Article

Assessing the Land Use-Carbon Storage Nexus Along G318: A Coupled SD-PLUS-InVEST Model Approach for Spatiotemporal Coordination Optimization

1
College of Surveying and Geo-Informatics, Shandong Jianzhu University, Jinan 250101, China
2
College of Oceanography and Space Informatics, China University of Petroleum (East China), Qingdao 266580, China
3
College of Geological Engineering and Geomatics, Chang’an University, Xi’an 710054, China
4
Institute of Estuarine and Coastal Zone Research, Shandong Jianzhu University, Yantai 265501, China
5
School of Geography and Tourism, Anhui Normal University, Wuhu 241002, China
*
Author to whom correspondence should be addressed.
Land 2025, 14(10), 2067; https://doi.org/10.3390/land14102067
Submission received: 14 September 2025 / Revised: 7 October 2025 / Accepted: 10 October 2025 / Published: 16 October 2025

Abstract

Revealing the coordination relationship between land use/land cover (LULC) and carbon storage (CS) under diverse climate scenarios is crucial for climate change adaptation in topographically complex regions. This study developed an integrated framework combining the System Dynamics (SD) model, Patch-generating Land Use Simulation (PLUS) model, and Integrated Valuation of Ecosystem Services and Tradeoffs (InVEST) model, enabling a closed-loop analysis of driving forces, spatial simulation, and ecological feedback. This study systematically assessed LULC evolution and ecosystem CS along China’s National Highway 318 (G318) from 2000 to 2020, and projected LULC and CS under three SSP-RCP scenarios (SSP1-1.9, SSP2-4.5, SSP5-8.5) for 2030. Results show the following: (1) Historical LULC change was dominated by rapid urban expansion, cropland loss, and nonlinear grassland fluctuation, exerting strong impacts on ecosystem dynamics. Future scenario simulations revealed distinct thresholds of ecological pressure. (2) Regional CS exhibited a decline–recovery pattern during 2000–2020, with all 2030 scenarios projecting CS reduction, although ecological-priority pathways could mitigate losses. (3) Coordination between land-use intensity and CS improved gradually, with SSP2-4.5 emerging as the optimal strategy for balancing development and ecological sustainability. Overall, the coupled SD-PLUS-InVEST framework provides a practical tool for policymakers to optimize land use patterns and enhance CS in complex terrains.

1. Introduction

Amid global climate change, rising temperatures and expanding anthropogenic pressures have amplified extreme disaster risks while progressively destabilizing ecosystem structure and function [1,2]. To address future climate challenges, China’s State Council launched the Carbon Peak Action Plan by 2030, mandating: (1) enhanced foundational support for ecosystem carbon sinks through comprehensive carbon storage (CS) assessments; (2) consolidation of ecosystem sequestration capacity and implementation of critical spatial planning measures—including optimized land use and land cover (LULC) frameworks—to advance carbon peaking and neutrality (Dual Carbon) goals. Terrestrial ecosystem CS significantly influences global carbon cycling and climate change, while LULC serves as a key driver of CS dynamics [3,4,5]. Land use intensity (LUI) serves as a critical indicator of land resource utilization efficiency, fundamentally shaping regional spatial development patterns [6,7]. Against the backdrop of China’s ‘Dual Carbon’ strategic objectives, investigating LULC and CS dynamics under divergent climate scenarios—and their synergistic relationships—holds critical significance for climate change adaptation in topographically complex regions, advancing green low-carbon development, and enhancing terrestrial carbon sequestration capacity [8,9,10].
Contemporary LULC simulation methodologies predominantly comprise three model classifications: quantity prediction models, spatial allocation models and coupled prediction models. Quantity prediction models—including Logistic regression [11], Artificial Neural Networks (ANN) [12], System Dynamics (SD) [13], and Markov chain models [14]—primarily rely on time-series data to statistically characterize relationships between driving factors and land-use change. These models are effective for projecting macro-scale LULC quantity trends; however, they typically overlook spatial heterogeneity and local feedback processes, which limits their utility for fine-scale simulations. Spatial prediction models—including Cellular Automata (CA) [15], the Conversion of Land Use and its Effects at Small regional extent (CLUE-S) [16], Agent-Based Models (ABM) [17], the Future Land Use Simulation (FLUS) [18], and the Patch-generating Land Use Simulation (PLUS) models [19,20]—simulate land-use competition and allocation processes based on geospatial data and rule-based constraints, explicitly capturing the synergies of multi-scale geographical drivers. Nevertheless, in the absence of reliable quantity constraints, they often suffer from inconsistencies between simulated spatial patterns and overall land-use demand. The coupled prediction model represents a hierarchical integration of quantity and spatial prediction approaches, simultaneously addressing both magnitude changes and spatial allocation patterns in LULC systems. This nested framework significantly enhances simulation accuracy by incorporating bidirectional feedback between quantitative demands and spatial constraints, but challenges remain regarding model integration complexity and parameter sensitivity in human–environment systems. Current CS assessment primarily employs three established models: the Carnegie-Ames-Stanford Approach (CASA) [21], Global Production Efficiency Model (GLO-PEM) [22], and Carbon Exchange between Vegetation, Soil, and Atmosphere (CEVSA) [23]. While these models provide robust frameworks for carbon accounting, their dependence on high-resolution LULC data introduces notable limitations in application. The Integrated Valuation of Ecosystem Services and Tradeoffs (InVEST) model has emerged as a prominent tool for CS assessment, owing to its user-friendly interface and operational efficiency [24]. This spatially explicit framework enables researchers to quantify regional CS and project temporal dynamics of CS under alternative scenarios [25,26]. However, InVEST is essentially a static accounting tool and is limited in capturing land-use driven temporal dynamics when applied in isolation.
Recent studies have demonstrated significant advances in CS assessment through the integration of diverse land-use simulation modeling approaches. He et al. integrated the LUSD-urban and InVEST models to assess urban expansion impacts on CS [27]. Zhao et al. applied a CA-Markov-InVEST framework to evaluate ecological engineering effects on LULC and CS dynamics in the upper Heihe River Basin [28]. Wang et al. integrated the PLUS and InVEST models to project 2030 LULC patterns and resultant CS dynamics under future scenarios (natural development and ecological protection) in the Chengdu–Chongqing Urban Agglomeration [29]. He et al. employed the FLUS-InVEST coupled model to simulate the distribution and changes in ecosystem CS under four future scenarios based on LULC in Guilin [30]. Wang et al. developed a GMOP-PLUS-InVEST modeling chain to project LULC and associated CS variations across four policy scenarios in Jining City [31]. Jing et al. investigated dynamic changes in LULC and CS in the Lijiang River Basin under different climate scenarios using the InVEST-PLUS model with SSP-RCP scenarios, combined with multi-source remote sensing data [32]. Despite these advances, several gaps remain. First, most existing frameworks emphasize a subset of drivers, while neglecting the coupled effects of natural, social, and economic forces. Second, the generalizability of model integration across diverse geographic contexts and the associated uncertainties have been insufficiently addressed. Third, limited attention has been paid to scenario-based simulations in regions characterized by complex topography and ecological vulnerability. Addressing these gaps requires integrated modeling frameworks that can reconcile quantity prediction, spatial allocation, and ecosystem service feedbacks, thereby providing more robust insights into LULC and CS dynamics under future climate scenarios.
To address these limitations, this study established an integrated modeling framework with SD as the central nexus, synergistically coupling the spatial allocation capacity of the PLUS model with the ecosystem service valuation functions of the InVEST model, thereby constructing a closed-loop ‘Driver-Pattern-Effect’ analytical system. This approach offers two key advantages: (1) compensating for individual model limitations through synergistic integration, and (2) achieving enhanced accuracy in comprehensive assessments. These attributes establish it as one of the most reliable methodologies for coupled human-environment system research [33]. The National Highway 318 (G318), traversing China’s eastern, central, and western regions, serves as a critical transportation corridor and ecological transect. The pronounced gradient variations in natural conditions, economic development, and LULC systems along the G318 create an ideal natural laboratory for investigating CS dynamics and climate feedback mechanisms. Conducting comprehensive CS assessments along this transect and establishing optimized LULC development patterns are of paramount importance for: safeguarding national ecological security, and promoting coordinated regional sustainable development [34].
Building upon historical LULC patterns, this study employed the SD model to systematically integrate high-resolution spatial heterogeneity data, establishing a quantitative foundation for multi-objective collaborative optimization. The coupled SD-PLUS model was implemented to project LULC patterns under different SSP-RCP scenarios for 2030, while the InVEST model was utilized to assess regional CS dynamics. Then, a coordination assessment model was incorporated to examine the relationship between LUI and CS across heterogeneous landscapes. The novelty of this study lies in the construction of a closed-loop modeling system that explicitly links socio-economic drivers, land-use dynamics, and ecosystem service feedbacks. Unlike previous studies that relied on loosely coupled or one-way integrations, our framework achieves dynamic feedback integration, thereby enhancing predictive robustness in topographically complex regions. Furthermore, by applying this framework to the G318 transect—characterized by sharp gradients in natural conditions and development pressures—this study provides the first systematic evaluation of LULC–CS coordination under SSP-RCP scenarios in a nationally significant ecological corridor. These contributions advance methodological development in coupled human–environment system research and offer policy-relevant insights for low-carbon transition and regional sustainability planning.

2. Materials and Methods

2.1. Study Area

The G318 originates from People’s Square in Shanghai’s Huangpu District (eastern terminus) and extends to the China-Nepal Friendship Bridge in Shigatse, Tibet (western terminus), spanning 5476 km across eight province-level divisions (Shanghai, Jiangsu, Zhejiang, Anhui, Hubei, Chongqing, Sichuan, and Tibet) of China (Figure 1). The eastern Yangtze River Delta urban agglomeration, centered on Shanghai and Hangzhou, demonstrates advanced economic development characterized by a dominant tertiary sector and intensive land utilization. The central region maintains a mixed economy of manufacturing and agriculture, accompanied by significant soil erosion risks. The western economy primarily depends on agriculture, animal husbandry, and tourism, with strictly constrained development within ecological conservation redlines. The G318 crosses China’s three major topographic steps. Its eastern section occupies the Yangtze River’s middle-lower alluvial plains and delta regions, exhibiting flat terrain, dense river networks, and a subtropical monsoon climate with mean annual temperatures of 14–17.5 °C, annual precipitation of 1000–1498 mm, and optimal hydrothermal conditions. The middle section transitions through the Exi Mountains and Sichuan Basin to the Western Sichuan Plateau, with elevations rising to 1000–4500 m, landforms shifting to folded mountain systems and faulted basins, and climate transitioning to warm temperate–plateau mountain conditions (annual temperature: −2.3 to 10 °C; precipitation: 500–800 mm) with distinct vertical zonation. The western section extends into the Tibetan Plateau’s interior, dominated by alpine gorges and glacial permafrost, exhibiting pronounced ecological vulnerability under cold arid climates (<400 mm precipitation) [35].

2.2. Data and Methods

As summarized in Table 1, this research utilizes Wuhan University’s CLCD land use data, which Reference to relevant classification system with six first-level categories: (1) cropland, (2) forest, (3) grassland, (4) water, (5) barren land, and (6) urban land [36]. Slope data were derived from DEM data processed using ArcGIS 10.8 software. The human footprint index was computed based on eight anthropogenic pressure indicators, including transportation infrastructure (railroads, roads, navigable waterways) and built-up land extent, employing a weighted algorithm to substitute traditional accessibility measures. Historical statistical data for the SD model were sourced from the China Statistical Yearbook and provincial/municipal statistical yearbooks, though these are not enumerated in Table 1. The PLUS model incorporates ten driving factors, sequentially listed as ‘GDP’ through ‘slope’ in Table 1. With an optimal operational resolution of 30 m [37] and superior compatibility with the WGS-1984 coordinate system, all spatial datasets were uniformly projected to WGS-1984 using ArcGIS. Additionally, the driving factor data were resampled to a 30 m resolution to maintain consistent row and column dimensions across all input layers.

2.2.1. Modeling Framework

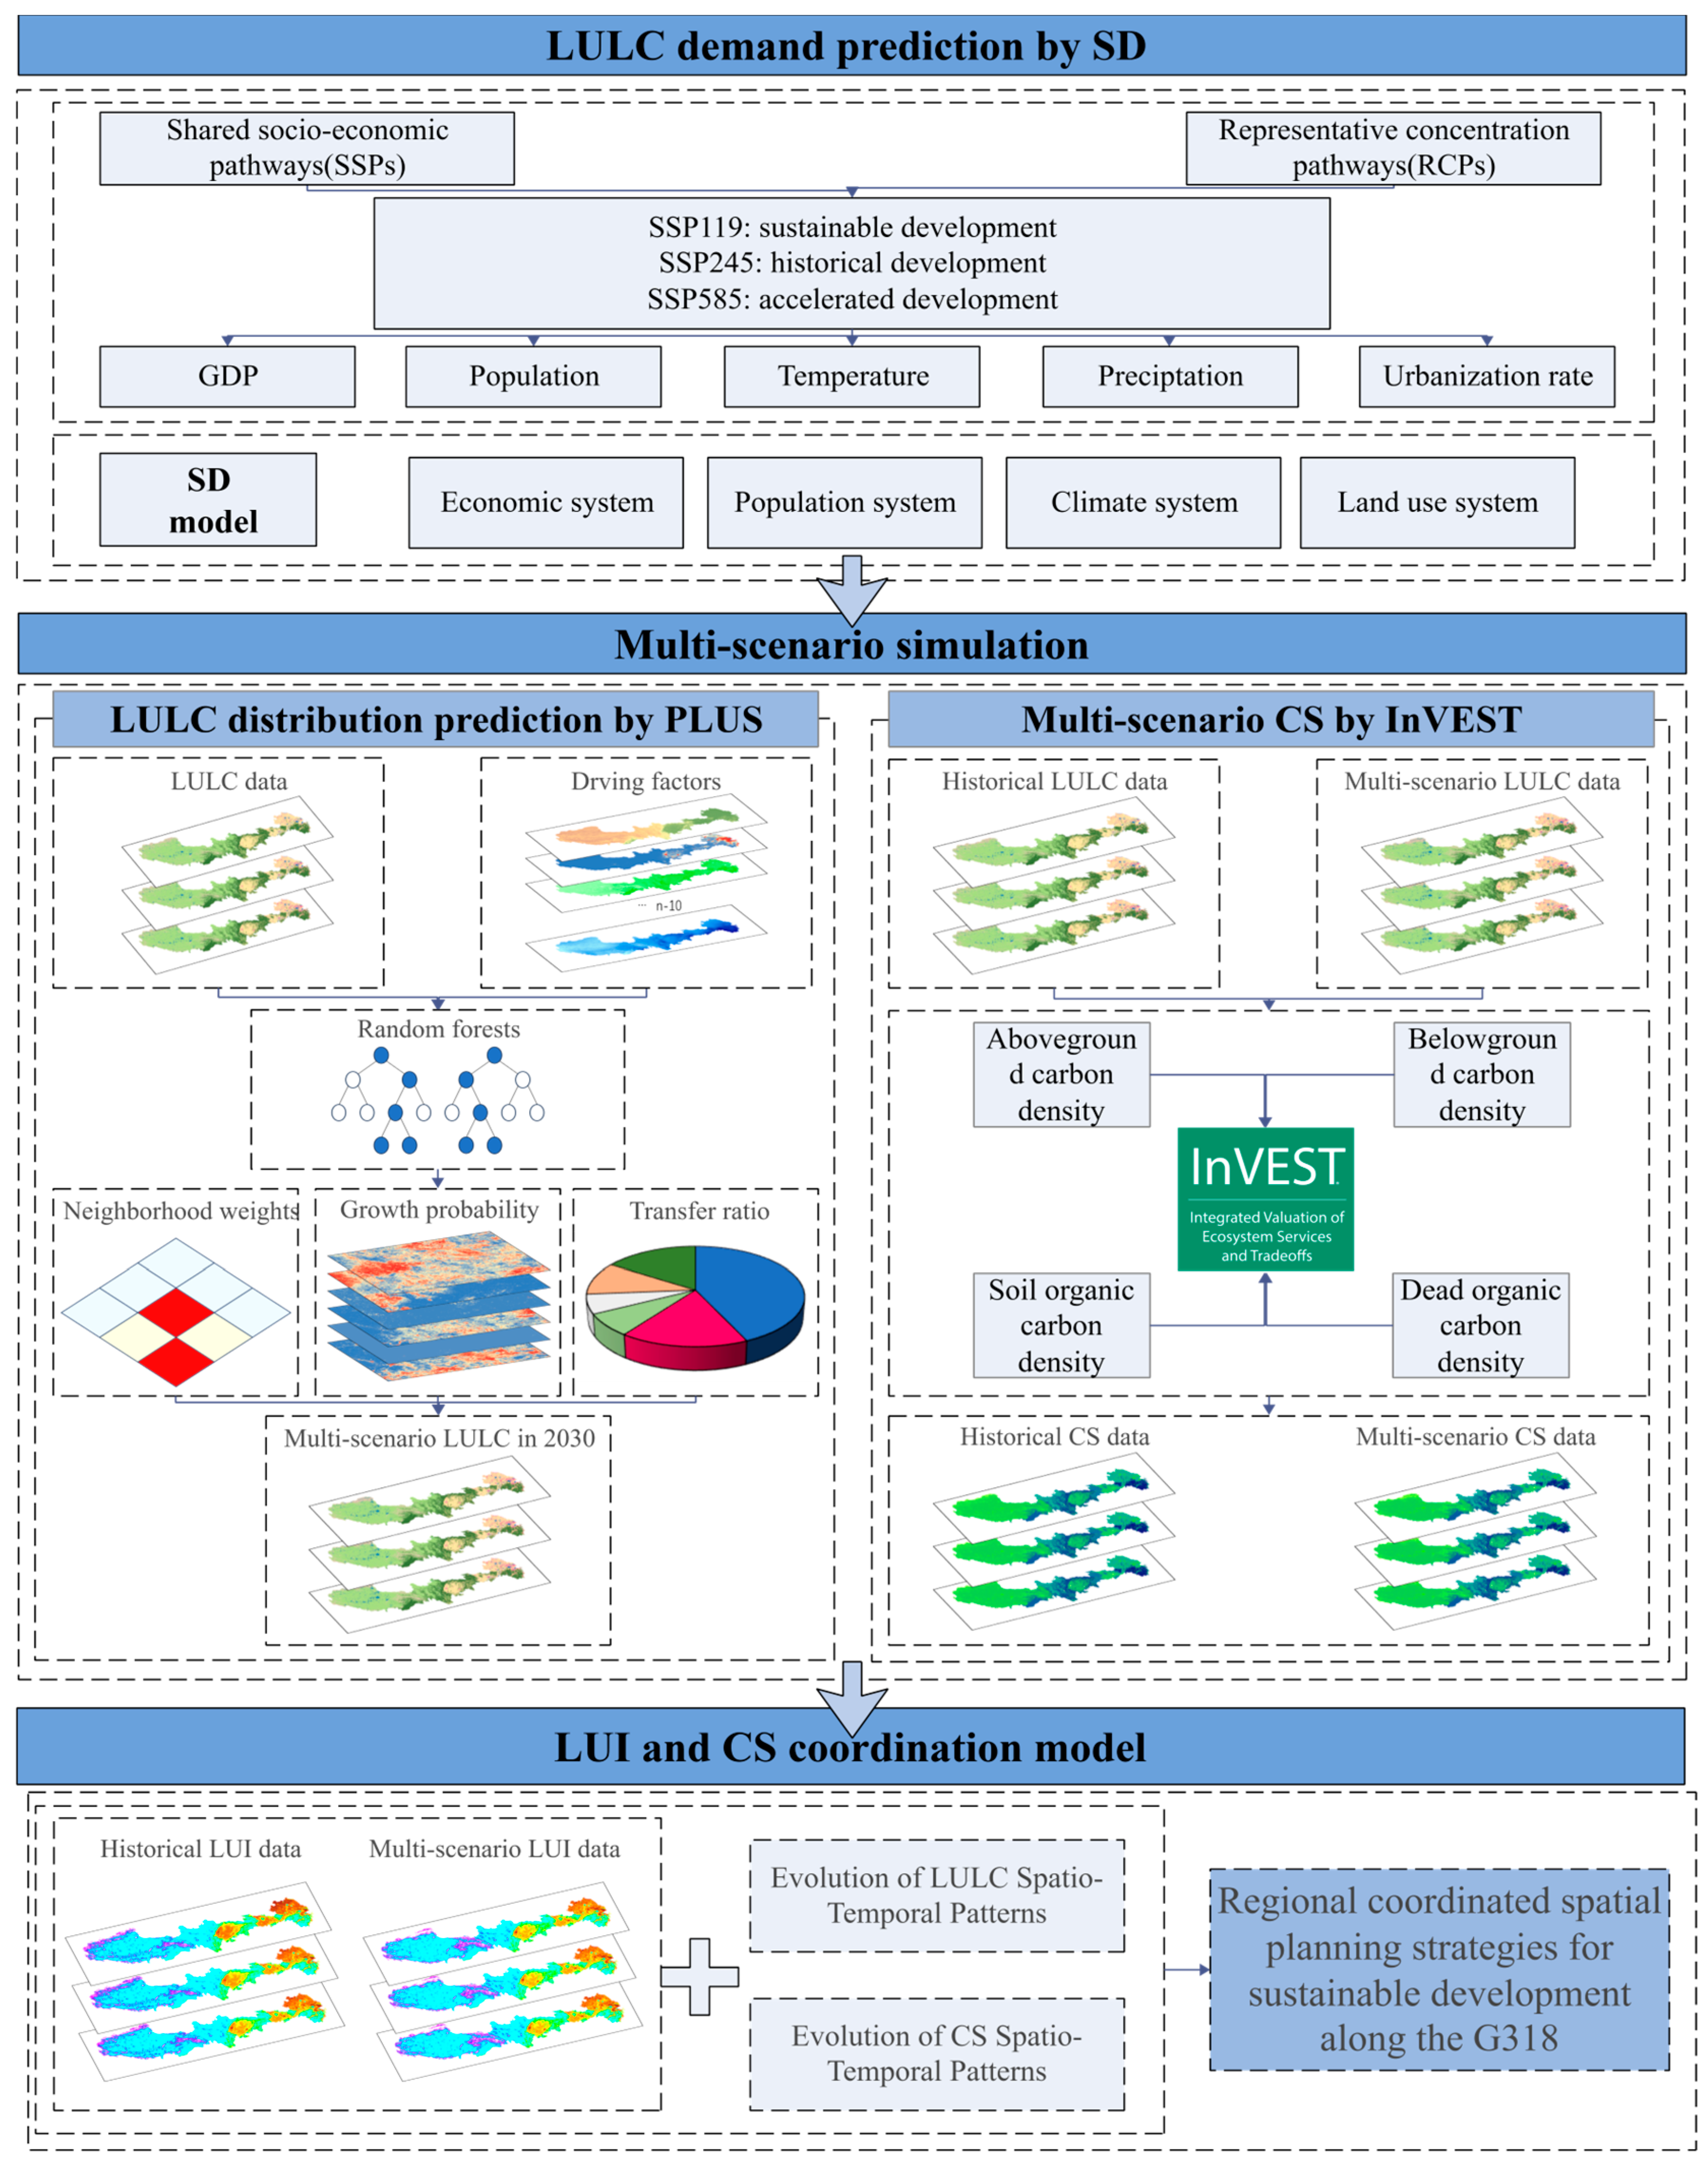
The conceptual framework was presented in Figure 2, employing CMIP6 multi-scenario projections coupled with the SD-PLUS-InVEST integrated model to investigate spatiotemporal dynamics and synergistic relationships between LULC patterns and CS along the G318, supporting ecological conservation and sustainable regional development strategies. The SD model dynamically generates evolutionary logic that better aligns with regional human-environment systems by quantifying multi-system interactions among key drivers (population, economic development, climate patterns) and LULC relationships. The PLUS model utilizes the SD-generated LULC quantity projections as inputs, while incorporating multiple driving factors to optimize the spatial allocation of land-cover types through its sophisticated algorithms. Building upon the LULC patterns simulated by PLUS, the InVEST model delivers prospective CS assessments with high temporal resolution. Phase Six of the Coupled Model Intercomparison Project (CMIP6) framework provides an expanded suite of future climate scenarios. By coupling LULC simulations with CS assessments through the integrated SD-PLUS-InVEST modeling system under diverse Shared Socioeconomic Pathways and Representative Concentration Pathways (SSP-RCP) scenarios.

2.2.2. SD Model

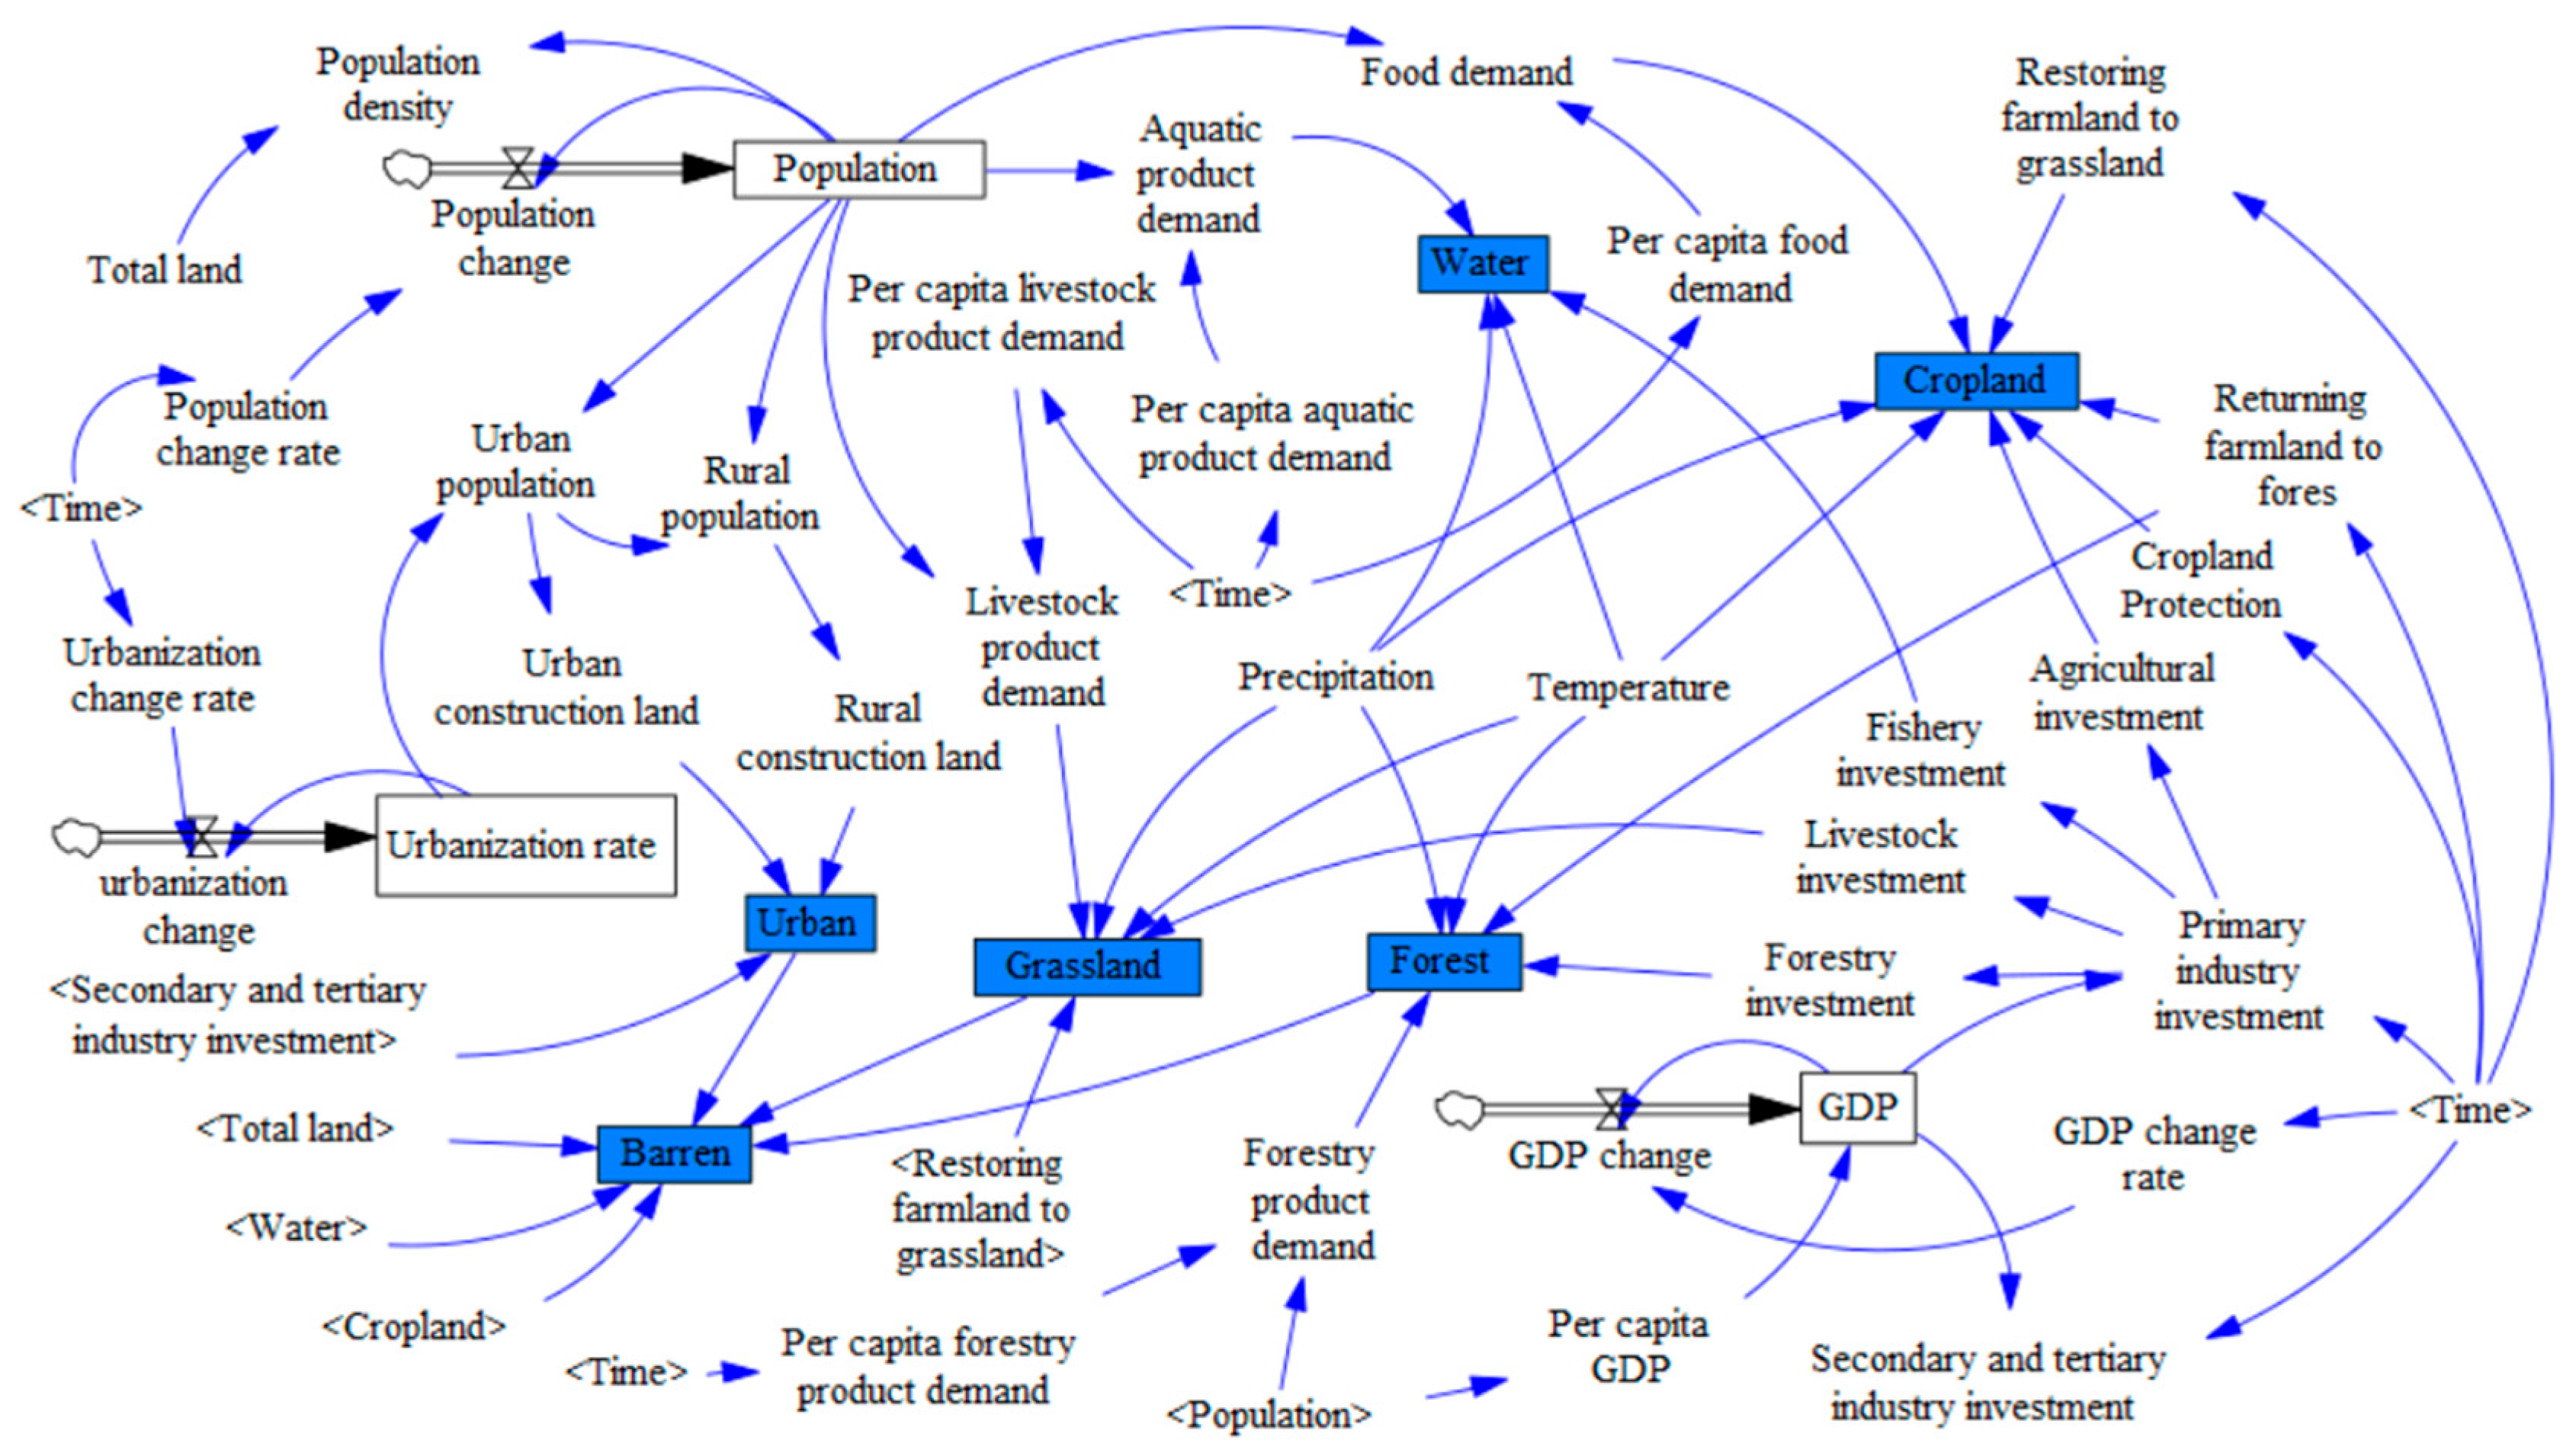
The SD model is a comprehensive system that can simulate and analyze complex systems through the information feedback loop between multivariate elements and variables [41,42]. In this study, the SD model was employed for the quantitative simulation of land use prediction. In light of the diverse SSP-RCP scenarios delineated by CMIP6, and in consideration of the specific circumstances of the study area, three coupling scenarios were identified: SSP1-1.9, SSP2-4.5, and SSP5-8.5. SSP1-1.9 is a scenario of minimal anthropogenic forcing, characterized by the pursuit of sustainable development, moderate population growth, and a pronounced commitment to environmental protection [43]. In contrast, SSP2-4.5 represents a scenario of medium radiation intensity, where the prevailing development path is one of inertial development, with socio-economic factors aligning with historical trends. SSP5-8.5 is indicative of a high-force scenario, characterized by accelerated development and a concomitant demand for substantial economic growth, driven by elevated levels of fossil fuel consumption and substantial energy intensity. The development scenarios under consideration are as follows: in accordance with prevailing demand, the subject is divided into four subsystems: population, economy, climate, and land use. The dominant variables are comprised of five categories of future forecast data. Firstly, the correlation between various factors was tested by SPSS (27.0.1) software, and the feedback mechanism between each subsystem is sorted out. On this basis, the functional relationship between them was determined. Subsequently, the Vensim (7.3.5) software is utilized to construct the land use change model in the designated study area (Figure 3), thereby facilitating the prediction of the number of land use areas. A comparison was made of the simulation results of land use area in each province and city from 2000 to 2020 with real data. The relative errors of the large land categories are all below 8%, indicating that the simulation results are more accurate and can be used for land use area prediction.

2.2.3. PLUS Model

The PLUS model is predicated on raster data, a fact that enables it to thoroughly explore the driving factors of land expansion and land type change [44]. This, in turn, facilitates a more accurate simulation of the generation and evolution of multi-use land. The model is principally composed of the land expansion strategy analysis (LEAS) module and the CA model based on multi-class random patch seeds (CARS) module, in addition to a built-in Markov model. The PLUS model extracts the spatial development probability of different land types based on multiple driving factors, combines the Markov model to determine the land transfer matrix and the neighborhood weight of each land type, and uses the CA model to simulate the land use space. The present study utilizes the land use data of the study area in 2010 as the initial reference point, employing a simulation technique to predict the land use situation in 2020. The simulation’s outputs are then juxtaposed with the actual land use data collected in 2020. The Kappa coefficients of land use simulation in each province are all above 0.8, and the simulation results can support the data research.
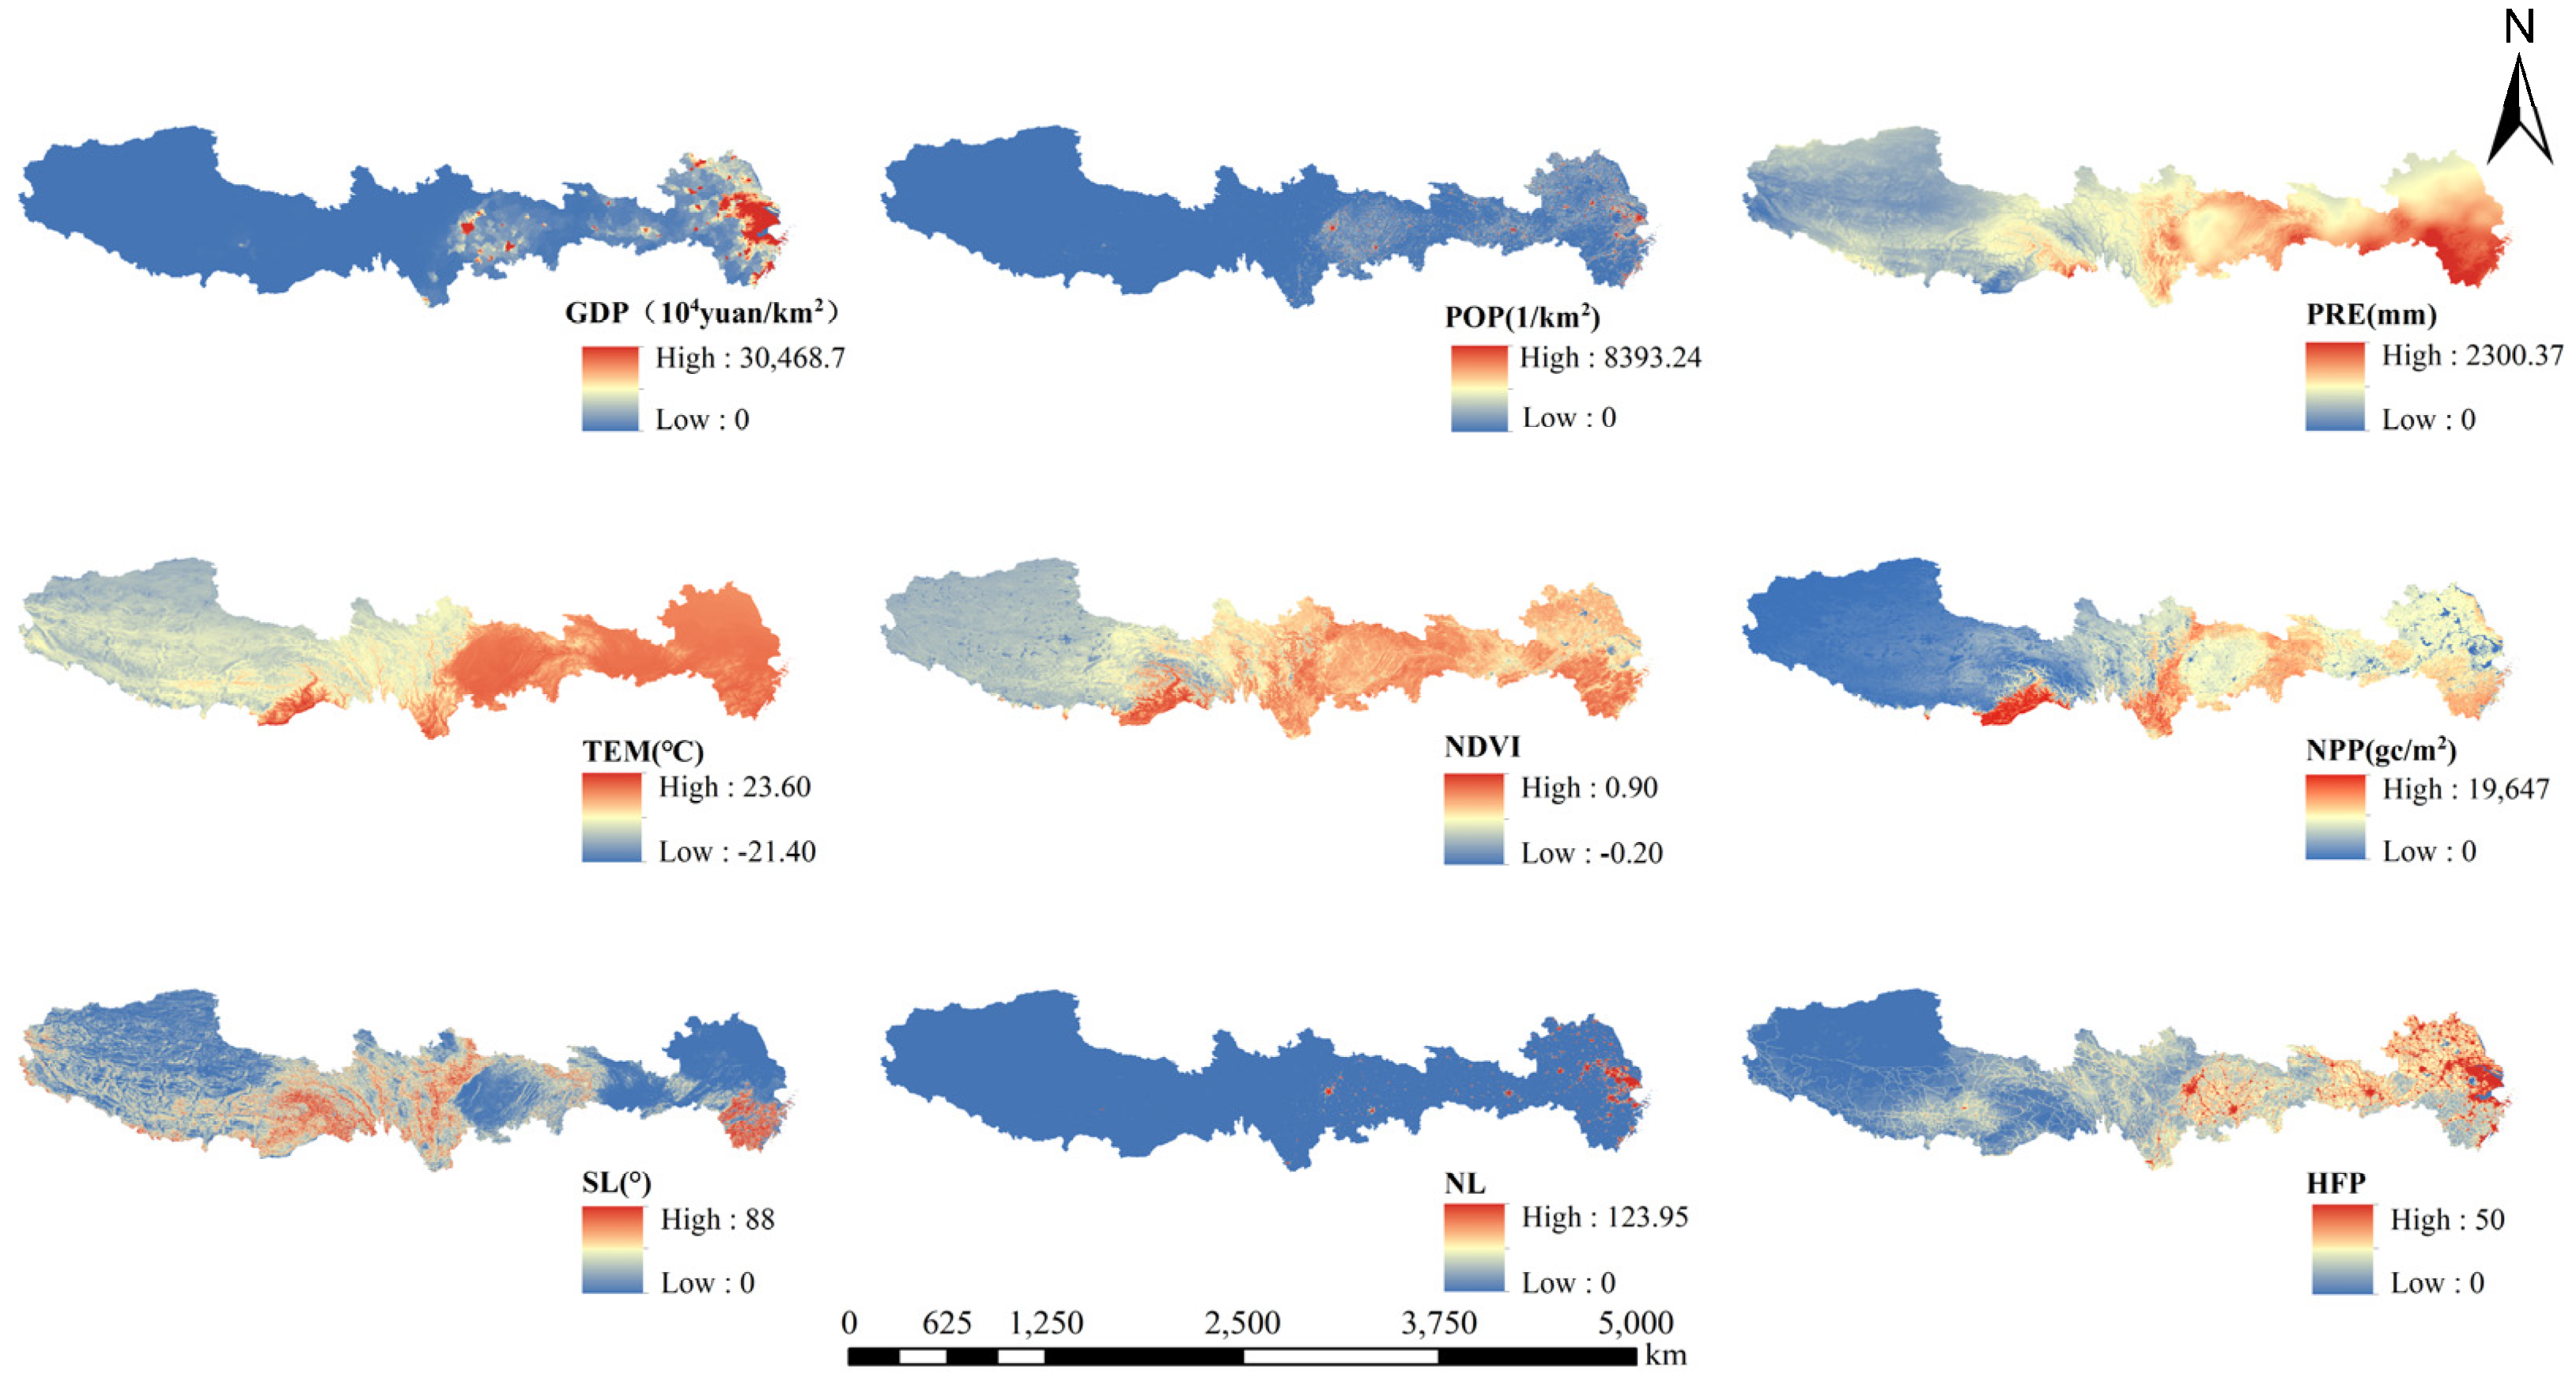
The PLUS model incorporated ten driving factors, with elevation data visualized in the study area overview map and the remaining nine factors’ spatial distributions presented in Figure 4. Elevation, slope, precipitation, temperature, NDVI, and NPP represent natural geographic elements; GDP and population density characterize socioeconomic development factors, while nighttime light and HFP signify anthropogenic influences. These three constituent elements collectively govern LULC spatial pattern distributions.
(1) LEAS module. The utilization of the random forest algorithm is predicated on two fundamental elements: firstly, the historical land expansion and, secondly, the driving factor data. The employment of this algorithm facilitates the calculation of the development probability for each category. The formula is as follows:
P i , k d x = n = 1 m I h n x = d M
where P i , k d x denotes the development probability of a specific land type at the pixel level; x represents a multidimensional vector comprising all considered driving factors; m indicates the total quantity of decision trees in the ensemble model; I (*) signifies the decision tree classification operator; h n x is the nth decision tree’s prediction type of vector x ; d is a constant that takes the value of 0 or 1, representing the transformation of other land types into land type k and no land types into land type k , respectively.
(2) CARS Module. The spatio-temporal dynamics of the land class patches are simulated by the improved CA model with the following equations, based on the development probabilities of each class generated by the LEAS module:
O P i , k d = 1 , t = P i , k d = 1 × Ω i , k t × D k t
where P i , k d = 1 , t represents the development probability of pixel i changing to land type k at time t ; P i , k d = 1 denotes the growth probability of land type k at pixel i ; Ω i , k t indicates the neighborhood weight of pixel i , specifically the neighborhood proportion of land type k at time t ; D k t stands for the adaptive inertia coefficient, reflecting the impact of future land demand on land type k .

2.2.4. InVEST Model

The InVEST model is a comprehensive valuation model that integrates ecosystem services and trade-offs to estimate changes in the quantity and value of ecosystem goods based on land-use data [45]. In this study, the CS module of the InVEST model was utilized to calculate the changes in CS within the study area according to ecosystem land type. The basic carbon pools selected for this study encompassed aboveground biogenic carbon, belowground biogenic carbon, soil carbon, and dead organic carbon. It is important to note that the regional disparity is substantial; the carbon density is subject to differentiation due to environmental impacts, and the carbon density data utilized in different provinces are not uniform. The specific carbon density data were referred to in relevant research area literature [46]. All of these data have undergone correction or correlation testing, and the formula is as follows:
C t o t a l = C a b o v e + C b e l o w + C s o i l + C d e a d i × A i
where C t o t a l represents the total CS; C a b o v e , C b e l o w , C s o i l and C d e a d denote aboveground carbon density, belowground carbon density, soil organic carbon density, and dead organic carbon density, respectively. i refers to the i th land type; A i indicates the total area of the i th land type.

2.2.5. LUI and Coordination Model

LUI serves as a critical indicator of land development and utilization, while the coordination model quantifies the temporal synergy between two variables. Following established methodology [47], we assigned intensity levels to land categories in descending order: urban land (4.0), cropland (3.0), forest (2.0), grassland (2.0), water (2.0), and barren land (1.0). Using a grid-based approach, we extracted composite LUI indices and mean CS values. The coordination degree model was then applied to assess their interrelationship and classify coordination types (Table 2), with the following formulas:
L = 100 × i = 1 n P i × Q i
where L is a composite index of LUI; P i represents the utilization intensity level of the i th land type; Q i denotes the area share of the i th land type.
H = x + y 2 x 2 + y 2
where H represents the coordination index, H 0 , 1 ; x and y denote the average annual growth rates of the LUI composite index and the mean carbon storage, respectively.

3. Results

3.1. Assessment of Spatial and Temporal Evolution of LULC

3.1.1. Analysis of Spatial Patterns of LULC Under Multiple Scenarios

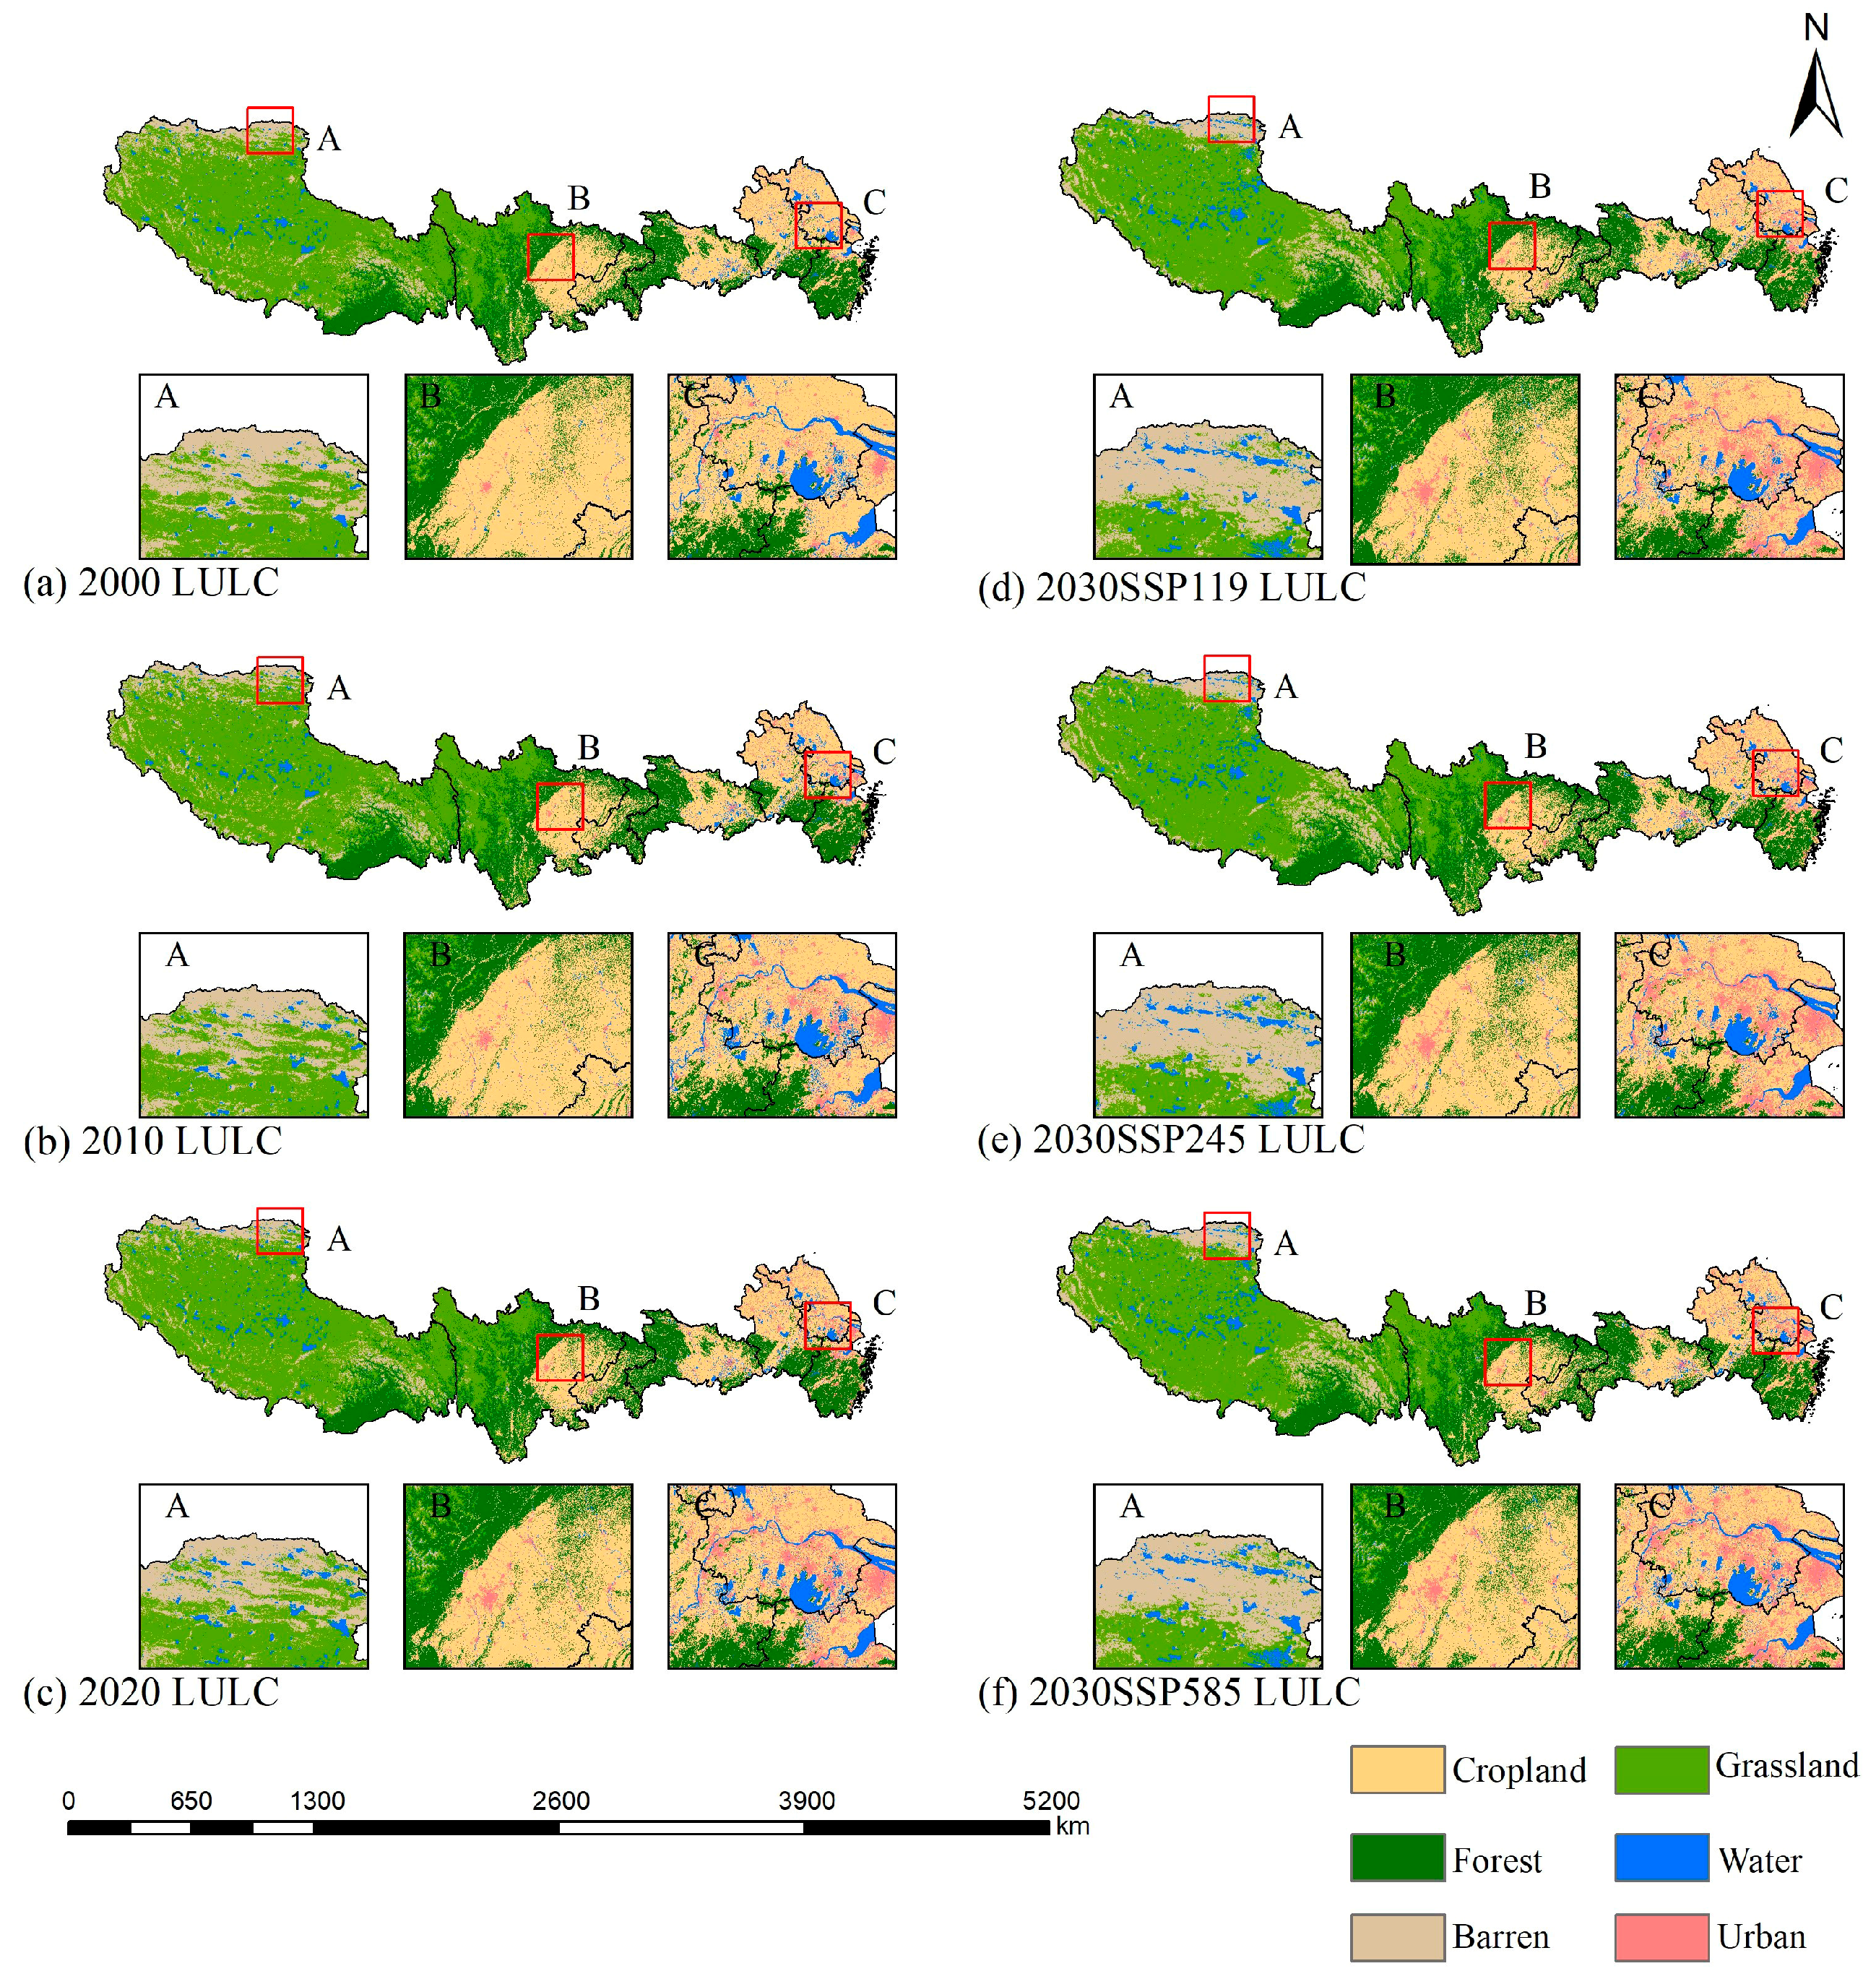
Based on the distribution of historical and SSP-RCP scenario land use simulations (Figure 5), the land cover pattern along G318 exhibited marked spatial heterogeneity. In the historical land use distribution, forest and grassland served as the dominant land types, collectively occupying 68.3% of the total area. Within this distribution, alpine meadow ecosystems were predominantly concentrated in the western Sichuan Plateau region, while forest vegetation formed continuous distribution corridors along the Hengduan Mountain range. The proportion of cropland resources was approximately 18%, with the majority concentrated in the Sichuan Basin and the alluvial plain of the Yangtze River Delta. The cultivation structure is characterized by the predominant cultivation of “western grain and eastern vegetable.” Urban land constituted 8.1% of the total area, exhibiting significant spatial differentiation. The tundra regions of the Tibetan Plateau and the desert belt of the Western Sichuan Plateau collectively encompassed over 99% of the total area of urban land. The spatial layout of the urban land is defined by a “double-core multi-point” configuration, with the Yangtze River Delta city cluster comprising Shanghai as the core (accounting for more than 40%) and the Chengdu–Chongqing Economic Zone (accounting for more than 35%) constituting the primary distribution area. This spatial expansion is characterized by a decentralized extension. In 2030, the distribution patterns of G318 regional LULC will remain consistent under different SSP-RCP development scenarios, exhibiting significant spatial coupling.

3.1.2. Analysis of LULC Transfer Change Under Multiple Scenarios

As demonstrated in Figure 6, an analysis of multi-scenario land use transfer matrices indicates that land types in the regions of G318 have undergone changes to varying extents between 2000 and 2020. The urban area exhibited an exponential expansion driven by rapid urbanization, with an increase in area from 29,716.75 km2 to 56,138 km2, representing an 88.9% increase. The cropland resources were impacted by the encroachment and marginalization of urban land, which exhibited a continuous decreasing trend. The total area under consideration is reduced by 33,356.75 km2, representing a reduction ratio of approximately 7.5%, with the greatest impact observed in the Chengdu Plain and the urban fringe of the Yangtze River Delta. The positive recovery of forest ecosystems was attributed to the implementation of various projects, including the reversion of farmland to forestry and the strategic planting of trees. Consequently, the coverage rate has exhibited an increase from 23.1% to 23.8%. The water in question is closely related to the water storage of the Three Gorges Project and the expansion of highland lakes, which has resulted in an increase of 0.3 percentage points (2.8–3.1%) in area during this period. The grassland area exhibited a V-shaped change, with a decrease of 0.6% from 2000 to 2010 and an increase of 0.4% from 2010 to 2020, resulting in an overall net loss of 6136.25 km2. The ongoing diminution of barren land is attributable to the construction of ecological barriers in the western regions.
In the context of the three development scenarios (SSP1-1.9, SSP2-4.5, and SSP5-8.5) for the year 2030, the disparities in the proportion of the overall land area are not readily apparent. However, the evolutionary trajectories exhibit substantial divergence. The SSP1-1.9 scenario mirrors an ecological priority development path, characterized by an augmentation in the total area of forest and grassland by 2462.5 km2 compared to the SSP5-8.5 scenario, and a concomitant increase of 5412.5 km2 in the area of cropland. This substantiates the viability of the ecological agriculture model. The SSP5-8.5 scenario is characterized by high-intensity development. The urban area exhibited a substantial increase, reaching 65,003.5 km2, which represents a 15.8% rise in comparison with the year 2020. Concurrently, the area dedicated to cultivation exhibited a modest headwind. The SSP2-4.5 scenario is predicated on the historical development trend, thus demonstrating the characteristics of the middle path and the synergistic growth of urban land and cropland. This reflects the potential for sustainable development, and the differences in land use among the three scenarios reveal the threshold effect of the choice of development path on the pressure on the land use system. Under the SSP5-8.5 scenario, the water surface area increased by 14.3% compared to the other two scenarios, which is directly attributable to accelerated glacier melt on the plateau driven by RCP8.5 radiative forcing. Under the three development scenarios for 2030, the area of barren land has increased greatly, mostly from the transformation of the tundra degradation area of the plateau.

3.2. Evolutionary Assessment of CS Under Multiple Scenarios

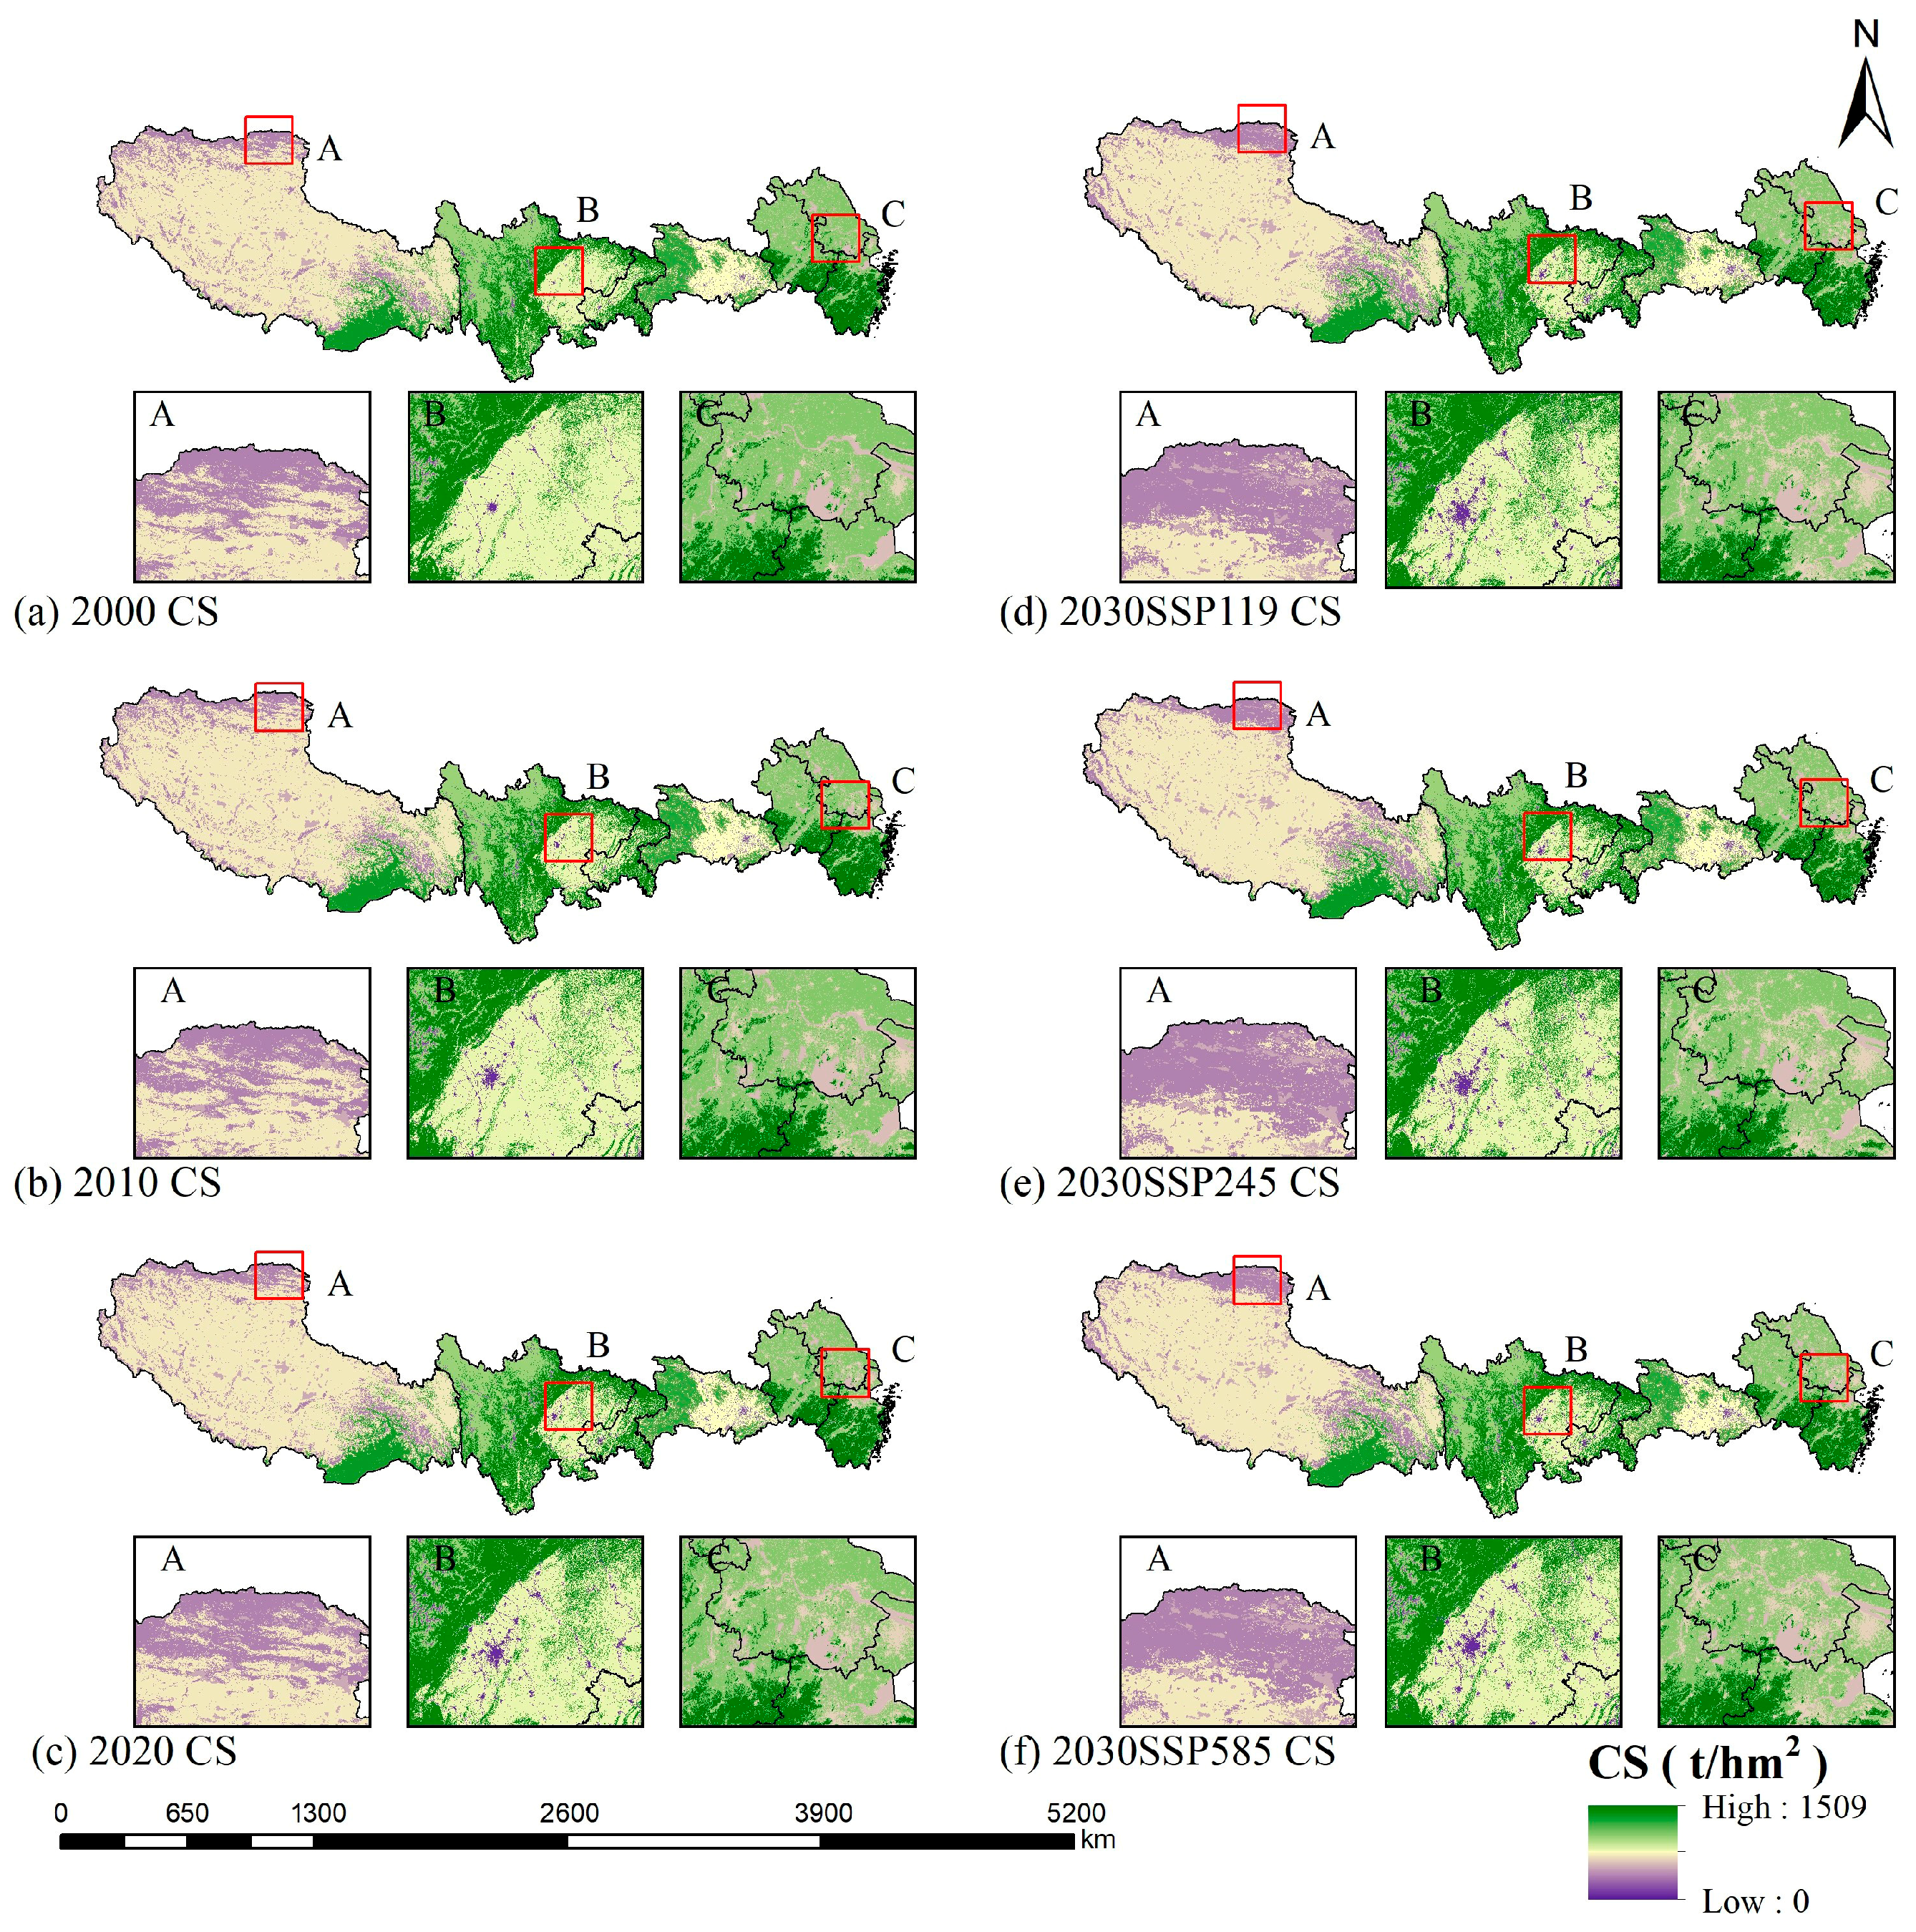
As demonstrated in Figure 7, which presents the CS assessment of multi-scenario LULC, there was a significant correlation between the spatial and temporal patterns of CS along G318 and LULC. The high carbon density areas are principally concentrated in the Hengduan Mountains and the nine mountain ranges in Zhejiang Province, while the medium and low carbon density areas are principally distributed in the Tibetan Plateau, the Chengdu–Chongqing Economic Zone, and the Yangtze River Delta urban agglomeration.
Historical data demonstrate that from 2000 to 2020, the total CS in the regions exhibited a dynamic equilibrium of “decreasing and then increasing, respectively, 26,120.63 × 106 t, 26,096.35 × 106 t, and 26,102.66 × 106 t, with a fluctuation amplitude of less than 0.1%. The study area was projected to experience a decrease in total CS in 2030 under the three SSP-RCP scenarios. In the context of the three SSP-RCP scenarios for 2030, the total CS within the study area underwent a decline. The SSP1-1.9 scenario demonstrated a superior ecological protection effect, with the total CS amounting to 26,014.35 × 106 t, thus substantiating the carbon sequestration advantage of the ecologically prioritized pathway. The SSP2-4.5 and SSP5-8.5 scenarios are reduced in turn, yielding 26,011.73 × 106 t and 26,001.04 × 106 t, respectively. The total CS within the study area was predominantly attributable to three land categories: grassland, forest, and cropland, accounting for over 90% of the total CS. Notably, grassland ecosystems dominated the CS in each category, a consequence of their characteristic high carbon density and extensive geographical distribution. A comparative analysis of the three development scenarios reveals that, in 2030, the proportion of grassland and forest in the total CS decreases by 0.2 percentage points compared to 2020. This decline is identified as the primary factor contributing to the overall decrease in the total CS. The augmentation of urban land has been demonstrated to elicit a substantial carbon source effect, with its CS escalating from 256.56 × 10⁶ t to 474.22 × 10⁶ t between 2000 and 2020. Projections indicated that, under the three projected development scenarios, this CS will further increase to about 520 × 106 t by 2030, with the growth rate of the SSP5-8.5 scenario being the most pronounced.

3.3. Analysis of Coordination Between LUI and CS

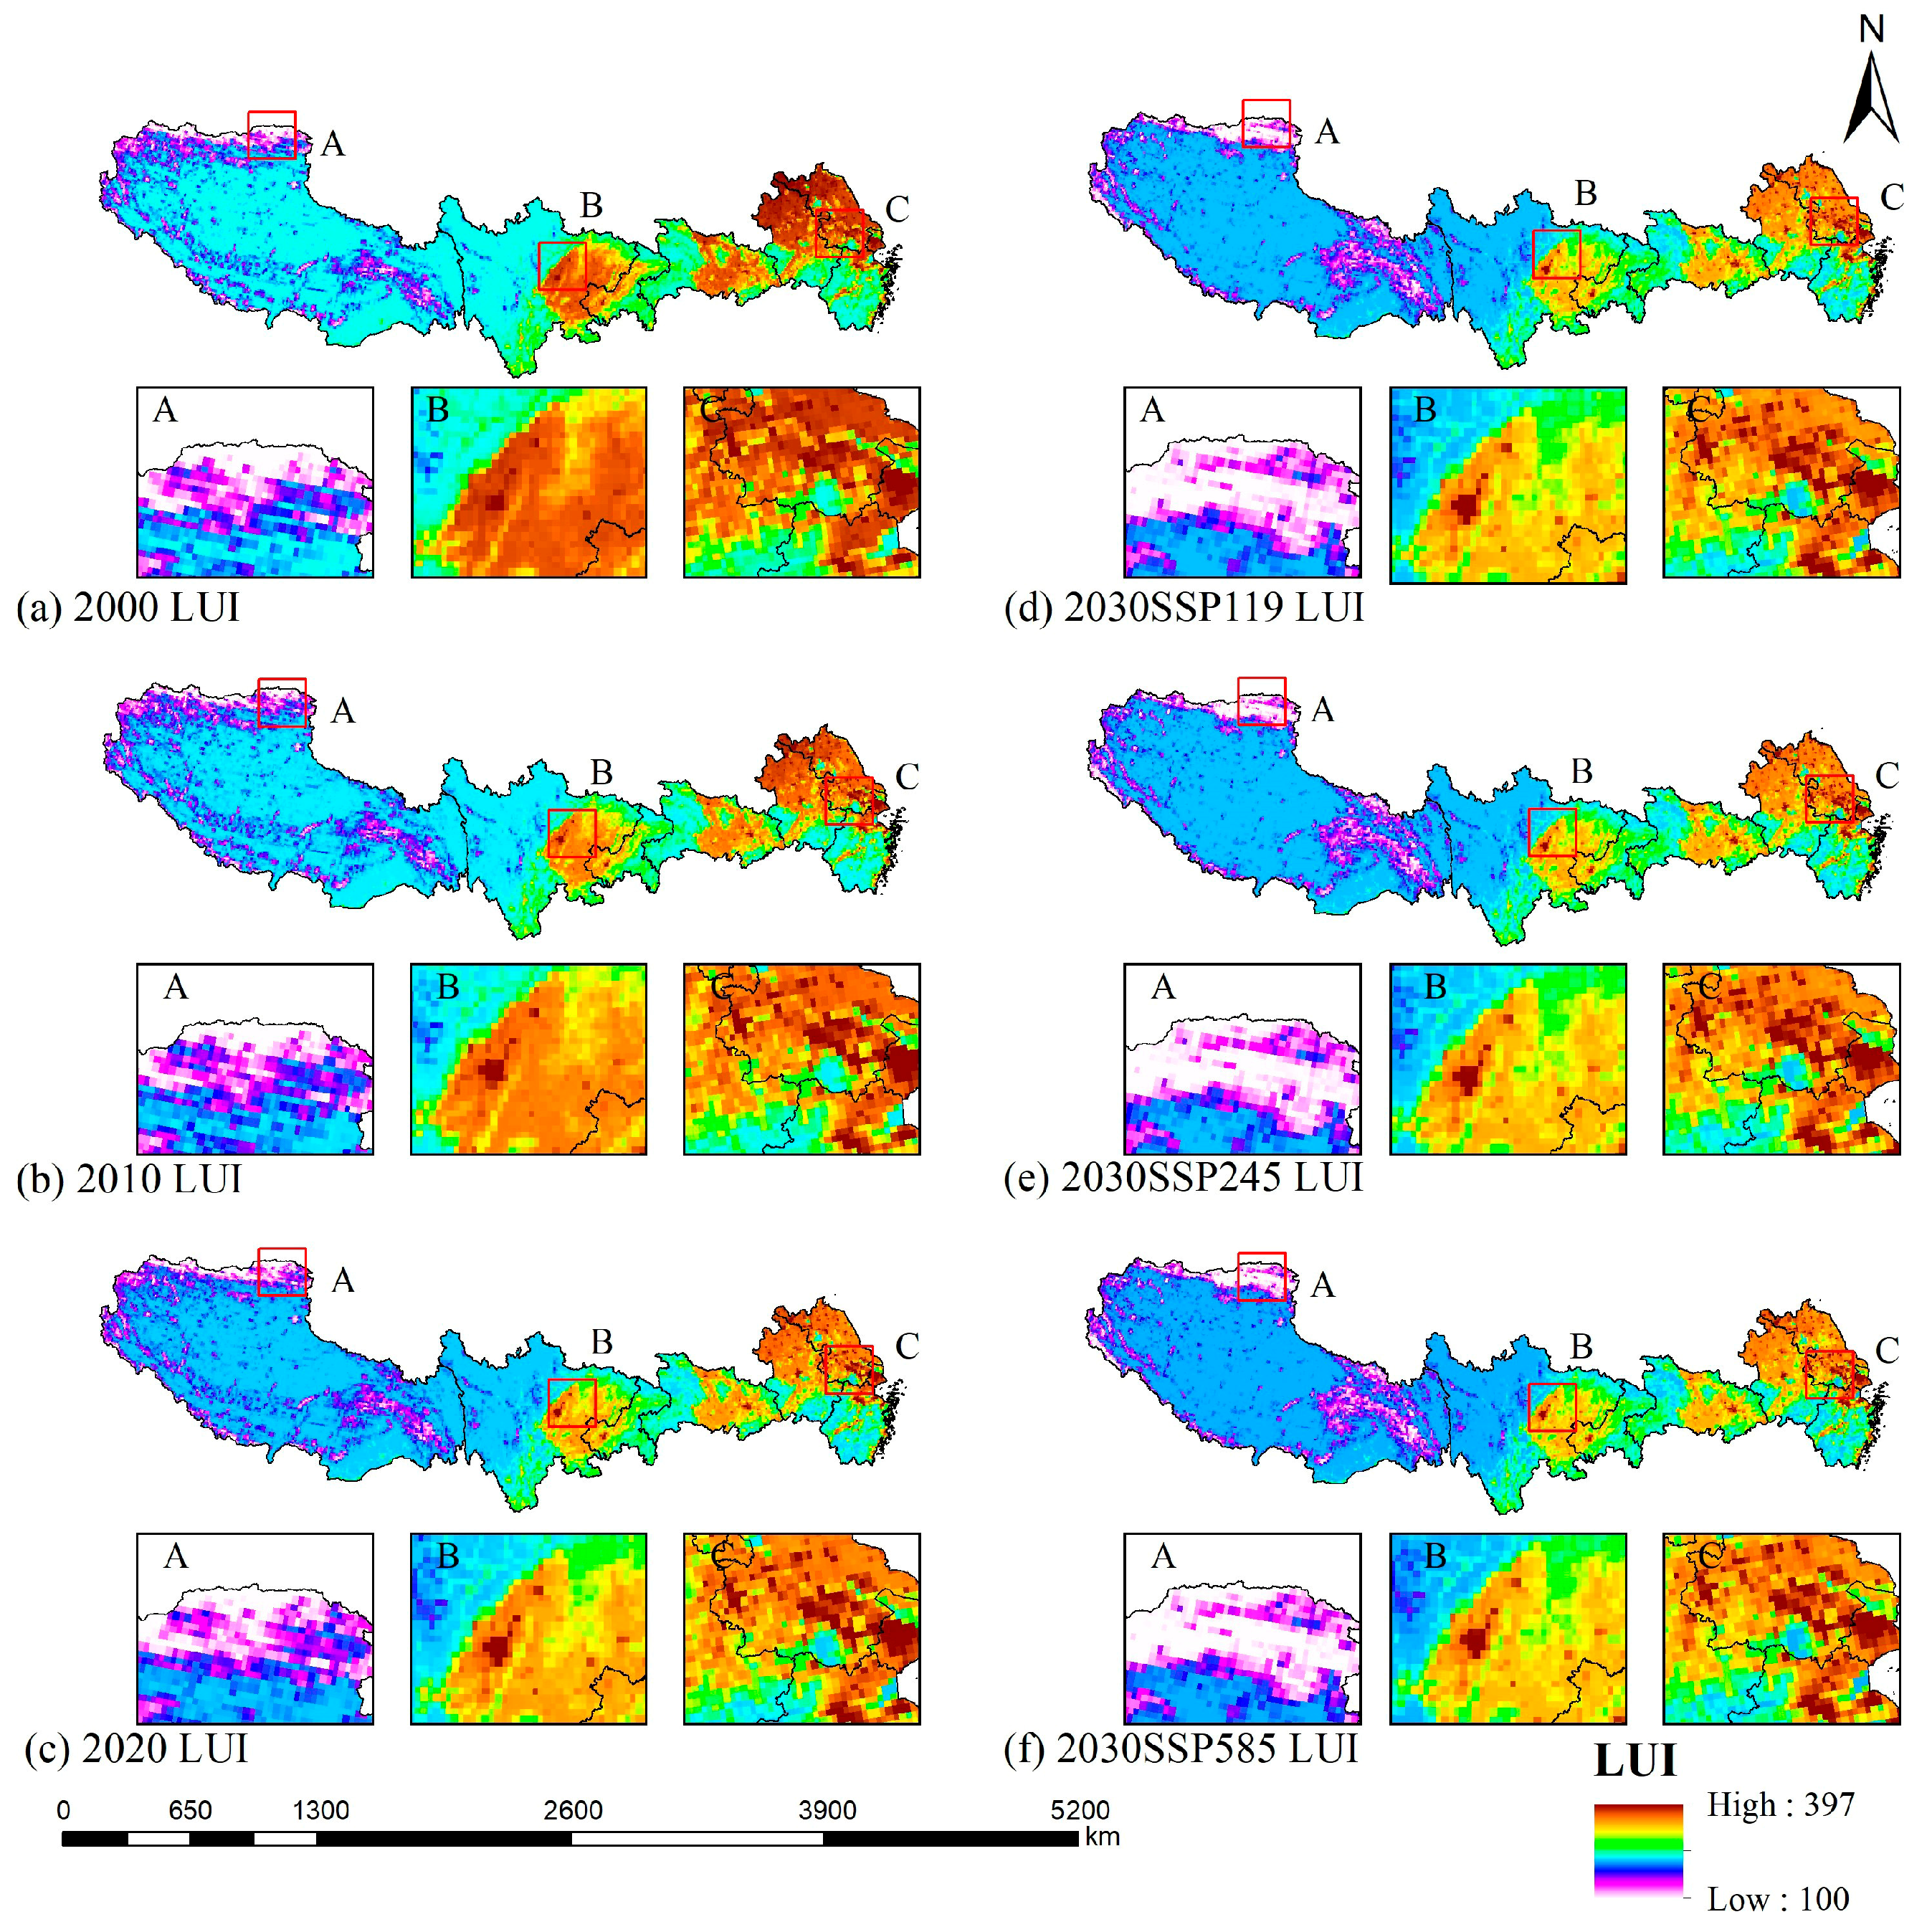
As shown in Figure 8, a notable coupling exists between the spatial pattern of LUI and the distribution of land cover types along the G318 corridor. High LUI is predominantly concentrated in the Yangtze River Delta and Chengdu–Chongqing urban agglomerations, exhibiting significant spatial agglomeration. In contrast, medium and low LUI areas are mainly found in forest and grassland regions, where their spatial distribution is strongly constrained by topographic elevation and ecological baseline conditions. Between 2000 and 2020, the LUI structure in the G318 region underwent marked changes. The proportion of low LUI remained relatively stable, maintaining a share of 43–44% with only minor fluctuations. Meanwhile, the share of medium LUI decreased from 48.22% to 46.30%, a net reduction of 1.92 percentage points, while that of high LUI increased from 7.84% to 9.78%, representing a rise of 1.94 percentage points. Under three future development scenarios, further evolution in LUI structure is projected. The proportion of low LUI is expected to decline significantly to approximately 39%, while medium LUI will become the dominant type, accounting for over 50% in all scenarios. High LUI is projected to continue expanding, exceeding 10% in all cases. In summary, LUI changes over the past two decades were primarily characterized by a shift from medium to high LUI, driven mainly by peri-urban expansion and regional development policies. Future scenario simulations further indicate that LUI along the G318 corridor will continue to increase, with high LUI showing an upward trend across all scenarios.
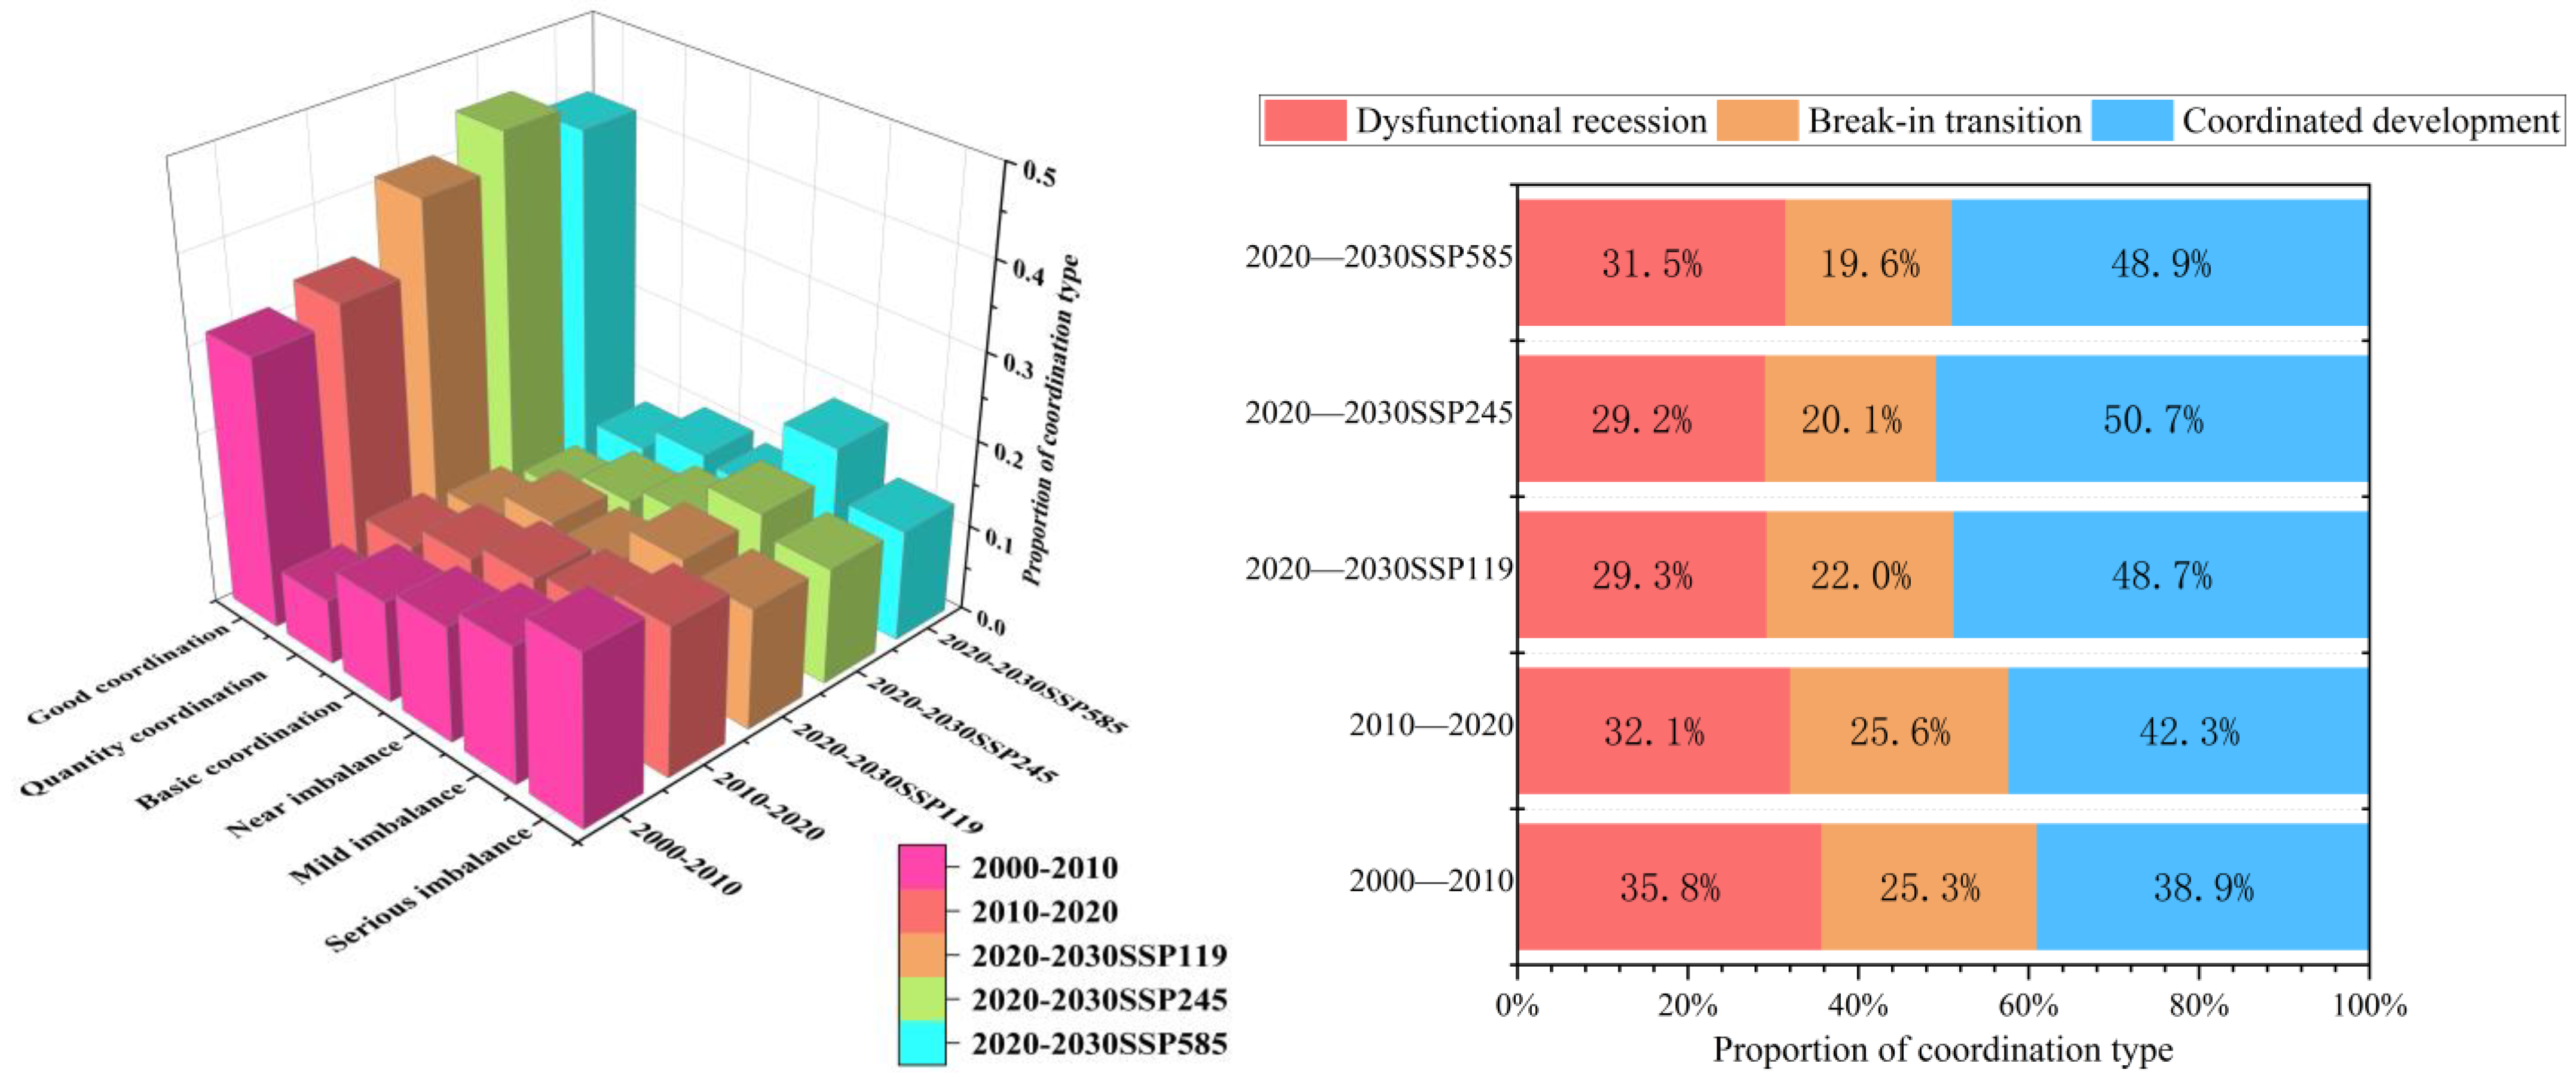
As illustrated in Figure 9, the coordinated types of LUI and CS changes in the multi-scenarios of the regions along G318 in each time period exhibited significant variation, suggesting a gradual improvement. The proportion of coordinated development type was low in 2000–2010 and 2010–2020, at 38.9% and 42.3%, respectively, which indicates a slight improvement. The proportion of dysfunctional recession type gradually recedes with the passage of time, decreasing from 35.8% to 32.1% during 2000–2020. The proportion of break-in transition type is the least, and it tends to stabilize at 25.3% and 25.6%, respectively. The accelerated proliferation of urban land during the periods 2000–2010 and 2010–2020, distinguished by elevated LUI and diminished carbon intensity, has incessantly encroached upon the domain of alternative land types. This phenomenon represents the dominant factor impacting the proportional distribution of coordination types across the study regions. The coordinated development types from 2010 to 2020 have shown significant improvement compared to the period from 2000 to 2010. The implementation of initiatives aimed at the reforestation of agricultural land and the promotion of ecological conservation has resulted in an augmentation of forest and grassland areas characterized by high carbon density and low utilization intensity. Concurrently, there has been a decline in the proportion of serious imbalance types and a modest increase in the proportion of quality coordination types. A comparison of the coordination of LUI and CS changes under the three SSP-RCP scenarios in 2030 reveals significant enhancement compared to the historical development stage. The proportion of coordinated development has increased significantly, and the proportion of dysfunctional recession has decreased. A comparative analysis of the three SSP-RCP scenarios reveals that the coordinated development of LUI and CS under the SSP2-4.5 scenario is optimal. This coordinated development type accounts for 50.7%, with quality coordination contributing significantly and the dysfunctional recession type being the least applicable to the three scenarios. This suggests that the coordinated development of LUI and CS in the region along G318 is more feasible. The proportion of coordinated development is analogous in the SSP1-1.9 and SSP5-8.5 scenarios, with a discrepancy of 0.2%. However, a substantial disparity exists in the dysfunctional decline type between the two scenarios, with the SSP5-8.5 scenario exhibiting a 2.2% increase over the SSP1-1.9 scenario. The overall coordination of the SSP5-8.5 scenario is suboptimal, indicating that this scenario is less conducive to the coordinated sustainable development of the regions compared to other scenarios.
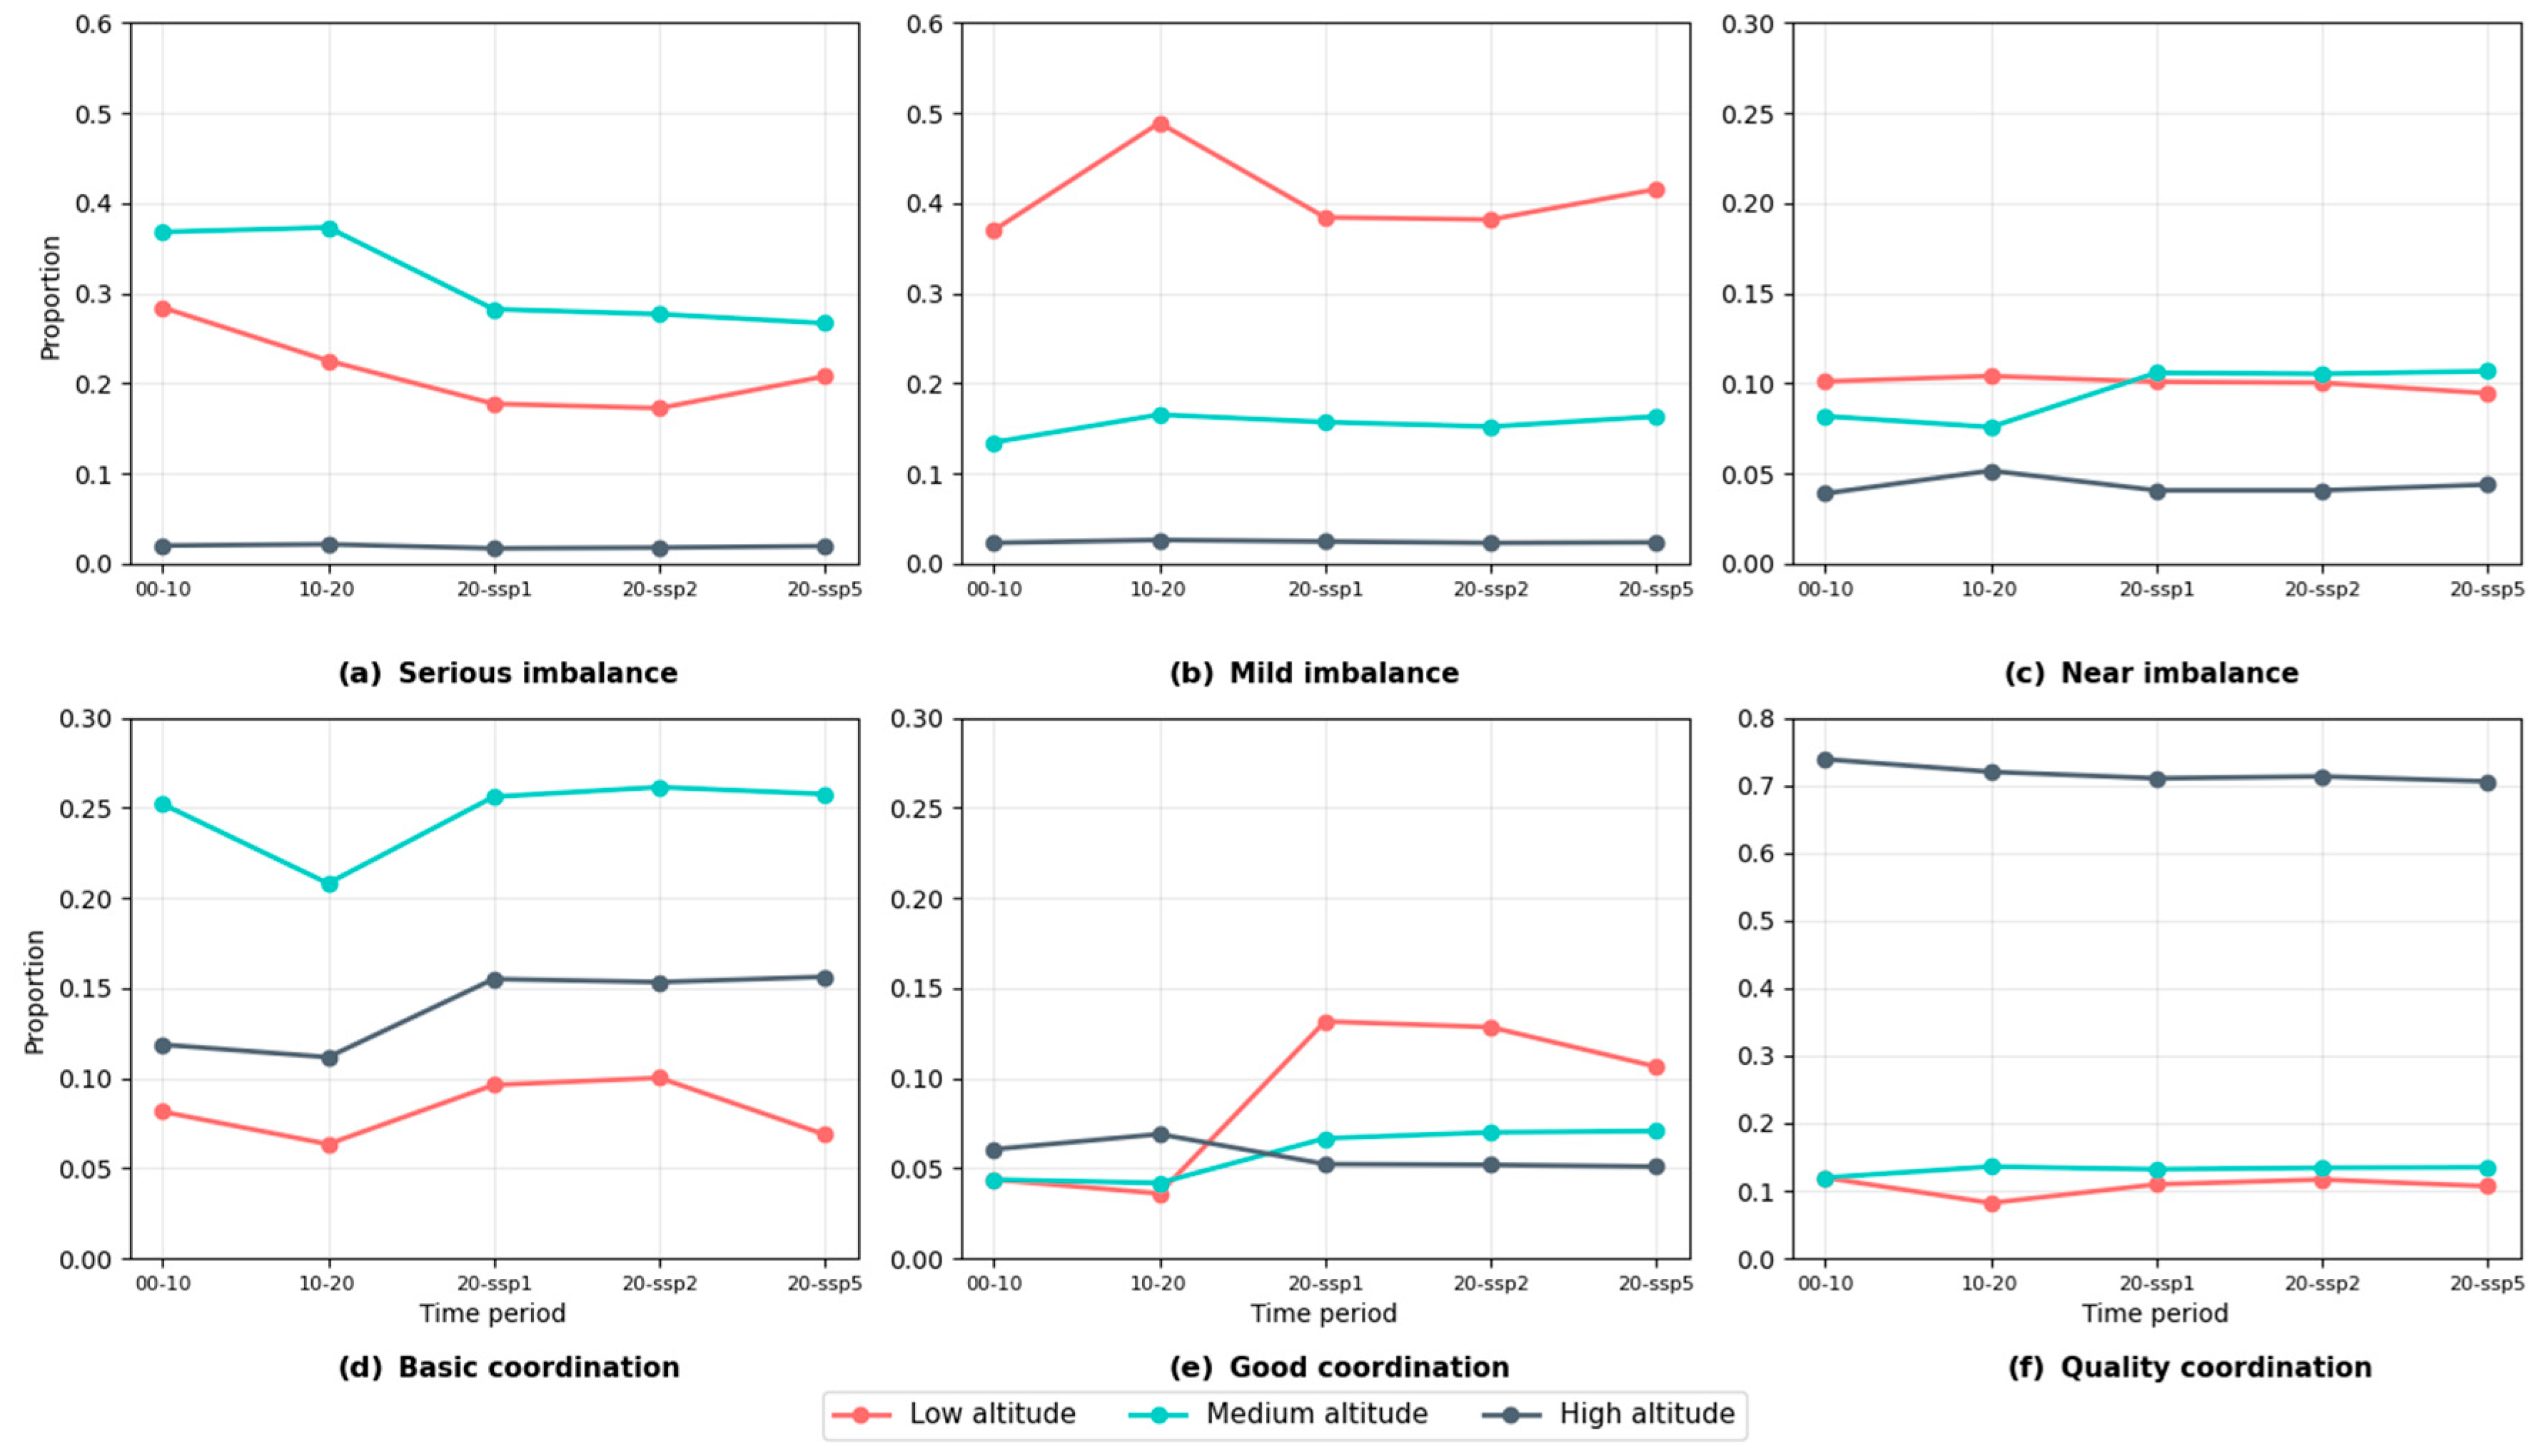
Building upon the clarified overall coordination pattern along the G318 corridor, this study further divides the research area into three zones based on elevation gradients for in-depth analysis (Figure 10). The results reveal a significant elevation-dependent characteristic in the coordination relationship between LUI and CS, with spatial heterogeneity reflecting the coupling between human activity intensity and ecosystem functions.
Spatially, ecosystem coordination exhibits distinct elevation-zonal patterns. The high-elevation zone maintains strong coordination, with 75–80% of the area being coordinated—primarily of high-quality—which reflects stable ecosystem structure and high CS capacity under minimal human disturbance. The mid-elevation transition zone shows a “conflict-resilience coexistence” pattern, featuring significant disturbance (historically exceeding 36% in severe categories) while also retaining persistent basic coordination. The low-elevation zone demonstrates the poorest coordination, being dominated by disturbed types (mostly mild disturbance), which indicates sustained pressure on carbon storage from intensive human activities. Temporally, elevation-dependent responses to future pathways emerge. The low-elevation zone shows marked coordination improvement under SSP1-SSP2 (coordinated types rising from 11.80–16.32% to ~24%), demonstrating sustainable pathways’ positive effects, whereas limited SSP5 progress reveals challenges in reversing degradation under carbon-intensive development. The mid-elevation zone exhibits gradual yet stagnant improvement across scenarios, indicating systemic resilience but requiring transformative governance. Notably, the high-elevation zone, while maintaining superior coordination, shows consistent slight declines and increasing transitional types across all scenarios, suggesting emerging vulnerability to climate change and marginal anthropogenic pressures.

4. Discussion

4.1. Spatiotemporal Variations of LUCC and CS in the G318 Region

LUCC directly influences the CS of terrestrial ecosystems. LUI is closely related to the efficiency of land resource utilization and serves as a key factor reflecting the spatial development pattern of a region. Exploring the variations in LUI and CS, as well as their coordination under different future climate scenarios, is of great significance for addressing climate change in complex surface regions, promoting green and low-carbon sustainable development, and consolidating and enhancing carbon sink capacity. The results indicate that over the past two decades, the G318 region has experienced rapid urbanization, with land-use change becoming the dominant driver of CS transfer, consistent with the findings of Wei et al. [48] From both historical and future perspectives, the overall CS in the G318 region has shown a continuous declining trend, primarily due to the expansion of urban construction, which has resulted in the conversion of high-carbon-density land types to low-carbon-density land types. This observation aligns with the studies of Xiang et al. [49] and Seto et al. [50] Conversely, ecological projects such as “Grain for Green” and ecological protection have facilitated the recovery of forest and grassland areas with high carbon density and low utilization intensity, thereby improving the coordination between LUI and CS, which is consistent with the findings of Han et al. [51] Overall, the results suggest that the SSP2-4.5 scenario is more suitable for sustainable development in the G318 region, which is in agreement with the conclusions of Yue et al. [52].

4.2. Development Proposal

A comprehensive analysis of the ecosystem’s carbon storage in the G318 regions reveals a downward trend in future development. The spatial pattern of CS exhibits significant variation, characterized by high storage in the west and low storage in the east. In contrast, the LUI displays a contrasting pattern. The high-intensity development zones are primarily concentrated in the eastern Yangtze River Delta urban agglomeration and the Chengdu–Chongqing Economic Zone. The western regions exhibit the most deficient development, with Hubei Province demonstrating a medium level of development. Among the three development scenarios in 2030, the SSP2-4.5 scenario demonstrates the most optimal coordination between land use intensity and carbon storage, making it particularly well-suited for the coordinated and sustainable development of the study area. In the context of land use development and ecosystem carbon resource management, the study area must be attentive to the transition from mild imbalance to near imbalance and must expedite the transformation from basic coordination to good coordination. As core areas experiencing pronounced anthropogenic disturbance, the low- and mid-elevation zones should be prioritized for territorial ecological restoration and land use optimization. Particular emphasis should be placed on implementing SSP1-/SSP2-aligned sustainable pathways to enhance systemic coordination. Meanwhile, the high-elevation zone requires preventive conservation strategies aimed at mitigating systemic risks, so as to effectively curb the observed trend of coordination degradation.

4.3. Uncertainty and Future Perspectives

The InVEST model has certain limitations [53]. Although the carbon density data employed in this study were calibrated, they were not derived from high-precision, high-density, real-time field surveys with standardized protocols, and thus may still differ from actual conditions. Future research will focus on different carbon density regions, incorporating ecological expert knowledge and supplementing with multi-source field measurements to further improve the accuracy of regional carbon storage simulations.
The SD model is constructed with the involvement of four subsystems: population, economy, climate, and land use. The correlation significance between the factors must be tested in order to determine the equation of the resume feedback. However, it is possible that there are nonlinear relationships that have not been recognized, or invisible feedback in the actual system. The SD model demonstrates an error of less than 8% in the prediction of the number of large-scale land types; However, in areas such as grasslands and unutilized land in Shanghai, the total area of these ≤20 km2 land types is less than 0.1% of the total study area. This has a minimal impact on the experimental results. The prediction results, on the other hand, have a greater impact and deviate from the actual development trend [54]. In future studies, regional development planning policies will be incorporated, and essential feedbacks among subsystems will be fully considered to establish a coupled human–environment system, enabling more accurate projections of regional future development.

5. Conclusions

In the context of the “dual-carbon” target development, this study adopted a two-pronged approach, examining LULC and CMIP6 multi-scenario development from a geographic perspective. The study integrated the SD-PLUS-InVEST model to predict and analyze regional LULC and ecosystem CS along G318. Additionally, the coordination model was employed to reveal the coordinated development between LUI and CS changes in depth, providing theoretical references for the management of the construction of sustainable and coordinated development along G318.
Historically, the G318 corridor has experienced rapid land-use transformations, characterized by exponential expansion of built-up areas, which served as the primary driver of persistent cropland loss. Projections under three 2030 development scenarios reveal a threshold effect of pathway selection on ecological pressure exerted by land-use changes. CS, influenced by land-use transitions, demonstrated a “decline-stabilization” dynamic during the historical period, yet is projected to decrease across all three future scenarios. The coupling relationship between LUI and CS shows a gradually improving trend, while exhibiting significant elevation-dependent characteristics. This spatial heterogeneity reflects the complex interplay between anthropogenic intensity and ecosystem functioning. Based on integrated multi-indicator assessment, the SSP2-4.5 scenario is identified as the most suitable pathway for achieving coordinated and sustainable development within the G318 region.

Author Contributions

X.X.: Methodology, Data curation and analysis, Formal analysis, Visualization, Writing—original draft; Q.W.: Data collection, Software, Visualization; P.L.: Writing—review and editing, Supervision, Project administration, Funding acquisition; F.M.: Writing—editing, Supervision, Project administration, Funding acquisition; L.H.: Writing—editing; W.Z.: Writing—editing. All authors have read and agreed to the published version of the manuscript.

Funding

We would like to express our sincere gratitude to the editors and reviewers who have put considerable time and effort into their comments on this paper. This work was supported by the Shandong Natural Science Foundation (ZR2020QD017), Research Project on Undergraduate Teaching Reform in Higher Education of Shandong Province (Z2024160) and the key project of the Jinan Municipal Education Bureau (JNSX2023065).

Data Availability Statement

No new data were created or analyzed in this study. The original contributions presented in the study are included in the article, further inquiries can be directed to the corresponding author.

Conflicts of Interest

The authors declare no conflicts of interest.

References

  1. Higgins, S.I.; Conradi, T.; Muhoko, E. Shifts in vegetation activity of terrestrial ecosystems attributable to climate trends. Nat. Geosci. 2023, 16, 147–153. [Google Scholar] [CrossRef]
  2. Munang, R.; Thiaw, I.; Alverson, K.; Liu, J.; Han, Z. The role of ecosystem services in climate change adaptation and disaster risk reduction. Curr. Opin. Environ. Sustain. 2013, 5, 47–52. [Google Scholar] [CrossRef]
  3. Feng, Y.; Chen, S.; Tong, X.; Lei, Z.; Gao, C.; Wang, J. Modeling changes in China’s 2000–2030 carbon stock caused by land use change. J. Clean. Prod. 2020, 252, 119659. [Google Scholar] [CrossRef]
  4. Legesse, F.; Degefa, S.; Soromessa, T. Carbon stock dynamics in a changing land use land cover of the Upper Awash River Basin: Implications for climate change management. Sustain. Environ. 2024, 10, 2361565. [Google Scholar] [CrossRef]
  5. Khachoo, Y.H.; Cutugno, M.; Robustelli, U.; Pugliano, G. Impact of Land Use and Land Cover (LULC) Changes on Carbon Stocks and Economic Implications in Calabria Using Google Earth Engine (GEE). Sensors 2024, 24, 5836. [Google Scholar] [CrossRef]
  6. Yang, J.; Zeng, C.; Cheng, Y. Spatial influence of ecological networks on land use intensity. Sci. Total Environ. 2020, 717, 137151. [Google Scholar] [CrossRef]
  7. Guo, L.; Liu, R.; Shoaib, M.; Men, C.; Wang, Q.; Miao, Y.; Jiao, L.; Wang, Y.; Zhang, Y. Impacts of landscape change on net primary productivity by integrating remote sensing data and ecosystem model in a rapidly urbanizing region in China. J. Clean. Prod. 2021, 325, 129314. [Google Scholar] [CrossRef]
  8. Wu, H.; Yang, Y.; Li, W. Spatial optimization of land use and carbon storage prediction in urban agglomerations under climate change: Different scenarios and multiscale perspectives of CMIP6. Sustain. Cities Soc. 2024, 116, 105920. [Google Scholar] [CrossRef]
  9. Tang, X.; Zhao, X.; Bai, Y.; Tang, Z.; Wang, W.; Zhao, Y.; Wan, H.; Xie, Z.; Shi, X.; Wu, B.; et al. Carbon pools in China’s terrestrial ecosystems: New estimates based on an intensive field survey. Proc. Natl. Acad. Sci. USA 2018, 115, 4021–4026. [Google Scholar] [CrossRef] [PubMed]
  10. Zafar, Z.; Zubair, M.; Zha, Y.; Mehmood, M.S.; Rehman, A.; Fahd, S.; Nadeem, A.A. Predictive modeling of regional carbon storage dynamics in response to land use/land cover changes: An InVEST-based analysis. Ecol. Inform. 2024, 82, 102701. [Google Scholar] [CrossRef]
  11. Ouma, Y.O.; Nkwae, B.; Odirile, P.; Moalafhi, D.B.; Anderson, G.; Parida, B.; Qi, J. Land-Use Change Prediction in Dam Catchment Using Logistic Regression-CA, ANN-CA and Random Forest Regression and Implications for Sustainable Land–Water Nexus. Sustainability 2024, 16, 1699. [Google Scholar] [CrossRef]
  12. Islam, K.; Rahman, M.F.; Jashimuddin, M. Modeling land use change using Cellular Automata and Artificial Neural Network: The case of Chunati Wildlife Sanctuary, Bangladesh. Ecol. Indic. 2018, 88, 439–453. [Google Scholar] [CrossRef]
  13. Geng, B.; Zheng, X.; Fu, M. Scenario analysis of sustainable intensive land use based on SD model. Sustain. Cities Soc. 2017, 29, 193–202. [Google Scholar] [CrossRef]
  14. Rahnama, M.R. Forecasting land-use changes in Mashhad Metropolitan area using Cellular Automata and Markov chain model for 2016–2030. Sustain. Cities Soc. 2021, 64, 102548. [Google Scholar] [CrossRef]
  15. Fu, X.; Wang, X.; Yang, Y.J. Deriving suitability factors for CA-Markov land use simulation model based on local historical data. J. Environ. Manag. 2018, 206, 10–19. [Google Scholar] [CrossRef]
  16. Jiang, W.; Chen, Z.; Lei, X.; Jia, K.; Wu, Y. Simulating urban land use change by incorporating an autologistic regression model into a CLUE-S model. J. Geogr. Sci. 2015, 25, 836–850. [Google Scholar] [CrossRef]
  17. Bert, F.E.; Podestá, G.P.; Rovere, S.L.; Menéndez, Á.N.; North, M.; Tatara, E.; Laciana, C.E.; Weber, E.; Toranzo, F.R. An agent based model to simulate structural and land use changes in agricultural systems of the argentine pampas. Ecol. Model. 2011, 222, 3486–3499. [Google Scholar] [CrossRef]
  18. Liu, X.; Liang, X.; Li, X.; Xu, X.; Ou, J.; Chen, Y.; Li, S.; Wang, S.; Pei, F. A future land use simulation model (FLUS) for simulating multiple land use scenarios by coupling human and natural effects. Landsc. Urban Plan. 2017, 168, 94–116. [Google Scholar] [CrossRef]
  19. Liang, X.; Guan, Q.; Clarke, K.C.; Liu, S.; Wang, B.; Yao, Y. Understanding the drivers of sustainable land expansion using a patch-generating land use simulation (PLUS) model: A case study in Wuhan, China. Comput. Environ. Urban Syst. 2021, 85, 101569. [Google Scholar] [CrossRef]
  20. Zhang, S.; Yang, P.; Xia, J.; Wang, W.; Cai, W.; Chen, N.; Hu, S.; Luo, X.; Li, J.; Zhan, C. Land use/land cover prediction and analysis of the middle reaches of the Yangtze River under different scenarios. Sci. Total Environ. 2022, 833, 155238. [Google Scholar] [CrossRef]
  21. Guan, D.; Nie, J.; Zhou, L.; Chang, Q.; Cao, J. How to Simulate Carbon Sequestration Potential of Forest Vegetation? A Forest Carbon Sequestration Model across a Typical Mountain City in China. Remote Sens. 2023, 15, 5096. [Google Scholar] [CrossRef]
  22. Sannigrahi, S. Modeling terrestrial ecosystem productivity of an estuarine ecosystem in the Sundarban Biosphere Region, India using seven ecosystem models. Ecol. Model. 2017, 356, 73–90. [Google Scholar] [CrossRef]
  23. Niu, Z.; He, H.; Peng, S.; Ren, X.; Zhang, L.; Gu, F.; Zhu, G.; Peng, C.; Li, P.; Wang, J.; et al. A Process-Based Model Integrating Remote Sensing Data for Evaluating Ecosystem Services. J. Adv. Model. Earth Syst. 2021, 13, e2020MS002451. [Google Scholar] [CrossRef]
  24. Hamel, P.; Chaplin-Kramer, R.; Sim, S.; Mueller, C. A new approach to modeling the sediment retention service (InVEST 3.0): Case study of the Cape Fear catchment, North Carolina, USA. Sci. Total Environ. 2015, 524, 166–177. [Google Scholar] [CrossRef]
  25. Nel, L.; Boeni, A.F.; Prohászka, V.J.; Szilágyi, A.; Tormáné Kovács, E.; Pásztor, L.; Centeri, C. InVEST Soil Carbon Stock Modelling of Agricultural Landscapes as an Ecosystem Service Indicator. Sustainability 2022, 14, 9808. [Google Scholar] [CrossRef]
  26. Yu, Y.; Guo, B.; Wang, C.; Zang, W.; Huang, X.; Wu, Z.; Xu, M.; Zhou, K.; Li, J.; Yang, Y. Carbon storage simulation and analysis in Beijing-Tianjin-Hebei region based on CA-plus model under dual-carbon background. Geomat. Nat. Hazards Risk 2023, 14, 2173661. [Google Scholar] [CrossRef]
  27. He, C.; Zhang, D.; Huang, Q.; Zhao, Y. Assessing the potential impacts of urban expansion on regional carbon storage by linking the LUSD-urban and InVEST models. Environ. Model. Softw. 2016, 75, 44–58. [Google Scholar] [CrossRef]
  28. Zhao, M.; He, Z.; Du, J.; Chen, L.; Lin, P.; Fang, S. Assessing the effects of ecological engineering on carbon storage by linking the CA-Markov and InVEST models. Ecol. Indic. 2019, 98, 29–38. [Google Scholar] [CrossRef]
  29. Wang, C.; Li, T.; Guo, X.; Xia, L.; Lu, C.; Wang, C. Plus-InVEST Study of the Chengdu-Chongqing Urban Agglomeration’s Land-Use Change and Carbon Storage. Land 2022, 11, 1617. [Google Scholar] [CrossRef]
  30. He, Y.; Ma, J.; Zhang, C.; Yang, H. Spatio-Temporal Evolution and Prediction of Carbon Storage in Guilin Based on FLUS and InVEST Models. Remote Sens. 2023, 15, 1445. [Google Scholar] [CrossRef]
  31. Wang, Z.; Zhong, A.; Wei, E.; Hu, C. Carbon Storage Simulation and Land Use Optimization for High-Water-Table Resource-Based Cities Based on the Coupled GMOP-PLUS-InVEST Model. Remote Sens. 2024, 16, 4480. [Google Scholar] [CrossRef]
  32. Jing, J.; Wei, F.; Jiang, H.; Chen, Z.; Lv, S.; Li, T.; Li, W.; Tang, Y. Prediction of Land Use Change and Carbon Storage in Lijiang River Basin Based on InVEST-PLUS Model and SSP-RCP Scenario. Land 2025, 14, 460. [Google Scholar] [CrossRef]
  33. Aishan, T.; Song, J.; Halik, Ü.; Betz, F.; Yusup, A. Predicting Land-Use Change Trends and Habitat Quality in the Tarim River Basin: A Perspective with Climate Change Scenarios and Multiple Scales. Land 2024, 13, 1146. [Google Scholar] [CrossRef]
  34. Cao, X.; Wang, H.; Zhang, B.; Liu, J.; Yang, J. Sustainable management of land use patterns and water allocation for coordinated multidimensional development. J. Clean. Prod. 2024, 457, 142412. [Google Scholar] [CrossRef]
  35. Zhang, Q.; Yuan, R.; Singh, V.P.; Xu, C.-Y.; Fan, K.; Shen, Z.; Wang, G.; Zhao, J. Dynamic vulnerability of ecological systems to climate changes across the Qinghai-Tibet Plateau, China. Ecol. Indic. 2022, 134, 108483. [Google Scholar] [CrossRef]
  36. Jin, X.; Jiang, P.; Li, M.; Gao, Y.; Yang, L. Mapping Chinese land system types from the perspectives of land use and management, biodiversity conservation and cultural landscape. Ecol. Indic. 2022, 141, 108981. [Google Scholar] [CrossRef]
  37. Jiang, X.; Duan, H.; Liao, J.; Song, X.; Xue, X. Land use in the Gan-Lin-Gao region of middle reaches of Heihe River Basin based on a PLUS-SD coupling model. Arid. Zone Res. 2022, 39, 1246–1258. [Google Scholar] [CrossRef]
  38. Moi, D.A.; Lansac-Tôha, F.M.; Romero, G.Q.; Sobral-Souza, T.; Cardinale, B.J.; Kratina, P.; Perkins, D.M.; Teixeira de Mello, F.; Jeppesen, E.; Heino, J.; et al. Human pressure drives biodiversity–multifunctionality relationships in large Neotropical wetlands. Nat. Ecol. Evol. 2022, 6, 1279–1289. [Google Scholar] [CrossRef]
  39. Jiang, T.; Su, B.; Wang, Y.; Wang, G.; Luo, Y. Gridded datasets for population and economy under Shared Socioeconomic Pathways for 2020–2100. Clim. Change Res. 2022, 18, 381–383. [Google Scholar]
  40. Chen, Y.; Guo, F.; Wang, J.; Cai, W.; Wang, C.; Wang, K. Provincial and gridded population projection for China under shared socioeconomic pathways from 2010 to 2100. Sci. Data 2020, 7, 83. [Google Scholar] [CrossRef] [PubMed]
  41. Yamamoto, H.; Yamaji, K.; Fujino, J. Evaluation of bioenergy resources with a global land use and energy model formulated with SD technique. Appl. Energy 1999, 63, 101–113. [Google Scholar] [CrossRef]
  42. Rebs, T.; Brandenburg, M.; Seuring, S. System dynamics modeling for sustainable supply chain management: A literature review and systems thinking approach. J. Clean. Prod. 2019, 208, 1265–1280. [Google Scholar] [CrossRef]
  43. Wang, X.; Meng, X.; Long, Y. Projecting 1 km-grid population distributions from 2020 to 2100 globally under shared socioeconomic pathways. Sci. Data 2022, 9, 563. [Google Scholar] [CrossRef] [PubMed]
  44. Mutale, B.; Qiang, F. Modeling future land use and land cover under different scenarios using patch-generating land use simulation model. A case study of Ndola district. Front. Environ. Sci. 2024, 12, 1362666. [Google Scholar] [CrossRef]
  45. Aghaloo, K.; Sharifi, A. Balancing priorities for a sustainable future in cities: Land use change and urban ecosystem service dynamics. J. Environ. Manag. 2025, 382, 125460. [Google Scholar] [CrossRef] [PubMed]
  46. Zhao, Z.H.; Liu, G.H.; Xu, Z.R. The Ecosystem Carbon Storage Dataset in Tibet (2001–2010). J. Glob. Change Data Discov. 2018, 2, 67–71. [Google Scholar] [CrossRef]
  47. Li, L.; Fan, Z.; Feng, W.; Yuxin, C.; Keyu, Q. Coupling coordination degree spatial analysis and driving factor between socio-economic and eco-environment in northern China. Ecol. Indic. 2022, 135, 108555. [Google Scholar] [CrossRef]
  48. Wei, Z.; Dong, B.; Xu, H.; Xu, Z.; Lu, Z.; Liu, X. The spatiotemporal evolution and scenario prediction of carbon storage in typical wetlands in the Poyang Lake region. Water Soil Conserv. Bull. 2023, 43, 290–300. [Google Scholar] [CrossRef]
  49. Xiang, S.; Wang, Y.; Deng, H.; Yang, C.; Wang, Z.; Gao, M. Response and multi-scenario prediction of carbon storage to land use/cover change in the main urban area of Chongqing, China. Ecol. Indic. 2022, 142, 109205. [Google Scholar] [CrossRef]
  50. Seto, K.C.; Güneralp, B.; Hutyra, L.R. Global forecasts of urban expansion to 2030 and direct impacts on biodiversity and carbon pools. Proc. Natl. Acad. Sci. USA 2012, 109, 16083–16088. [Google Scholar] [CrossRef]
  51. Han, Z.; Li, B.; Han, Z.; Wang, S.; Peng, W.; Liu, X.; Benson, D. Dynamic Simulation of Land Use and Habitat Quality Assessment in Baiyangdian Basin Using the SD-PLUS Coupled Model. Water 2024, 16, 678. [Google Scholar] [CrossRef]
  52. Yue, S.; Ji, G.; Chen, W.; Huang, J.; Guo, Y.; Cheng, M. Spatial and Temporal Variability Characteristics of Future Carbon Stocks in Anhui Province under Different SSP Scenarios Based on PLUS and InVEST Models. Land 2023, 12, 1668. [Google Scholar] [CrossRef]
  53. Wang, Q.; Zhang, W.; Xia, J.; Ou, D.; Tian, Z.; Gao, X. Multi-Scenario Simulation of Land-Use/Land-Cover Changes and Carbon Storage Prediction Coupled with the SD-PLUS-InVEST Model: A Case Study of the Tuojiang River Basin, China. Land 2024, 13, 1518. [Google Scholar] [CrossRef]
  54. Zhu, K.; He, J.; Tian, X.; Hou, P.; Wu, L.; Guan, D.; Wang, T.; Huang, S. Analysis of Evolving Carbon Stock Trends and Influencing Factors in Chongqing under Future Scenarios. Land 2024, 13, 421. [Google Scholar] [CrossRef]
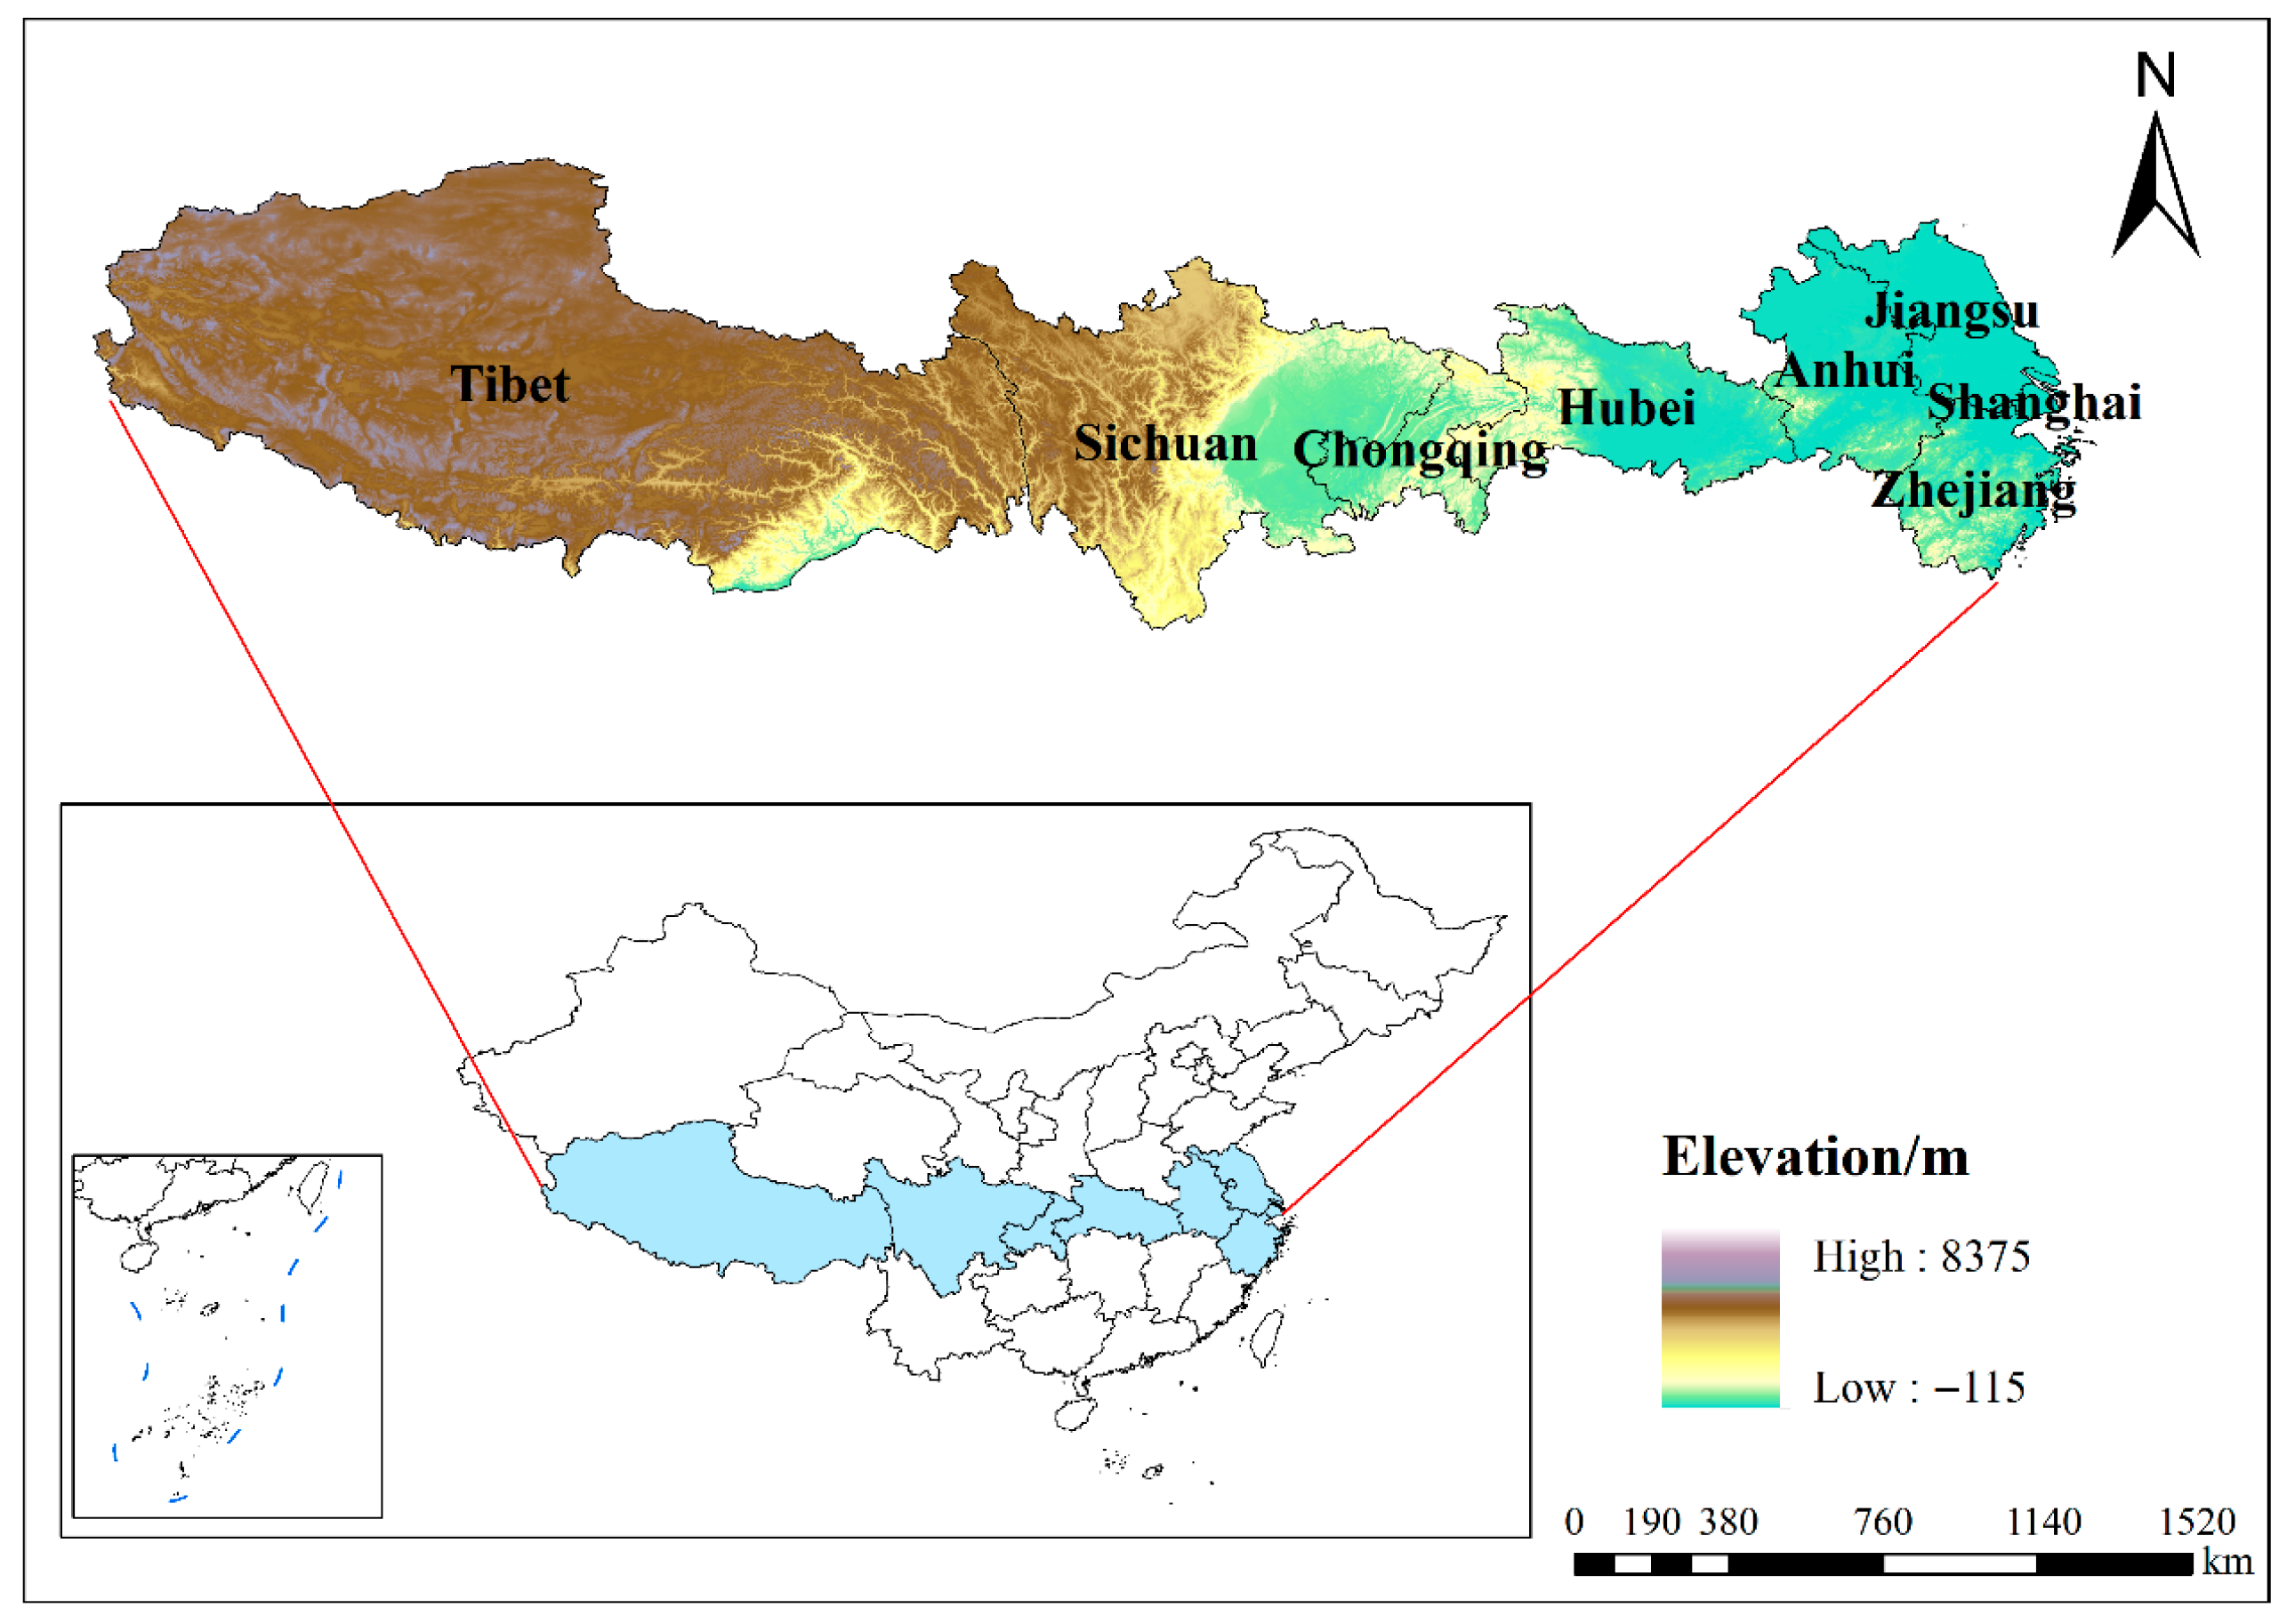
Figure 1. Location map.
Land 14 02067 g001
Figure 2. The flowchart of this study.
Land 14 02067 g002
Figure 3. SD model of land use demand change in the G318 regions.
Land 14 02067 g003
Figure 4. PLUS driving factors.
Land 14 02067 g004
Figure 5. Multi-scenario LULC in the G318 regions. Note: A: the glaciated and permafrost zone in the northern Tibetan Plateau; B: Chengdu-Chongqing Economic Zone; C: Yangtze River Delta Urban Agglomeration.
Land 14 02067 g005
Figure 6. Land use change in the G318 regions.
Land 14 02067 g006
Figure 7. Multi-scenario CS in the G318 regions. Note: A: the glaciated and permafrost zone in the northern Tibetan Plateau; B: Chengdu-Chongqing Economic Zone; C: Yangtze River Delta Urban Agglomeration.
Land 14 02067 g007
Figure 8. Multi-scenario LUI in the G318 regions. Note: A: the glaciated and permafrost zone in the northern Tibetan Plateau; B: Chengdu-Chongqing Economic Zone; C: Yangtze River Delta Urban Agglomeration.
Land 14 02067 g008
Figure 9. Coordination of LUI and CS.
Land 14 02067 g009
Figure 10. Coordination of LUI and CS across Elevation Bands.
Land 14 02067 g010
Table 1. Source Data.
Data CategoryTemporal CoverageResolutionAcquisition
CLCD2000, 2010, 202030 mZenodo Platform
(https://zenodo.org/record/8176941)
(accessed on 24 September 2024)
GDP distribution
Population (POP)
Temperature (TEM)
Precipitation (PRE)
Net Primary Productivity (NPP)
Normalized Difference Vegetation Index (NDVI)
20101 kmResource and Environment Science and Data Center
(https://www.resdc.cn/)
(accessed on 8 March 2025)
Nighttime light (NL)2010500 mAI Earth
(https://engine-aiearth.aliyun.com/)
(accessed on 7 March 2025)
Elevation
Slope (SL)
202030 mGeospatial Data Cloud
(https://www.gscloud.cn/)
(accessed on 7 March 2025)
Human Footprint maps (HFP)20091 km[38]
Future Population
Future GDP
2021–20301[39]
Future urbanization rate2021–2030[40]
Future Temperature
Future Precipitation
2021–20301 kmNational Tibetan Plateau Science Data Center
(https://data.tpdc.ac.cn/)
(accessed on 20 January 2025)
1 “—“ means that the data has no resolution.
Table 2. Classification of types of coordination.
Type of CoordinationDysfunctional RecessionBreak-in TransitionCoordinated Development
Coordination index interval[0, 0.2)[0.2, 0.4)[0.4, 0.6)[0.6, 0.8)[0.8, 0.9)[0.9, 1]
ClassificationSerious imbalanceMild imbalanceNear imbalanceBasic coordinationGood coordinationQuality coordination
Disclaimer/Publisher’s Note: The statements, opinions and data contained in all publications are solely those of the individual author(s) and contributor(s) and not of MDPI and/or the editor(s). MDPI and/or the editor(s) disclaim responsibility for any injury to people or property resulting from any ideas, methods, instructions or products referred to in the content.