Article

Assessment and Layout Optimization of Urban Parks Based on Accessibility and Green Space Justice: A Case Study of Zhengzhou City, China

1
School of Surveying and Land Information Engineering, Henan Polytechnic University, Jiaozuo 454003, China
2
Jiaozuo Municipal Natural Resources and Planning Bureau Shanyang Service Center, Jiaozuo 454003, China
3
Research Centre of Arable Land Protection and Urban-Rural High-Quality Development of Yellow River Basin, Henan Polytechnic University, Jiaozuo 454003, China
4
State Key Laboratory of Geographic Information Science and Technology, Institute of Geographic Sciences and Natural Resources Research, Chinese Academy of Sciences, Beijing 100101, China
*
Author to whom correspondence should be addressed.
Land 2025, 14(10), 2055; https://doi.org/10.3390/land14102055
Submission received: 10 September 2025 / Revised: 6 October 2025 / Accepted: 11 October 2025 / Published: 15 October 2025
(This article belongs to the Special Issue Green Spaces and Urban Morphology: Building Sustainable Cities)

Abstract

Addressing the imbalance between supply and demand for urban parks necessitates an assessment of their service accessibility and spatial equity. This study integrates multi-source geographic data, uses multiple data sources to generate a population distribution with high spatial resolution, and constructs park service areas with multiple time thresholds based on travel preference surveys. The network analysis method is used to evaluate the supply–demand ratio and spatial equity by using location entropy, Lorenz curves, and the Gini coefficient to identify the optimal location. The results reveal a significant difference in the supply–demand ratio of parks. Within the 5 min time threshold, only 14.68% of the pixels in the park supply area meet the needs of residents, while the proportions for the 15 min and 30 min time service area expands to 71.74% and 86.34%, respectively. The distribution of parks exhibits apparent spatial inequity. Equity is highest for the 15 min service area (Gini coefficient = 0.25), followed by the 30 min area (Gini coefficient = 0.27) and 5 min areas (Gini coefficient = 0.37). Among the 80 streets in the study area, the per capita green space location entropy of 11 streets is zero. A targeted site selection analysis for areas with park supply deficiencies led to the proposed addition of 11 new parks. After this optimization, the proportion of regions achieving supply–demand balance or better reached 80.38%, significantly alleviating the supply–demand conflict. This study reveals the characteristics of park supply–demand imbalance and spatial equity under different travel modes and time thresholds, providing a scientific basis for the precise planning and equity enhancement of parks in high-density cities.

1. Introduction

As a core component of public service facilities, urban parks serve not only as crucial venues for residents’ daily recreation and connection with nature [1,2] but also directly impact the enhancement of residents’ quality of life and the sustainable development of urban ecosystems [3,4]. In recent years, with the growing demand from residents for a livable environment and ecological well-being, the strategic importance of parks has become increasingly prominent in urban planning and construction [5]. Parks and urban residents form a “supply–demand” relationship chain. The distribution, scale, and quality of parks form the foundation of their social service capacity. Generally, the provision of larger urban green spaces implies stronger potential service capacity [6]. On the other hand, the population size [7], population density, and spatial distribution characteristics of residents [8] profoundly influence the actual intensity of demand for park services. The degree of matching between park resources and the resident population directly reflects the balance of this relationship [9]. When the population size continues to expand while the pace of park construction lags, core indicators such as per capita green space area and service radius coverage decline, leading to problems such as residents having no space for exercise, long queues for rest, competition for facilities, and overload of the environmental carrying capacity [10]. Therefore, studying the interaction mechanism between supply and demand, and accurately identifying supply–demand gaps and their spatial distribution patterns, is crucial for scientifically guiding the efficient and equitable allocation of green space resources [11].
Although traditional park planning methods can create a reasonable park layout on a large scale, there is a growing gap between what is provided and what people actually need [12]. Thus, studies have evolved from examining overall resource distribution to investigating more detailed matches between supply and demand. The methods used have also advanced from simple observations to more technical approaches that combine ideas from different fields. Among these, studies of how easy it is to reach parks (accessibility) [13,14] and whether services are fair (equity) [15,16] have become common ways to resolve mismatches between supply and demand [17]. Accessibility measures how well people can reach parks despite barriers such as distance or travel time [18,19]. Some researchers use computer-based network analysis to map reachable areas [20,21] and consider different travel modes to avoid focusing on a single trip type [22,23]. Equity examines whether everyone has fair access to park services. Zhou et al. [24] used the network analysis method, the improved Gaussian floating catchment area method, the Gini coefficient, and the Lorentz curve to measure the fairness of urban park green space (UPGS) service supply in Fuzhou, as well as the spatial fairness of UPGS in different streets and different travel modes. Together, these methods offer a scientific way to study supply and demand matching [25]. More recent studies have built on these ideas by using computational methods such as K-means clustering combined with PSO [26] or location–allocation models [27] to transition from analysis to practical park planning improvements.
However, existing research still has significant limitations that constrain the precision of supply–demand matching analysis. The two-step floating catchment area (2SFCA) method, while efficient for macro-scale analysis, has notable drawbacks [28,29]. Its coarse spatial units fail to reveal fine-grained, pixel-level disparities. Moreover, the model uses straight-line distances that do not match real-world travel and produces a relative supply–demand index that cannot be translated into actionable targets like per capita park area. Most studies focus solely on accessibility analysis for a single time threshold, failing to reflect residents’ differentiated needs under different time budgets (e.g., short breaks on weekdays vs. longer weekend trips) [30]. These limitations make it hard for planners to create targeted solutions.
Therefore, based on the space–time service threshold, multimodal transport mode, per capita park demand standard, residents’ demand preference, park supply and demand matching, and park fairness evaluation, this study systematically investigates the park service capacity and fairness pattern of Zhengzhou City, and proposes optimization strategies. The research mainly includes the following: (1) integrating multi-source geospatial data, objectively evaluating the weight of indicators, realizing the spatialization of permanent population data from 2024, and producing population raster data with a 50 m resolution; (2) using the network analysis method combined with a residents’ travel survey to determine the preference weight of different modes of transportation and quantitatively evaluate the accessibility of 173 parks in Zhengzhou; (3) using location entropy, the Lorenz curve, and the Gini coefficient to deeply quantify the matching relationship between the supply and demand of park areas at grid-unit scale and evaluating the fairness of park resource allocation; (4) combining K-means clustering and the PSO algorithm to provide an optimization strategy for Zhengzhou city’s parks. The aim of this study is to better meet residents’ growing demand for a high-quality ecological environment and blue–green spaces by enhancing park accessibility service ranges and equity, providing practical support for the construction and planning of Zhengzhou’s landscape.

2. Literature Review

Urban parks are a crucial type of public green infrastructure, and effective planning and management requires a deep understanding of the dynamic relationship between supply and demand [31]. This section systematically traces the evolution of research paradigms in park supply–demand matching, which critically examines advancements in the two core pillars of this field, accessibility and equity. By comparing international studies, it identifies the limitations of existing research and the innovative contributions of this paper.

2.1. The Evolution of Research Paradigms: From Static Indicators to Dynamic Simulation

Early park planning practices heavily relied on macro-level static indicators such as per capita green space area and green space ratio. Oh et al. [32] calculated the total service area of urban parks and the subsequent serviceability of pedestrian parks in Seoul, South Korea. Fasihi and Parizadi [33] conducted a spatial equity and urban park access analysis of Ilam, Iran, and found that the park area accounted for only 2.13% of the area of Ilam, and the per capita park area was 1.91 m2. While facilitating inter-city comparisons, these methods fundamentally ignored the spatial interaction between residents and parks, failing to reveal the spatial heterogeneity of resource distribution. With the maturation of geographic information systems and remote sensing technologies, the research paradigm underwent a revolutionary shift from “supply-oriented” to “demand-oriented” [34]. Researchers began to focus on delineating the match between population distribution and park resource supply at fine spatial scales, establishing spatially explicit supply–demand matching analysis as the mainstream paradigm.
This paradigm shift is evident in global research. European studies often emphasize social equity. For instance, research in Barcelona, Spain, utilizing high-resolution population data empirically demonstrated systematic disadvantages in green space accessibility for low-income neighborhoods, informing planning policies aimed at environmental justice. Research in the Netherlands applied fine-grained measurements of green spaces (such as lawns, hedges, and trees) to 5773 school locations, concentrating buffer zones at 50 m, 100 m, and 500 m. The results showed significant socioeconomic differences in the availability of green school outdoor environments [35]. It is worth noting that there is a unique perspective on the supply differences of parks in high-density cities in different regions. A horizontal comparative study based on New York, Amsterdam, and Beijing integrated indicators of environmental livability and social needs to estimate potential human needs and found that UGS inequality in New York is greater than that in Beijing and Amsterdam. The demand-based inequality of low supply and high demand is mainly distributed in the urban centers of the three cities, and the relationship between green supply and human demand varies by city and indicator [36].
These cross-regional cases not only validate the universality of spatial analysis methods but also emphasize the importance of incorporating contextual factors such as local culture, social structure, and urban form into the analytical framework.

2.2. Core Dimensions of Supply–Demand Matching: Accessibility and Equity

Within the spatially explicit analysis paradigm, accessibility and equity constitute two indispensable and interconnected dimensions for assessing park supply–demand matching [5].
In accessibility research, methods have evolved from simple geometric buffering to complex behavioral simulation. The two-step floating catchment area method and its variants significantly enhance the assessment by simultaneously considering supply capacity, demand distribution, and spatial impedance [37]. One of the main development trends is the integration of multimodal transport networks. A study in Europe assessed the accessibility of parks and forests in 33 major European cities and calculated the average accessibility scores of three green modes of transportation (walking, cycling, and public transportation) [38]. In addition, refined modeling of actual travel behaviors is also receiving increasing attention. Rad and Alimohammadi modeled the relationship between network distance and travel time dynamics to generate traffic maps for five times of the day to assess the fairness of urban park accessibility and found significant inequalities in accessibility at different times of the day [39].
In equity research, the focus has deepened from the Gini coefficient’s concern with aggregate resource distribution to investigating the spatial justice of resource access opportunities. The former measures the overall equality of park area distribution across populations or administrative units, while the latter, by spatially correlating accessibility results with fine-scale socioeconomic data, aims to identify overlooked “service deserts” and vulnerable groups. Research in Nashville, Tennessee, a low-density, car-oriented city, identified basic service deserts through spatial association local indicator (LISA) clustering and assessed spatial traffic inequalities between socio-demographic groups [40]. Similarly, studies in Changting, China, constructed a shared park demand index for socially disadvantaged groups and quantitatively measured the accessibility and social equity of the park. It was found that there was a certain degree of spatial mismatch between the distribution of urban parks and the distribution of residents [41].

2.3. Limitations of Existing Research and Identified Gaps

Despite fruitful outcomes in domestic and international research, several limitations continue to constrain their value for planning guidance. Table 1 systematically summarizes the main research methods, typical cases, and their limitations.
Based on the above, the research gaps can be summarized by a lack of micro-scale precision and policy alignment. Mainstream methods, constrained by data granularity, struggle to precisely identify supply–demand mismatches at the neighborhood scale, while their outputted relative indices prove difficult to align directly with policy benchmarks such as per capita park area. Furthermore, behavioral simulations lack realism, as the assignment of weights for different transport modes in multimodal analyses often relies on theoretical assumptions rather than empirical data derived from local travel behavior, leading to discrepancies between simulations and reality. To address these gaps, the aim of this study is to construct a comprehensive assessment framework that integrates high-precision data, empirically derived behavioral weights, and a spatiotemporal dynamic perspective, building upon international cutting-edge research cases and methodologies. This work seeks to advance park supply–demand matching research toward greater precision, realism, and policy relevance.

3. Materials and Methods

3.1. Study Area

Zhengzhou is the capital of Henan province and the national central city in China. The built-up area of its central urban area reached 822.30 square kilometers in 2024. This area covers core segments including Zhongyuan District, Erqi District, Jinshui District, Guancheng Hui District, Huiji District, Zhengdong New District, Zhengzhou Economic and Technological Development Zone, Zhengzhou High-Tech Industrial Development Zone, and Zhengzhou Airport Economy Zone, which together constitute a key part of the main urban area. According to data from the Zhengzhou Municipal Bureau of Statistics, as of 2025, the permanent population of Zhengzhou was 13.008 million, with an urbanization rate of 81%, placing it among China’s super-large cities. The population exhibits a typical spatial gradient of “high-core, low-suburban” distribution, with the urban form undergoing a critical transition from a “single-center” to a “multi-center, cluster-based” structure. In response to the national “Park City” strategy, the city has opened a total of 267 shared green spaces with a total area exceeding 9.22 million square meters. These green spaces are widely distributed in parks, squares, corridors, and other regions, with a higher density in the main urban area, providing basic space for residents’ leisure, recreation, sports, and fitness activities [42]. However, amid rapid urbanization, Zhengzhou faces structural imbalances in park supply and demand similar to those of other super-large cities nationwide: “sufficient overall scale but mismatched tiered structures and spatial layouts” [43].
To ensure the accuracy of the park location, number and road network information, we selected five major administrative regions (Zhongyuan District, Erqi District, Jinshui District, Guancheng Hui District, and Huiji District) in Zhengzhou city, which has a dense traffic network, mainly with 7 subway lines, 472 bus lines, and a perfect greenway system. This study includes 173 parks (Figure 1). The complex spatial structure of the region and the diversity of the park system provide a typical sample for an in-depth exploration of the spatial differentiation pattern of park accessibility and its contradiction with urban demand.

3.2. Data Collecting and Preprocessing

This study integrates multi-source geospatial data (Table 2), including road network information, Sentinel-2A satellite images, WorldPop population raster data, nighttime lighting data, POI data, and park location information. To calculate the accessibility of the park under different travel modes and multiple distance thresholds, the obtained road network data were differentiated. After unified preprocessing and topology correction of the filtered effective road data to ensure the integrity of the network topology, a multimode road network model was constructed. The service areas of each park were then generated for accessibility analysis.

3.3. Park Accessibility Calculation

Network analysis is used to quantitatively evaluate the spatial accessibility from residential areas to urban parks. This study constructs an accessibility analysis framework with multimode travel time resistance as the core evaluation factor. First, a total of 744 valid questionnaires were collected through a questionnaire survey to obtain residents’ travel times and modes. Based on this questionnaire survey data and empirical research, the average speeds of walking, cycling, and motor vehicles were determined to be 1.30 m/s, 4.17 m/s, and 8.33 m/s, respectively. In addition, the service distance of different travel modes under the specified time threshold was calculated. Based on the actual road network data, the constraints are constructed, the entrance of each park is taken as the starting point, and the selection ratios and corresponding weights of the three travel modes under different time thresholds are calculated and determined (Table 3). By multiplying the weight of each travel mode by its reachable distance within the corresponding time threshold and performing a weighted summation, the weighted reachable distance of the park under each time threshold is calculated (Table 4). This weighted distance was used as the search radius to generate the park service range for the three time thresholds under the comprehensive traffic mode.

3.4. Calculation of Quantitative Index of Supply and Demand of Accessible Park Area

This study integrates high-precision population raster data and multimode traffic network service areas to quantitatively evaluate the spatial accessibility of parks. According to ‘Zhengzhou City Park System Special Planning (2021-2035)’ and ‘GBT_51346-2019_Urban Green Space Planning-Standard’, the per capita accessible park area standards corresponding to 5 min, 15 min, and 30 min travel time are set to 2.00 m2/person, 3.50 m2/person, and 7.00 m2/person, respectively. In order to eliminate the problem of repeated calculation of area caused by the spatial overlap of multiple park service areas, the supply distribution method (Formula (1)) is introduced to accurately quantify the park resources actually achieved by each grid pixel. The population grid and park service vector surface are spatially joined and summarized to calculate the effective population served by each park and the park service area obtained by each pixel. Based on the per capita standards and different travel modes, Formula (3) is used to calculate the supply–demand ratio of each population grid pixel at different time thresholds and street scales. Formula 4 is then used to evaluate the overall coverage at each time threshold, enabling an accurate and fair evaluation of park service supply capacity in the spatial dimension.
(1) Calculate the park supply area of each pixel.
S i = k = 1 m ( A k × P o p i P_Po p k )
Si is the park area obtained by pixel point I; Ak is the area of park k; Popi is the population of pixel point i; P_Popk is the total population in the k service area of the park.
(2) Calculate the required area of each pixel.
D i = P o p i × C T
CT is the standard of park area per capita.
(3) Calculate the supply–demand ratio of each pixel.
R i T = S i D i
(4) Calculate the coverage rate of the park service standard range under each time threshold.
C T = R i T 1 I × 100 %
I is the total number of pixels; RTi ≥ 1 is the evaluation index for the park supply to meet or exceed the residents’ demand.

3.5. Park Space Equity Measurement Method

The location entropy can be used to measure the spatial distribution characteristics of the elements in a specific region and reflect the difference between the development degree of the elements in the area and the overall region. Among them, the per capita green space location entropy represents the level of residents’ per capita access to park space resources (Formula (5)), while the per capita green space service location entropy reflects the level of per capita access to effective services in park space (Formula (6)). Together, they characterize the spatial matching of park resources and the resident population.
Q 1 = A d 1 P d / A q 1 P q
Q 2 = A d 2 P d / A q 2 P q
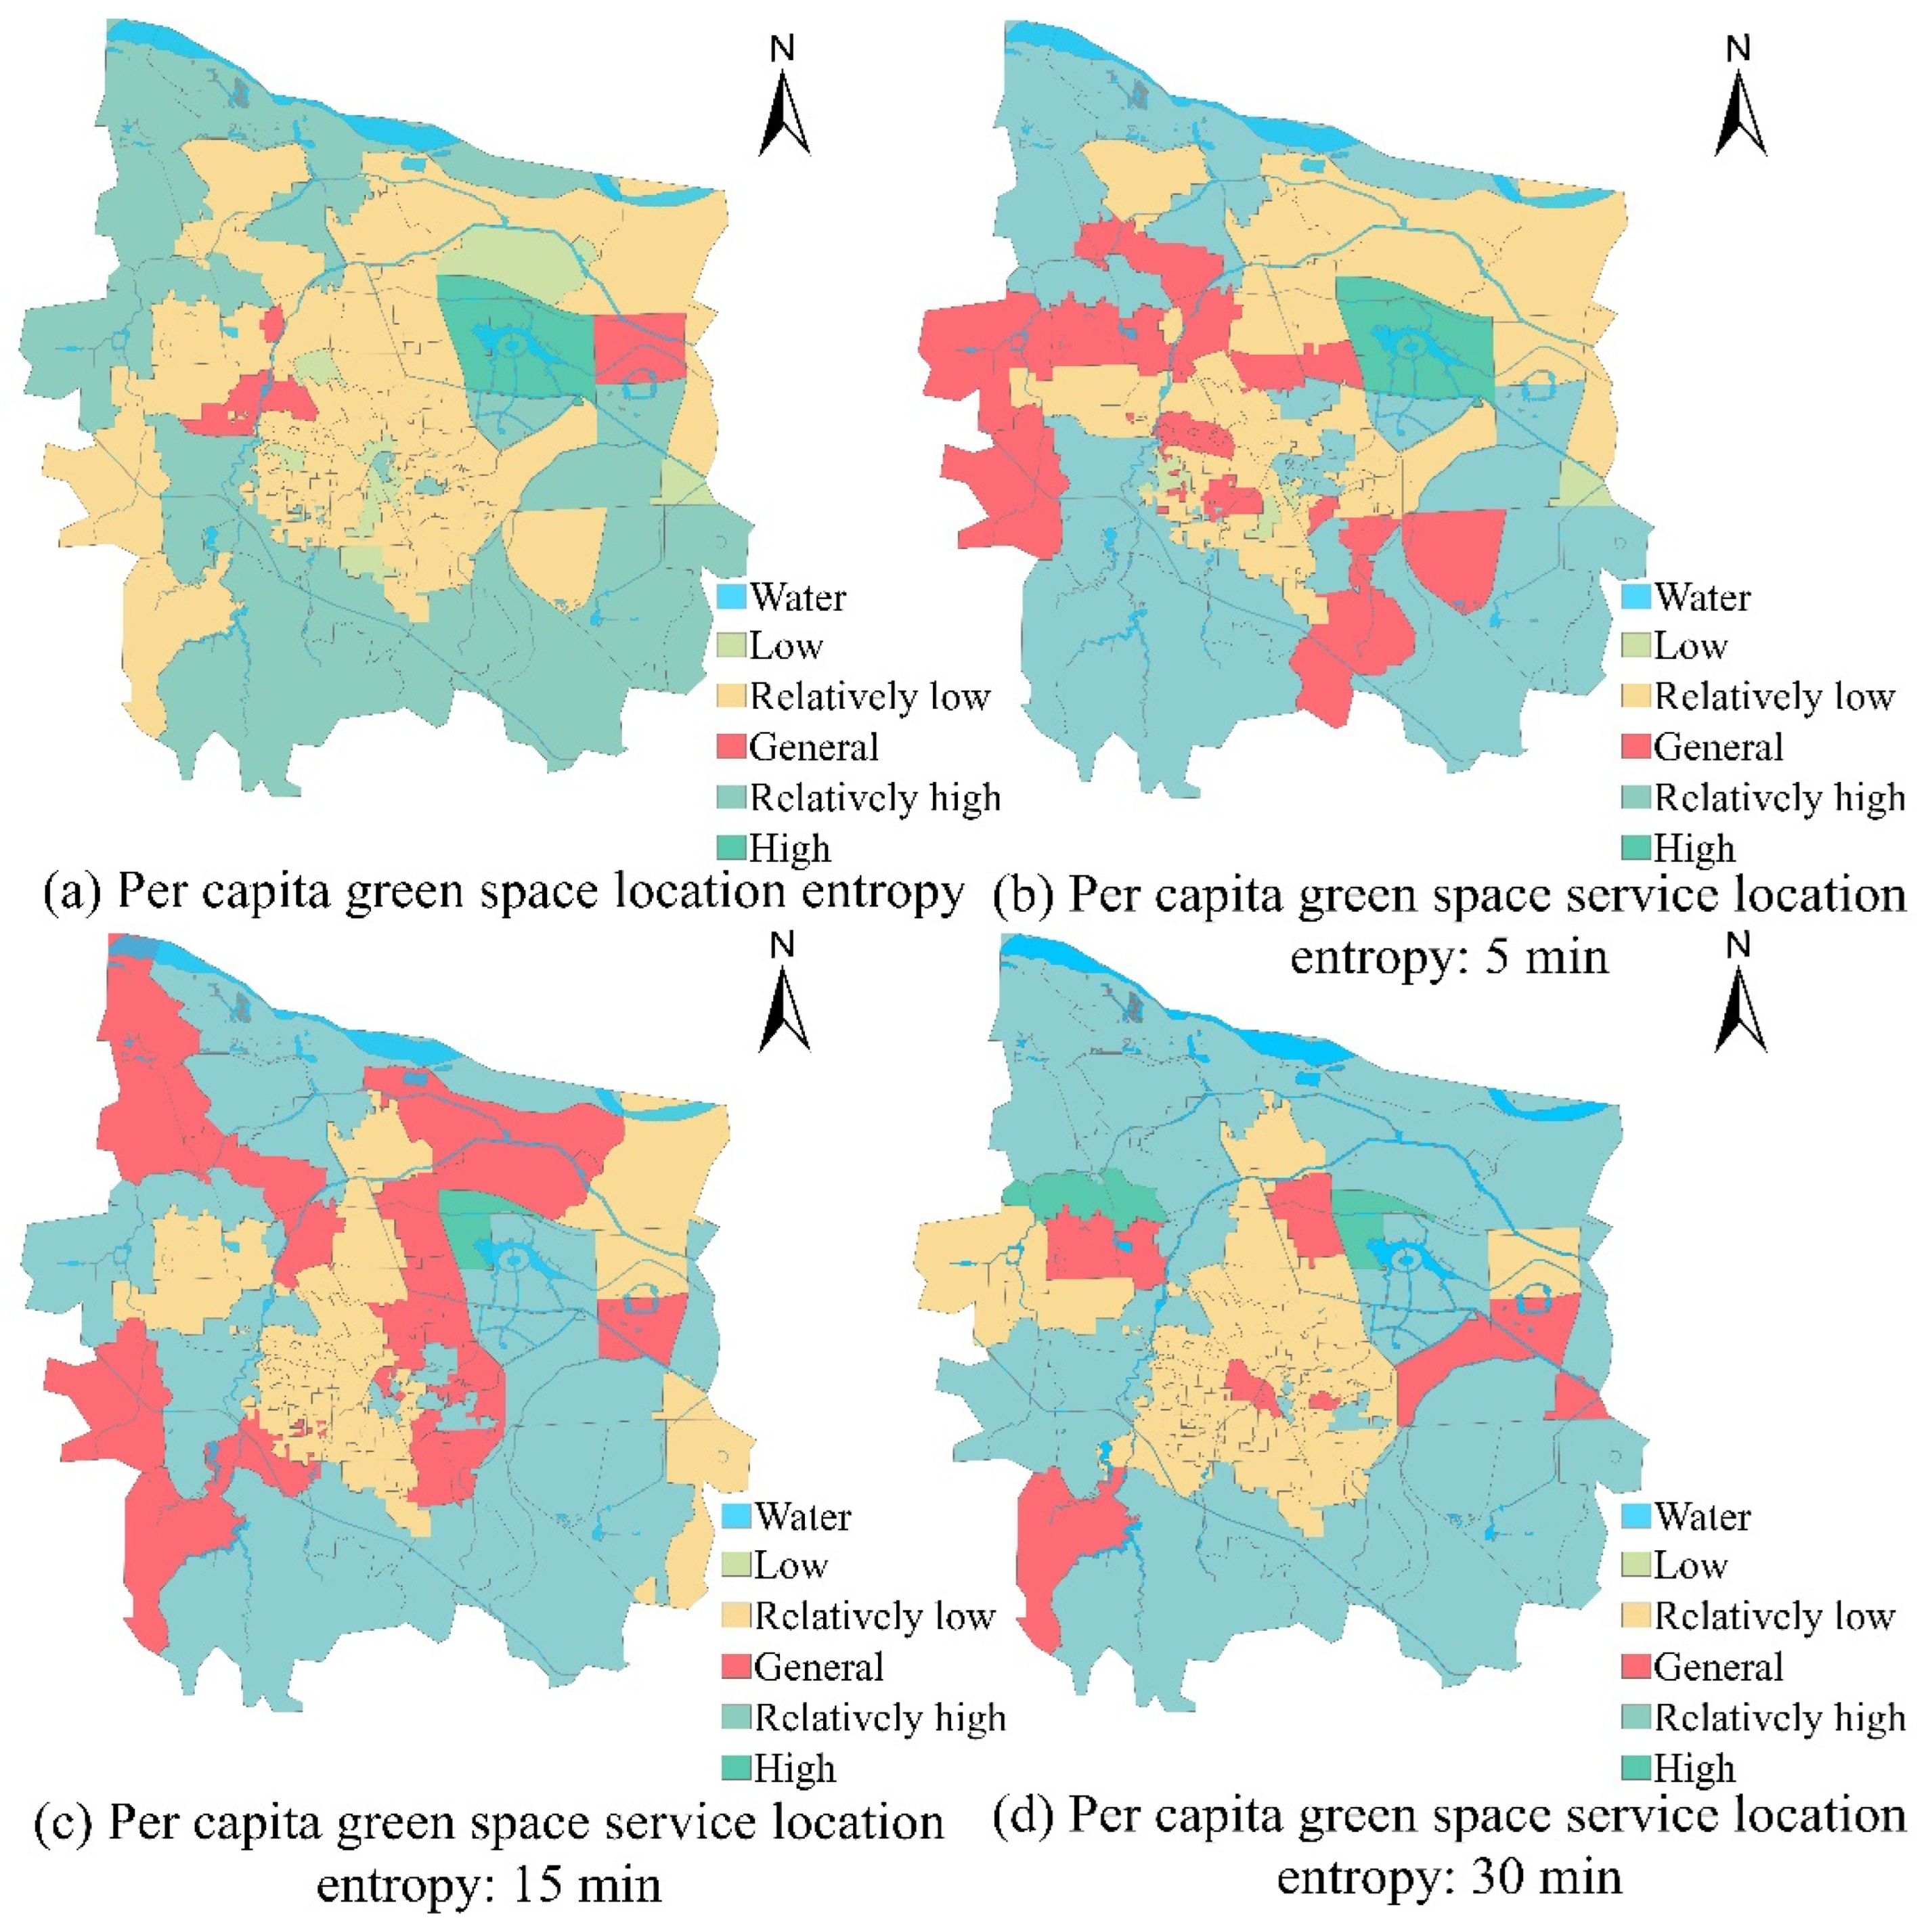
Q1 is the per capita green space location entropy; Q2 is the per capita green space service location entropy; Ad1 is the total area of a street park green space; Aq1 is the total park area in the study area; Ad2 is the total area of the park service radius in the street; Aq2 is the total area of the park service radius in the study area; Pd is the number of permanent residents in the street; Pq is the number of permanent residents in the study area. A location entropy of 0, (0,0.8], (0.8,1.2], (1.2,8], and greater than or equal to 8 indicates the level of access to park services is very low, relatively low, general, relatively high, and high, respectively.
The Gini coefficient can effectively identify the equity status within a region and facilitate horizontal comparisons between areas. Through the Gini coefficient (Formula (7)), the macro equity pattern of the spatial distribution of park green space can be quantitatively evaluated in the system.
G = 1 k = 1 n P k P k 1 S k + S k 1
G is the Gini coefficient; n is the number of streets; k is the area serial number sorted in ascending order according to the total park space area of the street; Pk is the cumulative percentage of the population of the kth street; Sk is the cumulative percentage of park space resources in the kth street. The rank is shown in Table 5.

4. Results

4.1. Analysis of Multi-Scale Park Accessibility Results

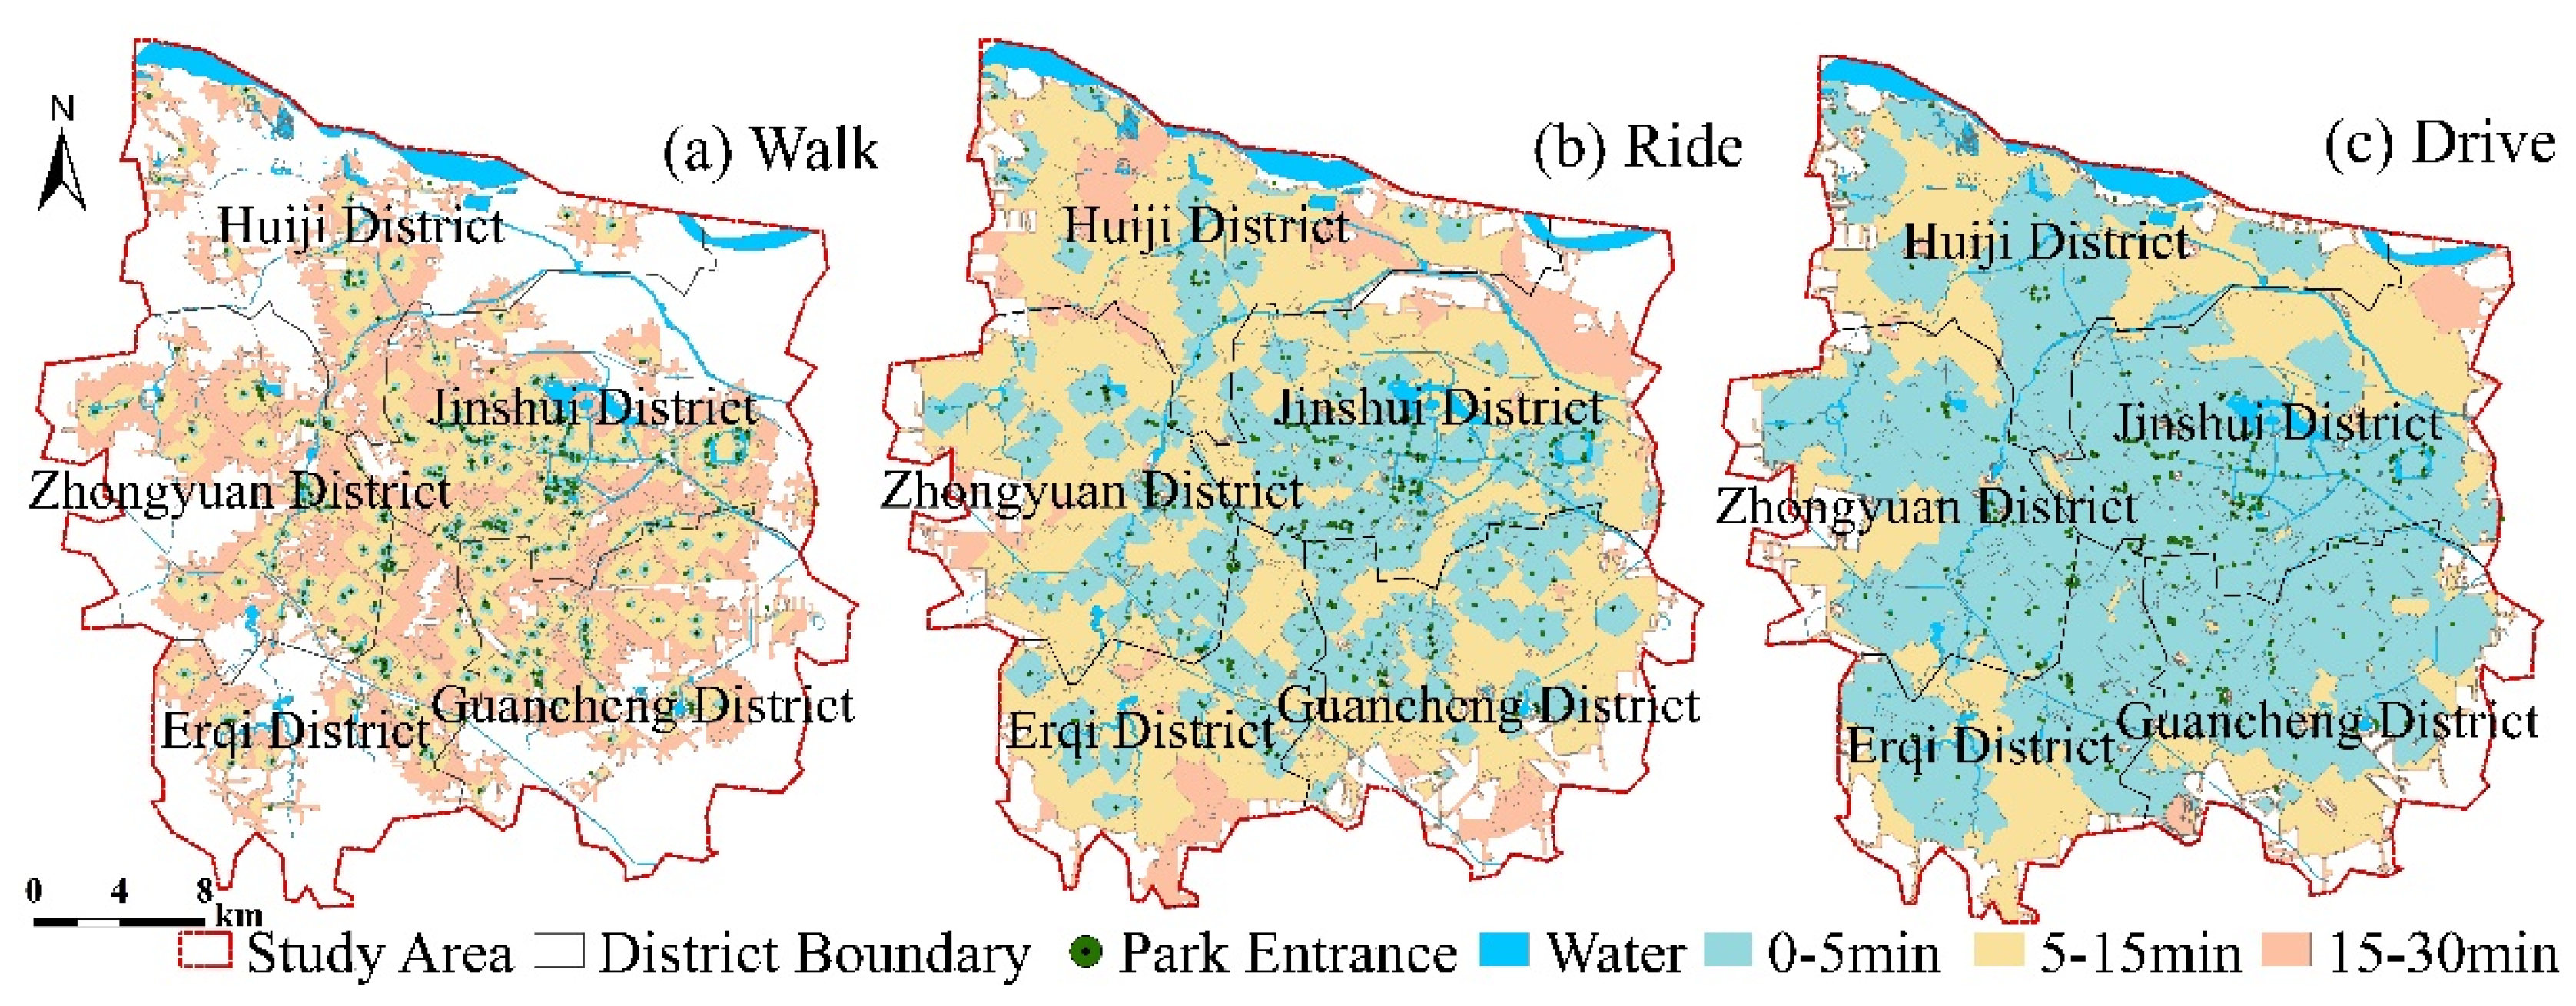
The spatial distribution of parks in Zhengzhou is mostly closely adjacent to water bodies, primarily along the Yellow River, Jialu River, and the main river basins in the urban area. According to the service range of the park under different time thresholds and various travel modes (Figure 2), it can be seen that the overall reachable range of the study area under the walking mode is limited. The space is concentrated in the southwest of Jinshui District, the southeast of Huiji District, the eastern part of Zhongyuan District, the northwest of Guancheng District, and the northeast of Erqi District, while peripheral villages and suburbs are relatively weak due to sparse population and lack of geographical advantages of the park layout.
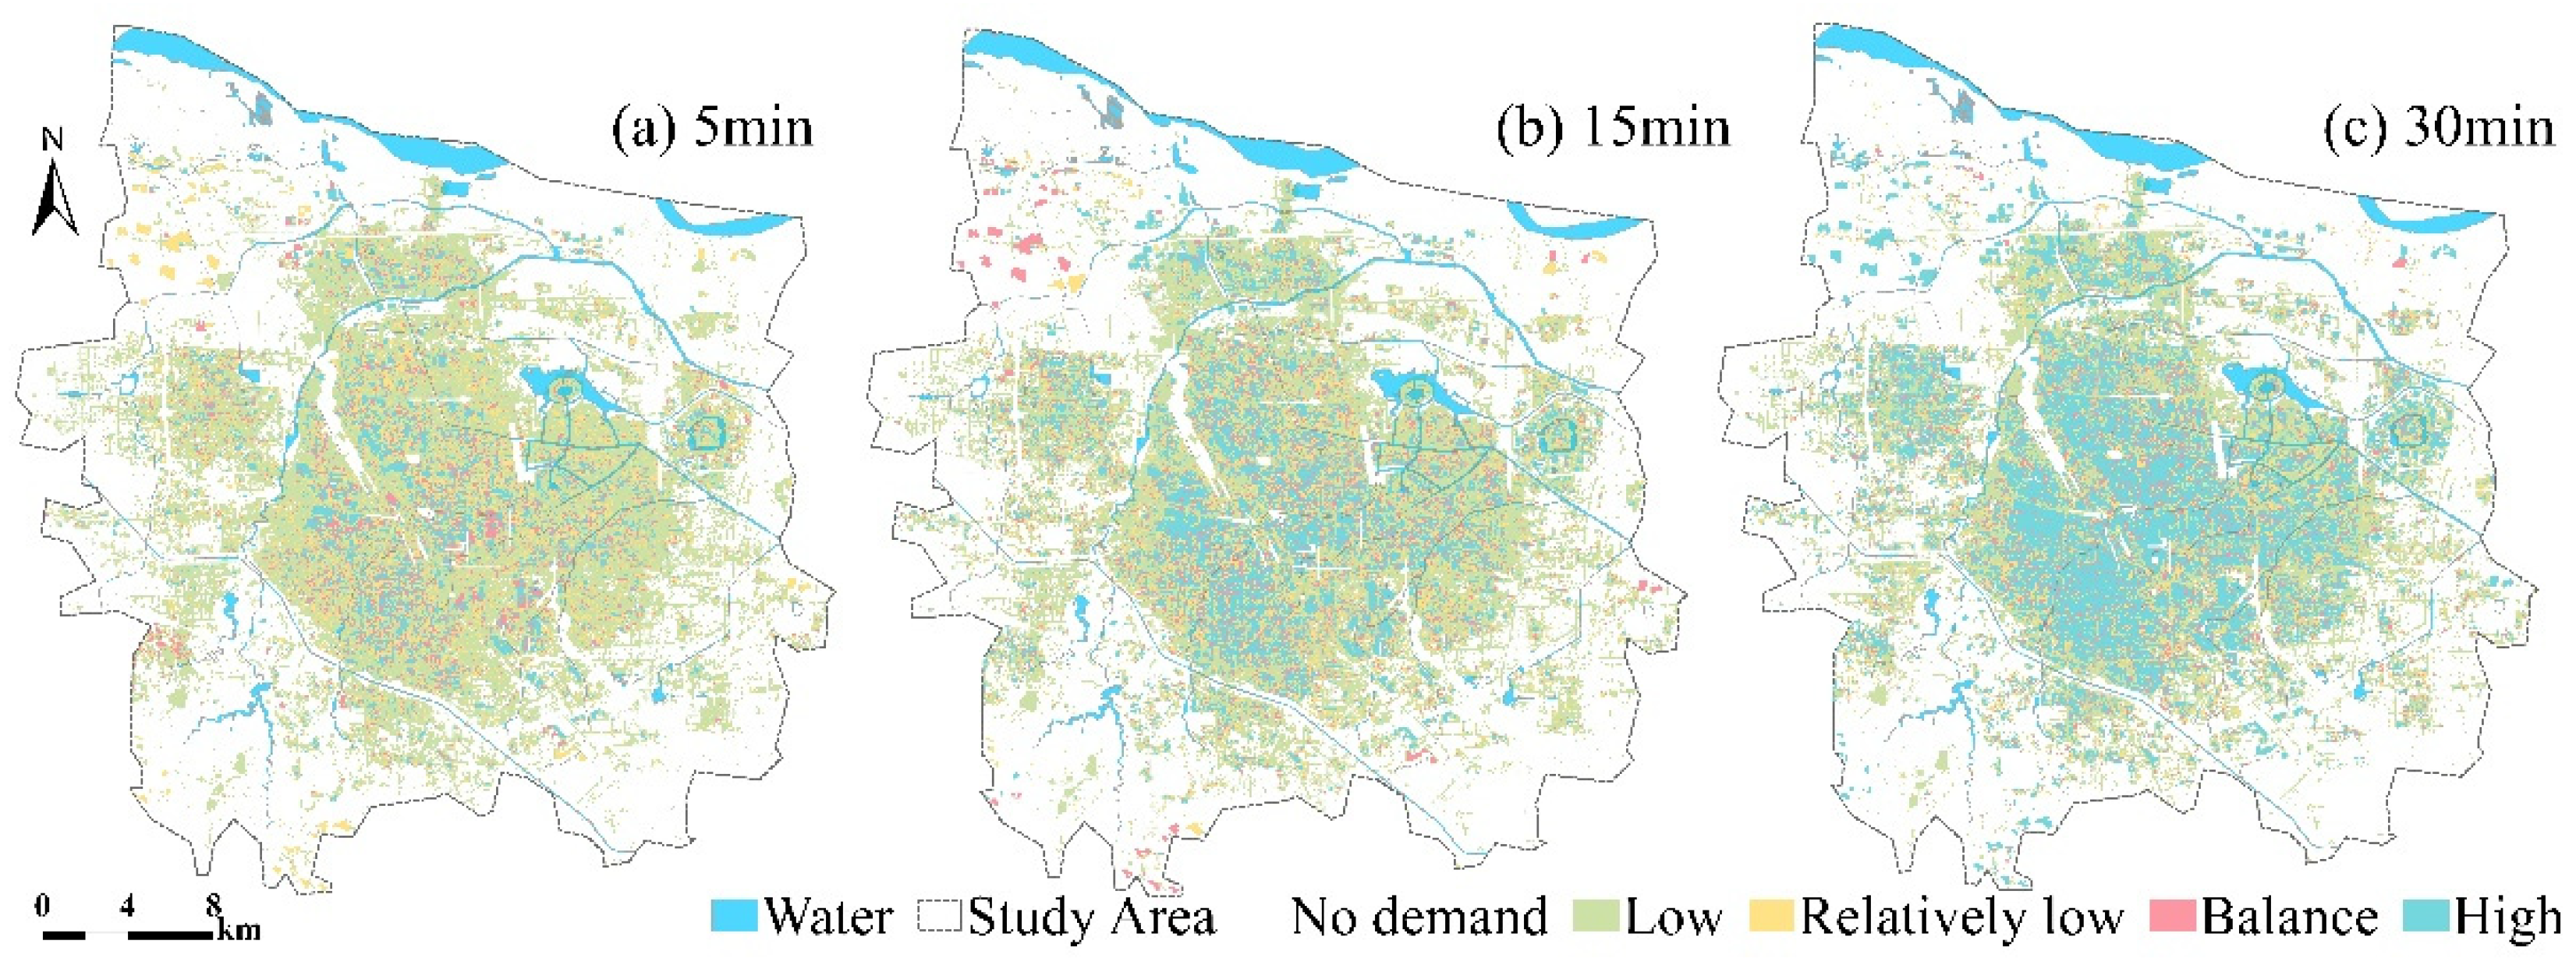
Under the integrated transportation mode, park service areas at different time thresholds demonstrate distinct gradient coverage characteristics. The 5 min service area primarily covers the core zones surrounding the parks, with a coverage area of 112.96 km2, accounting for only 10.93% of the total study area. Its limited scope mainly fulfills the immediate needs of residents in proximity to the parks (Figure 3a). As the time threshold increases, the 15 min service area exhibits significantly enhanced connectivity, covering 5619.41 km2 (Note: this value exceeds the total study area due to overlapping service ranges of individual parks). This 15 min service area substantially meets the demand for most residents within the study area to reach a park within 15 min (Figure 3b). Further expanding to the 30 min threshold achieves near-complete coverage of the study area, with a coverage area of 40,095.08 km2. This remarkable improvement effectively enhances park accessibility for residents within an acceptable time frame, fully demonstrating the supporting role of integrated transportation modes in the efficiency of public service coverage (Figure 3c).

4.2. Evaluation of the Supply and Demand of Blue–Green Space in Park

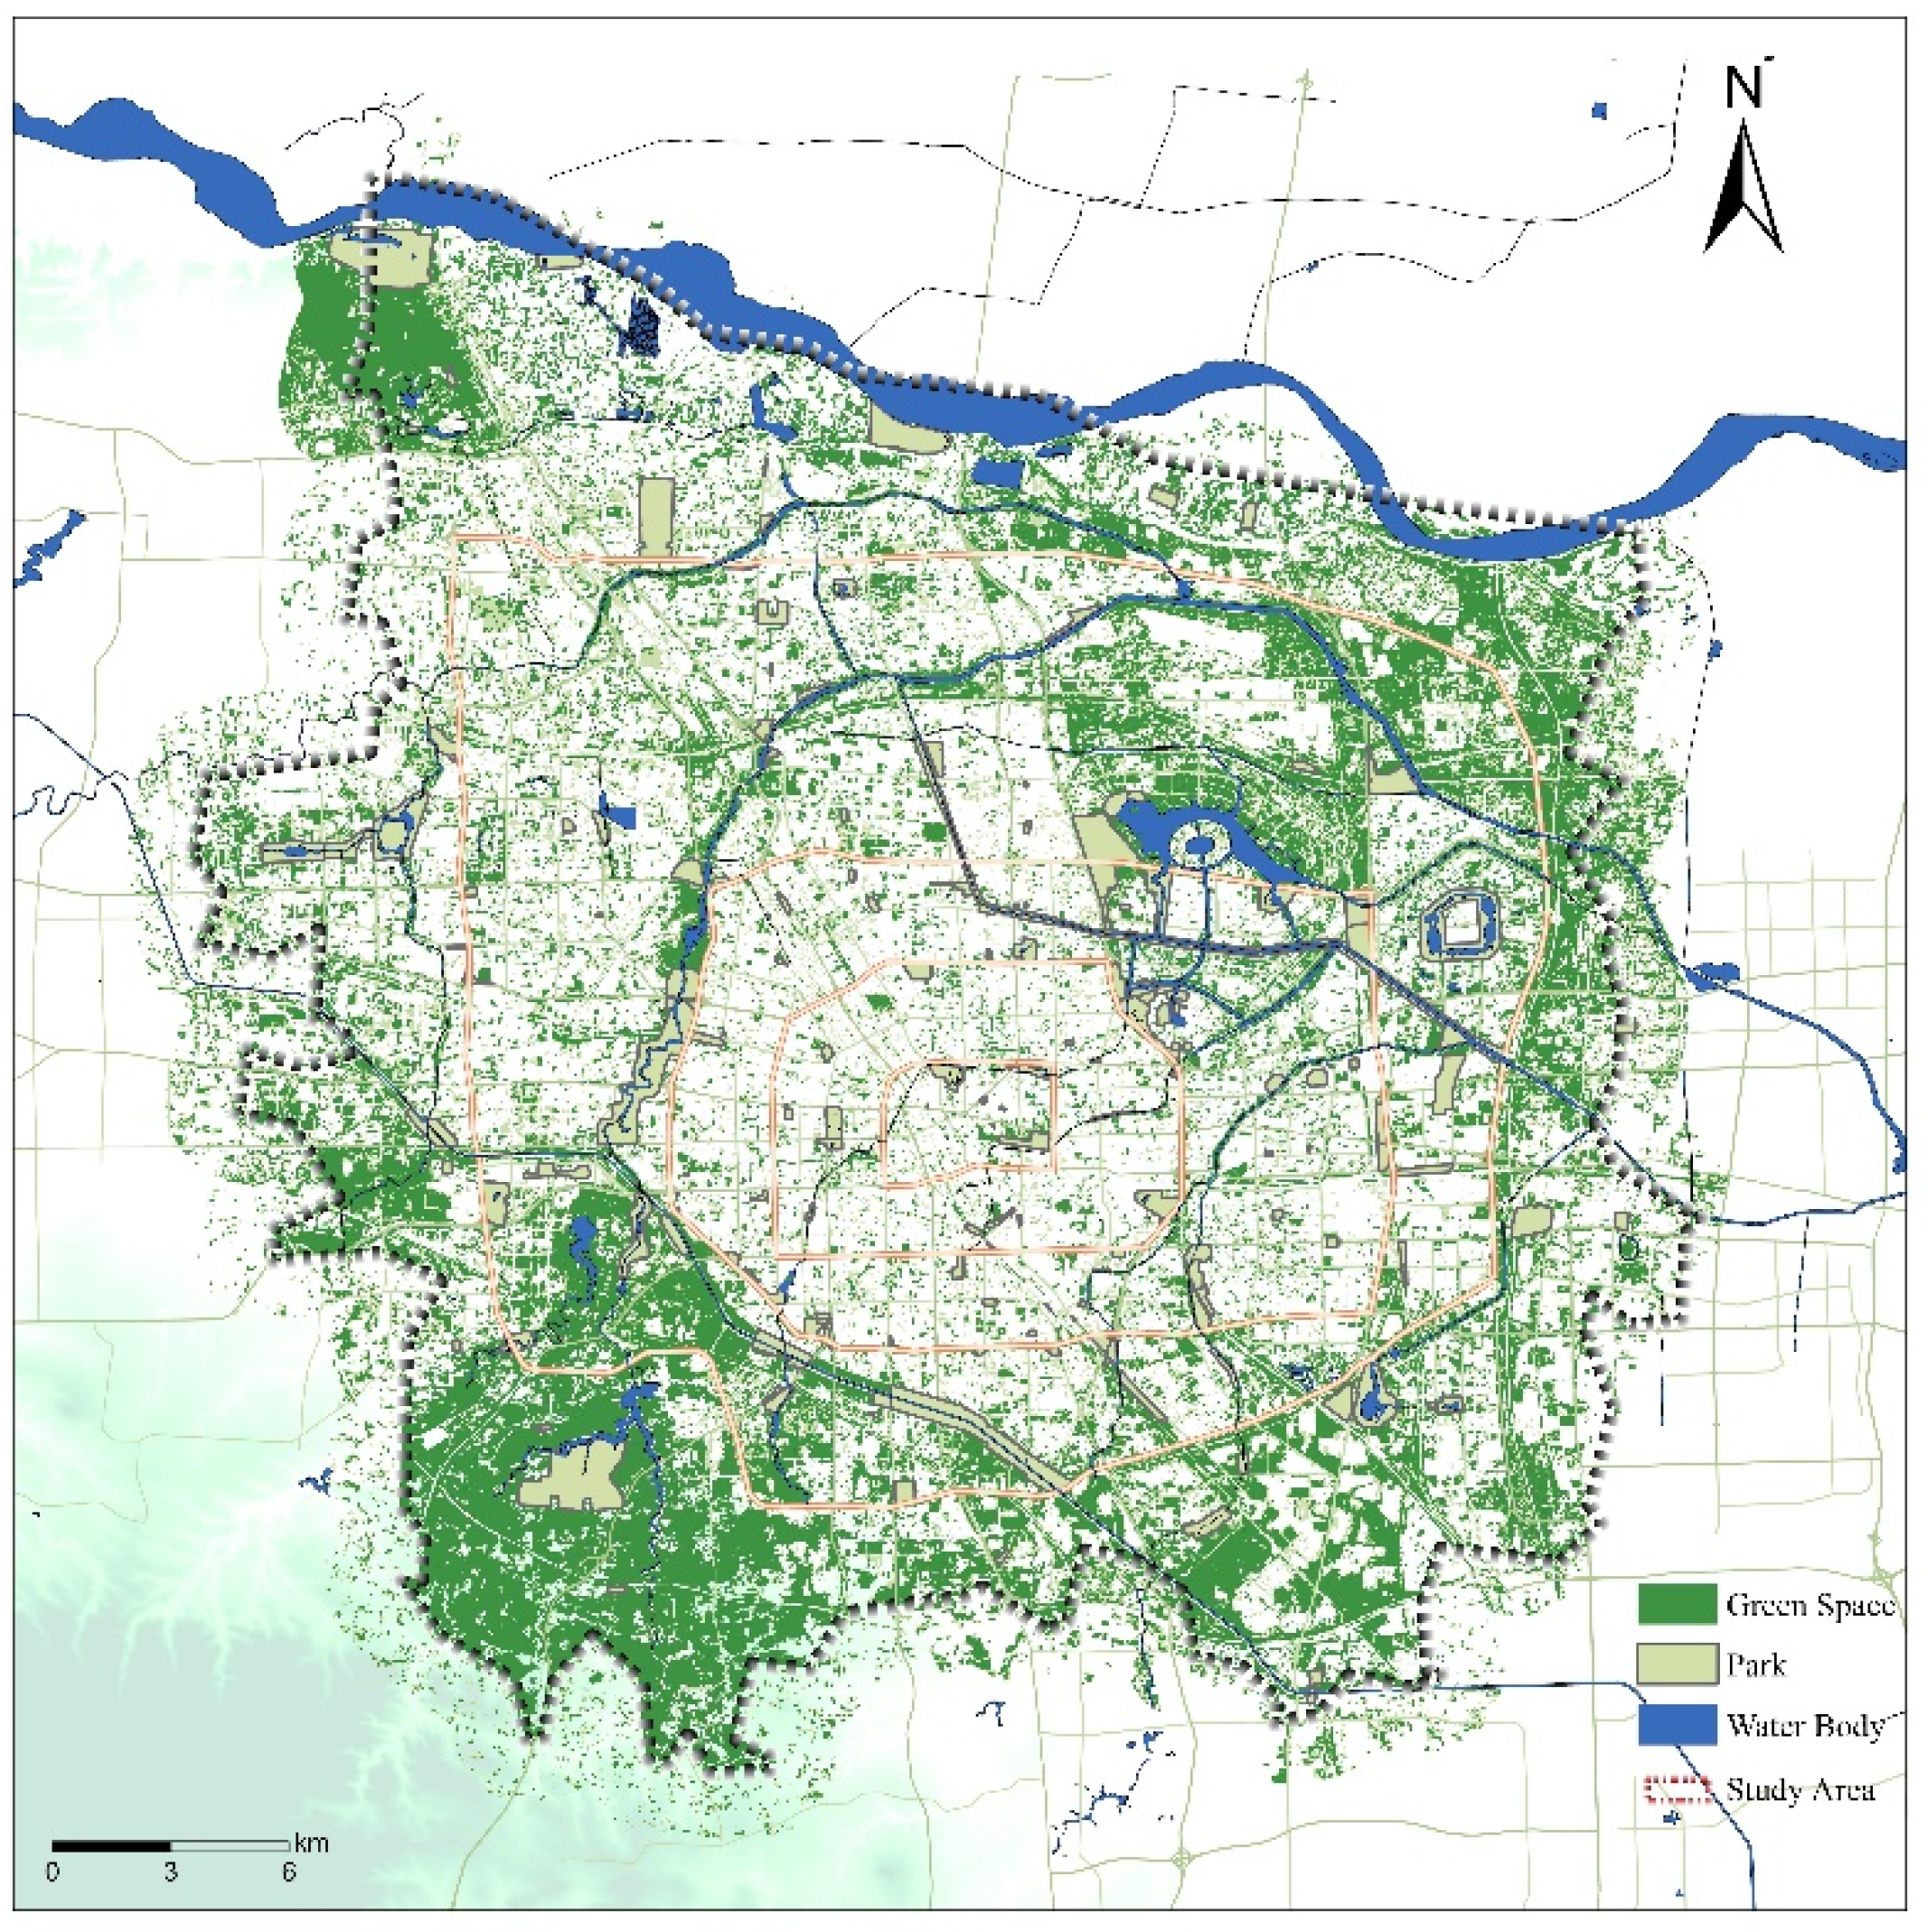
The blue–green space pattern in Zhengzhou’s main urban area serves as a crucial foundation for evaluating the supply and demand of park blue–green spaces (Figure 4). As the core component of blue–green spaces, green space resources are characterized by extensive distribution and large total scale, covering 413.57 km2. They are primarily concentrated in the western mountainous areas adjacent to Dengfeng City, Gongyi City, and Xinmi City, forming large contiguous green patches that constitute vital support for the city’s ecological foundation. Water bodies, serving as the “blue veins” of blue–green space, cover a total area of 59.75 km2. Their composition exhibits diversity and functionality. Natural waterways (e.g., the Yellow River, Jialu River), artificial lakes (e.g., Xiliu Lake, Longhu Lake), and water conservancy facilities (e.g., Jian Gang Reservoir, Changzhuang Reservoir) collectively form the core of the water space, acting as vital connectors linking the urban ecosystem. Park spaces exhibit a highly correlated spatial distribution with water bodies, showing relatively balanced coverage across the entire region. Spatial correlation analysis reveals that 56 parks are directly connected to the river network. When a 300-m buffer zone is defined, the number of parks spatially associated with the river network increases to 114. Expanding the buffer zone to 500 m raises this number to 133. This data pattern clearly validates Zhengzhou’s spatial planning logic of “building parks along waterways.” Zhengzhou’s main urban area has established a blue–green space pattern characterized by “green spaces as the foundation, water bodies as the veins, and interconnected parks,” which remains in a continuous improvement phase. This pattern not only advances the construction of an interwoven blue–green ecological network but also provides crucial ecological support for forming a citywide safety and resilience foundation. It further lays a solid spatial analysis foundation for subsequent evaluations of blue–green space supply and demand in parks.
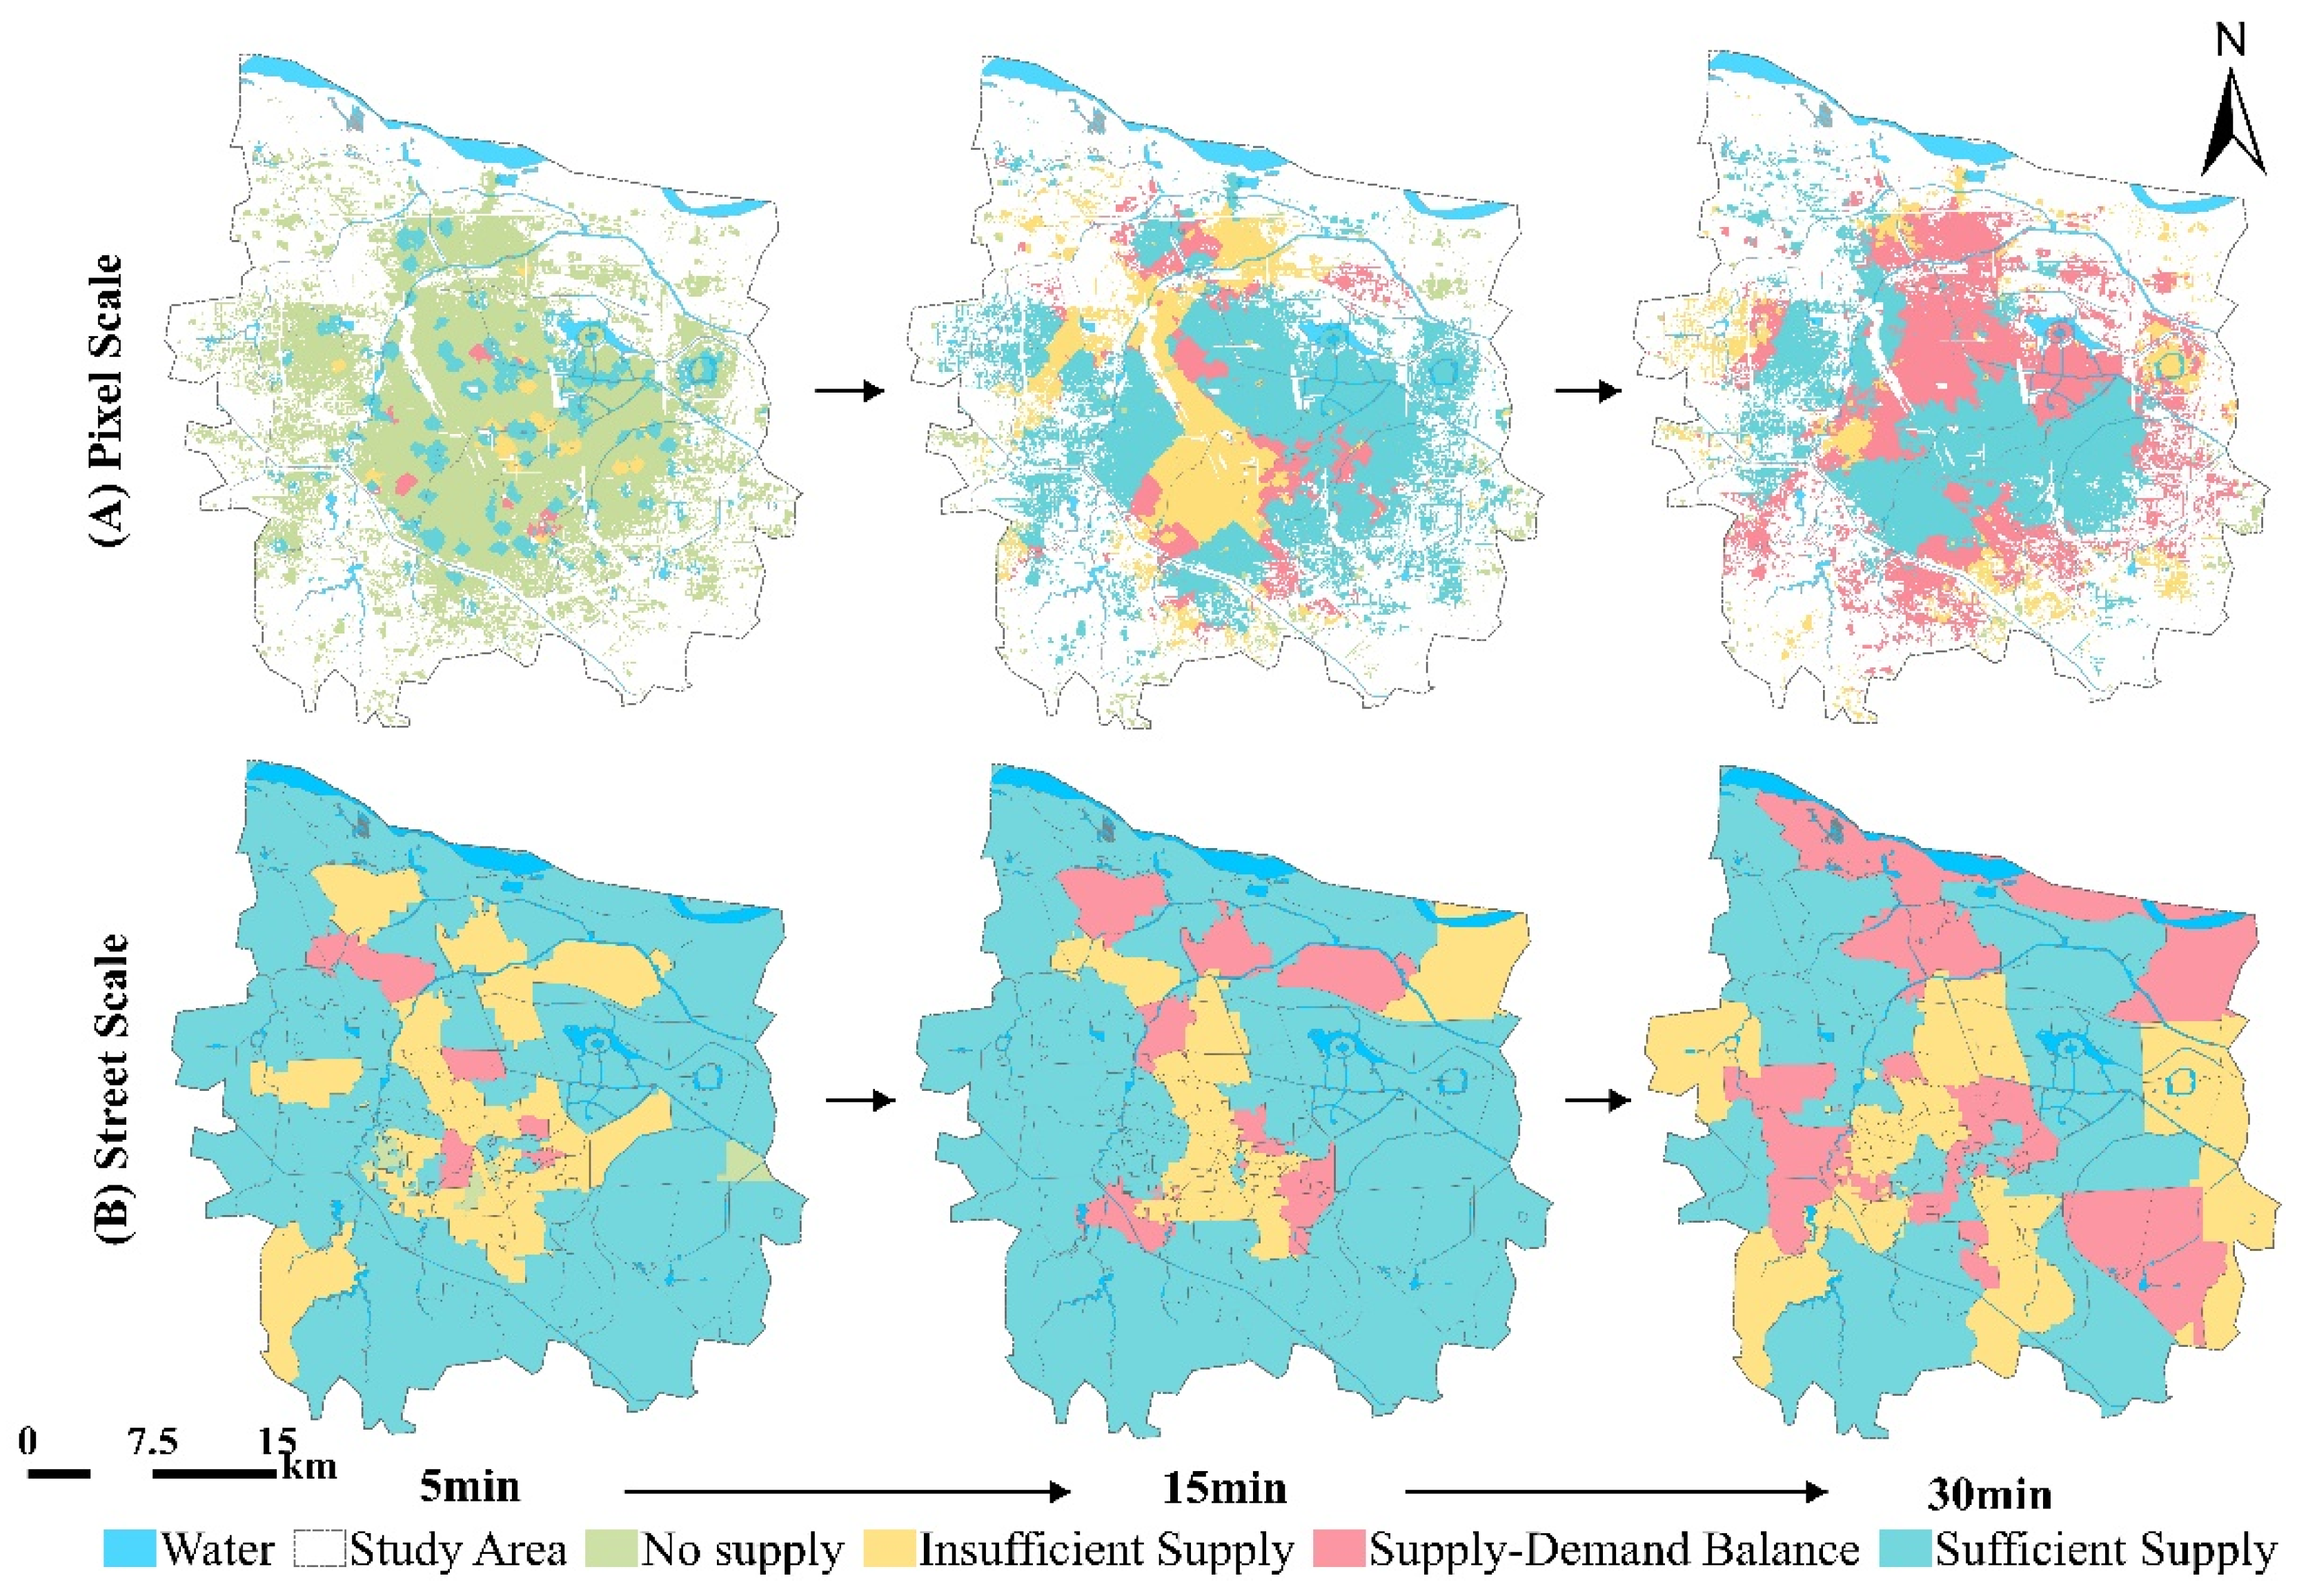
There are significant spatial differences between the supply of park services and the demand from residents (Figure 5 and Figure 6). In the 5 min service area, the area where the park supply area is insufficient to meet the needs of residents accounts for the vast majority, and the overall accessibility of the park is low. The number of pixels with supply and demand balance or better is 25,596, accounting for only 14.68% of the total number of pixels containing the population. Pixels with a high supply–demand ratio (value ≥ 1.2) are mainly concentrated in the adjacent areas around the parks. When the time threshold is extended to 15 min, the number of pixels with supply and demand balance or better increases significantly to 125,063, accounting for 71.74%. The area meeting demand expands, with high-value areas concentrated around large parks such as the National Forest Park, Dongfengqu Riverside Park, Longzi Lake Park, and South-to-North Water Diversion Park. In the 30 min service area, more than half of the population-containing pixel points can obtain park services that meet the demand, and the number of pixels with supply and demand balance or better has further increased to 150,514, accounting for 86.34%.
Further analysis of the supply and demand ratio (Figure 7) at the street scale by superimposing the administrative division boundary shows that there are service blind streets with a supply and demand ratio of 0 in the 5 min service area, including San-guanmiao Street in Zhongyuan District, Jianzhong Street and Yima Road Street in Erqi District, and Putian Township Street in Guancheng District. These streets are completely devoid of parks accessible within 5 min.

4.3. Equity of Park Space Layout

To systematically evaluate the equity of the spatial distribution of parks in Zhengzhou, this study focuses on analyzing the fairness of resource allocation at the street scale (Figure 8). The study area is characterized by high population density and intensive commercial development, resulting in generally low levels of actual green space resources within each sub-district. The analysis reveals a significant imbalance in the spatial distribution of park green space resources. Among the 80 sub-districts in the study area, 11 show a location entropy value of zero for per capita green space, indicating that residents in these areas are at a significant disadvantage in accessing park services. Furthermore, the number of streets with location entropy of less than one is 61, and the proportion of park area in most streets is lower than that of the whole park area in the study area. The remaining 19 streets have an excessive concentration of park resources, and the polarization of spatial distribution is profound.
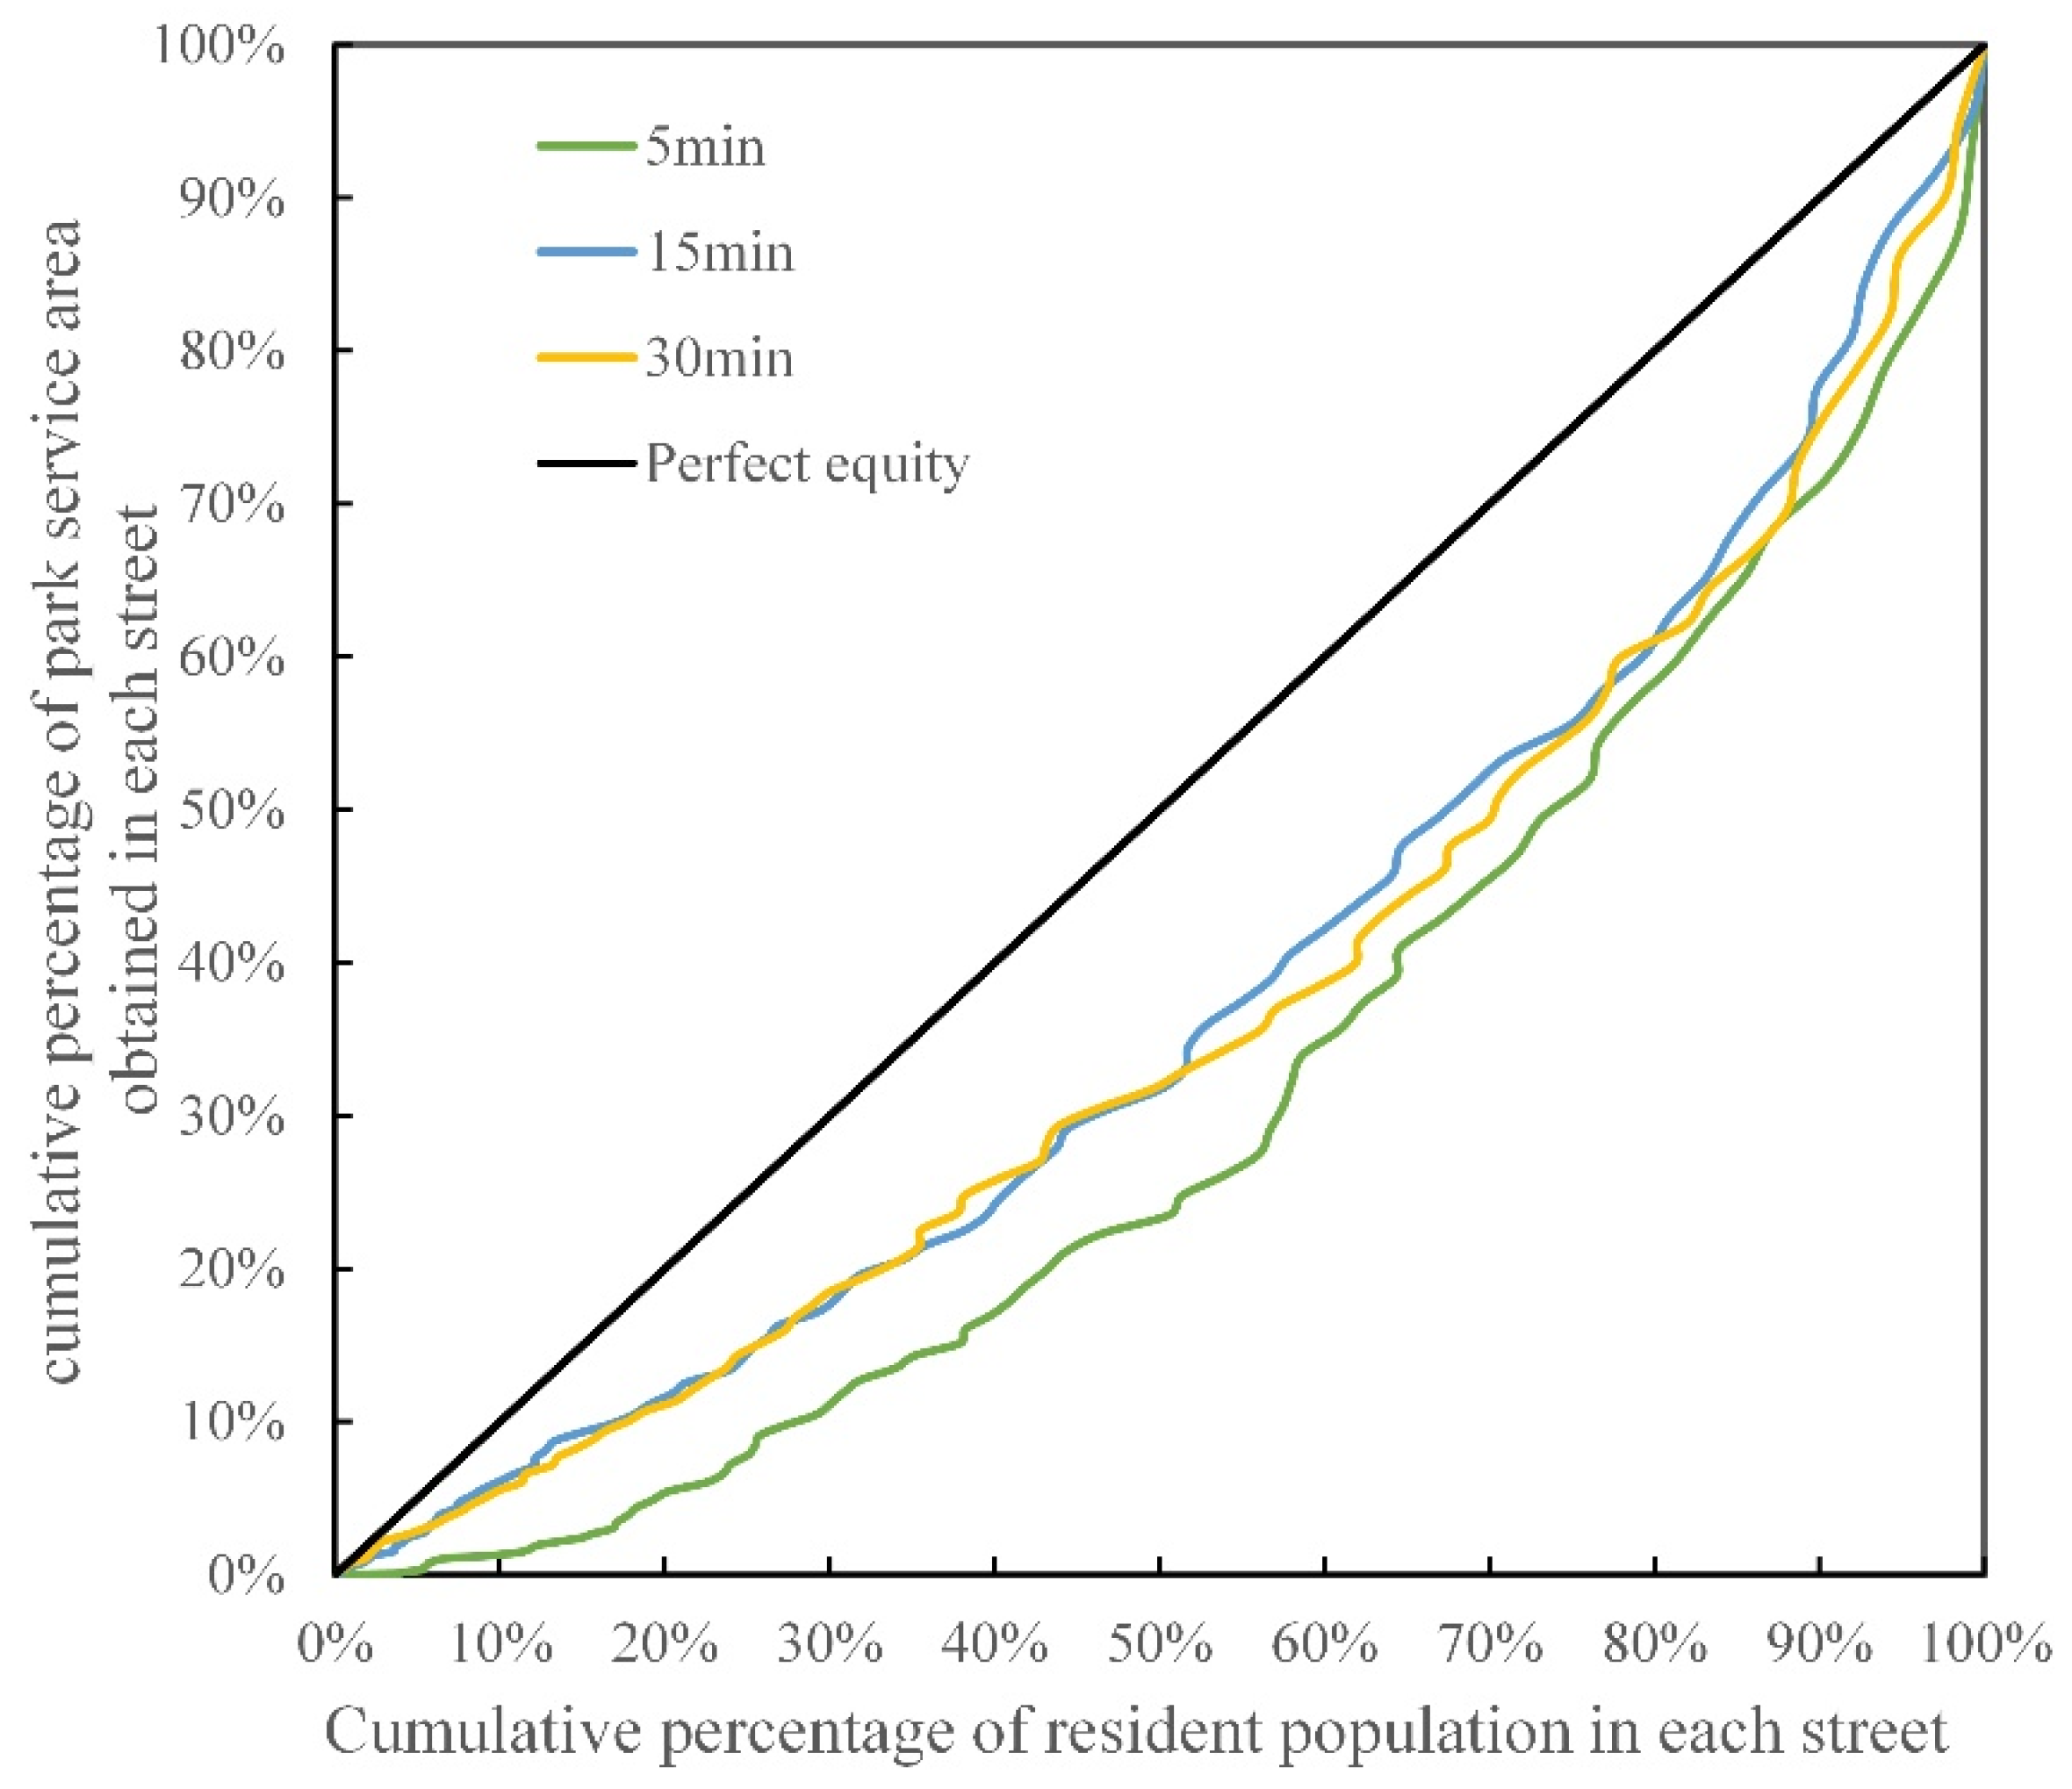
To more intuitively reveal the equality of residents’ access to park resources, this study takes the cumulative percentage of resident population in each street as the horizontal axis and the cumulative percentage of park service area obtained in each street as the vertical axis to draw the Lorenz curve (Figure 9). The analysis shows that the Lorentz curve under the 15 min time threshold is closest to the absolute equality line, indicating that the supply and demand matching of the park space is relatively balanced within this time range. The Lorentz curve for the 5 min time threshold is far away from the absolute equity line. Its distribution characteristics show that the streets accounting for 40.00% of the population only cover about 10.00% of the park space resources, and the roads accounting for 65.00% of the population enjoy about 25.00% of the park resources, indicating that a small number of people concentrate most of the green space resources.
The Gini coefficients calculated from the Lorenz curve are 0.37, 0.25, and 0.27 for the 5 min, 15 min, and 30 min thresholds, respectively (Table 6). According to the defined ranges of the Gini coefficient in Table 6, the values for all three travel times are within a fair range overall. In detail, although the Gini coefficient for the 5 min threshold is still in the relatively fair range, it is close to the critical value of the unfair range, which warrants attention.

4.4. Suggestions for Park Layout Optimization

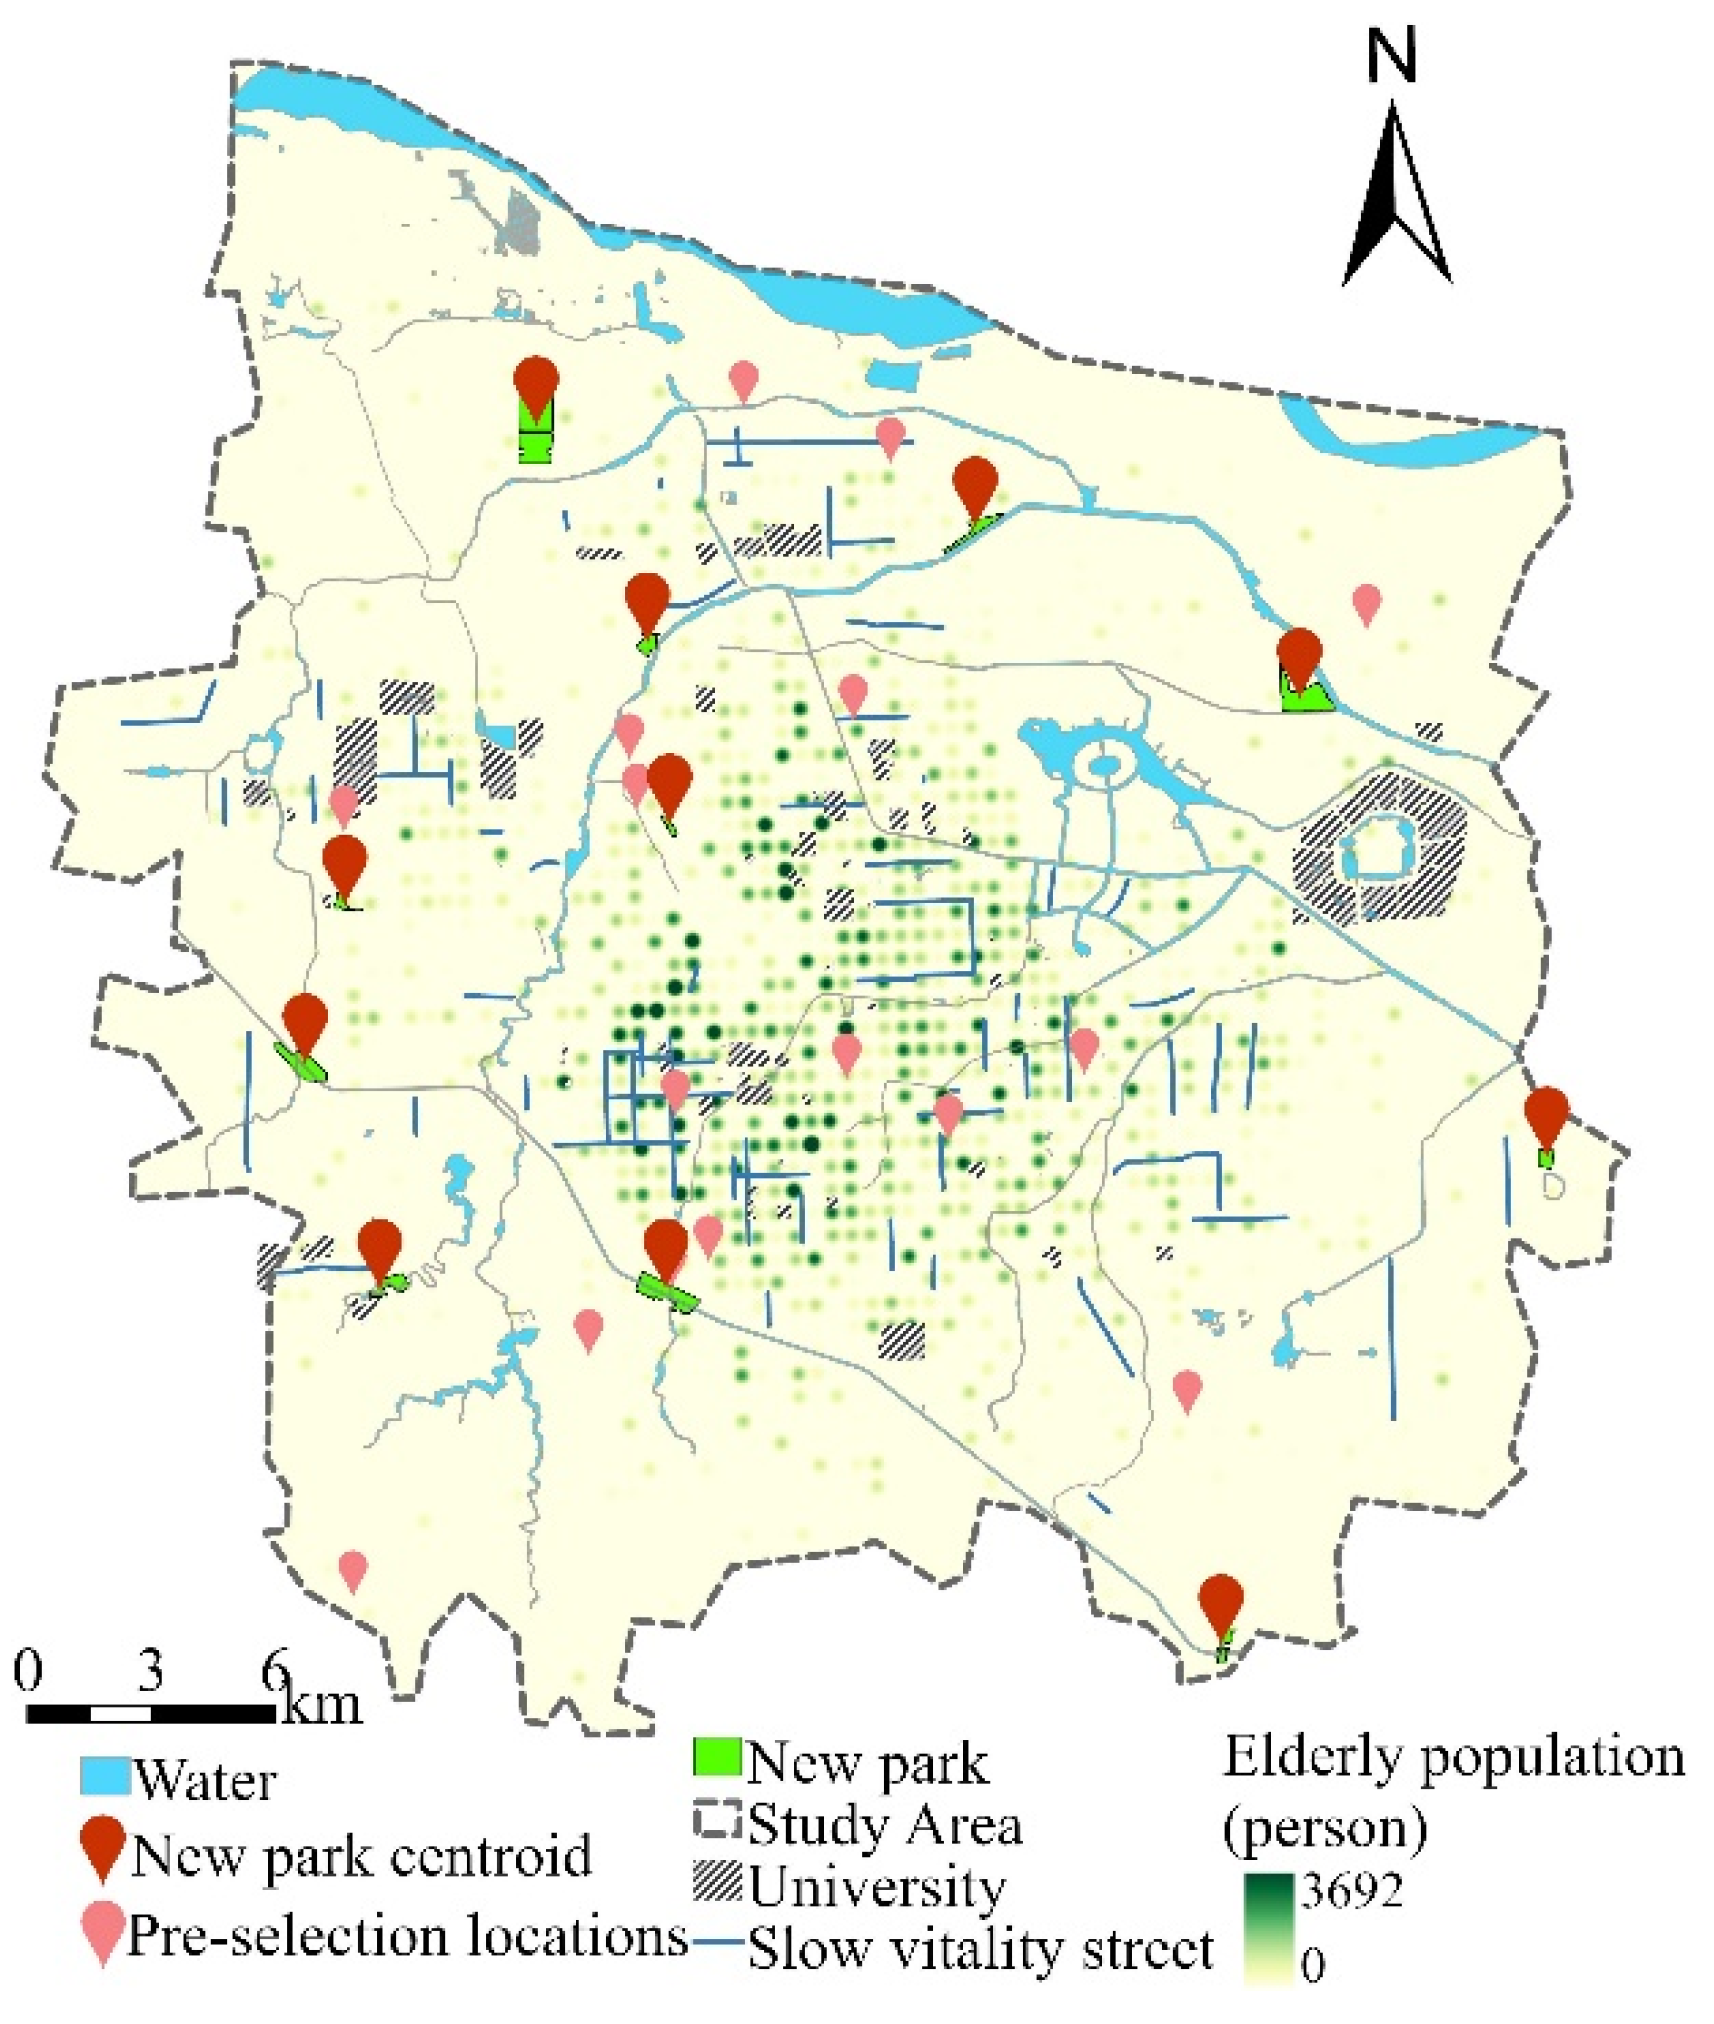
The actual supply analysis results for the park service area show that the connectivity of the 15 min service area is enhanced, which ensures that most residents in the study area can reach the park within 15 min. However, there is also an extensive population but no park, and the park supply area does not match the needs of residents. The 15 min travel time was set as the core threshold in this study and followed the minimum cost principle. First, the K-means clustering algorithm was used to cluster the pixels with no supply and insufficient supply–demand balance, calculating the optimal number of new parks in the 15 min service area to be 16. Then, the PSO algorithm was used to determine the initial park locations through multi-objective optimization.
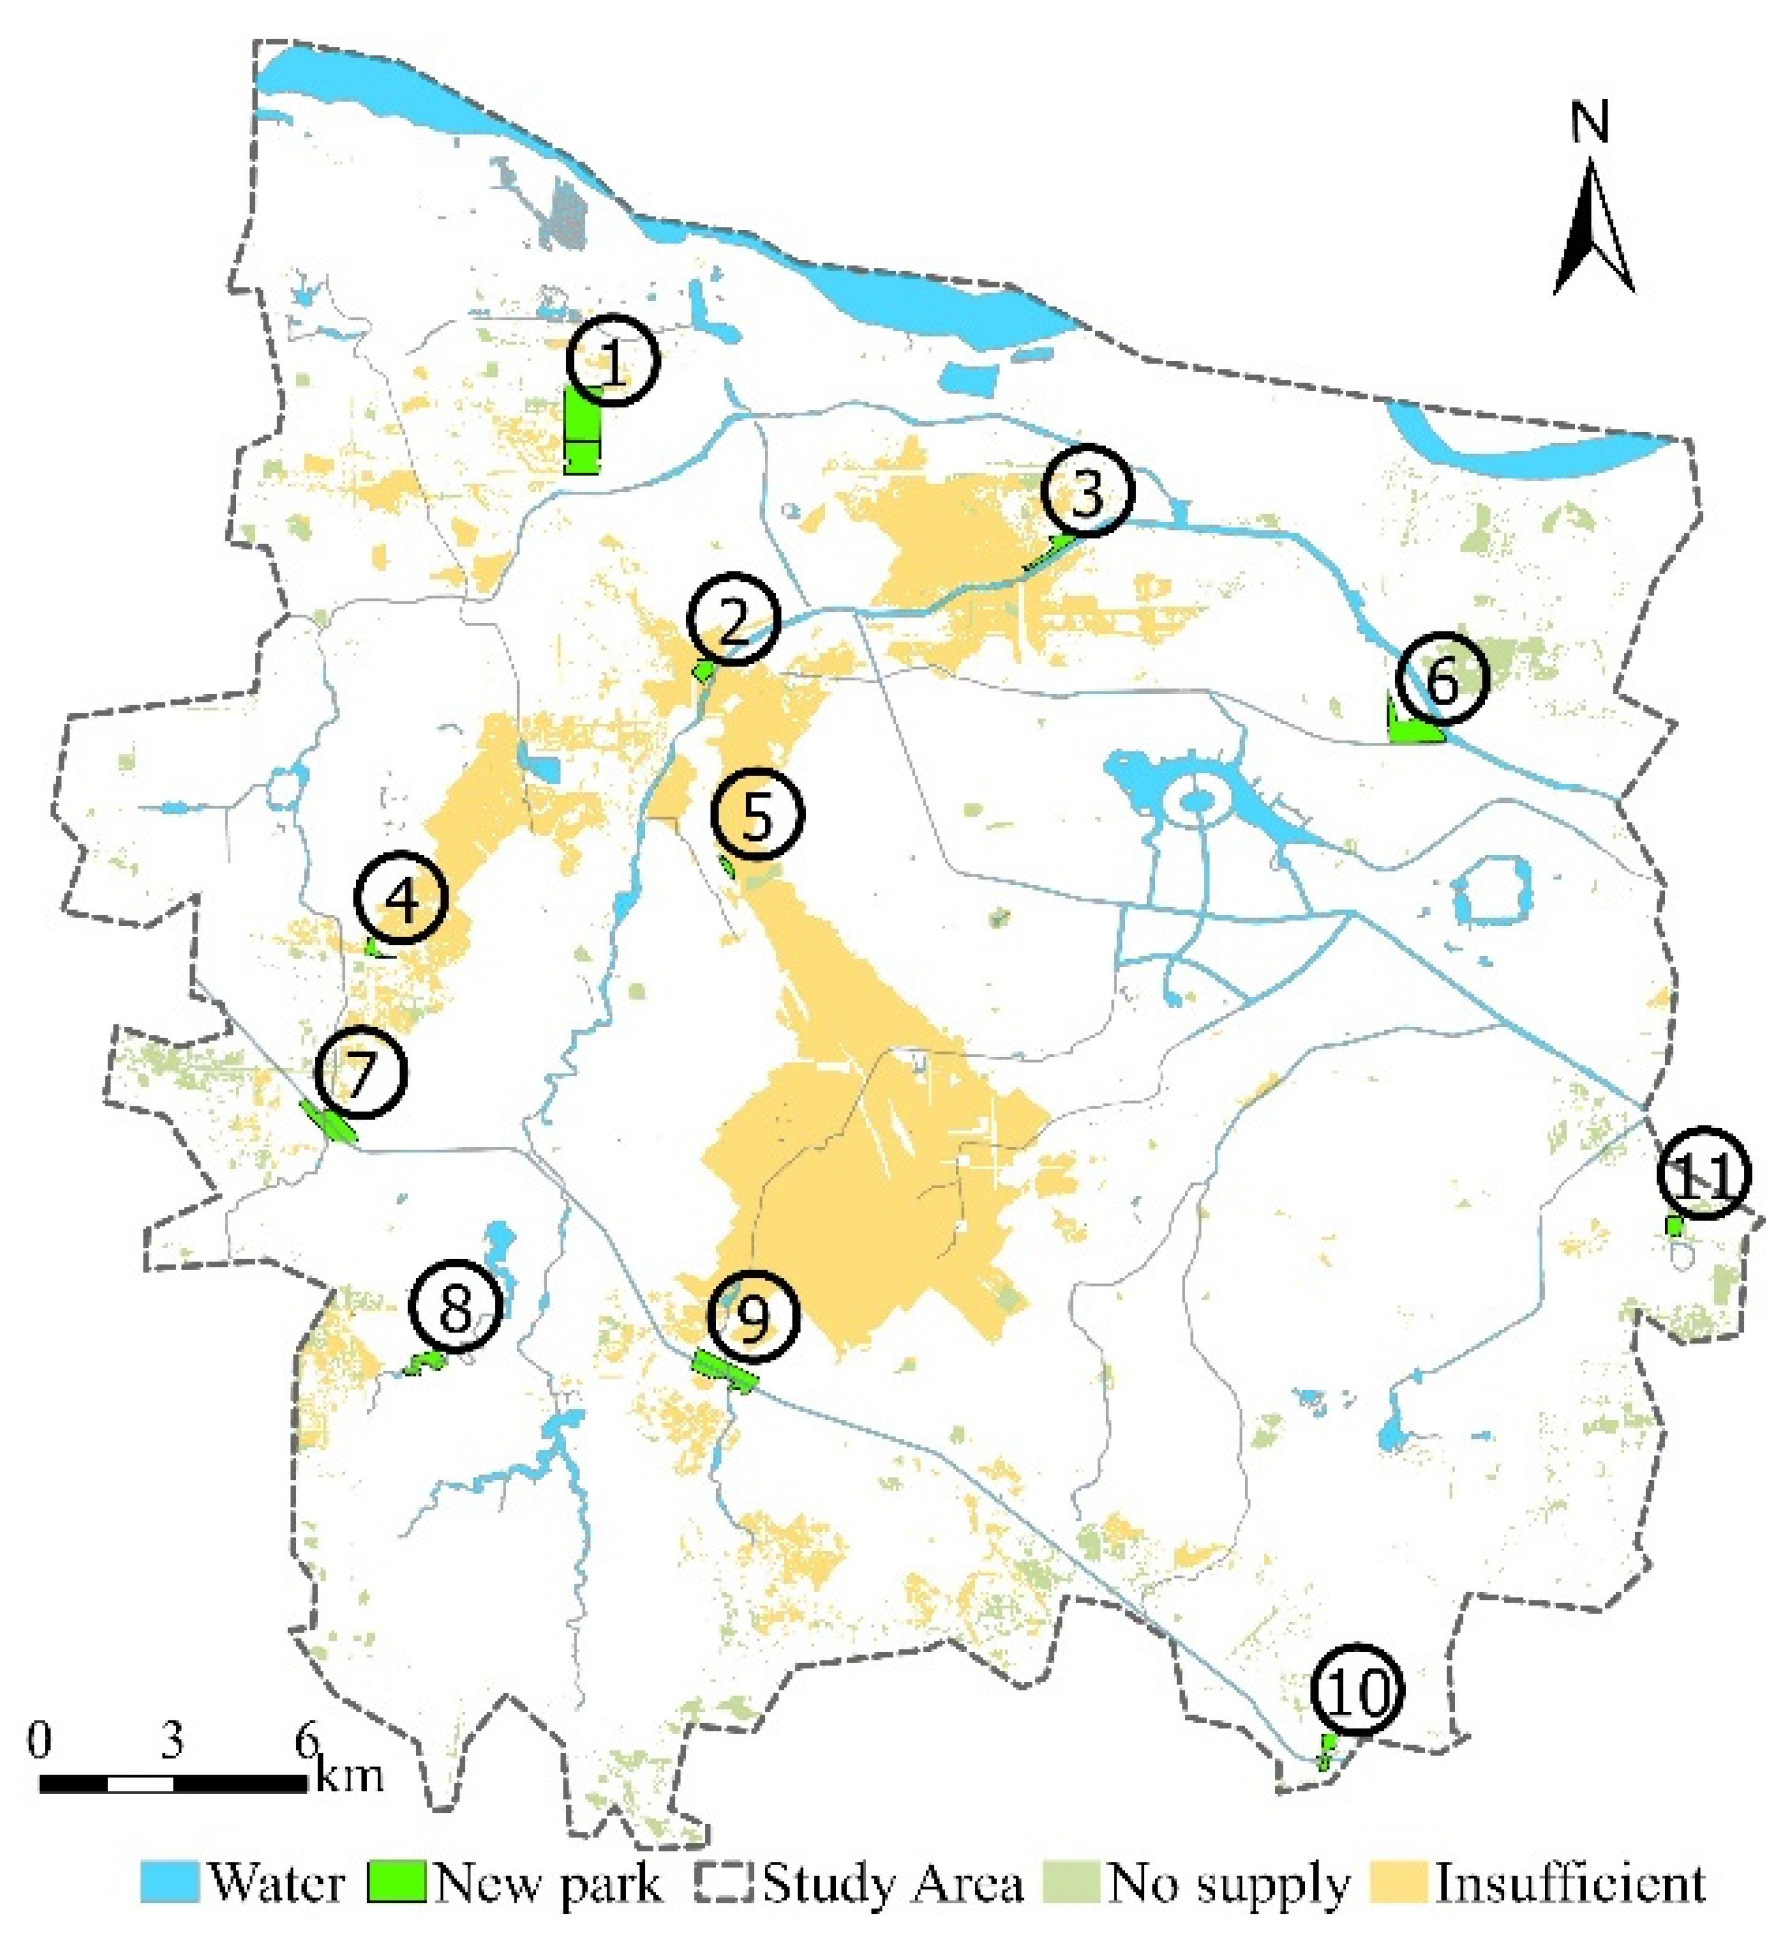
Based on the preliminary results, land-use data, education facilities, green space, the elderly population grid, building POI, land planning, and other factors were comprehensively integrated to optimize the adjustment. This was to ensure that the final site selection scheme could effectively meet the needs of residents and can be coordinated with urban land-use planning to maximize the ecological and social value of the park. According to the “Guidelines for the Implementation of Overall Urban Design in Zhengzhou City” issued by the Natural Resources and Planning Bureau of Zhengzhou City in June 2024, “the new planning community park green space, community service, leisure business and other facilities are given priority in the street layout”; thus, the location information of 80 chronic vitality streets was extracted to further guide the formulation of park layout optimization strategies and provide scientific reference for future planning and construction. Based on the above influencing factors, 11 park sites were finally selected, and satellite images and field surveys were combined to draw the boundaries of new parks (Figure 10). The specific park location is presented in the Appendix A. Finally, based on the resident need survey data (Table 7), a human-centered quality improvement strategy was implemented to promote the coordinated development of park scale supply and service optimization with the aim of building a full-age-friendly and fair urban park service system.
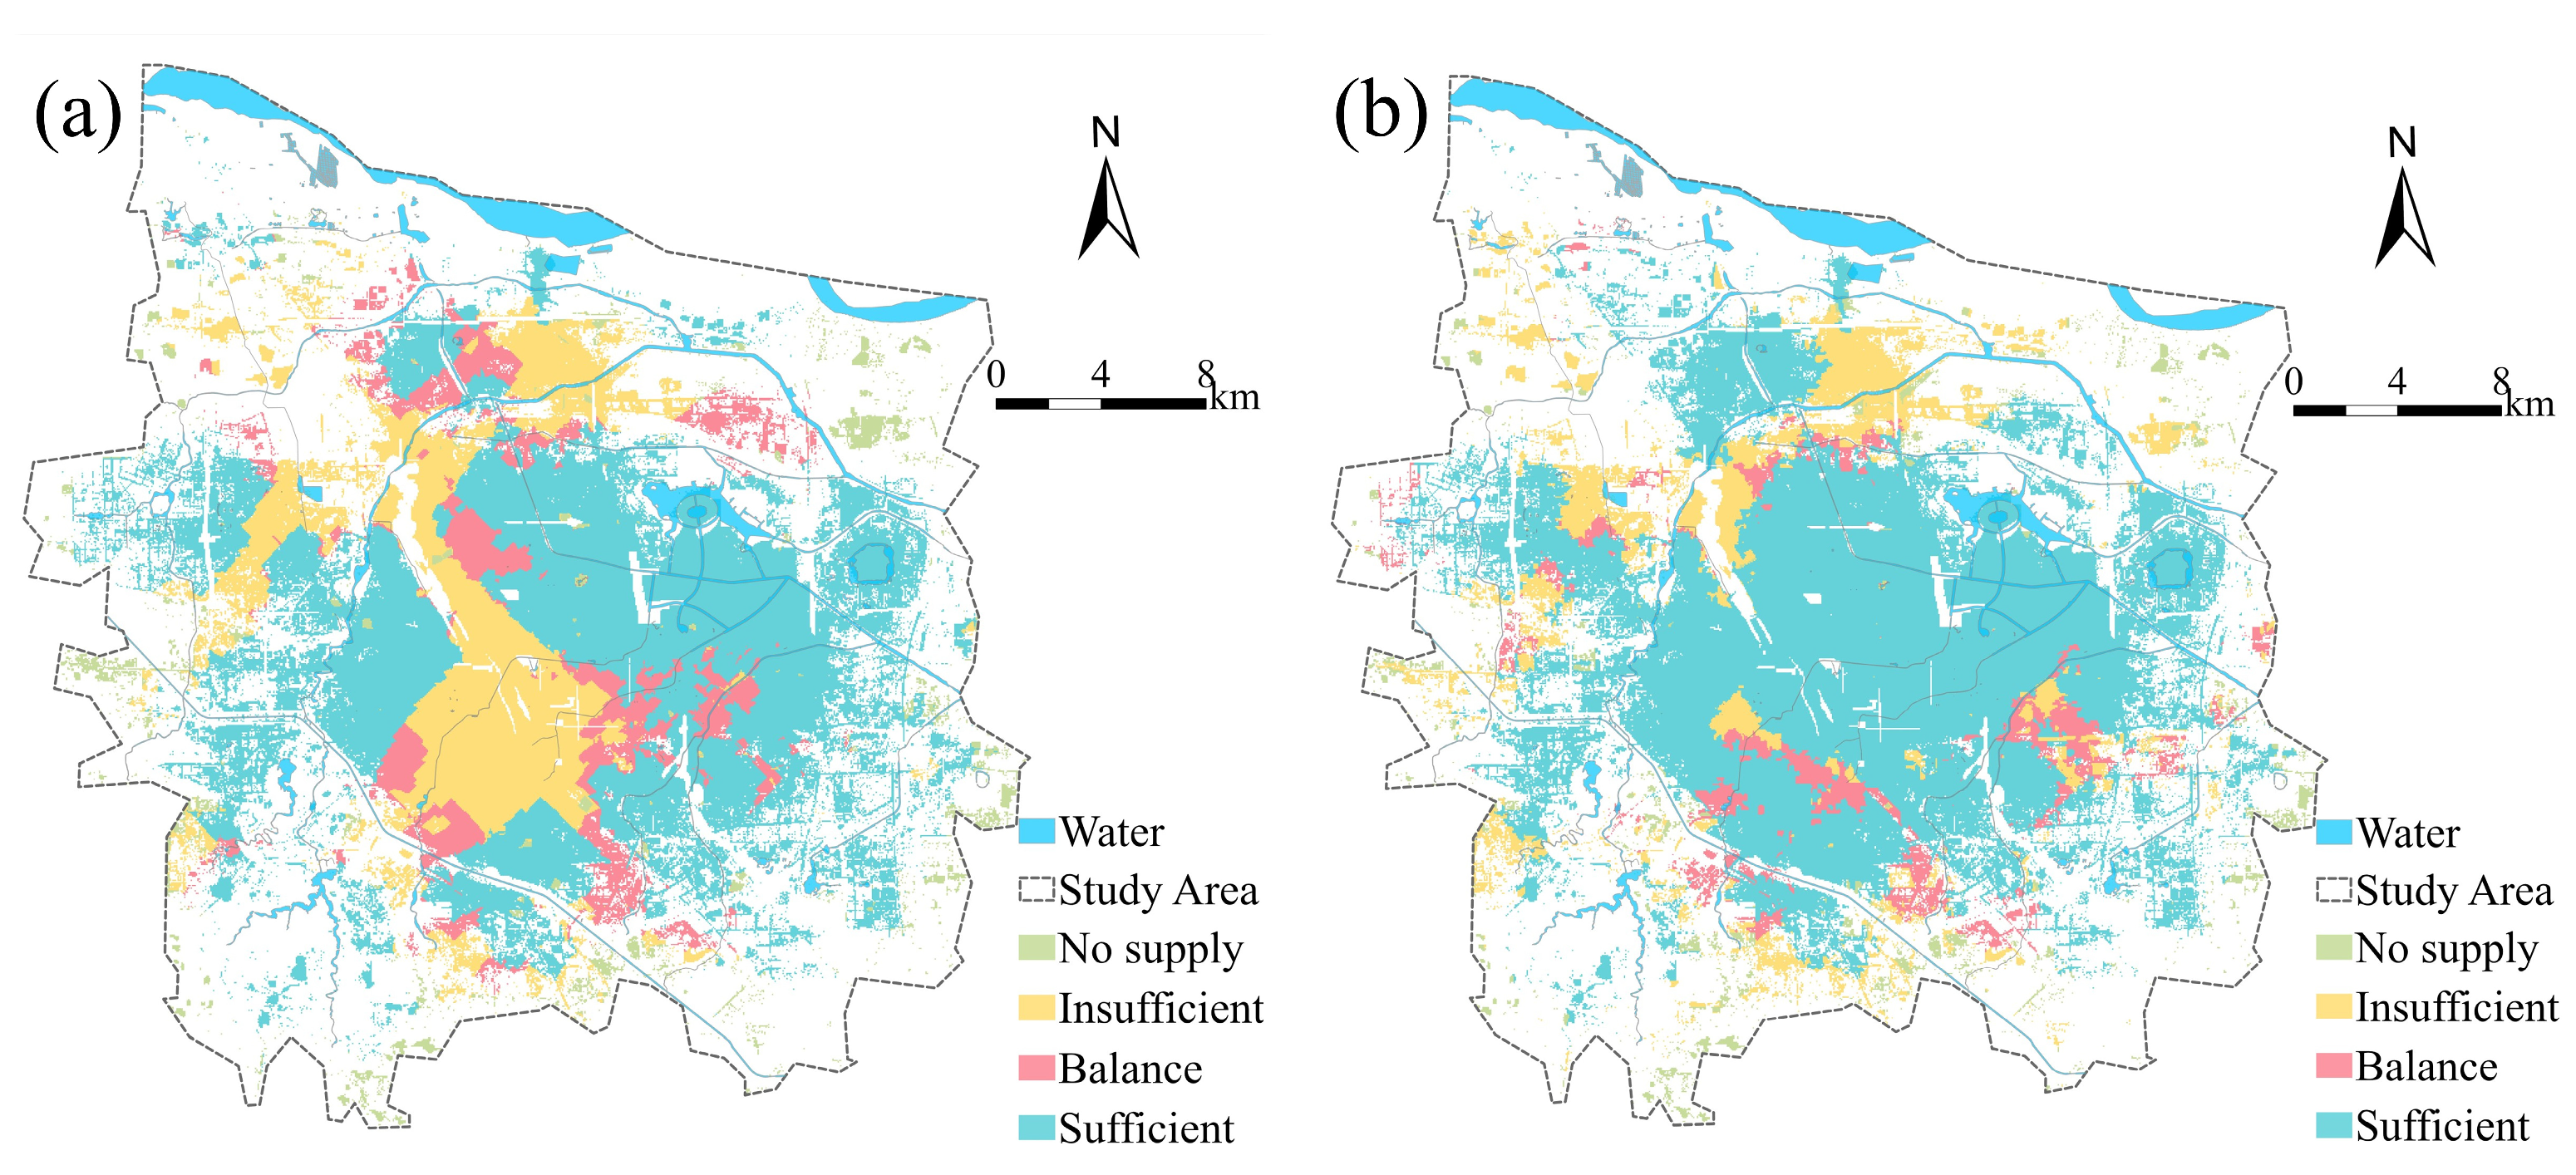
To verify the actual effect of park layout optimization, it is necessary to further analyze the supply-demand ratio of the 15-minute living service area after the addition of new parks; meanwhile, overlaying the area of the new parks with the area where park supply is insufficient enables a clearer judgment of the accuracy of the new parks’ site selection Figure 11. The visualization results in Figure 12 show that the park service blind spots in the study area are significantly reduced, and supply–demand matching is significantly improved. Specifically, the number of pixels with supply and demand balance and above supply–demand after adding the parks reached 140,113. Compared to before the new parks were added, the area with supply and demand balance or better in the populated area increased from 71.74% to 80.38%. Spatially, areas with improved supply–demand are concentrated in the middle of the study area, including the north of Erqi District, northwest of Guancheng District, southwest of Jinshui District, and southeast of Zhongyuan District. These areas with obviously insufficient supply and demand have basically eliminated the demand gap after adding new parks, which can better meet the daily use needs of local residential areas. Moreover, as shown in Table 8, areas with insufficient supply and demand balance significantly reduced after the addition of parks, while those with sufficient supply increased considerably.

5. Discussion

Compared to existing studies conducted at the street scale using the two-step floating catchment area (2SFCA) method [44], this research emphasizes the actual needs of residents, employs network analysis to more realistically reflect travel route choices, and incorporates residents’ feedback on park construction (such as sanitation, the maintenance of fitness facilities, noise control, and greening improvements) obtained through questionnaires, thereby enriching the dimensions of park service quality evaluation. During the park site selection phase, in addition to determining the optimal number and general locations via K-means clustering and PSO algorithms, key constraints such as territorial spatial planning, current land use, distribution of universities and elderly populations, and building POIs were comprehensively considered. Combined with field verification, this approach significantly enhanced the rationality and implementability of site selection, partially alleviating low supply–demand ratio issues. The temporal threshold effects revealed in this study support Talen’s [45] core argument that park equity is essentially a dynamic matching of supply and demand. Although the Gini coefficient for the 30 min service area in Zhengzhou (0.27) is at a relatively equitable level, the coefficient for the 5 min service area (0.37) approaches a warning value, exposing an imbalance in park supply and demand under different time thresholds. This finding echoes those in [46], indicating that high-density urban areas commonly face the spatial justice challenge of concurrent service shortages in core areas and resource redundancy in the periphery. Further spatial analysis shows that the supply–demand ratio of the streets with the highest commercial intensity in the 5 min service area is zero, which is in line with the research conclusion of Ghertner et al. [47] that economic development squeezes living space. This deprivation effect is particularly pronounced in areas where the elderly population is concentrated, and quantitative equity may mask differences between demographic groups [48].
By constructing an evaluation framework based on different travel modes and thresholds, this study systematically reveals the supply–demand matching characteristics and spatial equity patterns of park blue–green spaces in Zhengzhou across various spatiotemporal scales. The findings indicate a clear hierarchical differentiation in park supply–demand ratio in Zhengzhou: the 5 min service area only covers 14.68% of the population, exposing a “last-mile” service gap; the 15 min service area coverage increases to 71.74%, emerging as a critical threshold balancing service efficiency and spatial equity; while the 30 min service area, despite achieving a coverage rate of 86.34%, somewhat masks structural supply–demand contradictions within high-density built-up areas. This result aligns with findings from studies by Wang et al. [49] in Shenzhen, China, who reported widespread service blind spots in short-to-medium time thresholds, suggesting that “proximity deficiency” in park services is a common issue in high-density cities. The primary causes lie in early-stage planning that focuses on macro-scale green space layout and lacks responsiveness to micro-scale community population distribution and travel behavior, resulting in a park distribution characterized by “clustering along rivers and sparsity in centers,” that creates a service gap between old urban areas and emerging population agglomerations. For the issue of the service gap in the “last mile”, the plan needs to be further refined and updated. The first approach is to “fill in the gaps whenever there is a gap”. The system screens idle spaces such as community corner plots and abandoned public facility land and combines the needs of different groups such as children, the elderly, and office workers to create pocket parks that are functionally compatible. At the same time, this approach improves supporting facilities such as solar street lamps and classified trash cans, striving to achieve at least one pocket park within every 500 m in high-density areas, precisely filling the gap in green space services. The second is to activate idle activities to boost vitality, carry out functional renovations on existing idle green spaces, optimize the zoning layout, implant interactive facilities, and integrate local cultural elements, transforming them into vibrant nodes that residents are willing to stay and use frequently. The third approach is to open up the connection channels between the internal roads and the external park, expand the walking space, and enhance the clarity of signs and the safety of passage. At the same time, idle spaces should be transformed into micro-service stations to transform the walking paths for pedestrians to be more direct, safe, and comfortable. To ensure the effective implementation of the strategy, we have further strengthened the design of the long-term mechanism: promoting the collaborative participation of multiple entities including the government, communities, enterprises, and residents, integrating government special funds and social capital to broaden the sources of funds, leveraging the technical strength of universities to conduct dynamic monitoring and evaluation, and establishing community green space self-governance groups and smart feedback platforms to ensure the continuous optimization of the plan.
Regarding spatial equity, this study shows that Zhengzhou’s overall Gini coefficient is in a relatively reasonable range (0.25–0.37). However, compared to the results reported by Huang et al. [50] (5 min Gini = 0.95) and Qiu et al. [51] (10 min Gini = 0.77), Zhengzhou’s 5 min Gini (0.37) is lower. Street-scale analysis further reveals that the per capita green area entropy of 11 streets is zero, showing obvious micro-deprivation. This indicates that although the total amount of park green space in the overall planning meets standards, the highly uneven distribution of resources still leads to the exclusion of local residents from basic ecological services. This phenomenon is related to the planning concept of too much emphasis on construction in the process of urban expansion. Especially in areas with high land development intensity and fast update speed, park-supporting facilities have not been followed up simultaneously, resulting in a disconnection between service capacity and population agglomeration. It is worth noting that the Gini coefficient of the 30 min time threshold (0.27) is slightly higher than the 15 min threshold (0.25). This comparison reveals a key mechanism that although residents theoretically have more park options within 30 min, it is actually challenging to compete with residents in the 15 min service area. Parks in the 15 min service area are given priority because of their close proximity and high accessibility, while parks in the 30 min service area are not only used less frequently because of their distance, but also their service scope often overlaps with closer parks, which puts them at a competitive disadvantage. In view of the above problems, this study proposes a park optimization location model based on K-means clustering and the PSO algorithm and finally determines 11 new park locations. After optimization, the proportion of supply and demand balance in the 15 min living service area increased to 80.38%, which significantly alleviated the service pressure in Zhongyuan District, Erqi District, and Guancheng District. This will help to reduce the consumption of cooling energy [52], alleviate the heat island problem, increase the average cooling distance and cooling efficiency of parks [53], and enhance the multi-dimensional diversity of plants in urban parks [54]. This method inherits the advantages of the optimization model used by Wu et al. [55] in Shanghai, and integrates multi-source geographic data and behavior survey data to enhance the scientificity and feasibility of decision-making.
Our findings reveal a distinct “clustering along rivers and sparsity in centers” pattern in Zhengzhou’s park distribution, which is not merely a natural outcome of urban form but a direct result of specific historical planning priorities. Unlike cities where parks are evenly integrated into residential grids, Zhengzhou’s early planning emphasized large-scale ecological corridors and scenic belts along major waterways such as the Yellow River and Jialu River, prioritizing regional ecological services and landscape aesthetics over neighborhood-level accessibility [56]. This approach, while enhancing city-wide green connectivity and cultural ecosystem services such as aesthetic and recreational value, inadvertently created service gaps in high-density central areas where land values are high and retrofitting green space is challenging. Moreover, the predominance of large, peri-urban theme parks and specialized parks, which exhibit higher carbon sequestration density [57], further reflects a planning bias toward macro-ecological and tourism-oriented functions rather than daily recreational equity. This legacy of “green spectacle” over “green service” helps to explain the severe undersupply in the 5 min service area and the spatial mismatch observed in central neighborhoods. Thus, the inequity in park accessibility in Zhengzhou is not only a matter of quantity but also a structural outcome of a planning paradigm that has historically favored ecological branding and riverfront development over micro-scale, resident-oriented green space integration.

6. Limitations and Further Research

This study has several limitations. First, as a cross-sectional case study focused on Zhengzhou, the generalizability of its findings is constrained by the specific urban context, and its static design limits the ability to uncover the causal mechanisms and dynamic evolution behind the observed spatial disparities. Second, the supply–demand evaluation framework primarily concentrated on park area and spatial distribution, omitting “soft service elements” such as facility quality, environmental comfort, and safety, which directly influence user experience. The behavioral simulation also failed to distinguish travel patterns between weekdays and weekends, potentially threatening the validity of the accessibility conclusions. Third, the quantification of park accessibility and equity currently relies heavily on subjective preference data collected via a platform algorithm push. This method may inadequately represent populations who rarely use smartphones or have limited time, thus affecting sample representativeness. Furthermore, the model does not account for dynamic factors such as future urban renewal and population migration. Finally, practical constraints, including the challenges in acquiring high-precision urban land-use data and the associated high computational costs, were also present.
Based on the identified limitations, we propose the following future research directions to advance the field. First, to overcome the cross-sectional and static nature of the current work, future efforts will integrate high-precision multi-temporal data with spatial forecasting models (e.g., CA-Markov [58], FLUS [59]). This will enable the simulation of dynamic supply–demand gaps for park blue–green spaces under various urban development scenarios (e.g., population shifts, land expansion), facilitating the development of spatiotemporally adaptive optimization schemes and a dynamic “park–population” matching mechanism. Second, in response to the omission of “soft service elements,” the evaluation framework will be expanded. This involves incorporating multi-dimensional data—from questionnaires, field audits, and social media—on facility quality, safety, and perceived accessibility, thereby shifting park planning from a purely “indicator-oriented” approach to a more nuanced “demand-responsive” one. Particular emphasis will be placed on the systematic integration of small and pocket parks within 5–15 min living service areas, leveraging urban renewal for micro-regeneration in key areas. Finally, to address the limited generalizability of the single-city case study, future research will conduct multi-case comparative analyses across cities of different scales (e.g., small–medium cities, super cities) and development patterns (e.g., linear, cluster-based). This will involve calibrating evaluation parameters based on distinct policy orientations and ultimately contributing to establishing a cross-regional research database to support park layout optimization in diverse urban contexts.

7. Conclusions

In this study, a park supply and demand assessment framework of multimode traffic–multi-time threshold-refined population is constructed, and the supply and demand imbalance of Zhengzhou parks is systematically evaluated. The main conclusions are as follows. (1) The ratio of areas with a supply–demand balance or better is significantly differentiated: the 5 min service area only covers 14.68% of the population, exposing a “last-mile” service gap; the coverage rate of the 15 min service area is 71.74%, a key threshold to balance efficiency and equity; and for the 30 min service area, 86.34% coverage is achieved, but the structural contradictions in the local high-density area are masked. (2) Significant spatial inequity is observed at the street scale, where 11 streets exhibit a per capita green space location entropy of zero, indicating localized service deprivation amidst macro-level fairness (Gini coefficient: 0.25–0.37). (3) Eleven new parks were added based on the K-means–PSO algorithm and multi-factor combination results, which accurately identified high-demand and low-supply areas; hence, the 15 min low supply–demand ratio areas were significantly reduced, and the pixels with a supply–demand ratio greater than or equal to one increased by 8.64%. The proposed addition of 11 new parks reflects a key shift from “indicatory-oriented” to “demand-responsive” planning. The locations of these parks are not designed to meet the general per capita area target, but are based on service blind spot streets (with a supply–demand ratio of zero) and key gaps within a 15 min period, directly alleviating the supply and demand imbalance in the most underserved central areas. This presents a replicable model that can transform diagnostic analysis into precise spatial intervention measures to enhance green space equity in high-density cities.

Author Contributions

Conceptualization, S.Z., X.W., and Y.G.; methodology, S.Z., X.W., Y.G., X.Q., and Y.W.; software, S.Z., X.W., Y.G., and Y.W.; validation, X.Q., Y.W., J.Z., and W.L.; formal analysis, S.Z., X.W., and Y.G.; investigation, S.Z. and X.W.; resources, X.Q. and Y.W.; data curation, S.Z., X.W., Y.G., and Y.W.; writing—original draft preparation, S.Z. and X.W.; writing—review and editing, Y.G., X.Q., Y.W., J.Z., and W.L.; visualization, S.Z., X.W., and Y.G.; supervision, Y.G., X.Q., and Y.W.; project administration, X.Q.; funding acquisition, Y.W. All authors have read and agreed to the published version of the manuscript.

Funding

This work was supported by a grant from the State Key Laboratory of Geographic Information Science and Technology and the National Natural Science Foundation of China (grant number 42271283) and the Henan Province Soft Science Research Program (252400411153).

Institutional Review Board Statement

This study was conducted in accordance with the Declaration of Helsinki, and approved by the Equivalence Ethics Committee of Henan Polytechnic University (protocol code HPUCH-2025-012 and date of approval 25 August 2025).

Data Availability Statement

The Nighttime Light Data is available at https://www.sdgsat.ac.cn, accessed on 6 September 2025. The POI Data, Road Network Data, Boundary Data is available at https://openstreetmap.maps.arcgis.com/home/index.html, accessed on 6 September 2025. The Sentinel-2A Imagery is available at https://developers.google.cn/earth-engine, accessed on 6 September 2025. The Regional Population Data is available at https://tjj.zhengzhou.gov.cn, accessed on 6 September 2025. The World Pop Population Raster data is available at https://hub.worldpop.org/geodata/summary?id=50680, accessed on 6 September 2025. The Seventh Census Data is available at https://doi.org/10.6084/m9.figshare.24916140.v1, accessed on 6 September 2025.

Acknowledgments

We appreciate the anonymous reviewers and their valuable comments. Also, we thank the editors for their editing and comments.

Conflicts of Interest

The authors declare that the research was conducted in the absence of any commercial or financial relationships that could be construed as a potential conflict of interest.

Appendix A

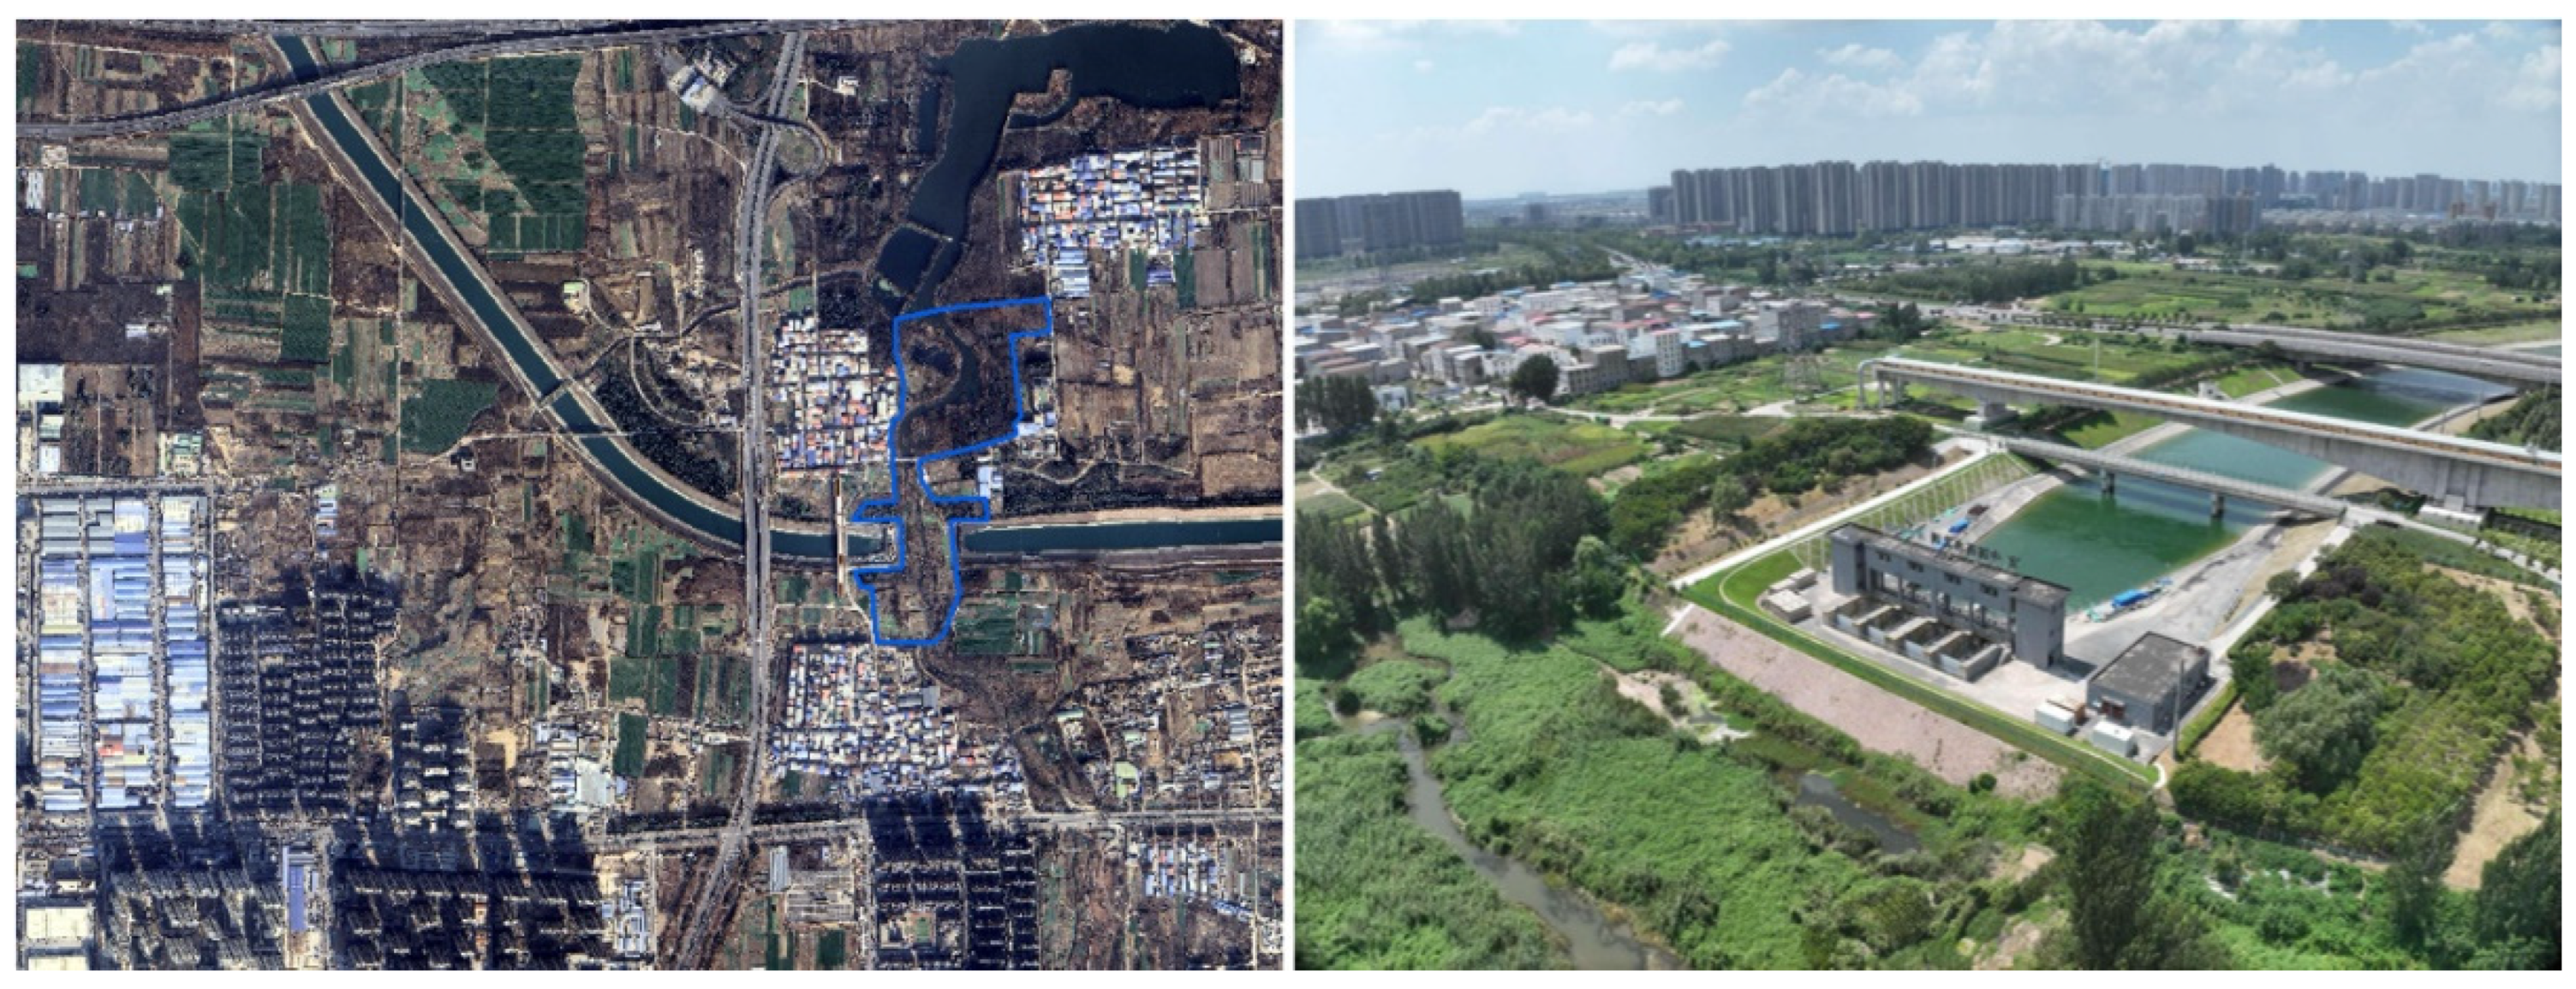
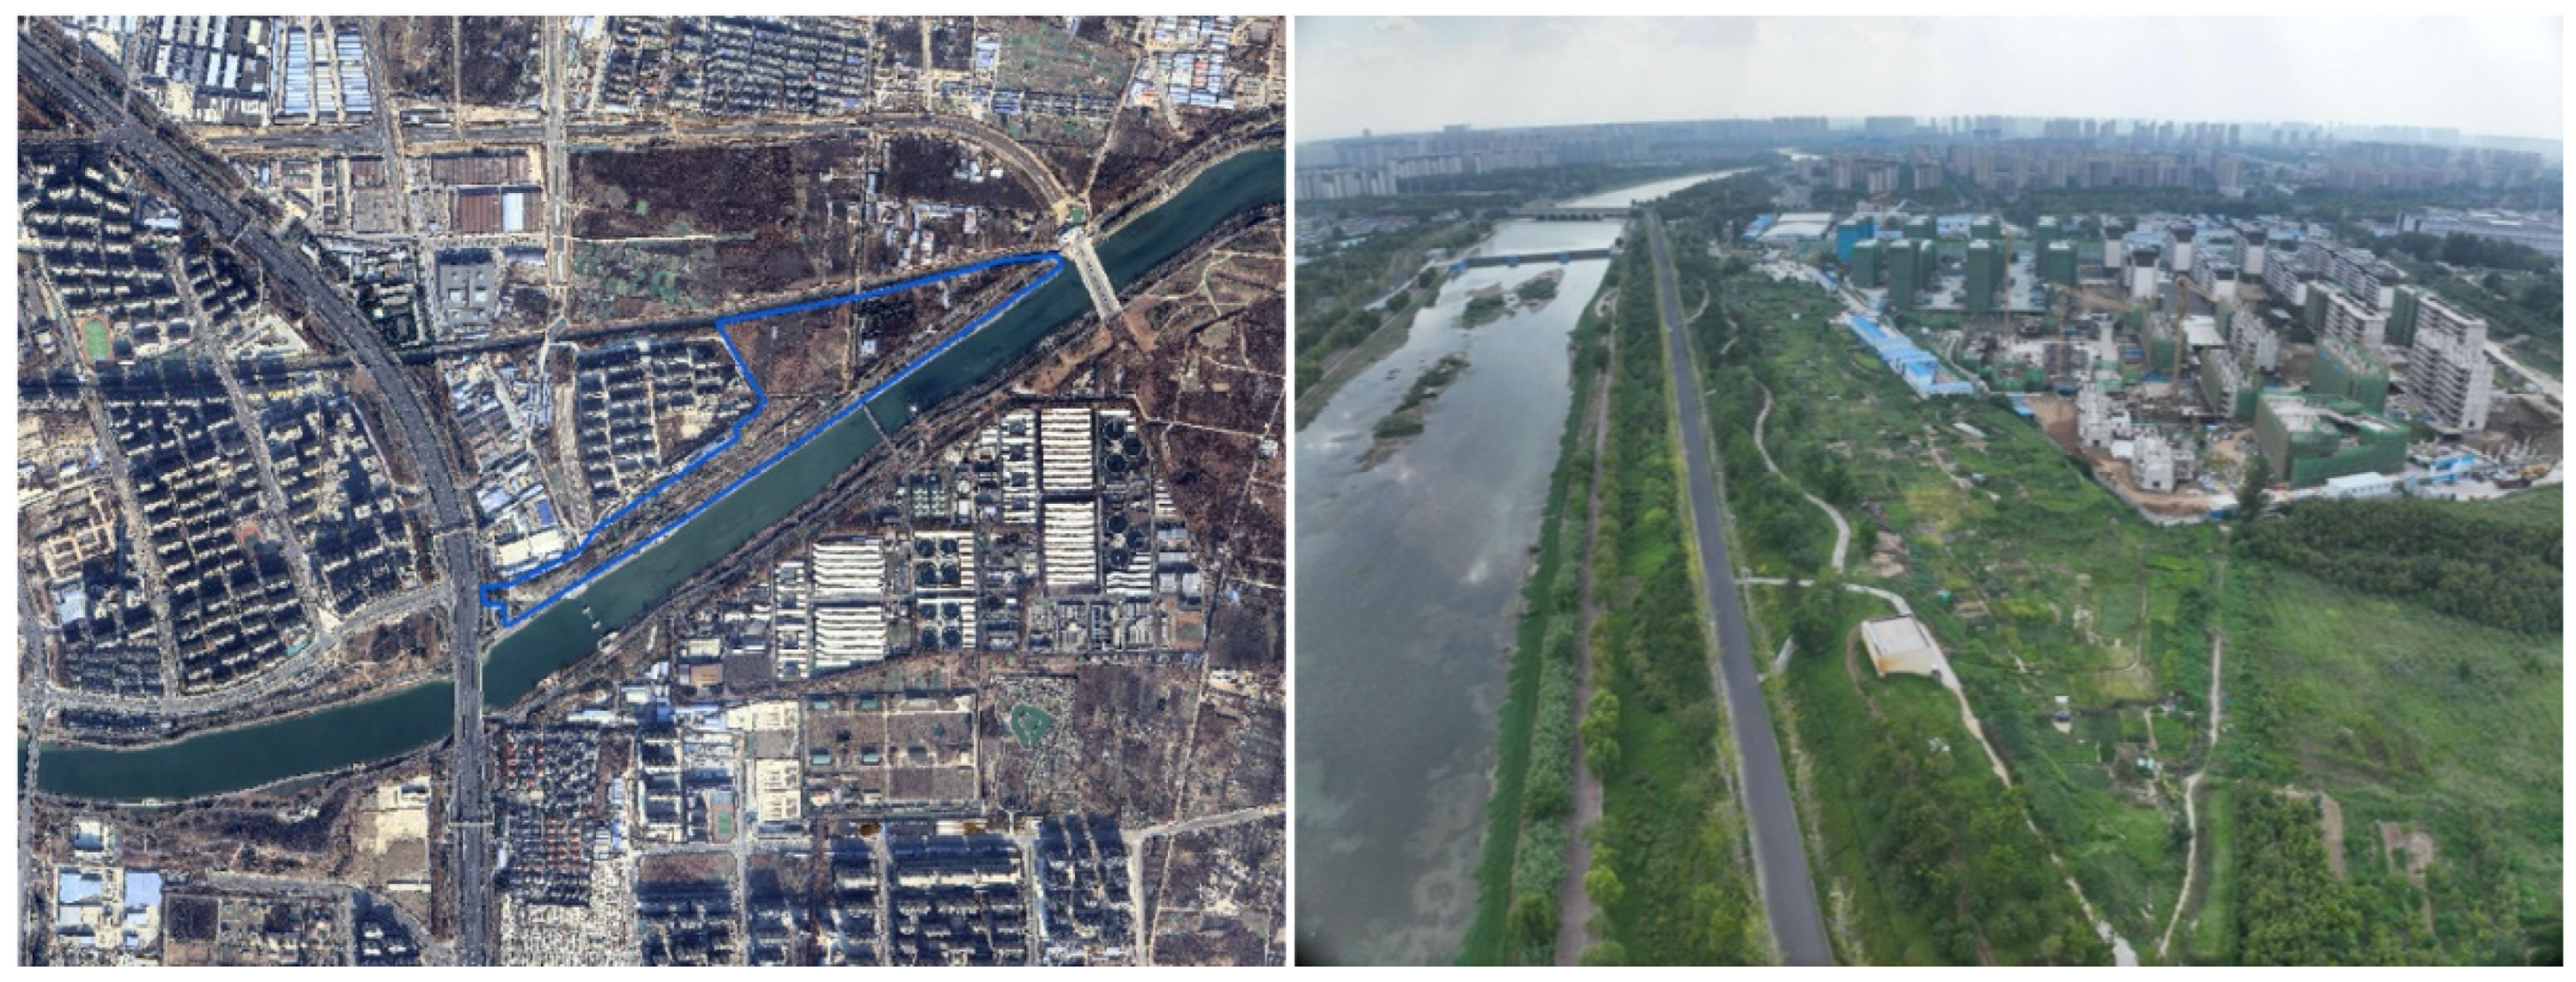
The proposed new park 1 (Xuhui River Hat Park) is located on the northeast side of the intersection of Qunan Road Expressway and Zhongyuan West Road (Figure A1), covering an area of 50.9 hectares. This area is the location of Xushui River Hat Park planned by the government. The interior of the site is mainly woodland and grassland, and the South-to-North Water Diversion and Xushui River pass through it. Near the site, there is the Xushui Resettlement Community, Jingxing Shengshi No.1 Courtyard, Yongweixi County, and Zhengzhou Olympic Sports Center, which are convenient for transportation. The shortest distance from the park to the slow vitality road Xintian Avenue is only 800 m. At present, there are many plots in the area under development, and the population potential is large. After the park is completed, it can support the construction of the blue chain ecological leisure zone in Zhengzhou and form a continuous ring city park system.
Figure A1. Surroundings of the proposed new Xushui River Hat Park.
Land 14 02055 g0a1
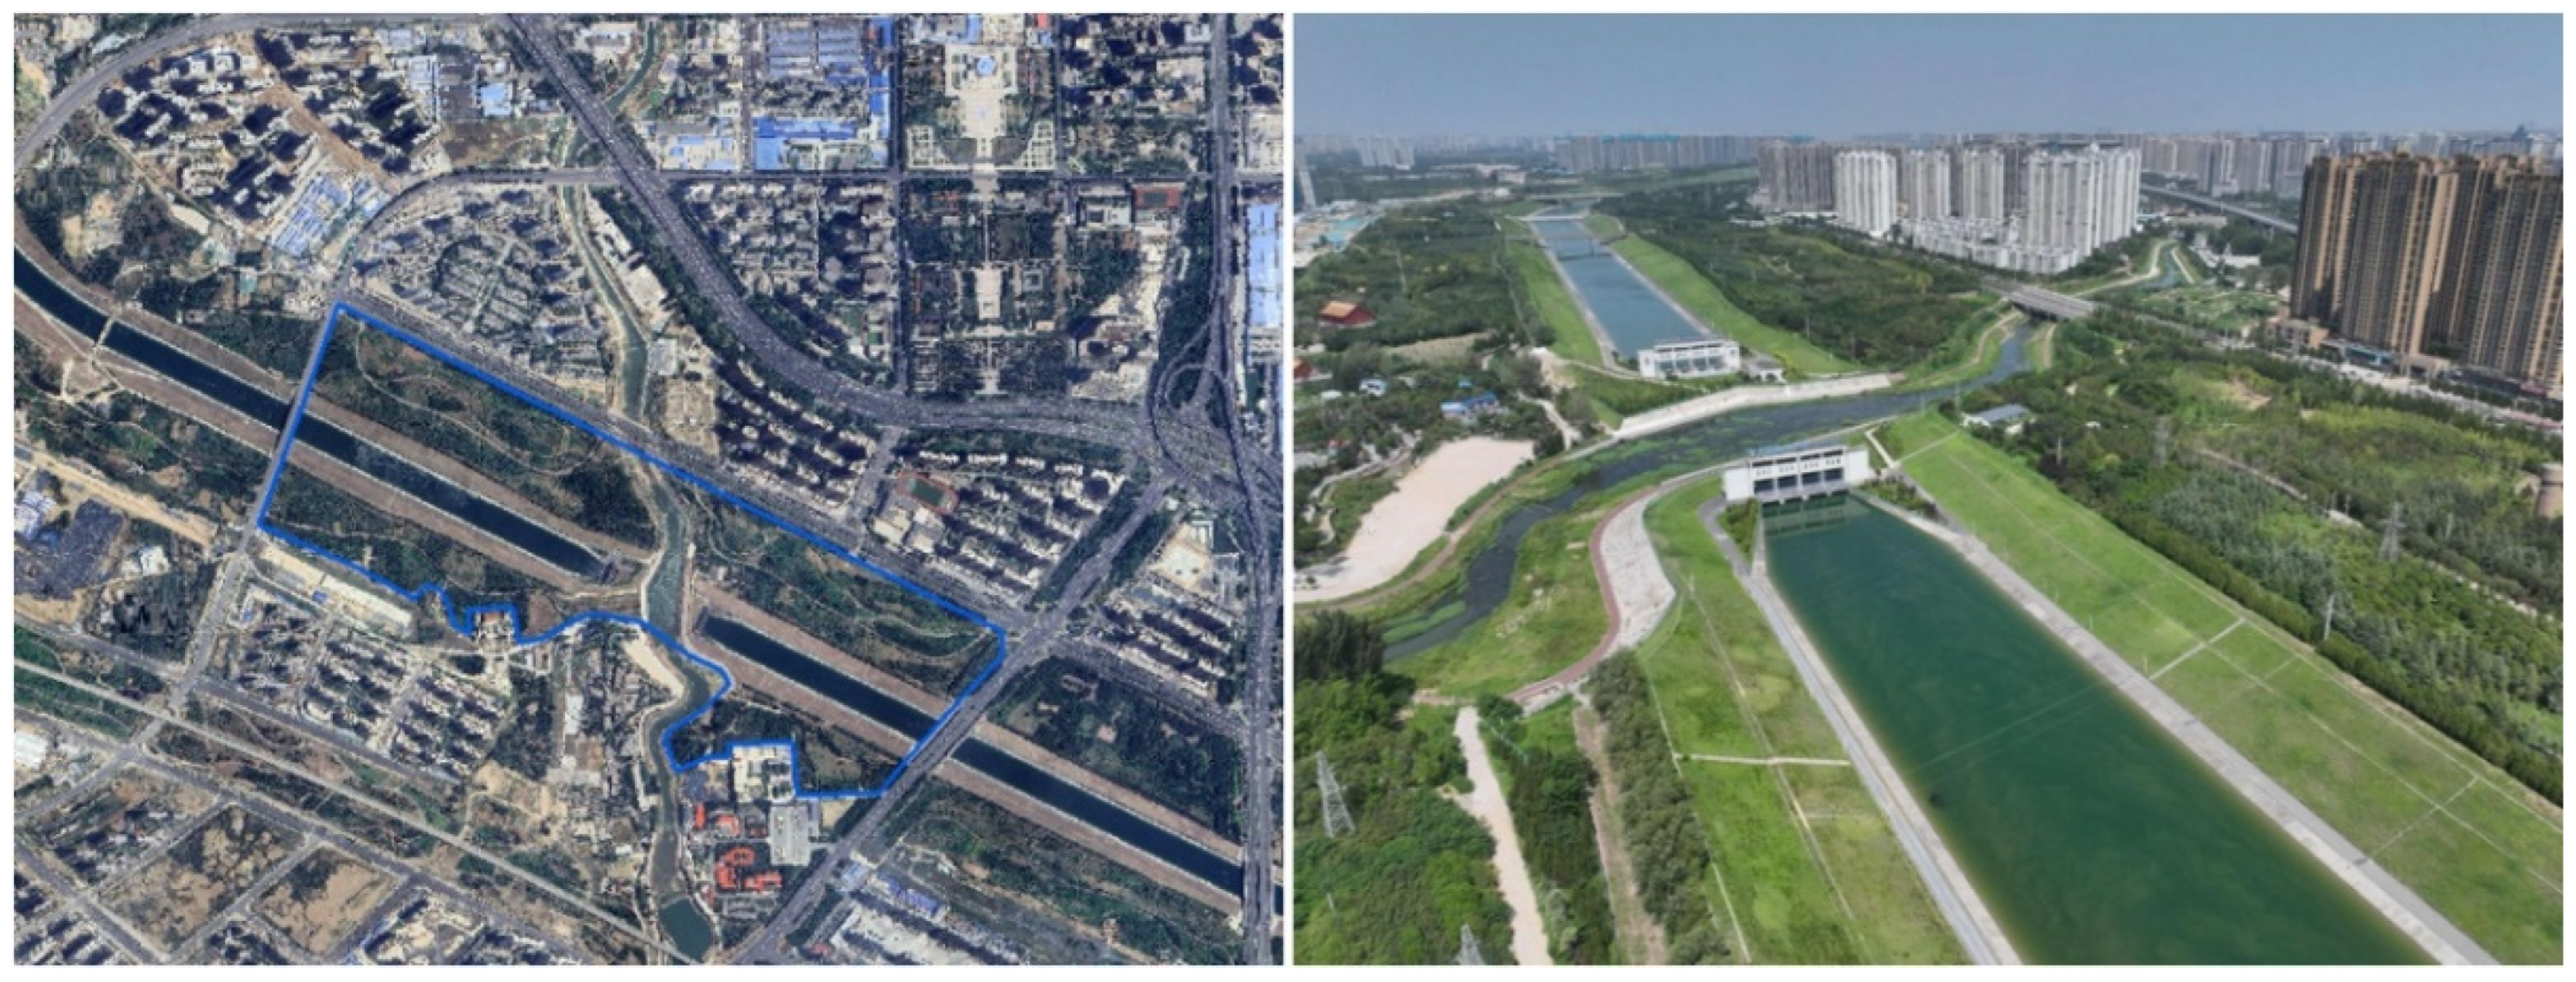
The proposed new park 2 (Jinghui River Hat Park) is located on the northwest side of the intersection of Zhengmi Road and Huancui Road (Figure A2), covering an area of 64.2 hectares. This area is the location of Jinshui River Hat Park planned by the government. The South-to-North Water Diversion Project and the Jinshui River converge here, and the water resources are relatively abundant, which is suitable for creating a waterfront play space. The interior of the site is mainly woodland and grassland, surrounded by high-rise buildings and a large population density. After the completion of the park, it can support the construction of the Zhengzhou ring blue chain ecological leisure area and form a continuous ring park system.
Figure A2. Surroundings of the proposed new Jinshui River Hat Park.
Land 14 02055 g0a2
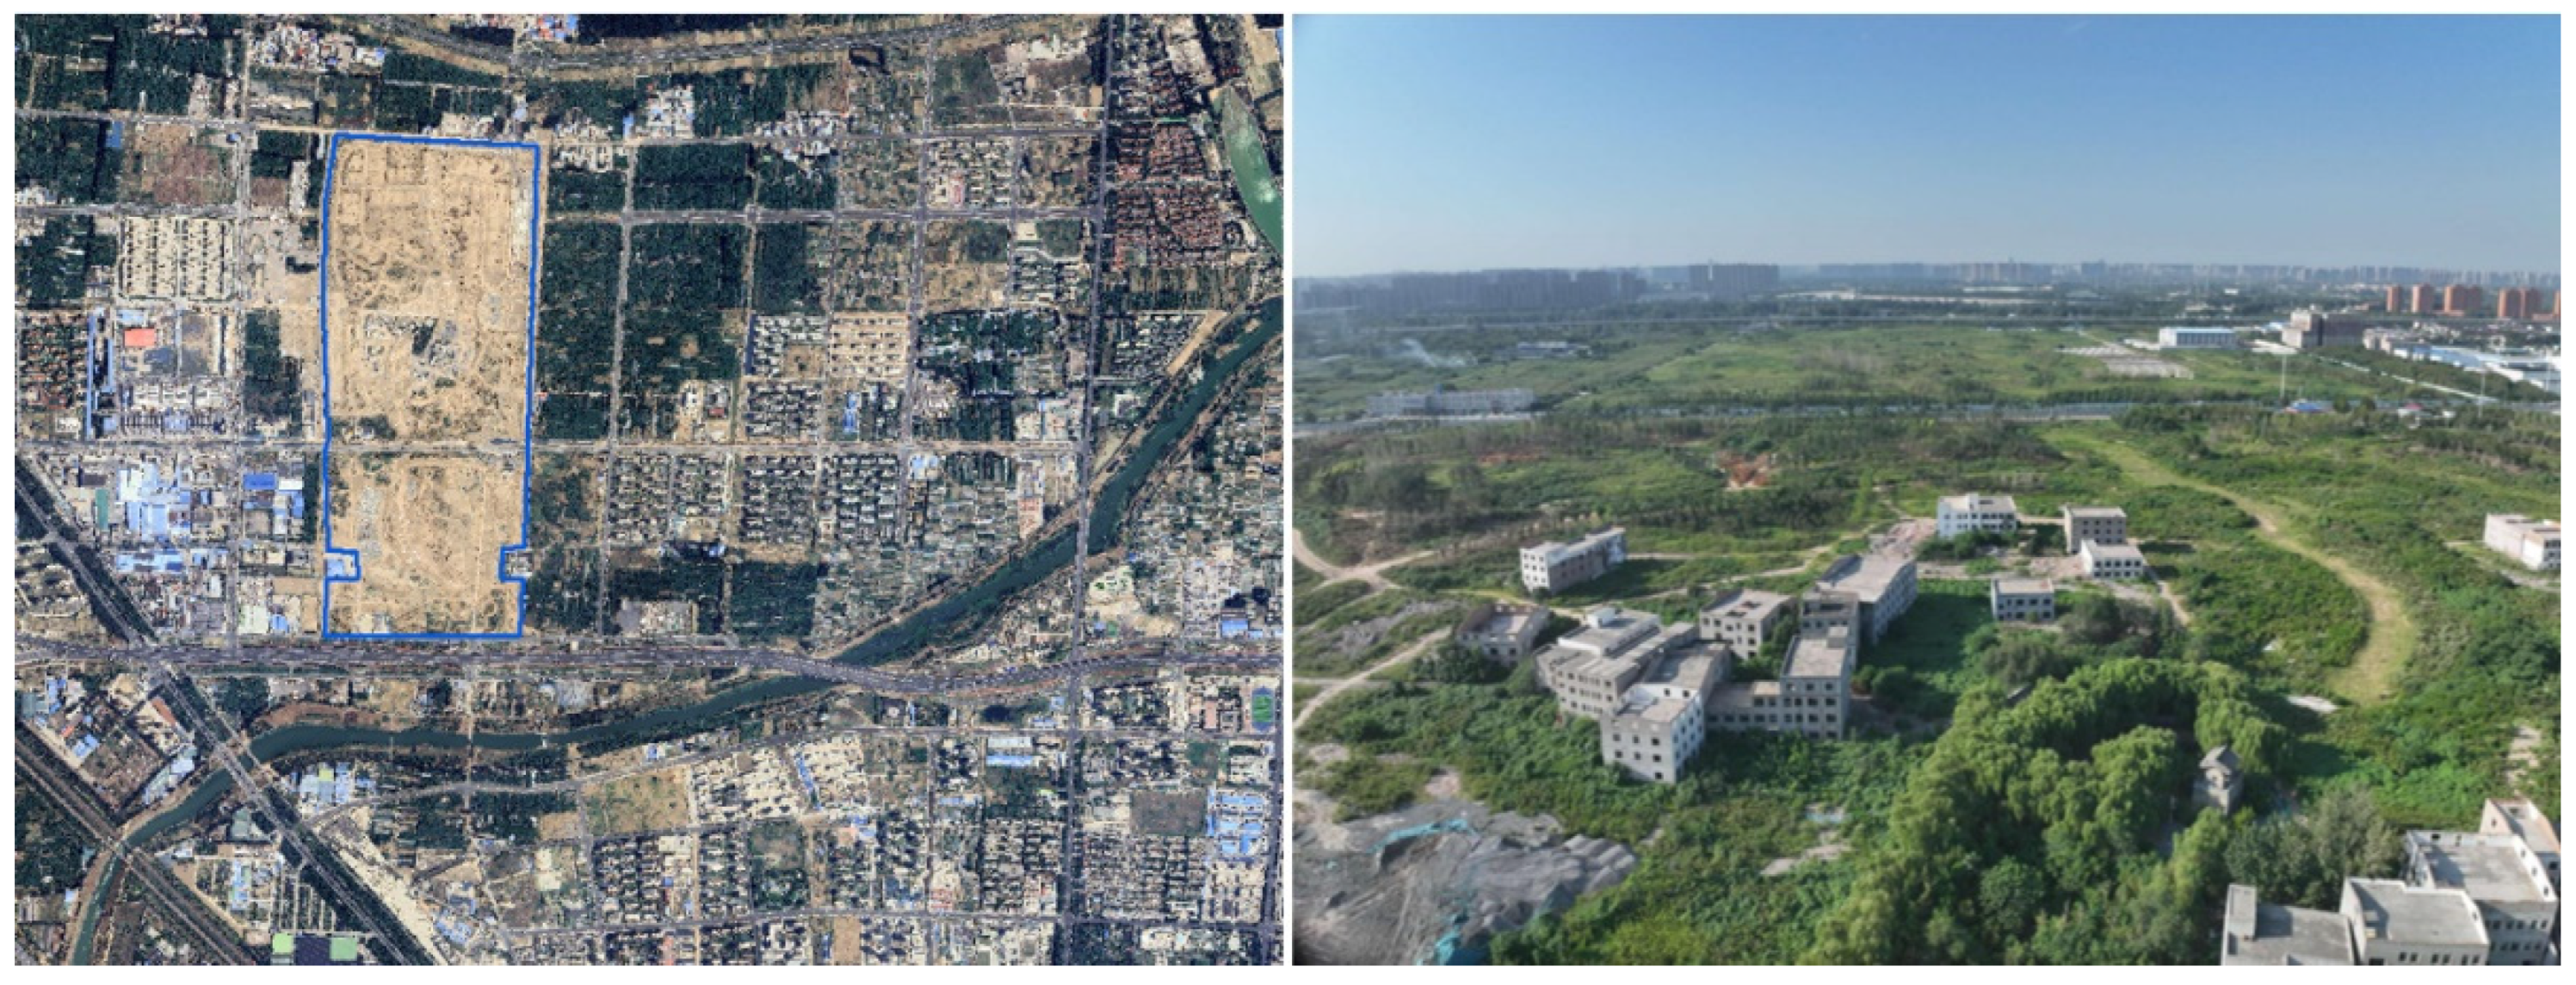
The proposed new park 3 (Chaohe Cap Park) is located in the east of the intersection of Central China Road and the South-to-North Water Diversion (Figure A3), covering an area of 19.0 hectares. The interior of the site is woodland, grassland, and part of the cultivated land, through which the tidal river passes. This area is the location of the tidal river hat park and the tidal river country park planned by the government. There are many neighborhoods with a large population base. The region has outstanding water resources advantages, which can build riverside space, support the construction of a Zhengzhou blue chain ecological leisure zone, and form a continuous ring city park system.
Figure A3. Surroundings of Chaohe Cap Park to be built.
Land 14 02055 g0a3
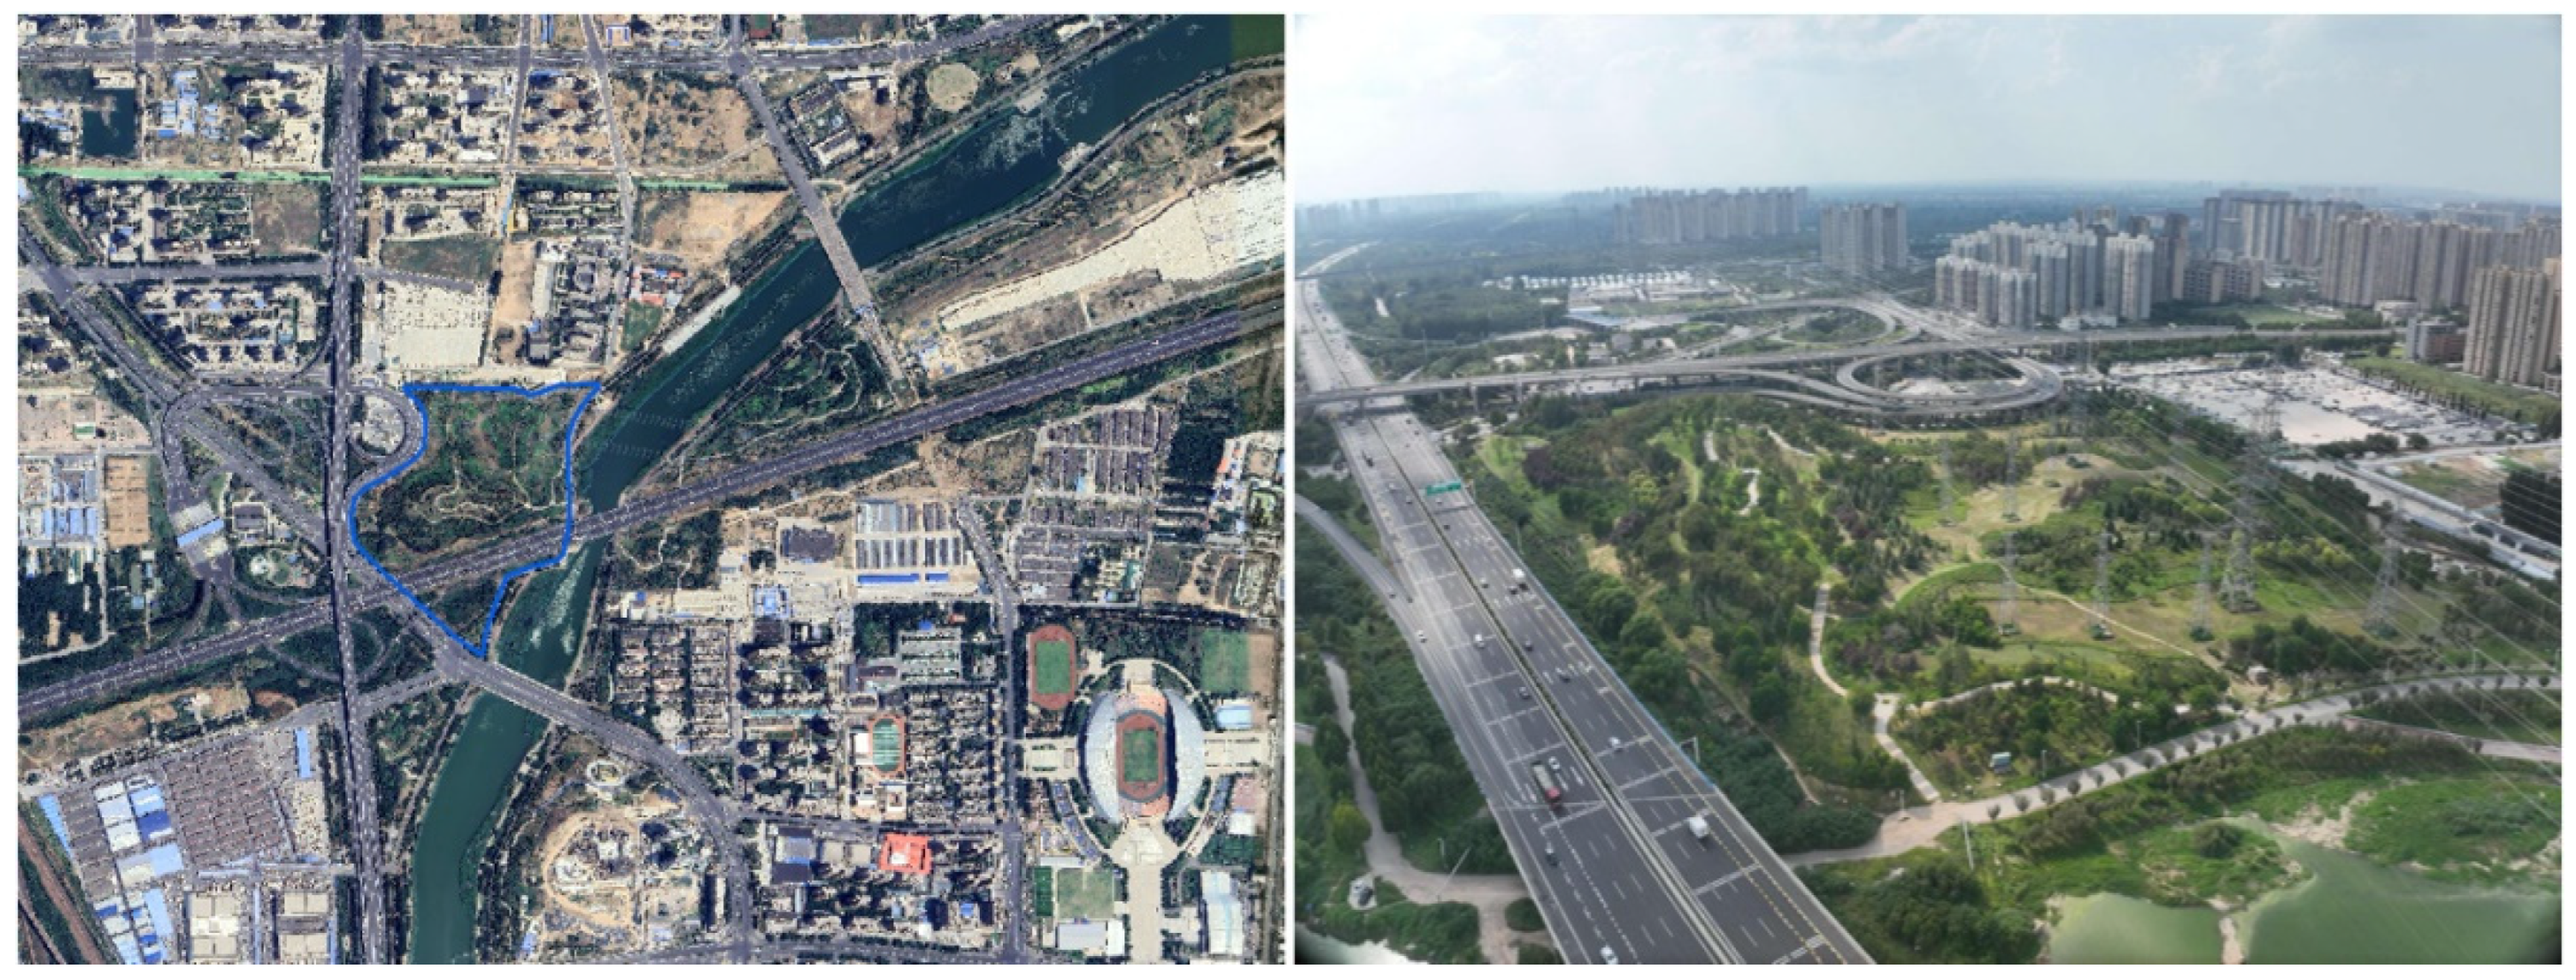
The proposed new park 4 (Bianhe Ruins Park), located on the northwest side of the intersection of Dahe Road and Fengshuo Street (Figure A4), covers an area of 155.2 hectares. This area is a green leisure area in the national spatial planning, and the south side is the Suoxu River. Huiji Bridge Heritage Park is located here. The park is a small area, only 170 m from north to south, and at the longest 55 m from east to west. The ancient bridge of the Sui and Tang Grand Canal (Huiji Bridge), which has a history of thousands of years, is the core landscape of the park. Huiji District, formerly known as Mangshan District, was officially renamed Huiji District in May 2004 in order to enhance the regional image and investment environment. The area has plans to expand into the Bianhe Site Park (Huijiqiao Village Area). It is currently undergoing demolition and renovation. After completion, it can improve the local environment, provide leisure and entertainment space for residents, and build cultural resources superimposed on the Yellow River, the canal, and the ancient city.
Figure A4. Surroundings of the proposed new Bianhe Ruins Park.
Land 14 02055 g0a4
The proposed new park 5 is located on the east side of the intersection of Jiangshan Road and Lianhuo Expressway (Figure A5), covering an area of 16.8 hectares. This area is a green leisure area in the national spatial planning. The interior of the site is forest land and grassland. The greening foundation is good, and many roads have been built inside. It is surrounded by a number of residential quarters and commercial plots. At 1.5 km (road distance) is the sports center of Henan Province, 700 m away from Jiyuan Road, a slow-moving street. The proposed new park is adjacent to the Jialu River, which can optimize the local living environment and enrich the residents’ leisure life.
Figure A5. Surroundings of the proposed new park 5.
Land 14 02055 g0a5
The proposed new park 6 is located on the east side of the intersection of Zhongzhou Avenue and Jialu River Feng (Figure A6), covering an area of 24.1 hectares. The interior of the site is woodland and grassland, which is a green leisure area in the national spatial planning. The surrounding residential areas are dense, and there are also Sino-Australian furniture cities, water companies, Zhengzhou No.4 Middle School, and Huiji District No.6 Middle School. The south side is adjacent to the Jialu River, and the three bridges cross the river bank to connect the opposite bank. Relying on the advantages of location and resources, we can consider building a theme park with water resources protection as the core, linking sewage treatment plants; through the visual demonstration process of “sewage into clean water,” it can not only make residents intuitively feel the actual effect of water resources protection but also strengthen residents’ awareness of water conservation and water protection and promote the integration of green life concepts into daily life.
Figure A6. Surroundings of the proposed new park 6.
Land 14 02055 g0a6
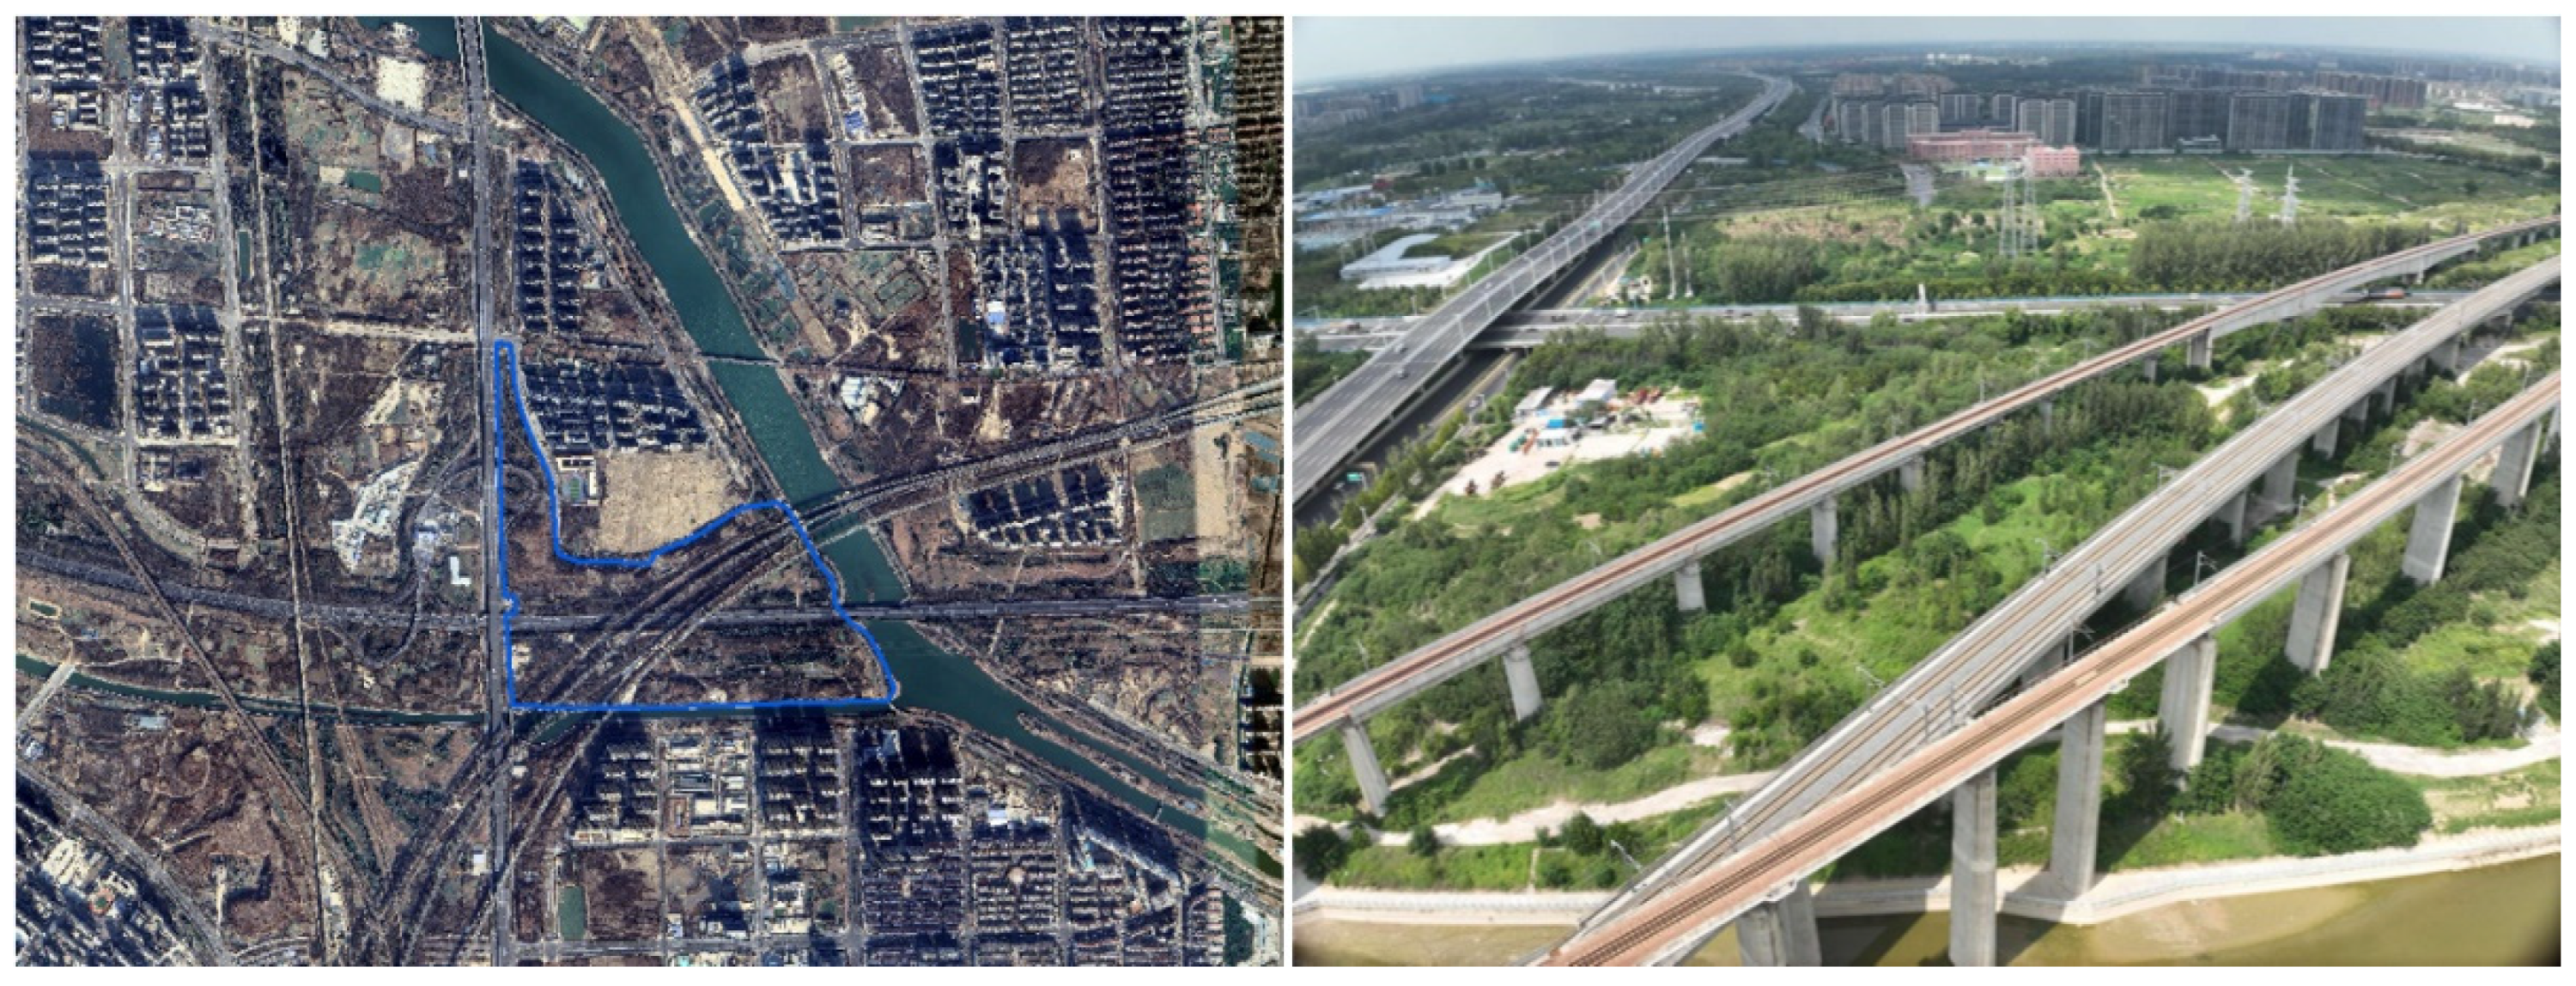
The proposed new park 7 is located on the east side of the intersection of the East Third Ring Road and Lianhuo Expressway (Figure A7), covering an area of 72.0 hectares. The interior of the site is mainly woodland and grassland, which is a green leisure area in the national land space planning. There are many residential areas nearby, and Zhengzhou Campus of Henan University is built 2 km away (road distance). The east side of the site is the Jialu River, and the south side is the Wei River. The water resources are abundant, and there are bridges connected to the opposite bank, and the transportation is convenient. Several high-speed rail lines passing through Zhengzhou East Railway Station can create a characteristic cultural landscape with the theme of high-speed rail, show the development process and technical achievements of high-speed rail such that residents can deeply understand the technology and culture behind high-speed rail, and create an intense cultural atmosphere of high-speed rail.
Figure A7. Surroundings of the proposed new park 7.
Land 14 02055 g0a7
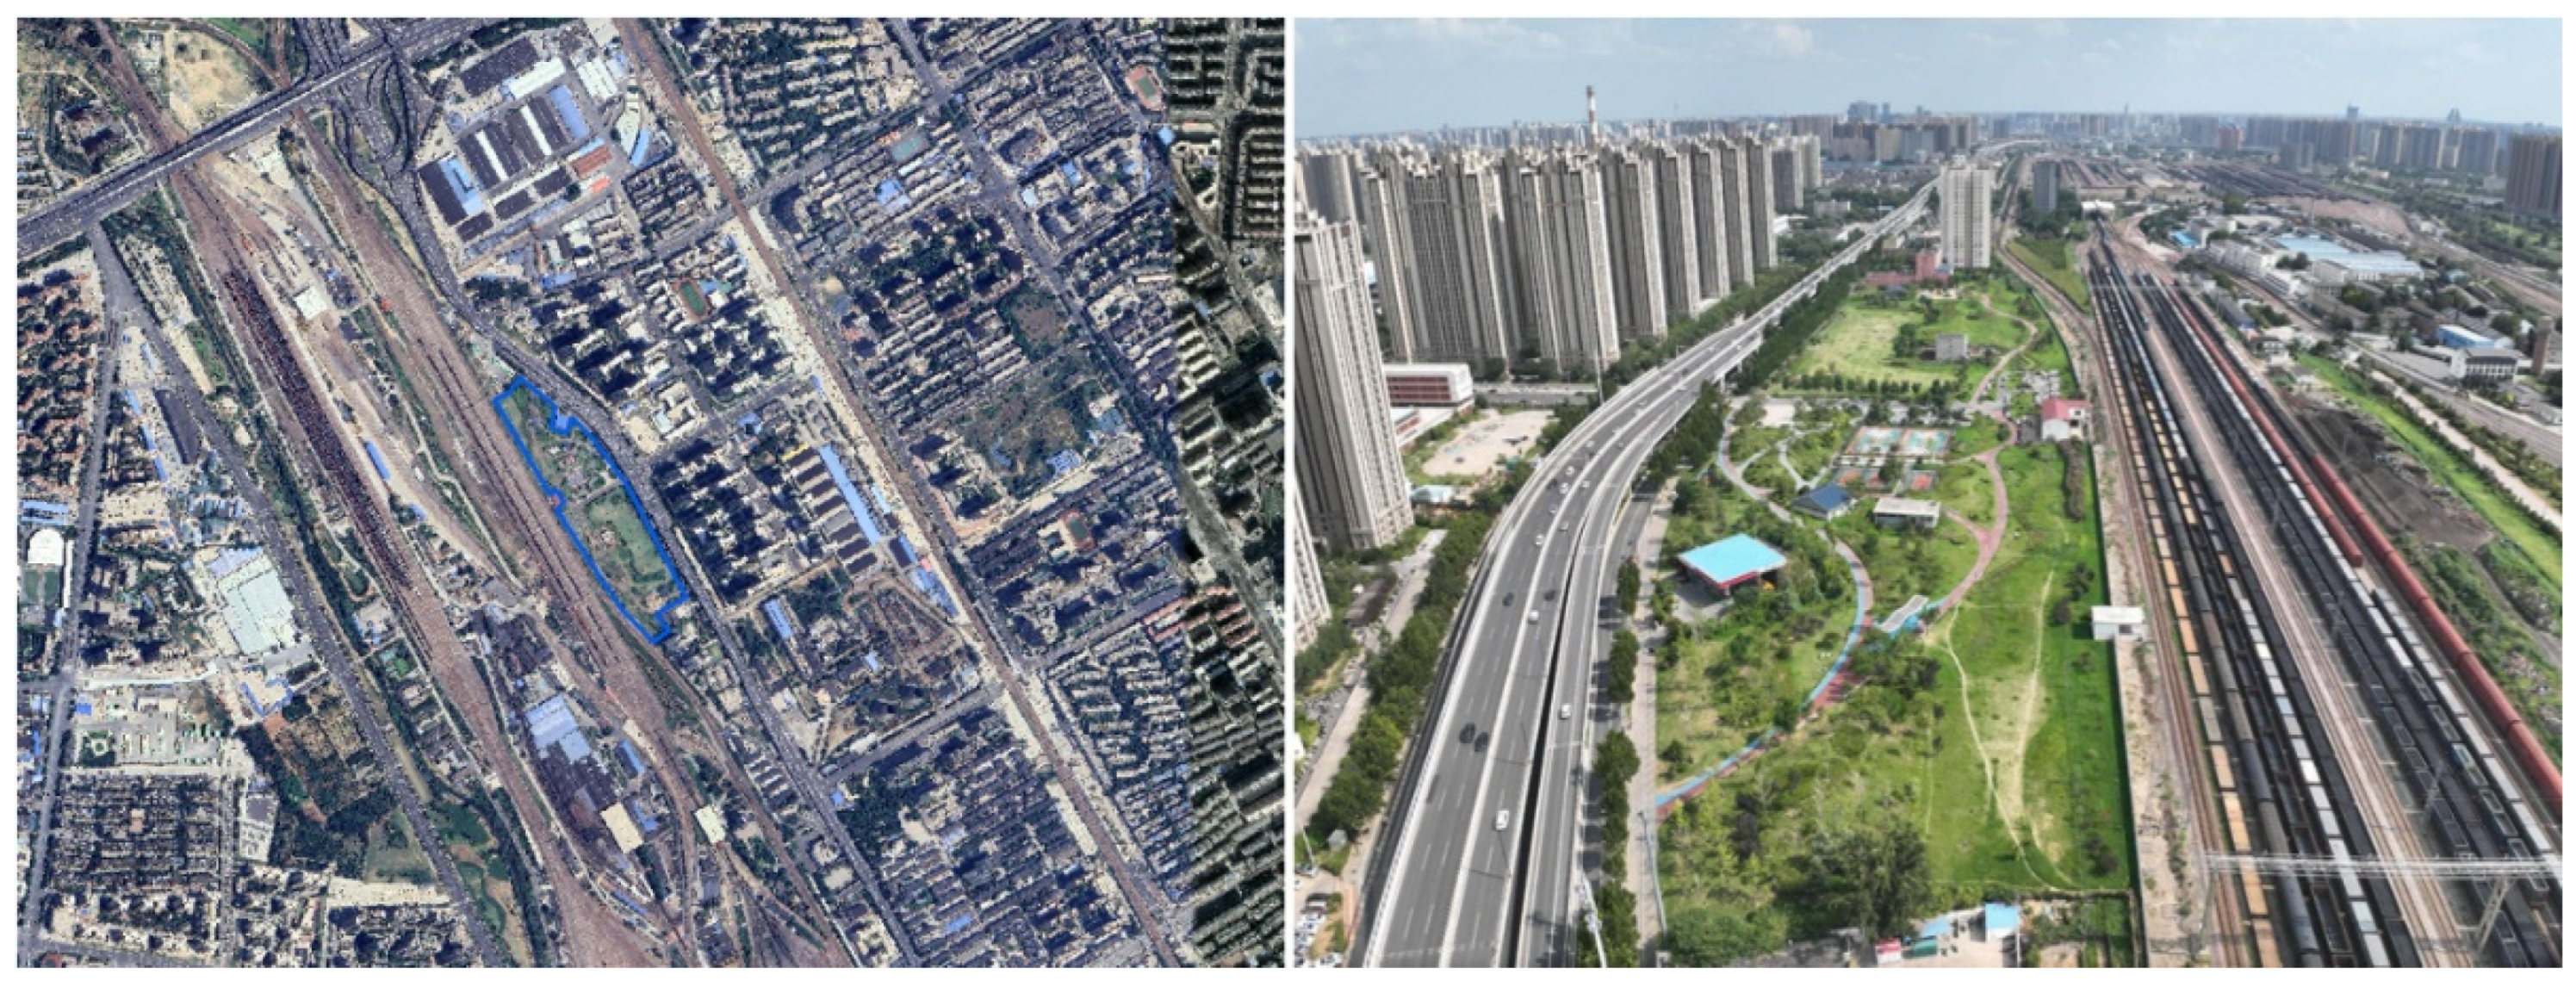
The proposed new park 8 is located on the north side of Zhengzhou North Railway Station (Railway Station) and the west side of Jingguang Expressway, which is connected with Granary Road (Figure A8) and covers an area of 7.3 hectares. The interior of the site is mainly grassland and woodland, and five pitches are built. There are many residential areas and dense population in the vicinity. The proposed new park can make full use of the existing infrastructure, quickly complete the park reconstruction, optimize the living environment, and enrich the residents’ leisure life.
Figure A8. Surroundings of the proposed new park 8.
Land 14 02055 g0a8
The proposed new park 9 is located on the north side of the intersection of the West Fourth Ring Road and the Flower Road (Figure A9), covering an area of 10.2 hectares. The interior of the site is mainly woodland and grassland, and two roads have been built, one pedestrian and one plastic runway, with a beautiful environment. There are many residential areas and industrial sites nearby, characterized by a significant large population density and convenient transportation. Through the construction of the street park through the fragmentation of the green layout, the increase in fitness equipment and the protected stadium can alleviate the shortage of parks in the region.
Figure A9. Surroundings of the proposed new park 9.
Land 14 02055 g0a9
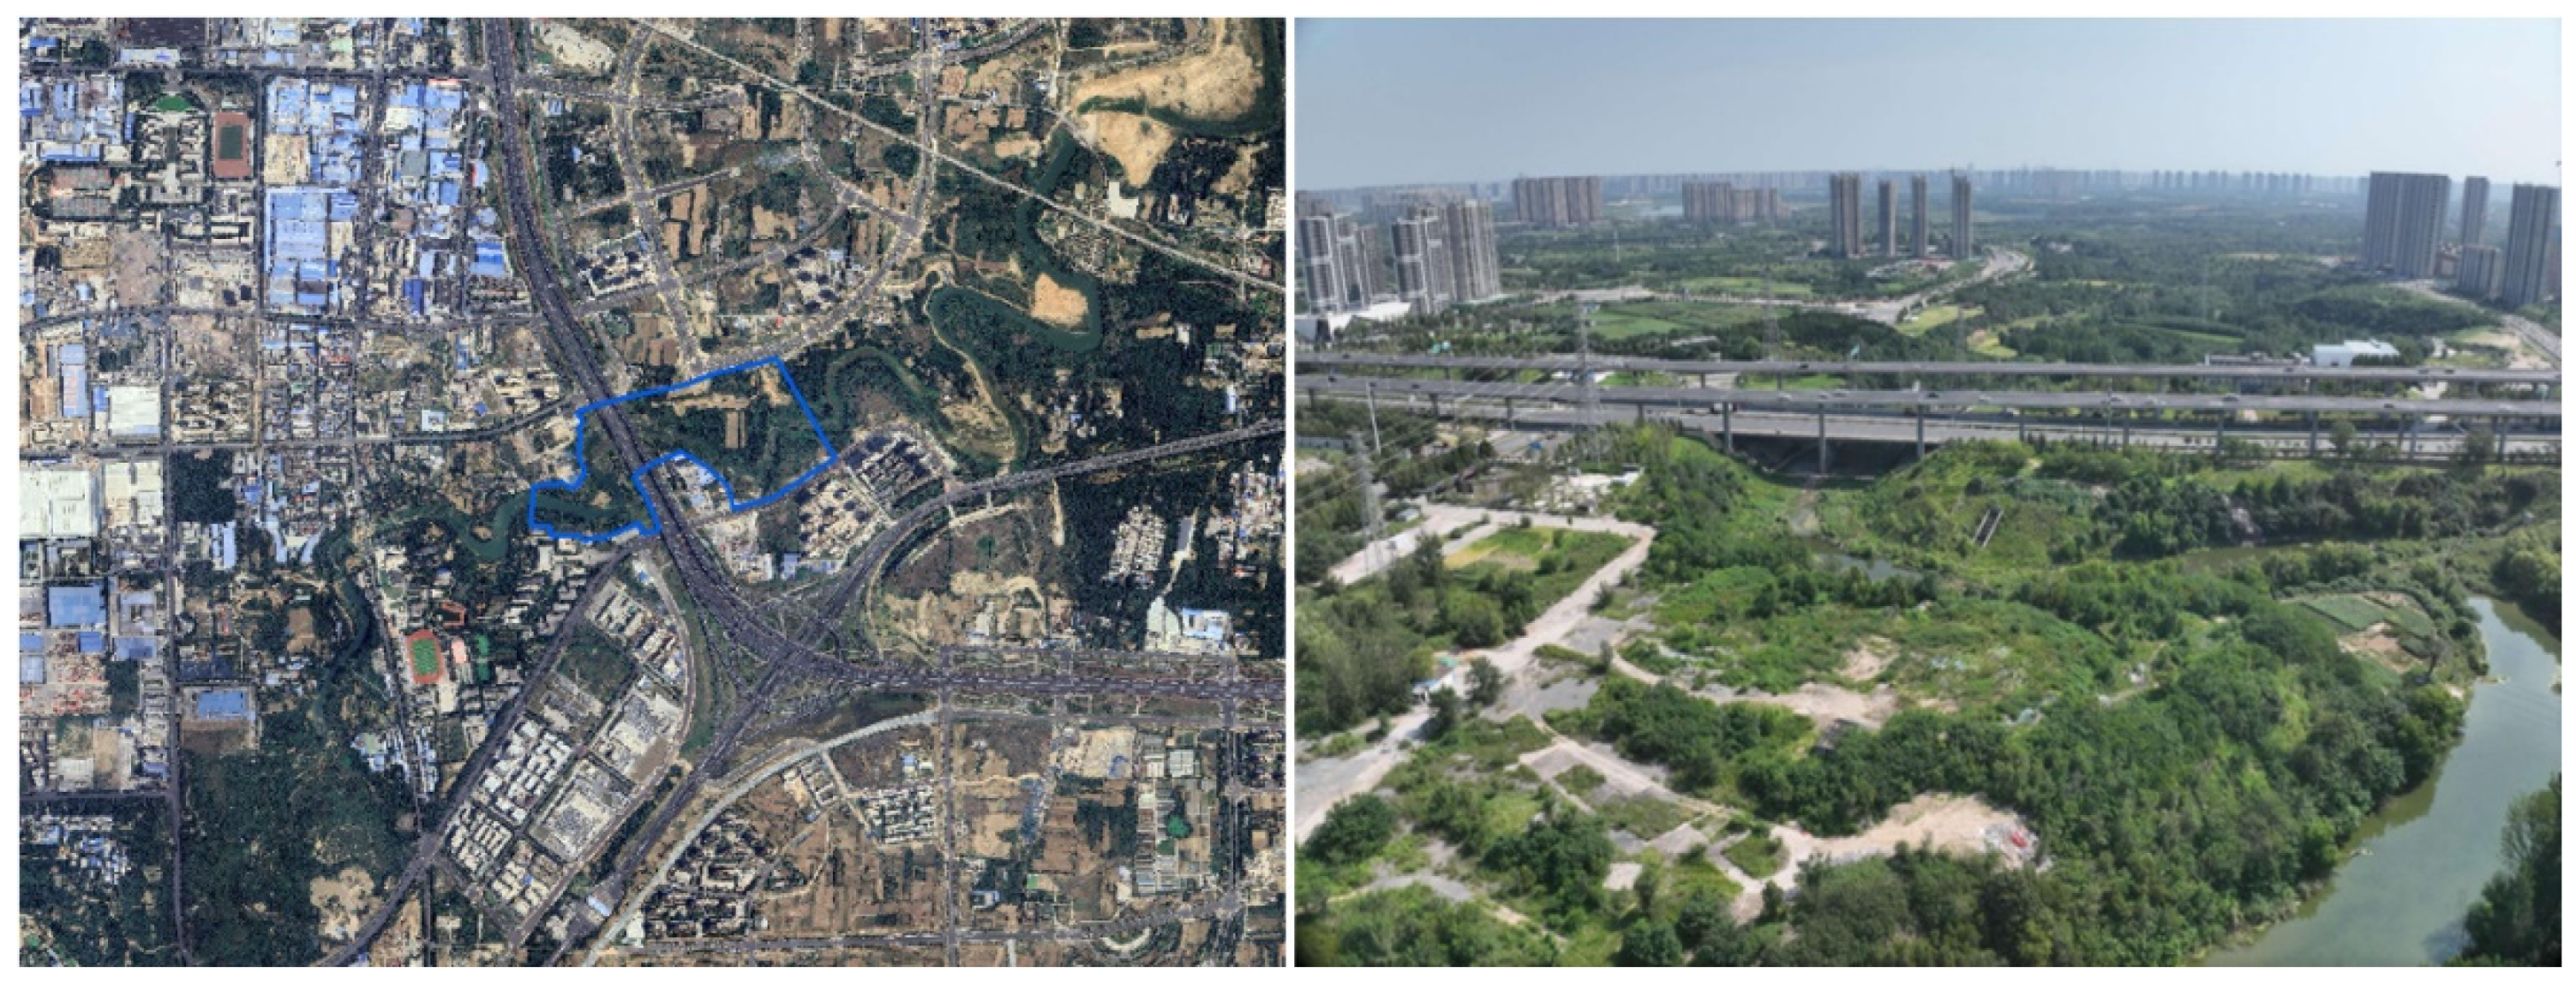
The proposed new park 10 is located on the northwest side of the intersection of Gongming East Road and the South Fourth Ring Road (Figure A10), covering an area of 28.7 hectares. The inside of the site is woodland and grassland, and the Kong River passes through it. Nearby, there are Rongqiao Yuecheng, Konghe Nursing Home, Huahuaniu Company, Shuqing Medical College Rehabilitation Hospital, and Shuqing Medical College. Many communities are under development and construction, with a large population base and convenient transportation. The shortest distance from the northernmost side of the park to the slow vitality road Tongxing Street is only 370 m.
Figure A10. Surroundings of the proposed new park 10.
Land 14 02055 g0a10
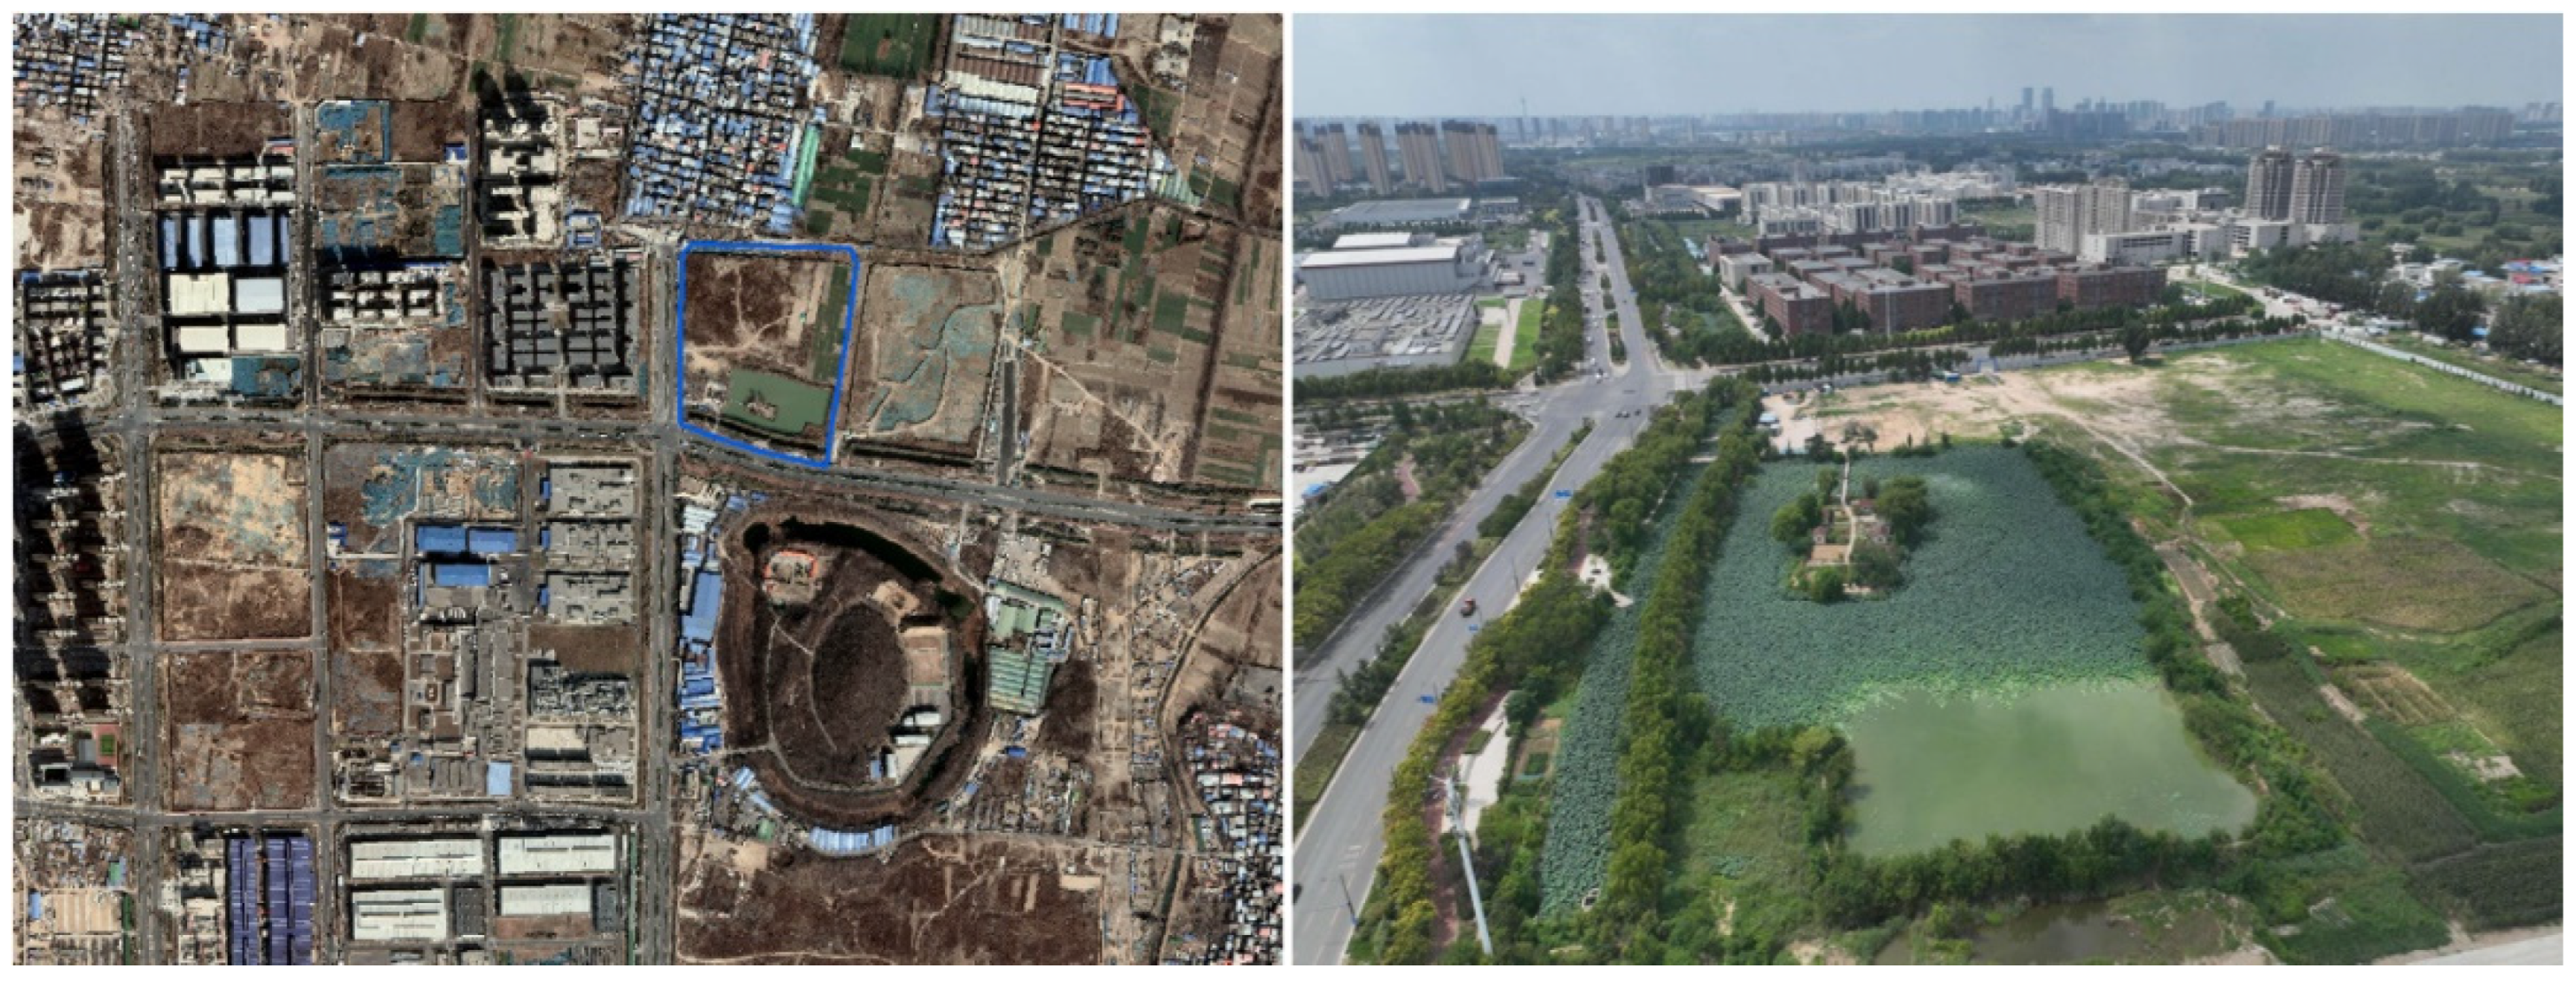
The proposed new park 11 is located on the east side of the intersection of East Hanghai Road and Luyimiao Street (Figure A11), covering an area of 14.3 hectares. The site is mainly composed of grassland, woodland, and some waters. There is a pond with full lotus inside. This area is the residential and living area in the national land space planning. It is 770 m away from the planned slow vitality street through Kai 32nd Street. The surrounding area is mainly industrial land, distributed with Shuanghui, Leanda auto parts, international enterprise port, etc. After the completion of the park, the local environment can be improved to attract more people to work and live.
Figure A11. Surroundings of the proposed new park 11.
Land 14 02055 g0a11

References

  1. Friedrich, K.; Rößler, S. Built Space Hinders Lived Space: Social Encounters and Appropriation in Large Housing Estates. Urban Plan. 2023, 8, 145–161. [Google Scholar] [CrossRef]
  2. Yuan, Y.; Wang, J.; Wei, Y.; Zhu, Y.; Shi, C.; Meng, B. Spatial-temporal Patterns of Urban Parks’ Effects on the Sentiments and Their Associated Factors Based on Social Media Data—A Cas in Beijing. J. Geod. Geoinf. Sci. 2024, 7, 96. [Google Scholar]
  3. Zhang, Y.; Liu, Y.; Zhang, Y.; Liu, Y.; Zhang, G.; Chen, Y. On the spatial relationship between ecosystem services and urbanization: A case study in Wuhan, China. Sci. Total Environ. 2018, 637–638, 780–790. [Google Scholar] [CrossRef]
  4. Peng, X.; Yin, X. Parks and People: Spatial and Social Equity Inquiry in Shanghai, China. Sustainability 2025, 17, 5495. [Google Scholar] [CrossRef]
  5. Zhang, J.; Tan, P.Y. Assessment of spatial equity of urban park distribution from the perspective of supply–demand interactions. Urban For. Urban Green. 2023, 80, 127827. [Google Scholar] [CrossRef]
  6. Alavi, S.A.; Esfandi, S.; Khavarian-Garmsir, A.R.; Tayebi, S.; Shamsipour, A.; Sharifi, A. Assessing the Connectivity of Urban Green Spaces for Enhanced Environmental Justice and Ecosystem Service Flow: A Study of Tehran Using Graph Theory and Least-Cost Analysis. Urban Sci. 2024, 8, 14. [Google Scholar] [CrossRef]
  7. Xu, S.; Li, J.; Gao, X.; Zhao, H.; Hu, J.; Yuan, S. Framework for Analyzing the Relationship between Supply, Demand, and Flow of Recreational Services in Urban Park Green Spaces. Ecol. Indic. 2024, 166, 112403. [Google Scholar] [CrossRef]
  8. Tong, A.; Xu, L.; Ma, Q.; Shi, Y.; Feng, M.; Lu, Z.; Wu, Y. Evaluation of the Level of Park Space Service Based on the Residential Area Demand. Urban For. Urban Green. 2024, 93, 128214. [Google Scholar] [CrossRef]
  9. Quan, Z.; Huijuan, N.; Xiaoying, L. Evaluation of Urban Space Livability in the Urban Area of Hefei Based on Produc-tion-Living-Ecological Space. J. Resour. Ecol. 2024, 15, 338–350. [Google Scholar]
  10. Qiu, D. Carrying Capacity and China’s Regional Functional Planning. In Carrying Capacity of China’s Resources, Environment, Population, and Economy; Qiu, D., Ed.; Springer Nature: Singapore, 2024; pp. 151–210. [Google Scholar]
  11. Zhou, Y.; Yao, J.; Li, P.; Li, B.; Luo, Y.; Ning, S. Multilevel Green Space Ecological Network Collaborative Optimization from the Perspective of Scale Effect. Ecol. Indic. 2024, 166, 112562. [Google Scholar] [CrossRef]
  12. Yang, L.; Lu, Y.; Cao, M.; Wang, R.; Chen, J. Assessing Accessibility to Peri-Urban Parks Considering Supply, Demand, and Traffic Conditions. Landsc. Urban Plan. 2025, 257, 105313. [Google Scholar] [CrossRef]
  13. Guan, C.; Zhou, Y. Exploring Environmental Equity and Visitation Disparities in Peri-Urban Parks: A Mobile Phone Data-Driven Analysis in Tokyo. Landsc. Urban Plan. 2024, 248, 105104. [Google Scholar] [CrossRef]
  14. Wilson, B.; Neale, C.; Roe, J. Urban Green Space Access, Social Cohesion, and Mental Health Outcomes before and during COVID-19. Cities 2024, 152, 105173. [Google Scholar] [CrossRef]
  15. Zhao, Y.; Gong, P. Optimal Site Selection Strategies for Urban Parks Green Spaces under the Joint Perspective of Spatial Equity and Social Equity. Front. Public Health 2024, 12, 1310340. [Google Scholar]
  16. Chen, Z.; Liu, Q.; Li, M.; Xu, D. A New Strategy for Planning Urban Park Green Spaces by Considering Their Spatial Accessibility and Distributional Equity. Forest 2024, 15, 570. [Google Scholar]
  17. Zhang, Z.; Wang, Q.; Yan, F.; Sun, Y.; Yan, S. Revealing Spatio-Temporal Differentiations of Ecological Supply–demand Mismatch among Cities Using Ecological Network: A Case Study of Typical Cities in the “Upstream-Midstream-Downstream” of the Yellow River Basin. Ecol. Indic. 2024, 166, 112468. [Google Scholar] [CrossRef]
  18. Colbert, J.; Chuang, I.T.; Sila-Nowicka, K. Measuring Spatial Inequality of Urban Park Accessibility and Utilisation: A Case Study of Public Housing Developments in Auckland, New Zealand. Landsc. Urban Plan. 2024, 247, 105070. [Google Scholar] [CrossRef]
  19. Chukwu, M.; Huang, X.; Wang, S.; Li, X.; Wei, H. Urban Park Accessibility Assessment Using Human Mobility Data: A Systematic Review. Ann. GIS 2024, 30, 181–198. [Google Scholar] [CrossRef]
  20. Chemnad, K.; Othman, A. Digital Accessibility in the Era of Artificial Intelligence: Bibliometric Analysis and Systematic Review. Front. Artif. Intell. 2024, 7, 1349668. [Google Scholar] [CrossRef]
  21. Yu, K.; Duan, T.; Li, D.; Peng, J.F. Landscape accessibility as a measurement of the function of urban green system. City Plan. Rev. 1999, 8, 7–10. (In Chinese) [Google Scholar]
  22. Xuan, X.; Zheng, Y. Collaborative mechanism and simulation of low-carbon travel for residents in community-built environment based on evolutionary game. J. Clean. Prod. 2024, 443, 141098. [Google Scholar] [CrossRef]
  23. Mwale, M.; Pisa, N.; Luke, R. Travel Mode Choices of Residents in Developing Cities: A Case Study of Lusaka, Zambia. J. Transp. Supply Chain Manag. 2024, 18, 1–14. [Google Scholar] [CrossRef]
  24. Zhou, Y.; Xie, H.; Liu, X.; Wang, X.; Wang, Z. From Service Capacity to Spatial Equity: Accurately and Comprehensively Evaluating Urban Park Green Space Distribution under Multi-Trips Mode. PLoS ONE 2024, 19, e0296629. [Google Scholar] [CrossRef]
  25. Lin, Y.; Zhang, M.; Gan, M.; Huang, L.; Zhu, C.; Zheng, Q.; Wang, K. Fine Identification of the Supply–Demand Mismatches and Matches of Urban Green Space Ecosystem Services with a Spatial Filtering Tool. J. Clean. Prod. 2022, 336, 130404. [Google Scholar] [CrossRef]
  26. Yang, L.; Zheng, Y. Improving and Simulating Urban Landscape Image Recognition Using Combination Optimization and Fuzzy K-Means Algorithm. Egypt. Inform. J. 2025, 31, 100736. [Google Scholar] [CrossRef]
  27. Chen, Y.; Men, H.; Ke, X. Optimizing Urban Green Space Patterns to Improve Spatial Equity Using Location-Allocation Model: A Case Study in Wuhan. Urban For. Urban Green. 2023, 84, 127922. [Google Scholar] [CrossRef]
  28. Zhang, J.; Chen, Y.; Hu, Y.; Lai, L. Spatial Equality of Urban Care Facilities from the Perspective of Refinement: An Example from Changchun, China. Land 2023, 12, 1676. [Google Scholar] [CrossRef]
  29. Wang, S.; Wang, M.; Liu, Y. Access to Urban Parks: Comparing Spatial Accessibility Measures Using Three GIS-Based Approaches. Comput. Environ. Urban Syst. 2021, 90, 101713. [Google Scholar] [CrossRef]
  30. Li, Z.; Liang, Z.; Feng, L.; Fan, Z. Beyond Accessibility: A Multidimensional Evaluation of Urban Park Equity in Yangzhou, China. ISPRS Int. J. Geo-Inf. 2022, 11, 429. [Google Scholar] [CrossRef]
  31. Dai, X.; Wang, L.; Tao, M.; Huang, C.; Sun, J.; Wang, S. Assessing the Ecological Balance between Supply and Demand of Blue-Green Infrastructure. J. Environ. Manag. 2021, 288, 112454. [Google Scholar] [CrossRef] [PubMed]
  32. Oh, K.; Jeong, S. Assessing the Spatial Distribution of Urban Parks Using GIS. Landsc. Urban Plan. 2007, 82, 25–32. [Google Scholar] [CrossRef]
  33. Fasihi, H.; Parizadi, T. Analysis of Spatial Equity and Access to Urban Parks in Ilam, Iran. J. Environ. Manag. 2020, 260, 110122. [Google Scholar] [CrossRef]
  34. Chen, J.; Fu, Y.; Ma, S.; Chen, Q.; Zhang, W.; Huang, J. Research on the Supply–demand Balance Evaluation and Driving Mechanism of Community Public Service Facilities. PLoS ONE 2025, 20, e0322109. [Google Scholar] [CrossRef] [PubMed]
  35. van Velzen, C.; Helbich, M. Green School Outdoor Environments, Greater Equity? Assessing Environmental Justice in Green Spaces around Dutch Primary Schools. Landsc. Urban Plan. 2023, 232, 104687. [Google Scholar] [CrossRef]
  36. Tian, Y.; Van Leeuwen, E.; Tsendbazar, N.E.; Jing, C.; Herold, M. Urban Green Inequality and its Mismatches with Human Demand across Neighborhoods in New York, Amsterdam, and Beig. Landsc. Ecol. 2024, 39, 60. [Google Scholar] [CrossRef]
  37. Tao, Z.; Zhang, R.; Liu, C.; Zhong, Q. On the Modifiable Areal Unit Problem (MAUP) in Healthcare Accessibility Measurement via the Two-Step Floating Catchment Area (2SFCA) Method. Health Place 2025, 93, 103280. [Google Scholar]
  38. Wozniak, M.; Radzimski, A.; Wajchman-Witalska, S. Is More Always Better? Evaluating Accessibility to Parks and Forests in 33 European Cities Using Sustainable Modes of Transportation. Urban For. Urban Green. 2025, 104, 100536. [Google Scholar]
  39. Rad, T.G.; Alimohammadi, A. Modeling Relationships between the Network Distance and Travel Time Dynamics for Assessing Equity of Accessibility to Urban Parks. Geo-Spat. Inf. Sci. 2021, 24, 1–18. [Google Scholar] [CrossRef]
  40. Guo, J.; Brakewood, C. Analysis of Spatiotemporal Transit Accessibility and Transit Inequity of Essential Services in Low-Density Cities, a Case Study of Nashville, TN. Transp. Res. Part A Policy Pract. 2024, 179, 103931. [Google Scholar] [CrossRef]
  41. Yanhua, Y.; Jiangang, X.; Zhenbo, W. Spatial Equity Measure on Urban Ecological Space Layout Based on Accessibility of Socially Vulnerable Groups—A Case Study of Changting, China. Sustainability 2017, 9, 1552. [Google Scholar] [CrossRef]
  42. Liu, L.; Cheng, G.; Yang, J.; Cheng, Y. Spatialization of Population Distribution in Zhengzhou City Based on Multi-Source Data Fusion. Int. J. Eng. Invent. 2025, 11, 1092664. [Google Scholar]
  43. Shi, Z.; Xing, L.; Zheng, L.; Mu, B.; Tian, G. Evaluations and optimization strategies of synergy degree of park greenspace based on balance of supply and demand for recreation. J. Naning For. Univ. (Nat. Sci. Ed.) 2021, 45, 197–204. (In Chinese) [Google Scholar]
  44. Chen, X.; Jia, P. A comparative analysis of accessibility measures by the two-step floating catchment area (2SFCA) method. Int. J. Geogr. Inf. Sci. 2019, 33, 1739–1758. [Google Scholar] [CrossRef]
  45. Talen, E. Visualizing Fairness: Equity Maps for Planners. J. Am. Plann. Assoc. 1998, 64, 22–38. [Google Scholar] [CrossRef]
  46. Zhang, R.; Zhang, C.Q.; Cheng, W.; Lai, P.C.; Schüz, B. The Neighborhood Socioeconomic Inequalities in Urban Parks in a High-Density City: An Environmental Justice Perspective. Landsc. Urban Plan. 2021, 211, 104099. [Google Scholar] [CrossRef]
  47. Ghertner, D.A. Lively Lands: The Spatial Reproduction Squeeze and the Failure of the Urban Imaginary. Int. J. Urban Reg. Res. 2020, 44, 561–581. [Google Scholar] [CrossRef]
  48. Karadimitriou, N.; Spyrellis, S. Measuring Deprivation and Micro-Segregation in Greek Integrated Sustainable Urban Develop-ment Strategies: Time to Apply a Common Method? Land 2024, 13, 552. [Google Scholar] [CrossRef]
  49. Wang, M.; Zhao, J.; Zhang, D.; Xiong, Z.; Sun, C.; Zhang, M.; Fan, C. Assessing Urban Vitality in High-Density Cities: A Spatial Accessibility Approach Using POI Reviews and Residential Data. Humanit. Soc. Sci. Commun. 2025, 12, 1–13. [Google Scholar] [CrossRef]
  50. Huang, Z.; Jia, Q.; Luo, S.; Tu, W.; Zhao, L.; Li, S.; Lu, Z. Static and Dynamic Assessments of Park Accessibility and Equity Across Different Living Circles in Shenzhen’s Core Area. Environ. Res. Commun. 2025, 7, 025011. [Google Scholar] [CrossRef]
  51. Qiu, W.; He, L.; Zhong, L.; Wang, S. Comprehensive Evaluation of Accessibility of Urban Parks in Nanchang. Landsc. Archit. 2023, 30, 78–86. [Google Scholar]
  52. Kim, K.; Yi, C.; Lee, S. Changes in Urban Temperature and Building Energy Consumption Due to Urban Park Construction: The Case of Gyeongui Line Forest in Seoul. Energy Build. 2019, 199, 142–151. [Google Scholar]
  53. Yue, W.; Liu, Y.; Fan, P.; Ye, X.; Wu, C. Assessing Spatial Pattern of Urban Thermal Environment in Shanghai, China. Stoch. Environ. Res. Risk Assess. 2012, 26, 899–911. [Google Scholar] [CrossRef]
  54. Chang, H.Y.; Lee, Y.F. Effects of Area Size, Heterogeneity, Isolation, and Disturbances on Urban Park Avifauna in a Highly Populated Tropical City. Urban Ecosyst. 2016, 19, 257–274. [Google Scholar] [CrossRef]
  55. Yang, Y.; Liu, S. Network Structure Evaluation and Optimization Path for Urban Park System of Shanghai City Based on Social Network Analysis. Landsc. Archit. 2023, 30, 51–58. (In Chinese) [Google Scholar]
  56. Song, L.; Wu, M.; Wu, Y.; Xu, X.; Xie, C. Research on the Evaluation of Cultural Ecosystem Services in Zhengzhou Urban Parks Based on Public Perceptions. Sustainability 2023, 15, 11964. [Google Scholar] [CrossRef]
  57. Du, C.; Ge, S.; Song, P.; Jombach, S.; Fekete, A.; Valánszki, I. Optimizing Urban Green Spaces for Vegetation-Based Carbon Sequestration: The Role of Landscape Spatial Structure in Zhengzhou Parks, China. Forests 2025, 16, 634. [Google Scholar] [CrossRef]
  58. Qiao, X.; Liu, L.; Li, Y.; Yang, Y.; Dai, Y.; Zhang, J.; Zhang, J.; Zheng, J.; Zhao, S. Spatio-temporal evolution and simulation prediction of heat island effect in shrinking cities in china based on improved ca-markov modeling. Sust. Cities Soc. 2025, 106583. [Google Scholar] [CrossRef]
  59. Dai, Y.; Qiao, X.; Yang, Y.; Liu, L.; Chen, Y.; Zhang, J.; Zhao, T. Optimizing land use to mitigate ecosystem service trade-offs using multi-scenario simulation in the luo river basin. Land 2024, 13, 1243. [Google Scholar] [CrossRef]
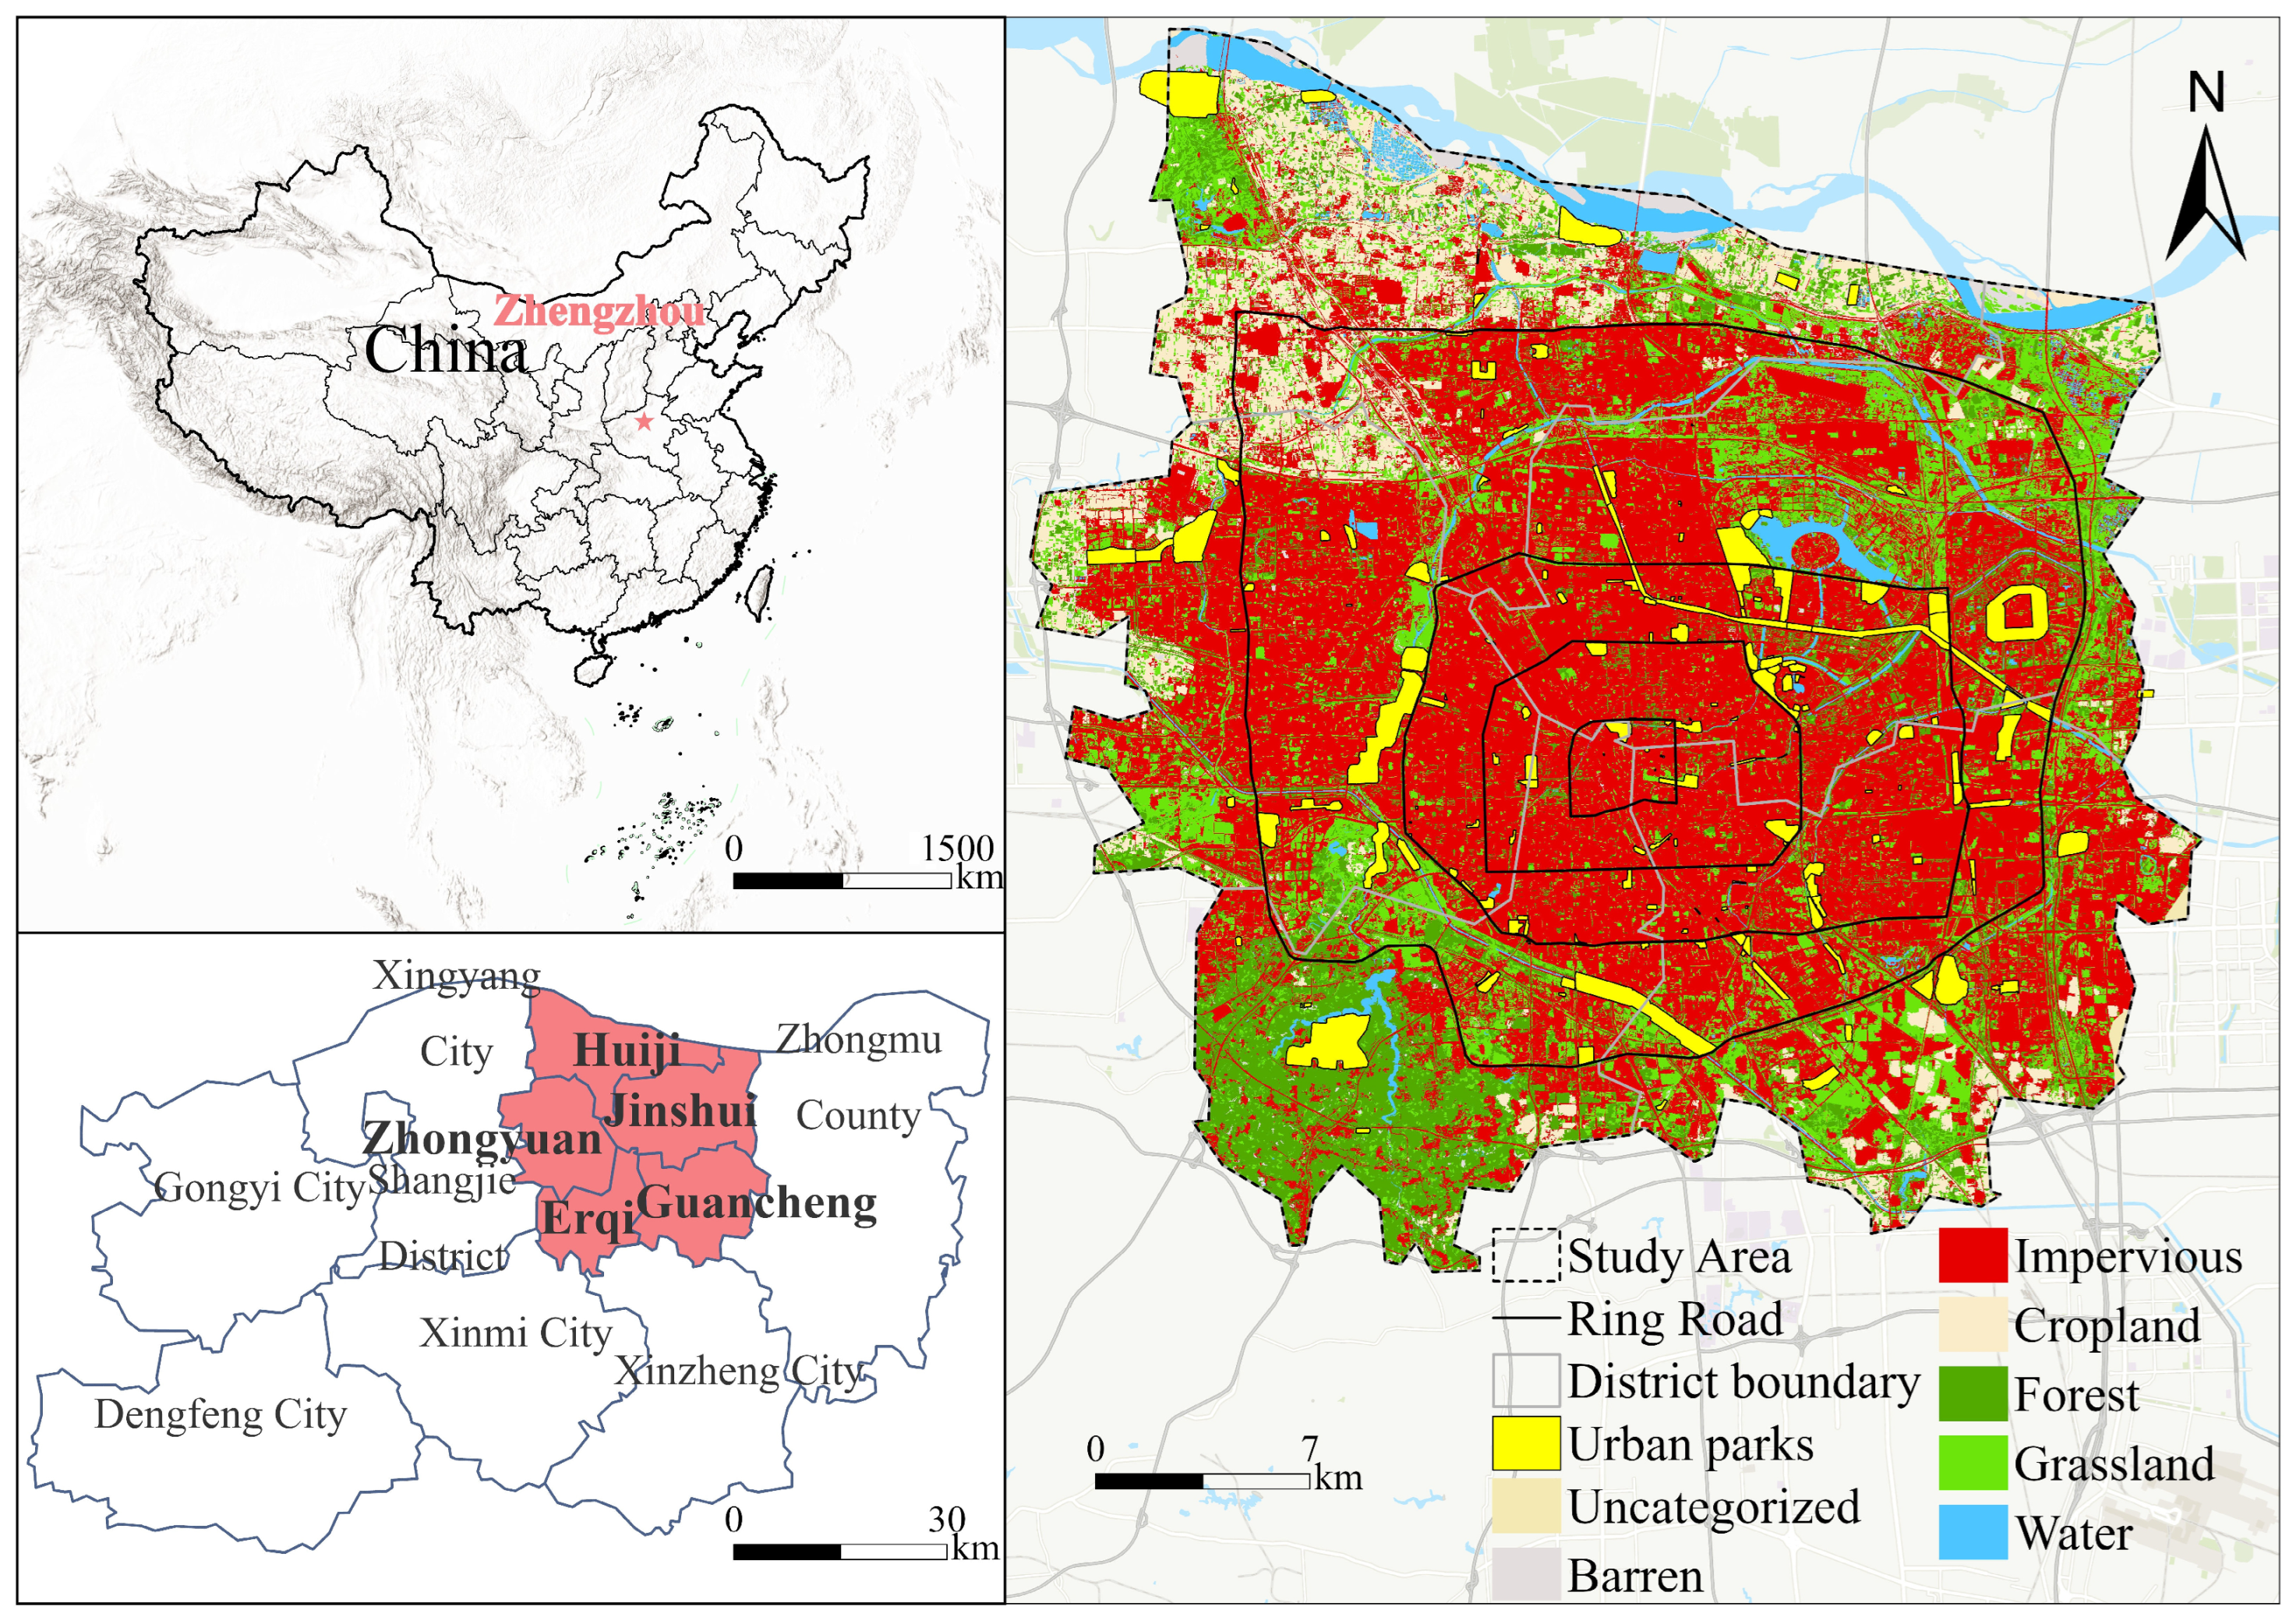
Figure 1. Location map of the study area.
Land 14 02055 g001
Figure 2. Park accessibility service areas under three time thresholds in multi-travel mode scenarios.
Land 14 02055 g002
Figure 3. The reachable service range of the park with multiple time thresholds under the integrated traffic mode.
Land 14 02055 g003
Figure 4. Blue–green space pattern in Zhengzhou’s main urban area.
Land 14 02055 g004
Figure 5. Distribution of park supply area.
Land 14 02055 g005
Figure 6. Area distribution of residents’ demand for parks.
Land 14 02055 g006
Figure 7. Distribution map of supply and demand ratio of park.
Land 14 02055 g007
Figure 8. Location entropy distribution.
Land 14 02055 g008
Figure 9. Lorenz curve the service area of street park.
Land 14 02055 g009
Figure 10. Location distribution of new parks.
Land 14 02055 g010
Figure 11. The addition of new parks and areas with insufficient supply and demand.
Land 14 02055 g011
Figure 12. Comparison of the supply and demand ratio before (a) and after (b) the addition of new parks.
Land 14 02055 g012
Table 1. Advantages, limitations, and improved strategy of current methods.
Research Method/DimensionMain AdvantagesMain LimitationsOur Research Strategy
Macro-Indicator ApproachSimple calculation, easy macro-managementIgnores spatial and behavioral heterogeneityUse as a benchmark, not the sole standard
Accessibility Analysis (Buffer)Simple model, computationally efficientSignificantly deviates from real travel pathsEmploy network analysis based on actual road networks
Accessibility Analysis (2SFCA)Integrates supply, demand, and distance; good for trend analysisCoarse units, simplified routes, relative resultsUse high-resolution population raster and multimodal network analysis
Equity Analysis (Gini Coefficient)Measures overall distributional equalityNot spatially explicit; masks local inequitySpatialize equity via location quotient and grid-cell analysis
Multimodal Transport IntegrationMore realistically reflects travel behaviorDoes not use empirical mode weightsIncorporate localized travel survey data to determine weights
Table 2. Data resources.
DataYearSource
Nighttime Light Data2024Sustainable Development Science Satellite 1 (SDGSAT-1)
https://www.sdgsat.ac.cn (accessed on 10 April 2025)
Mobile Signaling Data2024China Unicom
POI Data, Road Network Data, Boundary Data2024OpenStreetMap (OSM)
https://openstreetmap.maps.arcgis.com/home/index.html (accessed on 11 April 2025)
Building Data2024Scientific Data
Sentinel-2A Imagery2024Google Earth Engine Platform
https://developers.google.cn/earth-engine (accessed on 26 April 2025)
Regional Population Data2024Zhengzhou Statistical Yearbook 2024 https://tjj.zhengzhou.gov.cn (accessed on 26 April 2025)
WorldPop Population Raster2024WorldPop Official Website https://hub.worldpop.org/geodata/summary?id=50680 (accessed on 23 April 2025)
Seventh National Population Census Data2020Zhengzhou Municipal Bureau of Statistics
Rasterized Population Data from the Seventh Census2020Research Team of Prof. Yuehong Chen https://doi.org/10.6084/m9.figshare.24916140.v1 (accessed on 23 April 2025)
University Population Data2024Official University Statistics
Park Vector Boundaries2025Acquired via UAV Aerial Remote Sensing Imaging
Blue–Green Spaces within Parks2025Extracted using eCognition Software for Vegetation and Recreational Water Bodies
Table 3. Questionnaire survey results of residents’ travel mode and time.
Time PeriodNumber of Respondents Choosing WalkingPercentageNumber of Respondents Choosing CyclingPercentageNumber of Respondents Choosing Motor VehiclePercentage
5 min58973.90%19123.97%172.13%
15 min20712.53%109266.07%35421.40%
30 min293.43%27332.32%54364.25%
Note: This questionnaire item is multiple-select.
Table 4. Search radius and weighted distance by travel mode.
Travel Mode5 min15 min30 min
Walking0.39 km1.17 km2.34 km
Cycling1.25 km3.75 km7.51 km
Motor Vehicle2.50 km7.50 km15 km
Weighted Distance0.64 km4.23 km12.14 km
Table 5. Thresholds of the Gini coefficient.
ScopeRank
[0,0.2)Exact match
[0.2,0.3)Relative match
[0.3,0.4)Relatively reasonable match
[0.4,0.5)Relative mismatch
[0.5,1]Total mismatch
Table 6. The definition of the range of Gini Coefficient.
Time ThresholdGini CoefficientsFairness
5 min0.37Relatively reasonable match
15 min0.25Relative match
30 min0.27Relative match
Table 7. Residents’ opinions on park construction.
CategoryMain Suggestions
Park Quantity and DistributionIncrease the number of parks, especially small community parks; optimize spatial distribution to address coverage gaps
Hygiene and Facility MaintenanceIncrease cleaning frequency of restrooms; perform regular maintenance of fitness and recreational equipment; ensure timely garbage removal
Lighting and SafetyIncrease number of light fixtures; extend lighting hours; repair broken street lamps
Management of Square DancingDesignate dedicated areas for square dancing; establish reasonable time slots to avoid noise disturbance
Recreational and Fitness FacilitiesProvide facilities suitable for all age groups; diversify types of fitness equipment
Greening and EnvironmentExpand green areas; increase plant diversity; enhance vegetation maintenance
OthersIncrease number of public restrooms; improve parking conditions; set up resting areas; strengthen mosquito control measures
Table 8. Comparison of supply and demand before and after park expansion.
Number of PixelsNumber of Pixels Before OptimizationProportionNumber of Pixels After OptimizationProportion
Insufficient supply–demand
(supply–demand ratio ≤ 0.8)
49,2610.2834,2110.20
Balanced supply–demand
(0.8 < supply–demand ratio ≤ 1.2)
21,7540.1312,5890.07
Adequate supply–demand
(supply–demand ratio > 1.2)
103,3090.59127,5240.73
Disclaimer/Publisher’s Note: The statements, opinions and data contained in all publications are solely those of the individual author(s) and contributor(s) and not of MDPI and/or the editor(s). MDPI and/or the editor(s) disclaim responsibility for any injury to people or property resulting from any ideas, methods, instructions or products referred to in the content.