Article

Beyond the Surface: Understanding Salt Crusts’ Impact on Water Loss in Arid Regions

1
College of Ecology and Environment, Xinjiang University, Urumqi 830046, China
2
Key Laboratory of Oasis Ecology Ministry of Education, Xinjiang University, Urumqi 830046, China
3
Xinjiang Jinghe Observation and Research Station of Temperate Desert Ecosystem, Ministry of Education, Bole 833300, China
*
Author to whom correspondence should be addressed.
Land 2025, 14(10), 2028; https://doi.org/10.3390/land14102028
Submission received: 17 September 2025 / Revised: 7 October 2025 / Accepted: 9 October 2025 / Published: 10 October 2025

Abstract

Soils in arid regions are characterized by elevated salinity levels. During the process of soil moisture evaporation, salts are transported with water to the surface, resulting in the formation of salt crusts. Although these crusts significantly impact soil moisture evaporation, there is a paucity of systematic quantitative research concerning their formation mechanisms, dynamic evolution patterns, and effects on evaporation. To elucidate the mechanisms by which salt crusts influence soil moisture evaporation, this study conducted evaporation experiments utilizing brine soil columns. Various thicknesses of sand mulching (1 cm, 2 cm, 3 cm, 4 cm, 5 cm, and 6 cm) were applied to the top of the soil columns to generate different forms of NaCl salt crusts. Observations of soil column water evaporation rates, salt crust coverage (SCC), and salt crust morphology were conducted to analyze the effects of salt crust formation on soil water evaporation. The results indicate that the morphology and coverage of NaCl salt crusts significantly influence soil moisture evaporation. A crusty salt crust with high coverage impedes soil moisture evaporation; a patchy salt crust with moderate coverage may promote evaporation; the absence of a crust on the surface has a relatively weak effect on soil moisture evaporation. Nevertheless, the development of ‘salt trees’ within the soil profile can increase soil evaporation. These findings challenge the conventional understanding that “salt inhibits evaporation,” providing essential mechanistic parameters for accurately quantifying evaporation fluxes in saline soils and enhancing regional water cycle models, particularly the module related to atmosphere–soil water vapor exchange.

1. Introduction

In arid regions, water serves as the lifeline sustaining ecosystem balance and socioeconomic development [1], and acts as a limiting factor for regional ecosystem development [2]. With scarce precipitation, intense evaporation [3], sparse vegetation, and exposed land surfaces [4], soil moisture evaporation constitutes a vital component of the water cycle in arid zones [5]. Soil moisture evaporation, as a key component of the hydrological cycle in arid and semi-arid regions [6], it not only directly regulates land–atmosphere water exchange but also represents the primary pathway for ineffective water loss in these regions—particularly on bare land and saline-alkali soils lacking vegetation cover, where surface evaporation constitutes the overwhelming majority of water dissipation [7], this process profoundly constrains regional water resource availability and ecological sustainability.
Soil moisture transports dissolved salts toward the evaporation front, as moisture evaporates and dissipates, salts crystallize and precipitate in the topsoil or near-surface layer [8]. These salt crystals bind with soil particles, forming low-permeability, high-reflectivity salt crusts [9]. Depending on their formation location, salt crusts can be categorized as surface crusts (efflorescence) or subsurface crusts (subflorescence) [10,11]. Salt crust formation further inhibits water infiltration, exacerbates soil drought, disrupts soil structure, and ultimately triggers a cascade of ecological issues, including vegetation decline and land degradation [12]. Therefore, thoroughly elucidating the driving mechanisms of soil evaporation under saline conditions and the synergistic transport patterns of water and salts is crucial for accurately quantifying soil–atmosphere interface water fluxes in arid regions, refining regional hydrological models, and ultimately achieving sustainable management of scarce water resources in these areas.
Numerous studies indicated that the presence of salt crust affects soil moisture evaporation. First, the presence of salt crusts impedes soil moisture evaporation. Salt crusts, prevalent in arid regions, significantly suppress soil moisture evaporation by blocking pores and increasing resistance to gas-phase diffusion [13,14]. Salt crystals accumulate and grow on the soil surface or within near-surface pores, directly obstructing pathways for gas and water transport. This hinders the upward movement of liquid water and disrupts vapor diffusion routes [15]. Especially during surface crusting (efflorescence), salts such as NaCl form dense, low-permeability crusts whose hydraulic conductivity can decrease by two orders of magnitude compared to the original soil, significantly restricting water movement [16]. This suppression of evaporation reduces water loss while contributing to an increase in shallow soil moisture content [17] and a reduction in surface dust release [18]. Second, the presence of salt crusts promotes soil moisture evaporation. The effect of salt crusts on evaporation is not always inhibitory; patchy salt crusts may actually enhance evaporation under certain conditions [10]. When soil particle size is small (5–160 µm), continuous, dense “crusty” salt crusts readily form, significantly impeding soil moisture evaporation. When soil particle size is larger (200–300 µm), salt crystals form in a discrete, porous “patchy” distribution. Such crusts not only fail to inhibit evaporation but may even promote it under certain conditions by expanding the evaporation interface and enhancing local capillary water transport capacity, their evaporation rates can approach or exceed those of deionized water control groups [19]. However, the specific conditions under which evaporation is promoted remain unclear. Therefore, precisely managing salt crust morphology through regulatory measures (particularly the formation conditions and coverage of patchy crusts) to suppress ineffective evaporation, prevent surface salt accumulation, and avoid potential evaporation-promoting effects has become a core scientific issue in water–salt management in arid regions.
To clarify the regulatory mechanism of salt crust on soil water evaporation, this study conducted soil column evaporation experiments using a 4 mol/L NaCl aqueous solution. It was designed with the following specific objectives: (1) to generate distinct salt crust morphologies—specifically crusty, patchy—by applying six sand mulching thicknesses (1 cm, 2 cm, 3 cm, 4 cm, 5 cm, 6 cm); (2) to quantitatively monitor the dynamic evolution of salt crust coverage (SCC) and its coupling with soil moisture evaporation; and (3) to systematically elucidate how NaCl salt crust morphology and SCC regulate evaporation. We hypothesized that a morphological transition from a crusty to a patchy salt crust, induced by a critical sand mulching thickness, would fundamentally alter evaporation dynamics, shifting them from suppression to promotion. The findings challenge the oversimplified view that “salt inhibits evaporation,” and provide essential mechanistic parameters for refining regional hydrological models and improving water management in arid and semi-arid regions.

2. Materials and Methods

2.1. Experimental Materials

Fine sand with a particle size of 100–200 µm was selected as the experimental soil. To minimize the influence of residual soluble ions in the sand, it was washed with deionized water until the conductivity of the washing solution stabilized at 50–60 µs‧cm−1. The washed sand was then dried in an oven at 105 °C for later use. To form salt crusts of varying morphologies, this study employed six sand mulching thicknesses: 1 cm, 2 cm, 3 cm, 4 cm, 5 cm, and 6 cm. Sand mulching was carried out with 500–800 µm of coarse sand.

2.2. Experimental Design and Equipment

This study employed indoor soil column evaporation experiments, with the experimental setup shown in Figure 1. The total height of the soil column was 20 cm with a diameter of 10 cm, while the Mariotte bottle stood 25 cm tall. To guarantee uniform water distribution, a 5 cm thick layer of 3–5 mm sand was placed at the very bottom of the soil column. The fine sand layer was filled to a height of 8 cm, covered successively with coarse sand layers of 1 cm, 2 cm, 3 cm, 4 cm, 5 cm, and 6 cm. The lower part of the Mariotte bottle was connected to the soil column via a plastic tube to ensure a continuous water supply. The water level in the Mariotte bottle was maintained at 10 cm. The experiment included a control group and a brine evaporation group. The brine solution in the brine soil column was 4 mol/L NaCl. The control group used deionized water. Each group was established with six distinct sand mulching thickness treatments: 1 cm, 2 cm, 3 cm, 4 cm, 5 cm, and 6 cm. For each sand mulching thickness, the brine group comprised 12 replicate soil columns, while the control group included one soil column. The experiment lasted 13 days. A completely randomized design was implemented, with evaporation measurements taken concurrently for all soil columns under identical environmental conditions.
During the experiment, temperature and humidity variations were recorded using a temperature and humidity sensor (Vaisala, Helsinki, Finland) and a data logger (Campbell Scientific Inc., Logan, UT, USA). Throughout the experiment, the average daily indoor temperature was 23 °C, with relative humidity approximately 30%.

2.3. Data Acquisition and Processing

For each evaporation unit, one brine evaporation column and one control soil column were placed separately on an electronic balance connected to a computer (SHINKO, Tokyo, Japan, accuracy 0.01 g, maximum capacity 10 kg), measuring soil moisture evaporation (at a frequency of once per hour), with data automatically stored in the computer. The collected soil moisture evaporation data were organized using Excel 2024, then analyzed and graphed using Origin 2024b and SPSS Statistics 27 to assess the effect of sand mulching thickness on the daily and cumulative evaporation rates of the soil columns.
To accurately document the patterns of salt crust formation on the surface of the brine soil column, a high-definition camera (12-megapixel) was installed above the brine soil column. It automatically captures images of the soil column surface hourly, storing the photographs on a computer to record changes in the salt crust on the surface of the brine soil column. To observe the growth process of salt crystals in soil surface pores, a vertical microscope was placed above the brine soil column, and the growth of salt crystals at a fixed position was observed daily. Process the image using Adobe Photoshop 2020 to extract the SCC on the surface of the soil columns.
The effect of salt crust on soil moisture evaporation is calculated using the following formula:
E r = E c E s
R s = E s / E c 1 × 100 %
where E r represents the amount by which brine inhibits soil moisture evaporation, E c denotes the amount of evaporation (daily or hourly) from the control soil column, E s is the amount of evaporation (daily or hourly) from the brine soil column, R s is the rate of brine effect on soil moisture evaporation (When R s > 0 , it is the promotion of evaporation rate; R s < 0 , it is the inhibition of evaporation rate).

3. Results

3.1. Soil Moisture Evaporation

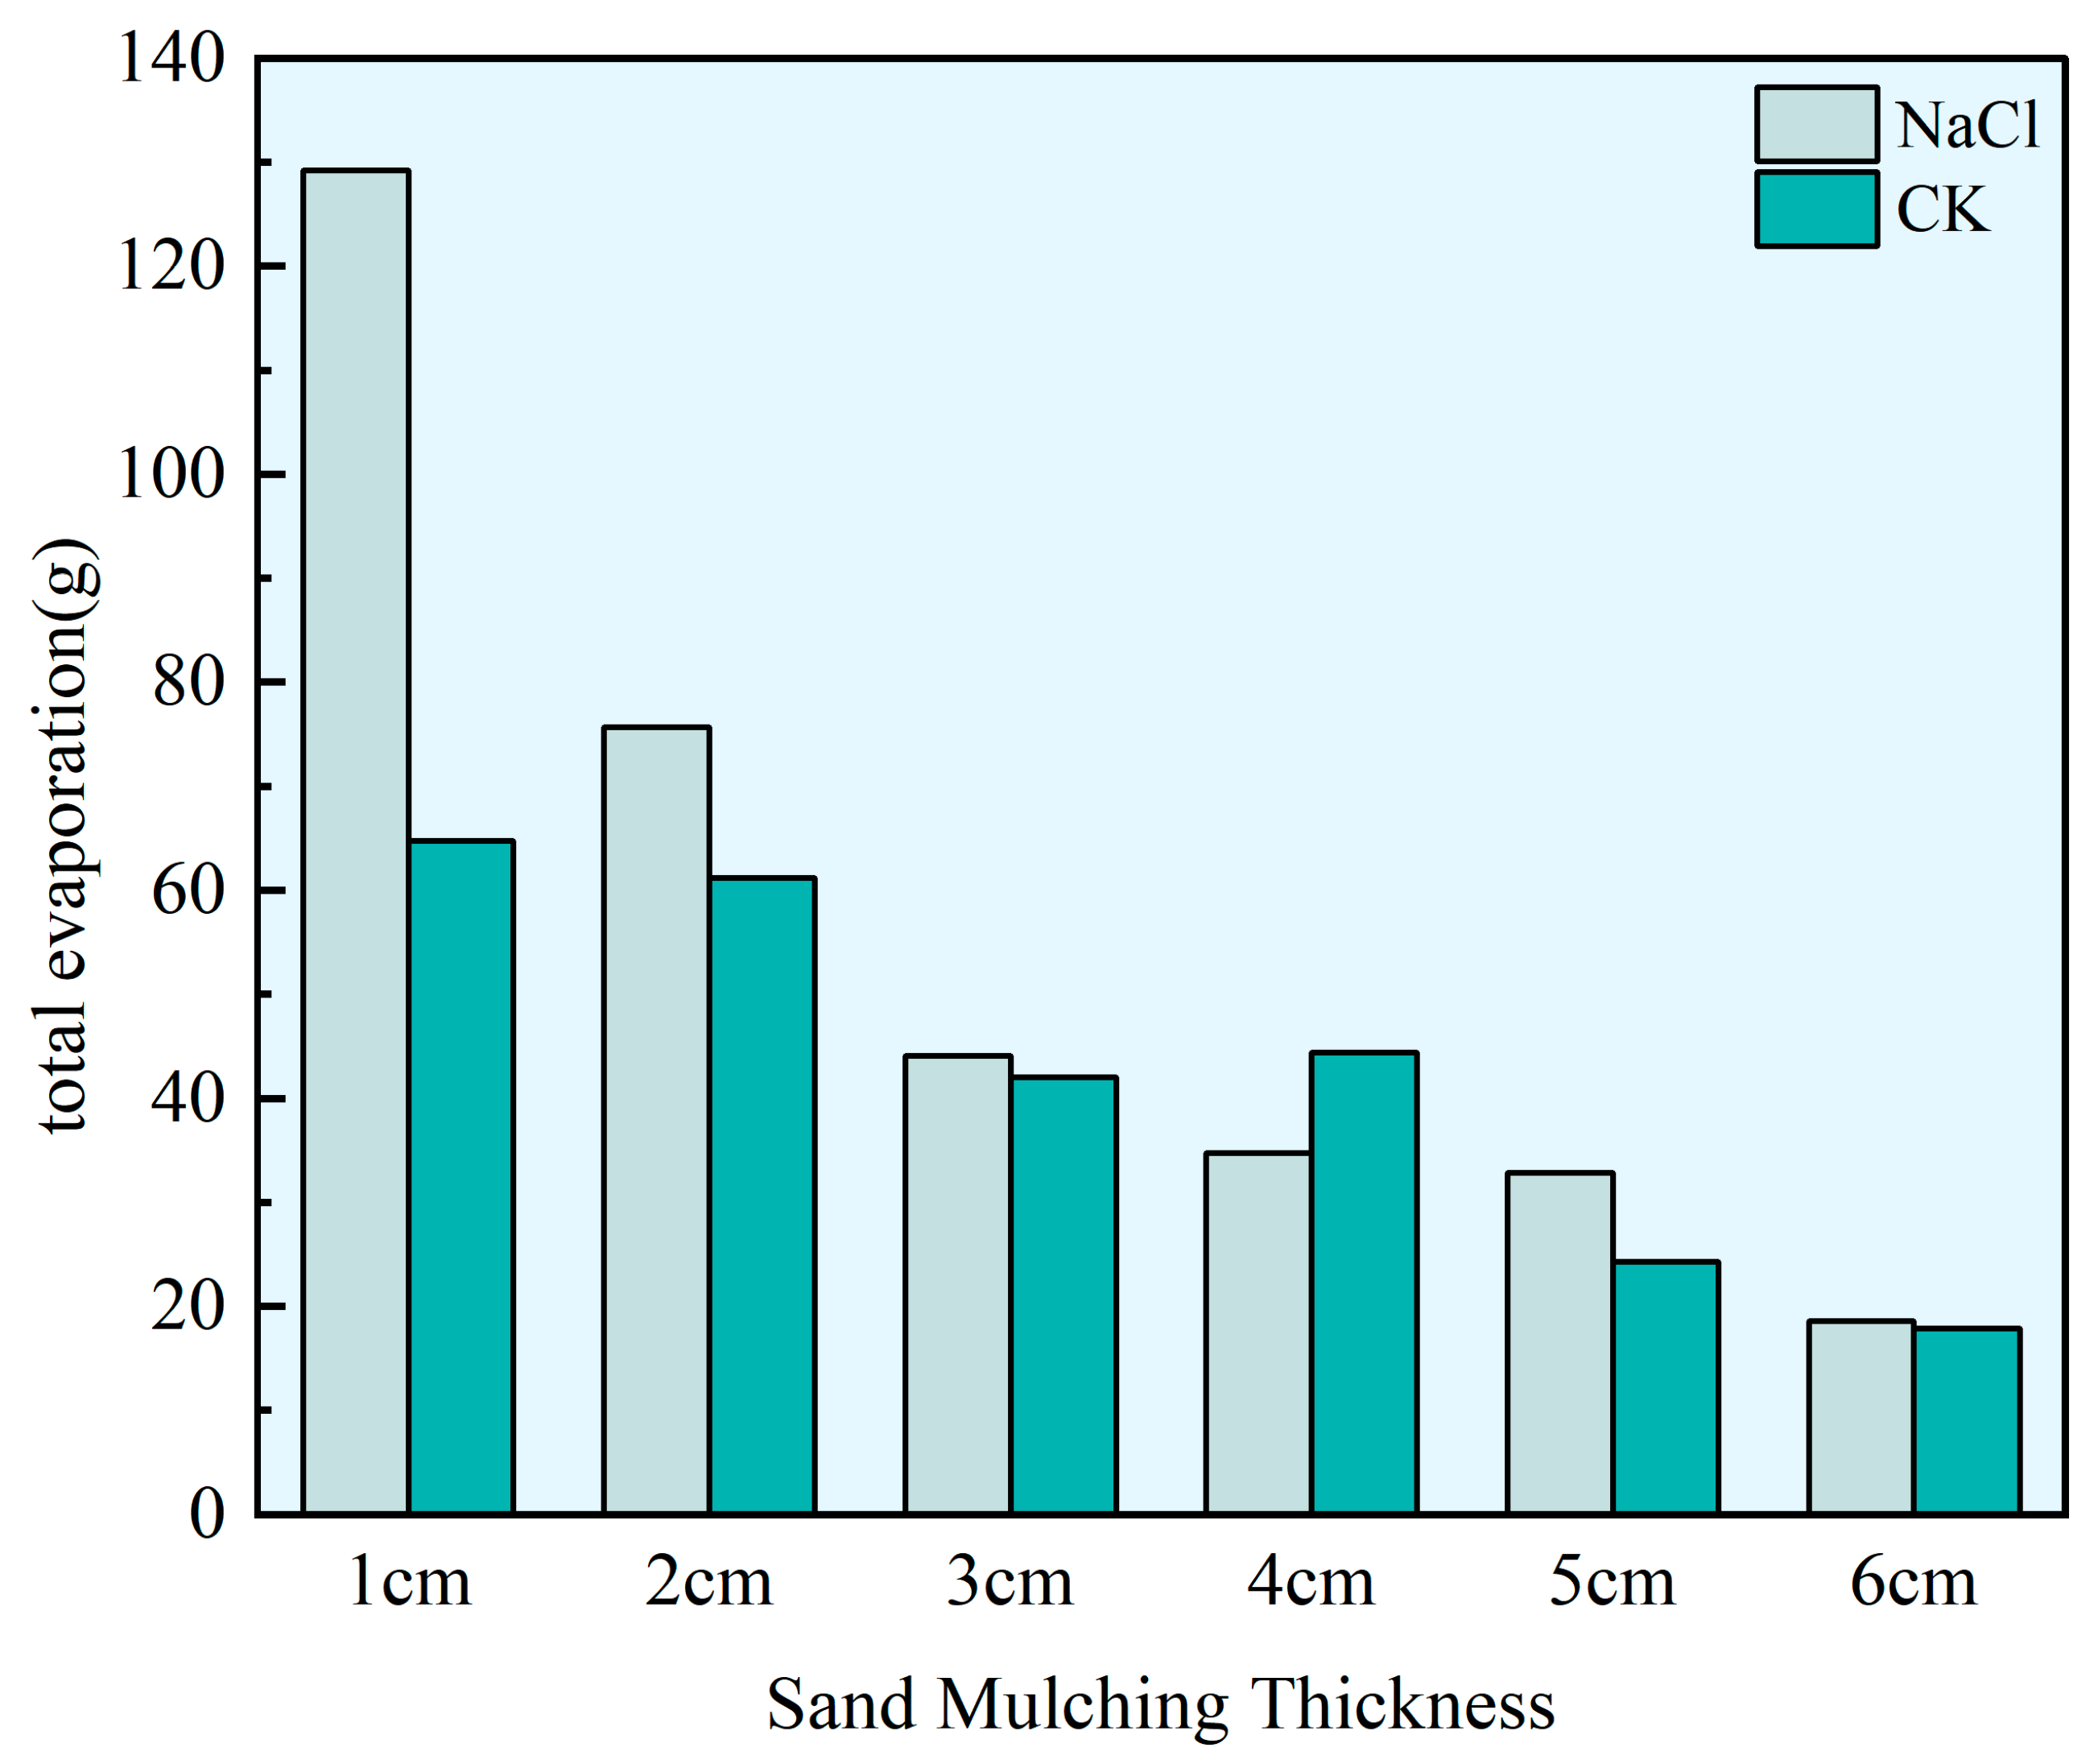
Soil surface sand mulching exhibits significant water retention properties and can significantly reduce soil moisture evaporation. The total evaporation of soil water from both deionized water and brine soil columns gradually decreased with the increase in the thickness of surface sand mulching, and the total evaporation of brine water from the soil columns of each treatment is shown in Figure 2. The total evaporation of the deionized water soil column under 1 cm sand mulching thickness was (129.22 g). When the sand mulching thickness increased to 6 cm, the total evaporation decreased to 18.61 g, a decline reached 85.6% (approximately 6.9 times). The decrease in total evaporation with increasing sand mulching thickness was not uniform; the rate of reduction in total evaporation for the deionized water soil column was fastest when the sand mulching thickness increased from 1 cm to 2 cm. Under identical conditions, the total evaporation of the brine soil column decreased from 64.74 g at 1 cm to 17.85 g at 6 cm, resulting in a decline reached 72.4% (approximately 2.6 times). The rate of decrease in total evaporation from the brine soil column was most rapid when the sand mulching thickness increased from 4 cm to 5 cm. Comparing the two soil columns under the same sand mulching thickness, the total evaporation of the deionized water soil column was always higher than that of brine soil column, except for the 4 cm sand mulching thickness, the average total evaporation of deionized water soil column was (55.85 g), and the average total evaporation of brine soil column was (42.42 g). At a 4 cm sand mulching thickness, the total evaporation of the brine soil column (44.42 g) was higher than that of the deionized water soil column (34.71 g), and the difference between them was 9.71 g. The difference in total evaporation between the deionized water soil column and the brine soil column decreases dramatically with increasing sand mulching thickness: from 64.48 g for 1 cm sand mulching to 0.76 g for 6 cm sand mulching. Meanwhile, the evaporation fluctuations of the brine soil columns themselves tend to stabilize under thick sand mulching, with total evaporation reaching its lowest at 6 cm of sand mulching.
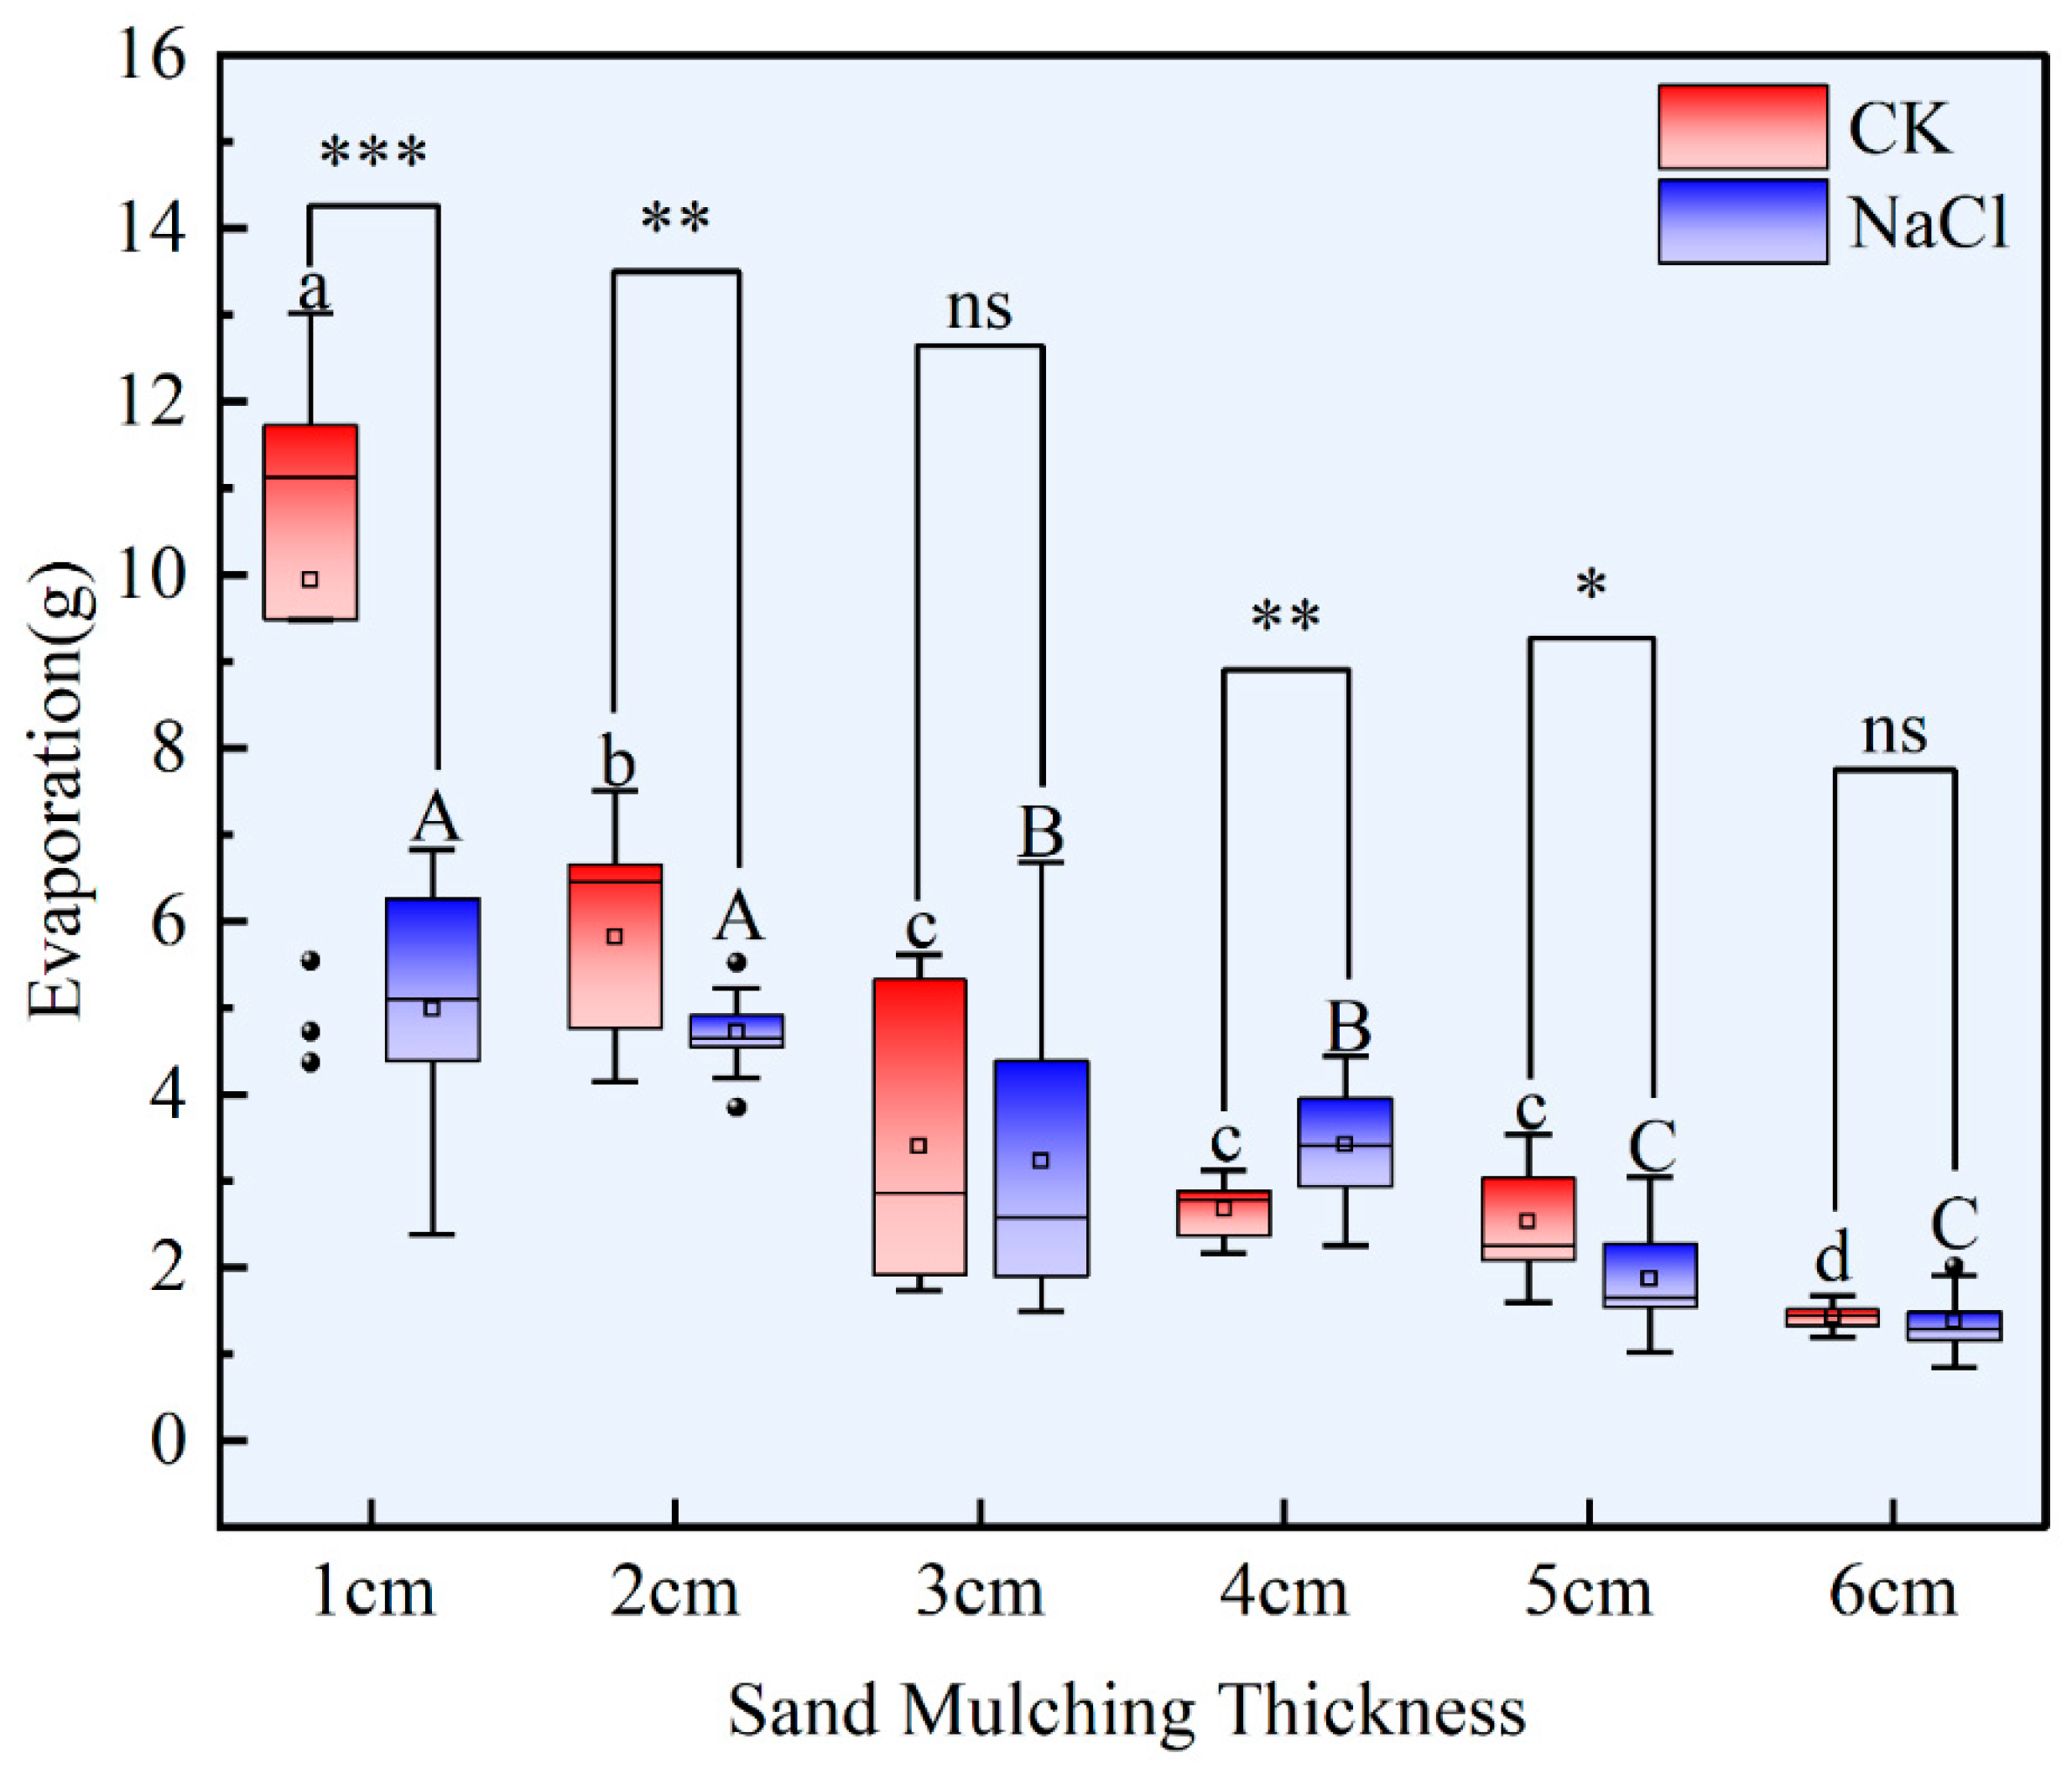
Sand mulching the soil surface can significantly reduce the rate of soil moisture evaporation. Daily evaporation of brine soil columns and deionized water soil columns treated with different sand mulching thicknesses. As shown in Figure 3. As the thickness of the sand mulching increased, the daily evaporation of both soil columns showed a decreasing trend; however, the daily evaporation of the brine soil column exhibited significant differences compared to that of the deionized water soil column. Except for the 4 cm sand mulching thickness, the median daily evaporation of the brine soil column was consistently lower than that of the deionized water soil column; the distribution of daily evaporation data of the brine soil column was obviously more concentrated, and the evaporation process was relatively more stable. At 1 cm sand mulching, the average daily evaporation of the deionized water soil column (9.94 g/d) and the brine soil column (4.98 g/d), the difference between the two groups was (4.96 g/d), and the difference between the two groups reached a highly significant level (p < 0.001). At 2 cm of sand mulching, the average daily evaporation of the deionized water soil column decreased significantly (5.82 g/d), narrowing the gap with the brine soil column (4.71 g/d). The difference between the two groups remained significant (p < 0.01), but the daily evaporation data for the brine soil column are more concentrated. At a sand mulching thickness of 3 cm, the daily evaporation of the two soil columns was further reduced. The difference between the daily evaporation of the deionized water soil column and that of the brine soil column was not significant (ns), and the two groups of daily evaporation tended to be the same. The effect of brine on the daily evaporation was weakened. However, the distribution of the data on the daily evaporation of the deionized water soil column was relatively dispersed with greater variability. When the sand mulching thickness was 4 cm, the average daily evaporation of the brine soil column (3.42 g/d) was greater than that of the deionized water soil column (2.67 g/d). The median of the brine soil column was higher than that of the deionized water soil column, and the difference between the two groups reached the significance level (p < 0.01), at which time the distribution of the daily evaporation data of the brine soil column was relatively scattered. At 5 cm sand mulching, the daily evaporation of the two groups decreased slowly. The data distribution was more concentrated, and the average daily evaporation of the deionized water soil column (2.52 g/d) was greater than that of the brine soil column (1.87 g/d). The difference between the two groups reached a significant level (p < 0.05). When the sand mulching thickness eventually reaches 6 cm, the daily evaporation is lower in both groups. The data distribution is very concentrated with weak variability; the difference in daily evaporation between the deionized water soil column and the brine soil column is minimal, the medians of the two groups were extremely close, and the difference between the two groups was not significant (ns).

3.2. The Effect of Salinity on Soil Water Evaporation Rate

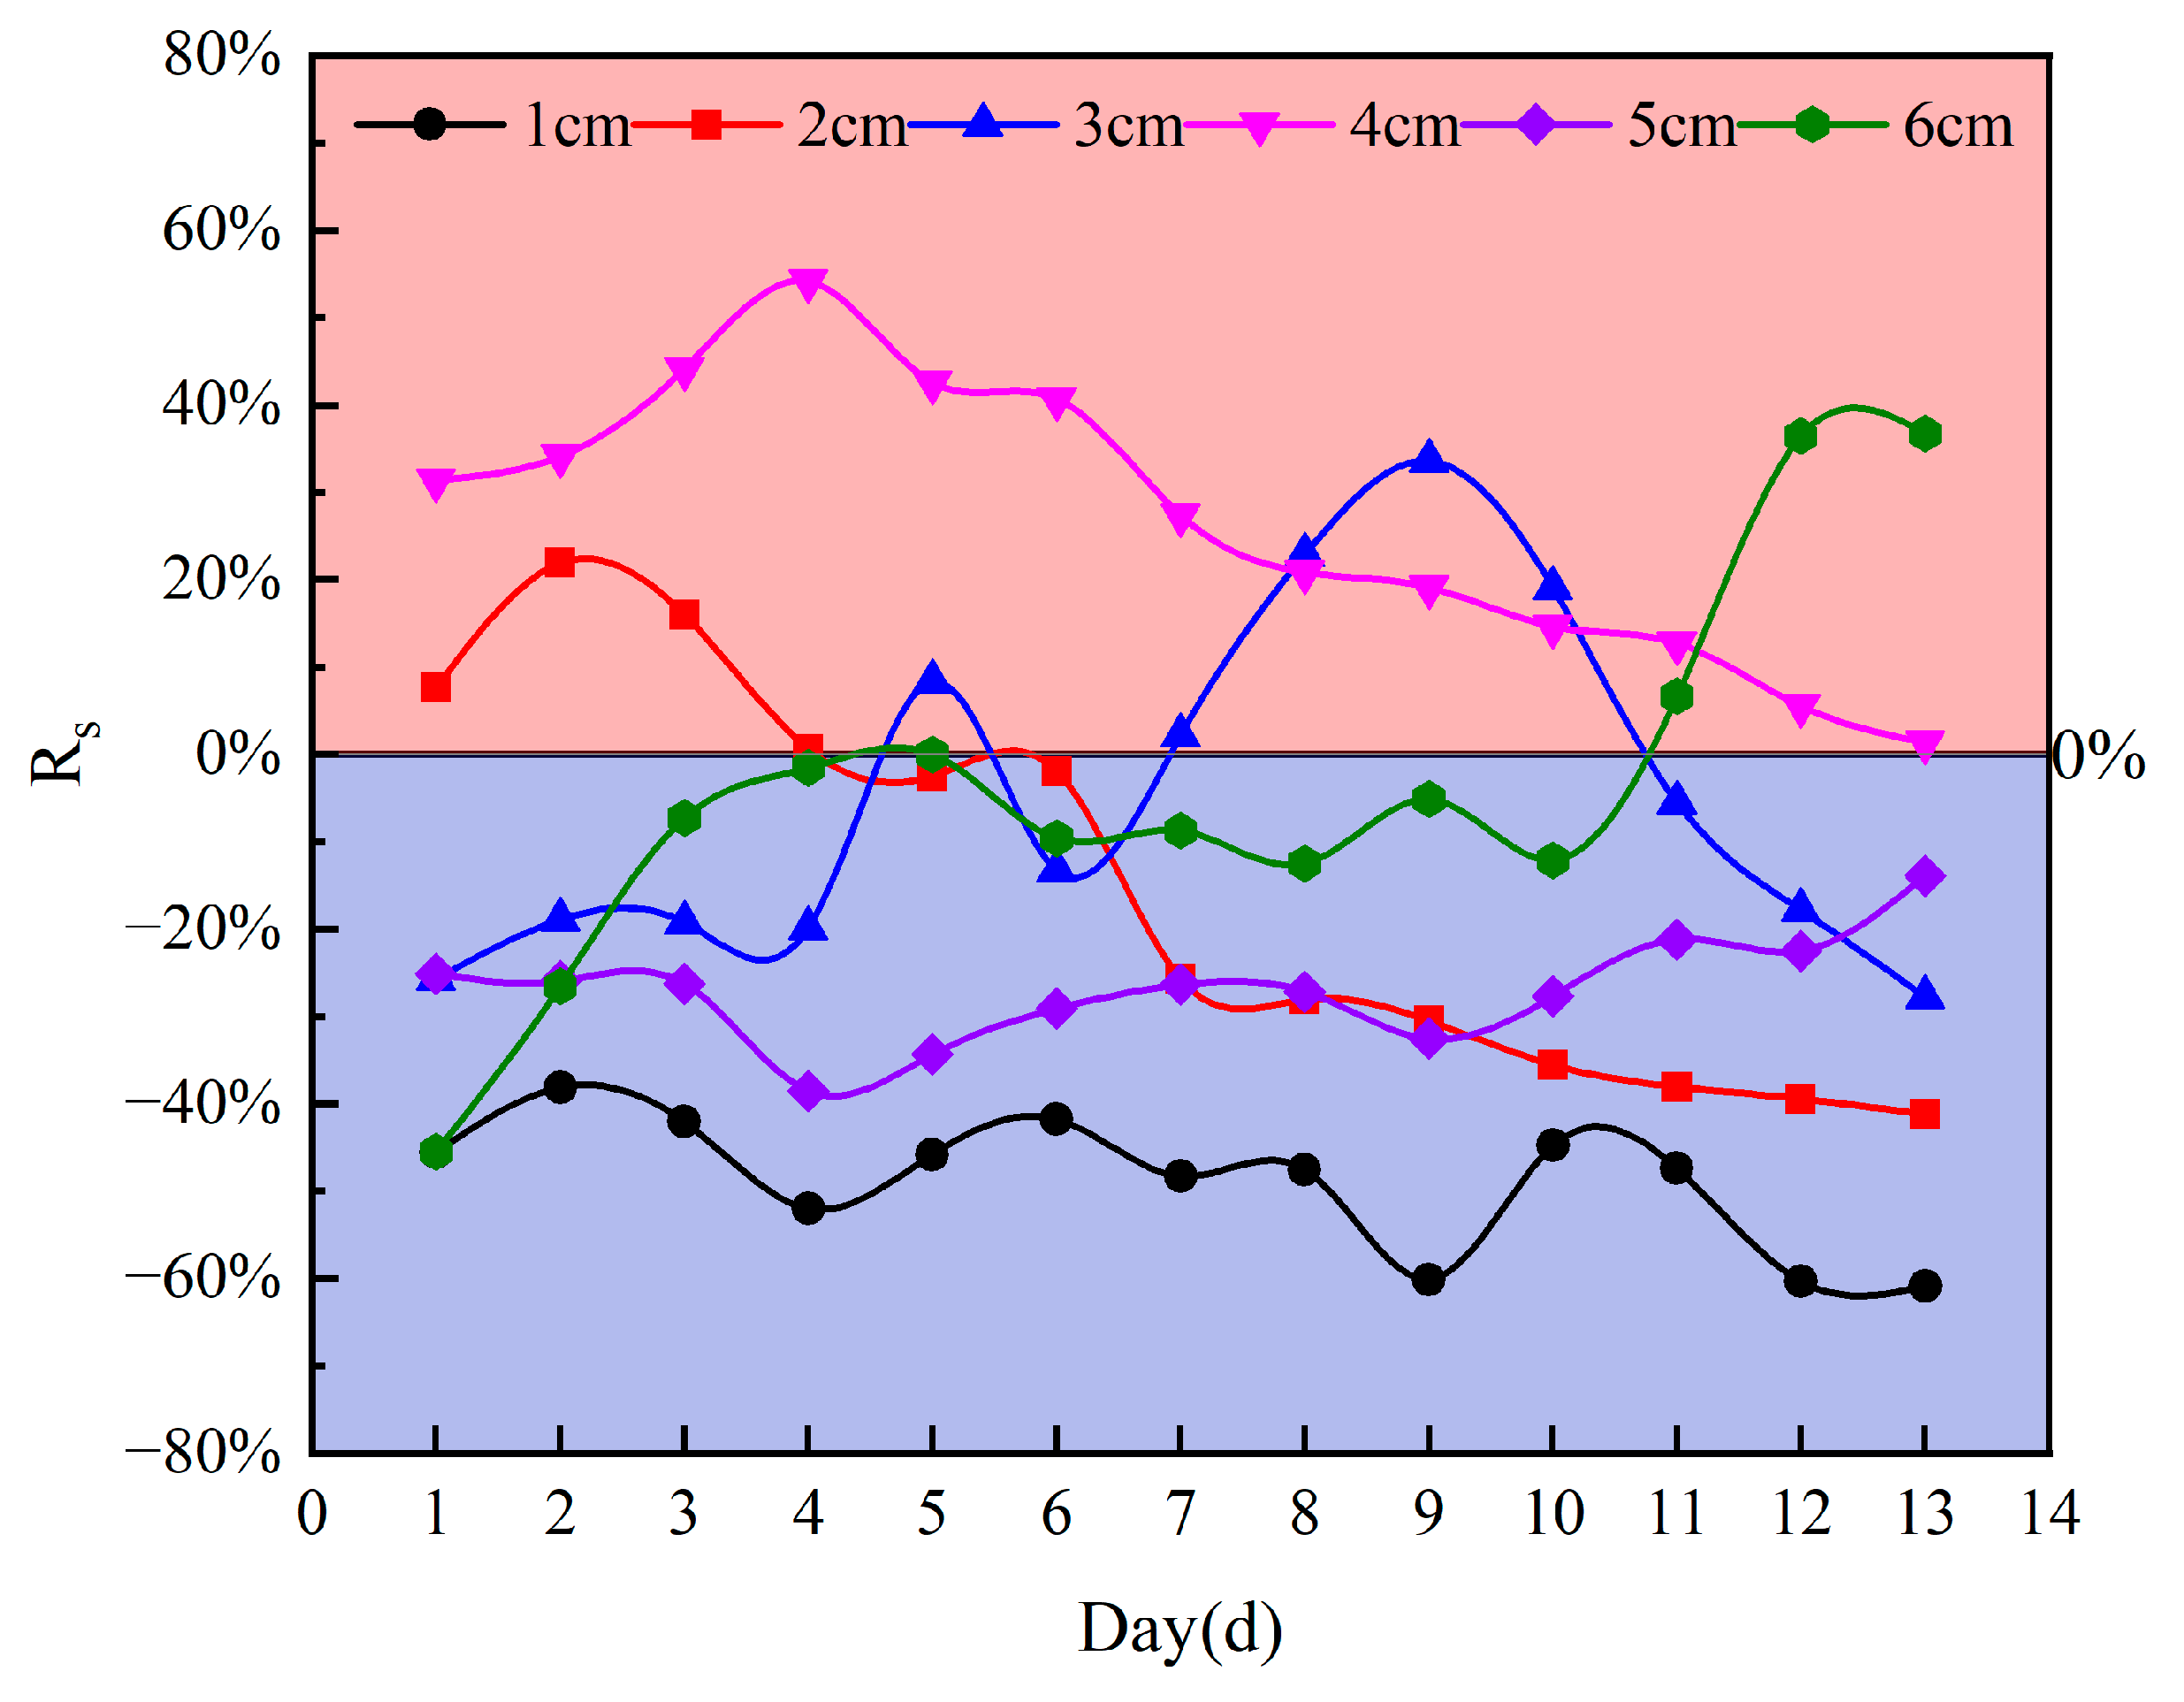
Under sand mulching conditions, salinity sometimes inhibited and sometimes promoted soil moisture evaporation, and the results are shown in Figure 4. At a sand mulching thickness of 1 cm, the salinity inhibited water evaporation throughout the evaporation period, with a slight fluctuating trend in the inhibition rate. The highest inhibition rate (60.91%) was observed at the end of the experiment on day 13. At a sand mulching thickness of 2 cm, evaporation was promoted during days 1–3, starting on day 4, evaporation inhibition persisted until the experiment concluded, with a maximum inhibition rate of 41.22%. At a sand mulching thickness of 3 cm, both inhibition and promotion rates fluctuated significantly throughout the evaporation period, exhibiting two peaks of promoted evaporation (8.33% and 33.61%). Days 1–4 suppressed evaporation, Day 5 promoted evaporation, Day 6 suppressed evaporation, Days 7–10 promoted evaporation, followed by a gradual increase in suppression rate to 27.82%. At a sand mulching thickness of 4 cm, salinity promoted evaporation throughout the entire evaporation period, with the highest promotion rate occurring on Day 4 (54.15%) and the lowest on Day 13 (1.35%). At a sand mulching thickness of 5 cm, salinity inhibited water evaporation throughout the entire evaporation period. The overall inhibition rate at 5 cm sand mulching was lower than that at 1 cm sand mulching, but the fluctuation of the inhibition rate was smaller than that at 1 cm sand mulching. When the sand mulching thickness is 6 cm, the evaporation is inhibited from day 1 to 10, with the highest inhibition rate (45.51%) on day 1. On the 11th day, evaporation was promoted, and the rate of evaporation promotion increased sharply from 6.67% to 36.43%, and the rate of evaporation promotion was 36.73% at the end of the 13th day.

3.3. Salt Crust on the Surface of a Brine Soil Column

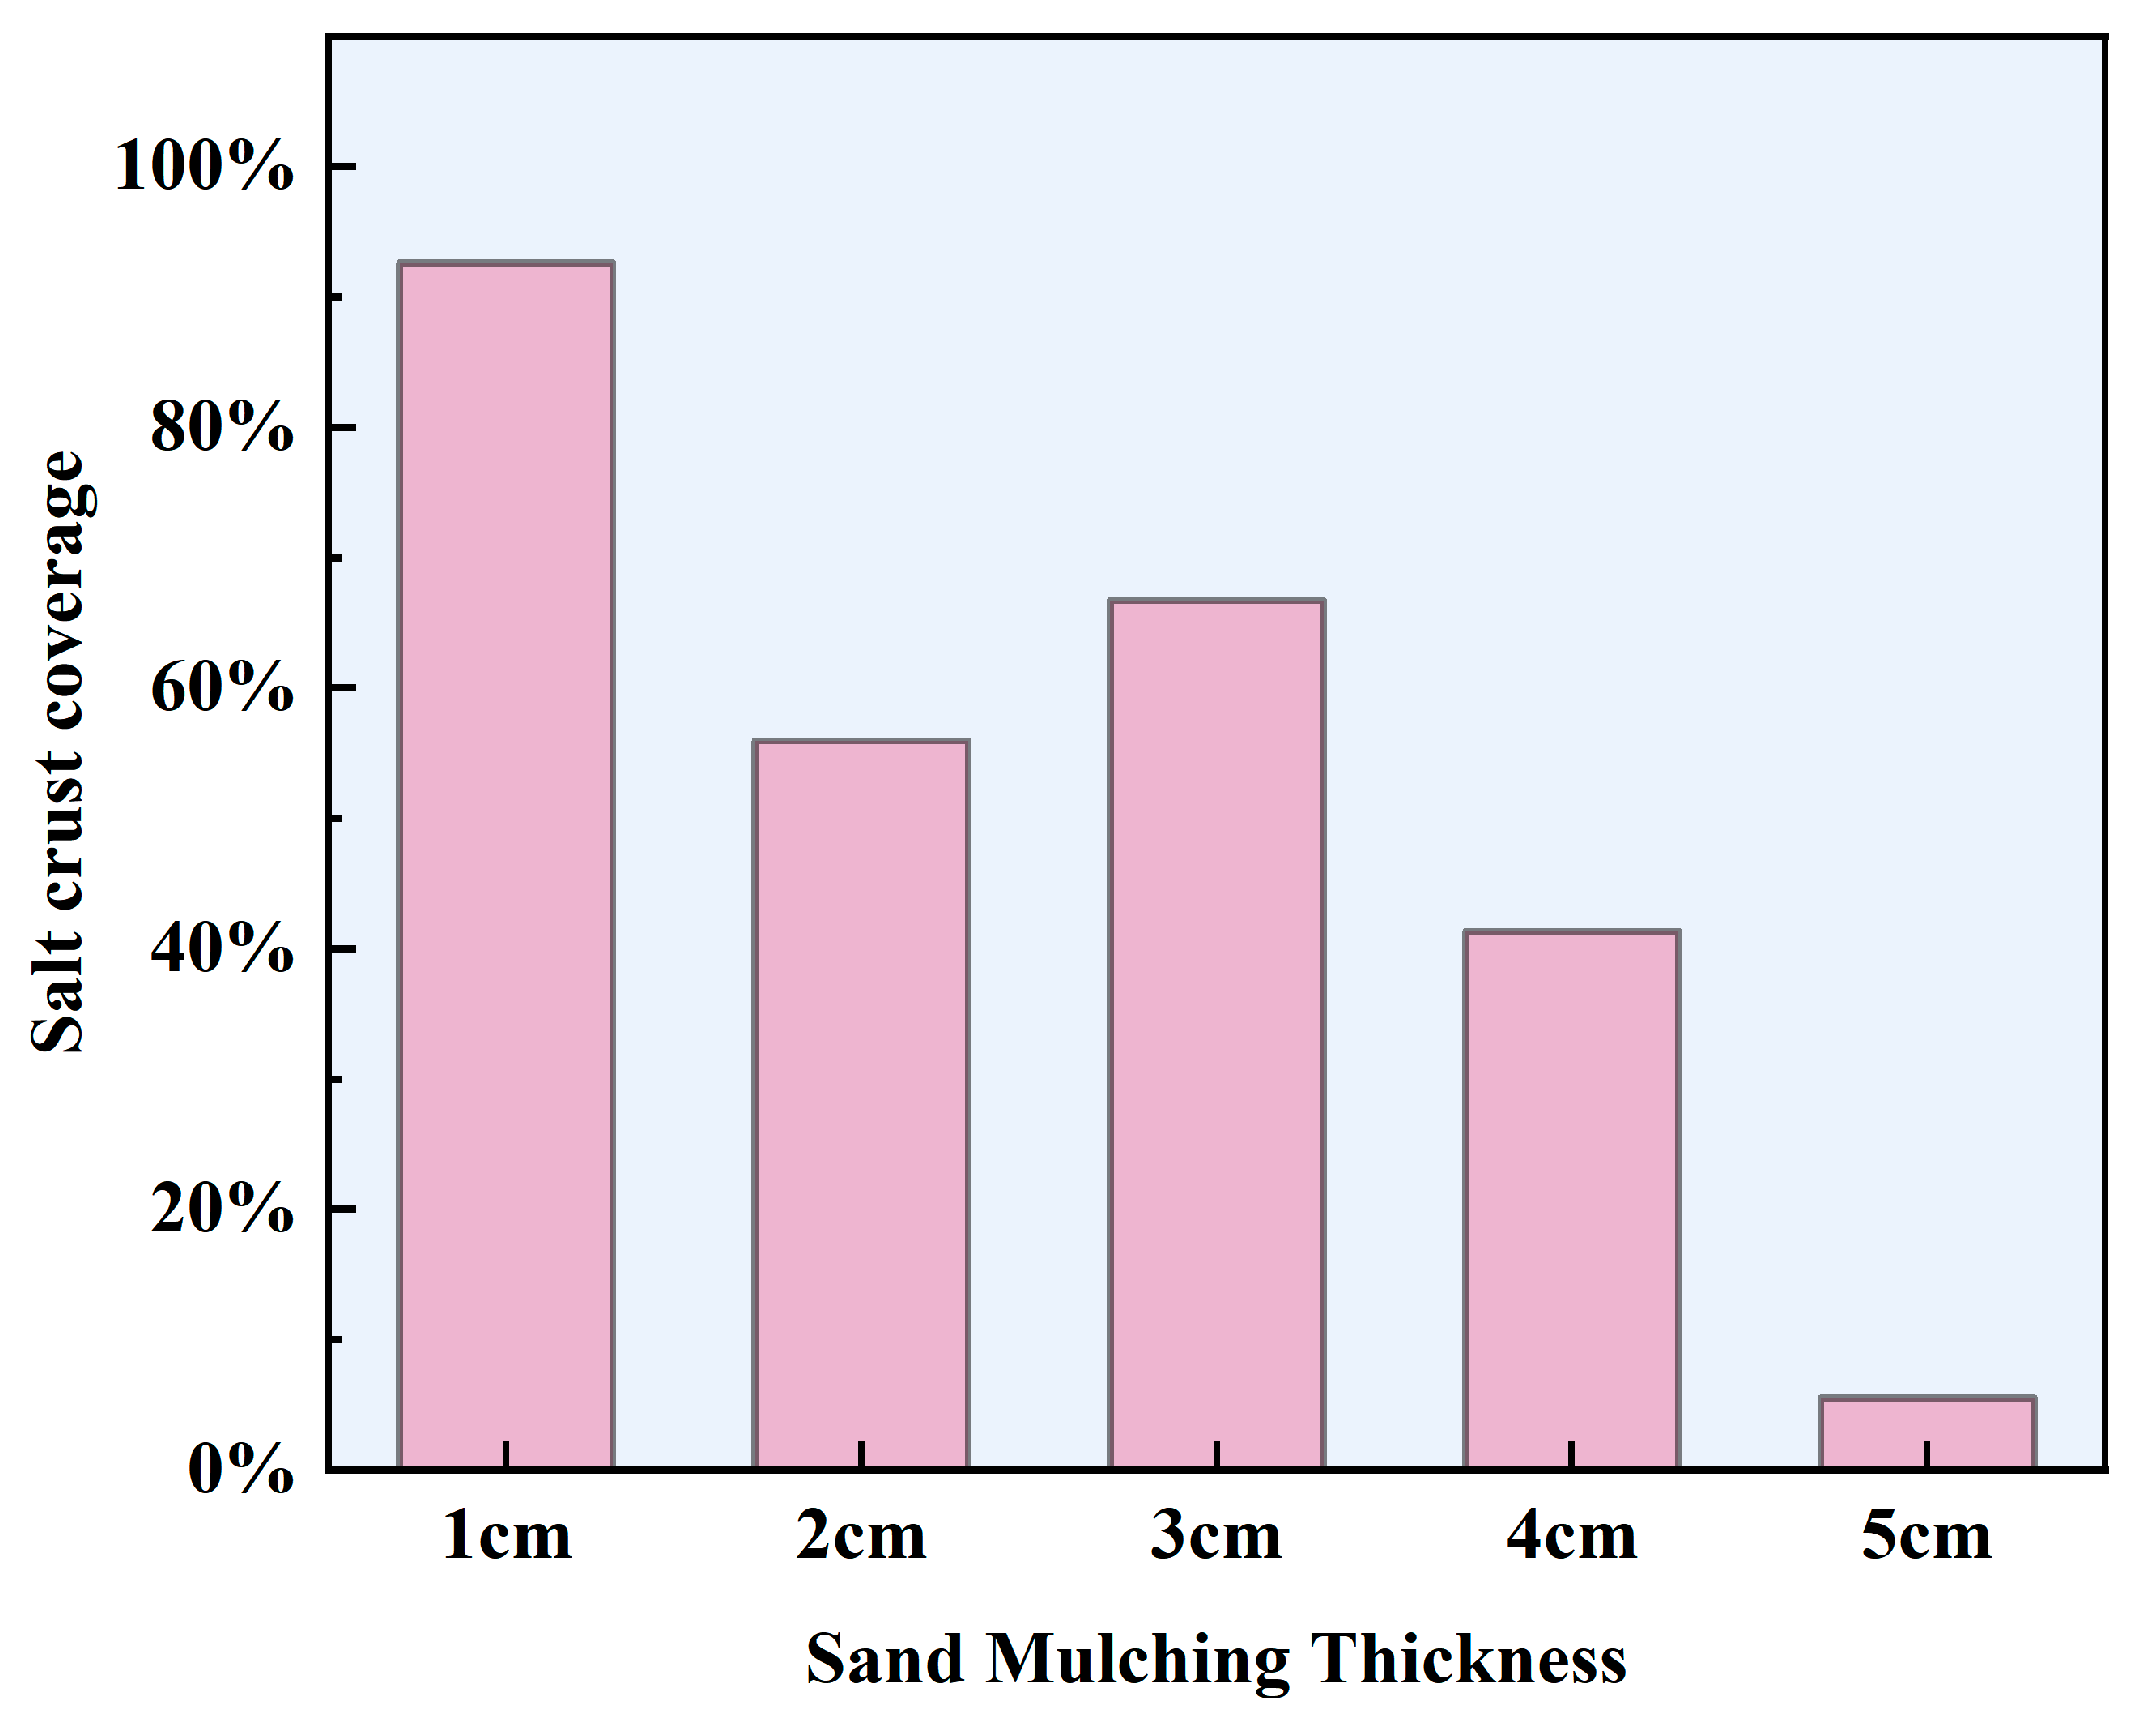
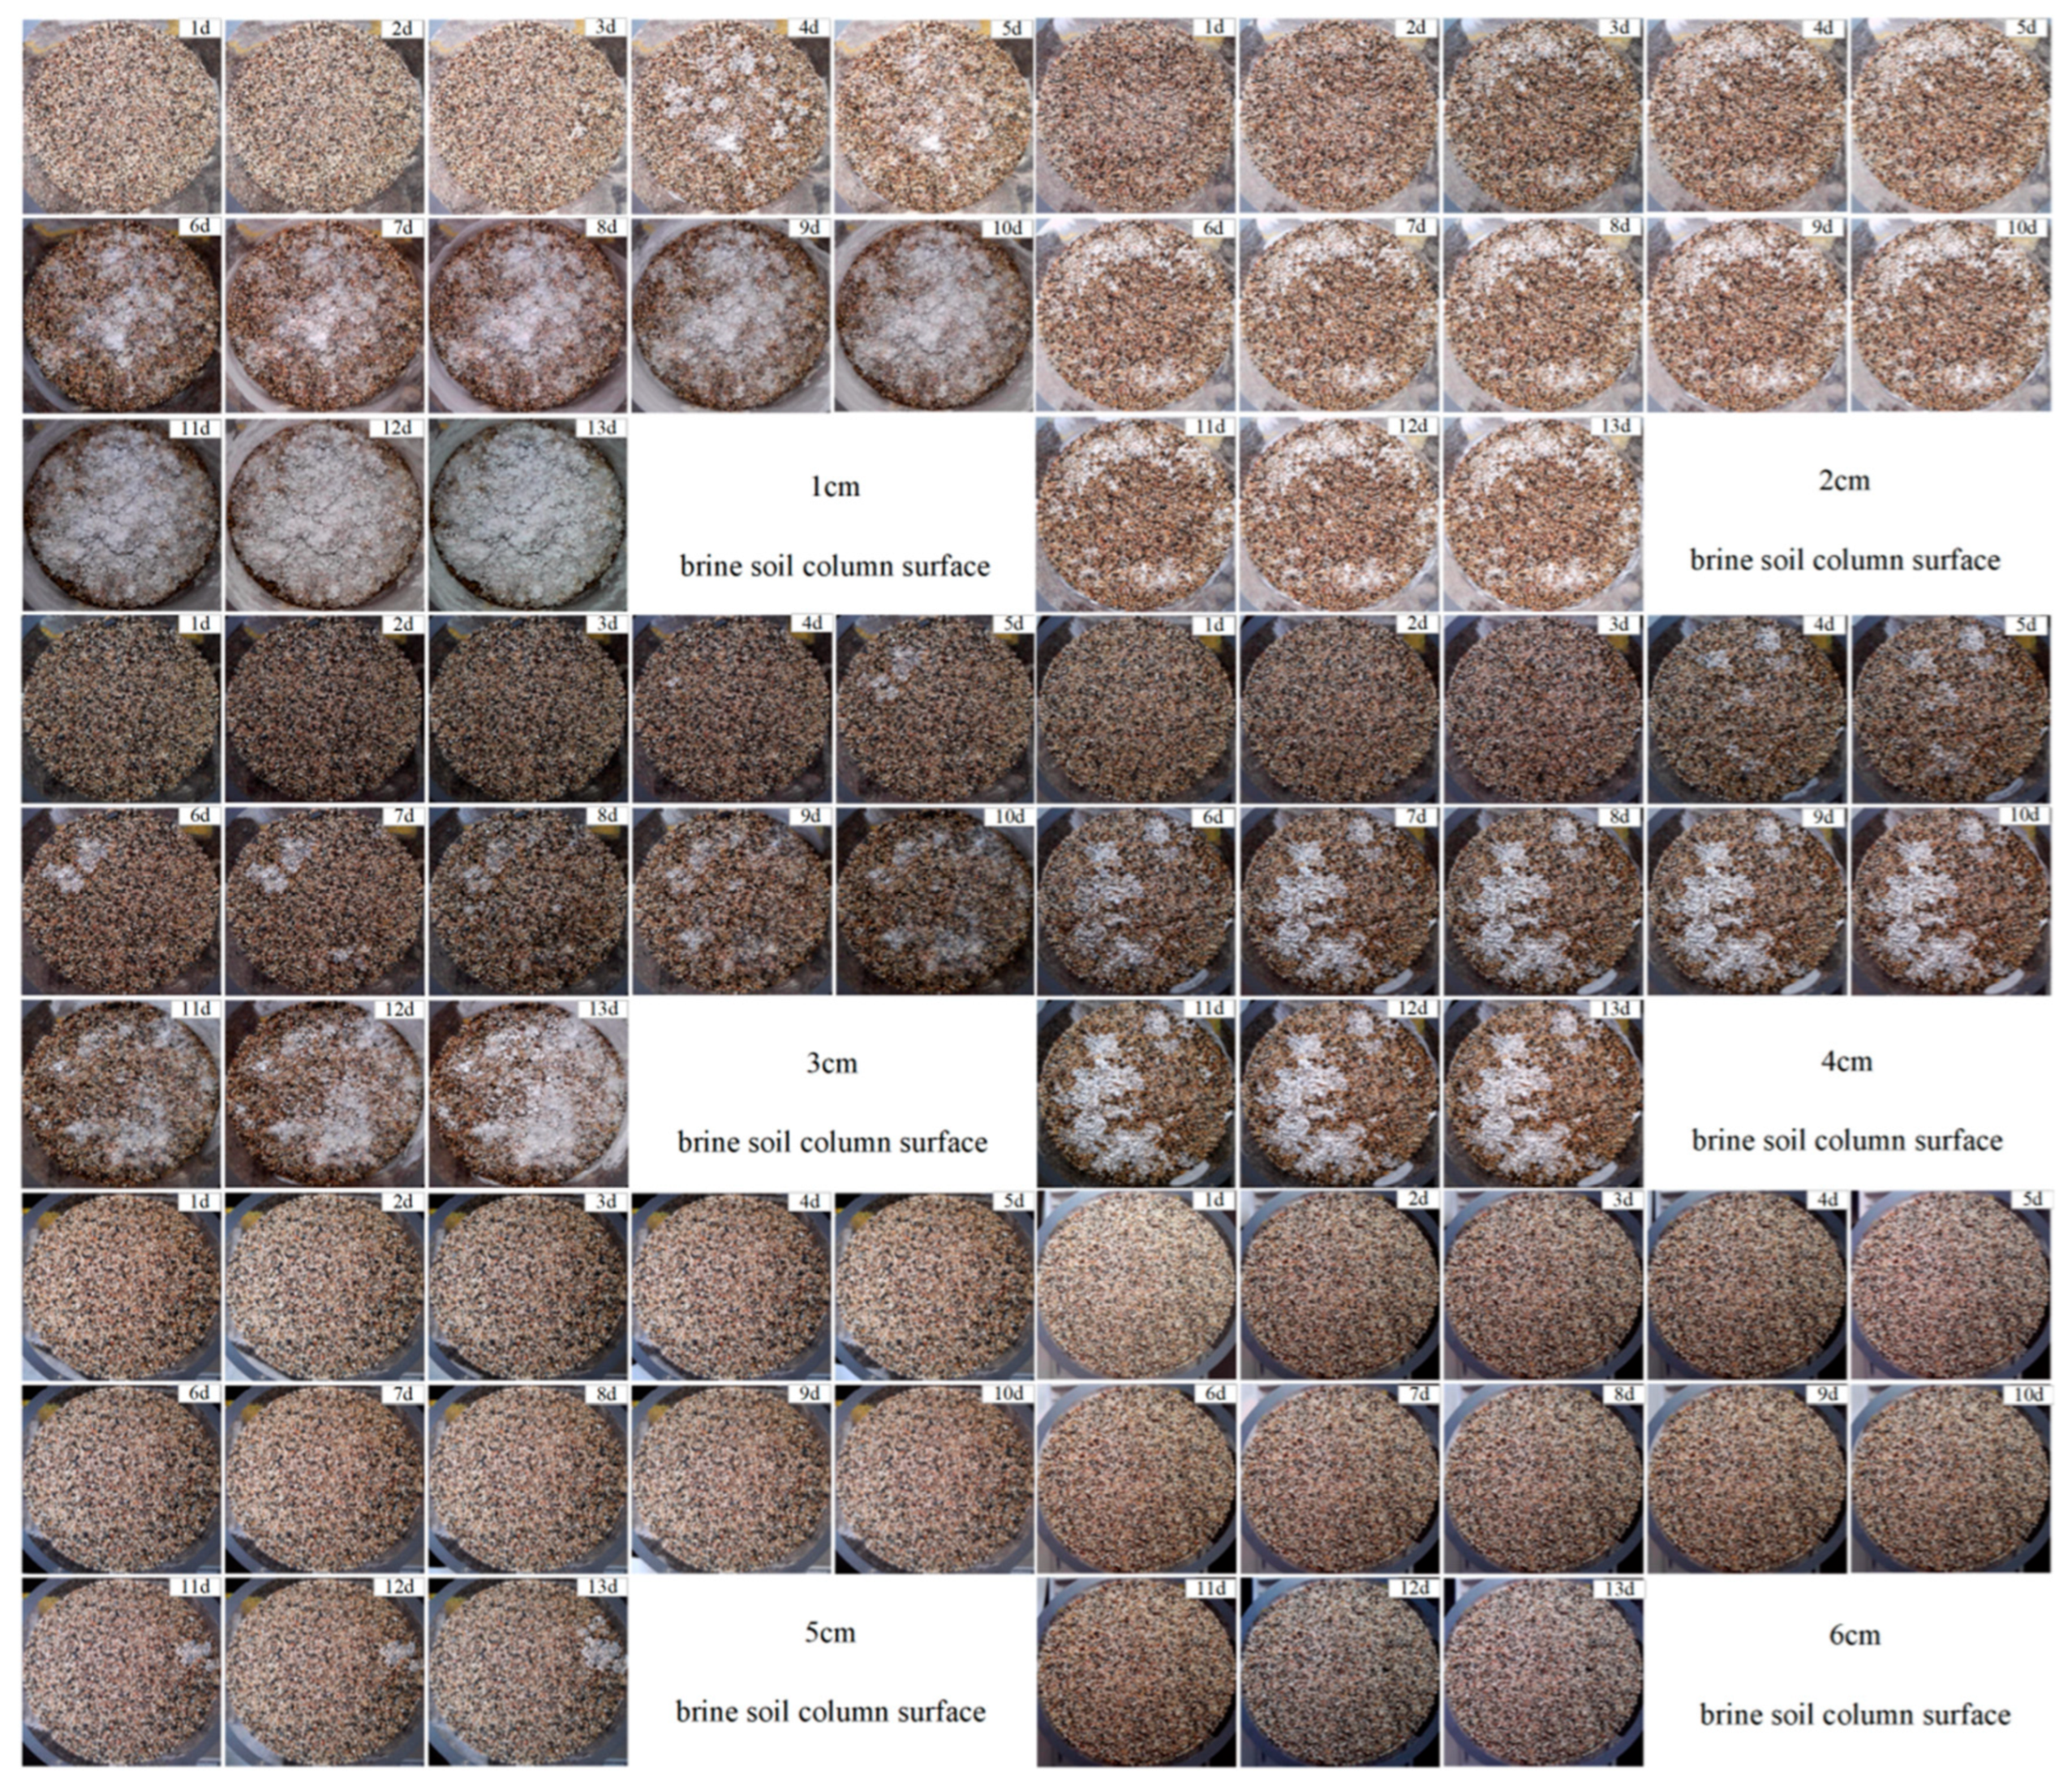
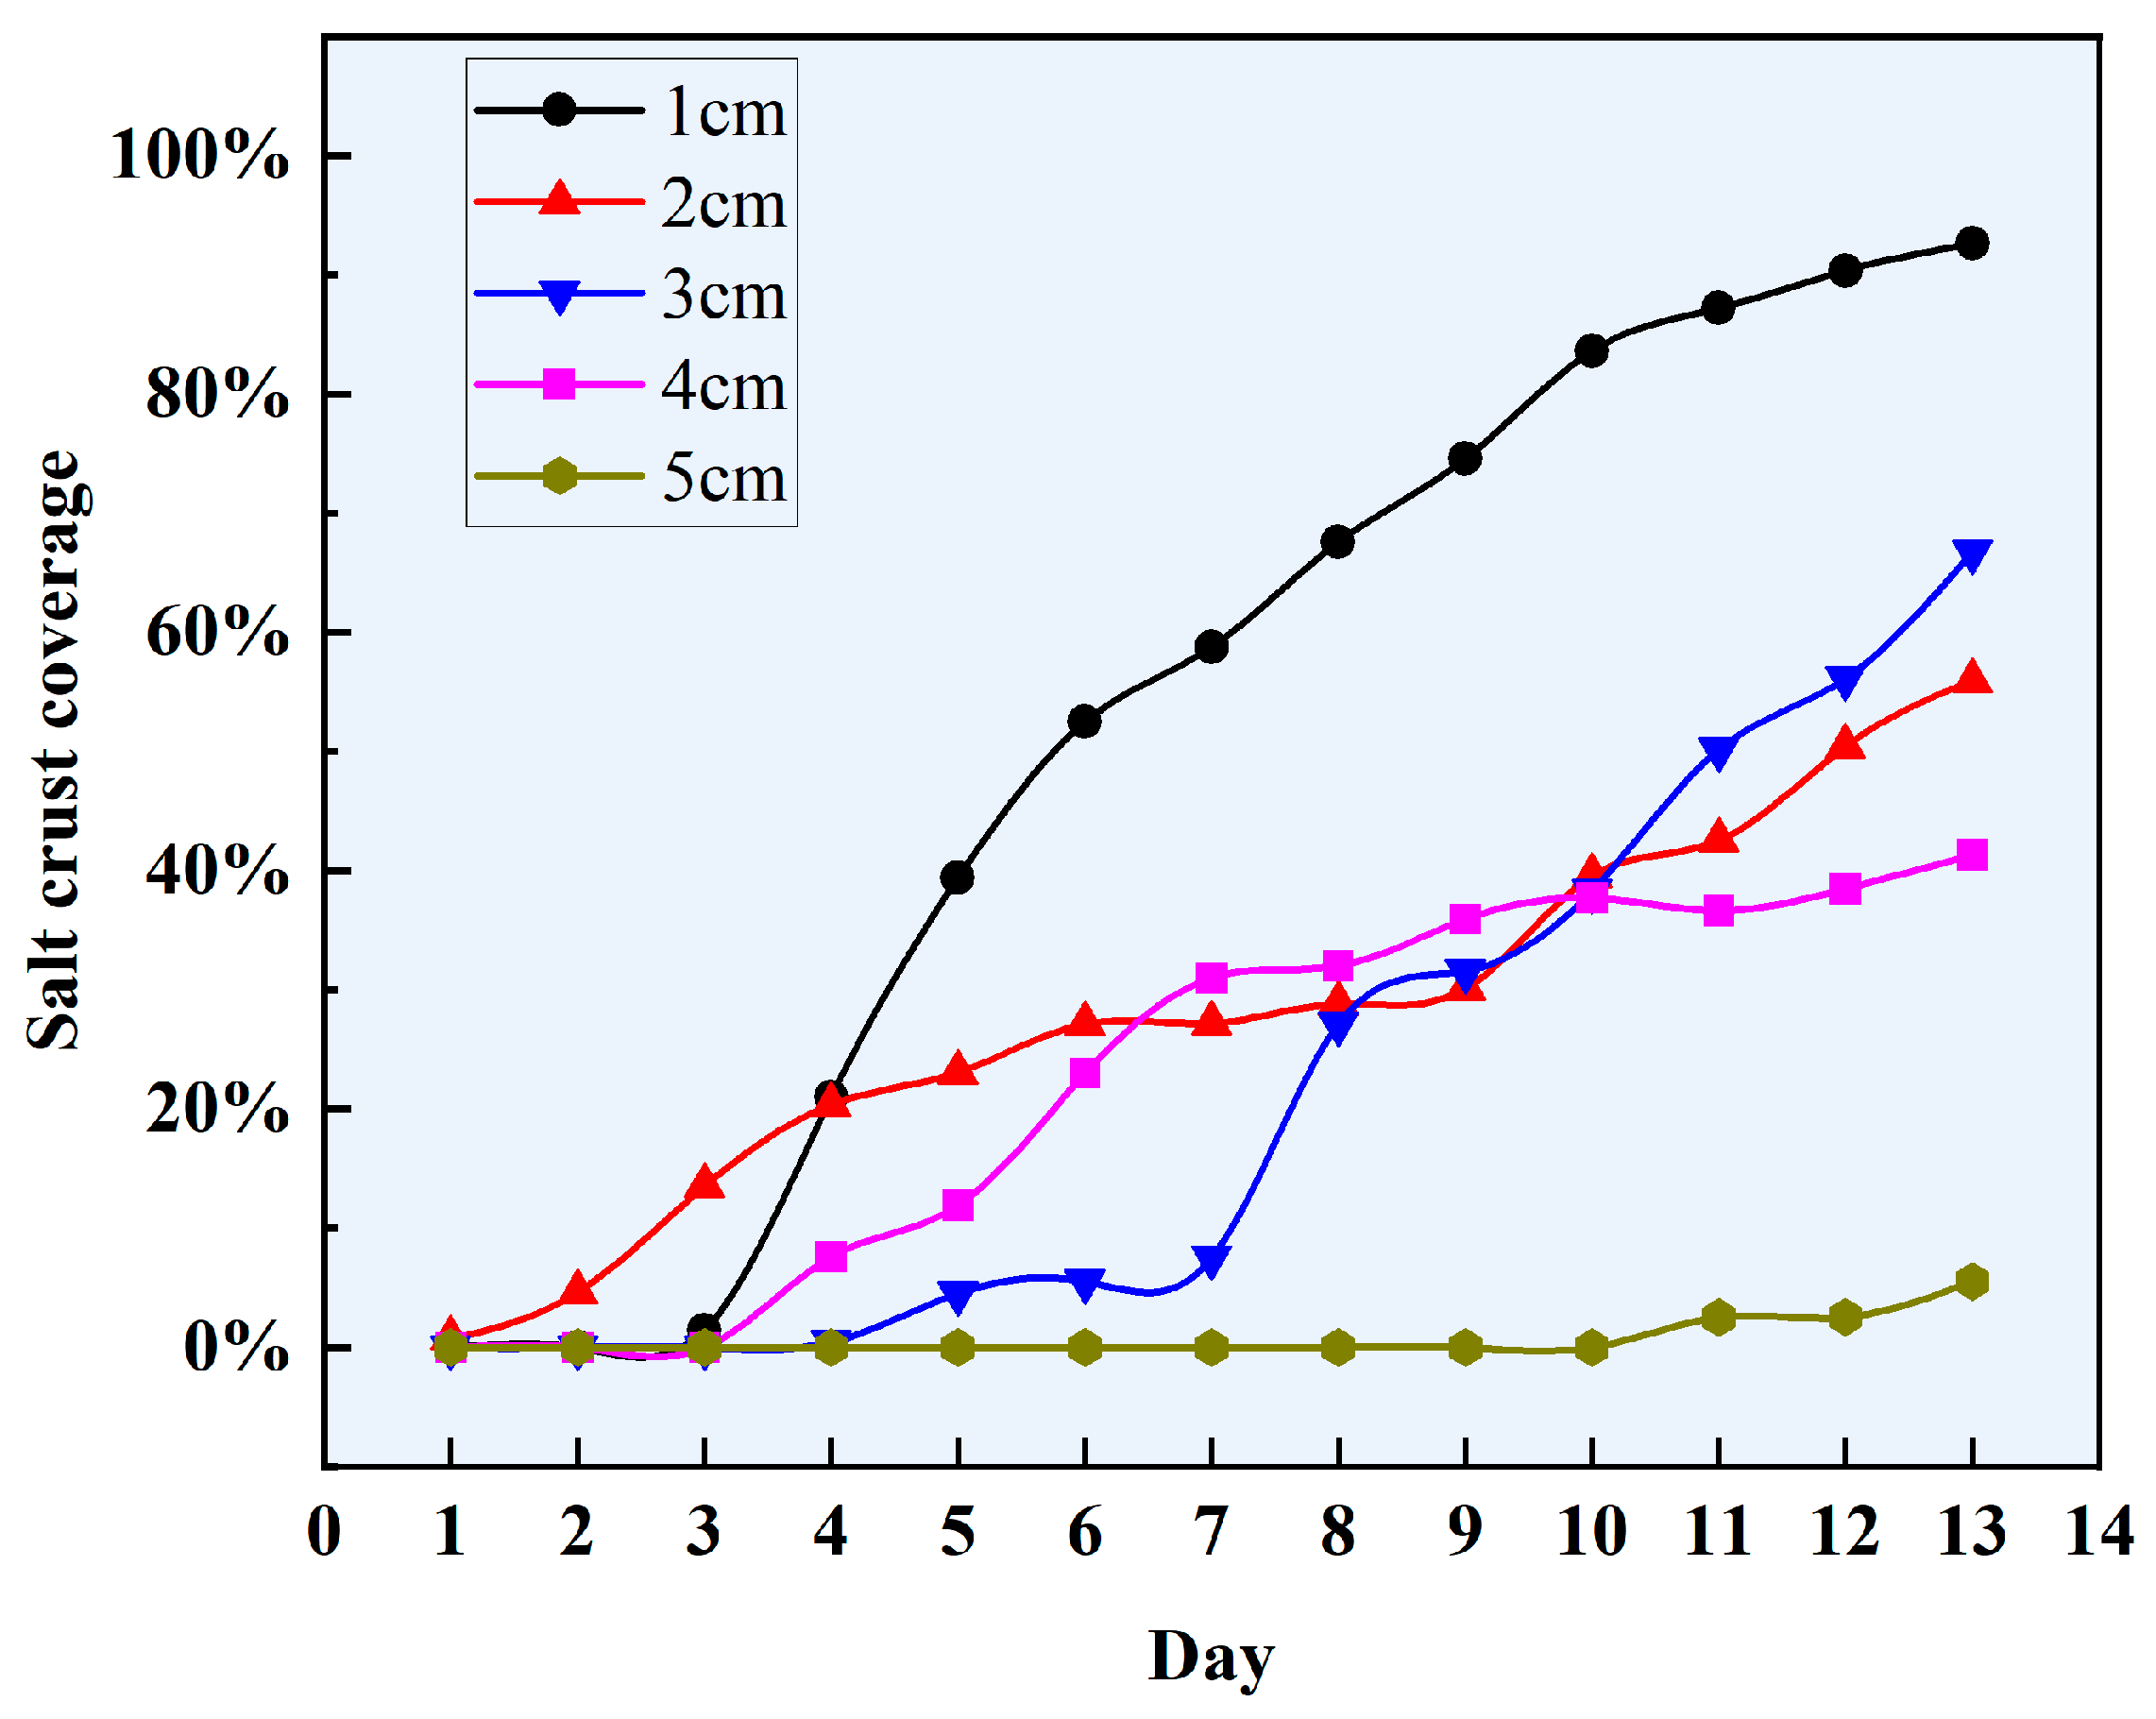
The salt crust on the surface of the brine soil column affects water evaporation from the column. To investigate the factors influencing water evaporation from the brine soil column, the salt crust on the soil column surface was photographed and observed, with measurements taken of its coverage and thickness. At the conclusion of the soil column evaporation test, the SCC on the soil column surface is shown in Figure 5. At the conclusion of evaporation in the brine soil columns, salt crusts were present across the surfaces of columns sand mulched with 1 cm to 5 cm, the SCC rates were as follows: 92.62% (1 cm sand mulching), 55.93% (2 cm sand mulching), 66.69% (3 cm sand mulching), 41.31% (4 cm sand mulching), and 5.52% (5 cm sand mulching). The thickness of the salt crust measured with calipers was approximately: 7.15 mm (1 cm sand mulching), 4.45 mm (2 cm sand mulching), 4.44 mm (3 cm sand mulching), 10.08 mm (4 cm sand mulching), and 9.16 mm (5 cm sand mulching).
Based on the salt crust photographs, further analyze the morphology of the salt crust on the surface of the soil column. When the sand mulching is 1 cm, a distinct crusty salt crust forms on the soil surface, covering the entire topsoil layer. The 2 cm sand mulching-formed crusty salt crust is not very pronounced, but it is more evident at the edges. At a sand mulching thickness of 3 cm, patchy salt crusts covered most of the soil surface. At a sand mulching thickness of 4 cm, larger patchy salt crusts formed on the soil surface, primarily distributed on the left side, with fewer crusts along the edges. At a sand mulching thickness of 5 cm, only a small area of patchy salt crust formed on the soil surface. At a sand mulching thickness of 6 cm, no salt crust formed on the soil surface.
To determine the effect of salt crust formation on water evaporation from the soil column, the formation process of the surface salt crust was recorded, as shown in Figure 6. At a sand mulching thickness of 1 cm, salt crystals began to precipitate from the edges of the soil columns in a dotted crystallization pattern starting on the third day; as evaporation continued, the salt crystals gradually expanded toward the center. By the eighth day, a crusty salt crust began to form, covering the entire soil surface. When the thickness of sand mulching was 2 cm, a moist salt solution appeared at the edge from the second day, and salt crystals were precipitated at the edge from the third day. Subsequently, the moist salt solution gradually lost water and formed white powdery crystals, which formed a crusty salt crust on the seventh day, and then there was no large-scale change in the salt crust on the soil surface. When the thickness of sand mulching was 3 cm, white dot-like crystals began to appear on the fourth day. The time for salt crystals to precipitate on the surface of the soil column was prolonged, and on the 10th day, the salt crust was roughly formed and began to accelerate the formation of a patchy salt crust. At a sand mulching thickness of 4 cm, salt crystals appeared on the surface on the fourth day, and salt patches were roughly formed on the seventh day. Then, the expansion of the salt crust slowed down, and a patchy salt crust was formed on the soil surface. At a sand mulching thickness of 5 cm, evaporation did not occur until the 11th day, when white powdery crystals appeared, and finally, a slight patchy salt crust was formed. At a sand mulching thickness of 6 cm, no salinity crystals appeared on the soil surface.

4. Discussion

4.1. The Effect of Sand Mulching on Soil Moisture Evaporation

This study clearly demonstrated the significant inhibitory effect of sand mulching as a physical barrier on soil moisture evaporation through evaporation experiments conducted on soil columns with six different sand mulching thicknesses. Experimental results indicate that as the thickness of the sand mulching increases, both the total evaporation, daily evaporation, and average evaporation rate of soil moisture show a significant decreasing trend, regardless of whether the soil column is saturated with brine (NaCl) or deionized water (CK). This finding confirms the effectiveness of sand mulching as a traditional water conservation measure in arid regions [20]. The sand mulching layer essentially increases the path length for water migration from the soil interior to the atmospheric interface. Water first passes through the soil matrix and sand mulching in liquid form (primarily via capillary action), then diffuses to the surface as vapor within the pores of the sand layer. The sand mulching increases the soil’s total evaporation resistance [21]. As the thickness of the sand mulching increases, the diffusion path for water vapor within the sand mulching pores lengthens, increasing diffusion resistance and consequently reducing the evaporation rate. This effect is particularly pronounced in the deionized water–soil column (Figure 3), where the evaporation rate drops sharply within the 1 cm to 3 cm sand mulching thickness range, reflecting the significant initial hindrance to water vapor diffusion by the newly added sand mulching layer. Beyond 3 cm, the decline slows, indicating that diffusion resistance has become the dominant factor. A coarser sand mulching layer can more effectively sever or significantly weaken the upward continuity of capillary action in the underlying soil [22]. At the soil-sand interface and within the sand layer, the pore structure and capillary forces undergo dramatic changes due to the significantly larger grain size of the sand particles (500–800 µm) compared to the underlying fine sand (100–200 µm). As the thickness of the sand mulching increases, liquid water cannot rapidly rise to the surface via capillary action, forcing the evaporation front to shift downward or causing moisture to primarily diffuse through the sand mulching’s pores as vapor to the surface. The migration pathway of moisture is blocked, leading to a significant decrease in evaporation.
In this experiment, the evaporation of deionized water from soil columns was more significantly affected by the thickness of the sand mulching. However, sand mulching can reduce soil evaporation rates [23]; the evaporation efficiency of brine is typically lower than that of deionized water [24], which has a higher evaporation rate. Shammiri and Oroud, from the perspective of water transport in saline soils, proposed that the solute potential induced by salts reduces soil evaporation [25,26]. Compared to solute-free soil, the presence of salts in soil reduces water evaporation [27], deionized water molecules contain no solutes that attract each other, resulting in a high activity coefficient that facilitates their escape from the liquid surface and diffusion into the surrounding environment. Conversely, in the brine evaporation group, dissolved salts increase the soil solute potential, enhancing water retention and inhibiting water molecule diffusion to the external environment, thereby suppressing soil moisture evaporation [28]. However, this study observed a highly intriguing phenomenon at a 4 cm sand mulching thickness: the total evaporation of brine exceeded that of deionized water (Figure 2), and the daily evaporation rate of brine was significantly higher than that of deionized water (p < 0.01) (Figure 3), at this point, brine actually promoted water evaporation (Figure 4), contradicting the conventional understanding that “salt inhibits evaporation”. Our in-depth analysis reveals that this anomalous phenomenon is closely related to the morphological transition of salt crusts induced by the critical thickness of sand mulching. Why brine promotes water evaporation remains to be further investigated and discussed.
The thickness of the sand mulching layer significantly influences the morphology of salt crusts by regulating the salt surface aggregation process, thereby affecting soil moisture evaporation. At ambient temperatures, NaCl typically forms surface crusts (efflorescence), primarily manifesting in two forms: crusty and patchy. Crusty salt crusts develop when soil particle size is small, while patchy salt crusts form when soil particle size is large [19]. The sand mulching covering the soil surface in this experiment had a uniform particle size of 500–800 µm, with the only variation being the thickness of the sand layer. In this study, we observed that two distinct salt crust morphologies could simultaneously form on the surface of soil with the same coarse particle size, as shown in Figure 6. When sand mulching is 1–2 cm, a crusty salt crust forms on the soil surface; when sand mulching is 3–4 cm, a patchy salt crust forms on the soil surface; when sand mulching is 5–6 cm, no obvious salt crust forms on the soil surface. Furthermore, as shown in Result 3.3, the coverage of salt crust generally decreases with increasing sand mulching thickness. The variation in SCC during evaporation is shown in Figure 7. As the sand mulching thickness increased from 1 cm to 5 cm, the SCC decreased sharply from 92.62% (1 cm) to 5.52% (5 cm). However, the study findings revealed that crusty salt crust suppresses evaporation even at high coverage levels, whereas patchy salt crust actually promotes evaporation at moderate coverage levels. It is evident that variations in SCC across different forms influence soil moisture evaporation; however, the underlying mechanism of this influence remains to be further analyzed and discussed.

4.2. Effect of SCC on Soil Water Evaporation

This study, under uniform sand mulching grain size conditions (500–800 µm), observed for the first time that sand mulching thickness, by regulating the salt surface aggregation process, not only significantly altered the morphology of the salt crust but also directly caused changes in the SCC (Figure 7). At the same time, the effect of brine on water evaporation also changes accordingly, as shown in Figure 4. When sand mulching with 3 cm, the SCC surged sharply to 4.51% on the fifth day, marking the first brine-promoted evaporation peak of 8.33%. Subsequently, from days 7 to 10, the SCC reached a new high of 38.27%, accompanied by a second brine-promoted peak of 33.61%. When sand mulching reached 4 cm, the first salt crust appeared on the soil surface on the fourth day, coinciding with the peak of brine-promoted evaporation. The pattern of SCC change closely mirrored the pattern of water evaporation promotion. The above observations clearly reveal a high degree of temporal synchrony between the dynamic changes in SCC and the promoting effect of brine on evaporation. This indicates that SCC itself may be a key direct variable regulating the evaporation process, rather than merely a concomitant phenomenon of morphological changes. Based on the close association between SCC and enhanced evaporation, and considering the morphological characteristics of salt crusts observed under different sand mulching thicknesses (crusty, patchy, and crustless), we propose three evaporation mechanism hypotheses to explain the influence of salt crusts on soil water evaporation.

4.2.1. Mechanism of High-Coverage Crusty Crusts Suppresses Evaporation

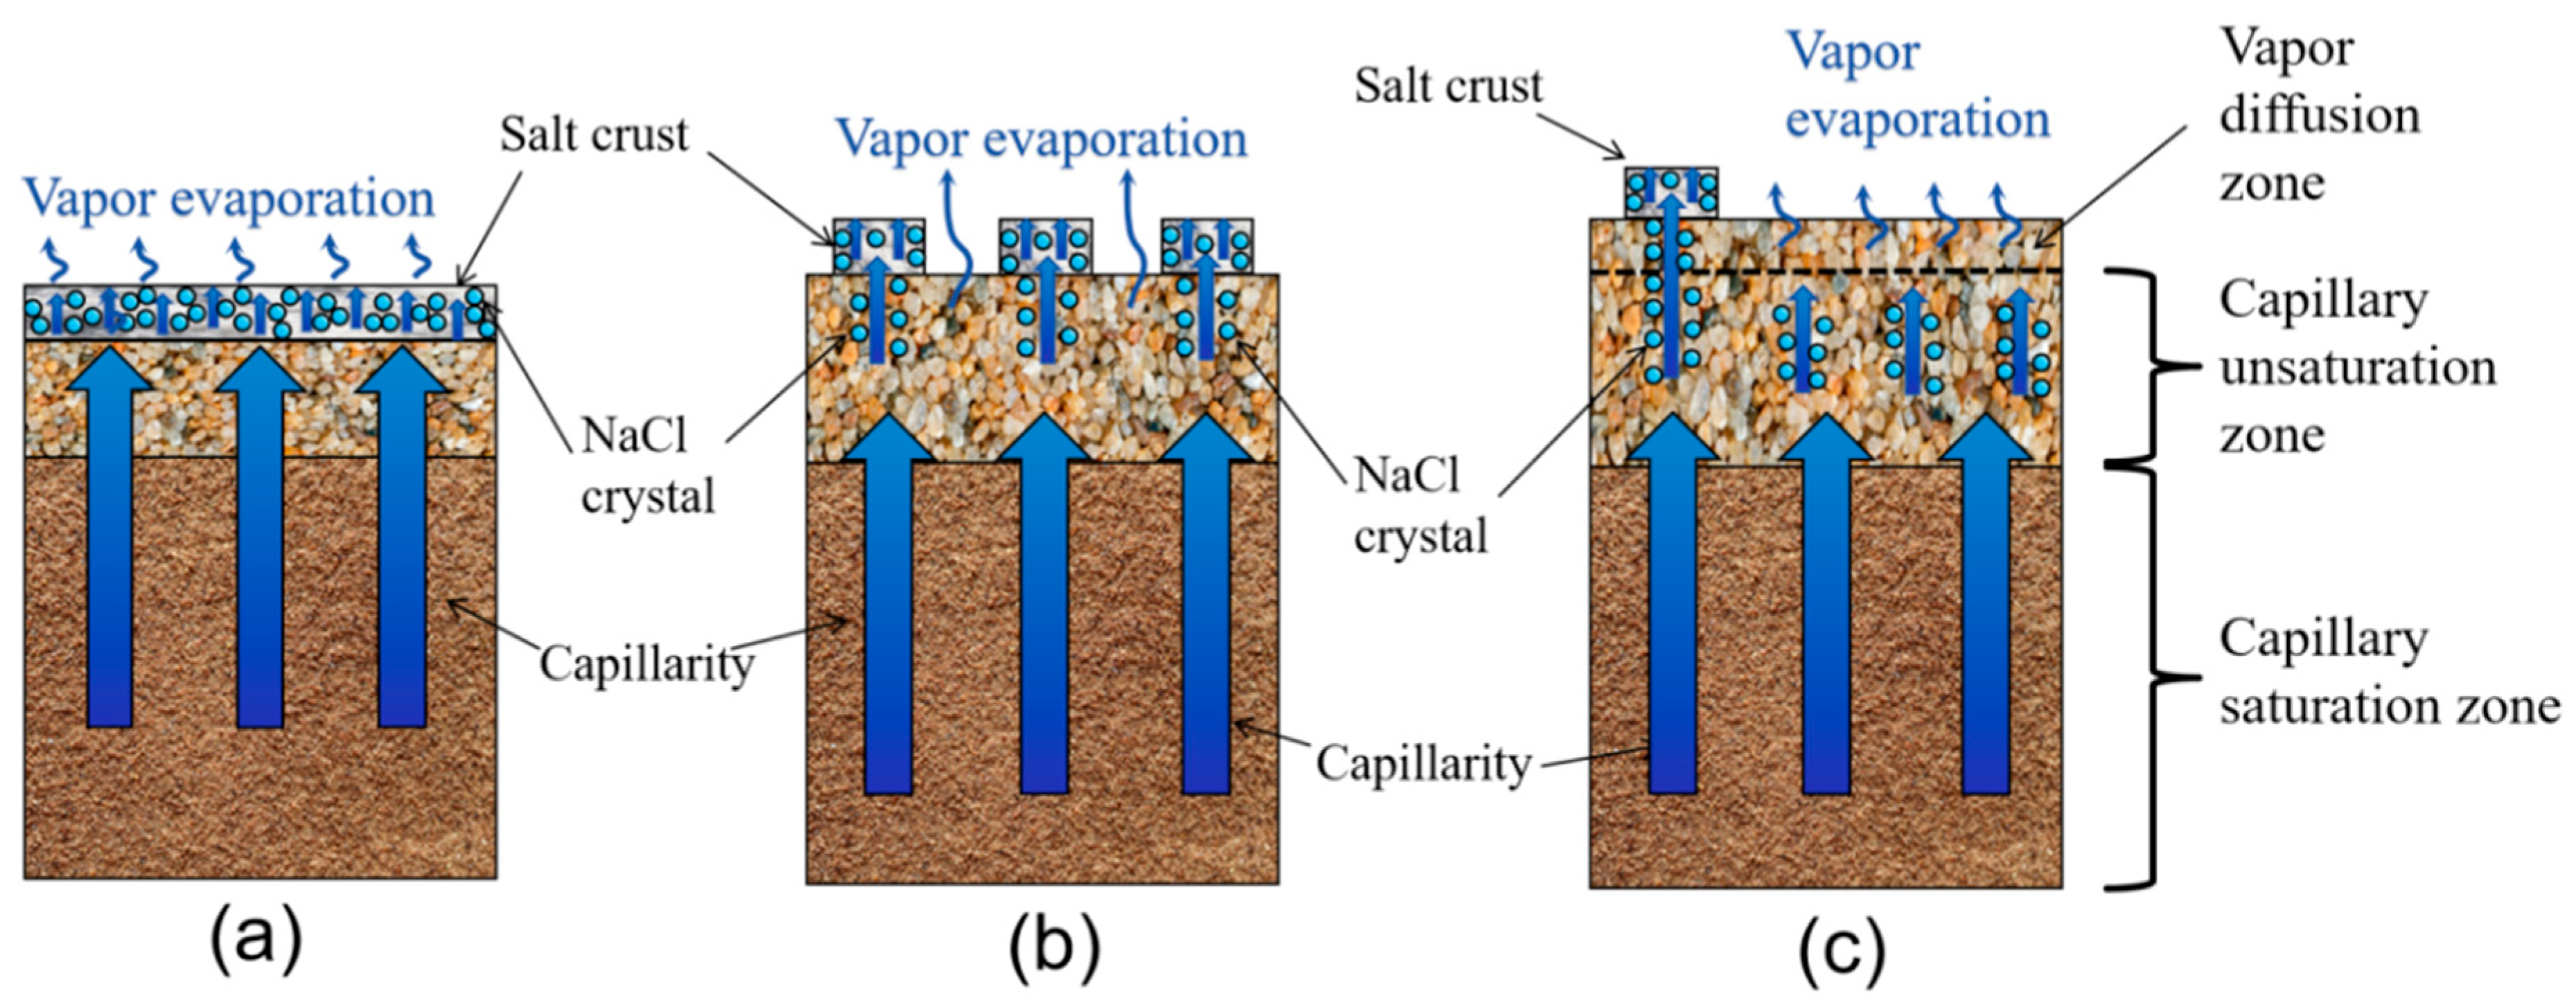
The mechanism of high-coverage crusty crust suppresses soil water evaporation, as shown in Figure 8a. When the soil surface is covered with a thin layer of coarse sand (sand mulching thickness 1–2 cm), capillary channels extend throughout the entire coarse sand layer to the evaporation surface, soil moisture is transported upward to the soil surface via capillary action, with the evaporation surface located at ground level. Intense capillary action ensures good hydraulic continuity throughout the profile [29], resulting in relatively rapid soil moisture evaporation. After water evaporation from brine, increased salinity leads to the formation of NaCl crystals, which gradually accumulate on the evaporation surface to form a dense crusty crust of NaCl [30]. The pores within this dense crusty crust are significantly smaller than soil capillary pores; water movement through these salt crust pores slows considerably, increasing resistance to evaporation and thereby inhibiting soil moisture loss [31,32], forming an evaporation-inhibiting mechanism. This mechanism manifests externally as: crust formation covering the surface and blocking evaporation pores [33], thereby reducing evaporation rates [32]. This experiment demonstrates that with a 1 cm sand mulching, surface SCC reached 92.62%, and the evaporation rate of the brine soil column (4.98 g/d) decreased by 50.1% compared to the deionized water soil column (9.94 g/d), achieving a maximum evaporation suppression rate of 60.91%. When the sand mulching layer thickness increased to 2 cm, the extended water migration path reduced the crusty SCC, which became unevenly distributed and discontinuous. This weakened the evaporation suppression effect and introduced fluctuations, manifesting as alternating suppression and promotion (as shown in Figure 4).

4.2.2. Mechanism of Medium-Coverage Patchy Crusts Promotes Evaporation

The mechanism of medium-coverage patchy crust promotes soil water evaporation, as shown in Figure 8b. When the thickness of the surface sand mulching increased to 3–4 cm, the soil water migration path within the coarse sand layer was extended. The rising height of soil capillary water in the coarse sand layer could not reach the soil surface in its entirety, and only part of the capillary water could reach the soil surface. In the area where capillary water reaches the soil surface, brine water evaporates rapidly, and brine gradually crystallizes at the evaporation point to form small patches of salt crust. As evaporation continues, the patchy salt crust gradually expands in all directions to form a large patchy salt crust. NaCl patchy salt crust is a porous structure [34], In the region of patchy salt crust, water can still be transported to the surface of the salt crust in liquid form for evaporation due to the presence of finer capillaries inside the salt crust than in the coarse sand layer, where capillary forces still exist [35]. With the expansion of the patchy crust and the increase in fine capillaries within the salt crust, its overall evaporation rate may exceed the evaporation rate in the absence of salt crust [36], forming an evaporation-promoting mechanism. This mechanism manifests externally as: patchy salt crusts sometimes promote soil moisture evaporation [19]. In this study, salt crusts promoted soil moisture evaporation when sand mulching was 2 cm, 3 cm, and 4 cm thick.
The mechanism by which patchy salt crusts promote soil moisture evaporation may be linked to patch coverage. As shown in Figure 4 and Figure 7, when sand mulching was 2 cm, 3 cm, and 4 cm thick, the soil moisture evaporation enhancement effect of the brine soil columns underwent a process of gradual increase followed by a slow decline. The maximum soil moisture evaporation promotion time for 2 cm sand mulching was on Day 2, with a SCC of 4.62%; for 3 cm sand mulching, it was on Day 9 with a SCC of 31.55%; and for 4 cm sand mulching, it was on Day 4 with a SCC of 7.6%. As SCC increases further, the promotion of soil moisture evaporation gradually diminishes, and may ultimately even inhibit soil moisture evaporation. The transition from promoting to inhibiting soil moisture evaporation under 2 cm of sand mulching occurred on day 4, with a SCC of 20.37% at that time; for the 3 cm sand mulching layer, the transition from promoting to inhibiting soil moisture evaporation occurred on the 11th day, with a SCC of 50.14% at that time; for the 4 cm sand mulching layer, the transition from promoting to inhibiting soil moisture evaporation occurred on the 13th day, with a SCC of 41.31% at that time. However, the relationship between patchy salt crusts promoting soil moisture evaporation and patch coverage remains highly complex. It may be influenced by other factors such as soil surface evaporation potential, temperature, humidity, and other contributing elements [37,38]. Further in-depth research is required to clarify these specific effects.

4.2.3. Mechanism of Weakened Effect of Thick Sand Mulching Without Crusts

The mechanism of thick coarse sand mulching without crust formation is the weak brine influence mechanism. In this study, when covered with 5–6 cm of coarse sand, no salt crust or only minimal salt crust appeared on the soil surface (as shown in Figure 6), there was no significant difference in evaporation between the brine soil column and the deionized water soil column, the brine soil column neither exhibited an inhibitory effect on evaporation nor a promoting effect, as shown in Figure 8c. With thick sand mulching, the capillaries within the surface coarse sand were unable to transport water in liquid form to the soil surface [39]. The process of soil moisture evaporation was mainly in the form of water vapor diffusion; the evaporation rate was slow, and there was no obvious salt crust on the soil surface.
Under this mechanism, although soil moisture evaporates slowly, salt crystallization still occurs on the internal evaporation surface within the soil. Within coarse sand layers, salt crystallization reduces the size of large pores, increases capillary forces, raises the liquid level [40], and consequently elevates the internal evaporation surface. At the new evaporation surface, salt continues to crystallize, and the evaporation surface continues to rise. As evaporation persists, a “salt tree” structure forms within the soil [41], as shown in Figure 9a. Salt crystals gradually interconnect and bridge within pores near the evaporation interface, forming a continuous “salt tree” with a microporous structure. This “salt tree,” due to its delicate pores, can “extract” liquid water from the underlying soil. This action progressively elevates the evaporation surface, shortening the path for water vapor diffusion into the atmosphere. According to Fick’s law, under the same vapor pressure gradient, the shortened diffusion path leads to a significant increase in water vapor diffusion flux, manifesting as a sharp acceleration in the later evaporation rate [42]. In this study, the evaporation rate of brine with 6 cm of sand mulching during the late evaporation stage (days 11–13) increased by 36.73% relative to deionized water. With 6 cm of sand mulching, “salt tree” was also observed within the brine soil column, as shown in Figure 9b. This “salt tree” is formed from salt crystals cementing sand particles. As evaporation continued, this “salt tree” grew until a patchy salt crust formed on the soil surface, as seen in the small patches of salt crust appearing on the 11th day with 5 cm of sand mulching (Figure 6).

4.3. Implications and Future Perspectives

The mechanisms of evaporation suppression by crusty crusts and promotion by patchy crusts, as elucidated in this study under ambient laboratory conditions (characterized by moderate, natural fluctuations in temperature and humidity) using NaCl and homogeneous sand, provide a fundamental framework for understanding soil–water–atmosphere interactions in saline environments. However, translating these insights to natural arid zones requires consideration of greater complexity. First, the applicability of these mechanisms to soils with differing textures (e.g., clays, silts) and to natural salt assemblages beyond NaCl (e.g., sulfates, carbonates) must be validated, as these factors profoundly alter crystallization dynamics and soil hydrology. Second, the complex interplay between patchy crust coverage and evaporation enhancement identified here must be tested under a broader range of controlled environmental conditions, including more intense fluctuations in temperature, humidity, and evaporation demand, to quantify their modulating effects fully. Therefore, future research should prioritize field-scale validation and systematically investigate the effects of diverse soil types, complex salt chemistry, and a broader spectrum of atmospheric dynamics to build a more comprehensive and predictive model of water loss from saline soils.

5. Conclusions

This study employed six sand mulching thicknesses to induce distinct salt crust morphologies on the surface of NaCl brine soil columns. These variations in salt crust morphology subsequently influenced soil moisture evaporation. By systematically examining the relationship between salt crust morphology and soil moisture evaporation, the study elucidated the regulatory mechanism of NaCl salt crusts on soil evaporation. The core conclusions are as follows:
  • Sand mulching can suppress evaporation overall, but salinity regulates the evaporation process. The soil evaporation process in NaCl brine differs significantly from that in deionized water conditions, with the evaporation rate depending on the morphology and coverage of the surface NaCl salt crust. When a high-coverage crusty crust forms, evaporation is markedly inhibited; conversely, when a medium-coverage patchy crust forms, evaporation is enhanced.
  • The regulatory mechanisms of salt crust morphology and coverage (SCC) on evaporation can be categorized into the following three types:
    (1)
    Mechanism of high-coverage crusty crusts suppresses soil evaporation (sand mulching 1–2 cm). High SCC (92.62–55.93%) suppresses evaporation by blocking pores and increasing diffusion resistance, with a maximum inhibition rate of 60.91% (1 cm sand mulching);
    (2)
    Mechanism of medium-coverage patchy crusts promotes soil evaporation (sand mulching 3–4 cm). At 4 cm sand mulching, the salt crust morphology transformed into a medium-coverage patchy crust, significantly enhancing water evaporation with a maximum promotion rate of 54.15%. At 3 cm sand mulching, the salt crust exhibited a medium-coverage patchy crust, also showing significant promotion of water evaporation with a maximum promotion rate of 33.61%. However, excessively low (SCC = 0.42%) or high (SCC = 50.14%) coverage may inhibit water evaporation.
    (3)
    Mechanism of non-crusting weak influence (sand mulching 5–6 cm). Salt crystals form ”salt tree” structures within the soil, with no salt crust on the surface. During the late evaporation phase (days 11–13), the ”salt tree” structures shorten the distance for water vapor diffusion, resulting in promoted soil evaporation (promotion rate: 36.73%).
This study contests the conventional cognitive framework that posits “salt inhibits evaporation,” instead showing that the thickness of sand mulching can regulate soil water evaporation by controlling the salt crust coverage (SCC) under controlled laboratory conditions. It is important to note, however, that these findings are based on a system utilizing a single soil texture and salt type (NaCl). The broader applicability of the quantitative relationships to field conditions—where variable factors such as heat flux, albedo, wind, and stochastic events significantly influence evaporation—requires further validation. Future research should therefore focus on translating these mechanistic insights into predictive frameworks for natural environments, with particular emphasis on the thermodynamic-hydraulic coupling within patchy salt crust pore networks and the role of “salt tree” channel morphology in water and salt transport.

Author Contributions

Conceptualization, Y.W. and C.L.; methodology, Y.W. and C.L.; formal analysis, Y.W., Z.L. and S.W.; experiment, Y.W., C.L., Z.L. and S.W.; data curation, Y.W. and C.L.; writing—original draft preparation, Y.W.; writing—review and editing, C.L.; visualization, Y.W. and C.L.; supervision, C.L.; project administration, C.L.; funding acquisition, C.L. All authors have read and agreed to the published version of the manuscript.

Funding

This research was funded by National Natural Science Foundation of China, with the grant number 42267043 and the “Key Research and development projects of Xinjiang Uygur Autonomous Region”, with the grant number 2022B03025-5.

Data Availability Statement

Data supporting reported results can be provided upon request.

Acknowledgments

The authors would like to thank the anonymous reviewers and the academic editor for their support in improving this manuscript.

Conflicts of Interest

The authors declare no conflicts of interest.

References

  1. Sharafatmandrad, M.; Khosravi Mashizi, A. Temporal and Spatial Assessment of Supply and Demand of the Water-yield Ecosystem Service for Water Scarcity Management in Arid to Semi-arid Ecosystems. Water Resour. Manag. 2021, 35, 63–82. [Google Scholar] [CrossRef]
  2. Jiao, L.; An, W.; Li, Z.; Gao, G.; Wang, C. Regional variation in soil water and vegetation characteristics in the Chinese Loess Plateau. Ecol. Indic. 2020, 115, 106399. [Google Scholar] [CrossRef]
  3. Hamarash, H.; Hamad, R.; Rasul, A. Meteorological drought in semi-arid regions: A case study of Iran. J. Arid Land 2022, 14, 1212–1233. [Google Scholar] [CrossRef]
  4. Feng, Y.; Sun, F.; Deng, X. Attributing the divergent changes of drought from humid to dry regions across China. J. Hydrol. 2025, 660, 133363. [Google Scholar] [CrossRef]
  5. Guo, J.; Sun, M.; Zhang, C.; Lienhart, W.; Jiang, H.; Shi, B. Water Vapor Transport in Dry Sand During Evaporation Monitored by Quasi-Distributed Fiber-Optic Sensing Technology. Water Resour. Res. 2025, 61, e2024WR038719. [Google Scholar] [CrossRef]
  6. Li, Y.; Li, S.; Xiao, B.; Wang, F. Evaporation Characteristics of Soil Covered with Moss Crust in the Wind-water Erosion Crisscross Region of the Loess Plateau. J. Soil Water Conserv. 2020, 34, 208–215. [Google Scholar]
  7. Jia, H.; Li, W.; Wang, Z.; Ding, H.; Xu, H. Effects of biodegradable mulching film on soil water evaporation characteristics. Agric. Res. Arid Areas 2020, 38, 1–9. [Google Scholar]
  8. Zhang, X.; Ye, P.; Wu, Y.; Zhai, E. Experimental study on simultaneous heat-water-salt migration of bare soil subjected to evaporation. J. Hydrol. 2022, 609, 127710. [Google Scholar] [CrossRef]
  9. Christiansen, F.W. Polygonal Fracture and Fold Systems in the Salt Crust, Great Salt Lake Desert, Utah. Science 1963, 139, 607–609. [Google Scholar] [CrossRef]
  10. Veran-Tissoires, S.; Prat, M. Evaporation of a sodium chloride solution from a saturated porous medium with efflorescence formation. J. Fluid Mech. 2014, 749, 701–749. [Google Scholar] [CrossRef]
  11. Roy, R.; Weibel, J.A.; Garimella, S.V. Modeling the formation of efflorescence and subflorescence caused by salt solution evaporation from porous media. Int. J. Heat Mass Transf. 2022, 189, 122645. [Google Scholar] [CrossRef]
  12. Rengasamy, P. World salinization with emphasis on Australia. J. Exp. Bot. 2006, 57, 1017–1023. [Google Scholar] [CrossRef] [PubMed]
  13. Xu, Z.; Wallach, R.; Mao, X. Understanding evaporation from salinized soils in Xinjiang: Impact of sodium adsorption ratio, salt type, and concentrations. Soil Sci. Soc. Am. J. 2025, 89, e20796. [Google Scholar] [CrossRef]
  14. Wang, H.; Li, X.; Li, J.; Cui, M.; Ren, X.; Jin, H. Impact of salt precipitation on evaporation resistance under different soil textures. Environ. Earth Sci. 2025, 84, 12. [Google Scholar] [CrossRef]
  15. Nachshon, U.; Weisbrod, N.; Dragila, M.I.; Grader, A. Combined evaporation and salt precipitation in homogeneous and heterogeneous porous media. Water Resour. Res. 2011, 47. [Google Scholar] [CrossRef]
  16. Nachshon, U.; Weisbrod, N. Beyond the Salt Crust: On Combined Evaporation and Subflorescent Salt Precipitation in Porous Media. Transp. Porous Media 2015, 110, 295–310. [Google Scholar] [CrossRef]
  17. Guo, M.; Li, X.; Wang, H.; Li, J. Effect of salt crust thickness on distribution characteristics of soil water and salt. Arid Land Geogr. 2023, 46, 1303–1313. [Google Scholar]
  18. Fu, X.; Li, C.; Li, S. Effects of NaCl Content on Salt Crust Properties and Wind-erosion Resistance of Aeolian Sand Soil. Soils 2021, 53, 1064–1071. [Google Scholar]
  19. Eloukabi, H.; Sghaier, N.; Ben Nasrallah, S.; Prat, M. Experimental study of the effect of sodium chloride on drying of porous media: The crusty-patchy efflorescence transition. Int. J. Heat Mass Transf. 2013, 56, 80–93. [Google Scholar] [CrossRef]
  20. Gale, W.J.; McColl, R.; Fang, X. Sandy fields traditional farming for water conservation in China. J. Soil Water Conserv. 1993, 48, 474–477. [Google Scholar] [CrossRef]
  21. Kang, W.R.; Zhang, Y.Y.; Zhao, W.Z.; Wu, S.X. The Effect of Gravel Mulch on soil Evaporation and Resistance: Experimental Findings and Modeling. J. Soil Sci. Plant Nutr. 2025, 25, 1135–1148. [Google Scholar] [CrossRef]
  22. Zhao, Z.; Luo, Z.; Sun, H.; Li, H.; Liu, Q.; Liu, H. Capillary Rise in Layered Soils. Appl. Sci. 2023, 13, 3374. [Google Scholar] [CrossRef]
  23. Cai, Y.; Li, Y.; Feng, H. Effects of Gravel-Sand Mulching Degree and Size on Soil Moisture Evaporation. J. Soil Water Conserv. 2014, 28, 273–277, 297. [Google Scholar]
  24. Liu, C.; Peng, Y.; Zhao, X. Flower-inspired bionic sodium alginate hydrogel evaporator enhancing solar desalination performance. Carbohydr. Polym. 2021, 273, 118536. [Google Scholar] [CrossRef] [PubMed]
  25. Oroud, I.M. Temperature and evaporation dynamics of saline solutions. J. Hydrol. 1999, 226, 1–10. [Google Scholar] [CrossRef]
  26. Al-Shammiri, M. Evaporation rate as a function of water salinity. Desalination 2002, 150, 189–203. [Google Scholar] [CrossRef]
  27. Nassar, I.N.; Horton, R. Salinity and compaction effects on soil water evaporation and water and solute distributions. Soil Sci. Soc. Am. J. 1999, 63, 752–758. [Google Scholar] [CrossRef]
  28. Yu, C.; Sun, C.; Zhang, Q.; Sun, Y.; Zhu, Z.; Li, B.; Lyu, P.; Yu, S. Response characteristics of saline soil evaporation in Yellow River Delta under different salinity levels. J. Drain. Irrig. Mach. Eng. 2023, 41, 89–95. [Google Scholar]
  29. Wang, S.; Zhai, S.; Fu, Y.; Fei, L. Study on the Variation Characteristics of Rising CapillaryWater of Layered Soil under Variation of Sand Layer and Thickness. J. Irrig. Drain. 2019, 38, 49–57. [Google Scholar]
  30. Wen, Y. Influence of Texture and Bulk Density on the Transport’s Law of Cl~- in Soils. Res. Soil Water Conserv. 2002, 9, 73–75. [Google Scholar]
  31. Li, X.; Guo, M.; Wang, H. Impact of soil texture and salt type on salt precipitation and evaporation under different hydraulic conditions. Hydrol. Process. 2022, 36, e14763. [Google Scholar] [CrossRef]
  32. Fujimaki, H.; Shimano, T.; Inoue, M.; Nakane, K. Effect of a salt crust on evaporation from a bare saline soil. Vadose Zone J. 2006, 5, 1246–1256. [Google Scholar] [CrossRef]
  33. Or, D.; Lehmann, P.; Shahraeeni, E.; Shokri, N. Advances in Soil Evaporation Physics-A Review. Vadose Zone J. 2013, 12, 1–16. [Google Scholar] [CrossRef]
  34. Nachshon, U.; Weisbrod, N.; Katzir, R.; Nasser, A. NaCl Crust Architecture and Its Impact on Evaporation: Three-Dimensional Insights. Geophys. Res. Lett. 2018, 45, 6100–6108. [Google Scholar] [CrossRef]
  35. Shokri-Kuehni, S.M.S.; Vetter, T.; Webb, C.; Shokri, N. New insights into saline water evaporation from porous media: Complex interaction between evaporation rates, precipitation, and surface temperature. Geophys. Res. Lett. 2017, 44, 5504–5510. [Google Scholar] [CrossRef]
  36. Veran-Tissoires, S.; Marcoux, M.; Prat, M. Discrete Salt Crystallization at the Surface of a Porous Medium. Phys. Rev. Lett. 2012, 108, 054502. [Google Scholar] [CrossRef]
  37. Zhang, H.; Tang, A.M.; Zhao, B. Brine Drying and Salt Precipitation in Sandy Soil and Its Impact on Thermal Conductivity. Water Resour. Res. 2025, 61, e2024WR038956. [Google Scholar] [CrossRef]
  38. Li, X.; Wang, H. Effect of salt crust on the soil temperature of wet sandy soils. Agric. For. Meteorol. 2025, 362, 110346. [Google Scholar] [CrossRef]
  39. Gou, L.Y.; Zhang, C.; Lu, N.; Hu, S.J. A Soil Hydraulic Conductivity Equation Incorporating Adsorption and Capillarity. J. Geotech. Geoenviron. Eng. 2023, 149, 04023056. [Google Scholar] [CrossRef]
  40. Yu, X.; Qi, D.; Lu, S. Pore structure alteration in a reclaimed saline-sodic soil identified by multiscale X-ray tomography. Soil Sci. Soc. Am. J. 2022, 86, 1015–1027. [Google Scholar] [CrossRef]
  41. Hird, R.; Bolton, M.D. Migration of sodium chloride in dry porous materials. Proc. R. Soc. A—Math. Phys. Eng. Sci. 2016, 472, 20150710. [Google Scholar] [CrossRef]
  42. Jin, K.; Lu, Y.; Zhou, H.; Zhang, Q.; Hu, Y.; Wan, D.; Yan, J. Research Progress on the Hydrology in the Gurbantunggut Desert. J. China Hydrol. 2022, 42, 1–10. [Google Scholar]
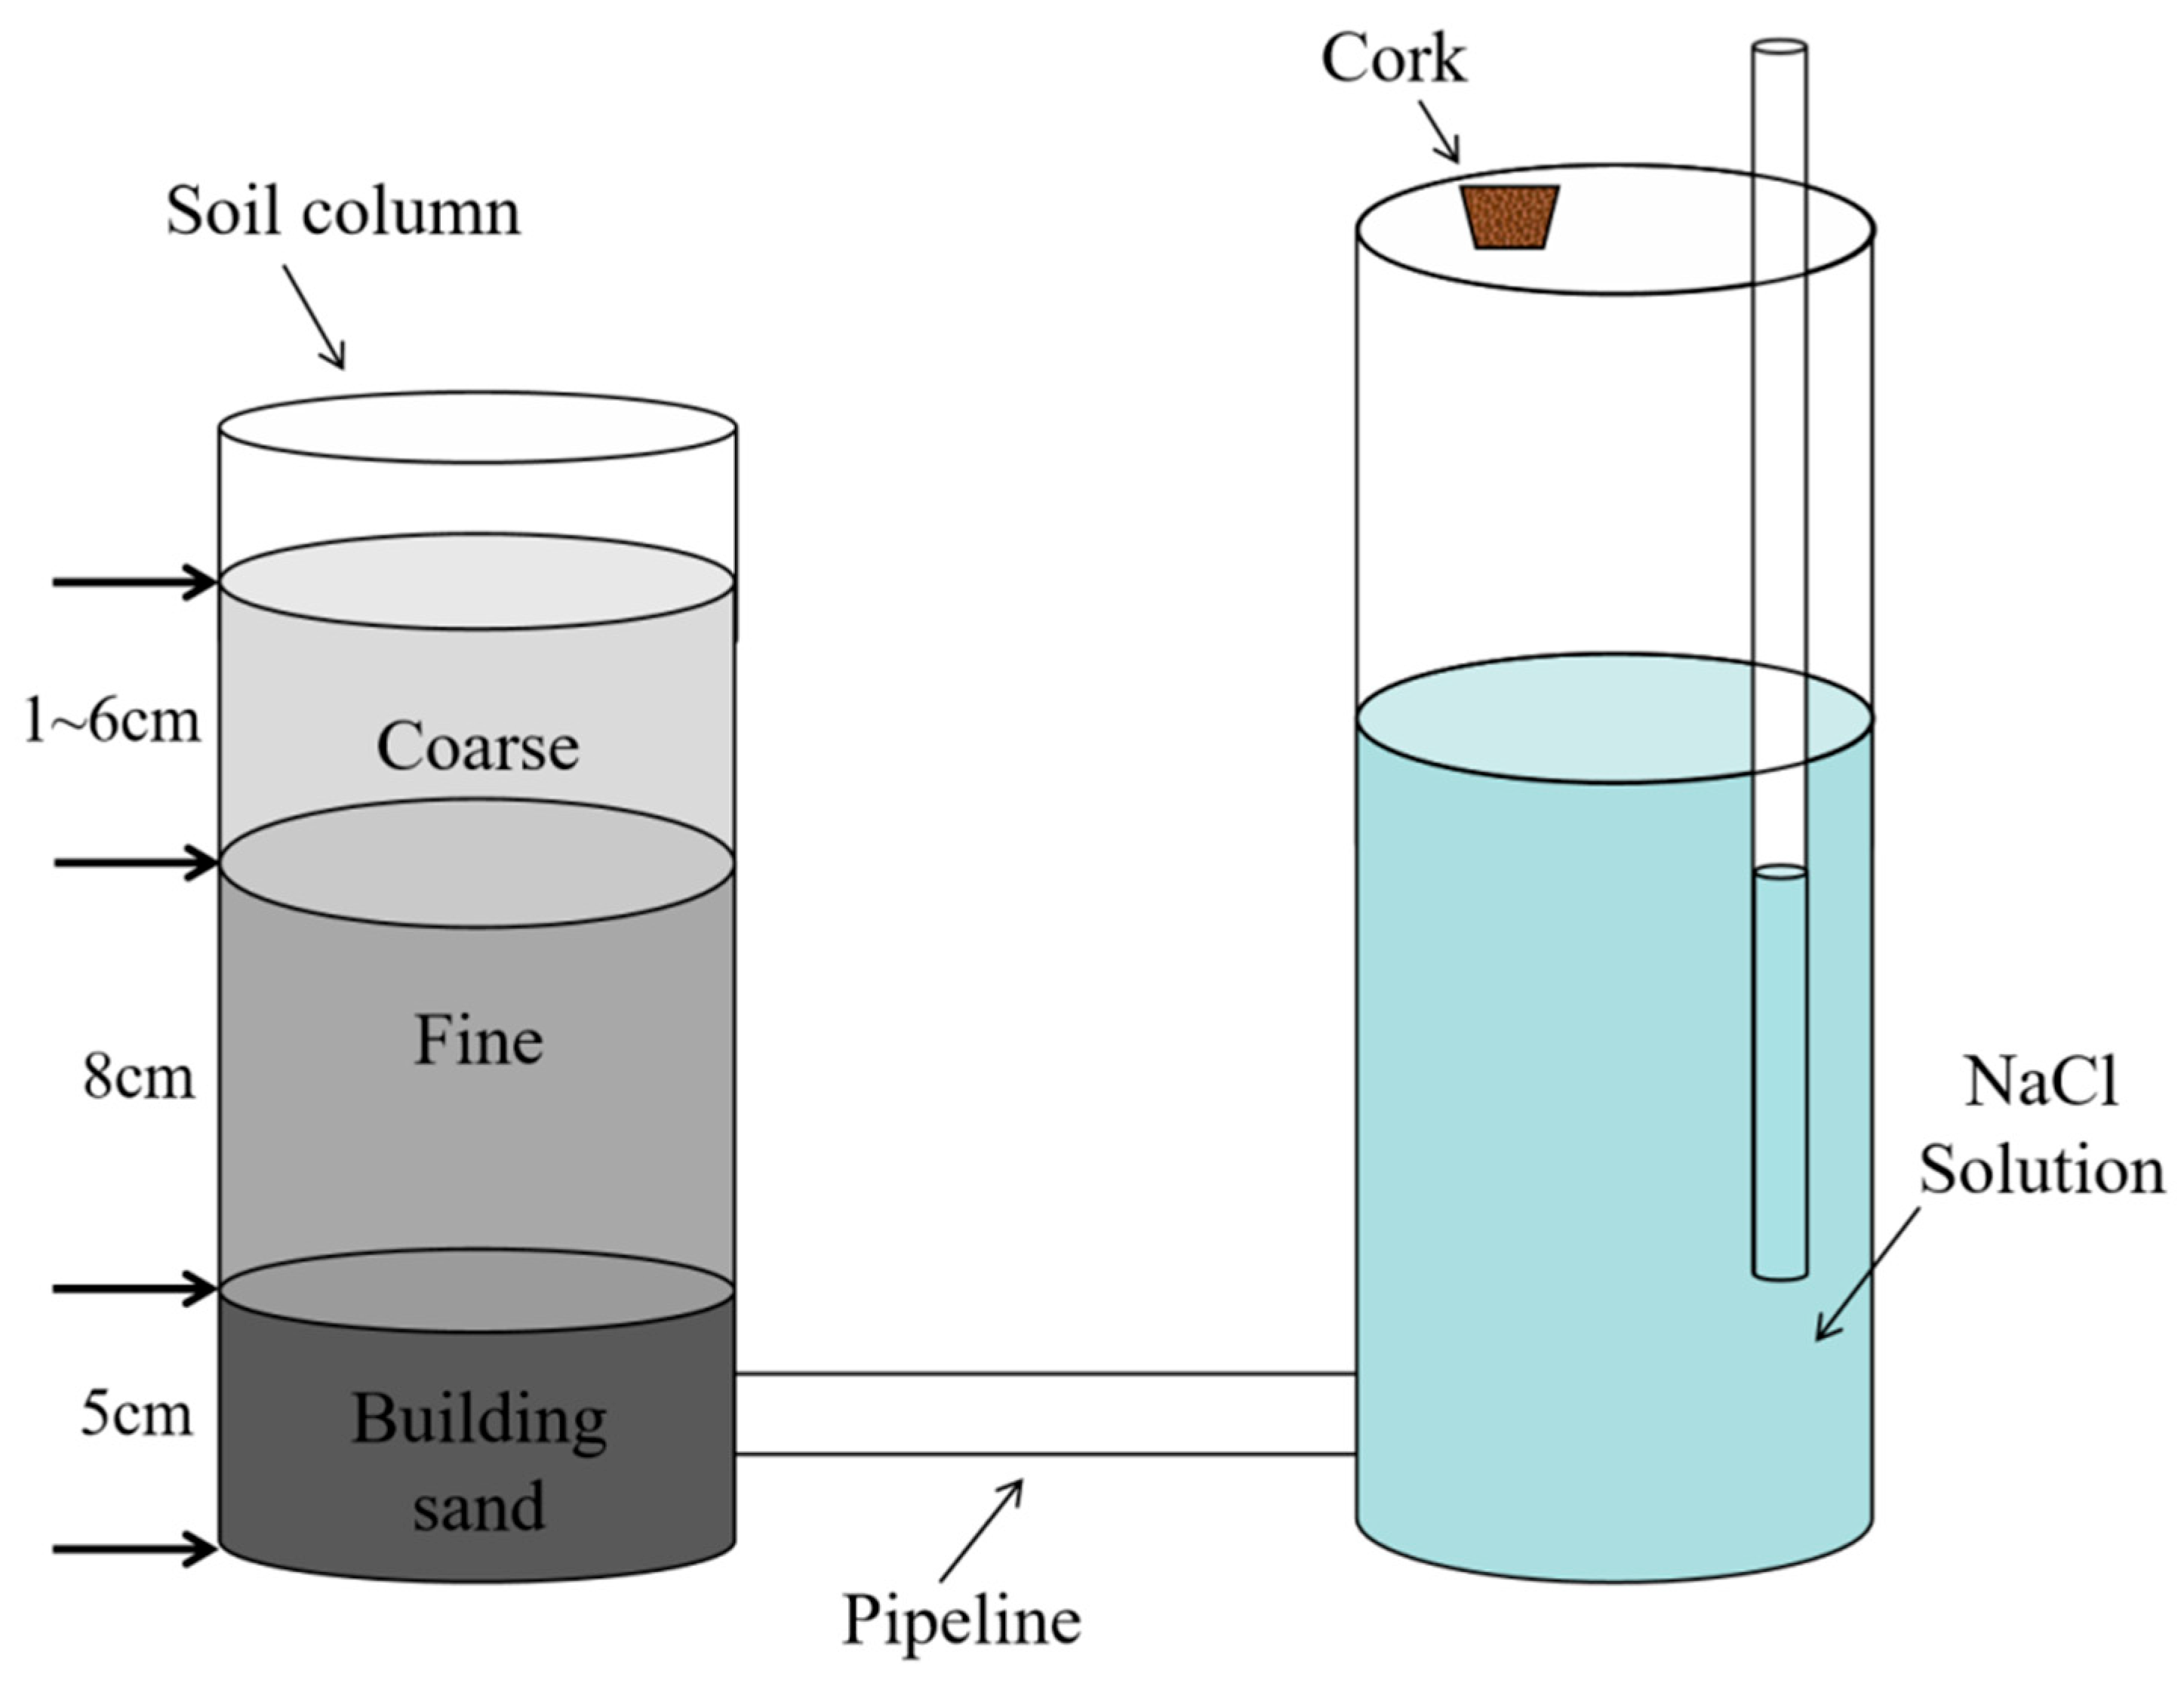
Figure 1. Schematic diagram of the soil column evaporation experiment setup.
Land 14 02028 g001
Figure 2. Total evaporation of brine and deionized water soil columns at different sand mulching thicknesses.
Land 14 02028 g002
Figure 3. Daily evaporation of brine and deionized water in soil columns at different sand mulching thicknesses. Solid black circles indicate outliers. Lowercase letters denote significant differences in daily evaporation of CK columns at different sand mulching thicknesses (p < 0.05). Uppercase letters denote significant differences in daily evaporation of NaCl columns at different sand mulching thicknesses (p < 0.05). Three asterisks (***) indicate p < 0.001, two asterisks (**) indicate p < 0.01, an asterisk (*) indicates p < 0.05, ns indicates no significant difference.
Land 14 02028 g003
Figure 4. Rates of brine effect on soil moisture evaporation under different sand mulching thicknesses, above 0% scale is promotion rate and below is inhibition rate. Rs values under different sand mulching thicknesses were calculated according to Formula (1) and (2).
Land 14 02028 g004
Figure 5. Salt crust coverage on the soil column at the end of the experiment. No significant salt crust was observed on the soil surface beneath the 6 cm sand mulching.
Land 14 02028 g005
Figure 6. The surface of the brine soil column with different thicknesses of sand mulching.
Land 14 02028 g006
Figure 7. Salt Crust Coverage under Different Sand Mulching Thicknesses. Salt crust is invisible on the soil surface with 6 cm of sand mulching.
Land 14 02028 g007
Figure 8. (a) Schematic diagram of the mechanism by which a high-coverage crusty crust suppresses evaporation; (b) Schematic diagram of the mechanism by which a medium-coverage patchy crust promotes evaporation; (c) Schematic diagram of the mechanism by which crust-free conditions exert a weak influence.
Land 14 02028 g008
Figure 9. (a) Salt dendrites remaining within a granular medium flow column, image from Hird [41]; (b) “Salt tree” observed within a brine soil column under 6 cm of sand mulching.
Land 14 02028 g009
Disclaimer/Publisher’s Note: The statements, opinions and data contained in all publications are solely those of the individual author(s) and contributor(s) and not of MDPI and/or the editor(s). MDPI and/or the editor(s) disclaim responsibility for any injury to people or property resulting from any ideas, methods, instructions or products referred to in the content.