Abstract
The quantitative assessment of acoustic rain enhancement technology is highly significant for improving the ecological environment. A scientific and accurate evaluation of its operational effects provides an important basis for continued government and public support and investment in artificial weather modification activities. To effectively analyze the effects of acoustic rain enhancement on the vegetation of grassland ecosystems in arid and semi-arid areas and to clarify its mechanism, this study constructed eight vegetation indices based on Sentinel-2 satellite data. A comprehensive assessment of the changes in vegetation within the grassland ecosystem of the experimental zone was conducted by analyzing spatiotemporal distribution patterns, double-ratio analysis, and difference value comparisons. The results showed that (1) following the acoustic rain enhancement experiment, vegetation growth improved significantly. The mean values of all eight vegetation indices increased more substantially than before the experiment, with kNDVI showing the most notable gain. The proportion of the zone with kNDVI values greater than 0.417 increased from 52.62% to 71.59%, representing a relative increase of 36.05%. (2) The rain enhancement experiment significantly raised the values of eight vegetation indices: kNDVI increased by 0.042 (18.68%), ARVI by 0.043 (18.67%), and the remaining indices also increased to varying degrees (9.51–12.34%). (3) Vegetation improvement was more pronounced in areas closer to the acoustic rain enhancement site. Under consistent climate conditions, vegetation growth in the experimental zone showed significant enhancement. This study demonstrates that acoustic rain enhancement technology can mitigate drought and low rainfall, improve grassland ecosystem services, and provide a valuable foundation for ecological restoration and aerial water resource utilization in arid and semi-arid regions.
1. Introduction
Water resources play a crucial role in human production, daily life, water conservation, and ecosystem security. They are also a significant limiting factor in China’s arid and semi-arid climate zones. Although China’s annual atmospheric water resources total 22 trillion tons, their distribution is uneven, both temporally and spatially [1], particularly in the arid and semi-arid northwest regions, where natural precipitation is low and water scarcity is severe. Fully integrating and utilizing aerial water resources, surface water resources, and groundwater resources can alleviate severe water shortages in a region. For arid Northwest China, developing atmospheric water resources is particularly vital. Furthermore, their exploitation is crucial for food production security, watershed ecological protection, enhancing precipitation conversion rates, and effectively increasing water source conservation.
Effectively utilizing atmospheric water resources remains a major challenge. With societal progress and technological development, artificial rain enhancement technology has advanced rapidly, and new techniques are being applied across various fields. Among these, acoustic rain enhancement technology is an effective physical method for utilizing atmospheric water resources. This technology primarily utilizes the physical effects of sound waves to impart energy to the atmosphere and its particles, enhancing relative motion between cloud particles at certain scales. This increases the probability of particle collision and coalescence, enlarging raindrop diameters and thereby achieving rain enhancement [2,3]. Compared to traditional methods, acoustic rain enhancement is easier to operate, consumes fewer resources, requires no catalysts, and causes no environmental pollution. Recently, this technology has seen wide application. Studies indicate its effectiveness can be assessed through parameters including water vapor content, raindrop spectra, cloud liquid water content [4], radar echo intensity [5], average equivalent droplet diameter, and cloud layer height [6]. Experiments by Pan et al. [4] and Wei et al. [5] demonstrated increased local rainfall within a 3 km radius of the operation site. Yao et al. [3] statistically analyzed acoustic rain enhancement experiments in Leizhou City, Guangdong Province, finding an average rain enhancement rate of 0.67 mm/h and an average relative rain enhancement rate of 16.54%, effectively evaluating effectiveness using statistical methods. Li et al. [7] assessed the environmental effects and operational effectiveness of artificial rain enhancement using the Pressure–State–Response (PSR) model.
In the arid and semi-arid regions of Northwest China, grassland ecosystems represent the predominant ecosystem type. Moisture serves as a primary limiting factor for these ecosystems and plays a crucial role in their functioning [8,9]. Vegetation constitutes one of the most important and sensitive environmental factors within grassland ecosystems, as well as a key indicator of responses to global climate change, largely reflecting the overall quality of the ecological environment [10,11,12,13]. Soil moisture is a critical ecological factor influencing vegetation growth and development [14], with vegetation being highly sensitive to variations in precipitation and temperature. Increased precipitation has been shown to significantly promote the growth of herbaceous plants [15,16]. Particularly in these regions, atmospheric precipitation acts as the main source of soil moisture recharge. Alterations in precipitation patterns directly affect hydrological processes—such as soil water content, runoff, and evaporation—thereby significantly influencing regional vegetation phenology and physiological characteristics [17,18]. Additionally, temperature affects plant photosynthesis, and suitable hydrothermal conditions can enhance photosynthetic activity, leading to improved productivity in grassland ecosystems [19,20,21]. Acoustic rain enhancement technology can effectively increase atmospheric precipitation, thereby replenishing soil water content and contributing to the stability of grassland ecosystems.
Since the launch of the first Earth observation satellite in the 1970s, relationships between spectral response and vegetation cover have been established. Remote sensing technology offers significant advantages for monitoring vegetation changes due to its wide coverage, high efficiency, and dynamic capabilities [12,22,23]. Long-term monitoring relies on vegetation indices constructed using visible, near-infrared, and red-edge spectral bands, effectively tracking regional vegetation changes over time and space [24,25,26,27,28]. Most vegetation indices offer high sensitivity, reduce noise from solar elevation angle and atmosphere, and minimize terrain radiation interference. Indices like the red edge vegetation index, Enhanced Vegetation Index (EVI), and emerging indices such as the kernel Normalized Difference Vegetation Index (kNDVI) and Near-Infrared Reflectance of Terrestrial Vegetation (NIRv) exhibit enhanced resistance to background interference, effectively reducing atmospheric and soil effects and specifically addressing impacts from soil and dry vegetation [10,29,30,31], demonstrating excellent sensitivity. The Ratio Vegetation Index (RVI) is unaffected by soil moisture content and can enhance radiative differences between vegetation and soil, better highlighting important vegetation information.
However, studies on the effects of acoustic rain enhancement experiments on vegetation cover and grassland ecosystem quality have been minimal. Moreover, the influence of acoustic rain enhancement experiments on vegetation growth and grassland ecosystems—as assessed through remote sensing-based vegetation indices—remains unclear. Therefore, this study focuses on arid and semi-arid grasslands where acoustic rain enhancement experiments were carried out. By analyzing changes in vegetation using remote sensing vegetation indices, this research aims to clarify the mechanisms through which acoustic rain enhancement affects grassland ecosystems. The findings are expected to provide a valuable foundation for grassland ecological restoration and the utilization of atmospheric water resources in Qinghai Province.
2. Materials and Methods
2.1. Overview of the Study Area
Hainan Tibetan Autonomous Prefecture is located at the junction of Qinghai Province’s pastoral areas and eastern agricultural regions. Situated in the eastern Qinghai–Tibet Plateau and southwestern Qinghai Province, the prefecture features predominantly mountainous terrain surrounded by ranges on all sides, with an average elevation exceeding 3000 m. The region experiences a typical highland continental climate characterized by aridity, low annual rainfall, intense solar radiation, poor thermal conditions, and significant climatic variation. Xinghai County, administered by Hainan Prefecture, exhibits higher elevations in the southwest and lower elevations in the northeast. Its central and southern areas contain numerous rivers with abundant forests and well-developed vegetation, while the northern region features relatively flat, open terrain with extensive pastureland. The county lies within the geographical coordinates of 34°48′–36°14′ N and 99°01′–100°59′ E, positioning it within the core area of both the “Three Rivers Source” National Natural Ecological Protection Area and the “Qinghai Lake” Ecological Protection Area. The local economy primarily relies on livestock farming, supplemented by agriculture. Figure 1 illustrates the geographical locations of the study area, experimental zone, and comparison zone, along with the corresponding Sentinel-2 remote sensing imagery.
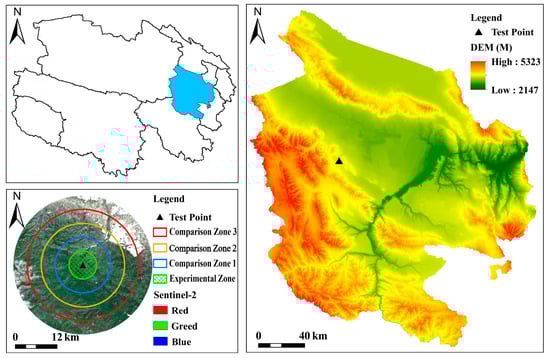
Figure 1.
Map of the study area.
2.2. Data Sources and Processing
This study utilizes Sentinel-2 multispectral optical remote sensing imagery data from 2021, 2022, 2023, and 2024. Sentinel-2 is a pair of satellites (2A and 2B) launched by the European Space Agency, equipped with a Multispectral Imaging (MSI) covering 13 channels in the visible, near-infrared, and shortwave infrared ranges (including the red edge band, which has a good response and is an important indicator of vegetation chlorophyll and health status). Among these, the three visible bands and the near-infrared band have a spatial resolution of 10 m; Both satellites have a revisit cycle of 10 d, complementing each other, with a temporal resolution of 5 d [32]. The Sentinel-2 data used in this paper are sourced from Google Earth Engine (GEE) (https://earthengine.google.com/ (accessed on 25 July 2025)) remote sensing cloud platform [33,34]. On the GEE platform, the function ee.ImageCollection is used to call the Surface Reflectance product dataset after preprocessing, including radiometric calibration and atmospheric correction. To reduce errors caused by vegetation phenology and solar geometry changes, this study primarily selected Sentinel-2 remote sensing images synthesized from the monthly averages of June to September for each year, and resampled the spatial resolution of the bands used in this study to 10 m. Using the GEE remote sensing cloud platform to access Sentinel-2 remote sensing imagery, vegetation index values were calculated for each period, with water bodies, built-up zones, and cropland pixels excluded from the calculations.
2.3. Experimental Design
This study began in June 2022 and conducted acoustic rain enhancement experiments in Heika Town, Xinghai County, Hainan Tibetan Autonomous Prefecture, Qinghai Province. To effectively assess the impact of acoustic rain enhancement technology on the ecological environment, this paper uses the acoustic rain enhancement transmission point as the center and a 4 km radius as the maximum influence zone of acoustic rain enhancement, i.e., the acoustic rain enhancement experimental zone. Buffer zones were established around the experimental zone at 4 km intervals, extending outward to 16 km. Each layer serves as a comparison zone for the acoustic rain enhancement experiments. Specifically, the 4–8 km zone is Comparison Zone 1, the 8–12 km zone is Comparison Zone 2, and the 12–16 km zone is Comparison Zone 3.
The comparison zone serves as the benchmark for evaluating the effectiveness of acoustic rain enhancement experiments and is selected based on the following principles: (1) The average surface temperature and precipitation in the comparison zone from June to September should align with those in the experimental zone, and the mean values of these two natural variables should not differ significantly between rain-enhancement years and non-rain-enhancement years; (2) The comparison zone should not be influenced by the experimental zone. This study assumes that natural climate changes remain consistent within the 0–16 km range. Two approaches were used to assess the ecological effects of acoustic rain enhancement: (1) calculate and compare the difference in indicators between the experimental zone and the comparison zone, observing the differences between rain-enhancement years and non-rain-enhancement years; and (2) compare the difference in indicators between rain-enhancement years and non-rain-enhancement years across all regions, observing the differences between the experimental zone and the comparison zone.
2.4. Selection of Vegetation Ecological Indicators
To visually represent the vegetation growth status within the study zone using remote sensing imagery data, this study employs the Normalized Difference Vegetation Index (NDVI) to reflect vegetation growth characteristics [13,25,35]. This index can effectively evaluate the ecological effects of acoustic rain enhancement. In addition to calculating the NDVI for the experimental and comparison zones, this study also calculated seven other vegetation indices to reflect the vegetation characteristics of the experimental and comparison zones, namely the Enhanced Vegetation Index (EVI) [36], Red Edge Chlorophyll Index (ReCI) [37], Green Normalized Difference Vegetation Index (GNDVI) [38], Ratio Vegetation Index (RVI) [39], Difference Vegetation Index (DVI) [40], Atmospherically Resistant Vegetation Index (ARVI) [41], and Kernel Normalized Difference Vegetation Index (kNDVI) [30]. Their formulas are as follows:
In the equation, NIR, Red, Green, and Re represent the reflectance values of the near-infrared band, red band, green band, and red edge band of the Sentinel-2 image, respectively; G is the gain factor, C1 and C2 are the aerosol resistance term coefficients, and L is the canopy background adjustment value, with their respective values being G = 2.5, C1 = 6, C2 = 7.5, and L = 1; tanh is the hyperbolic tangent function.
2.5. Research Methods
2.5.1. Sequence Ratio Method
Using the ecological vegetation indices of the historical experiment zone or comparison zone in non-rain-enhancement years as the baseline, compare the differences between the experimental zone or comparison zone in acoustic rain-enhancement years and non-rain-enhancement years. The relative increase rate (percentage change) R and absolute increase amount (change amount) Q of the vegetation ecological indices in the experimental zone are calculated as follows:
In the equation, is the average value of ecological indices in the experimental zone during years with rain enhancement; is the average value of ecological indices in the experimental zone during years without rain enhancement.
2.5.2. Regional Single Ratio Analysis
A comparison was conducted between the vegetation indices of the acoustic rain enhancement experimental zone and the comparison zone. It was assumed that the ratio of vegetation indices values in the experimental zone and comparison zone prior to acoustic rain enhancement was 1, indicating that the natural climatic conditions of the comparison zone and experimental zone were similar. The average indicator value of the acoustic rain enhancement experimental zone or comparison zone was denoted as Y2, while the average vegetation indices value of the non-rain enhancement experiment zone or comparison zone was denoted as Y1. The formulas for the single ratio (SR) and the relative increase rate (percentage change) of vegetation indices values (RSR) are as follows:
2.5.3. Double Ratio Analysis
The double ratio analysis assumes that under natural conditions, the ratio of vegetation indices between the rain-enhancement experiment zone and the comparison zone in rain-enhancement years is the same as the corresponding ratio in non-rain-enhancement years. The ratio of ecological indicators between the experimental zone and the comparison zone in non-rain-enhancement years is used to replace the ratio of indicators between the two zones in rain-enhancement years. The estimated values of each ecological indicator in the experimental zone during the rain-enhancement year are calculated, and these are compared with the actual ecological indicator values in the experimental zone to determine the impact of acoustic rain enhancement on regional ecological indicator values [3,42], thereby obtaining the relative increase rate of vegetation indicator values. The formulas for the double ratio (DR) and the relative increase rate of ecological indicators are as follows:
In the formula, DR represents the double ratio of ecological indicators; RDR represents the relative increase rate of ecological indicators; SR represents the ratio of actual ecological indicator values between rain-enhancement years and non-rain-enhancement years; Y2 is the actual ecological indicator value of the experimental zone in rain-enhancement years; Y1 is the actual ecological indicator value of the experimental zone in non-rain-enhancement years; X2 is the actual ecological indicator value of the comparison zone in rain-enhancement years; X1 is the actual ecological indicator value of the comparison zone in non-rain-enhancement years. When DR > 1, it indicates that acoustic rain enhancement has a positive ecological effect; when DR = 1, it indicates that acoustic rain enhancement has no ecological effect; when DR < 1, it indicates that acoustic rain enhancement has a negative ecological effect.
3. Results and Analysis
3.1. Spatio-Temporal Distribution Characteristics of Vegetation Ecological Indices
3.1.1. Spatial Variation Characteristics of Vegetation Indices
Using the acoustic rain enhancement experiment site as the center and a radius of 16 km, the circular zone depicted in Figure 2 shows the spatial distribution maps of the three vegetation indices—RVI, kNDVI, and EVI—from 2021 to 2024, with the values of the three indices categorized into grades.
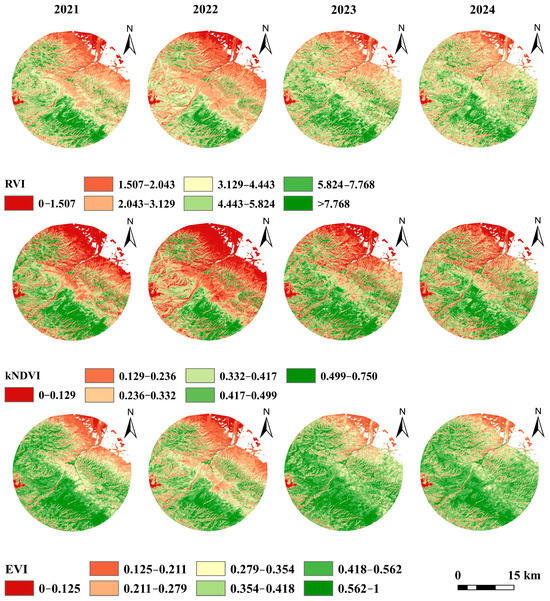
Figure 2.
Spatiotemporal distribution of vegetation indices.
From the spatial distribution maps of the three vegetation indices, it can be observed that there are differences in the spatial distribution of the three vegetation indices before and after the acoustic rain enhancement experiment. Before the experiment, there were more zones with lower vegetation index values (poorer vegetation growth) around the experimental site. After the experiment, the proportion of zones with poorer vegetation growth decreased significantly, while the proportion of zones with higher vegetation index values (better vegetation growth) increased. Based on the spatial distribution of vegetation indices, it can be concluded that the acoustic rain enhancement experiment effectively promoted vegetation growth by increasing regional precipitation, thereby enhancing the spatial coverage of vegetation in the zone.
To further validate the ecological effects of acoustic rain enhancement, we statistically analyzed the proportion of pixels corresponding to each vegetation index level based on spatial distribution maps of three vegetation indices (Figure 3). As shown in the figure, following the acoustic rain enhancement experiments, the proportion of pixels in low vegetation coverage zones exhibited a decreasing trend, while the proportion of pixels in high vegetation coverage zones correspondingly increased. Taking the kNDVI as an example, this study explicitly defines zones with kNDVI values greater than 0.417 as high vegetation coverage zones. Statistical data show that in 2021 and 2022, the proportions of pixels with vegetation index values greater than 0.417 were 31.45% and 21.17%, respectively. After the acoustic rain enhancement experiment, the proportion of pixels with vegetation index values greater than 0.417 in this region increased to 35.35% and 36.24%, respectively, representing increases of 3.90% and 4.79% compared to 2021. Similarly, in terms of the RVI, the proportions of pixels with an RVI greater than 4.443 were 31.34% and 26.66% in 2021 and 2022, respectively. By 2023 and 2024, these proportions had increased to 42.67% and 45.31%, respectively. These data clearly demonstrate that acoustic rain enhancement experiments have a significant promotional effect on improving vegetation index values, thereby reflecting positive ecological effects. In summary, from a multi-dimensional analysis of the pixel proportions of various vegetation indices, acoustic rain enhancement experiments have achieved significant results in improving vegetation coverage and regional ecological environments, effectively proving their ability to enhance vegetation growth and promote ecological environment quality improvement.
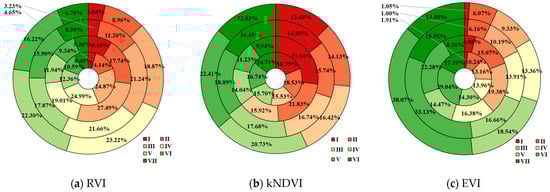
Figure 3.
Proportion of pixels by vegetation index grade.
3.1.2. Analysis of Temporal Variation Characteristics of Vegetation Ecological Indices
Since the Sentinel-2A satellite was not successfully launched until 2015, in order to analyze the variation characteristics of vegetation indices over a long-term time series before the acoustic rain enhancement experiment. Based on the analysis of 7 vegetation indices using Landsat 8 remote sensing data during the historical period (2013–2022) and the acoustic rain enhancement period (2023–2024) (Figure 4), the results indicate that the experimental zone and the three comparison zones exhibit significant spatial heterogeneity in the temporal changes in the differences in the 7 vegetation indices.
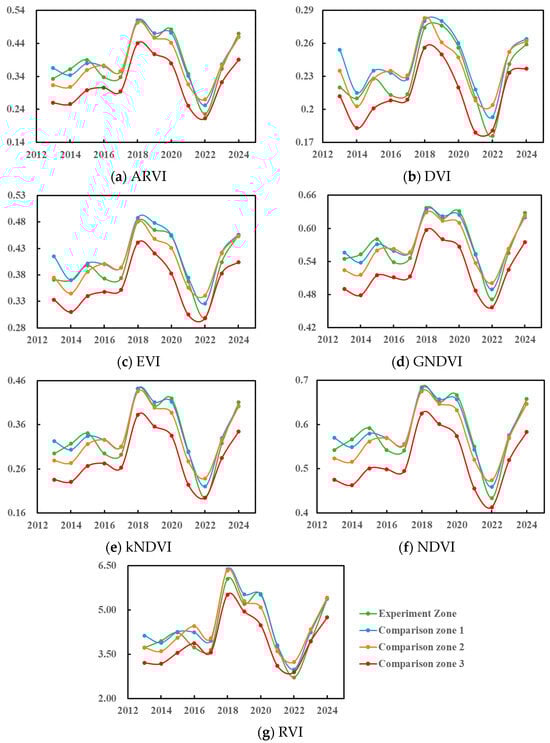
Figure 4.
Temporal changes in mean values of all indices for the experimental zone and three comparison zones.
The difference in vegetation indices is positively correlated with spatial distance, specifically showing a significant increasing trend as the distance from the acoustic rain enhancement experiment site increases. As shown in Figure 4, the farther the distance from the experimental zone, the larger the difference. From the time-series change diagrams of the seven vegetation indices, it can also be observed that during the natural climate fluctuation cycle from 2019 to 2022, the time-series curves of vegetation parameters 1–3 in the experimental zone and comparison zones 1–3 exhibit similar changes, indicating a long-term equilibrium relationship in their trends. However, after the implementation of acoustic rain enhancement technology in 2022, the growth rate of vegetation indices in the experimental zone was significantly higher than that in the comparison zone, with vegetation indices in the experimental zone improving more rapidly. Acoustic rain enhancement experiments promote vegetation growth, and acoustic intervention enhances the productivity of vegetation ecosystems by altering local water vapor condensation efficiency.
3.2. Statistical Test Results and Analysis
3.2.1. Sequence Ratio Analysis
A comparative analysis of changes in vegetation indices between the experimental zone and three comparison zones during rain-enhanced years and non-rain-enhanced years (Table 1) reveals that there are significant differences in the values of eight vegetation ecological indices between rain-enhanced and non-rain-enhanced years. Taking the experimental zone as an example, the increase in the kNDVI index is the most prominent. The average value of the index in non-rain-enhancement years is 0.273, while it jumps to 0.352 in rain-enhancement years, with an absolute increase of 0.079.

Table 1.
Comparison of mean values of eight indices between rain-enhanced years and non-rain-enhanced years.
The relative increase in vegetation indices during rain-enhanced years is greater than that during non-rain-enhanced years (Figure 5). The relative increase rate of kNDVI reached 29.04%, followed by ARVI with a relative increase rate of 26.36%, and RVI with a relative increase rate of 25.95%. The remaining indices also showed varying degrees of increase, with the increase range between 11.26% and 21.32%. Similarly, vegetation indices in the comparison zone also improved, but compared to the experimental zone, the increase trend in vegetation indices in the comparison zone was significantly lower than that in the experimental zone. Further analysis reveals that the farther the comparison zone is from the experimental zone, the lower the relative increase rate of its vegetation indices. That is, the farther the comparison zone is from the acoustic rain enhancement test site, the lower the vegetation indices values become. This phenomenon indicates that within the effective range of acoustic rain enhancement, this technology improves vegetation growth by increasing precipitation, thereby enhancing the values of eight vegetation indices in the region and positively contributing to ecological environment quality improvement. Additionally, the positive ecological effects of acoustic rain enhancement technology are robustly demonstrated from the perspective of the relative increase rate of vegetation indices means.
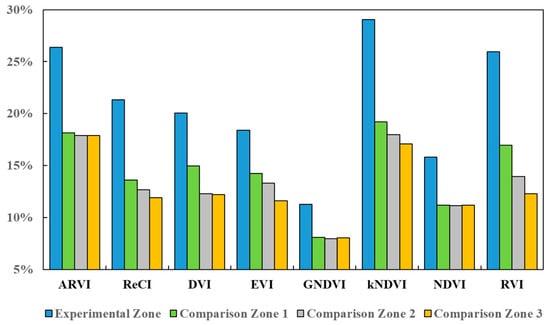
Figure 5.
Relative increase rate of eight vegetation indices in the experimental zone and three comparison zones.
3.2.2. Single-Ratio Analysis of Vegetation Indices
Statistical analysis yielded the average values of vegetation ecological indices in the experimental zones during rain-enhancement years and non-rain-enhancement years (Table 2). The changes in eight vegetation indices in 2024 and their regional single ratios were calculated. The top three indices in terms of percentage change in 2024 were kNDVI, RVI, and ARVI, with percentage changes of 32.13%, 30.28%, and 29.18%, respectively. It can also be observed that the minimum single ratio of the eight vegetation indices in the experimental zone before and after the acoustic rain enhancement was 1.113, and the maximum was 1.290, indicating the positive ecological effects of the acoustic rain enhancement experiment.
Table 2.
Paired comparison for the experimental zone: before and after acoustic rain enhancement.
Similarly, the changes in various indices before and after acoustic rain enhancement in Comparison Zone 1 are shown in Table 3. Compared to non-rain-enhancement years, the kNDVI showed the largest increase in 2024, with a change percentage of 20.22%. followed by ARVI, with a change percentage of 18.71% in 2024. Additionally, the individual ratio ranges of all indices in Comparison Zone 1 before and after acoustic rain enhancement were 1.029–1.077, all greater than 1, indicating that acoustic rain enhancement has a positive ecological effect. By comparing the changes in the eight vegetation indices before and after acoustic rain enhancement between the experimental zone and comparison zone 1, it can be observed that under natural climate change conditions, there are differences in the changes in various vegetation indices between the experimental zone and comparison zone 1. However, despite the average values of the eight vegetation indices in the experimental zone being lower than those in comparison zone 1 before acoustic rain enhancement, the changes in all indices in 2024 were greater than those in comparison zone 1, indicating that the effects of acoustic rain enhancement are relatively significant.
Table 3.
Paired comparison for comparison zone 1: before and after acoustic rain enhancement.
Table 4 shows the changes in various indices and their percentage changes before and after acoustic rain enhancement in comparison zone 2. In 2024, the percentage change range for various vegetation indices in comparison zone 2 was 9.77–19.82%, which was slightly lower than the increase rates in the experimental zone. The individual ratios of vegetation indices in comparison zone 2 ranged from 1.030 to 1.105. For comparison zone 3, the percentage changes in vegetation indices ranged from 9.51% to 18.68%, with the lowest percentage changes in vegetation indices compared to the experimental zone.
Table 4.
Paired comparison for comparison zone 2: before and after acoustic rain enhancement.
The 12–16 km circular comparison zone (comparison zone 3) was designated as the baseline region unaffected by the ecological benefits of acoustic rain enhancement. In 2024, the ARVI in the rain enhancement experiment zone increased by 0.043 (18.67%), and the ReCI increased by 0.140 (9.51%). DVI increased by 0.017 (11.82%), EVI increased by 0.033 (10.29%), GNDVI increased by 0.017 (10.09%), kNDVI increased by 0.042 (18.68%), NDVI increased by 0.033 (12.29%), and RVI increased by 0.654 (12.34%), confirming the positive ecological effects of acoustic rain enhancement.
3.2.3. Double Ratio Analysis of Acoustic Rain Enhancement Vegetation Indices
Three comparison zones were subjected to a two-way comparison analysis with the acoustic rain enhancement experiment zone (Figure 6). The study revealed that there were gradient differences in ecological response ratios between the experiment zone and the three comparison zones.
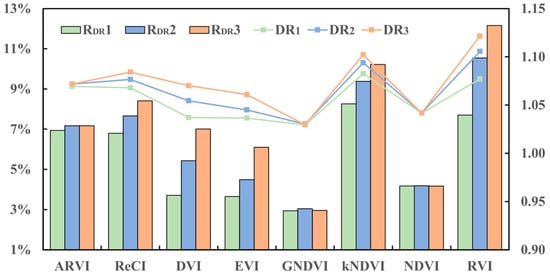
Figure 6.
Double ratio and relative increase rate of vegetation indices.
Following the acoustic rain enhancement experiment, the vegetation growth conditions in the rain-enhanced year were better than those in 2021 and 2022. After acoustic rain enhancement, when comparing comparison zone 1 with the experimental zone, the relative increase rates of eight vegetation indices ranged from 2.94% to 8.26%. For comparison zone 2, the relative increase rate of the RVI was the highest (10.54%), while the GNDVI had the smallest increase rate (3.04%). Within Comparison Zone 3, the average relative increase rates of all indices compared to the experimental zone ranged from 2.96% to 12.15%. In terms of the relative increase rates of vegetation indices, except for GNDVI and NDVI, which showed no significant changes, the improvement in vegetation increased as the distance to the acoustic rain enhancement influence zone decreased. This indicates that under the same climatic conditions, acoustic rain enhancement further strengthened vegetation growth in the influence zone, while the positive ecological effects of rain enhancement weakened with increasing distance. From the dual ratios, it can be seen that the dual ratios of all three regions are greater than 1, with the comparison zone 3 having the largest dual ratio. The larger the dual ratio, the stronger the positive ecological effect brought by acoustic rain enhancement.
To examine whether the differences in the eight vegetation indices before and after the acoustic rain enhancement in the experimental zone were statistically significant, a fishnet grid was created for each index in the experimental zone, followed by grid-based sampling. The data collected from the grid were then subjected to the Mann–Whitney U test. Except for the NDVI and GNDVI, the p-values of the statistical test results for all other indices were less than α at the significance level of α = 0.05. The null hypothesis that there was no significant difference in vegetation indices values before and after acoustic rain enhancement was rejected for these indices, indicating statistically significant results and demonstrating the notable effectiveness of the acoustic rain enhancement operation.
4. Discussion
In the context of global climate change, drought and water scarcity have become increasingly severe issues, not only affecting agricultural production but also impacting regional ecological and environmental quality. Against this grim backdrop, acoustic rain enhancement technology, as an emerging artificial weather modification technique, has garnered significant attention in recent years. This technology involves emitting strong acoustic waves into cloud layers to induce condensation of water vapor within the clouds, thereby increasing precipitation levels in the region [43]. This study utilized remote sensing imagery to construct eight vegetation indices and analyzed the spatio-temporal characteristics of vegetation changes, thereby thoroughly investigating the impact of acoustic rain enhancement technology on vegetation ecology. The findings indicate that the application of acoustic rain enhancement technology can significantly improve vegetation growth environments, thereby exerting a notable positive driving effect on ecosystems.
Changes in precipitation have a significant impact on soil moisture, and soil surface moisture content is a key factor influencing vegetation growth, soil and water conservation, and biological community richness, thereby determining the quality of the regional ecological environment. Research findings by Kang et al. indicate that vegetation cover exerts an influence on ecological environment quality second only to topographical factors, with both topography and vegetation jointly affecting regional ecological environment quality [44]. Precipitation is one of the key factors directly influencing vegetation coverage, playing a crucial role in ecological processes within vegetation communities and the growth cycles of vegetation [45]. Notably, Li [46] further supports this conclusion, showing that as simulated precipitation increases, both vegetation leaf area index and species diversity index exhibit an upward trend, aligning with the significant increases in vegetation indices observed in this study at the mechanistic level. In arid and semi-arid ecosystems, soil moisture thresholds constitute a critical constraint on vegetation recovery. Zhang et al. [47] effectively assessed the mitigating effects of artificial rainfall on drought severity, providing scientific basis for the formulation of drought prevention and mitigation measures. According to relevant research reports, vegetation restoration and ecological security construction in the Loess Plateau are primarily constrained by soil moisture, and natural precipitation timing is the sole pathway for vegetation to access soil moisture in this region, severely limiting the progress of local vegetation restoration and ecological security construction.
Artificial rainmaking (snowmaking) is a technique that utilizes the physical properties of different cloud layers to artificially introduce catalysts into clouds, thereby inducing precipitation. It is the most effective method for ecological restoration. Artificial rainmaking can supplement water shortages in regions, effectively increase soil surface moisture content, improve soil moisture conditions, promote vegetation growth, and thereby alleviate drought severity [48]. However, the rockets and artillery shells used in this process can pose risks to the safety of ground personnel and property. Acoustic rain enhancement technology, which taps into aerial water resources, can avoid such adverse effects, minimizing the risks associated with acoustic rain enhancement. Especially in arid and semi-arid regions, soil moisture is the primary constraint on plant survival and growth. The application of acoustic rain enhancement technology can alter precipitation levels in these regions, leading to a series of changes in vegetation phenology and community characteristics. Additionally, the extent to which precipitation resources replenish soil moisture reflects their influence on vegetation distribution [15,49,50]. Therefore, acoustic rain enhancement technology provides a solid theoretical basis for regional vegetation restoration and grassland development, offering broad application prospects and significant ecological significance.
This study has yielded positive conclusions by confirming the positive ecological effects of acoustic rain enhancement technology from the perspective of vegetation indices. However, several limitations remain and should be addressed in future research. Vegetation change is a complex process driven by the synergistic effects of multiple factors (e.g., temperature, soil type, nutrient content, human activities) [14,15,51]. While vegetation indices can effectively reflect vegetation greenness and biomass, they cannot precisely distinguish between vegetation changes driven by natural climate variability and those specifically attributable to acoustic rain enhancement at a more nuanced level. Among the various influencing factors, temperature is also a critical environmental factor regulating plant physiological activities, and its interannual fluctuations significantly impact vegetation growth. High temperatures directly affect the growth and development rates of vegetation. Exceptionally high temperatures can exacerbate evapotranspiration, leading to water stress, which may negatively affect vegetation growth even under normal rainfall conditions [52,53]. The acoustic rain enhancement experiment was conducted during the vegetation growing season, and since temperature variation within the experimental area was not significant, its effect could be neglected. Furthermore, inherent spatial heterogeneity in attributes such as soil type, nutrient content, and pH value constitutes another important cause of vegetation variation [54,55].
In summary, it is necessary for future research to introduce multi-factor collaborative assessment, ground verification, radar detectors, and other methods to construct a multi-dimensional and comprehensive explanatory framework. Furthermore, although the Sentinel-2 data adopted in this study provide valuable time-series information at a regional scale, the utilization of Unmanned Aerial Vehicle (UAV) imagery in future investigations can help reveal the ecological effects of acoustic rain enhancement on vegetation more accurately and mechanistically. By enhancing spatial resolution, such an approach can effectively mitigate interference from spatiotemporal environmental heterogeneity, thereby providing robust evidence for establishing the relationship between acoustic rain enhancement technology and vegetation response.
5. Conclusions
This study analyzes the characteristics of vegetation index changes in acoustic rain enhancement experimental zone and comparison zones, confirming that acoustic rain enhancement technology has a significant and positive ecological effect on promoting vegetation growth. The main conclusions are as follows:
- (1)
- Within a 16 km radius of the acoustic rain enhancement test site, the technology demonstrates a clear improvement in vegetation, with effects diminishing as distance increases. After two years of implementation, the experimental zone showed notable increases in vegetation indices. For instance, the proportion of pixels with kNDVI > 0.417 significantly rose from 52.62% to 71.59% (a relative increase of 36.05%), while the proportion of zones with low vegetation coverage (kNDVI < 0.236) decreased. These results indicate that acoustic rain enhancement effectively alleviates water limitations and that its ecological impact weakens with increasing distance.
- (2)
- Following the implementation of acoustic rain enhancement in 2023, the vegetation growth trend in the experimental zone surpassed that of the comparison zones, and the relative increase rates of various vegetation indices were higher during the enhancement years compared to non-enhancement years. The kNDVI in the experimental zone showed the most prominent increase, with an average annual value during enhancement years rising by 29.04% compared to non-enhancement years. The increase was smaller in comparison zones farther away. Acoustic rain enhancement represents an artificial intervention that adds a positive ecological disturbance beyond regional climatic conditions, and its improving effect on ecological environment quality is identifiable.
- (3)
- In 2024, the percentage changes in indices such as kNDVI, RVI, and ARVI in the experimental zone compared to the non-enhancement baseline period were 32.13%, 30.28%, and 29.18%, respectively—significantly higher than those in the comparison zones. This confirms that acoustic rain enhancement technology not only effectively mitigates drought stress, but also markedly enhances grassland productivity and ecosystem service functions.
Acoustic rain enhancement is an emerging technology with practical application potential, offering a new solution for vegetation restoration and water resource management in arid and semi-arid regions. It not only helps address water scarcity but also provides effective support for grassland conservation and restoration at the ecological level, demonstrating broad potential for promotion.
Author Contributions
Conceptualization, G.C., J.W., Q.L. and T.L.; methodology, G.C., J.W. and T.L.; software, G.C. and J.W.; validation, J.W. and Z.L.; formal analysis, J.W.; investigation, G.C.; resources, J.W.; data curation, Z.L. and S.K.T.; writing—original draft preparation, J.W.; writing—review and editing, G.C.; visualization, J.W., Z.L. and S.K.T.; supervision, Q.L.; project administration, G.C.; funding acquisition, G.C. and Q.L. All authors have read and agreed to the published version of the manuscript.
Funding
This research was funded by Major Science and Technology Projects of Qinghai Province, grant number 2024-SF-A6.
Data Availability Statement
The raw data supporting the conclusions of this article will be made available by the authors on request.
Acknowledgments
The authors would like to acknowledge to all reviewers who have given us valuable information.
Conflicts of Interest
The authors declare no conflicts of interest.
Abbreviations
The following abbreviations are used in this manuscript:
| PSR | Pressure-State-Response model |
| EVI | Enhanced Vegetation Index |
| kNDVI | Kernel Normalized Difference Vegetation Index |
| NIRv | Near-Infrared Reflectance of Terrestrial Vegetation |
| RVI | Ratio Vegetation Index |
| GEE | Google Earth Engine |
| NDVI | Normalized Difference Vegetation Index |
| ReCI | Red Edge Chlorophyll Index |
| GNDVI | Green Normalized Difference Vegetation Index |
| DVI | Difference Vegetation Index |
| ARVI | Atmospherically Resistant Vegetation Index |
| NIR | Near-Infrared |
| R | Relative Increase Rate |
| Q | Absolute Increase |
| SR | Single Ratio |
| DR | Double Ratio |
| UAV | Unmanned Aerial Vehicle |
References
- Du, X.; Yang, G.; Yuan, H.; Wu, Y.; Lv, Z.; Du, C.; Jian, J.; Wang, Q.; Huang, L.; Chen, W. Bibliometric Insights into Terracing Effects on Water Resources Under Climate Change: Advances in Remote Sensing and GIS Applications. Water 2025, 17, 1125. [Google Scholar] [CrossRef]
- Chen, M.; Li, T.; Huang, Y.; Chen, G. Atmospheric Water Resources Utilization: Technology, Applications, and Ecological Economic Benefits. Bull. Chin. Acad. Sci. 2025, 40, 1317–1328. (In Chinese) [Google Scholar] [CrossRef]
- Yao, Z.; Liu, Z.; Wang, J.; Li, T.; Liu, D.; Huang, B.; Zhang, Z. Effect Evaluation of Acoustic Rain Enhancement Operations of Stratus-Cumulus Mixed Clouds in the Leizhou Peninsula. J. Basic Sci. Eng. 2024, 32, 1211–1226. (In Chinese) [Google Scholar]
- Pan, P.; Shi, Y.; Zhao, Z.; Wang, J.; Cao, J.; Bai, W.; Xie, H.; Wei, J. Microphysical Characteristics of Precipitation under the Intervention of Acoustic Over an Inland Arid Region. Arid Land Geogr. 2021, 44, 906–913. (In Chinese) [Google Scholar]
- Wei, J.; Qiu, J.; Li, T.; Huang, Y.; Qiao, Z.; Cao, J.; Zhong, D.; Wang, G. Cloud and Precipitation Interference by Strong Low-frequency Sound Wave. Sci. China Tech. Sci. 2021, 64, 261–272. [Google Scholar] [CrossRef]
- Shi, Y.; Wei, J.; Li, Q.; Yang, H.; Qiao, Z.; Ren, Y.; Ni, S.; He, J.; Shen, W.; Cao, S.; et al. Investigation of Vertical Microphysical Characteristics of Precipitation Under the Action of Low-Frequency Acoustic Waves. Atmos. Res. 2021, 249, 105283. [Google Scholar] [CrossRef]
- Li, C.; Wang, R.; Shen, S. Evaluation on Environmental Effects of Artificial Precipitation Based on PSR Model in Urumqi. Environ. Sci. Technol. 2014, 37, 171–176. (In Chinese) [Google Scholar]
- Zou, H.; Gao, G.; Fu, B. The Relationship Between Grassland Ecosystem and Soil Water in Arid and Semi-Arid Areas: A Review. Acta Ecol. Sin. 2016, 36, 3127–3136. (In Chinese) [Google Scholar]
- Felton, A.J.; Slette, I.J.; Smith, M.D.; Knapp, A.K. Precipitation Amount and Event Size Interact to Reduce Ecosystem Functioning During Dry Years in A Mesic Grassland. Glob. Change Biol. 2019, 26, 658–668. [Google Scholar] [CrossRef]
- Xie, Z.; Zhu, W.; Fu, Y. Key Issues of Remote Sensing-Based Vegetation Phenology Monitoring. Natl. Remote Sens. Bull. 2024, 28, 2131–2143. (In Chinese) [Google Scholar] [CrossRef]
- Ye, C.; Han, L.; Miao, F. Monitoring and Analysis of Vegetation Using Remote Sensing in 5.12 Wenchuan Earthquake Region. Prog. Geophys. 2012, 27, 1922–1928. (In Chinese) [Google Scholar]
- Mao, Z.; Wang, M.; Chu, J.; Sun, J.; Liang, W.; Yu, H. Feature Extraction and Analysis of Reclaimed Vegetation in Ecological Restoration Area of Abandoned Mines Based on Hyperspectral Remote Sensing Images. J. Arid Land 2024, 16, 1409–1425. [Google Scholar] [CrossRef]
- Bai, Y.; Li, S.; Liu, M.; Guo, Q. Assessment of Vegetation Change on the Mongolian Plateau Over Three Decades Using Different Remote Sensing Products. J. Environ. Manag. 2022, 317, 115509. [Google Scholar] [CrossRef]
- Laporte, M.F.; Duchesne, L.; Wetzel, S. Effect of Rainfall Patterns on Soil Surface CO2 Efflux, Soil Moisture, Soil Temperature and Plant Growth in A Grassland Ecosystem of Northern Ontario, Canada: Implications for Climate Change. BMC Ecol. 2002, 2, 10. [Google Scholar] [CrossRef]
- She, W.; Bai, Y.; Zhang, Y.; Qin, S.; Jia, X.; Feng, W.; Lai, Z.; Fu, J.; Qiao, Y. Nitrogen Enrichment Suppresses Revegetated Shrub Growth Under Increased Precipitation Via Herb-Induced Topsoil Water Limitation in A Desert Ecosystem in Northern China. Plant Soil 2020, 446, 97–110. [Google Scholar] [CrossRef]
- Zhang, X.; Li, X. An Innovative Index for Separating the Effects of Temperature and Precipitation on Global Vegetation Change. iScience 2023, 26, 106972. [Google Scholar] [CrossRef] [PubMed]
- Antala, M.; Rastogi, A.; Stróżecki, M.; Saiz, M.; Bandopadhyay, S.; Juszczak, R. Evaluating Remote Sensing Metrics for Land Surface Phenology in Peatlands. Remote Sens. 2024, 17, 32. [Google Scholar] [CrossRef]
- Xu, J.; Tang, Y.; Xu, J.; Chen, J.; Shu, S.; Ni, J.; Zhou, X.; Yu, B.; Wu, J.; Huang, Y. Impact of Snow on Vegetation Green-Up Dynamics on the Tibetan Plateau: Integration of Survival Analysis and Remote Sensing Data. Agric. For. Meteorol. 2025, 362, 110377. [Google Scholar] [CrossRef]
- Chen, L.; Li, C.; Pan, C.; Yan, Y.; Jiao, J.; Zhou, Y.; Wang, X.; Zhou, G. Estimating the Effects of Natural and Anthropogenic Activities on Vegetation Cover: Analysis of Zhejiang Province, China, from 2000 to 2022. Remote Sens. 2025, 17, 1433. [Google Scholar] [CrossRef]
- Nila, M.; Bobrowski, M.; Schickhoff, U. Growing Season Normalized Difference Vegetation Index in the Nepal Himalaya and Adjacent Areas, 2000–2019: Sensitivity to Climate Change and Terrain Factors. Land 2025, 14, 749. [Google Scholar] [CrossRef]
- Rahimabadi, P.; Abdolshahnejad, M.; Alamdarloo, E.; Azarnivand, H. Vegetation Dynamics Assessment: Remote Sensing and Statistical Approaches to Determine the Contributions of Driving Factors. J. Indian Soc. Remote Sens. 2024, 52, 1969–1984. [Google Scholar] [CrossRef]
- Seka, A.; Zhang, J.; Prodhan, F.; Ayele, G.; Finsa, M.; Sharma, T.P.P.; Melesse, A. Hydrological Drought Impacts on Water Storage Variations: A Focus on the Role of Vegetation Changes in the East Africa Region. A Systematic Review. Environ. Sci. Pollut. Res. Int. 2022, 29, 80237–80256. [Google Scholar] [CrossRef] [PubMed]
- Dashpurev, B.; Wesche, K.; Jäschke, Y.; Oyundelger, K.; Phan, T.; Bendix, J.; Lehnert, L. A Cost-Effective Method to Monitor Vegetation Changes in Steppes Ecosystems: A Case Study on Remote Sensing of Fire and Infrastructure Effects in Eastern Mongolia. Ecol. Indic. 2021, 132, 108331. [Google Scholar] [CrossRef]
- Wang, T.; Guan, T.; Qiu, F.; Liu, L.; Zhang, X.; Zeng, H.; Zhang, Q. Evaluation of Scale Effects on UAV-Based Hyperspectral Imaging for Remote Sensing of Vegetation. Remote Sens. 2025, 17, 1080. [Google Scholar] [CrossRef]
- Favretto, A. Checking Vegetation Changes with Remote Sensing: The Case of the Trieste Province (North-East of Italy). Remote Sens. Appl. Soc. Environ. 2018, 11, 1–10. [Google Scholar] [CrossRef]
- Chen, Y.; Khongdee, N.; Wang, Y.; Song, Q.; Lu, D.; Wang, S.; Chen, Y. Spatiotemporal Trends of Rubber Defoliation and Refoliation and Their Responses to Abiotic Factors in the Northern Edge of the Asian Tropics. Ind. Crops Prod. 2025, 226, 120753. [Google Scholar] [CrossRef]
- Yang, L.; Shi, L.; Li, J.; Kong, H.; Shan, Z. Spatiotemporal Variation Pattern and Spatial Coupling Relationship Between NDVI and LST in Mu Us Sandy Land. Open Geosci. 2024, 16, 20220691. [Google Scholar] [CrossRef]
- Mamun, M.; Alauddin, M.; Meraj, G.; Almazroui, M.; Ehsan, M. Evaluating the Spatiotemporal Variation of Agricultural Droughts in Bangladesh Using MODIS-based Vegetation Indices. Earth Syst. Environ. 2024, 8, 997–1010. [Google Scholar] [CrossRef]
- Dechant, B.; Ryu, Y.; Badgley, G.; Köhler, P.; Rascher, U.; Migliavacca, M.; Zhang, Y.; Tagliabue, G.; Guan, K.; Rossini, M.; et al. NIRVP: A Robust Structural Proxy for Sun-Induced Chlorophyll Fluorescence and Photosynthesis Across Scales. Remote Sens. Environ. 2022, 268, 112763. [Google Scholar] [CrossRef]
- Camps-Valls, G.; Campos-Taberner, M.; Moreno-Martínez, Á.; Walther, S.; Duveiller, G.; Cescatti, A.; Mahecha, M.D.; Muñoz-Marí, J.; García-Haro, F.J.; Guanter, L.; et al. A Unified Vegetation Index for Quantifying the Terrestrial Biosphere. Sci. Adv. 2021, 7, eabc7447. [Google Scholar] [CrossRef]
- Huete, A.; Didan, K.; Miura, T.; Rodriguez, E.P.; Gao, X.; Ferreira, L.G. Overview of the Radiometric and Biophysical Performance of the MODIS Vegetation Indices. Remote Sens. Environ. 2002, 83, 195–213. [Google Scholar] [CrossRef]
- Drusch, M.; Bello, U.D.; Carlier, S.; Colin, O.; Fernandez, V.; Gascon, F.; Hoersch, B.; Isola, C.; Laberinti, P.; Martimort, P.; et al. Sentinel-2: ESA′s Optical High-Resolution Mission for GMES Operational Services. Remote Sens. Environ. 2012, 120, 25–36. [Google Scholar] [CrossRef]
- Pham-Duc, B.; Nguyen, H.; Phan, H.; Tran-Anh, Q. Trends and applications of google earth engine in remote sensing and earth science research: A bibliometric analysis using scopus database. Earth Sci. Inf. 2023, 16, 2355–2371. [Google Scholar] [CrossRef]
- Gorelick, N.; Hancher, M.; Dixon, M.; Ilyushchenko, S.; Thau, D.; Moore, R. Google Earth Engine: Planetary-scale geospatial analysis for everyone. Remote Sens Environ. 2017, 202, 18–27. [Google Scholar] [CrossRef]
- Ma, L.; Yan, H.; He, Y.; Zhang, Q.; Liu, B. Vegetation Changes in South Himalayas Areas Based Onremote Sensing Monitoring During 2001–2015. Arid Land Geogr. 2017, 40, 405–414. (In Chinese) [Google Scholar]
- Miura, T.; Yoshioka, H.; Huete, A.R. Evaluation of Sensor Calibration Uncertainties on Vegetation Indices for MODIS. IEEE Trans. Geosci. Remote Sens. 2000, 38, 1399–1409. [Google Scholar] [CrossRef]
- Clevers, J.G.P.W.; Gitelson, A.A. Remote Estimation of Crop and Grass Chlorophyll and Nitrogen Content Using Red-edge bands on Sentinel-2 and -3. Int. J. Appl. Earth Obs. Geoinf. 2013, 23, 344–351. [Google Scholar] [CrossRef]
- Daughtry, C.S.T.; Gallo, K.P.; Goward, S.N.; Prince, S.D.; Kustas, W.P. Spectral Estimates of Absorbed Radiation and Phytomass Production in Corn and Soybean Canopies. Remote Sens. Environ. 1992, 39, 141–152. [Google Scholar] [CrossRef]
- Zheng, Y.; Xu, Y.; Yan, H.; Zheng, Y. Analysis of Influencing Factors in Wheat/Maize Canopy RVI and NDVI Acquisition Using Ground-Based Remote Sensing System. Spectrosc. Spectral Anal. 2021, 41, 2578–2585. [Google Scholar]
- Richardson, A.J.; Wiegand, C.L. Distinguishing Vegetation from Soil Background Information. Photogramm. Eng. Remote Sens. 1977, 43, 1541–1552. [Google Scholar]
- Kaufman, Y.J.; Tanre, D. Atmospherically Resistant Vegetation Index (ARVI) for EOS-MODIS. IEEE Trans. Geosci. Remote Sens. 1992, 30, 261–270. [Google Scholar] [CrossRef]
- Liu, Z. Evaluation of the Effectiveness of Acoustic Rain Enhancement Experiment in Leizhou Peninsula. Master’s Thesis, Chinese Academy of Meteorological Sciences, Beijing, China, 2024. (In Chinese). [Google Scholar]
- Wang, M.; Li, J.; Chen, J.; Wang, J.; Shao, S. Impact of Acoustic Waves on Rainfall Distribution in Acoustics-induced Artificial Rainfall Technology. Results Eng. 2021, 27, 105895. [Google Scholar] [CrossRef]
- Kang, L.; Xin, C.; Yang, Y.; Xin, S.; Wang, Y.; Chen, N.; Zhang, B.; Zhu, K.; Ma, X.; Chen, H. Remote Sensing Evaluation of Ecological Environment Quality in Gansu Province and Quantitative Identification of Its Driving Factors. Environ. Sci. 2025, 46, 3730–3746. (In Chinese) [Google Scholar]
- Wang, L.; Jiao, L.; Lai, F.; Zhang, N. Evaluation of Ecological Changes Based on A Remote Sensing Ecological Index in A Manas Lake Wetland, Xinjiang. Acta Ecol. Sin. 2019, 39, 2963–2972. (In Chinese) [Google Scholar] [CrossRef]
- Li, X. Effect and Mechanism of Stimulated Precipitation Change on Soil Respiration in Yellow River Delta Wetland. Ph.D. Thesis, Yantai Institute of Coastal Zone Research, Chinese Academy of Sciences, Yantai, China, 2023. (In Chinese). [Google Scholar]
- Zhang, Z.; Fu, J.; Tang, W.; Liu, Y.; Zhang, H.; Fang, X. Spatiotemporal Variations of Drought and the Related Mitigation Effects of Artificial Precipitation Enhancement in Hengyang-Shaoyang Drought Corridor, Hunan Province, China. Atmosphere 2022, 13, 1307. [Google Scholar] [CrossRef]
- Liu, R.; Zhou, H.; Li, D.; Zeng, L.; Xu, P. Evaluation of Artificial Precipitation Enhancement Using UNET-GRU Algorithm for Rainfall Estimation. Water 2023, 15, 1585. [Google Scholar] [CrossRef]
- Ge, F.; Wang, N.; Hu, S.; Zhou, Z.; Jiang, P. Evaluation of Germination Response and the Resistance of Main Plant Species Seedling to Drought Stress in the Hill-gullied Loess Plateau Region of Northern Shaanxi. Pratac. Sci. 2018, 35, 348–356. (In Chinese) [Google Scholar]
- Zhao, Z.; Li, Y.; Liu, K.; Wu, C.; Yu, B.; Liu, G.; Wang, Y. Layered Soil Moisture Retrieval and Agricultural Application Based on Multi-Source Remote Sensing and Vegetation Suppression Technology: A Case Study of Youyi Farm, China. Remote Sens. 2025, 17, 2130. [Google Scholar] [CrossRef]
- Assiri, M.E.; Ali, M.A.; Siddiqui, M.H.; AlZahrani, A.; Alamri, L.; Alqahtani, A.M.; Ghulam, A.S. Remote Sensing Assessment of Water Resources, Vegetation, and Land Surface Temperature in Eastern Saudi Arabia: Identification, Variability, and Trends. Remote Sens. Appl. Soc. Environ. 2024, 36, 101296. [Google Scholar] [CrossRef]
- Shi, H.; Li, Z.; Xiang, Y.; Tang, Z.; Sun, T.; Du, R.; Li, W.; Liu, X.; Huang, X.; Liu, Y.; et al. Integrating Multi-source Remote Sensing and Machine Learning for Root-zone Soil Moisture and Yield Prediction of Winter Oilseed Rape (Brassica napus L.): A New Perspective From the Temperature-vegetation Index Feature Space. Agric. Water Manag. 2024, 308, 109129. [Google Scholar] [CrossRef]
- Sun, H.; Xu, Z.; Liu, H. An Evaluation of the Response of Vegetation Greenness, Moisture, Fluorescence, and Temperature-based Remote Sensing Indicators to Drought Stress. J. Hydrol. 2023, 625, 130125. [Google Scholar] [CrossRef]
- Zhang, K.; Ning, L.; Ning, K.; Jin, Z.; Wang, X.; Zhu, H. Structural Characteristics and Spatial Heterogeneity of Vegetation and Below-ground Habitat During the Long-term Succession of Ecosystems in Mining Areas. Ecol. Eng. 2025, 215, 107601. [Google Scholar] [CrossRef]
- Cen, Y.; Gao, Z.; Sun, G.; Lou, Y.; Zhang, S.; Li, Y.; Wu, T. Effects of Soil Conservation on the Spatial Heterogeneity of Vegetation Carbon Sequestration in the Yellow River Basin, China. Land Degrad. Dev. 2023, 34, 4607–4622. [Google Scholar] [CrossRef]
Disclaimer/Publisher’s Note: The statements, opinions and data contained in all publications are solely those of the individual author(s) and contributor(s) and not of MDPI and/or the editor(s). MDPI and/or the editor(s) disclaim responsibility for any injury to people or property resulting from any ideas, methods, instructions or products referred to in the content. |
© 2025 by the authors. Licensee MDPI, Basel, Switzerland. This article is an open access article distributed under the terms and conditions of the Creative Commons Attribution (CC BY) license (https://creativecommons.org/licenses/by/4.0/).