Article

Linking Acoustic Indices to Vegetation and Microclimate in a Historical Urban Garden: Setting the Stage for a Restorative Soundscape

1
Department of Land, Environment, Agriculture and Forestry (TESAF), University of Padova, 35020 Padova, Italy
2
Research Centre for Forestry and Wood, CREA, 52100 Arezzo, Italy
3
Interdepartmental Research Center of Geomatics (CIRGEO), University of Padova, 35131 Padova, Italy
4
Department of General Psychology, University of Padua, 35121 Padua, Italy
5
Department of Neuroscience (DNS), University of Padova, 35121 Padova, Italy
6
Padova Neuroscience Center (PNC), University of Padova, 35131 Padova, Italy
*
Author to whom correspondence should be addressed.
Land 2025, 14(10), 1970; https://doi.org/10.3390/land14101970
Submission received: 11 July 2025 / Revised: 16 September 2025 / Accepted: 25 September 2025 / Published: 30 September 2025

Abstract

Urban soundscapes are increasingly recognized as fundamental for both ecological integrity and human well-being, yet the complex interplay between the vegetation structure, seasonal dynamics, and microclimatic factors in shaping these soundscapes remains poorly understood. This study tests the hypothesis that vegetation structure and seasonally driven biological activity mediate the balance and the quality of the urban acoustic environment. We investigated seasonal and spatial variations in five acoustic indices (NDSI, ACI, AEI, ADI, and BI) within a historical urban garden in Castelfranco Veneto, Italy. Using linear mixed-effects models, we analyzed the effects of season, microclimatic variables, and vegetation characteristics on soundscape composition. Non-parametric tests were used to assess spatial differences in vegetation metrics. Results revealed strong seasonal patterns, with spring showing increased NDSI (+0.17), ADI (+0.22), and BI (+1.15) values relative to winter, likely reflecting bird breeding phenology and enhanced biological productivity. Among microclimatic predictors, temperature (p < 0.001), humidity (p = 0.014), and solar radiation (p = 0.002) showed significant relationships with acoustic indices, confirming their influence on both animal behaviour and sound propagation. Spatial analyses showed significant differences in acoustic patterns across points (Kruskal–Wallis p < 0.01), with vegetation metrics such as tree density and evergreen proportion correlating with elevated biophonic activity. Although the canopy height model did not emerge as a significant predictor in the models, the observed spatial heterogeneity supports the role of vegetation in shaping urban sound environments. By integrating ecoacoustic indices, LiDAR-derived vegetation data, and microclimatic parameters, this study offers novel insights into how vegetational components should be considered to manage urban green areas to support biodiversity and foster acoustically restorative environments, advancing the evidence base for sound-informed urban planning.

1. Introduction

1.1. Research Background

Urban soundscapes reflect complex ecological and environmental processes that profoundly affect both biodiversity and human well-being [1,2]. A growing body of research shows that exposure to natural sounds—particularly birdsong—can reduce stress, boost mood and positively impact well-being, and enhance cognitive performance [3,4,5]. These findings align with the biopsychosocial model of restorative environments, where nature-derived stimuli contribute to both physiological recovery and psychological restoration [6,7]. Within this context, urban green area vegetation can act as acoustic refuges, buffering anthropogenic noise while fostering vibrant biophonic activity [5].

1.2. Soundscape Components and Acoustic Indices

Acoustic environments are composed of sounds originating from distinct sources, generally categorized into three major components: biophony, referring to sounds produced by living organisms and typically occupying the 2–14 kHz range; anthropophony, which includes human-made mechanical noises commonly found between 0.1 and 2 kHz; and geophony, generated by natural physical processes such as wind or rainfall, usually extending across the full frequency spectrum but with a predominance in the lower frequencies [1,8,9]. As also noted by Benocci et al. [10], the frequency thresholds commonly used to distinguish biophonic and anthropophonic components may be somewhat artificial, since many species can vocalize outside these bounds. Nonetheless, such categorizations remain useful for the scientific community as they provide a standardized framework for assessing soundscapes and developing acoustic indices. Among the tools for assessing soundscapes’ ecological quality in urban settings, acoustic indices—such as the Normalized Difference Soundscape Index (NDSI), Acoustic Complexity Index (ACI), Acoustic Evenness Index (AEI), Acoustic Diversity Index (ADI), and Bioacoustic Index (BI)—have gained momentum for their ability to capture patterns in biotic and abiotic sound components, offering a non-invasive method for biodiversity monitoring and detecting shifts in ecological dynamics across space and time [2,11,12,13]. Given that no single index can fully represent the multidimensional nature of soundscapes, combining multiple indices reduces the risk of bias and provides a more robust assessment of biodiversity and anthropogenic pressure across different spatial and temporal scales [14]. The integrated use of multiple acoustic indices facilitates the extraction of detailed information on specific sound characteristics, while offering an objective, standardized, and replicable approach for soundscape quantification [14,15]. This enables both spatial comparisons across sites and temporal monitoring of acoustic patterns over time [16,17].

1.3. Ecoacoustic Monitoring Evidence

Vegetation plays a critical role in mediating acoustic environments by altering sound transmission dynamics and modulating the effects of anthropogenic noise on biodiversity, particularly in avian species that rely on acoustic signals for intra- and interspecific communication. Moreover, urban vegetation provides essential structural components for birds nesting and foraging [18]. Therefore, the structural and compositional attributes of vegetation are increasingly acknowledged as key variables that influence site conditions, local biodiversity, and the related acoustic comfort of urban dwellers [19,20,21]. For instance, denser and structurally complex vegetation can attenuate anthropogenic noise while enhancing habitat for vocalizing species [5]. Vertical stratification afforded by tall canopy, high basal area, and evergreen understory supports acoustic niche differentiation, consistent with the acoustic niche hypothesis [1,4]. Finally, recent urban forestry research has demonstrated that forest structure directly partitions sound frequencies by buffering anthropophony and promoting biophony [5,18,22]. With increasing urbanization, understanding how vegetation structure, seasonal dynamics, and microclimate shape soundscapes has become critical for sustainable city planning and conservation [3,23,24,25]. Nevertheless, despite the growing adoption of ecoacoustic approaches in urban settings, several knowledge gaps remain. As highlighted by the recent literature, most soundscape studies have been conducted in relatively undisturbed habitats such as natural forests or conservation areas [26], whereas our understanding of soundscape dynamics in human-dominated green spaces remains limited [27,28]. Even though European policies such as Directive 2002/49/EC [29] have promoted efforts to improve acoustic quality in urban parks [10], the application of acoustic indices in urban environments is still debated. Challenges include the unpredictable nature of anthropophonic signals such as traffic and speech [30], as well as methodological uncertainties about how anthropogenic noise influences index behaviour [31,32,33]. Furthermore, there is limited understanding of how acoustic indices relate to physical vegetation structures in spatially complex urban green infrastructures, particularly in high-resolution studies [34]. While indices such as ACI, AEI, and ADI were originally designed to estimate biodiversity through sound diversity, complexity, and distribution patterns [15,35,36], their effectiveness in urban contexts—characterized by noisy, dynamic, and fragmented habitats—remains an open question [37,38,39]. These concerns highlight the need for site-specific investigations that test the validity and interpretability of acoustic indices within real-world urban conditions, especially in heritage or restored gardens with structured vegetation and diverse microhabitats.

1.4. Research Significance

This study primarily aims to explore how established acoustic indices respond to environmental gradients—specifically seasonality, microclimatic variability, and vegetation structure—within the context of an urban historical garden. Rather than validating the indices themselves, we use them as tools to characterize the soundscape and examine how it is modulated by ecological and meteorological drivers across space and time. Specifically, the objectives of this study are to (1) assess how acoustic indices vary across seasons and in relation to meteorological drivers, (2) evaluate spatial differences in soundscape composition across four fixed recording points by comparing acoustic indices with vegetation metrics, and (3) investigate the role of local vegetation structure in shaping the acoustic environment. We hypothesize that seasonally driven biological activity and weather conditions shape acoustic patterns, while vegetation heterogeneity amplifies biophonic signals and mediates anthropophonic interference. The study aims to assess overall soundscape composition, including both biophonic, geophonic, and anthropophonic components, rather than focusing exclusively on specific sources of sounds. Moreover, our approach does not aim to test the performance of the indices themselves, but to apply them in a realistic urban setting to better understand ecological soundscape dynamics. By combining bioacoustic, seasonal patterns, microclimate conditions variability, and vegetation data, this study aims to inform urban green infrastructure design that promotes acoustically restorative and biodiverse soundscapes. Such insights are crucial for planners and ecologists seeking to design or manage urban landscapes that promote restorative, biodiverse, and ecologically functional soundscapes.

2. Materials and Methods

2.1. Study Area

This study was conducted in the historical urban garden of Villa Revedin Bolasco, located in Castelfranco Veneto, Italy (45.6736° N, 11.9340° E)—an exceptional site of both cultural heritage and ecological significance, awarded the title of ’Most Beautiful Urban Park’ in a national competition in 2018. Owned and managed by the University of Padova, the garden offers an ideal setting for controlled fieldwork. In fact, it serves as a research and pilot site for several EU- and nationally funded projects, among which the Horizon 2020 project VARCITIES. This European initiative aims to implement nature-based solutions for healthier and more inclusive urban spaces, integrating well-being and sustainability goals. As part of the project, acoustic monitoring was deployed to assess the biodiversity and restorative potential of the garden’s green infrastructure, with the intention of informing evidence-based management for urban resilience and quality of life. The historical garden of Villa Revedin Bolasco is characterized by a mixture of more than 1000 ornamental trees, evergreen and deciduous species, and a complex vegetative structure typical of European formal gardens. The site covers approximately 8 hectares and includes pathways, open lawns, a 2-hectare-wide lake, and densely vegetated patches, providing heterogeneous soundscape conditions that are well-suited for ecoacoustic investigation [13].

2.2. Acoustic Data Collection

Fixed autonomous recording devices (Song Meter Micro, Wildlife Acoustics, Maynard, MA, USA, Figure 1b) were installed at four locations (labeled P1, P2, P3, and P4 in Figure 1a, P = Point) within the historical garden. The four locations were selected based on a previous study conducted by the Environmental Psychology research team at the University of Padova [40], which investigated perceived restorativeness along with affective and memory-related benefits of exposure to nature within the historical garden. As a result, four core areas associated with restorative experiences were identified by the test group. Within these areas, the recorders were placed as far apart from one another as possible to maximise spatial coverage and avoid as much as possible sounds overlapping. The four points were strategically positioned to capture the diverse characteristics of the historical garden, such as the presence of the water feature, areas with denser tree cover, open glades, proximity to a trafficked road, etc. To ensure consistent temporal coverage, the recorders were programmed to sample for 10 min every hour, for 24 h, throughout multiple seasons in 2022: winter (12 days in February), spring (16 days in May), and autumn (16 days between October and November), resulting in approximately 44 days of field recordings. In total, we obtained 4006 recording sessions, each 10 min long (about 667 h of recordings in total). Recorders captured audio in WAV format at a 44.1 kHz sampling rate and 16-bit resolution, which is standard for avian bioacoustic surveys [41]. Since our objective was to evaluate soundscape variation under realistic and representative conditions across seasons and space—considering that in an urban green area, biotic, anthropogenic, and meteorological variability normally coexist—we chose not to manually screen, process, and exclude periods with heavy rainfall or disturbances. This is also because there is still no consensus in the scientific community on the best practices to process and filter audio files to assess acoustic indices [42]. Therefore, all recordings were included, except for any obvious technical malfunctions or file corruption. Each recording point was georeferenced and associated with surrounding vegetation and environmental variables.

2.3. Calculation of Acoustic Indices

To quantify soundscape patterns, five widely used acoustic indices were computed for each 10 min recording segment using Kaleidoscope software version 5.4.9 (Wildlife Acoustics, Maynard, MA, USA). These indices are commonly used as proxies for ecological richness and anthropogenic disturbance [15,35,43,44]. Moreover, the selection of multiple indices is grounded in previous comparative and conceptual studies [10,14,15,35,41,45], which demonstrate that using a combination of indices helps capture both taxonomic and functional acoustic diversity, depicts the multifactorial characteristics of the urban acoustic environment, and reduces bias introduced by context-specific noise conditions. The Acoustic Complexity Index (ACI) quantifies temporal variability in the soundscape by measuring the sum of absolute differences between adjacent intensity values (Ik and Ik + 1) within a specific frequency bin over a defined time window, which is determined by the Fast Fourier Transform (FFT) settings [44,46].
A C I = D k = 1 n I k
where Ik is the sum of the intensities and D is defined as follows:
D = k = 1 n d k
The Acoustic Diversity Index (ADI) quantifies soundscape diversity by partitioning the spectrogram into NNN frequency bins (typically spanning 1 to 10 kHz) and calculating the proportion p(i) of acoustic signals within each bin that exceed a predefined amplitude threshold (−50 dBFS), thereby reducing the influence of background noise and low-intensity sounds. ADI then applies the Shannon diversity index [47,48,49] to the resulting set of p(i) values, providing an integrated measure of the richness and evenness of spectral content across the frequency spectrum [50,51].
A D I = i = 1 N p ( i ) × log e p ( i )
In a similar structure, the Acoustic Evenness Index (AEI) also analyzes frequency bins, but employs the Gini coefficient [52] instead of Shannon entropy, focusing on the distribution inequality of signal intensities across bins, and thereby serving as a proxy for spectral dominance or imbalance [50].
A E I = 1 p ( i ) 2
where p(i) represents the proportion of acoustic energy (or the number of sound events) within frequency bin i, calculated relative to the total energy or total number of events in the spectrogram, and N denotes the total number of frequency bins into which the spectrogram is divided. Therefore, a high AEI value is generally interpreted as an indicator of good ecosystem health or high acoustic diversity, whereas a low AEI value may reflect anthropogenic disturbances, acoustic homogenization, or low biological diversity. The Bioacoustic Index (BI) reflects the area under the mean frequency spectrum curve within a target frequency range, providing a proxy for both the acoustic energy and the breadth of frequency usage by vocalizing species [53]. The BI is computed by applying a fast Fourier transform (FFT) to the acoustic data (A), with index values calculated as the integrated area under the FFT curve within the 2–8 kHz frequency range.
BI = f = 2 kHz 8 kHz FFT ( A )
Lastly, the Normalized Difference Soundscape Index (NDSI) assesses habitat disturbance by calculating the ratio between anthropophonic sounds ( α , typically within 0.1–2 kHz) and biophonic components ( β , often ranging from 2 to 11 kHz), enabling a quantification of human-induced acoustic impact [54]. The NDSI values range from −1 to +1, and the positive values indicate the dominance of biophony, where +1 represents pure biophony (Kasten et al., [54]). When the anthropophonic component dominates, NDSI assumes a negative value.
N D S I = α β α + β
A concise summary table of the Acoustic Indices considered and their attributes is given in Appendix A (Table A1).

2.4. Microclimatic and Vegetational Variables

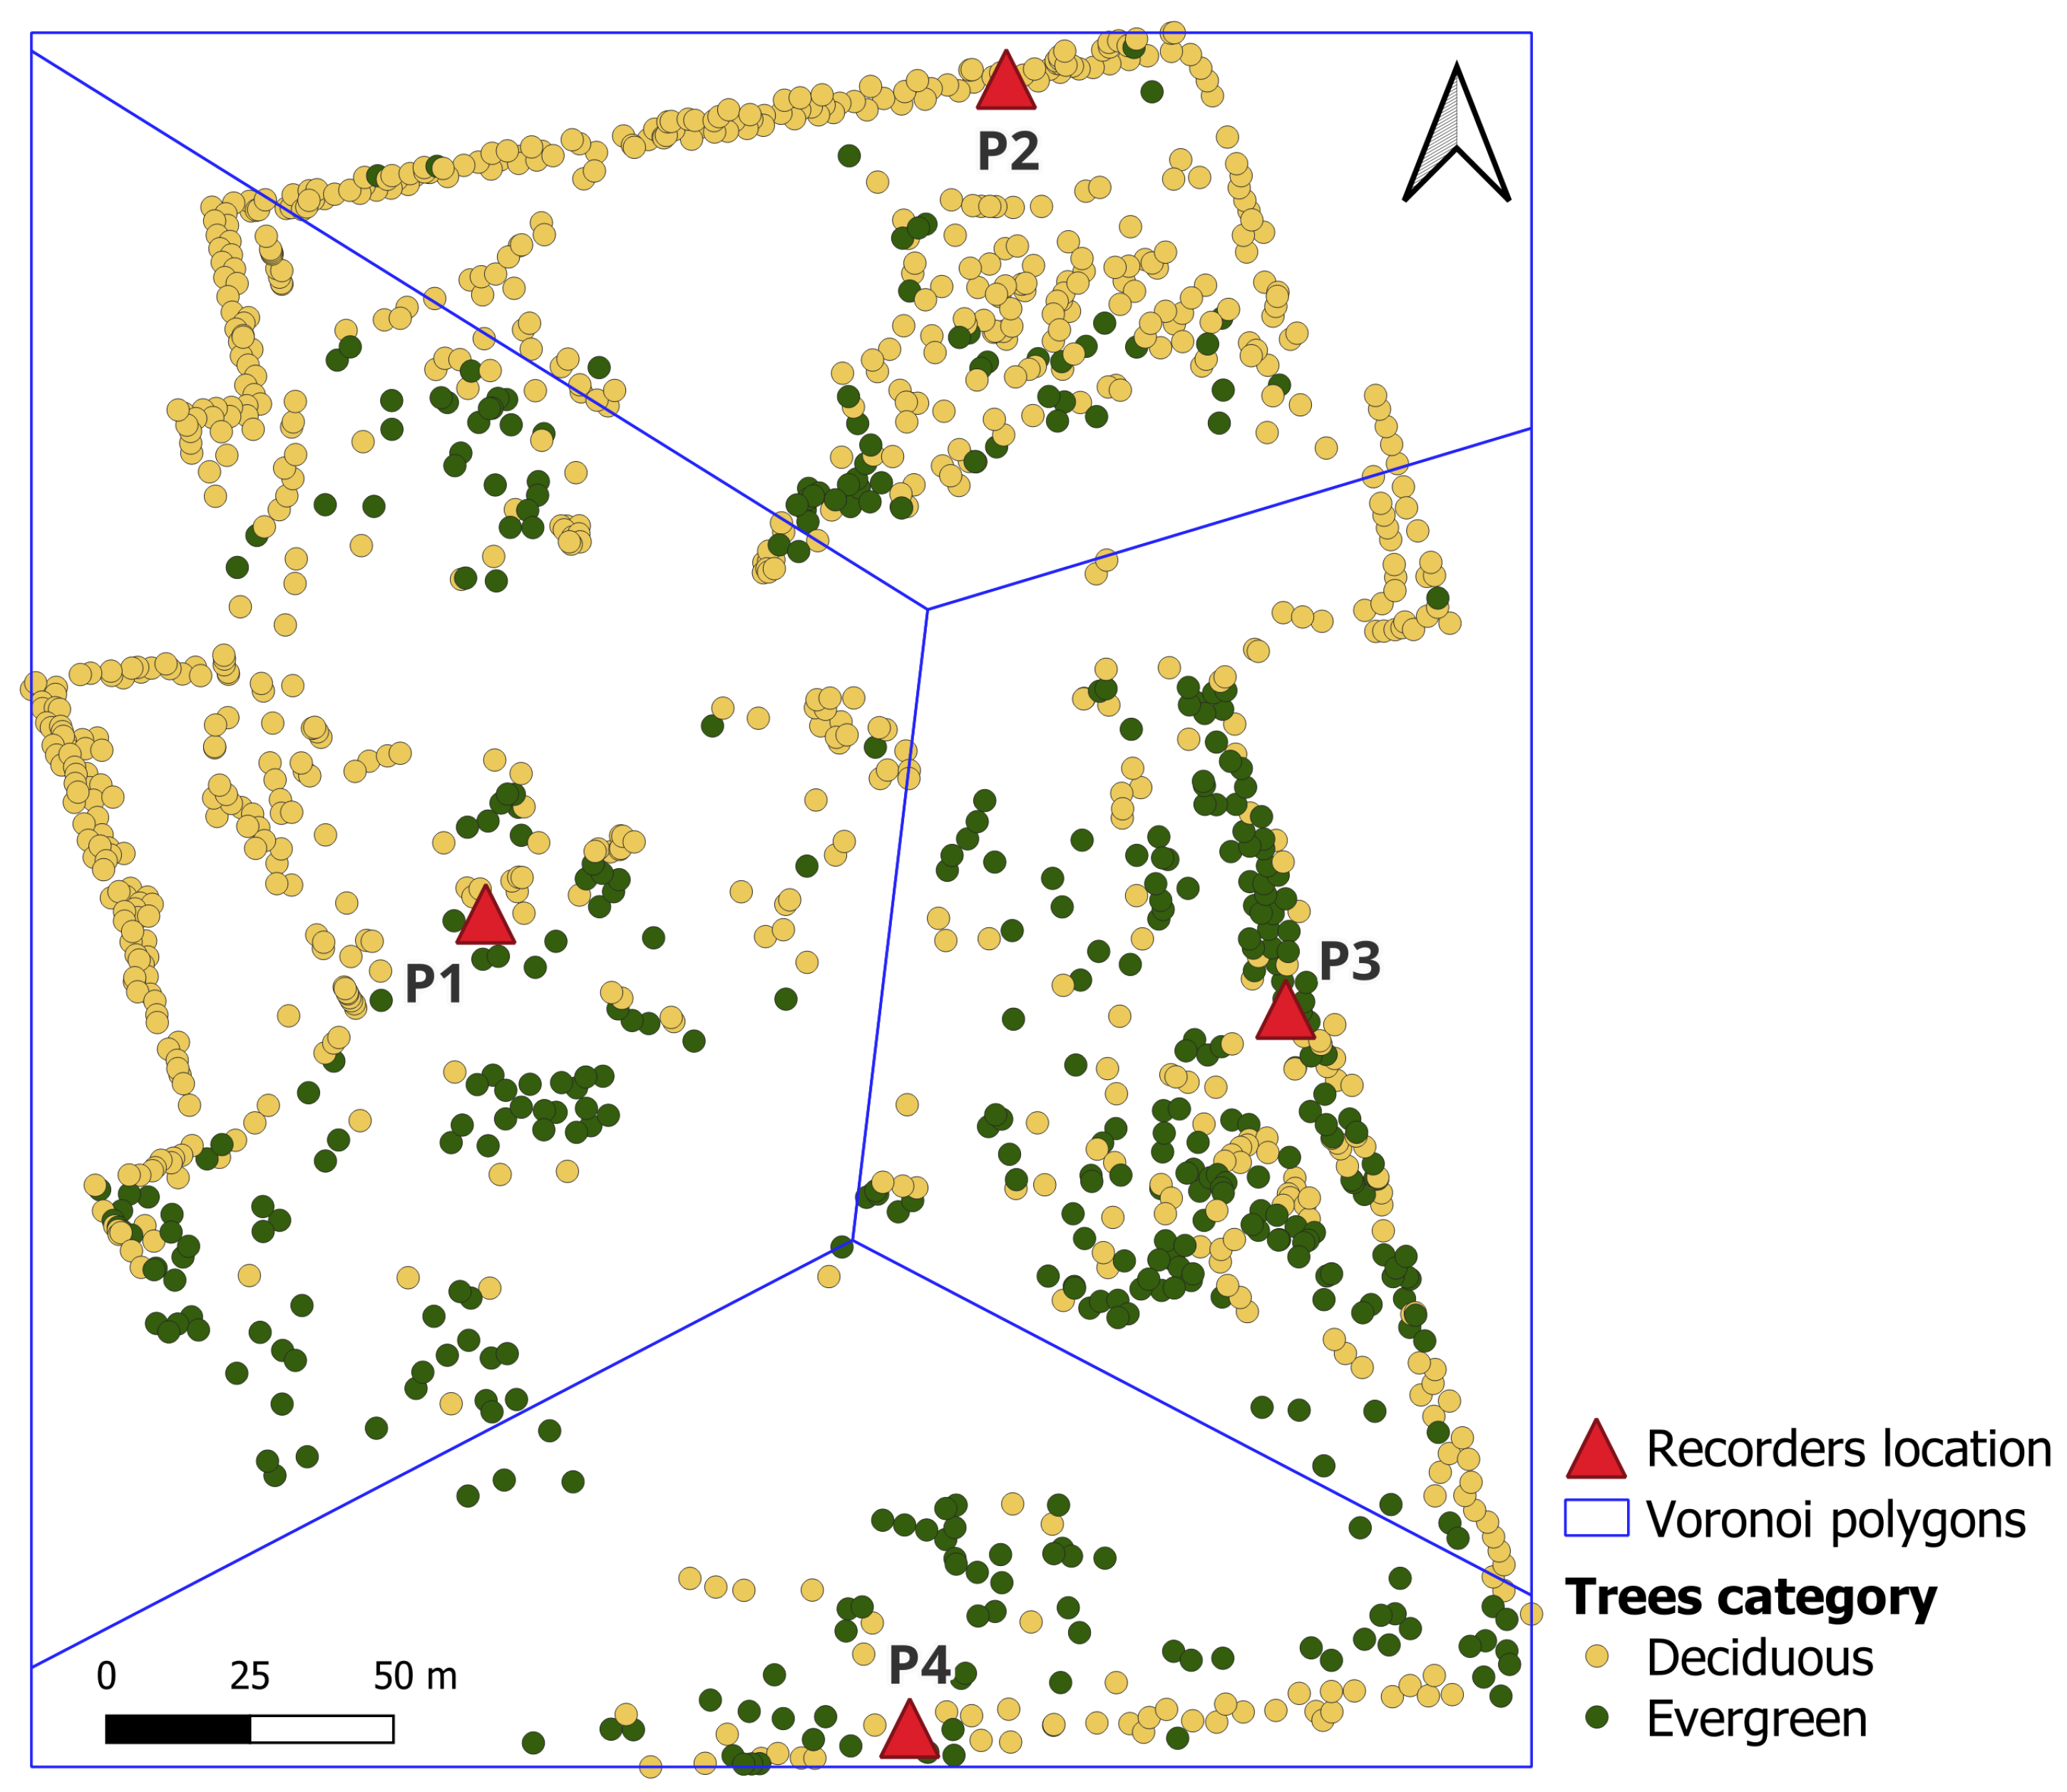
Meteorological data (air temperature, humidity, solar radiation, and barometric pressure) were obtained from a weather station located within the study area. These variables were extracted over the same time windows used for Acoustic Index extraction, as they can significantly affect both sound transmission and animal vocal activity [55]. Seasonal classification for each recording was derived from the date and included as a separate variable in the dataset. General information on the vertical vegetation structure was characterized using a canopy height model (CHM) derived from drone-borne LiDAR data collected on 22 July 2021. The CHM represents the height of vegetation above ground level, calculated as the difference between the digital surface model (DSM) and the digital terrain model (DTM). The LiDAR dataset (see [56] for details) was acquired using a RIEGL MiniVUX-3 sensor mounted on an RPAS Soleon LasCo X8 multicopter, flying at an average altitude of 60 m above ground level. The survey produced a high-density point cloud with an average of 1000 points per square meter, allowing for a detailed reconstruction of vegetation structure. The resulting CHM was generated in GeoTIFF raster format with a spatial resolution of 10 cm. For each recorder location, we extracted the mean CHM value within its corresponding Voronoi polygon, resulting in a numerical variable representing local canopy height. Such a technique is explained later, as it has been used for all the vegetational metrics. Vegetation data were obtained from a detailed georeferenced shapefile containing individual tree records (n = 1299, 61 different species), including species identity and basal area. Indeed, the study assumes trees are the primary structural component influencing the acoustic environment, since the presence of scattered shrubs is rare and ground cover is mainly characterized by herbaceous species. Information on vegetation metrics—including the tree species composition with their relative abundances and proportions (Table A2), and descriptive statistics of tree size (Table A3)—is provided in Appendix B, along with the hypsometric curve (Figure A1). Tree species were further classified into deciduous and evergreen categories. The considered vegetational variables are known to influence both habitat structure and sound propagation [57,58]. For each recorder location, to compute mean structural and compositional vegetation metrics—including CHM, tree density, mean basal area, proportion of evergreen species, and tree species diversity—we used Voronoi tessellation as a spatial partitioning method based on proximity to each point to define the local area of influence [59] (see Figure 2). This technique divides the entire study area into contiguous, non-overlapping polygons, where each polygon contains the area closer to its associated recorder point than to any other point. In this way, vegetation characteristics within each polygon can be reasonably attributed to the corresponding recorder location.

2.5. Statistical Analyses

Since vegetation-related variables were derived from a single LiDAR survey conducted in summer 2021 and a single tree inventory, they were treated as temporally static across the study period. In contrast, acoustic indices and meteorological parameters varied seasonally. This mismatch in temporal resolution may affect the model’s ability to accurately estimate variance components when all predictors are included simultaneously. Therefore, as an initial step in the analysis, no vegetation variables were considered. To assess the effects of season and meteorological variables on acoustic indices, we applied linear mixed-effects models (LMMs) using the lmer function from the lme4 package in R [60] (R software version 4.3.1 [61]). Each Acoustic Index was modeled as a response variable, with season (categorical) and meteorological variables as fixed effects, and recorder location (point) as a random intercept to account for repeated measures and for spatial variability among recording locations. The Gaussian distribution was selected, as it showed a better fit to the data. To deal with multicollinearity issues, we calculated the variance inflation factor (VIF) of each predictor using the ‘car’ R package [62]. We verified the normality of residuals through visual inspection of Q–Q plots and computed conditional and marginal pseudo-R2 [63] with the ‘performance’ R package [64]. Post-hoc comparisons among seasons were conducted using estimated marginal means (EMMs) and Tukey-adjusted pairwise contrasts with the emmeans package [65]. This step was performed to identify which specific seasons differed significantly from each other in their effect on the response variables (i.e., acoustic indices). This approach is particularly suitable following a significant effect of season in the main model, as it provides adjusted p-values for all possible comparisons, ensuring robust inference across multiple contrasts. To test for spatial variation among recording points, we also ran fixed-effects models (i.e., without the random intercept) and used one-way ANOVA followed by pairwise Tukey’s HSD post hoc tests. Assumptions of normality and homoscedasticity were verified visually through residual plots. Since significant differences in Acoustic Index values across seasons or recording points may reflect underlying variations in vegetation structure over time or space, we investigated whether vegetation characteristics differed significantly among the four sampling areas. We conducted a non-parametric statistical analysis using R software (version 4.3.1 [61]). Five vegetation-related metrics were considered: canopy height model (CHM), tree density, mean basal area, tree species richness, and proportion of evergreen species. For each metric, we first assess the residual distribution from a one-way ANOVA using the Shapiro–Wilk test, a widely used method to test for normality in ecological data [66]. In all cases, the residuals significantly deviated from normality (p < 2.2 × 10 16 ), indicating violations of ANOVA assumptions. As a result, we applied the Kruskal–Wallis rank-sum test, a robust non-parametric alternative suitable for comparing more than two independent groups without assuming normal distribution [67]. The variable related to the recording location (point) was treated as a categorical predictor to compare the vegetation metrics across the four polygonal areas surrounding the recorders. When the Kruskal–Wallis test indicated statistically significant overall differences (all p-values < 2.2 × 10 16 ), we performed post hoc pairwise comparisons using Dunn’s test with Bonferroni correction [68]. Adjusted p-values were used to determine statistical significance, following conventional thresholds: p < 0.001 ***, p < 0.01 **, p < 0.05 *, or not significant.

3. Results

3.1. Effects of Season and Environmental Variables on Acoustic Indices

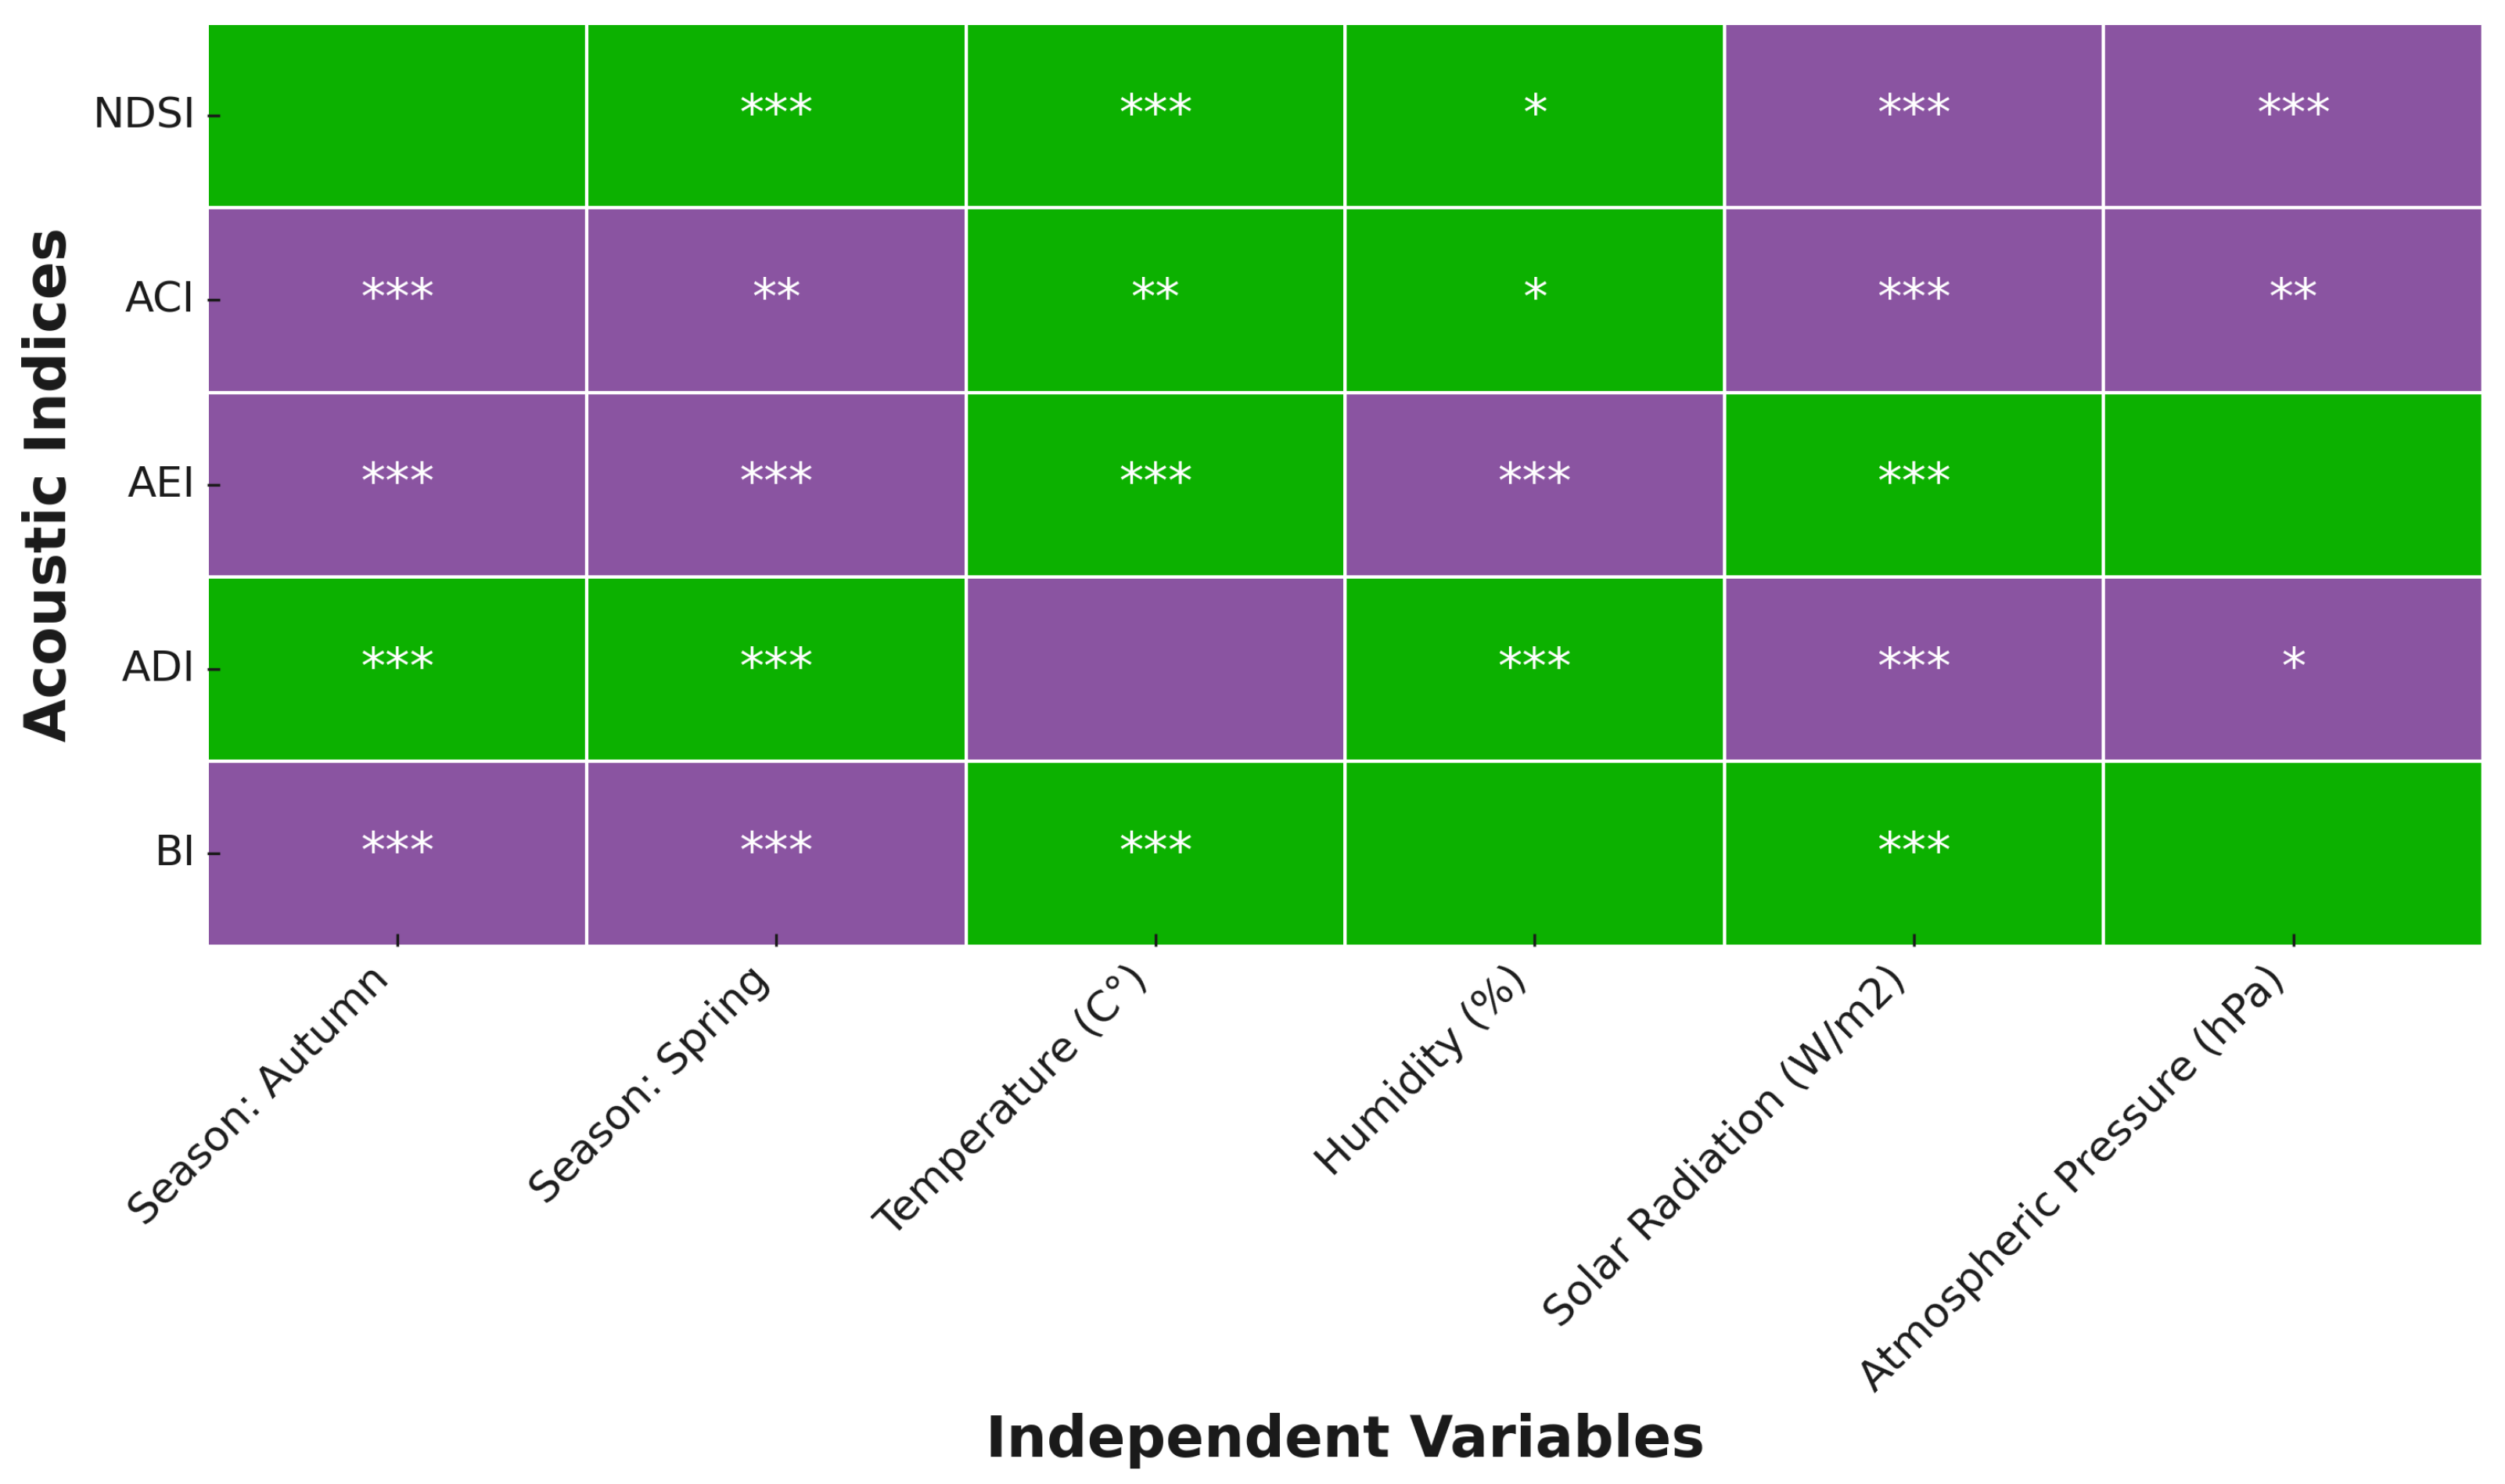
Linear mixed-effects models revealed that season and meteorological variables significantly influenced acoustic indices, though with differing patterns across the five metrics. The estimates of effects and the significance results for the acoustic indices are summarized in Figure 3 and Table 1. For NDSI, the mixed linear model revealed significant effects of season and microclimatic variables (REML = 3750.9). Compared to winter, NDSI increased significantly in spring (p < 0.001), while the effect of autumn was marginal (p = 0.088). Among environmental predictors, temperature and humidity were positively associated with NDSI, whereas solar radiation and barometric pressure showed significant negative effects. The linear mixed model revealed significant seasonal and environmental effects on ACI, too. In fact, the ACI was significantly lower in autumn ( β = –0.857, p < 0.001) and spring ( β = –0.676, p < 0.01) compared to winter. Temperature and humidity had significant positive effects on ACI, while solar radiation and barometric pressure had significant negative effects. Random intercepts for the location of the recorder accounted for moderate site-level variation (SD = 1.045), with most variation attributed to residual noise (SD = 2.642). Several environmental variables significantly influenced AEI: among fixed effects, the season had a strong and significant impact, since AEI was significantly lower in autumn ( β = –0.129, p < 0.001) and even more so in spring ( β = –0.214, p < 0.001) compared to winter, indicating pronounced seasonal dynamics in the distribution of acoustic energy. Meteorological variables also showed significant associations with AEI. In particular, air temperature was positively associated with AEI ( β = 0.183, p < 0.001), whereas relative humidity had a negative effect ( β = –0.113, p < 0.001). Similarly, solar radiation showed a significant positive relationship ( β = 0.108, p < 0.001), suggesting increased acoustic evenness under higher light conditions. The barometric pressure had a marginally significant positive effect (p = 0.036). The random intercept for recorder location accounted for a small proportion of variance (variance = 0.004), compared to the residual variance (0.042), indicating moderate spatial consistency in AEI responses across sites. Higher ADI values were found in spring and autumn compared to winter (p < 0.001), with spring showing the greatest increase. Microclimatic variables influence ADI, with positive associations with relative humidity and negative effects from solar radiation and barometric pressure. Finally, BI showed strong seasonal dependence, with significantly lower values in spring (p < 0.001) and autumn (p < 0.01) compared to winter. Temperature and solar radiation were both significant positive predictors of BI (p < 0.001), while other meteorological variables did not show consistent effects. Recorder location accounts for a substantial portion of the variance (SD = 23.81), suggesting that location-specific factors (e.g., habitat type or local disturbance) influence acoustic activity independently of the fixed effects. Residual variability is also high (SD = 30.59), indicating considerable unexplained variation.

3.2. Acoustic Indices Comparisons According to Seasons

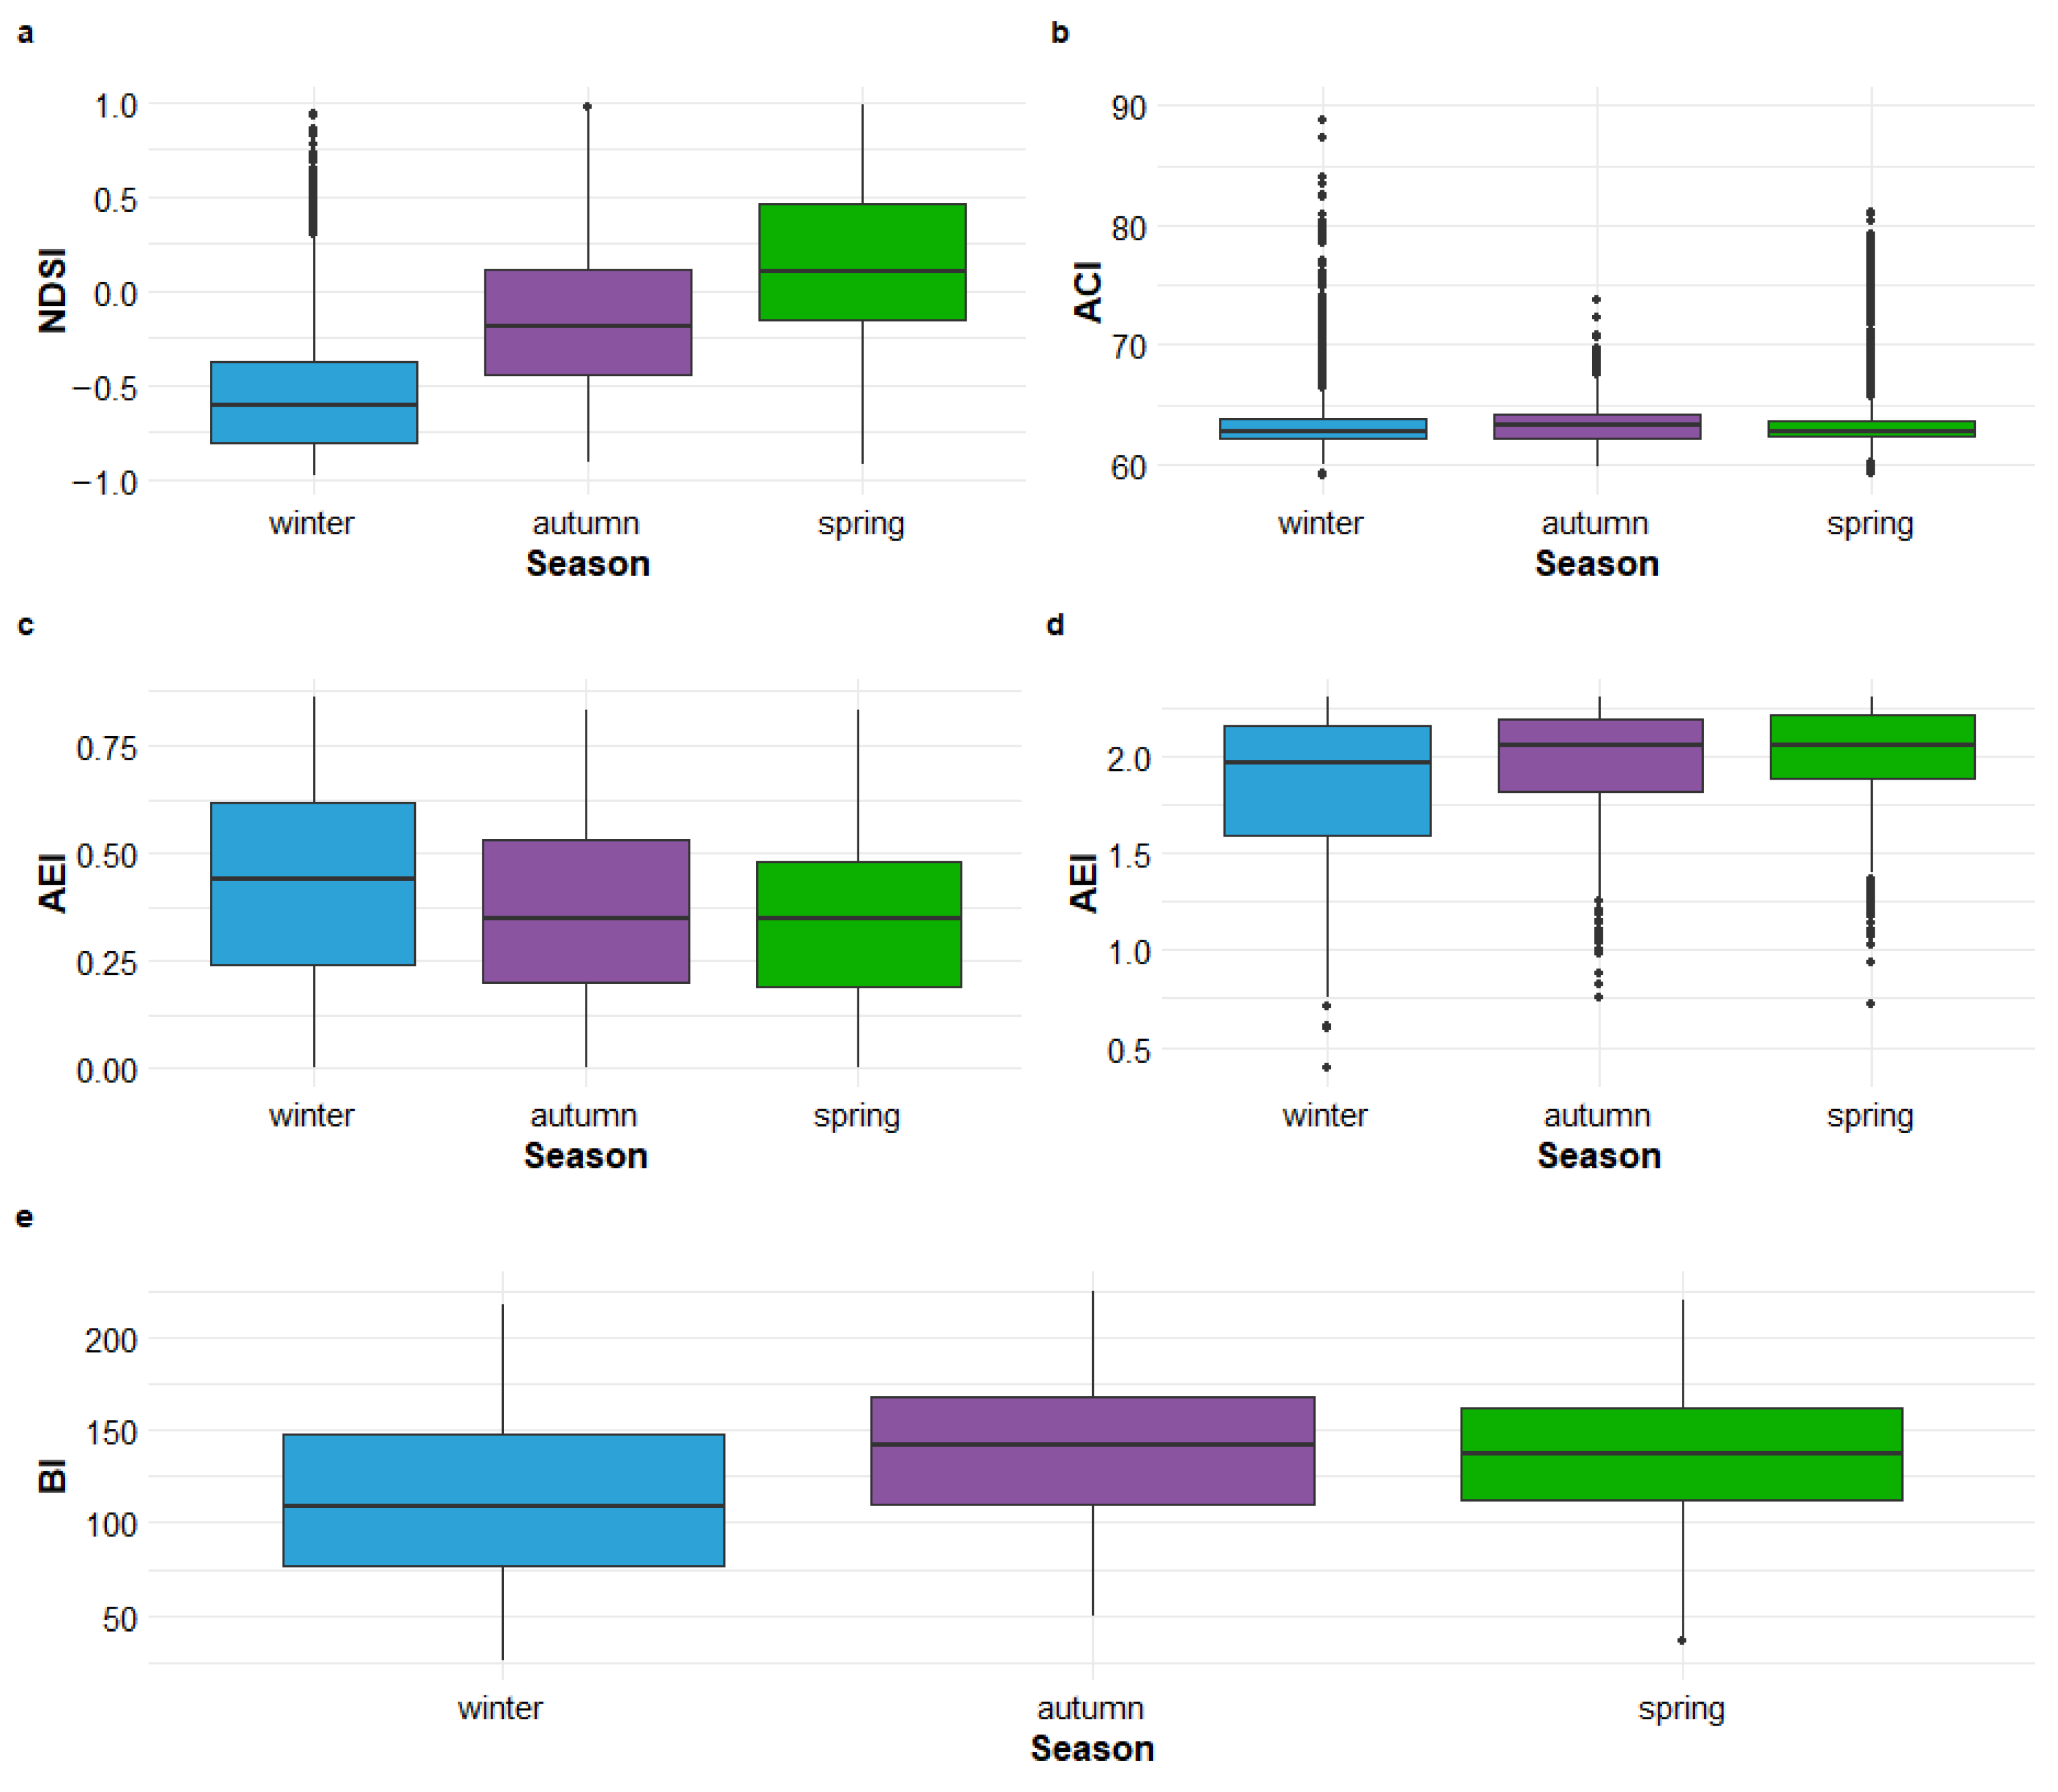
Here, we present the main results related to the seasonal variation in the AI measured in the historical garden. A seasonal peak in NDSI during spring is confirmed (Figure 4a), as spring differs significantly from both autumn and winter (p < 0.0001). No significant difference emerged between winter and autumn for the same index (p = 0.204), indicating similar acoustic conditions between these two seasons. Winter shows significantly higher ACI compared to both autumn and spring (Figure 4b, although the absolute differences are moderate (under 1 unit). No significant difference was found between autumn and spring. Although differences were statistically significant, they were moderate in magnitude, suggesting subtle seasonal variation in acoustic complexity. The post hoc comparisons of seasonal differences in AEI reveal statistically significant contrasts between all seasonal pairs based on estimated marginal means (emmeans) from the linear mixed model: winter consistently shows the highest AEI values, suggesting greater acoustic evenness (i.e., a more balanced distribution of sound energy across frequency bands), while spring shows the lowest values (Figure 4c). Estimated marginal means indicated that ADI values were lowest in winter (mean = 1.83, SE = 0.052), intermediate in autumn (mean = 1.98, SE = 0.051), and highest in spring (mean = 2.06, SE = 0.051). All pairwise comparisons were statistically significant after Tukey adjustment (p < 0.0001 in all cases), showing a clear seasonal gradient. Specifically, ADI in winter was significantly lower than both autumn (estimate = –0.148, SE = 0.027) and spring (estimate = –0.231, SE = 0.029), while spring also differed significantly from autumn (estimate = –0.083, SE = 0.014). These results point to a progressive increase in acoustic diversity from winter to spring (Figure 4d). Finally, post hoc comparisons of the estimated marginal means revealed significant seasonal differences in BI, with a clear seasonal gradient in acoustic activity, with a marked increase from winter to spring (Figure 4e). Specifically, BI values recorded in winter were significantly lower than those observed in both autumn (estimate = 10.5, SE = 2.84, p = 0.0006) and spring (estimate = 27.5, SE = 3.01, p < 0.0001).

3.3. Spatial Effect on Acoustic Indices

The one-way ANOVA revealed a highly significant effect of recording location on all the acoustic indices analyzed, suggesting spatial variation in the acoustic environment likely driven by differences in vegetation characteristics, proximity to noise sources, or site-specific microhabitat characteristics. NDSI varied significantly among recorder points (ANOVA: F ( 3 , 4006 ) = 30.05, p < 0.001). According to Table 2, mean NDSI values ranged from –0.29 at P1 (lowest) to –0.12 at P2 (highest), with intermediate values at P3 (–0.24) and P4 (–0.13). Post-hoc comparisons (Tukey HSD) confirmed that NDSI was significantly higher at P2 compared to P1 (Δ = 0.18, p < 0.001) and P4 (Δ = 0.01, ns), and that P4 had significantly higher NDSI than P1 (Δ = 0.16, p < 0.001). The contrast between P3 and P1 approached significance (p = 0.071), while P4 and P2 did not differ significantly. These results suggest that sites such as P2 and P4, despite proximity to anthropogenic features (e.g., roads, water), showed relatively higher NDSI values—indicating either a stronger biological signal or reduced anthropogenic noise at certain times. The random effect of recorder location in the mixed model (variance = 0.0054) confirmed that site-specific factors moderately contributed to the variability of NDSI.
ACI varied significantly among the four recorder points (ANOVA: F ( 3 , 4006 ) = 154.44, p < 0.001), highlighting pronounced spatial heterogeneity in soundscape structure (Table 3). Mean ACI values ranged from a maximum of 64.88 at P2 to a minimum of 62.40 at P4, with intermediate values at P1 (64.02) and P3 (63.39). Post-hoc Tukey HSD tests confirmed significant pairwise differences across all points. Specifically, ACI was significantly higher at P2 than at P1 (Δ = 0.87, p < 0.001), P3 (Δ = 1.49, p < 0.001), and P4 (Δ = 2.49, p < 0.001). P1 also differed significantly from both P3 (Δ = 0.63, p < 0.001) and P4 (Δ = 1.62, p < 0.001), while P3 recorded significantly higher ACI than P4 (Δ = 0.99, p < 0.001). These results suggest that P2 consistently captured the richest and most temporally variable biophonic activity, whereas P4 exhibited a notably reduced acoustic complexity. The spatial gradient may reflect differences in local vegetation structure, landscape filtering effects, or proximity to chronic anthropogenic noise sources such as roads and water infrastructure.
Mean AEI values ranged from a high of 0.402 at P2 to a notably lower value of 0.277 at P4, with intermediate means at P1 (0.392) and P3 (0.393), as reported in Table 4. Post-hoc Tukey HSD tests confirmed that P4 differed significantly from all other points (p < 0.001), showing a marked reduction in AEI. In contrast, the differences between P1, P2, and P3 were not statistically significant. These findings suggest that P4 presents a substantially less even acoustic environment, potentially reflecting the dominance of a few strong sound sources (e.g., mechanical or water-related noise) and a lower representation of diverse or evenly distributed biological sounds.
Mean ADI values ranged from 1.88 at P2 to 2.09 at P4, suggesting higher acoustic diversity in areas surrounding P4 (Table 5. Tukey’s HSD post hoc test confirmed that P4 exhibited significantly higher ADI values compared to all other points (P4–P1: Δ = +0.192, p < 0.001; P4–P2: Δ = +0.213, p < 0.001; P4–P3: Δ = +0.182, p < 0.001). No significant differences were observed among P1, P2, and P3. These results suggest that the soundscape around P4 supports a more acoustically diverse environment, potentially due to differences in vegetation structure, proximity to natural features such as the water element, or particular characteristics of anthropogenic disturbance.
Mean BI values increased from P2 (111.2) and P1 (112.4) to substantially higher values at P3 (120.4) and especially at P4 (161.7), suggesting pronounced spatial differences in broadband acoustic energy levels across the garden (see Table 6). Tukey HSD post hoc comparisons revealed that P4 consistently differed from all other points, with significantly higher BI values compared to P1 (Δ = +49.21, p < 0.001), P2 (Δ = +50.45, p < 0.001), and P3 (Δ = +41.27, p < 0.001). Additionally, P3 exhibited significantly higher BI than both P1 (Δ = +7.94, p < 0.001) and P2 (Δ = +9.19, p < 0.001), while no significant difference emerged between P1 and P2. These patterns may reflect local acoustic contributions from distinct habitat features, such as the presence of water and hard surfaces near P4, which are known to influence high-frequency sound propagation and reflection.

3.4. Differences in Vegetational Metrics Across Recorder Locations

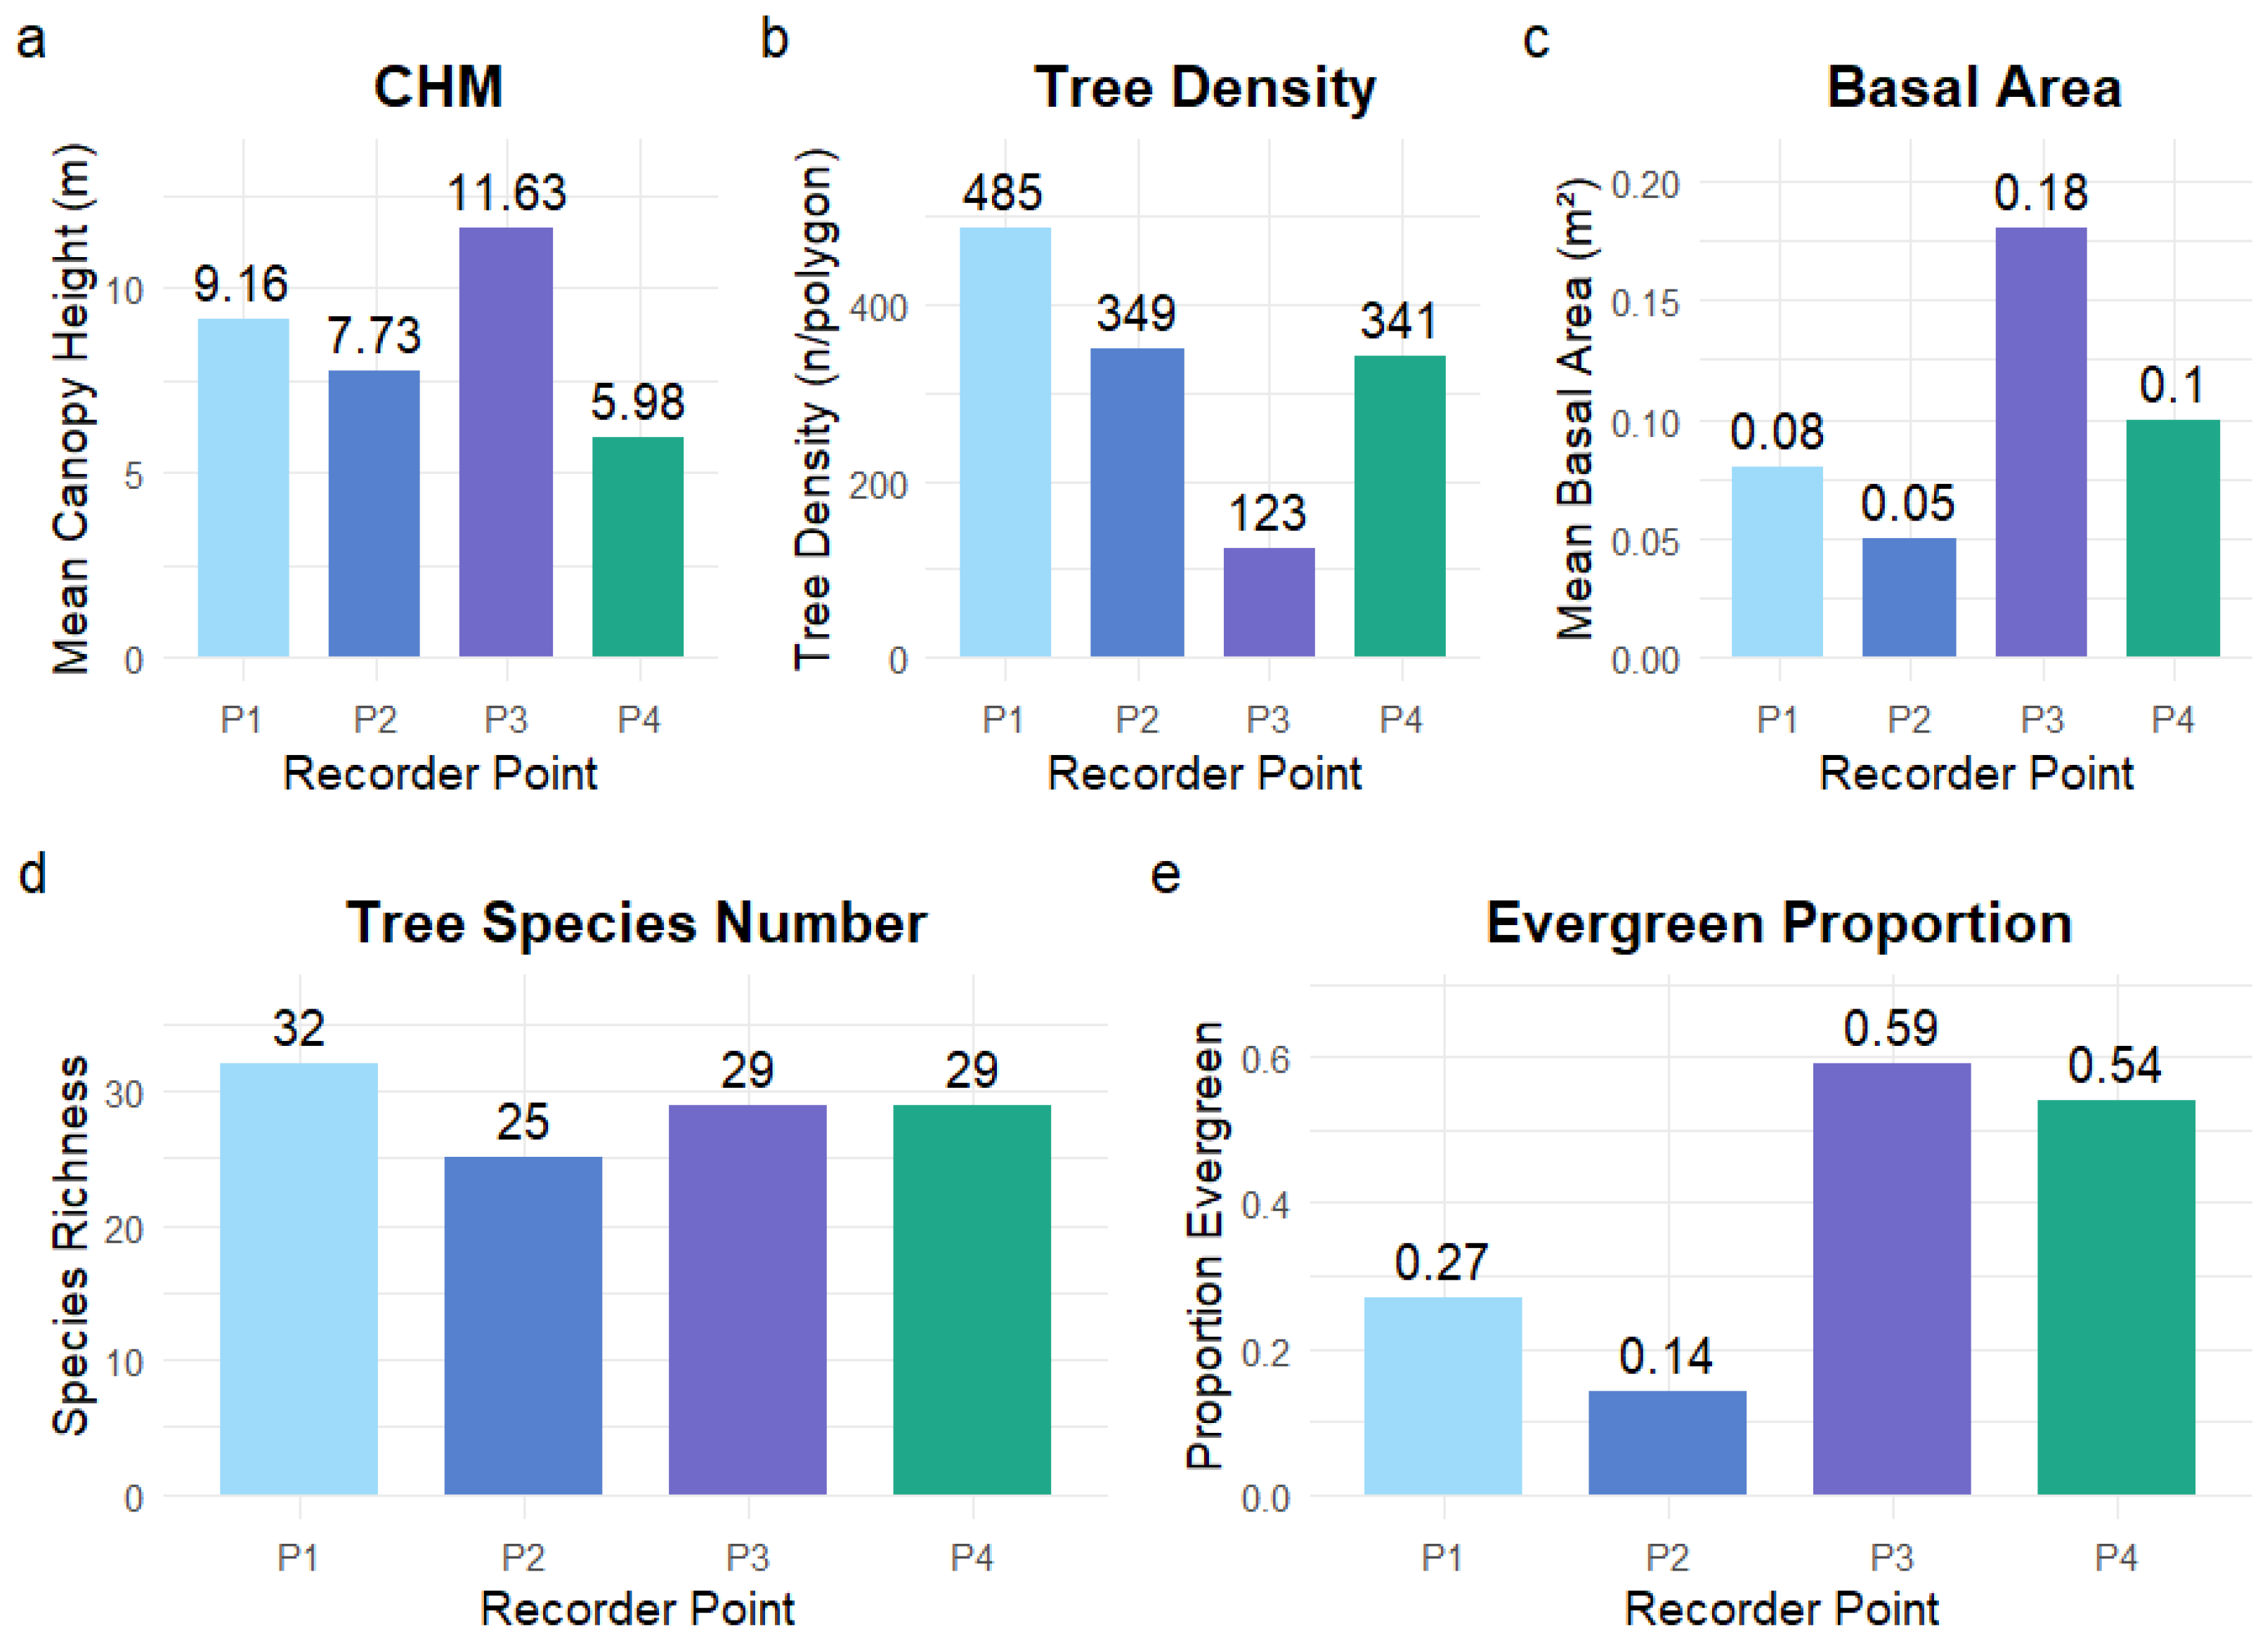
Vegetational metrics (summarized in Table 7) varied significantly among the four recording points (P1–P4, Figure 5), as revealed by non-parametric statistical analyses due to non-normality of residuals for all considered metrics (Shapiro–Wilk tests, p < 2.2 × 10 16 ). P3 often represented the structurally most complex polygon in terms of canopy height, basal area, and evergreen species presence. P2, in contrast, generally showed lower vaues, except for species richness and tree density. The Kruskal–Wallis test revealed a significant difference in mean canopy height among the four points (χ2 = 4005, df = 3, p < 0.001). Dunn’s post hoc comparisons indicated that all pairwise differences were statistically significant (adjusted p < 0.001), with P3 exhibiting the highest canopy height and P2 the lowest (Table A4). The analysis reveals strong and consistent differences in tree density across all four recorder locations (χ2 = 4005, df = 3, p < 0.001). All pairwise comparisons were significant (p.adj < 0.001), indicating distinct levels of tree distribution in each polygon. P3 showed the highest density, whereas P2 had the lowest. Since tree density is a key structural parameter of vegetation, these findings suggest that each recorder was embedded in a distinct vegetational context, possibly reflecting spatial heterogeneity in the historical planting schemes. The fact that even small differences between points are statistically significant might indicate a fine-scale environmental gradient or a clear demarcation in garden design (e.g., denser groves vs. open lawns). These variations in vegetation structure could have influenced acoustic environments and biodiversity (as reported in the analyses above). The number of tree species differed significantly among most recording points, suggesting that the species richness of tree communities varied considerably across the study area. Specifically, P1 and P2 differed strongly, indicating very different compositions or planting strategies; P2 appears to be distinct from all others, perhaps representing an area with particularly low or high diversity; P3 and P4 did not differ significantly, suggesting that these locations could share similar vegetation management or historical tree compositions. The proportion of evergreen trees, which maintain foliage year-round, varies significantly between the four recording locations. This suggests marked heterogeneity in the structure of the vegetation and the phenological strategies between sites. Notably, P2 showed the lowest proportion of evergreen cover, while P3 had the highest. Differences in the mean basal area per polygon were highly significant (χ2 = 4005, df = 3, p < 0.001). Dunn’s test showed that all pairwise contrasts were statistically significant (p.adj < 0.001), with P3 having the largest basal areas, likely reflecting a higher prevalence of mature trees (Table A4).

4. Discussion

4.1. Effects of Season and Environmental Variables on Acoustic Indices

The findings highlight the strong seasonal and meteorological influence on urban soundscape composition, as captured by a suite of acoustic indices. In line with previous research (e.g., [2,69]), seasonal dynamics emerged as a primary driver of acoustic variability, with spring generally associated with increased biophonic activity (e.g., higher NDSI and ADI), likely due to bird breeding phenology and greater overall biological activity. Further details about differences related to seasonality are discussed in the following subsection. Microclimatic variables showed consistent and often significant effects across indices. Temperature positively influenced several metrics, notably NDSI, ACI, AEI, and BI, suggesting that warmer conditions favor both biological activity and signal propagation [11]. Similarly, humidity effects were index-specific, with AEI and BI showing inverse trends compared to NDSI and ADI. This could be linked to humidity’s dual role in both sound attenuation (especially for high frequencies) and ecological processes influencing species behaviour [70]. The consistent negative association between solar radiation and NDSI/ACI may reflect increased anthropogenic noise or reduced vocal activity of some species during high light intensity periods [71]. Unexpectedly, CHM, which represents the level of vertical vegetation complexity in the surrounding zone of the recorder, did not significantly affect any of the indices. This contrasts with earlier studies demonstrating that canopy structure can modulate acoustic transmission and influence animal behaviour [72,73]. One possible explanation is that within the relatively small and homogeneous context of an urban historical garden, the variation in canopy height may not be sufficient to drive detectable changes in soundscape structure. However, the vegetational characteristics and differences between recorder locations are discussed later. Lastly, the high unexplained residual variance in models for BI and ACI suggests that unmeasured variables—such as momentary disturbances, presence of water features, or species-specific vocalisation patterns—may substantially contribute to the observed acoustic dynamics. This underlines the importance of incorporating fine-scale spatial and behavioural data in future urban ecoacoustic studies [12,74].

4.2. Acoustic Indices Comparisons According to Seasons

The observed seasonal patterns across acoustic indices reflect well-known ecological dynamics of temperate urban ecosystems, particularly the phenological cycles of animal vocal activity and associated biotic sound production. The spring peak in NDSI, driven by an increase in biophonic components relative to anthropogenic noise, aligns with previous studies documenting increased bird vocalisations during the breeding season [69,71]. The lack of significant differences between winter and autumn suggests that biological activity—and thus acoustic biophony—is relatively subdued or monotonous in these seasons, leading to similar overall soundscape compositions. This demonstrates that, during spring, the historical urban garden of Villa Revedin Bolasco offers an ideal habitat for nesting for several migratory species that might abandon the site to overwinter elsewhere. ACI, representing acoustic complexity and often linked to vocal interaction intensity, was significantly higher in winter than in other seasons. This pattern may reflect the acoustic prominence of fewer but more continuous sound sources, such as fewer resident bird species or abiotic sounds like wind and rain, which are more typical of winter conditions [2,11]. The moderate magnitude of these differences implies that ACI is less sensitive to seasonal shifts than other indices and may be capturing both biotic and abiotic signal complexity. The seasonal decrease in AEI from winter to spring is somewhat counterintuitive, as one might expect greater acoustic evenness with the emergence of multiple active species. However, this result may indicate that in spring, vocal activity is dominated by a few highly active species (e.g., territorial songbirds), thereby reducing evenness across the frequency spectrum—a phenomenon already noted in ecoacoustic studies of breeding bird communities [71,75]. ADI showed a progressive and statistically significant increase from winter to spring, highlighting the growing diversity of acoustic sources, likely attributable to increased insect and bird activity as temperatures rise [76]. This gradual increase corresponds with expected ecological responses to seasonal resource availability and reproductive cycles [43]. The sensitivity of ADI to seasonal transitions makes it a reliable proxy for monitoring phenological change and biodiversity trends in urban environments. Finally, the pronounced increase in BI from winter to spring suggests an expansion in the breadth of biotic sound frequencies, likely driven by the simultaneous activation of different taxonomic groups (e.g., birds, insects, amphibians). This seasonal pattern is consistent with findings from tropical and temperate soundscape studies where BI was positively correlated with habitat use and species richness during biologically active periods [45,74]. The sharp spring rise in BI underscores its responsiveness to seasonal changes in vocal activity and supports its utility as a bioindicator in urban ecological assessments. Collectively, these findings affirm that acoustic indices, particularly ADI and BI, are highly sensitive to seasonal biological rhythms and may serve as effective tools for phenological monitoring in urban green spaces. However, the differential responsiveness of each index also suggests that multi-index approaches are necessary to comprehensively capture the temporal dynamics of urban soundscapes [71,77]. Moreover, the seasonal variations observed in acoustic indices may reflect underlying changes in vegetation phenology characteristics throughout the year.

4.3. Spatial Effect on Acoustic Indices

The significant spatial differences observed across all five acoustic indices underscore the role of site-specific features in shaping the acoustic environment of the historical urban garden. Variations in local vegetation structure, proximity to anthropogenic noise sources, and the presence of natural elements (e.g., water bodies) likely interact to generate the observed heterogeneity [23,28,78]. The higher NDSI values at P2 and P4 suggest a relatively stronger biophonic presence or reduced anthropogenic noise, even in proximity to urban features. This pattern may reflect the role of vegetation as a buffer against human-generated noise [79,80]. Conversely, the lower values at P1, located near more disturbed zones, highlight the sensitivity of this index to human activity. In fact, P1 was closer to the side of the garden, confined by a long-lasting building site outside the walls. The ACI showed the clearest spatial gradient, with P2 exhibiting the highest acoustic complexity and P4 the lowest. This finding is consistent with previous studies reporting that ACI is responsive to both species richness and temporal variability of vocalization [44,81]. The high ACI in P2 may result from favorable and heterogeneous microhabitat conditions that support rich avifaunal activity, while the low ACI of P4 could reflect sound masking due to dominant noise sources. In fact, P2 is located near a small hill and a couple of clearings that differentiate the landscape matrix at the local level, while the fixed recording device in P4 was located near the border walls adjacent to a traffic road. AEI values further reinforce the idea that P4 is acoustically unbalanced: a significantly lower evenness suggests dominance by a few strong sound sources—possibly engine mechanical noise—rather than a well-distributed biological chorus [11,77]. Similarly, elevated ADI at P4, and to a lesser extent at P3, may be due to increased heterogeneity in the soundscape, potentially attributable to a mixture of natural (e.g., running water, vegetation) and anthropogenic sources. High ADI in semi-natural patches has been linked to complex soundscapes where overlapping sounds from multiple sources coexist [20]. Lastly, the BI’s pronounced peak at P4—where values doubled compared to the other sites—suggests high broadband acoustic energy, which could result from structural features such as hard surfaces, water reflections, or increased anthropogenic activity [43,53]. The simultaneous high BI and low AEI at P4 points to a soundscape dominated by intense but uneven noise sources, which may reduce its ecological or restorative value [3].

4.4. Differences in Vegetational Metrics Across Recorder Locations

The observed heterogeneity in vegetational metrics across the four recorder locations underscores the structural and compositional complexity of the historical garden. Notably, P3 consistently exhibited the highest canopy height, basal area, and tree density, suggesting a vegetational context dominated by tall, mature, and possibly closely spaced trees. Such structural features are known to influence sound propagation by increasing reverberation and attenuating high-frequency sounds [72,82], potentially contributing to the distinctive acoustic profiles observed at this location. There are many of the monumental trees of the historical garden around this recorder location, known for their exceptional size and age. In contrast, P2 showed the lowest values for most metrics—particularly canopy height, basal area, and evergreen cover—indicating a more open or fragmented vegetation structure that may facilitate the transmission of anthropogenic sounds and reduce acoustic shielding effects [20,83]. Moreover, this recorder was positioned near the perimeter wall adjacent to the local hospital, where the noise from the power generator may have represented a continuous yet subtle acoustic disturbance—likely imperceptible to human listeners but consistently captured by the recorder and reflected in the acoustic indices. In fact, it has already been demonstrated how anthropogenic noises can interfere with bird singing activity and mask the signal of bird sounds [84]. The significant differences in tree species richness among points reflect the spatial heterogeneity of historical planting schemes or management interventions. Higher species richness could be linked to more complex and heterogeneous acoustic environments due to the presence of functionally and phenologically diverse vocalising fauna [11,69]. Similarly, the proportion of evergreen trees—a key phenological trait—has ecological relevance for soundscapes throughout the year, as evergreen canopies provide continuous foliage coverage that modulates both microclimate and acoustic filtering [79]. The pronounced contrast between P2 (lowest evergreen cover) and P3 (highest, where a copse of Yew trees is present) further reinforces the idea that phenological structure may contribute to shaping seasonal and spatial acoustic patterns. Moreover, the strong and consistent differences in basal area across points support the presence of a structural vegetation gradient, possibly aligned with original garden zoning. Basal area, being a proxy for tree biomass and maturity, influences not only habitat quality for fauna but also the physical architecture through which sound travels [85]. The finding that even relatively short distances within the garden correspond to statistically significant differences in vegetational metrics suggests a fine-scale environmental heterogeneity that could underlie much of the spatial variation detected in the acoustic indices. Taken together, these patterns suggest that vegetation structure plays a critical role in modulating urban soundscapes at the local scale. These findings align with previous studies indicating that both vertical and horizontal vegetation complexity can alter the perception and ecological function of soundscapes in urban green spaces [3,86]. Such relationships merit further investigation, particularly regarding the integration of ecoacoustic data into urban ecological planning and historical garden conservation.

4.5. Limitations

Despite the valuable insights provided by this study, certain limitations should be acknowledged to support cautious interpretation of the results. The research was conducted in a unique urban garden that exhibits mature vegetation, rich tree species composition, and minimal disturbance due to high maintenance standards. These site characteristics likely contribute to a stable ecological and acoustic environment that may differ from more typical urban parks or recently developed green spaces. Therefore, the patterns observed here—particularly those related to soundscape quality and biophonic activity—may not fully represent conditions in other urban contexts with simpler structure or more fragmented management. In addition, the analysis was based on four fixed recording points, which, although thoughtfully distributed, limit the spatial granularity and may not capture the full heterogeneity of local vegetation and sound conditions. Furthermore, while the influence of vegetation structure on soundscapes was assessed using static LiDAR-derived metrics, no temporal data on canopy changes across seasons were available. This restricted the possibility of testing whether seasonal variations in acoustic indices among points were directly modulated by changes in vegetative cover. Moreover, future research should incorporate understory and ground vegetation to provide a more comprehensive picture of vertical habitat complexity. Lastly, all meteorological variables were recorded at a single location within the site, and although representative at the site scale, this approach may have overlooked microclimatic differences across points. In addition, acoustic indices may be affected by species-specific detection bias, sensitivity to geophony, and variability in equipment calibration or placement, potentially introducing analytical uncertainties that limit the interpretation of absolute index values. Together, these limitations highlight the need for future studies to adopt more spatially replicated and temporally dynamic designs across a broader range of urban settings. Future research should further investigate the causal mechanisms underlying these patterns—such as species-specific vocal contributions and long-term phenological dynamics—while also exploring the social dimensions of soundscape perception across diverse urban communities in relation to the surrounding habitat structure. Additionally, studies should include a broader range of urban contexts and integrate temporally dynamic vegetation data to better assess how seasonal changes in canopy cover influence soundscape composition.

5. Conclusions

This study highlights how seasonal biological activity, microclimatic variation, and vegetation structure jointly shape the acoustic characteristics of an urban historical garden. All five acoustic indices showed spatial and seasonal patterns, with spring marked by increased biophonic activity. Microclimatic factors such as temperature and radiation were significant predictors of acoustic variability, while differences in vegetation structure contributed to localized soundscape features. Although static vegetation metrics offered insights into spatial heterogeneity, their lack of temporal resolution limited assessments of seasonal vegetation effects. The results support the potential of acoustic indices as practical tools for evaluating ecological quality and soundscape comfort in urban green areas. The integration of ecoacoustic monitoring into urban management frameworks provides a cost-effective and scalable tool for tracking the ecological and restorative functions of green infrastructure, particularly in contexts of historical and cultural significance. Designing urban landscapes that enhance biophony and mitigate anthropophony through vegetative planning—by preserving canopy stratification, maintaining species richness, and mitigating microclimate conditions—can offer substantial benefits for both human well-being and biodiversity. The findings should be interpreted in light of the study site’s distinctive ecological features and high maintenance regime, which may not be representative of more typical urban parks.

Author Contributions

Conceptualization, A.P., R.C., F.P. (Francesca Pazzaglia), F.P. (Francesco Pirotti), A.Z. and M.C. (Maurizio Corbetta); methodology, A.P., F.C. and F.P. (Francesco Pirotti); software, A.P., F.C., F.P. (Francesco Pirotti), M.P. and M.S.; validation, F.C. and F.P. (Francesco Pirotti); formal analysis, A.P. and F.C.; investigation, F.P. (Francesco Pirotti); resources, R.C., F.P. (Francesco Pirotti), A.Z. and M.C. (Maurizio Corbetta); data curation, A.P., F.P. (Francesco Pirotti), R.C., M.S. and M.P.; writing—original draft preparation, A.P.; writing—review and editing, all authors; visualization, A.P., F.C. and F.P. (Francesco Pirotti); supervision, R.C., F.P. (Francesca Pazzaglia), F.P. (Francesco Pirotti) and M.C. (Maurizio Corbetta); project administration, R.C. and F.P. (Francesco Pirotti); funding acquisition, R.C., F.P. (Francesca Pazzaglia), M.C. (Maurizio Corbetta) and F.P. (Francesco Pirotti). All authors have read and agreed to the published version of the manuscript.

Funding

This research was funded by the European Union’s Horizon 2020 Research and Innovation program under Grant Agreement No. 869505.

Data Availability Statement

The raw data supporting the conclusions of this article will be made available by the authors on request.

Acknowledgments

We gratefully acknowledge the team of gardeners and landscapers from Euphorbia Srl for their support in collecting tree data within the historical garden.

Conflicts of Interest

The authors declare no conflicts of interest. The funders had no role in the design of the study; in the collection, analyses, or interpretation of data; in the writing of the manuscript; or in the decision to publish the results.

Abbreviations

The following abbreviations are used in this manuscript:
AcronymFull NameDescription
AIAcoustic IndicesQuantitative metrics derived from sound recordings that describe key aspects of the acoustic environment.
NDSINormalized Difference Soundscape IndexMeasures balance between biological and anthropogenic sounds.
ACIAcoustic Complexity IndexQuantifies the complexity of sound based on variations in amplitude across frequencies and time.
AEIAcoustic Evenness IndexReflects the evenness in the distribution of acoustic energy across frequency bands.
ADIAcoustic Diversity IndexMeasures the diversity of frequency bands occupied by sounds, analogous to species diversity.
BIBioacoustic IndexEstimates the intensity of biological sounds within a target frequency range.
CHMCanopy Height ModelA spatial dataset representing vegetation height above ground, derived from LiDAR data and used as a proxy for vegetation structure.

Appendix A. Acoustic Indices and Attributes Description

Table A1. Summary of the five acoustic indices used in the study, including their purpose, calculation principle, and relevant references.
IndexSoundscape DimensionCalculation PrincipleParameters/ThresholdsReferences
NDSI(Normalized Difference Soundscape Index)Biophony vs. anthropophony ratio ( B A ) / ( B + A ) , where B = energy in 2–8 kHz, A = energy in 1–2 kHzFrequency bands empirically set to distinguish anthropogenic and biological componentsPijanowski et al., 2011, [2]
ACI (Acoustic Complexity Index)Temporal variability of biophonic activitySum of amplitude differences across consecutive time steps in each frequency binFrame length (e.g., 512), step size; sensitive to avian activity patternsPieretti et al., 2011, [44]
AEI (Acoustic Evenness Index)Spectral evenness and dominanceGini coefficient of the distribution of energy across frequency binsCalculated on normalized amplitudes in fixed bands (e.g., 1 kHz)Villanueva-Rivera et al., 2011, [50]
ADI (Acoustic Diversity Index)Spectral entropy and diversityShannon diversity index based on energy levels in frequency binsNumber of frequency bands (e.g., 1 kHz); assumes higher diversity = more taxaVillanueva-Rivera et al., 2011, [50]
BI (Bioacoustic Index)Biotic acoustic activity (intensity)Summed amplitude in the biophonic range (typically 2–8 kHz)Amplitude thresholding applied to filter background noiseBoelman et al., 2007, [53]

Appendix B. Vegetational Metrics Description and Statistics

Table A2. Number of individuals and proportional abundance of tree species recorded in the historical garden. Species are listed in descending order of abundance.
SpeciesN of IndividualsProportion (%)
Taxus baccata L.30423.4
Carpinus betulus L.19214.8
Acer campestre L.14311.0
Ulmus minor Miller13310.2
Celtis australis L.1189.1
Celtis occidentalis L.433.3
Ligustrum lucidum Ait. fil.382.9
Tilia platyphyllos Scop.362.8
Cedrus deodara G. Don312.4
Robinia pseudoacacia L.292.2
Fraxinus excelsior L.272.1
Quercus robur L.262.0
Acer pseudoplatanus L.181.4
Quercus ilex L.131.0
Photinia serrulata Lindl.110.8
Magnolia grandiflora L.100.8
Morus alba L.100.8
Prunus spinosa L.90.7
Tilia x vulgaris Hayne90.7
Aesculus hippocastanum L.80.6
Platanus hybrida Brot.80.6
Fraxinus angustifolia Vahl70.5
Picea abies (L.) Karst70.5
Crataegus monogyna Jacq.60.5
Morus nigra L.50.4
Cryptomeria japonica D. Don40.3
Ailanthus altissima Swingle30.2
Gleditschia triacanthos L.30.2
Pinus nigra Arnold30.2
Sambucus nigra L.30.2
Taxodium disticum (L.) Rich.30.2
Abies alba Miller20.2
Diospyros virginiana L.20.2
Osmanthus decorus (Boiss. e Bal.)20.2
Popolus alba20.2
Populus nigra L.20.2
Sophora japonica L.20.2
Sophora japonica L. var. pendula20.2
Thuja occidentalis L.20.2
Tilia cordata Miller20.2
Acer negundo L.10.1
Acer platanoides L.10.1
Alnus glutinosa (L.) Gaertner10.1
Cedrus atlantica Carriere10.1
Cephalotaxus fortunei (Knight)10.1
Cercis Siliquastum10.1
Chamaecyparis lawsoniana (Parl.)10.1
Cupressus lusitanica Miller10.1
Cupressus sempervirens L.10.1
Fraxinus ornus L.10.1
Ginkgo biloba L.10.1
Gymnocladus dioicus Koch10.1
Lagerstroemia indica L.10.1
Larix decidua Miller10.1
Ligustrum ovalifolium Hassk.10.1
Liquidambar orientalis Mill.10.1
Magnolia soulangeana Soul.10.1
Pinus strobus L.10.1
Populus nigra L. var. italica10.1
Prunus avium L.10.1
Trachycarpus fortunei (Hooker) Wendl.10.1
Table A3. Descriptive statistics (mean, median, and standard deviation) for tree height and diameter in the urban garden study site.
StatisticHeight (m)Diameter (cm)
Mean14.9826.89
Median15.0024.00
Standard Deviation5.2020.33
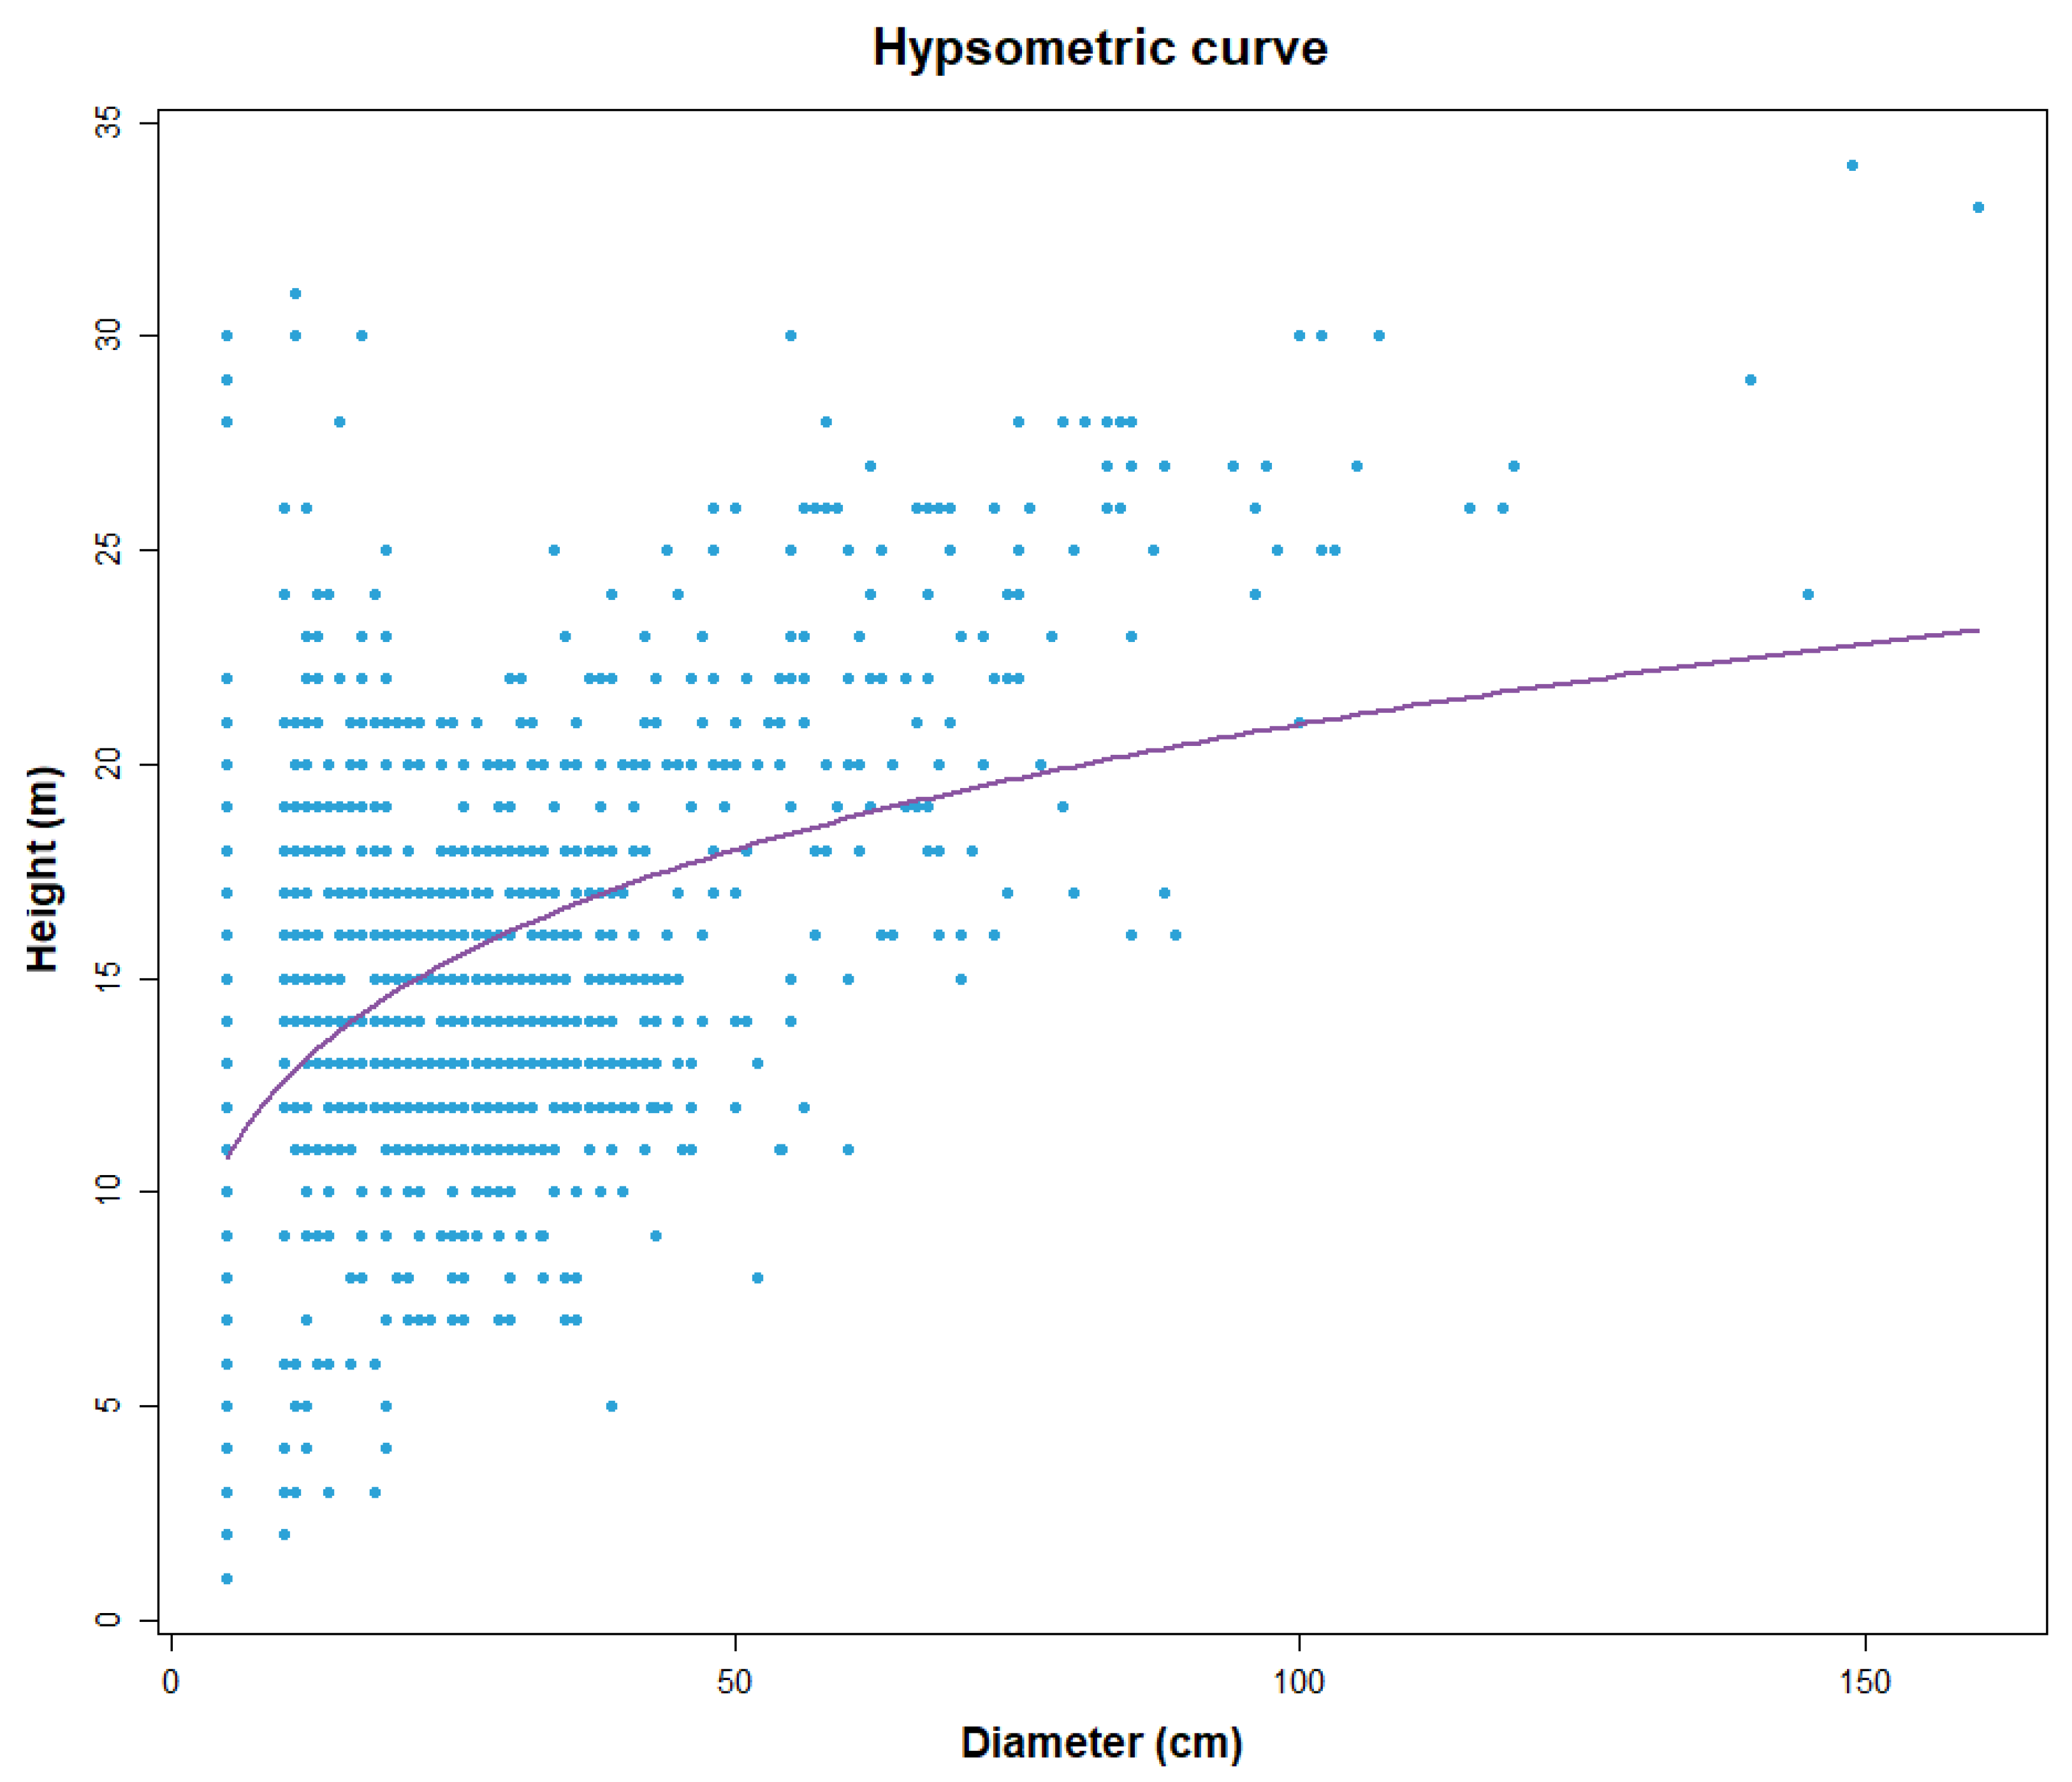
Figure A1. Hypsometric curve representing the relationship between tree diameter and height for the studied historical urban garden. Light blue dots correspond to the observed data points, while the purple line shows the fitted curve based on the Chapman–Richards growth model. Given the structural complexity and species diversity typical of urban green spaces, we used the Chapman–Richards model [87] to describe the height-diameter relationship (trend line) of trees at the study site. This nonlinear model allows for flexible fitting of asymptotic growth patterns, making it suitable for capturing the variability observed in urban forest stands.
Land 14 01970 g0a1

Appendix C. Vegetation Metrics’ Spatial Variation Analysis Results

To identify which pairs of points differed significantly, a Dunn’s post hoc test with Bonferroni correction was applied. The adjusted p-values show significant differences in all pairwise comparisons for all the vegetation metrics considered.
Table A4. Results of Dunn’s post hoc pairwise comparisons for the considered vegetation metrics’ values across the four recording points, following a significant Kruskal–Wallis test. The table reports Z-scores, Bonferroni-adjusted p-values, and significance levels for each pairwise contrast (Significance codes: * p < 0.05 , ** p < 0.01 , *** p < 0.001 .). All comparisons showed statistically significant differences, indicating marked spatial variability in vegetation height.
ComparisonZ-ScoreAdjusted p-ValueSignificance
CHM
P1 vs. P2−20.02.58 × 10 88 ***
P1 vs. P3−60.00***
P1 vs. P4−40.10***
P2 vs. P3−40.00***
P2 vs. P4−20.04.69 × 10 88 ***
P3 vs. P420.02.57 × 10 88 ***
Tree Density
P1 vs. P2−20.02.58 × 10 88 ***
P1 vs. P3−60.00***
P1 vs. P4−40.10***
P2 vs. P3−40.00***
P2 vs. P4−20.04.69 × 10 88 ***
P3 vs. P420.02.57 × 10 88 ***
Number of species
P1 vs. P2−63.30***
P1 vs. P3−31.71.09 × 10 219 ***
P1 vs. P4−31.75.11 × 10 220 ***
P2 vs. P331.66.45 × 10 218 ***
P2 vs. P431.63.06 × 10 218 ***
P3 vs. P401
Proportion of evergreen species
P1 vs. P2−20.02.58 × 10 88 ***
P1 vs. P340.10***
P1 vs. P420.15.70 × 10 89 ***
P2 vs. P360.00***
P2 vs. P440.10***
P3 vs. P4−20.02.57 × 10 88 ***
Mean basal area (m2)
P1 vs. P2−20.02.58 × 10 88 ***
P1 vs. P340.10***
P1 vs. P420.15.70 × 10 89 ***
P2 vs. P360.00***
P2 vs. P440.10***
P3 vs. P4−20.02.57 × 10 88 ***

References

  1. Krause, B.L. The niche hypothesis: A hidden symphony of animal sounds, the origins of musical expression and the health of habitats. Soundscape Newsl. 1993, 6, 6–10. [Google Scholar]
  2. Pijanowski, B.C.; Villanueva-Rivera, L.J.; Dumyahn, S.L.; Farina, A.; Krause, B.L.; Napoletano, B.M.; Gage, S.H.; Pieretti, N. Soundscape ecology: The science of sound in the landscape. BioScience 2011, 61, 203–216. [Google Scholar] [CrossRef]
  3. Francis, C.D.; Kleist, N.J.; Ortega, C.P.; Cruz, A. Anthropogenic noise pollution: A novel risk factor for avian populations. Behav. Ecol. 2017, 28, 949–957. [Google Scholar] [CrossRef]
  4. Hedblom, M.; Heyman, E.; Antonsson, H.; Gunnarsson, B. Bird song diversity influences young people’s appreciation of urban landscapes. Urban For. Urban Green. 2014, 13, 469–474. [Google Scholar] [CrossRef]
  5. Zhao, Y.; Kang, J.; Torija, A.J. Vegetation structure and urban noise attenuation: Evaluating the role of green infrastructure in shaping restorative soundscapes. Urban For. Urban Green. 2025, 81, 127151. [Google Scholar]
  6. Truax, B. The World Soundscape Project; Simon Fraser University: Burnaby, BC, Canada, 1978. [Google Scholar]
  7. Fuller, R.A.; Gaston, K.J.; Irvine, K.N. Psychological benefits of green space increase with biodiversity. Biol. Lett. 2015, 3, 390–394. [Google Scholar] [CrossRef]
  8. Schafer, R.M. The Soundscape: Our Sonic Environment and the Tuning of the World; Destiny Books: Rochester, VT, USA, 1994. [Google Scholar]
  9. Joo, W.; Napoletano, B.; Qi, J.; Gage, S.; Biswas, S. Soundscape Characteristics of An Environment A New Ecological Indicator of Ecosystem Health. In Wetland and Water Resource Modeling and Assessment—A Watershed Perspective; CRC Press: Boca Raton, FL, USA, 2007; pp. 201–211. [Google Scholar]
  10. Benocci, R.; Brambilla, G.; Bisceglie, A.; Zambon, G. Sound ecology indicators applied to urban parks: A preliminary study. Asia-Pac. J. Sci. Technol. 2020, 25, 1–10. [Google Scholar]
  11. Depraetere, M.; Pavoine, S.; Jiguet, F.; Gasc, A.; Duvail, S.; Sueur, J. Monitoring animal diversity using acoustic indices: Implementation in a temperate woodland. Ecol. Indic. 2012, 13, 46–54. [Google Scholar] [CrossRef]
  12. Gasc, A.; Sueur, J.; Jiguet, F.; Devictor, V.; Grandcolas, P.; Burrow, C.; Depraetere, M.; Pavoine, S. Assessing biodiversity with sound: Do acoustic diversity indices reflect phylogenetic and functional diversity? Ecol. Indic. 2016, 61, 658–667. [Google Scholar] [CrossRef]
  13. Farina, A.; Gage, S.H. Ecoacoustics: The Ecological Role of Sounds; John Wiley & Sons: Hoboken, NJ, USA, 2017. [Google Scholar] [CrossRef]
  14. Benocci, R.; Brambilla, G.; Bisceglie, A.; Zambon, G. Eco-acoustic indices to evaluate soundscape degradation due to human intrusion. Sustainability 2020, 12, 10455. [Google Scholar] [CrossRef]
  15. Sueur, J.; Farina, A.; Gasc, A.; Pieretti, N.; Pavoine, S. Acoustic indices for biodiversity assessment and landscape investigation. Acta Acust. United Acust. 2014, 100, 772–781. [Google Scholar] [CrossRef]
  16. Rajan, S.C.; Athira, K.; Jaishanker, R.; Sooraj, N.; Sarojkumar, V. Rapid assessment of biodiversity using acoustic indices. Biodivers. Conserv. 2019, 28, 2371–2383. [Google Scholar] [CrossRef]
  17. Righini, R.; Pavan, G. A soundscape assessment of the Sasso Fratino integral nature reserve in the Central Apennines, Italy. Biodiversity 2020, 21, 4–14. [Google Scholar] [CrossRef]
  18. Guagliumi, G.; Canedoli, C.; Potenza, A.; Zaffaroni-Caorsi, V.; Benocci, R.; Padoa-Schioppa, E.; Zambon, G. Unraveling Soundscape Dynamics: The Interaction Between Vegetation Structure and Acoustic Patterns. Sustainability 2025, 17, 4204. [Google Scholar] [CrossRef]
  19. Yang, W.; Kang, J. Soundscape and sound preferences in urban squares: A case study in Sheffield. J. Urban Des. 2005, 10, 61–80. [Google Scholar] [CrossRef]
  20. Gasc, A.; Francomano, D.; Dunning, J.B.; Pijanowski, B.C. Future directions for soundscape ecology: The importance of defining metrics for community-level acoustic patterns. Bioacoustics 2015, 24, 289–297. [Google Scholar]
  21. Fisher, J.C.; Irvine, K.N.; Bicknell, J.E.; Hayes, W.M.; Fernandes, D.; Mistry, J.; Davies, Z.G. Perceived biodiversity, sound, naturalness and safety enhance the restorative quality and wellbeing benefits of green and blue space in a neotropical city. Sci. Total Environ. 2021, 755, 143095. [Google Scholar] [CrossRef]
  22. Hao, Z.; Wang, C.; Sun, Z.; Zhao, D.; Sun, B.; Wang, H.; van den Bosch, C.K. Vegetation structure and temporality influence the dominance, diversity, and composition of forest acoustic communities. For. Ecol. Manag. 2021, 482, 118871. [Google Scholar] [CrossRef]
  23. Dumyahn, S.L.; Pijanowski, B.C. Soundscape conservation. Landsc. Ecol. 2011, 26, 1327–1344. [Google Scholar] [CrossRef]
  24. Buxton, R.T.; McKenna, M.F.; Mennitt, D.; Brown, E.; Fristrup, K.M.; Crooks, K.; Angeloni, L.; Wittemyer, G. Noise pollution is pervasive in U.S. protected areas. Science 2018, 356, 531–533. [Google Scholar] [CrossRef]
  25. Holgate, B.; Maggini, R.; Fuller, S. Mapping ecoacoustic hot spots and moments of biodiversity to inform conservation and urban planning. Ecol. Indic. 2021, 126, 107627. [Google Scholar] [CrossRef]
  26. Gibb, R.; Browning, E.; Glover-Kapfer, P.; Jones, K.E. Emerging opportunities and challenges for passive acoustics in ecological assessment and monitoring. Methods Ecol. Evol. 2019, 10, 169–185. [Google Scholar] [CrossRef]
  27. Fairbrass, A.J.; Rennert, P.; Williams, C.; Titheridge, H.; Jones, K.E. City-wide acoustic monitoring reveals biotic and anthropogenic sound patterns in an urban landscape. Landsc. Urban Plan. 2017, 162, 178–186. [Google Scholar] [CrossRef]
  28. Fairbrass, A.J.; Rennert, P.; Williams, C.; Titheridge, H.; Jones, K.E. Biases of acoustic indices measuring biodiversity in urban areas. Ecol. Indic. 2017, 83, 169–177. [Google Scholar] [CrossRef]
  29. European Parliament and Council. Directive 2002/49/EC of the European Parliament and of the Council of 25 June 2002 Relating to the Assessment and Management of Environmental Noise. Official Journal of the European Union, L 189/12, 18.07.2002. 2002. Available online: https://eur-lex.europa.eu/eli/dir/2002/49/oj (accessed on 28 June 2025).
  30. Somervuo, P.; Roslin, T.; Fisher, B.; Hardwick, B.; Kerdraon, D.; Raharinjanahary, D.; Mata, V. Human contributions to global soundscapes are less predictable than the acoustic rhythms of wildlife. Nat. Ecol. Evol. 2025, 9, 1585–1598. [Google Scholar] [CrossRef]
  31. Bian, Q.; Wang, C.; Cheng, H.; Han, D.; Zhao, Y.; Yin, L. Exploring the application of acoustic indices in the assessment of bird diversity in urban forests. Ecol. Indic. 2022, 144, 109528. [Google Scholar] [CrossRef]
  32. Lei, C.; Zhiyong, X.; Pukun, S.; Xiaotian, L.; Zhao, Z. Exploring the application of frequency-dependent acoustic diversity index in human-dominated areas. Biodivers. Sci. 2024, 32, 24286. [Google Scholar] [CrossRef]
  33. Santos, E.; Wiederhecker, H.; Pompermaier, V.; Schirmer, S.; Gainsbury, A.; Marini, M. Are acoustic indices useful for monitoring urban biodiversity? Urban Ecosyst. 2024, 27, 1975–1981. [Google Scholar] [CrossRef]
  34. Haselhoff, T.; Schuck, M.; Lawrence, B.T.; Fiebig, A.; Moebus, S. Characterizing acoustic dimensions of health-related urban greenspace. Ecol. Indic. 2024, 166, 112547. [Google Scholar] [CrossRef]
  35. Buxton, R.T.; Agnihotri, S.; Robin, V.; Goel, A.; Balakrishnan, R. Acoustic indices as rapid indicators of avian diversity in different land-use types in an Indian biodiversity hotspot. J. Ecoacoustics 2018, 2, 8. [Google Scholar] [CrossRef]
  36. Xiang, Y.; Meng, Q.; Zhang, X.; Li, M.; Yang, D.; Wu, Y. Soundscape diversity: Evaluation indices of the sound environment in urban green spaces–Effectiveness, role, and interpretation. Ecol. Indic. 2023, 154, 110725. [Google Scholar] [CrossRef]
  37. Alcocer, I.; Lima, H.; Sugai, L.S.M.; Llusia, D. Acoustic indices as proxies for biodiversity: A meta-analysis. Biol. Rev. 2022, 97, 2209–2236. [Google Scholar] [CrossRef] [PubMed]
  38. Araujo, A.; Machado, R. Acoustic communities in an environmental gradient from native to urban areas in Central Brazil. Austral Ecol. 2023, 48, 1941–1960. [Google Scholar] [CrossRef]
  39. Diaz, S.D.U.; Gan, J.L.; Tapang, G.A. Acoustic indices as proxies for bird species richness in an urban green space in Metro Manila. PLoS ONE 2023, 18, e0289001. [Google Scholar] [CrossRef] [PubMed]
  40. Sella, E.; Meneghetti, C.; Muffato, V.; Borella, E.; Carbone, E.; Cavalli, R.; Pazzaglia, F. The influence of individual characteristics on perceived restorativeness and benefits associated with exposure to nature in a garden. Front. Psychol. 2023, 14, 1130915. [Google Scholar] [CrossRef]
  41. Darras, K.; Batáry, P.; Furnas, B.; Celis-Murillo, A.; Van Wilgenburg, S.L.; Mulyani, Y.A. Comparative effectiveness of acoustic indices for biodiversity monitoring in complex tropical landscapes. Ecol. Indic. 2018, 85, 117–126. [Google Scholar] [CrossRef]
  42. Hyland, E.B.; Schulz, A.; Quinn, J.E. Quantifying the Soundscape: How filters change acoustic indices. Ecol. Indic. 2023, 148, 110061. [Google Scholar] [CrossRef]
  43. Joo, W.; Gage, S.H.; Kasten, E.P. Analysis and interpretation of variability in soundscapes along an urban–rural gradient. Landsc. Urban Plan. 2011, 103, 259–276. [Google Scholar] [CrossRef]
  44. Pieretti, N.; Farina, A.; Morri, D. A new methodology to infer the singing activity of an avian community: The Acoustic Complexity Index (ACI). Ecol. Indic. 2011, 11, 868–873. [Google Scholar] [CrossRef]
  45. Sueur, J.; Farina, A. Ecoacoustics: The ecological investigation and interpretation of environmental sound. Biosemiotics 2015, 8, 493–502. [Google Scholar] [CrossRef]
  46. Farina, A.; Pieretti, N. Soundscape Ecology: Principles, Patterns, Methods and Applications; Springer: Berlin/Heidelberg, Germany, 2014. [Google Scholar] [CrossRef]
  47. Shannon, C.E. A Mathematical Theory of Communication. Bell Syst. Tech. J. 1948, 27, 379–423. [Google Scholar] [CrossRef]
  48. Legendre, P.; Legendre, L. Numerical Ecology; Elsevier: Amsterdam, The Netherlands, 1998. [Google Scholar]
  49. Magurran, A.E. Measuring Biological Diversity; Blackwell Publishing: Oxford, UK, 2004. [Google Scholar]
  50. Villanueva-Rivera, L.J.; Pijanowski, B.C.; Doucette, J.; Pekin, B. A primer of acoustic analysis for landscape ecologists. Landsc. Ecol. 2011, 26, 1233–1246. [Google Scholar] [CrossRef]
  51. Krause, B. The Great Animal Orchestra: Finding the Origins of Music in the World’s Wild Places; Little, Brown and Company: New York, NY, USA, 2012. [Google Scholar]
  52. Gini, C.W. Variability and mutability, contribution to the study of statistical distributions and relations. Studi Econ.-Giuridici R Univ. Cagliari 1912. [Google Scholar]
  53. Boelman, N.T.; Asner, G.P.; Hart, P.J.; Martin, R.E. Multi-trophic invasion resistance in Hawaii: Bioacoustics, field surveys, and remote sensing. Ecol. Appl. 2007, 17, 2137–2144. [Google Scholar] [CrossRef]
  54. Kasten, E.P.; Gage, S.H.; Fox, J.; Joo, W. The remote environmental assessment laboratory’s acoustic library: An archive for studying soundscape ecology. Ecol. Inform. 2012, 12, 50–67. [Google Scholar] [CrossRef]
  55. August, P.V. Environmental sound propagation and landscape heterogeneity: Linking acoustic ecology with ecoacoustics. Ecol. Indic. 2021, 122, 107301. [Google Scholar] [CrossRef]
  56. Pirotti, F.; Piragnolo, M.; Vettore, A.; Guarnieri, A. Comparing accuracy of ultra-dense laser scanner and photogrammetry point clouds. Int. Arch. Photogramm. Remote Sens. Spat. Inf. Sci. 2022, 43, 353–359. [Google Scholar] [CrossRef]
  57. Farina, A.; Pieretti, N.; Piccioli, L. The soundscape methodology for long-term bird monitoring: A Mediterranean Europe case-study. Ecol. Informatics 2014, 21, 4–15. [Google Scholar] [CrossRef]
  58. Remme, R.P.; Hein, L.; van Swaay, C.A. Exploring spatial indicators for biodiversity accounting. Ecol. Indic. 2016, 70, 232–248. [Google Scholar] [CrossRef]
  59. Okabe, A.; Satoh, T.; Furuta, T.; Suzuki, A.; Okano, K. Generalized network Voronoi diagrams: Concepts, computational methods, and applications. Int. J. Geogr. Inf. Sci. 2008, 22, 965–994. [Google Scholar] [CrossRef]
  60. Bates, D.; Maechler, M.; Bolker, B.; Walker, S.; Christensen, R.H.B.; Singmann, H.; Dai, B.; Grothendieck, G.; Green, P.; Bolker, M.B. Package ‘lme4’. Convergence 2015, 12, 2. [Google Scholar]
  61. R Core Team. R: A Language and Environment for Statistical Computing; Version 4.3.1; R Foundation for Statistical Computing: Vienna, Austria, 2023. [Google Scholar]
  62. Fox, J.; Weisberg, S. An R Companion to Applied Regression; Sage Publications: Thousand Oaks, CA, USA, 2018. [Google Scholar]
  63. Nakagawa, S.; Schielzeth, H. A general and simple method for obtaining R2 from generalized linear mixed-effects models. Methods Ecol. Evol. 2013, 4, 133–142. [Google Scholar] [CrossRef]
  64. Lüdecke, D.; Ben-Shachar, M.S.; Patil, I.; Waggoner, P.; Makowski, D. Performance: An R package for assessment, comparison and testing of statistical models. J. Open Source Softw. 2021, 6. [Google Scholar] [CrossRef]
  65. Lenth, R.; Singmann, H.; Love, J.; Buerkner, P.; Herve, M. Emmeans: Estimated marginal means. AKA Least-Squares Means 2018, 1. [Google Scholar]
  66. Razali, N.M.; Wah, Y.B. Power comparisons of shapiro-wilk, kolmogorov-smirnov, lilliefors and anderson-darling tests. J. Stat. Model. Anal. 2011, 2, 21–33. [Google Scholar]
  67. Kruskal, W.H.; Wallis, W.A. Use of ranks in one-criterion variance analysis. J. Am. Stat. Assoc. 1952, 47, 583–621. [Google Scholar] [CrossRef]
  68. Dinno, A. Nonparametric pairwise multiple comparisons in independent groups using Dunn’s test. Stata J. 2015, 15, 292–300. [Google Scholar] [CrossRef]
  69. Farina, A.; Lattanzi, E.; Malavasi, R.; Pieretti, N.; Piccioli, L. Avian soundscapes and cognitive landscapes: Theory, application and ecological perspectives. Landsc. Ecol. 2011, 26, 1257–1267. [Google Scholar] [CrossRef]
  70. Darras, K.; Furnas, B.; Fitriawan, I.; Mulyani, Y.; Tscharntke, T. Estimating biodiversity with sound: Optimizing sampling effort of ecoacoustic indices. Ecol. Indic. 2016, 66, 555–564. [Google Scholar]
  71. Gasc, A.; Sueur, J.; Jiguet, F.; Devictor, V.; Grandcolas, P.; Burrow, A.L.; Depraetere, M.; Pavoine, S. Assessing biodiversity with sound: Do acoustic diversity indices reflect phylogenetic and functional diversities of bird communities? Ecol. Indic. 2013, 25, 279–287. [Google Scholar] [CrossRef]
  72. Mullet, T.C.; Kight, C.R.; Swaddle, J.P. Urban noise affects perception of risk in songbirds. Urban Ecosyst. 2016, 19, 1395–1402. [Google Scholar]
  73. García, R.G.; Brambilla, M.; Laiolo, P. Integrating LiDAR and acoustic indices to understand habitat complexity and biodiversity patterns in forests. Ecol. Appl. 2021, 31, e02317. [Google Scholar]
  74. Duarte, M.H.L.; Sousa-Lima, R.S.; Young, R.J. Monitoring free-ranging wildlife in urban landscapes: Using acoustic recordings to detect species presence. Urban Ecosyst. 2018, 21, 1169–1180. [Google Scholar]
  75. Bradfer-Lawrence, T.; Gardner, K.; Bunnefeld, D.; Willis, S.G.; Edwards, D.P. Guidelines for the use of passive acoustic recorders to monitor animal populations. Ecol. Indic. 2020, 115, 106412. [Google Scholar] [CrossRef]
  76. Darras, K.; Schmidt, H.P.; Römer, T.; Müller, D.; Tscharntke, T. Measuring sound detection spaces for acoustic animal sampling and monitoring. Biol. Conserv. 2016, 201, 29–37. [Google Scholar] [CrossRef]
  77. Fuller, R.A.; Warren, P.H.; Gaston, K.J. Daytime noise predicts nocturnal singing in urban robins. Biol. Lett. 2007, 3, 368–370. [Google Scholar] [CrossRef] [PubMed]
  78. Gasc, A.; Sueur, J.; Jiguet, F.; Devigne, C. Soundscapes in four European cities: Noise monitoring, health impacts, and practical applications. Ecol. Indic. 2016, 72, 746–756. [Google Scholar] [CrossRef]
  79. Sánchez, M.L.; Barbosa, O.; Bustamante, R.O. Vegetation structure modulates the perception of noise pollution in urban parks. Urban For. Urban Green. 2020, 47, 126561. [Google Scholar] [CrossRef]
  80. Smith, N.; Pijanowski, B.C.; Gage, S.H. Acoustic indices predict biodiversity and human perception of soundscapes in urban green spaces. Ecol. Indic. 2020, 116, 106495. [Google Scholar] [CrossRef]
  81. Farina, A.; James, P. The ecoacoustic event detection: A new method for index development and soundscape analysis. Ecol. Informatics 2016, 31, 25–33. [Google Scholar] [CrossRef]
  82. Reed, S.E.; Boggs, J.L.; Mann, J.P. A GIS tool for modeling anthropogenic noise propagation in natural ecosystems. Environ. Model. Softw. 2012, 37, 1–5. [Google Scholar] [CrossRef]
  83. Zhou, Z.; Yang, L.; Zhang, Y. Vegetation structure influences sound transmission and attenuation in urban parks. Urban For. Urban Green. 2020, 48, 126520. [Google Scholar] [CrossRef]
  84. Slabbekoorn, H.; Ripmeester, E.A.P. Birdsong and anthropogenic noise: Implications and applications for conservation. Mol. Ecol. 2008, 17, 72–83. [Google Scholar] [CrossRef]
  85. Pekin, B.; Jung, J.; Villanueva-Rivera, L.; Pijanowski, B.; Ahumada, J. Modeling acoustic diversity using soundscape recordings and LIDAR-derived metrics of vertical forest structure in a neotropical rainforest. Landsc. Ecol. 2012, 7, 1513–1522. [Google Scholar]
  86. Brambilla, M.; Galli, L. Soundscapes in urban parks: Ecological meaning and perceptual implications. Urban For. Urban Green. 2021, 64, 127266. [Google Scholar] [CrossRef]
  87. Richards, F.J. A flexible growth function for empirical use. J. Exp. Bot. 1959, 10, 290–301. [Google Scholar] [CrossRef]
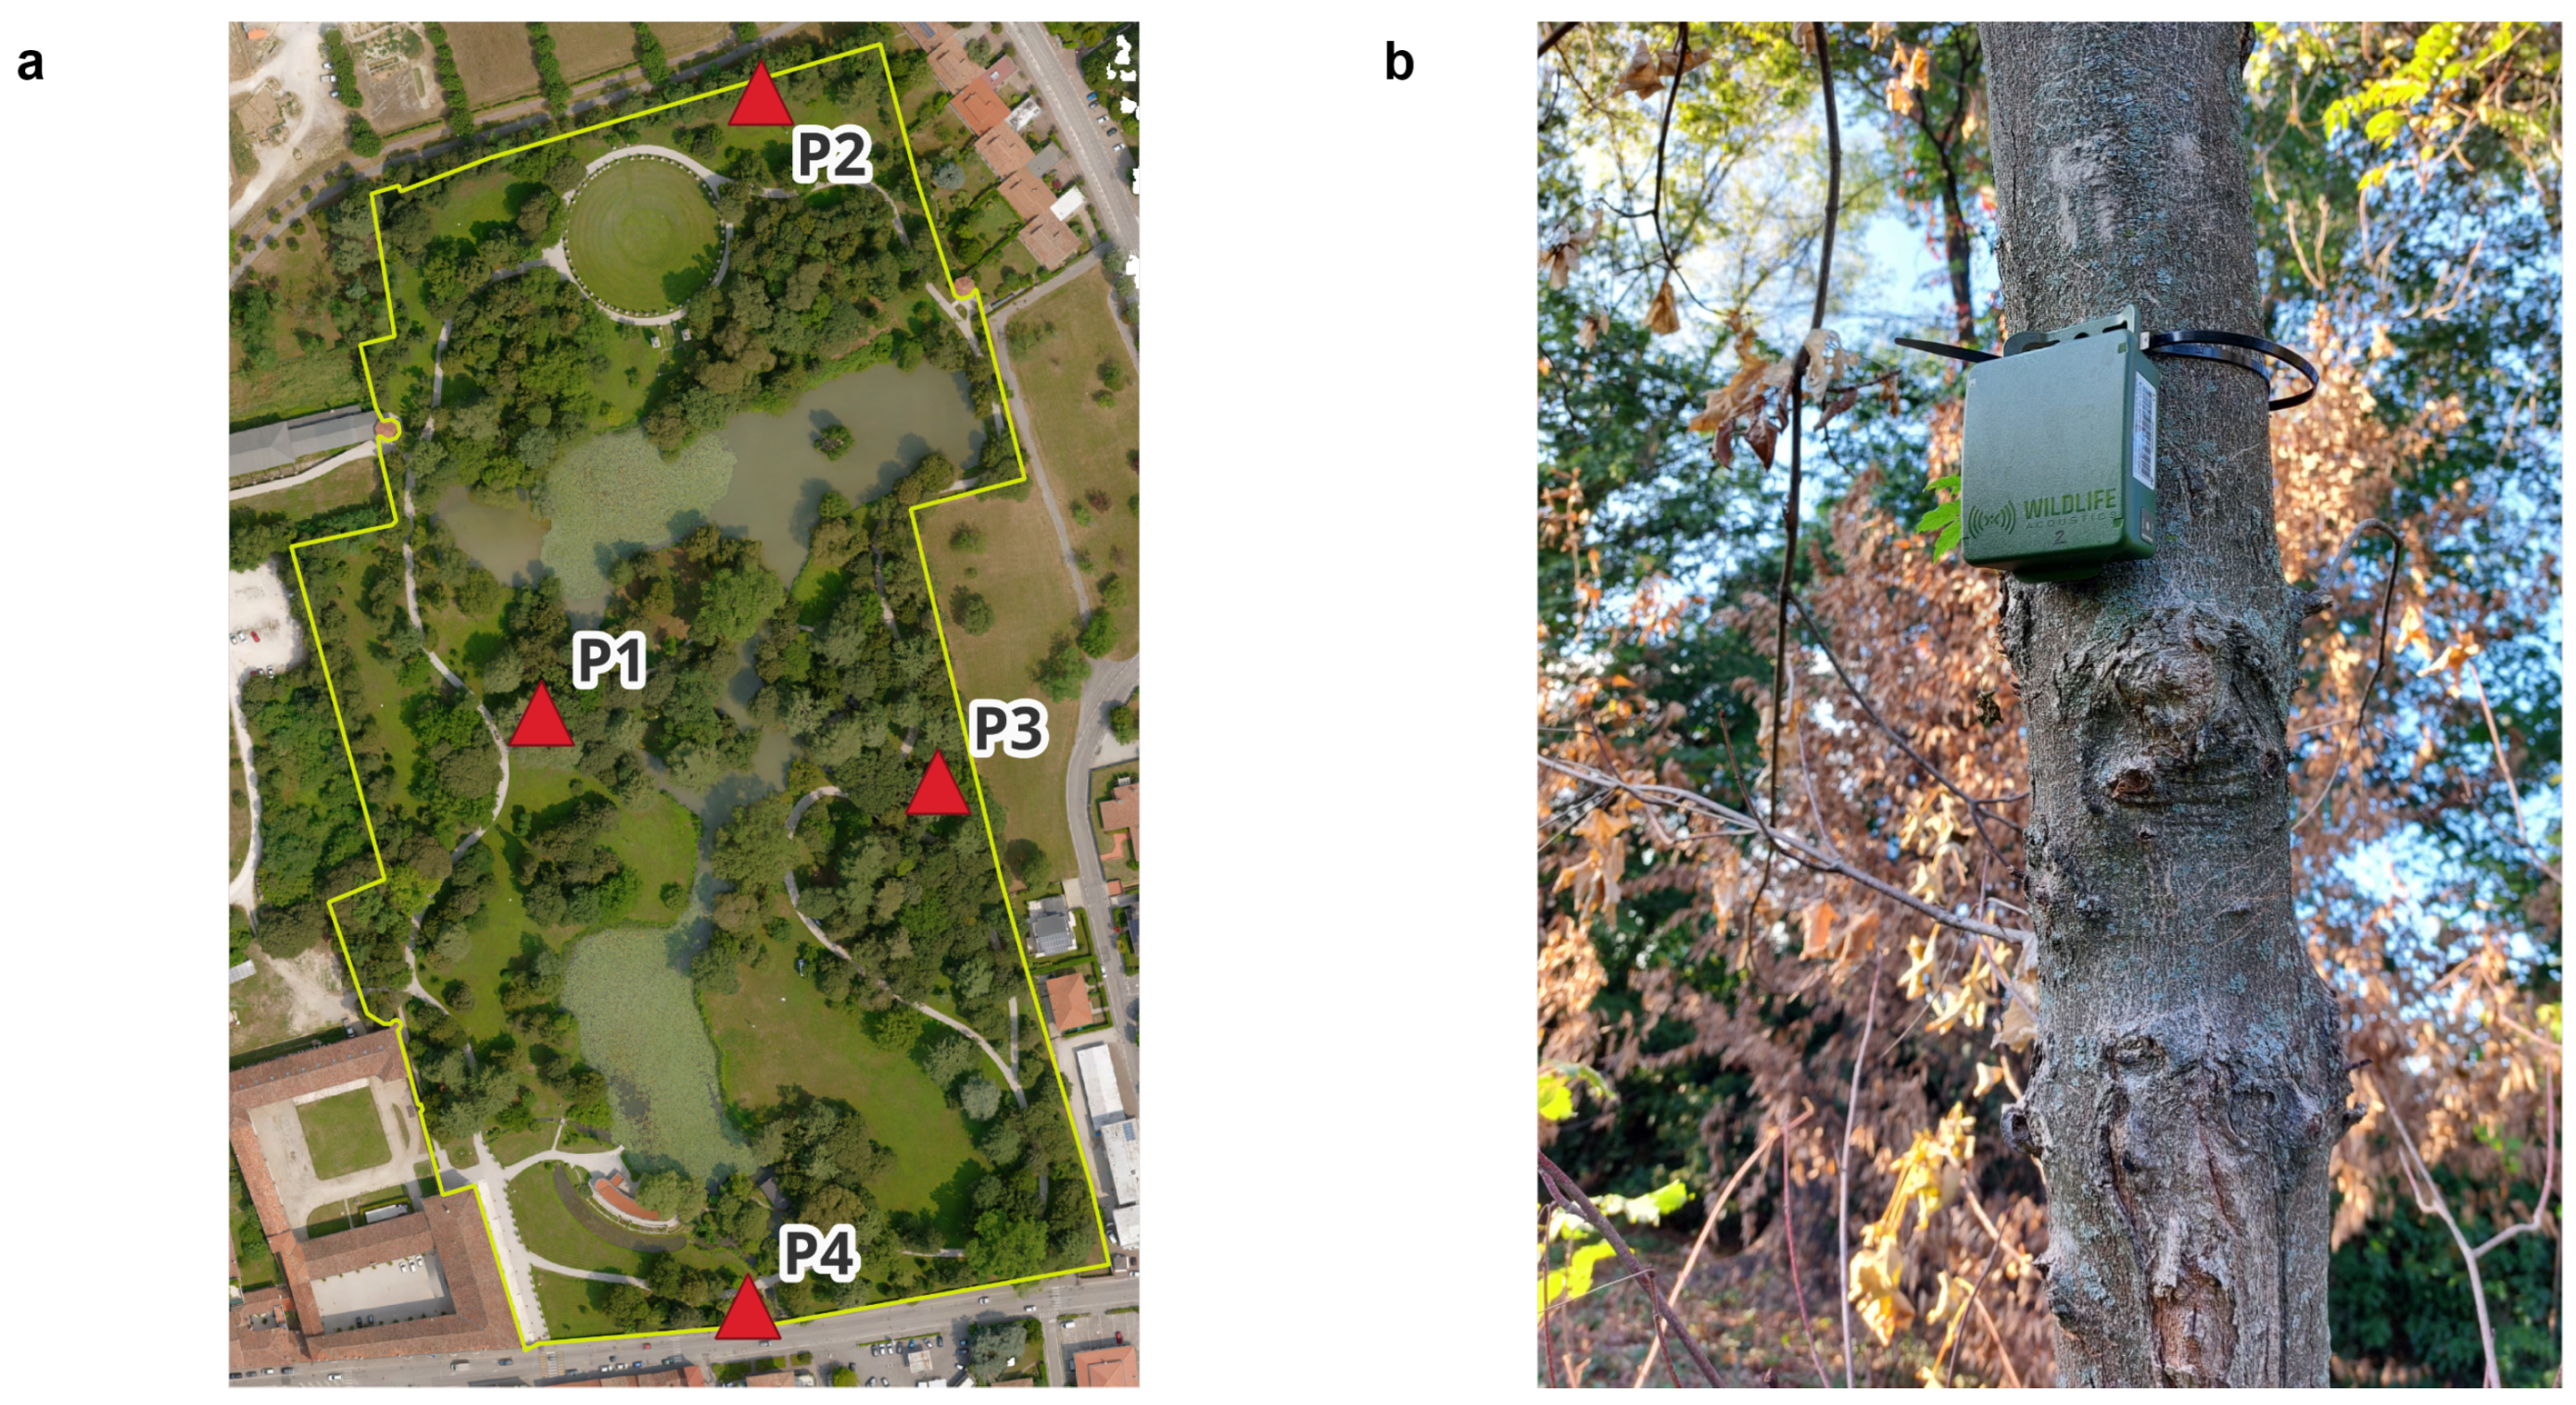
Figure 1. (a) Locations of the four fixed automated recorders (red triangles) within the historical urban garden (perimeter line in yellow on orthophoto sourced from photogrammetry techniques); (b) photo of a fixed recording device installed on a tree through cable ties in P2.
Land 14 01970 g001
Figure 2. Proportion of deciduous (yellow) and evergreen (green) species across the Voronoi polygons (blue line) calculated for the surface of the historical garden based on the four recorders’ positions (red triangle).
Land 14 01970 g002
Figure 3. Categorical heatmap showing the direction and statistical significance of fixed effects from linear mixed models for five acoustic indices (NDSI, ACI, AEI, ADI, and BI). Columns represent predictor variables; rows correspond to each Acoustic Index. Colours indicate the direction of the effect: green for positive, purple for negative. Statistical significance based on p-values is shown using asterisks: p < 0.05 *, p < 0.01 **, p < 0.001 ***.
Land 14 01970 g003
Figure 4. Seasonal variation in five acoustic indices measured in an urban historical garden. Boxplots show the distribution of (a) Normalized Difference Soundscape Index (NDSI), (b) Acoustic Complexity Index (ACI), (c) Acoustic Evenness Index (AEI), (d) Acoustic Diversity Index (ADI), and (e) Bioacoustic Index (BI) across three seasons: autumn, winter, and spring. Each box represents the interquartile range, with the median indicated by the central line. Colours correspond to seasons (autumn = purple, winter = blue, spring = green).
Land 14 01970 g004
Figure 5. Barplots showing differences between recorder locations (P1–P4) of the considered vegetational metrics based on Voronoi polygon summaries. Panels display (a) canopy height model (CHM, m), (b) tree density (n/polygon), (c) mean basal area (m2), (d) tree species richness (Nspp), and (e) proportion of evergreen trees. Bar heights represent the average value per point; numeric labels indicate rounded means.
Land 14 01970 g005
Table 1. Estimates of fixed effects for acoustic indices.
PredictorNDSIACIAEIADIBI
(Intercept)6.183 ***89.892 ***0.428 ***3.668 ***52.212
Season: Autumn0.061−0.857 ***−0.129 ***0.148 ***−10.512 ***
Season: Spring0.238 ***−0.676 **−0.214 ***0.231 ***−27.533 ***
Mean temperature (C°)0.028 ***0.058 **0.182 ***−0.0022.859 ***
Mean humidity (%)0.001 *0.009 *−0.113 ***0.002 ***0.017
Solar radiation (W/m2)−0.0002 ***−0.002 ***0.108 ***−0.0001 ***0.016 ***
Barometric pressure (hPa)−0.007 ***−0.027 **0.036−0.002 *0.041
Conditional R20.4150.1230.3000.1590.430
Marginal R20.3940.200.0680.0890.171
Note: Estimates are shown with significance levels as superscripts. Significance codes: * p < 0.05 , ** p < 0.01 , *** p < 0.001 .
Table 2. Mean NDSI values per recording point and results of Tukey HSD post hoc comparisons. Asterisks indicate significance levels (* p < 0.05; ** p < 0.01; *** p < 0.001).
Recorder LocationMean NDSIPairwise Comparison (Tukey HSD)
Contrast Difference p-Value
P1–0.295P2–P10.176<0.001 ***
P2–0.119P3–P10.0540.071
P3–0.241P4–P10.164<0.001 ***
P4–0.131P3–P2–0.122<0.001 ***
P4–P2–0.0120.947
P4–P30.110<0.001 ***
Table 3. Mean ACI values at each recorder point and results of pairwise Tukey HSD comparisons. All differences are statistically significant at p < 0.001 .
Recorder LocationMean ACIPairwise Comparison (Tukey HSD)
Contrast Difference p-Value
P164.02P2–P1+0.87<0.001 ***
P264.88P3–P1–0.63<0.001 ***
P363.39P4–P1–1.62<0.001 ***
P462.40P3–P2–1.49<0.001 ***
P4–P2–2.49<0.001 ***
P4–P3–0.99<0.001 ***
Table 4. Mean AEI values at each recorder point and pairwise comparisons (Tukey HSD). Significant differences are highlighted with *** for p < 0.001 .
Recorder LocationMean AEIPairwise Comparison (Tukey HSD)
Contrast Difference p-Value
P10.392P2–P1+0.0100.714
P20.402P3–P1+0.0010.999
P30.393P4–P1–0.116<0.001 ***
P40.277P3–P2–0.0090.796
P4–P2–0.126<0.001 ***
P4–P3–0.117<0.001 ***
Table 5. Mean ADI values at each recorder point and pairwise comparisons (Tukey HSD). Significant differences are highlighted with *** for p < 0.001 .
Recorder Location Mean ADIPairwise Comparison (Tukey HSD)
Contrast Difference p-Value
P11.901P2–P1–0.0200.452
P21.880P3–P1+0.0110.872
P31.911P4–P1+0.192<0.001 ***
P42.093P3–P2+0.0310.115
P4–P2+0.213<0.001 ***
P4–P3+0.182<0.001 ***
Table 6. Mean BI values at each recorder point and pairwise comparisons (Tukey HSD). Significant differences are highlighted with *** for p < 0.001 .
Recorder LocationMean BIPairwise Comparison (Tukey HSD)
Contrast Difference p-Value
P1112.45P2–P1–1.240.855
P2111.20P3–P1+7.94<0.001 ***
P3120.39P4–P1+49.21<0.001 ***
P4161.66P3–P2+9.19<0.001 ***
P4–P2+50.45<0.001 ***
P4–P3+41.27<0.001 ***
Table 7. Mean values and standard errors (SEs) for canopy height model (CHM), tree density, mean basal area, number of tree species, and proportion of evergreen species. The table also reports the values observed at each recorder location (P1–P4) of the structural and compositional vegetation variables considered in the analysis.
VariableMeanSEP1P2P3P4
CHM8.6240.0339.167.7311.635.98
Tree Density (n/ha)324.7002.049485349123341
Basal area (m2)0.1020.0010.080.050.180.1
Number of tree species28.7560.03932252929
Proportion of evergreen species (%)0.3850.0030.270.140.590.54
Disclaimer/Publisher’s Note: The statements, opinions and data contained in all publications are solely those of the individual author(s) and contributor(s) and not of MDPI and/or the editor(s). MDPI and/or the editor(s) disclaim responsibility for any injury to people or property resulting from any ideas, methods, instructions or products referred to in the content.