Abstract
Southwestern China, characterized by highly undulating terrain and mountainous areas, faces frequent landslide disasters. However, previous studies in this region mostly neglected the role of extreme rainfall in landslide susceptibility assessment and the socio-economic risks threatened by landslides. To address these gaps, this study integrated 688 recorded landslides for Tengchong City in the southwest of China and 10 influencing factors (topography, lithology, climate, vegetation, and human activities), particularly two extreme precipitation indices of maximum consecutive 5 day precipitation (Rx5day) and maximum length of wet spell (CWD). These influencing factors were selected after ensuring variable independence via multicollinearity analysis. Four machine learning models were then built for landslide susceptibility assessment. The Random Forest model performed the best with an Area Under Curve (AUC) of 0.88 and identified elevation, normalized difference vegetation index (NDVI), lithology, and CWD as the four most important influencing factors. Landslides in Tengchong are concentrated in areas with low NDVI (<0.57), indicating increased vegetation cover might reduce landslide frequency. Landslide risk was further quantified via the Analytic Hierarchy Process (AHP) by integrating multiple socio-economic factors. High-risk zones were pinpointed in central-southern Tengchong (e.g., Heshun and Tuantian townships) due to their high social exposure and vulnerability. Overall, this study highlights extreme rainfall and vegetation as key modifiers of landslide susceptibility and identifies the regions with high landslide risk, which provides targeted scientific support for regional early-warning systems and risk management.
1. Introduction
Landslides refer to natural processes in which a mass of rock or soil on an inclined surface moves downward, either partially or completely, induced by either natural or human-induced causes [1]. As a common geological disaster, a landslide is sudden and destructive. It not only directly affects construction, transportation, and the ecological environment but also threatens the safety of people’s lives and property, causing far-reaching social and economic impacts [2,3]. According to statistical data from the China Natural Resources Bulletin (2024) [4], landslides accounted for 57.98% (3316 out of 5719) of all recorded geological disasters in China in 2024. Southwestern China, with its complex terrain and extensive mountain ranges, is a region that has always been at high risk of landslides and other geological disasters. The Department of Emergency Management of Yunnan Province (2025) reported that geological hazard events in 2024 impacted an estimated 80,000 individuals, spanning 48 county-level administrative units across 15 prefecture-level divisions of the province [5]. Therefore, it is crucial to undertake a comprehensive landslide susceptibility assessment, geohazard risk analysis, and identification of landslide-prone areas in Yunnan province of southwest China.
Landslide susceptibility is defined as the probability of landslides occurring in an area under basic geographic conditions. Traditional models, such as the Weights of Evidence (WOE) method [6,7,8] and the Coefficient of Determination approach [9,10], have been widely employed in landslide susceptibility assessments. These models can reveal the dominant influencing factors of regional landslides. For example, the results obtained from the WOE method demonstrated that the distribution of landslides in Badong is predominantly concentrated along both sides of rivers and is influenced by faults [11]. Similarly, the results obtained from the Coefficient of Determination approach demonstrate that rivers, faults, and rocks are the primary factors of landslides in the Qin-Ba Mountain region [12]. Although traditional models are straightforward, easy to comprehend, and highly interpretable, these assessment techniques are limited by their incapacity to fully account for all possible influencing factors in the analysis, e.g., vegetation and extreme rainfall.
In recent years, machine learning has provided a new framework for landslide susceptibility research, leveraging its strong capabilities in data mining and pattern recognition, as well as providing more accurate predictive results. Among them, the most representative models are Random Forest (RF) [13,14], Back Propagation Neural Networks (BPNNs) [10,15], Support Vector Machines (SVMs) [9,16], Logistic Regression (LR), and Naive Bayes (NB) [17]. Researchers have conducted a lot of studies to evaluate different areas using different machine learning models. For example, the multivariate LR method is employed in northeast Kansas, identifying slope as the most significant predictor of landslide risk [18]. Two machine learning methods called RF and RF-SVM are developed to evaluate landslide susceptibility in the Rangit River watershed, and the results indicate both high regional risk and the superior predictive capability of the hybrid model [19]. The evaluation conducted in the Nandakini River basin compares three machine learning models, including RF, Deep Learning Neural Network (DLNN), and Artificial Neural Network (ANN), and demonstrates that the DLNN achieves the highest predictive accuracy in landslide susceptibility assessment [20]. Similarly, the comparative evaluation between LR and other machine learning approaches reveals that the RF model exhibits the highest predictive accuracy in the Sihjhong watershed of Taiwan [21]. The consistently better performance of machine learning models across various regions confirms their technical superiority in landslide susceptibility assessment.
Landslide risk refers to the impact of landslides on human activities and economic factors. The Analytic Hierarchy Process (AHP) is a quantitative and multi-criteria method designed for the hierarchical representation of a decision-making problem. This approach has been extensively employed in disaster risk assessment. For example, in ground subsidence risk assessment, AHP can quantitatively assign weights to hydrological, geological, anthropogenic factors and other factors [22]. Similarly, AHP can be used in flood, landslide and earthquake hazard assessment by assigning a weight value to each selected factor to provide risk maps for multi-hazard assessment modelling [23,24,25]. It has previously been mathematically validated and used to identify landslide risk in India [26]. As a semi-quantitative technique, AHP combines qualitative and quantitative methods. Machine learning training and simulation rely heavily on inventory data. However, landslide risk is a further assessment by considering socio-economic factors. Therefore, machine learning-based susceptibility maps serve as a key input in the AHP framework, creating a hybrid model. This approach weights outputs of machine learning and other layers to ensure the final risk maps are statistically reliable and informed by socio-economic judgment. Consequently, the hybrid model and the resulting map are valuable for decision-making.
Rainfall, different from terrain, geology, and other factors, is greatly affected by climate change. The relationship between rainfall and landslides has always been a research hotspot. Previous work identified a close relation between rainfall and landslide [27,28]. It is well accepted that shallow landslides and debris flows are triggered by high-intensity, short rainfalls, and deep-seated landslides occur as a result of less intense rain over a long time [29,30,31]. However, previous studies have mostly considered the annual average precipitation [32,33,34]. Extreme rainfall is often a key factor in triggering landslides, especially in areas with existing potential landslides. Heavy rainfall exerts an influence on the land surface, thereby affecting the movement of land surface materials. Long-term continuous rainfall leads to severe water infiltration, affecting deep soil layers. Therefore, the integration of extreme rainfall indices (e.g., rainfall intensity and duration) is expected to enhance the predictive precision of landslide susceptibility mapping through capturing rainfall intensity extremes beyond traditional mean-based metrics.
Therefore, this study employed four commonly used machine learning models and combined them with AHP for landslide susceptibility and risk assessment in Tengchong city. Compared with previous studies, this study has two major innovations. First, in the selection of influencing factors, the important influence of extreme rainfall on landslide occurrence is fully considered. The extreme rainfall indicators are introduced, and two representative factors are screened by correlation analysis for inclusion in landslide susceptibility assessment. It improves the accuracy of landslide prediction under extreme rainfall conditions. Second, a landslide risk zoning framework is developed through the integration of AHP and machine learning modeling. The results provide valuable support to assist local government in developing targeted disaster mitigation measures and strengthening landslide risk management capabilities.
2. Data and Methods
2.1. Study Area
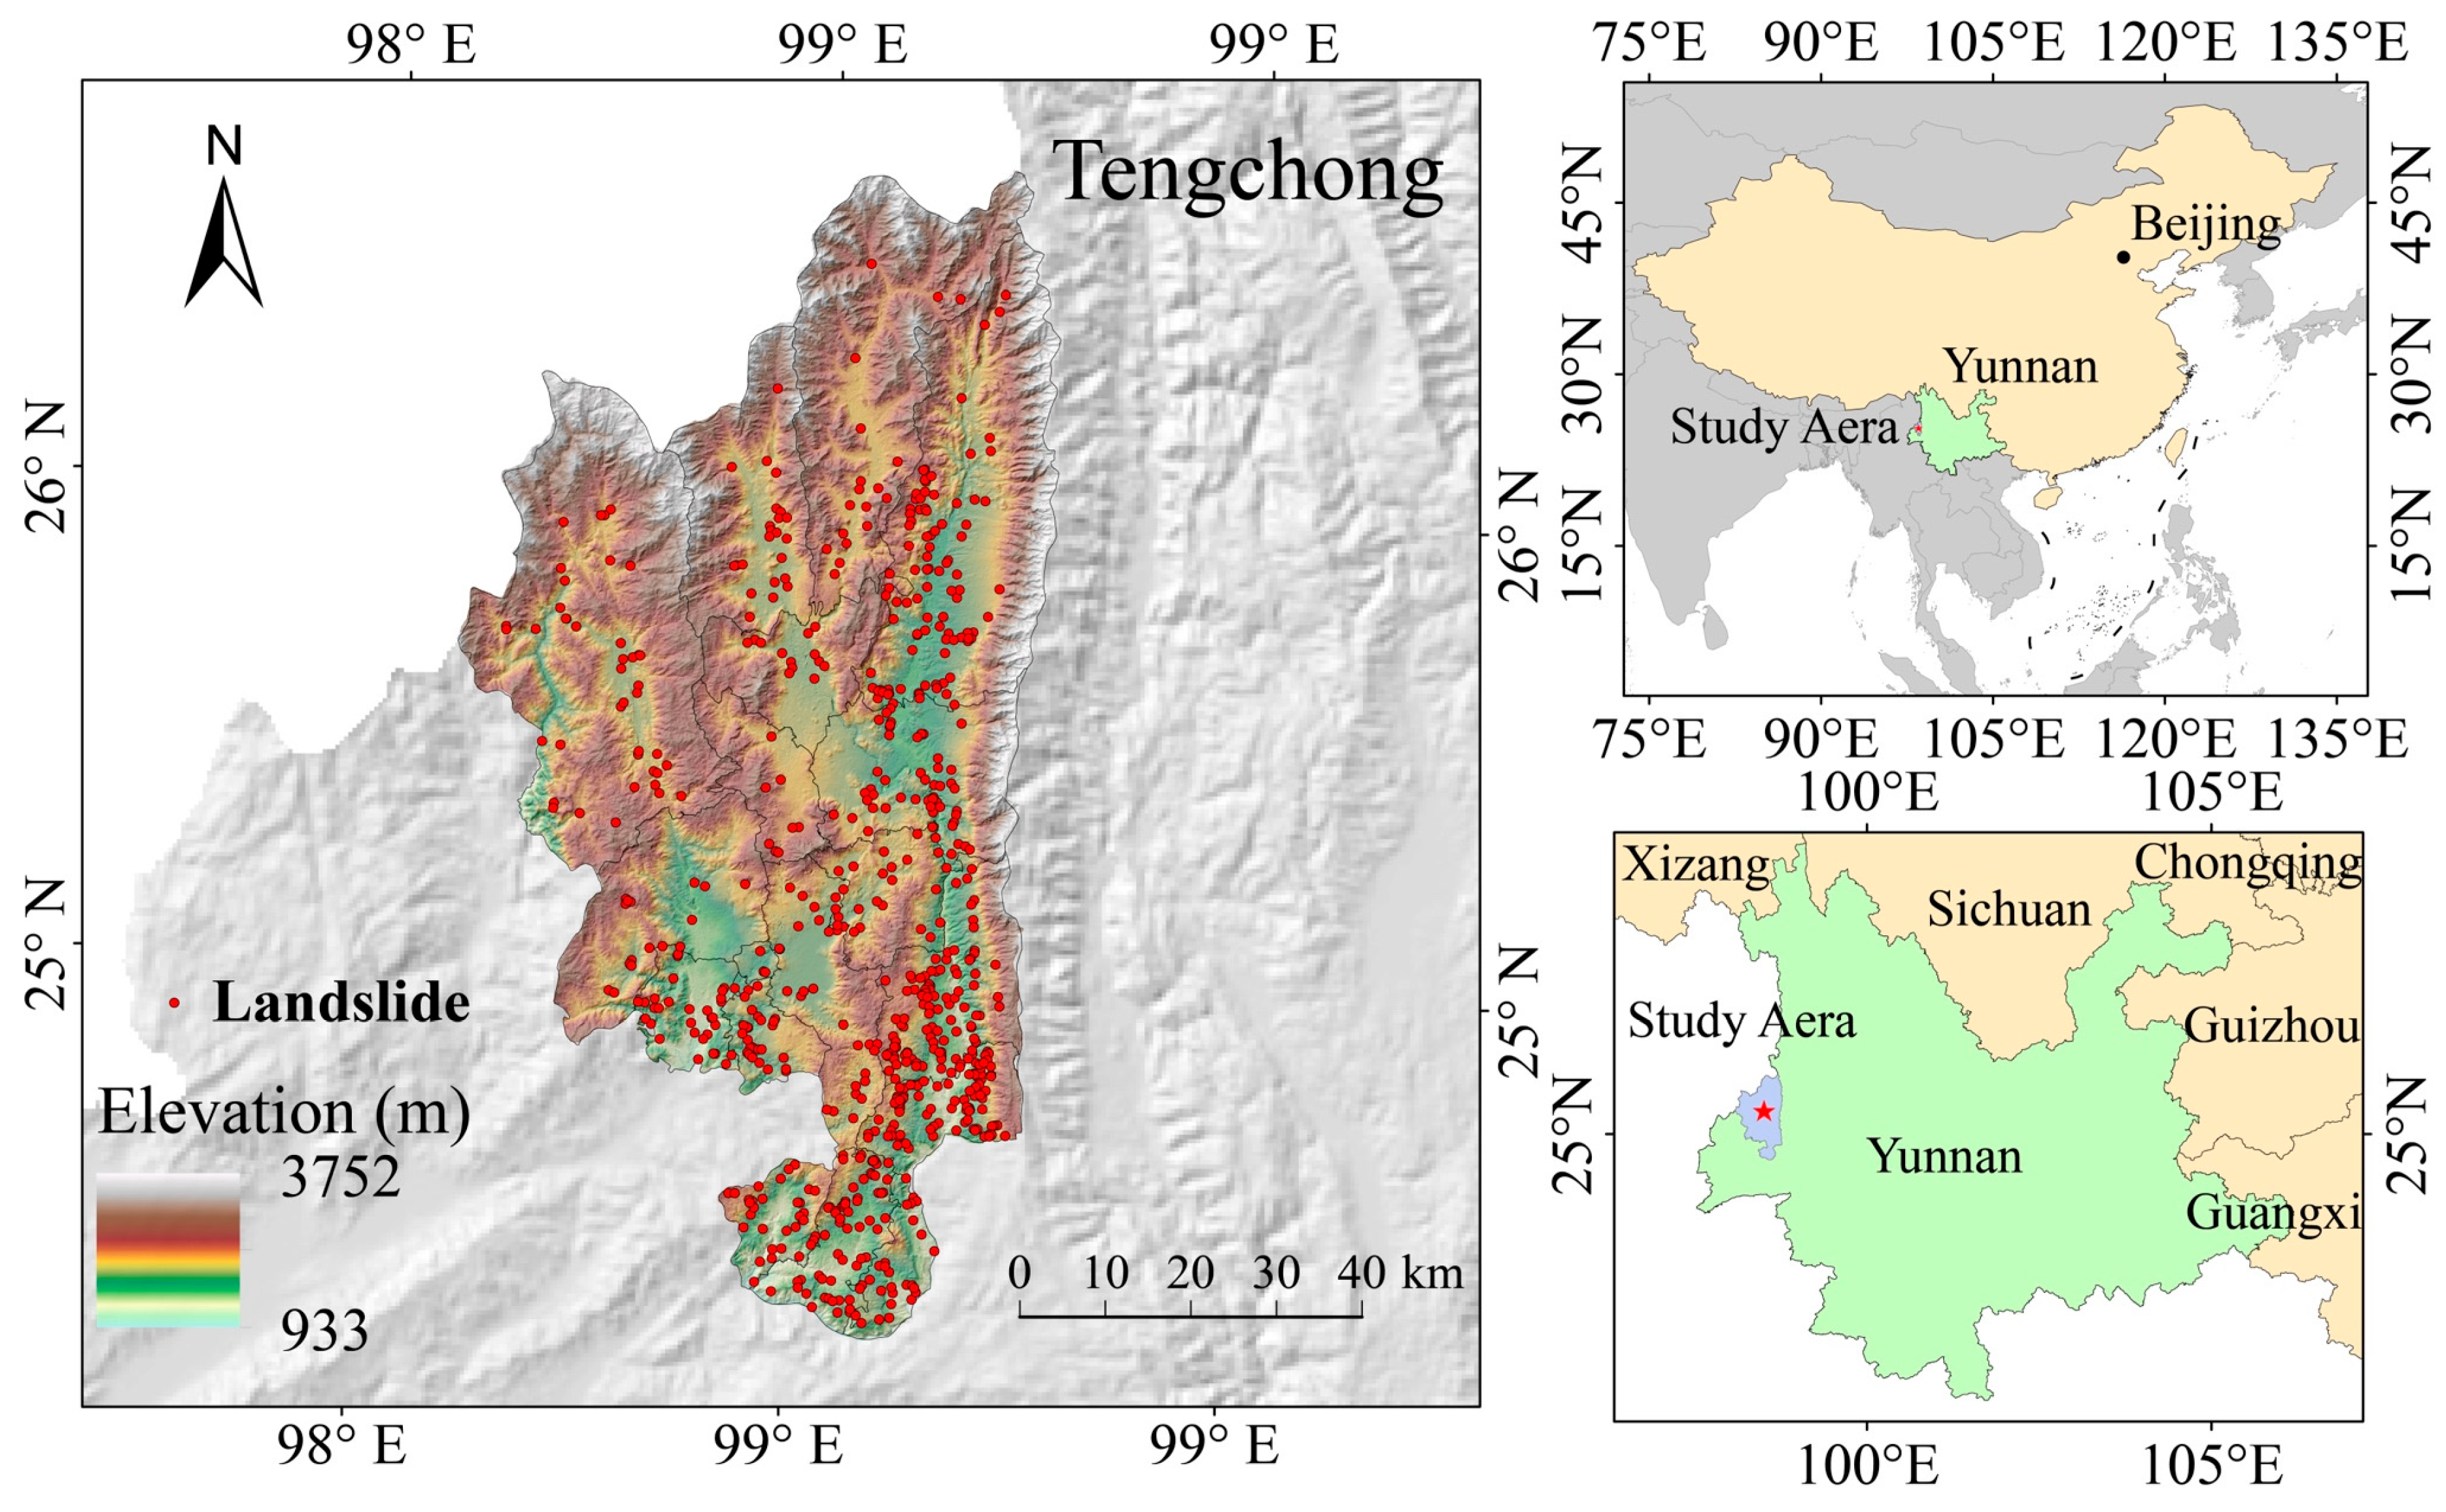
Tengchong is located in the western Yunnan Province of southwest China, covering an area of 5845 km2 (Figure 1). Situated within the Indian Ocean monsoon climate zone, Tengchong exhibits a humid subtropical climate characterized by copious annual precipitation, marked seasonal contrasts between dry and wet phases, and pronounced altitudinal climatic gradients due to its complex topography, posing significant challenges for landslides and flood hazard mitigation. It lies between 24°37′–25°51′ N and 98°05′–98°46′ E, at the southern end of the Hengduan Mountains. Located on the western side of the Indian–Eurasian plate collision zone and within the Sanjiang fold system, Tengchong is tectonically active, rich in geothermal resources, and frequently affected by fault and magma activity [35]. As a result, earthquakes and geological disasters occur frequently.
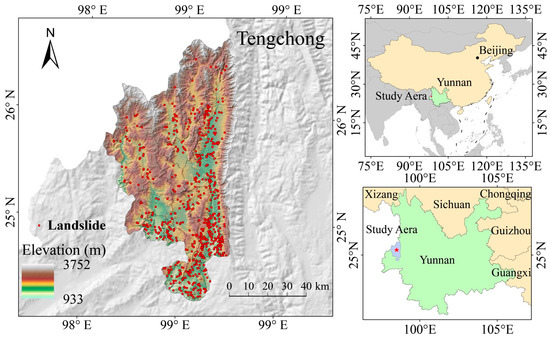
Figure 1.
Location of Tengchong city of Yunnan province, southwestern China. The red dots in the left panel represent the 688 recorded landslides. The blue area with the red star in the right panels denotes the study area.
2.2. Data and Factors of Assessment
A total of 688 landslide sites, spatially dispersed across the study area, were mapped and verified by the China Geological Survey. The data for the 688 landslides are mainly derived from detailed field surveys conducted between 2000 and 2020. The dataset includes each landslide with information on landslide types, slope structures, and possible causal factors. In addition, the dataset provides precise latitudes and longitudes for specific landslide occurrence points to facilitate their easy use in subsequent analyses. This study incorporates landslide-influencing indicators, including terrain, vegetation indices, rainfall indices, geology, rivers and roads, as well as population and build-up (Table 1). For vegetation indices, rainfall data, population density and building data, average values from 2000 to 2020 are used.

Table 1.
List of datasets with their resolutions and data sources.
Given the inconsistent resolutions of the datasets and Tengchong’s spatial scope, all datasets were resampled to a uniform 30 m resolution. In detail, distance variables to target features (e.g., roads, rivers, and buildings) were first calculated at the raster scale using the Euclidean Distance tool in ArcGIS10.8. For this computation, vector-to-raster conversion was performed in two key steps: first, original vector features (e.g., linear road features) were converted to a binary source raster via the Feature to Raster tool—pixels containing the target features were assigned a value of 1, while all other pixels were set to NoData. Following this, the source raster was used as input for the Euclidean Distance tool to generate a final continuous distance raster. For each pixel in this raster, the value represents the shortest straight-line (Euclidean) distance from the pixel’s center to the nearest target feature. Additionally, the rainfall raster dataset was resampled to a higher spatial resolution using the nearest neighbor method. We assumed that the average climate state over 20 years within a 4 km grid cell is consistent. The total number of raster cells in the study area is approximately 6.32 × 10⁶.
Topographic factors include elevation, slope, and curvature. Elevation affects rainfall, vegetation, and biological activities, and consequently can cause landslides to spread in a certain range of elevations [37]. Slope also has a direct effect on landslide development [9]. The number of landslides occurring increases as the slope increases and then decreases after a certain peak [12]. Curvature is an expression of the degree of change in slope distortion [38]. Positive values indicate convex slopes, while negative values indicate concave slopes, and curvature closer to 0 suggests a gentler slope.
The land surface factors affecting landslide susceptibility are normalized difference vegetation index (NDVI) and distance from rivers. Higher NDVI values indicate healthier and denser vegetation [39]. Research shows adding NDVI to the landslide susceptibility mapping model is better than the model without NDVI [40]. The river system exhibits varying degrees of scouring and infiltration on both sides of the river, resulting in the formation of steep bank slopes, which induces landslides.
Rock and soil bodies, as well as faults, are the geologic basis for the occurrence of landslides. Different rock types have different weathering resistance, which affects the degree of development of landslides. Faults reflect the physical properties of the geologic body, affecting the stability of slopes. In fault fracture zones, the slope is prone to sliding to a certain extent. When rainfall occurs, water infiltration softens the soil in the sliding zone and influences saturation of the sliding mass. This leads to an increase in the downward sliding force of the slope mass, resulting in a landslide [41].
The main human activity factor considered in this study is the distance from roads. Excavation and unloading at the foot of slopes and accumulation at the top of slopes are the main causes of landslides induced by engineering activities. Geotechnical excavation and unloading will concentrate the stress on slopes. This leads to deterioration of slope stability conditions, thus causing landslides [42].
Atmospheric precipitation-induced elevation of pore water pressure reduces the effective stress within the soil matrix, which in turn decreases the shear resistance of potential sliding zones. This hydrological process softens the rock-soil mass through water infiltration, leading to a decline in mechanical properties and subsequent acceleration of slope failure mechanisms [43]. The expert team on Climate Change Detection and Indices (ETCCDI) and its predecessor have developed and calculated a suite of extreme indices about rainfall, which could measure the intensity and time of rainfall. Therefore, we adopt the ten extreme rainfall indicators proposed by ETCCDI, as shown in Table 2.

Table 2.
Definition of extreme precipitation indices.
2.3. Machine-Learning-Based Landslide Susceptibility Assessment
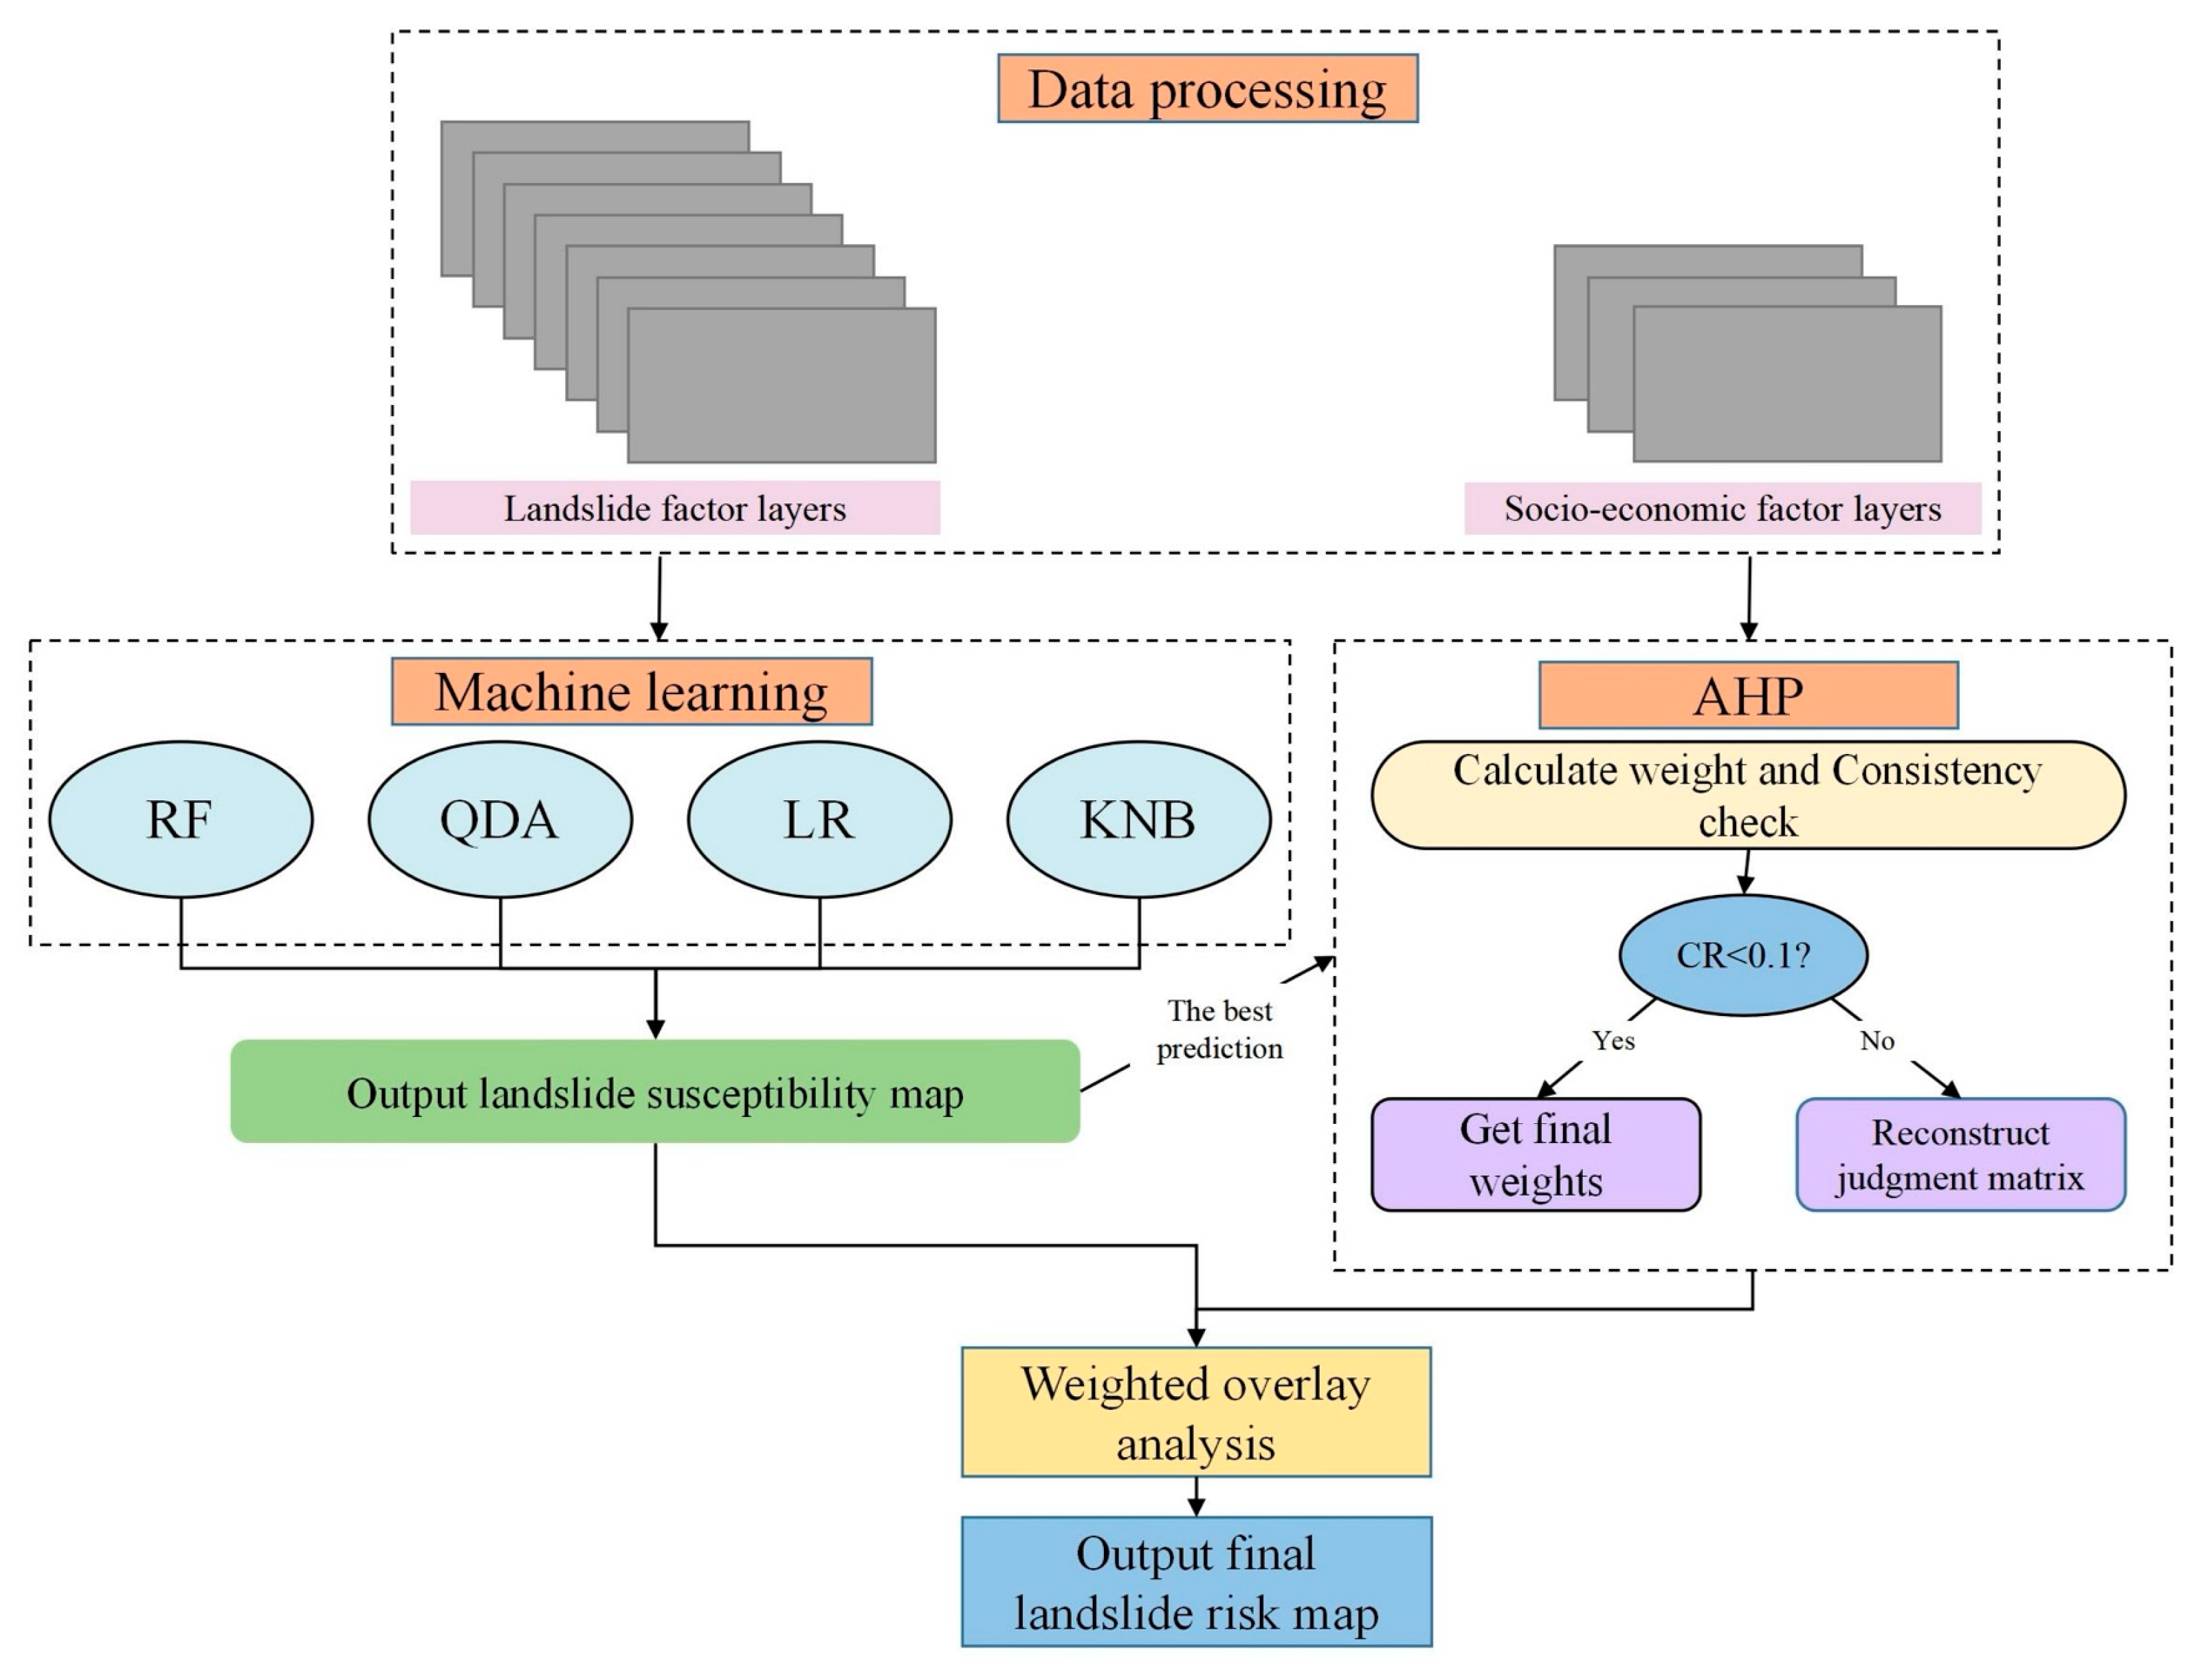
The overall methodological framework (Figure 2) of this study consists of the following key steps: (1) data processing involving preparation of landslide and socio-economic factor layers; (2) random sample selection for model training and validation. This set consists of 600 samples, comprising 300 landslide and 300 non-landslide samples; (3) five-fold cross-validation is performed to evaluate more than 10 machine learning methods. The four best machine learning methods (RF, QDA, LR, and KNB) are used to produce landslide susceptibility maps. The best-performing model is selected for further analysis; (4) utilization of the Analytic Hierarchy Process (AHP) to determine factor weights. A consistency check is performed (CR < 0.1). Should the result fail the check, the judgment matrix is reconstructed until consistency is achieved; (5) integration of the optimal susceptibility map and additional factor layers via weighted overlay analysis based on AHP-derived weights; (6) generation of a final landslide risk map.
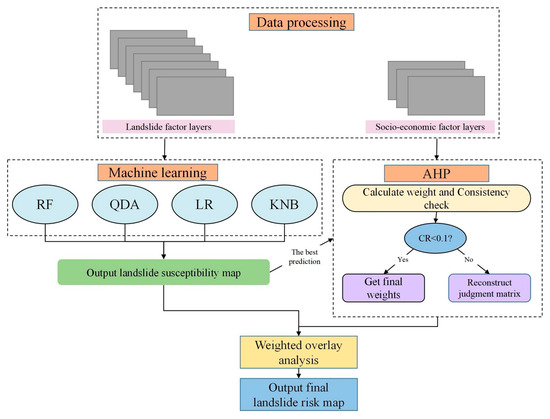
Figure 2.
Framework diagram for assessing landslide susceptibility and risk.
Four machine learning techniques for classification are employed to construct landslide susceptibility models. First, RF is an ensemble learning method that builds multiple decorrelated decision trees through bootstrap aggregation (bagging) with random feature selection. Each base learner trains on independently bootstrapped data samples using a randomly chosen subset of features, with final predictions determined by majority voting across the ensemble [44]. Second, Quadratic Discriminant Analysis (QDA) is a probabilistic classification method. It models each class using multivariate Gaussian distributions with class-specific parameters. By estimating distinct covariance matrices for each class, QDA generates quadratic decision boundaries that effectively handle heterogeneous class distributions. Classification is performed by comparing posterior probabilities computed through discriminant functions derived from these class-conditional density estimates [45]. Third, Logistic Regression (LR) is a statistical method for binary classification. It models the probability of class membership using a logistic function. It estimates coefficients from training data to predict binary outcomes (0 or 1) based on a decision threshold [46]. Fourth, Kernel Naive Bayes (KNB) extends conventional Naive Bayes (NB) classifiers by replacing parametric distribution assumptions with kernel density estimation. This nonparametric approach enables improved modeling of continuous features with nonlinear distributions [47]. KNB preserves classification efficiency through posterior probability maximization while demonstrating superior capability in modeling complex data patterns compared to standard approaches.
2.4. AHP-Based Landslide Risk Assessment
The AHP is a decision-making tool that assists in solving complex problems by dividing them into simpler criteria, which can derive ratio scales from discrete and continuous pairwise comparisons [48]. AHP can effectively construct measurement systems in instances where physical or statistical measures are unavailable. This method works by quantifying subjective evaluations into relative weights for each element based on their importance [49]. Numerous studies worldwide use this approach to rank the elements depending on their importance [50,51,52,53]. AHP involves the following key steps [54]:
Step 1. Clarify the decision-making process and establish objectives.
Step 2. Creation of hierarchies and construction of relative importance matrices. The relative importance is usually measured on a scale of 1 to 9, where 1 indicates equal importance and higher values indicate greater importance [55].
Step 3. Determine the criterion weights. When determining the eigenvector, first, each element of the obtained matrix is divided by the sum of its column. Then, the arithmetic mean of each row of the calculated new matrix is taken to determine the criterion weights.
Step 4. Calculate consistency. The reliability assessment involves calculating the principal eigenvalue to derive the consistency index (CI, Equation (1)), followed by computing the consistency ratio (CR, Equation (2)) using the randomness index (RI). If the obtained consistency ratio does not exceed the value of 0.1, it is interpreted that the criterion weights are reliable, and the decision matrix is formed.
where λmax is the maximum eigenvalue and n is the order of the matrix.
where CI is the consistency index and RI is the random consistency index. The CI value is calculated using Equation (1). RI varies according to the matrix order n consequently (Table 3), referring to Saaty [56].

Table 3.
Random consistency index (RI).
3. Results
3.1. Correlation Analyses of Multiple Factors
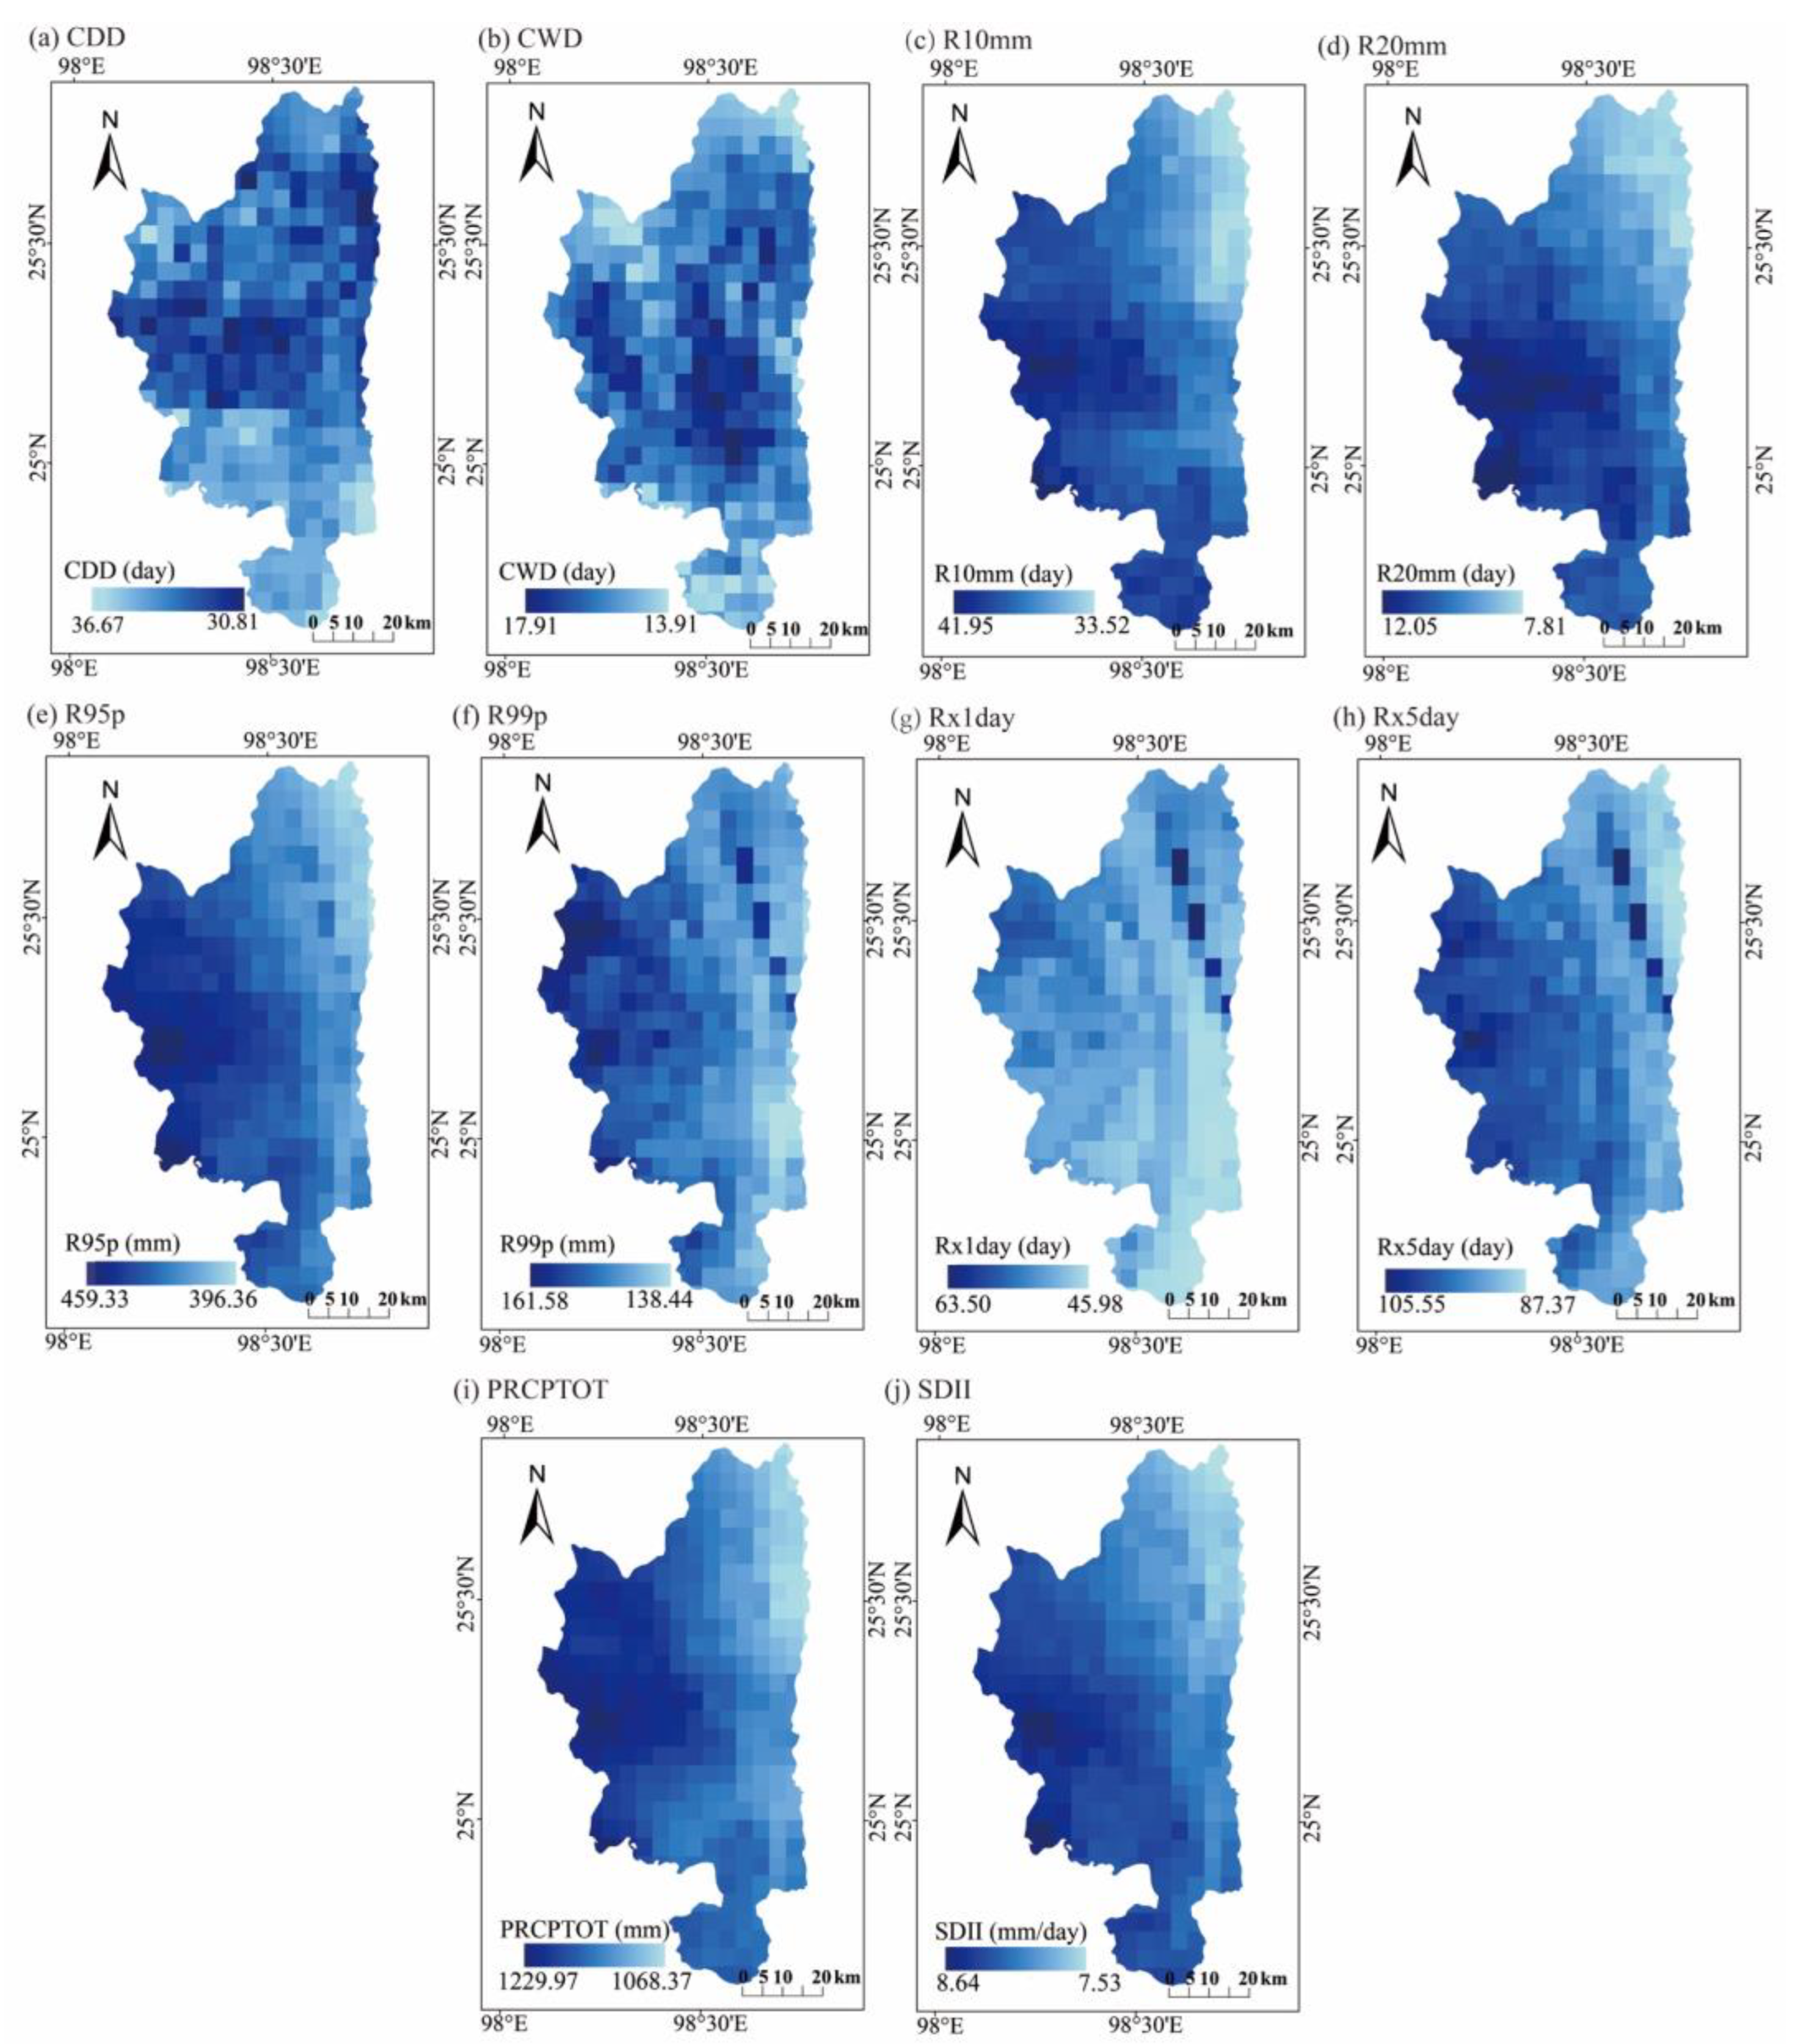
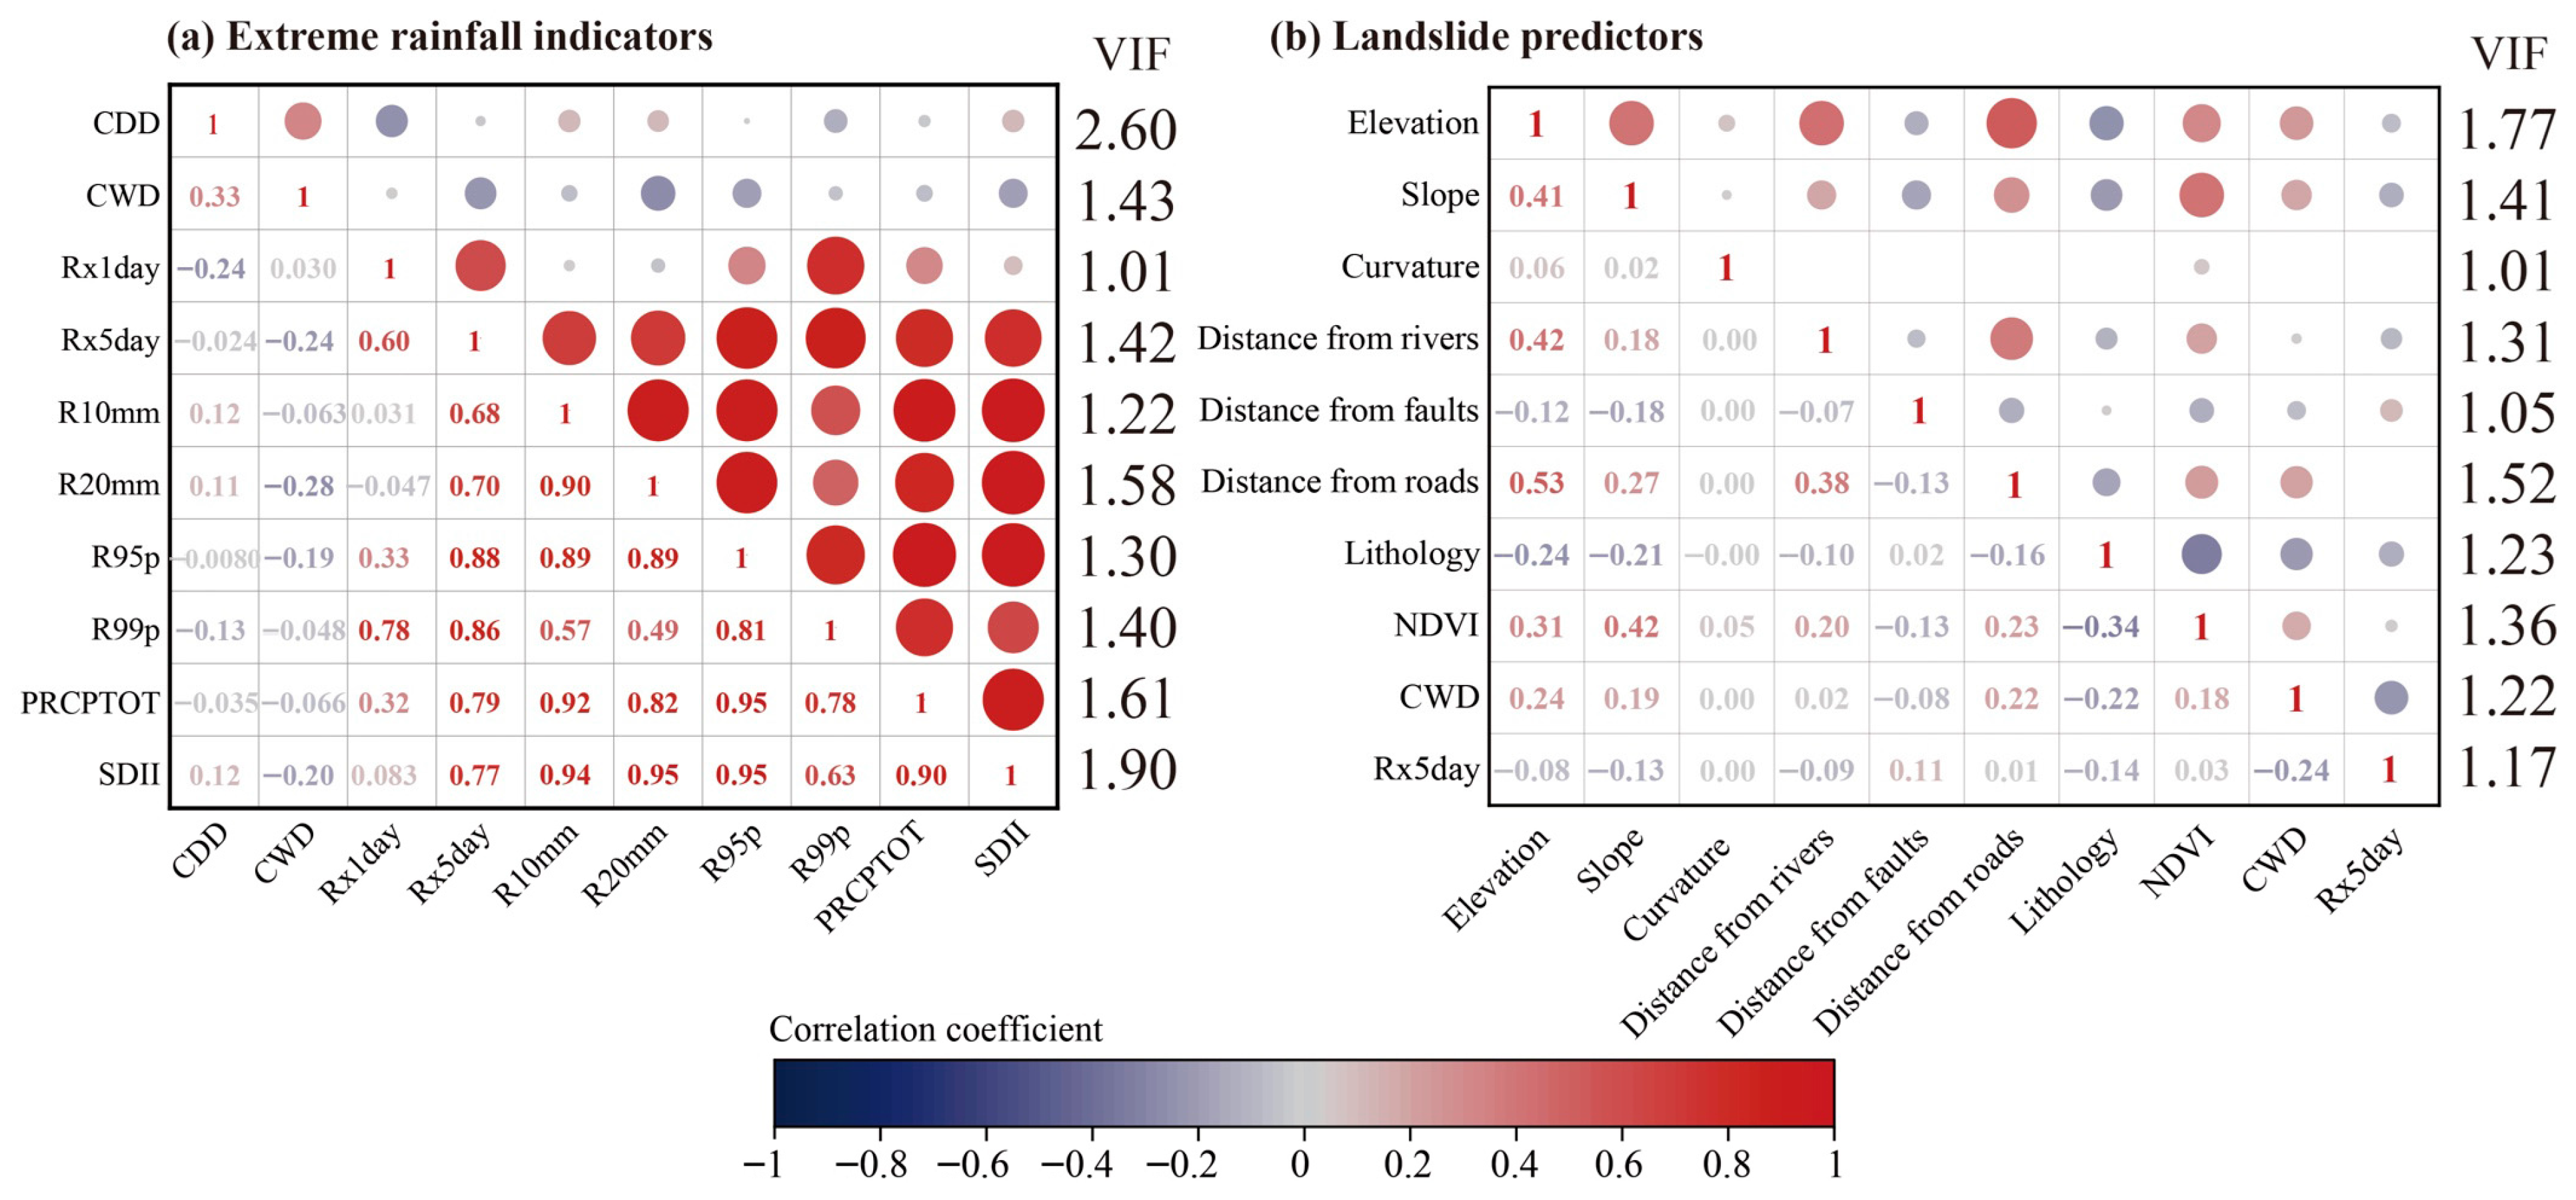
The subtropical monsoon climate in Tengchong exhibits a weakly defined seasonal cycle, with clear delineation between dry and wet periods. The rainy season extends from May to October, while the remaining months constitute the dry season. The region receives substantial precipitation, which classifies it among the southern high-rainfall zones of China. The average annual rainfall in Tengchong exceeds 1000 mm, and the city is relatively humid overall—with the western region being more humid than the eastern region (Figure 3i). The maximum consecutive dry days (CDDs) can persist for up to one month (Figure 3a), likely influenced by the monsoon climate, while the maximum consecutive wet days (CWDs) are shorter, with approximately 20 days (Figure 3b). Notably, extreme values of maximum 1 day precipitation (Rx1day) and maximum consecutive 5 day precipitation (Rx5day) occur in the northeast region, indicating the higher possibility of extreme rainfall events in these areas (Figure 3f–j). Theoretically, both short-duration, high-intensity rainfall and long-duration, low-intensity rainfall events can trigger landslides [57]. This suggests that CWDs, which reflects long-term wetting trends, and Rx5day, which represents short-term heavy rainfall, should be considered as landslide-predicting variables. Additionally, these two indices show a low correlation coefficient of −0.24 and a variance inflation factor (VIF) less than 3, making them suitable as independent factors for landslide susceptibility assessment (Figure 4a).
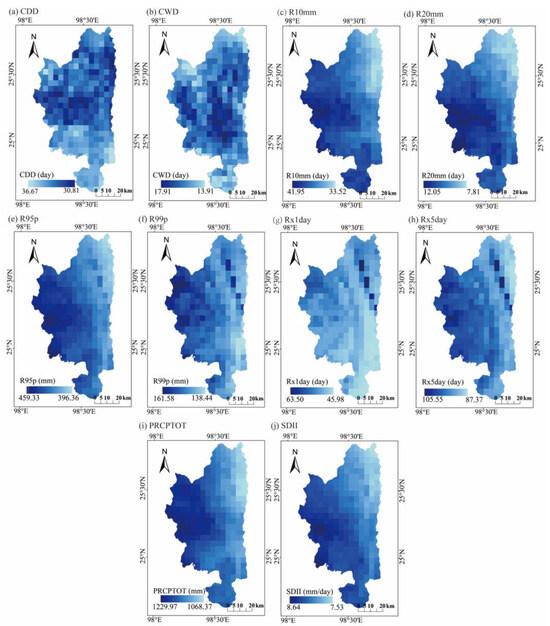
Figure 3.
Spatial distribution of extreme rainfall indicators averaged from 2000 to 2020 for Tengchong. These rainfall indicators are derived from further calculations of daily rainfall. Subfigure labels (a–j) indicate the 10 extreme rainfall indicator metrics as defined in Table 2.
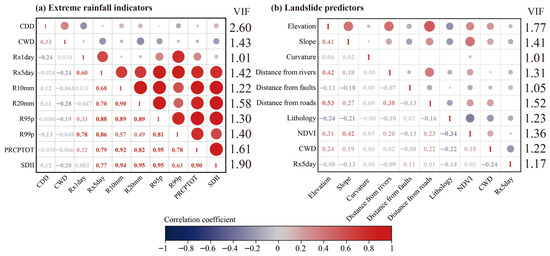
Figure 4.
Correlation analyses and variance inflation factor (VIF) between the ten extreme rainfall indicators (a) and the ten landslide predictors (b). Correlation coefficient values range from −1 to 1, with larger absolute values indicating higher correlation. Positive correlation coefficient values indicate a positive correlation between two factors, and negative values indicate a negative correlation. The magnitude of the correlation can be represented by r. A larger absolute value of r indicates a stronger positive or negative correlation. VIF is a measure of the severity of multicollinearity in multiple linear regression models. It is indicative of the ratio of the variance of the estimated regression coefficient to the variance when assuming nonlinear correlation between the independent variables. A value of VIF greater than one indicates the presence of multicollinearity, and a value closer to one suggests a lesser degree of multicollinearity. In instances of severe multicollinearity, it is imperative that appropriate methods are implemented to address the issue. The 10 landslide predictors are used for training a machine-learning-based landslide susceptibility model.
Correlation analyses of all factors were performed after selecting the two extreme rainfall indicators, CWDs and Rx5day (Figure 4a). Human engineering activities exhibit substantial altitude dependence, leading to a characteristically high correlation coefficient between human engineering activities and altitude (Figure 4b). Nevertheless, we cannot ignore the impact of human engineering activities on landslides based solely on the correlation coefficient. Notably, all correlation coefficients satisfy the medium multicollinearity threshold (|r| < 0.5) [58,59], and their VIF values are all less than 2, confirming the variables’ statistical independence as predictive features for machine learning model development.
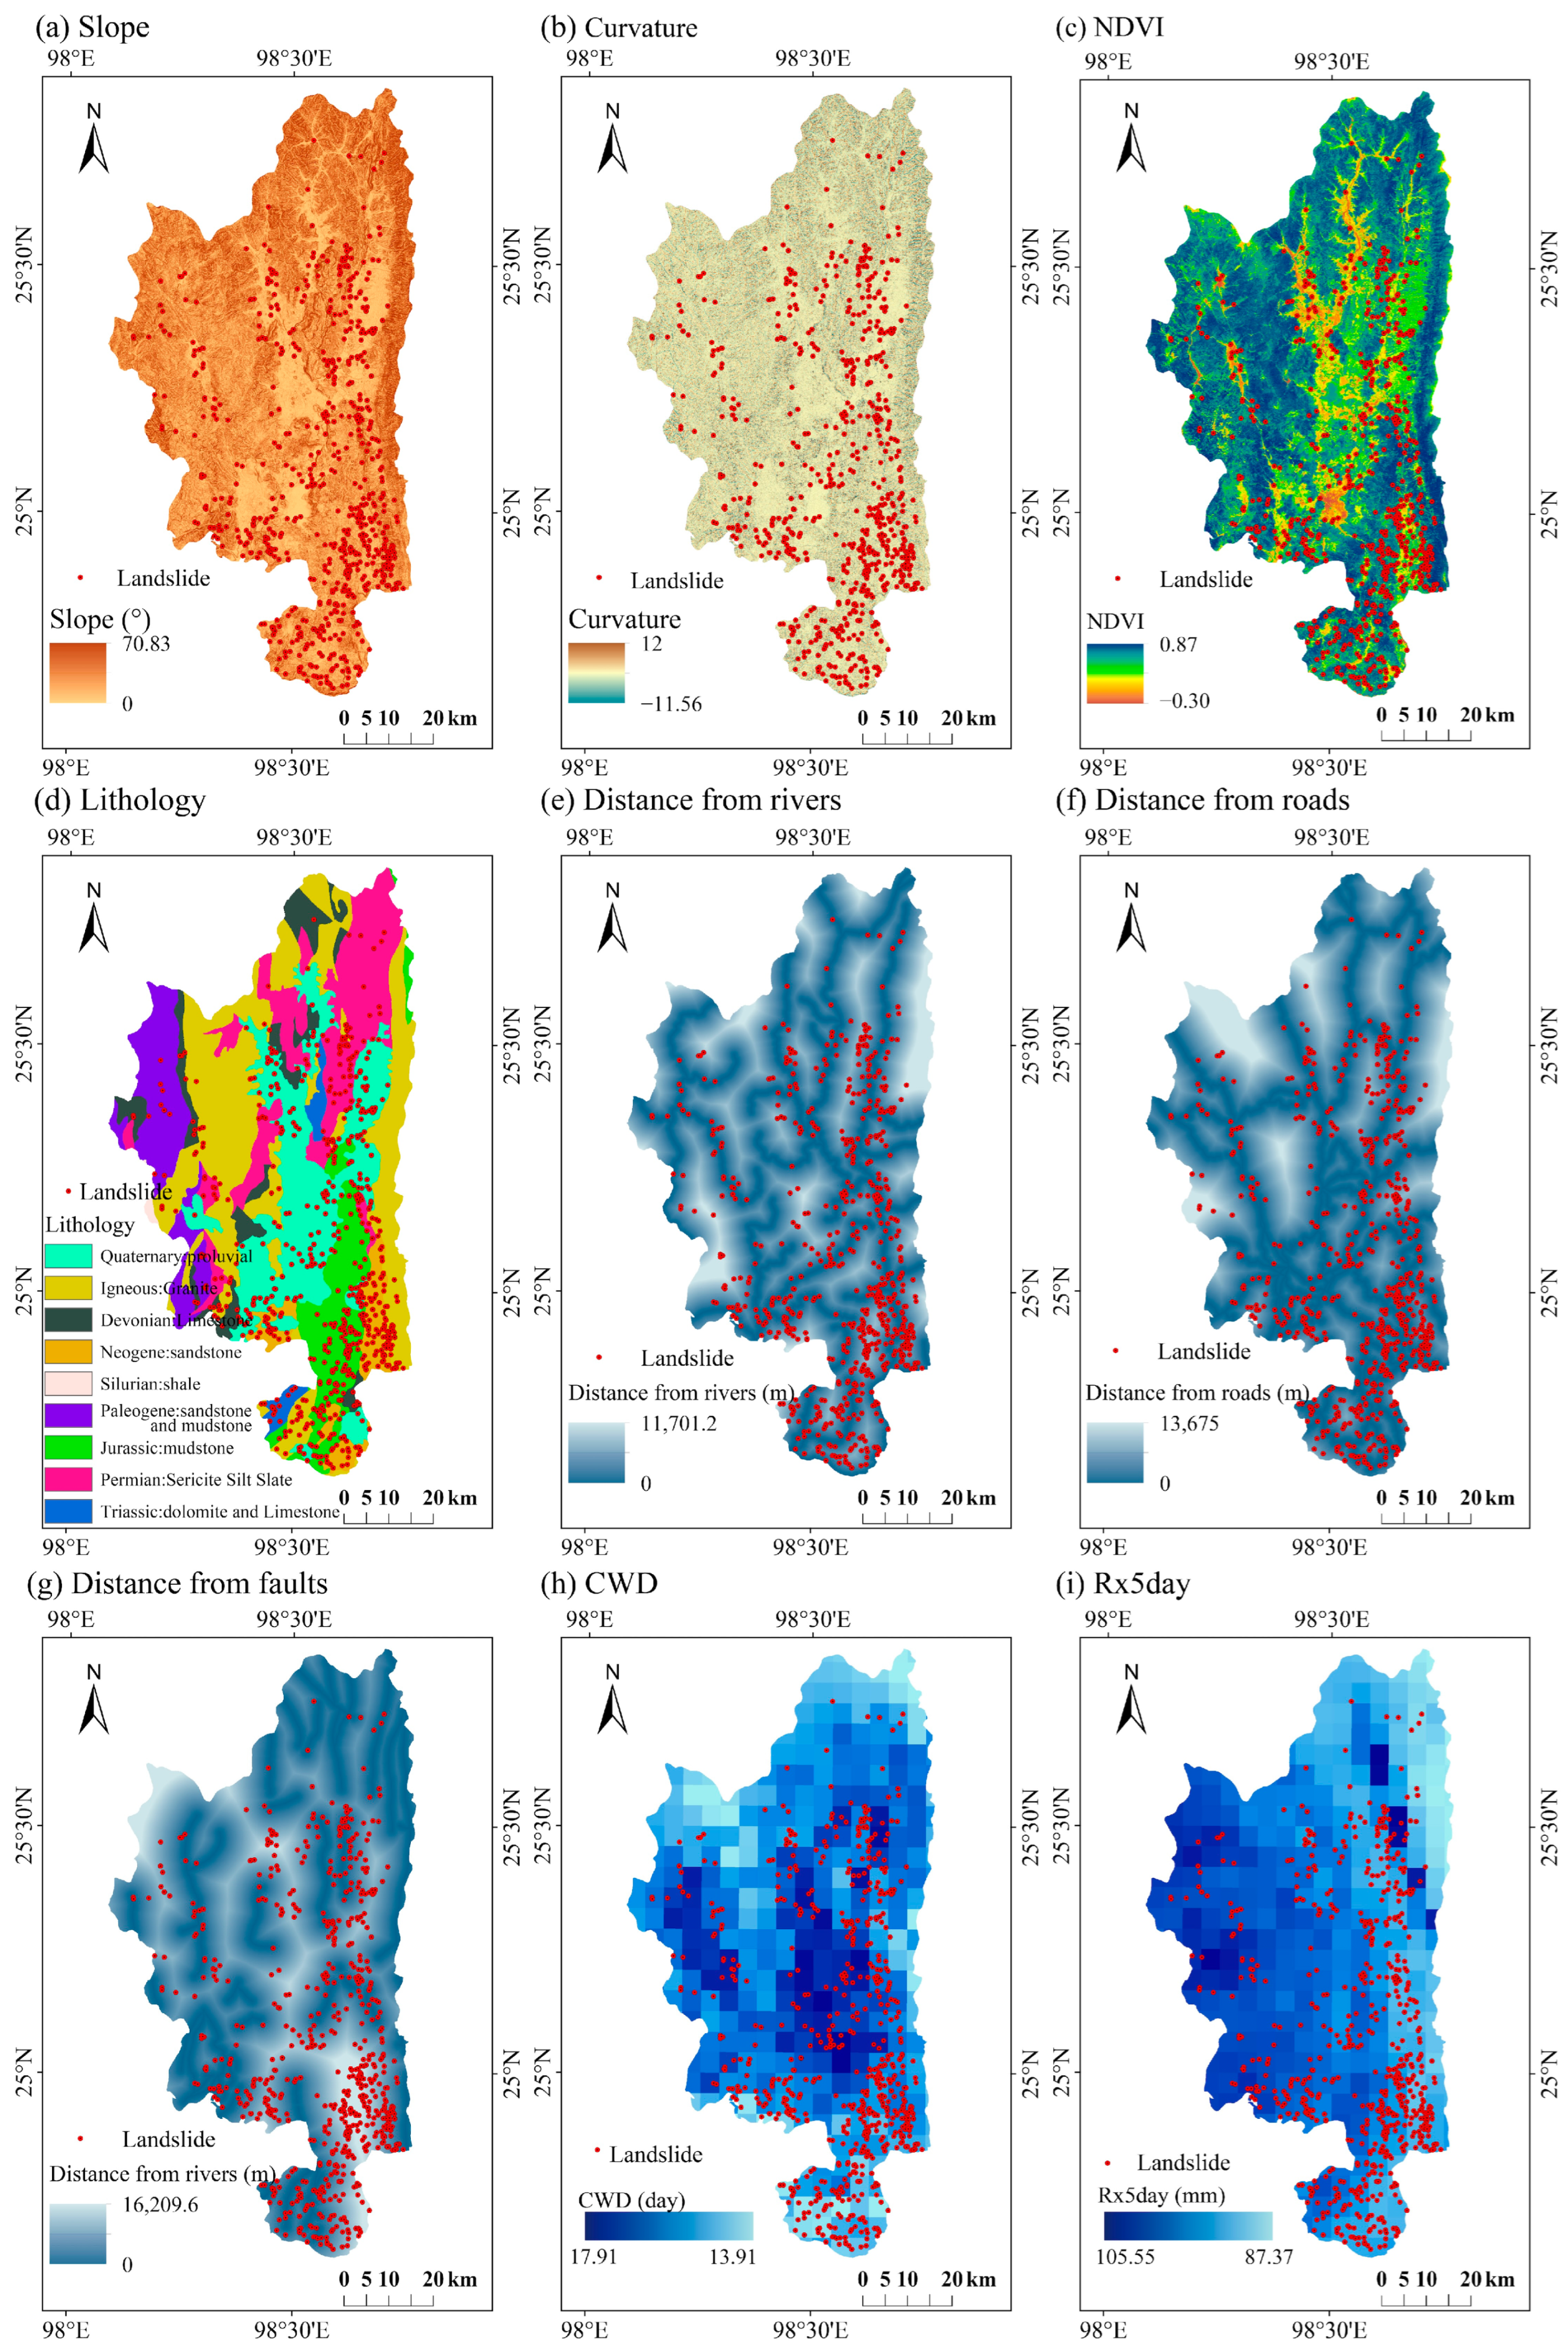
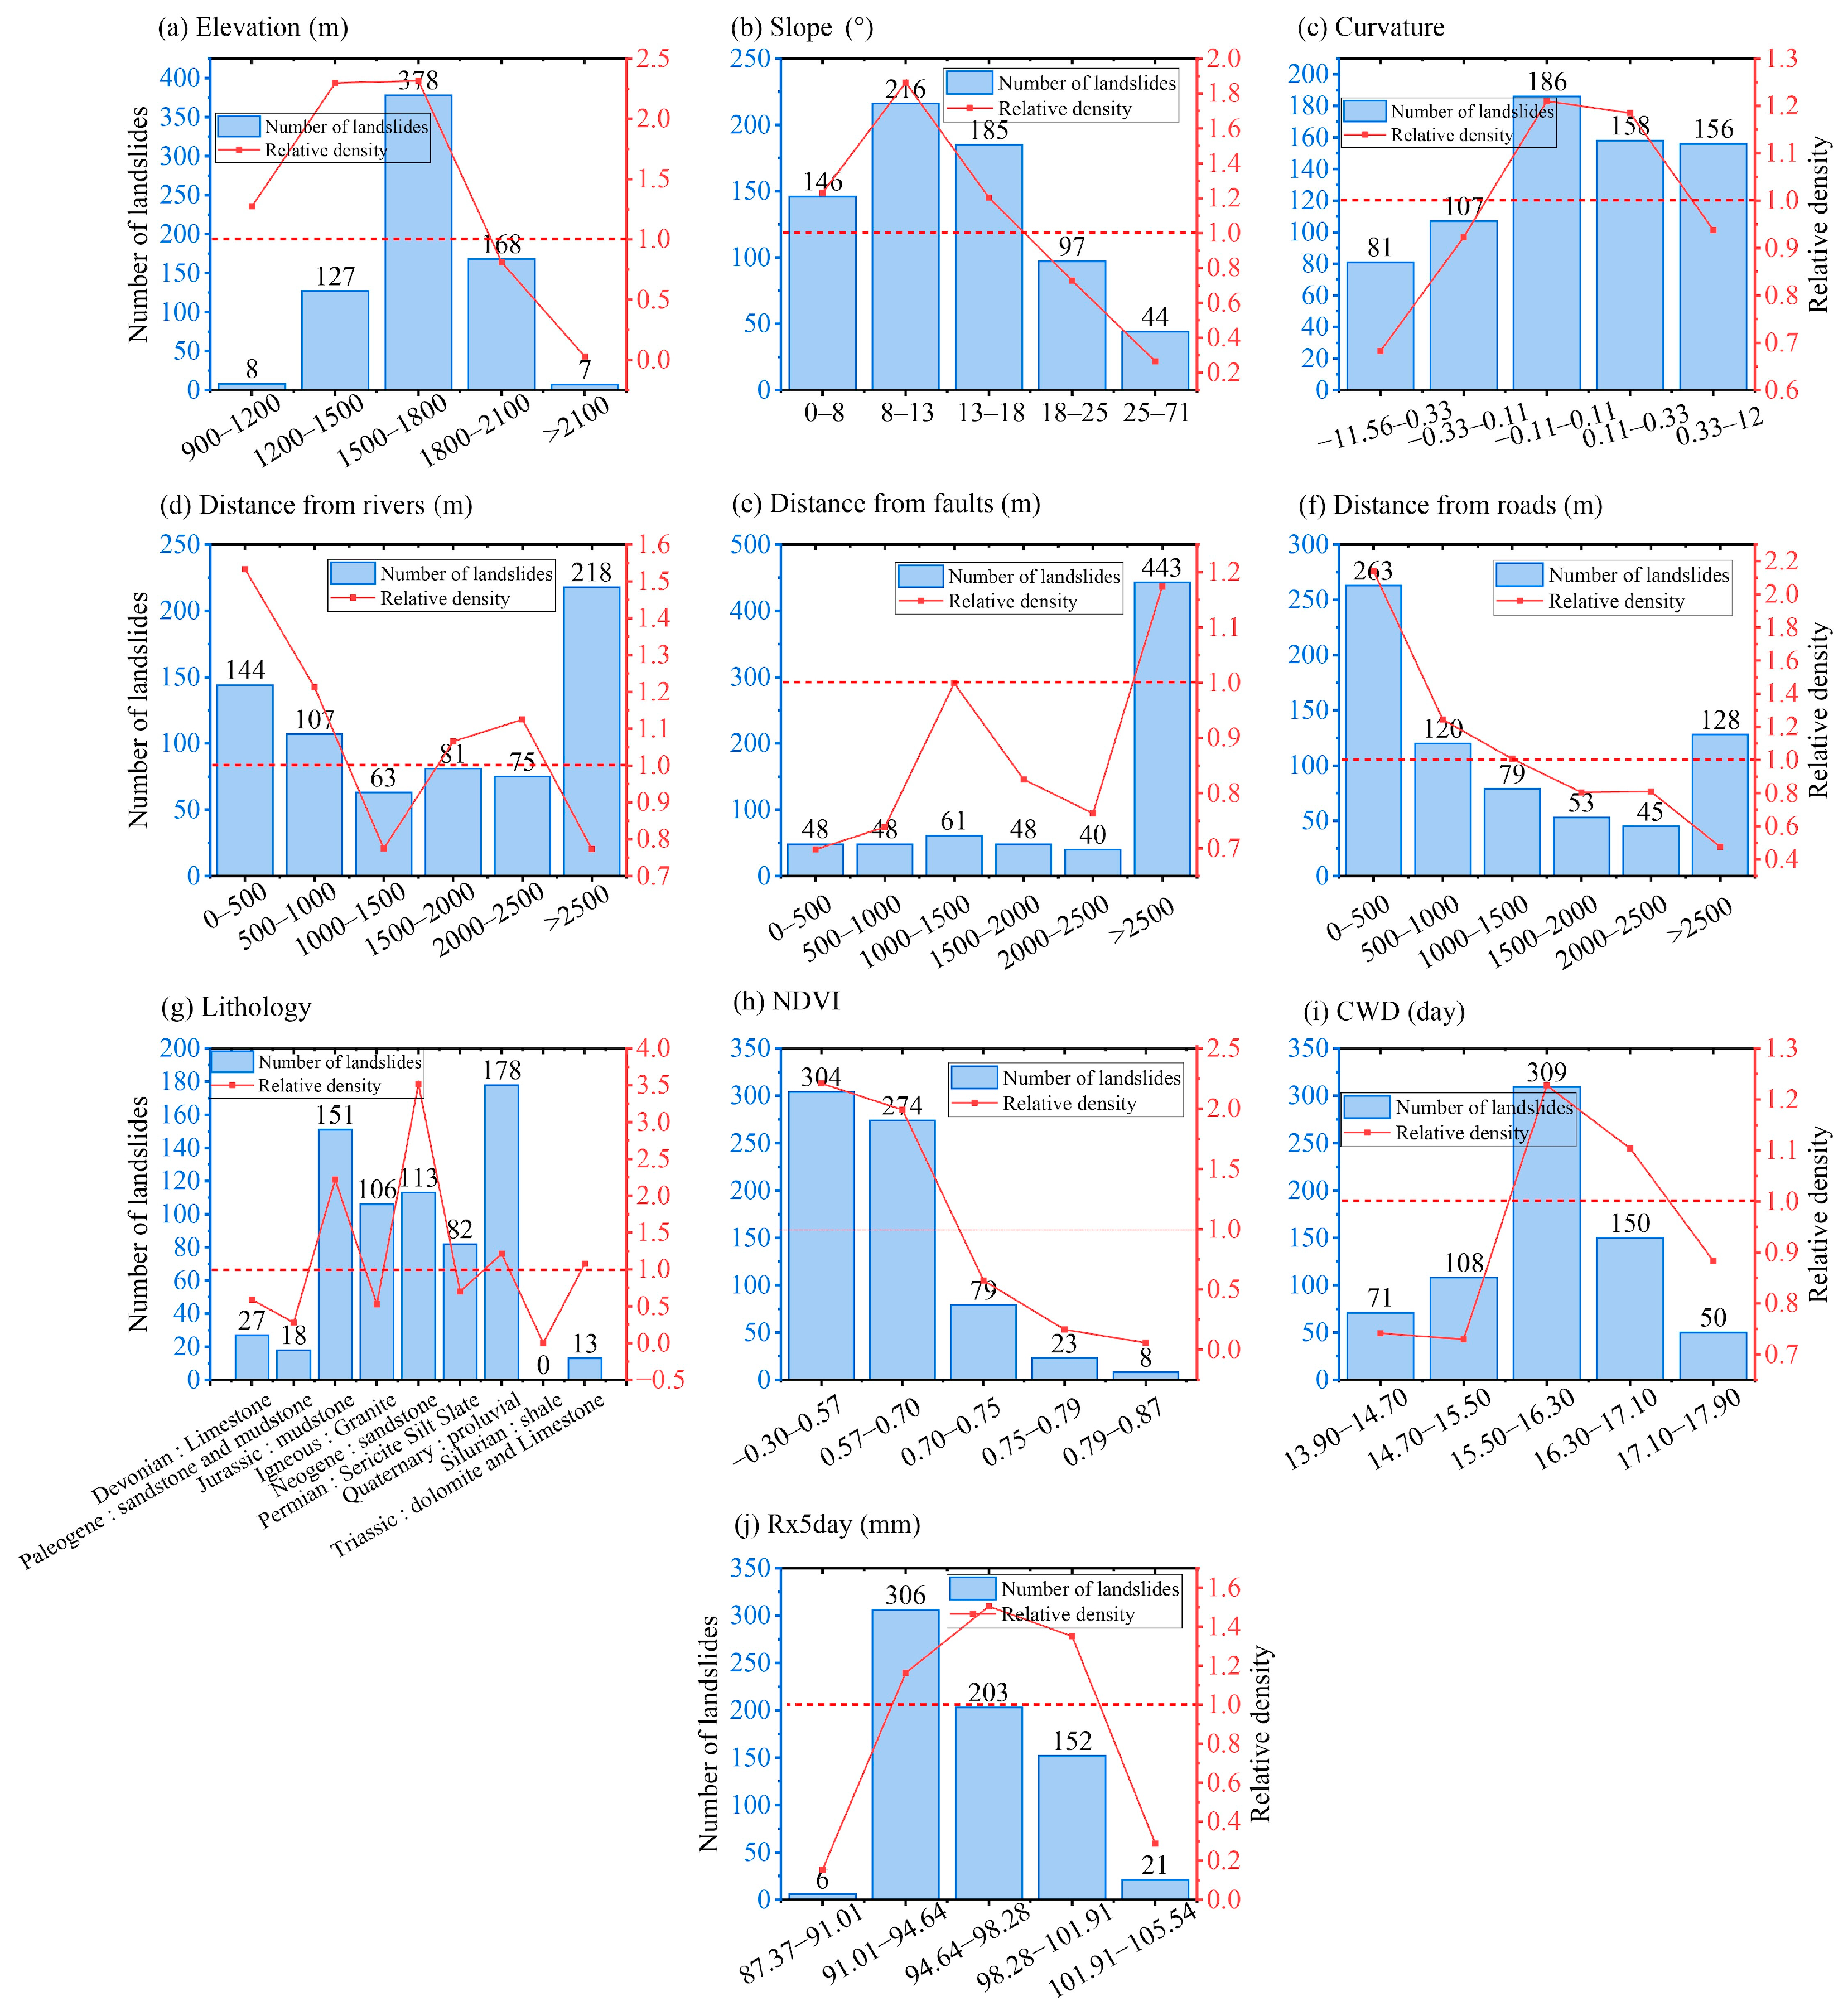
The spatial distribution of landslide disasters in Tengchong demonstrates distinct regional clustering, with pronounced concentrations in the eastern and southern sectors. Notably, a high-density cluster emerges along the 25° N latitudinal zone in the eastern region. Visually, landslide disasters are clearly concentrated in areas near rivers and roads, with weak spatial correlations with other environmental factors (Figure 5). Statistical analysis was conducted to investigate the correlations between landslides and the susceptibility factors. It should be noted that slope, curvature, NDVI, CWDs, and Rx5day do not have explicit integer threshold breakpoints. Therefore, the use of quintile processing by the number of effective grids was considered. Recorded landslides are mainly concentrated in the range of 1500 m to 1800 m above sea level (Figure 6a) and in areas with gentle slopes (Figure 6b), likely due to generally gentle topography in the region. They also tend to occur where curvature is near zero, with a higher likelihood on convex (positive curvature) slopes (Figure 6c). Landslides are concentrated near roads and rivers, while the influence of fault distance is less pronounced (Figure 6d–f). It suggests a more important role of hydrological condition and human activities on landslides. In addition, landslides are concentrated in the area with Quaternary alluvial deposits and Neogene sandstones. Tengchong has a high vegetation cover, while the landslides are concentrated in the middle and low NDVI areas (Figure 6h). In particular, both the number and relative density of landslides decrease as NDVI increases. Lastly, landslides are more likely to occur during extreme rainfall when the CWDs are longer than 15.5 days and the Rx5day ranges from 91 mm to 102 mm (Figure 6i,j).
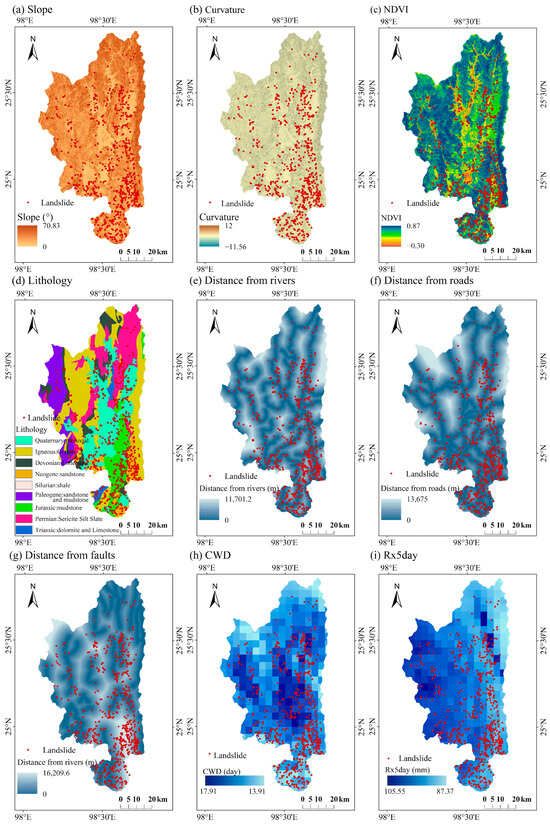
Figure 5.
The spatial distribution of influencing factors and the recorded landslides.
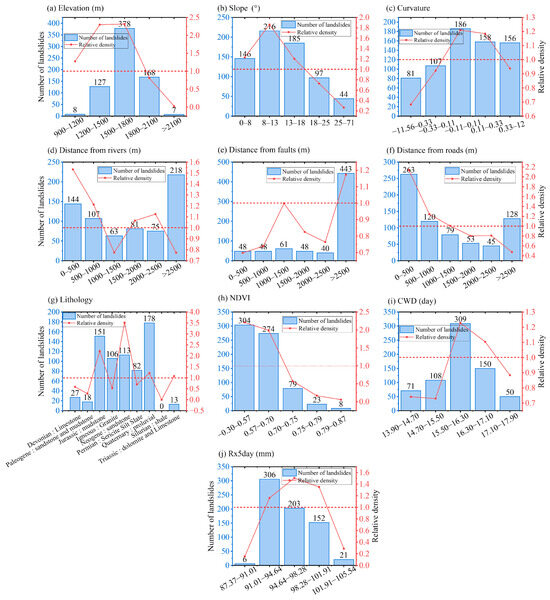
Figure 6.
Number and relative density of landslides in each predictor bin. The bar graph indicates the number of landslides in each classification, and the line graph denotes the relative density. The relative density is defined as the ratio of the landslide point proportion in a classification to the area proportion of that classification within the study region. A relative density greater than one, denoted by the dotted lines in the figures, indicates that landslides are concentrated in that classification.
3.2. Assessment of Landslide Susceptibility
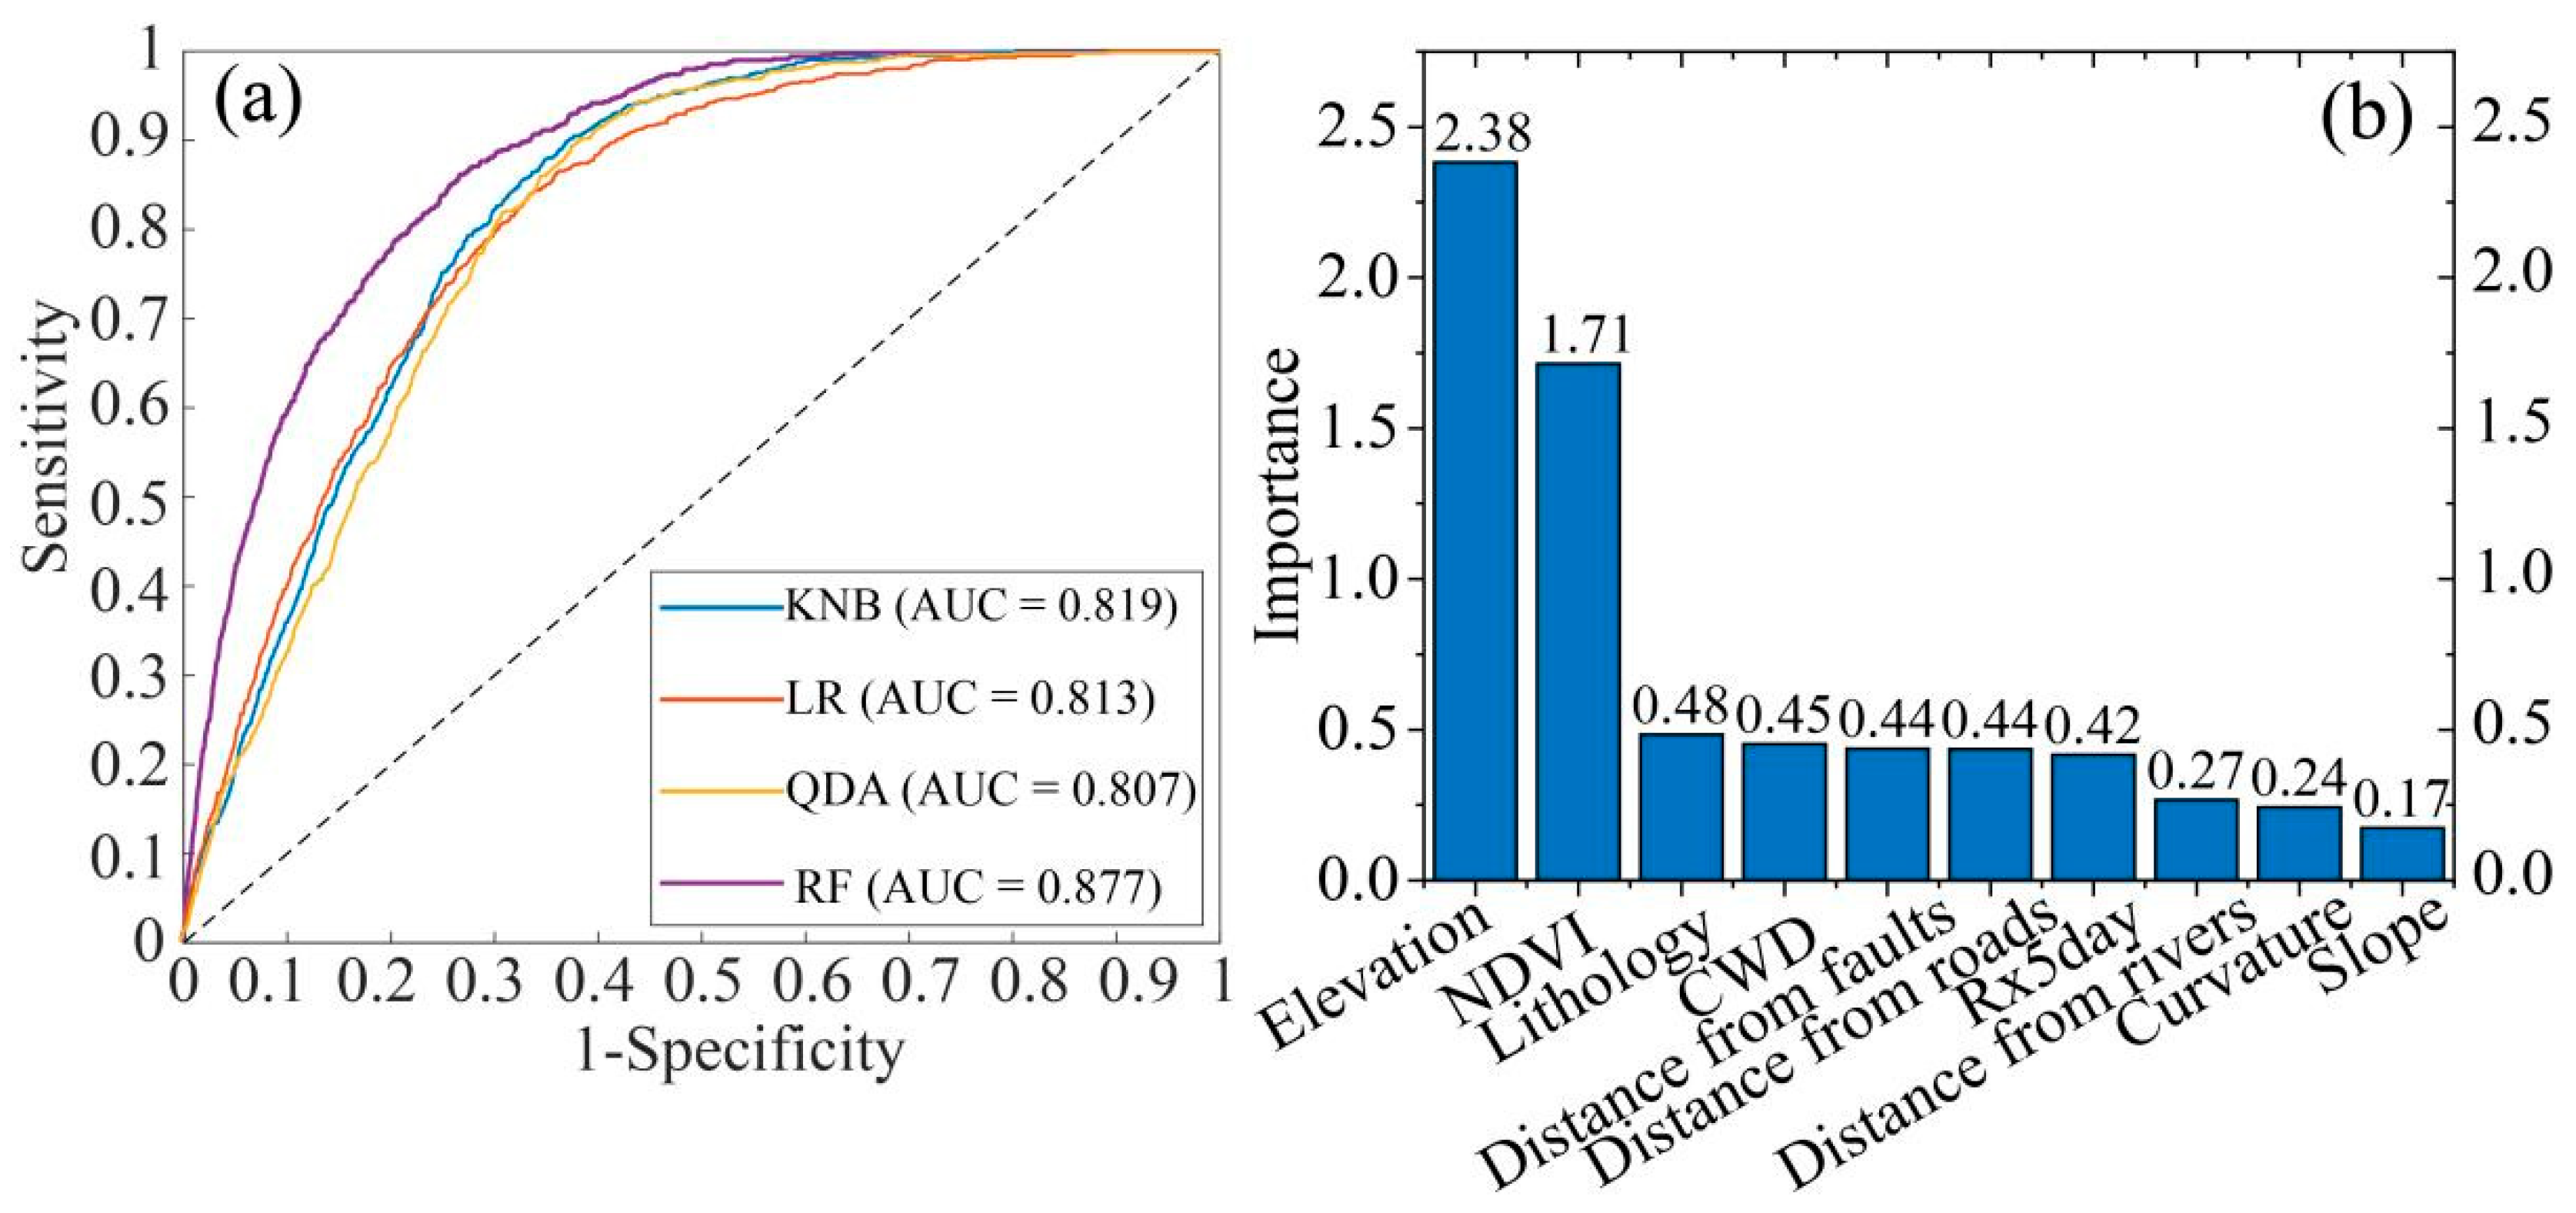
Four machine-learning models were trained to assess landslide susceptibility for Tengchong with recorded landslides and ten predictors. The receiver operating characteristic (ROC) curve is a graphical representation of the diagnostic ability of a binary classifier system as its discrimination threshold is varied, plotting the true positive rate (TPR) against the false positive rate (FPR). The area under the ROC curve (AUC) quantifies the model’s discriminative power across all possible classification thresholds, with values ranging from 0.5 (random guessing) to 1.0 (perfect discrimination). For the four models, RF, LR, QDA, and KNB, the AUC values are 0.877, 0.813, 0.807, and 0.819, with the RF model demonstrating superior performance (Figure 7a). Confusion matrix calculations for the four models indicate that the Random Forest model exhibits the highest number of correctly predicted grid cells for both landslide and non-landslide categories (Table 4). This model is the most effective. The RF model further ranks the importance of each factor and shows that elevation and NDVI have the greatest influence on landslide occurrence, followed by lithology and the extreme rainfall indicator CWDs (Figure 7b). This indicates that landslides are not only strongly correlated with terrain and geological background but also closely linked to vegetation and climatic conditions.
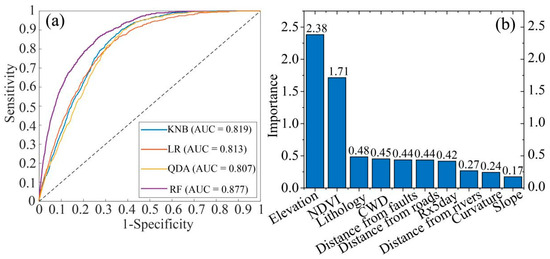
Figure 7.
The ROC curves of four models and the importance score of the ten predictors from the RF model. (a) ROC curves of all models. The AUC (Area Under the Curve) value reflects model performance, with higher values indicating better predictive accuracy. The ROC curve shows the trade-off between the rate of correctly predicted landslides (Sensitivity) and the rate of falsely predicting landslides where none occurred (1-Specificity). (b) The importance score assigned by the Random Forest (RF) model represents the relative contribution of each factor to landslide susceptibility assessment. A higher value indicates a greater influence of the corresponding factor on landslide occurrence.

Table 4.
Confusion matrix of the four models. 0 indicates non-landslide points, 1 indicates landslide points, 0-0 indicates correct prediction of non-landslide points, 0-1 indicates incorrect prediction of non-landslide points, 1-0 indicates incorrect prediction of landslide points, and 1-1 indicates correct prediction of landslide points.
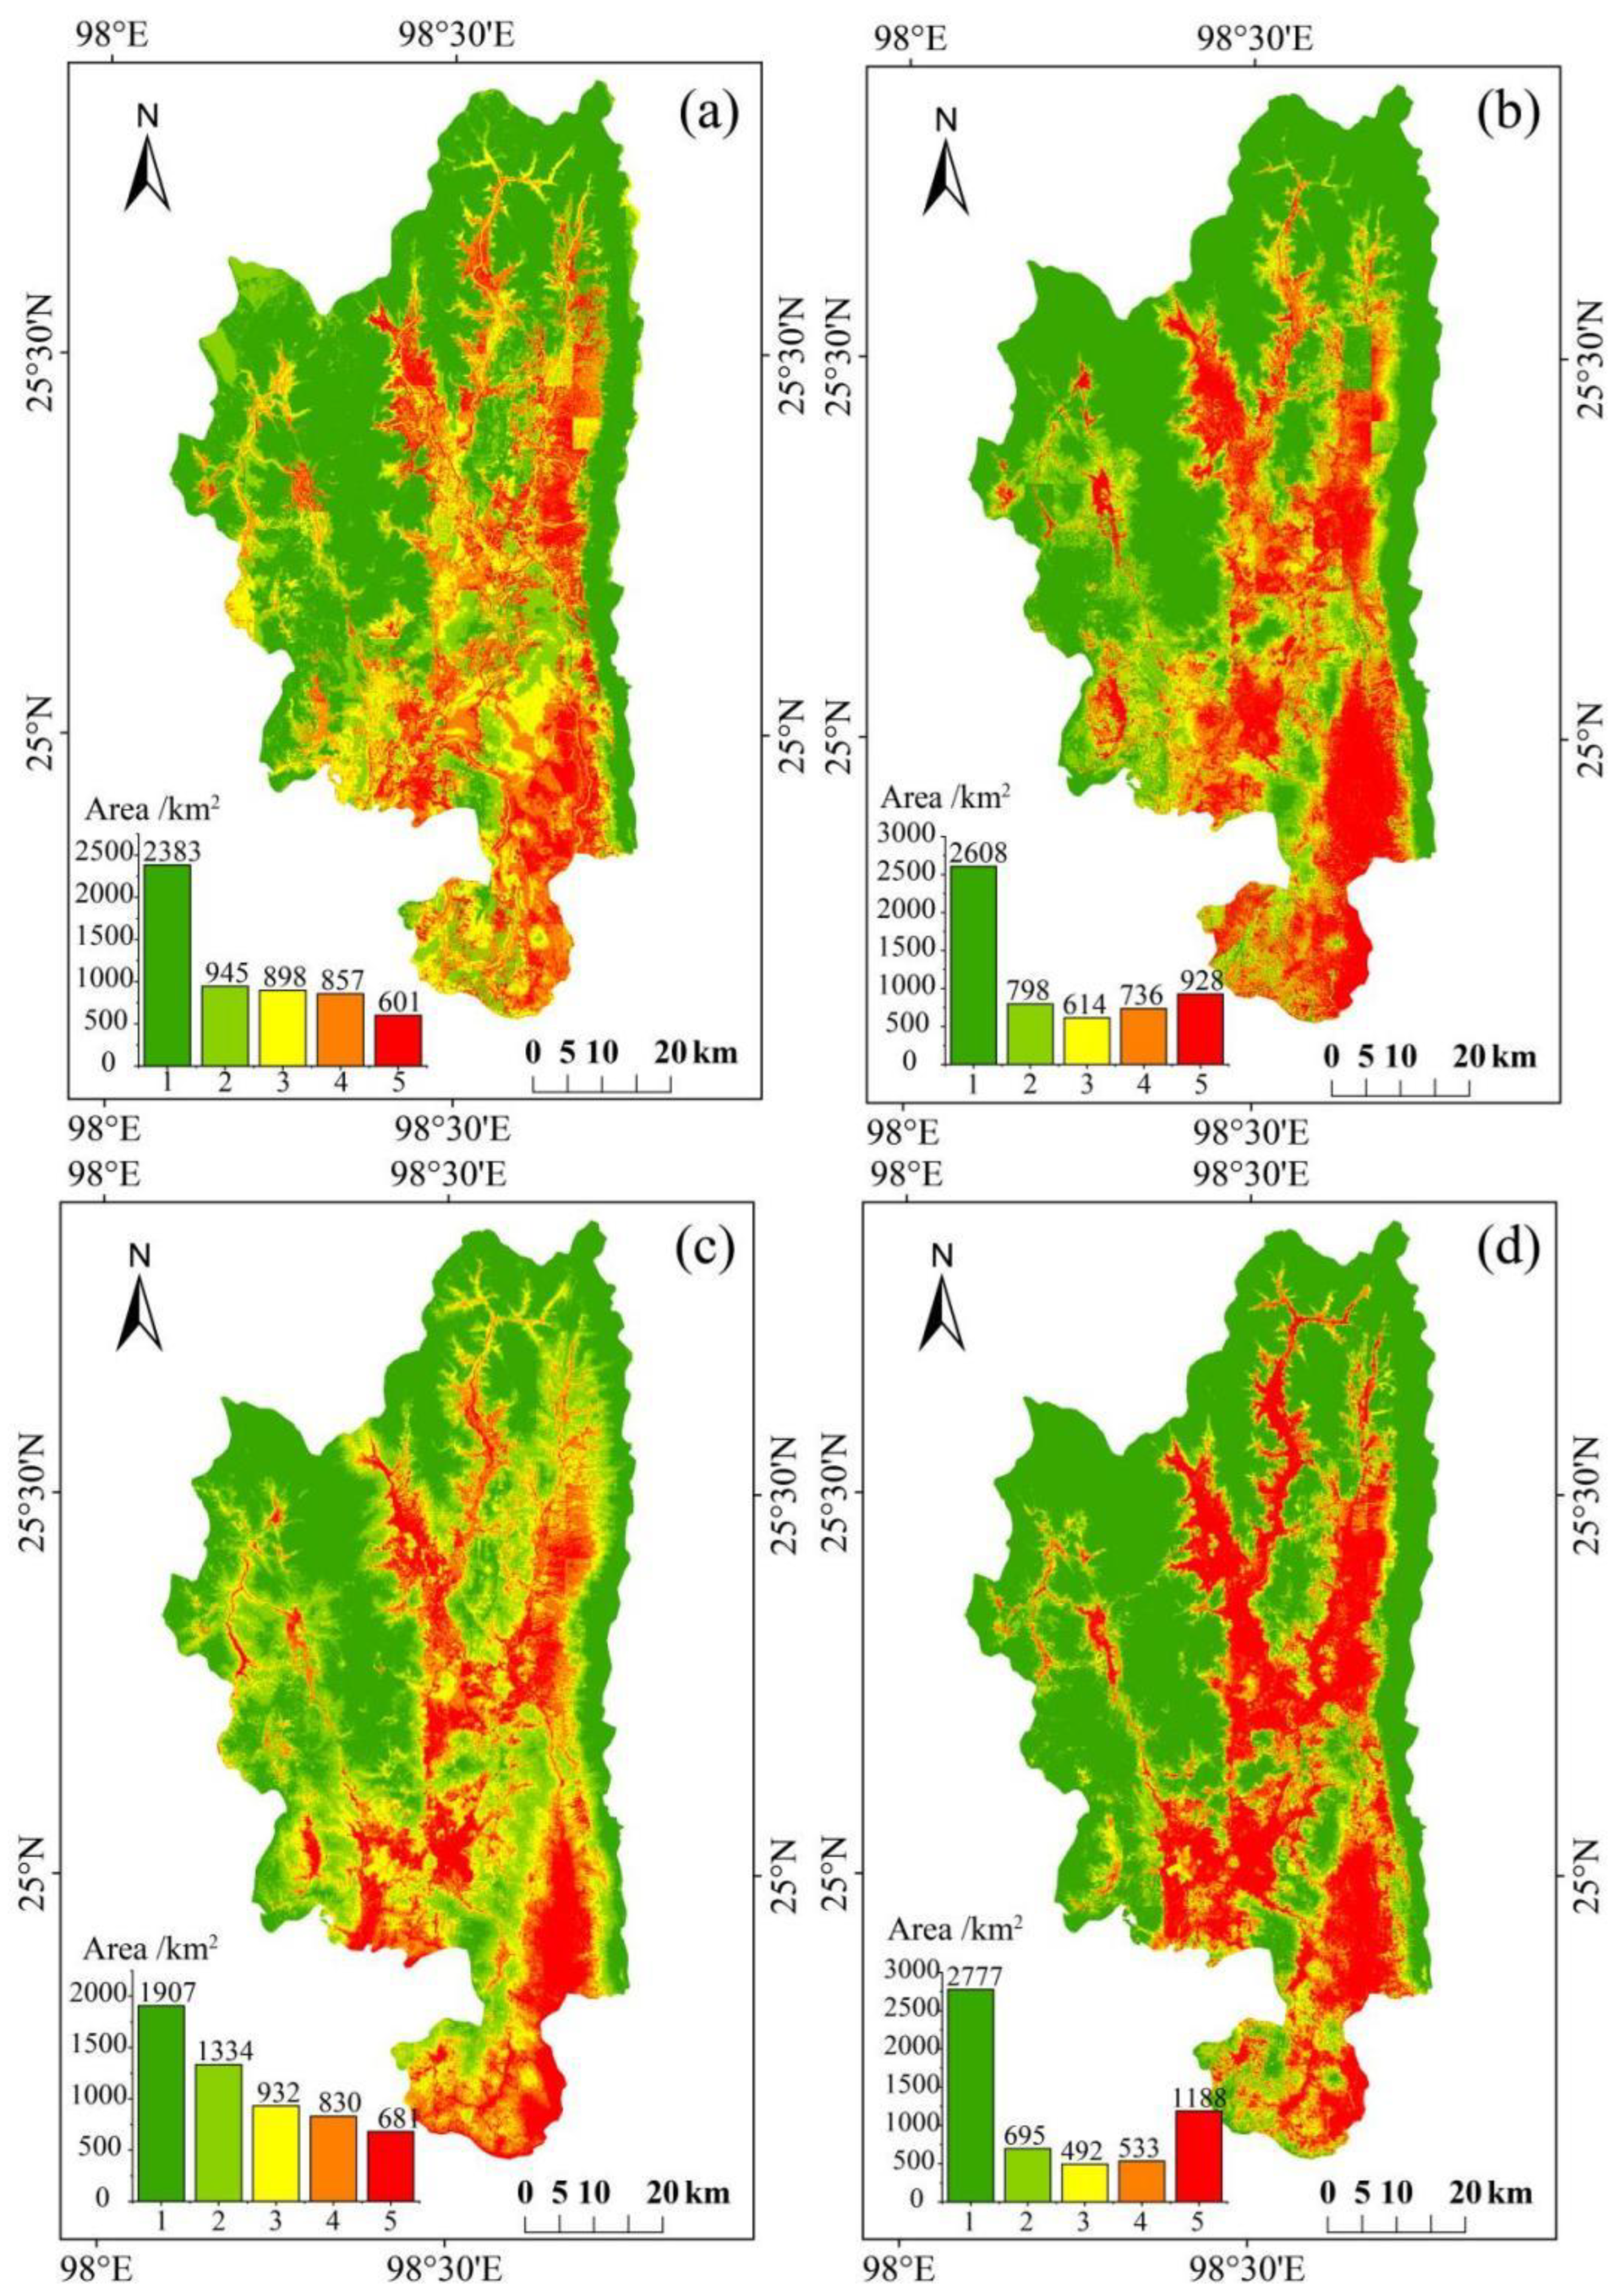
The landslide susceptibility maps obtained from the four models are classified into five categories using Natural Breaks Classification, and the area of each susceptibility zone is determined (Figure 8). The RF model has a smaller percentage of very high susceptibility zones, indicating a higher accuracy in identified high-susceptibility areas. For regions with NDVI higher than 0.57, the areas with high or very high landslide susceptibility account for 62%. Most regions close to rivers or roads (<500 m) are also threatened by high or very high susceptibility.
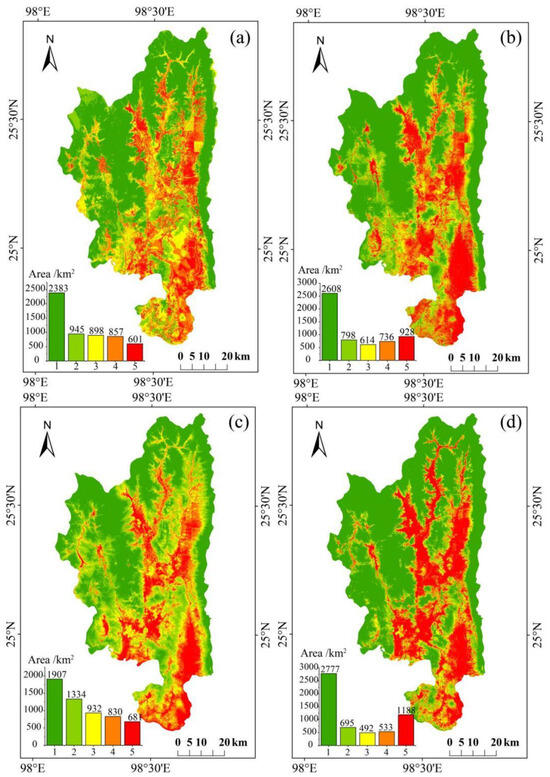
Figure 8.
Landslide susceptibility maps generated by: (a) RF; (b) QDA; (c) LR; and (d) KNB. Classification thresholds were determined using the natural breaks method. The core of the natural breakpoint method involves grouping data. This is completed in order to minimize differences within and maximize differences between groups. The horizontal axis indicates susceptibility levels: 1 (very low), 2 (low), 3 (medium), 4 (high), and 5 (very high). The larger the value, the greater the susceptibility. The bar chart shows the total area of the partition. The smaller the high-risk area, the more advantageous the model is at identifying it.
The lithology statistics reveal that the Quaternary stratigraphy in Tengchong has a wide distribution and is the primary zone for high or very high landslide susceptibility. The high susceptibility area accounts for 51.3% of the total area in the region. In addition, although the Neogene stratigraphy covers a small area, the distribution of landslide susceptibility shows a clear centralization trend, with high and very high susceptibility occupying 74.9% of the area (Table 5). Collectively, we identified that areas with high landslide susceptibility are primarily associated with zones of low vegetation cover, alluvial deposits, or Neogene sandstone and are also in close proximity to rivers or roads.

Table 5.
Statistics of landslide susceptibility for different ranges of NDVI, river distance, road distance, and lithology.
3.3. Assessment of Landslide Risk
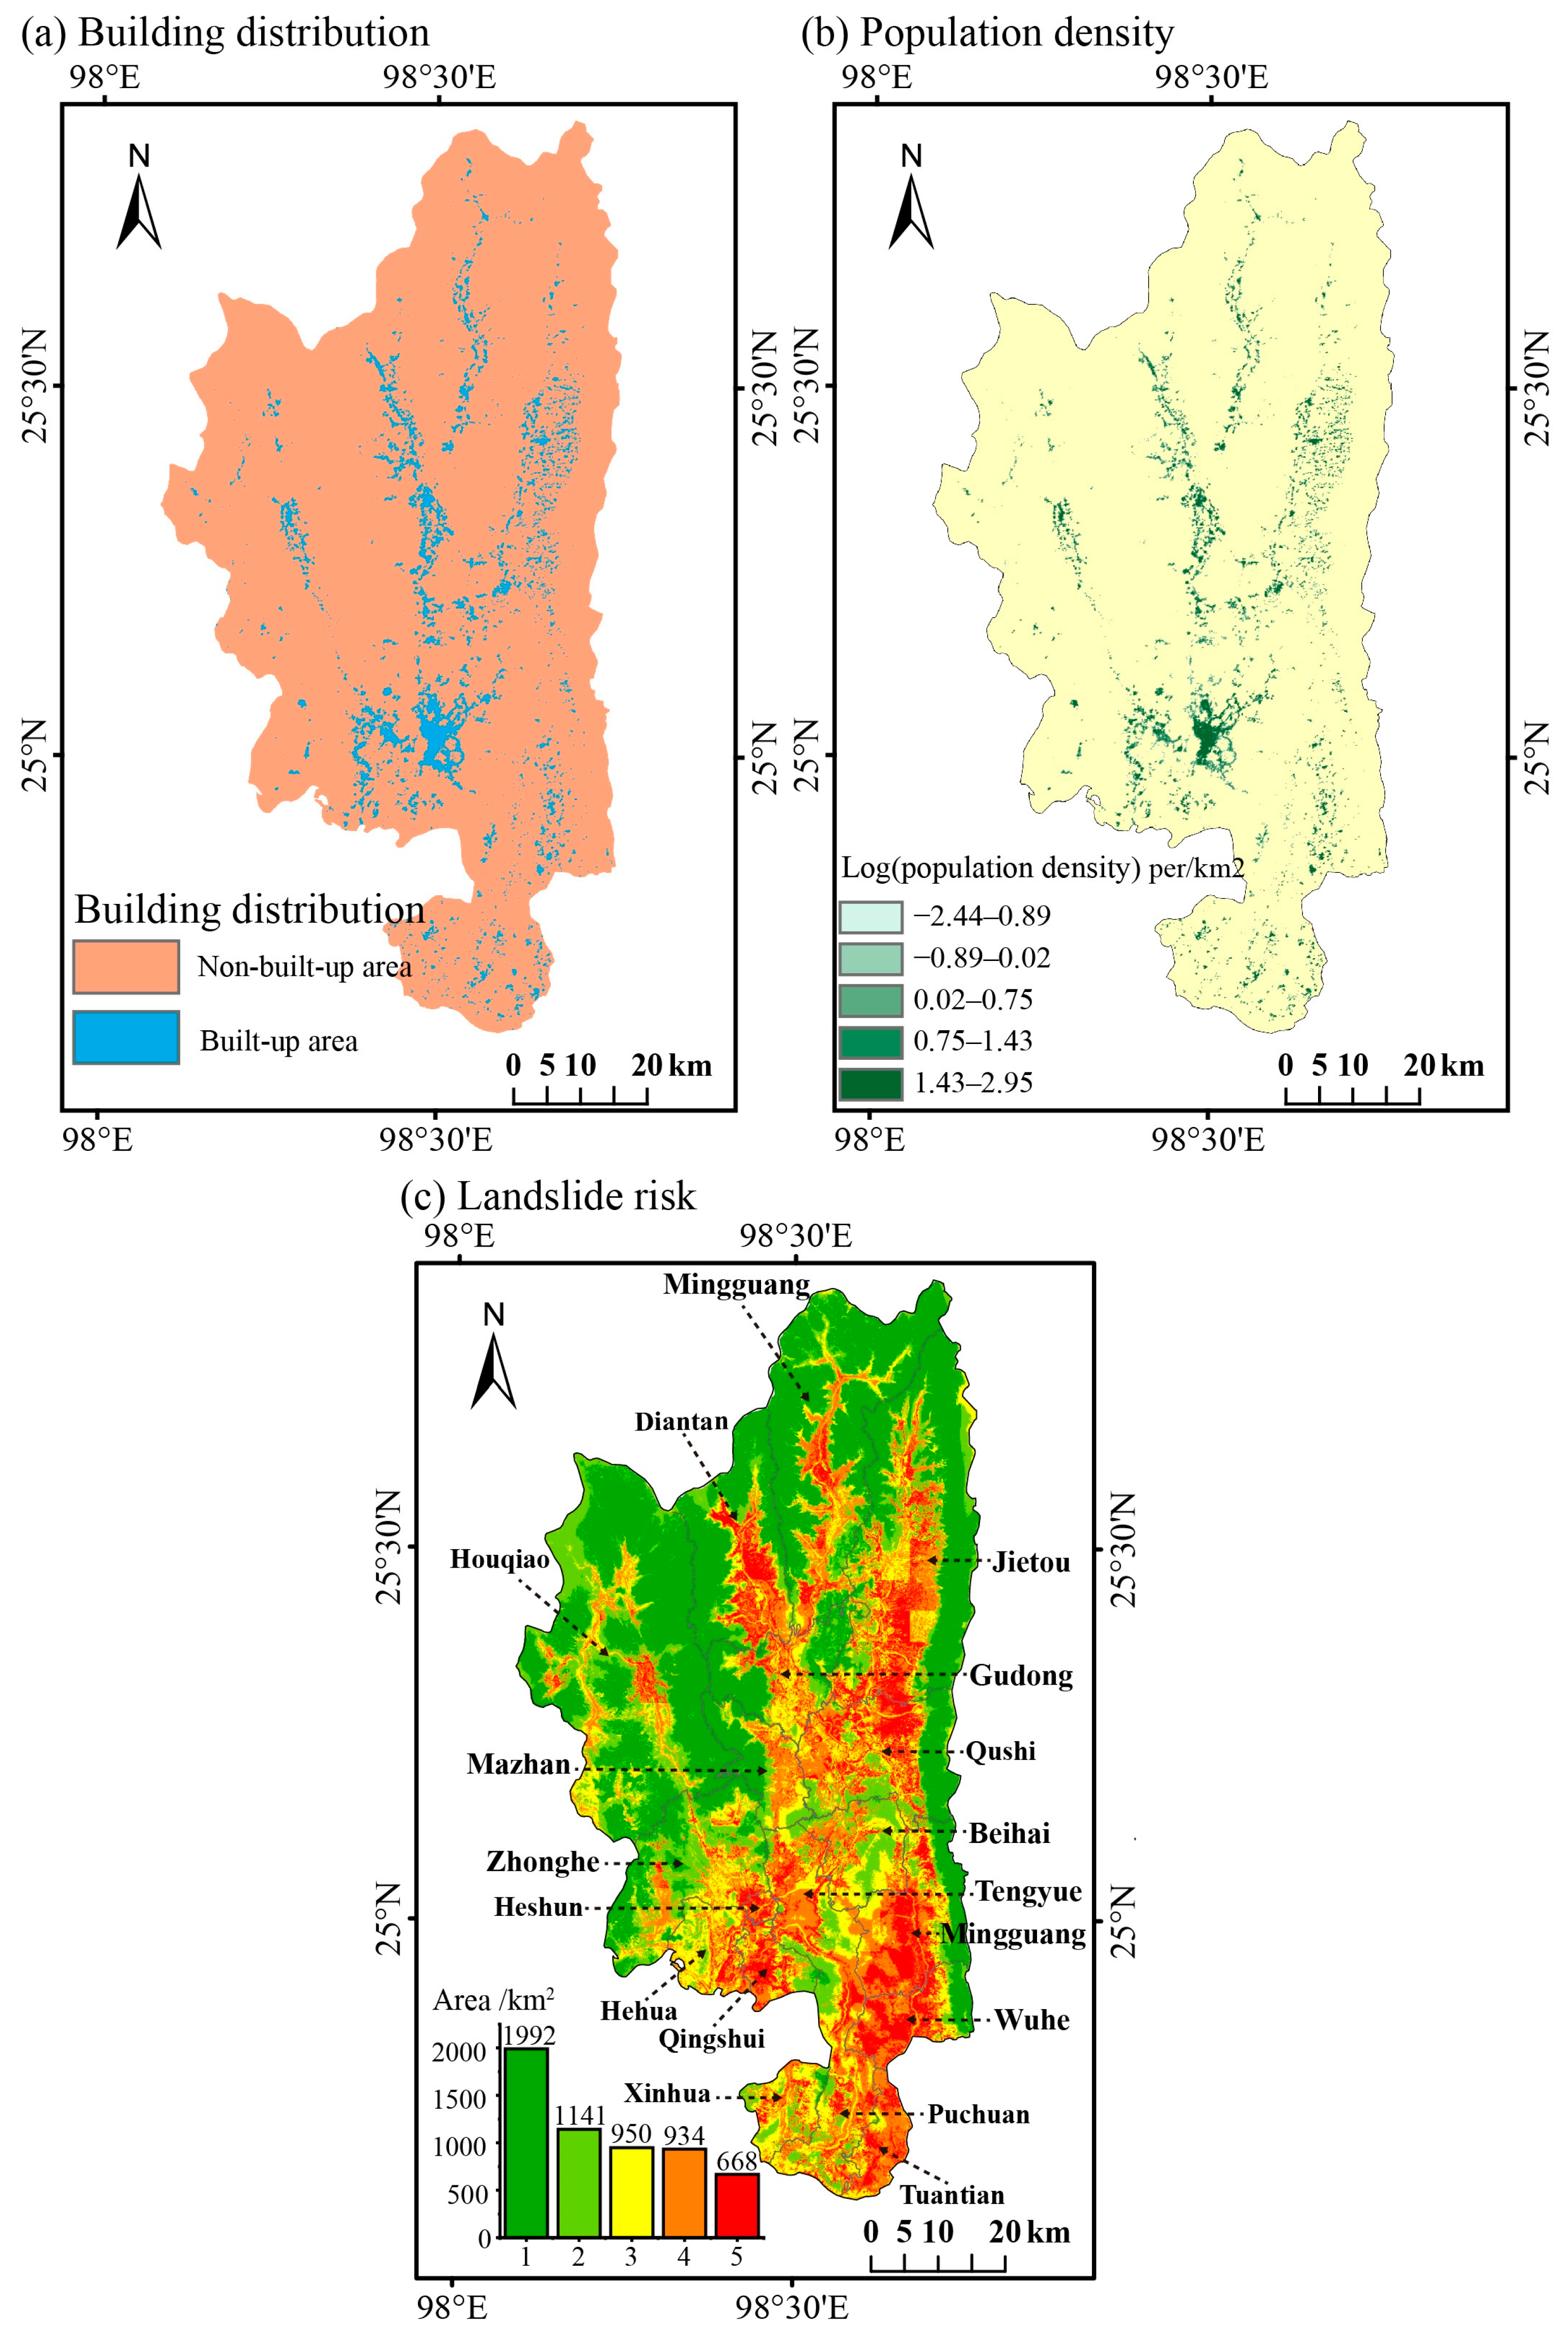
By integrating Tengchong’s landslide susceptibility with socio-economic factors (e.g., distance to buildings, population density, distance to roads) along with the judgment matrix in Table 6, we computed the CR to be 0.019. Since this value is less than 0.1, it indicates that the landslide risk distribution map for Tengchong is successfully derived based on the calculated weights after feasibility testing. The population density is highly consistent with the construction area (Figure 9a,b). The weights for each layer obtained from the relative importance matrix and the AHP are listed in Table 6. With the weights obtained from Table 6, the landslide susceptibility, population density, distance to roads, and distance to buildings layers were multiplied by their corresponding weights, thereby producing the landslide risk layer.

Table 6.
Relative importance matrix and weight of AHP for landslide risk assessment.
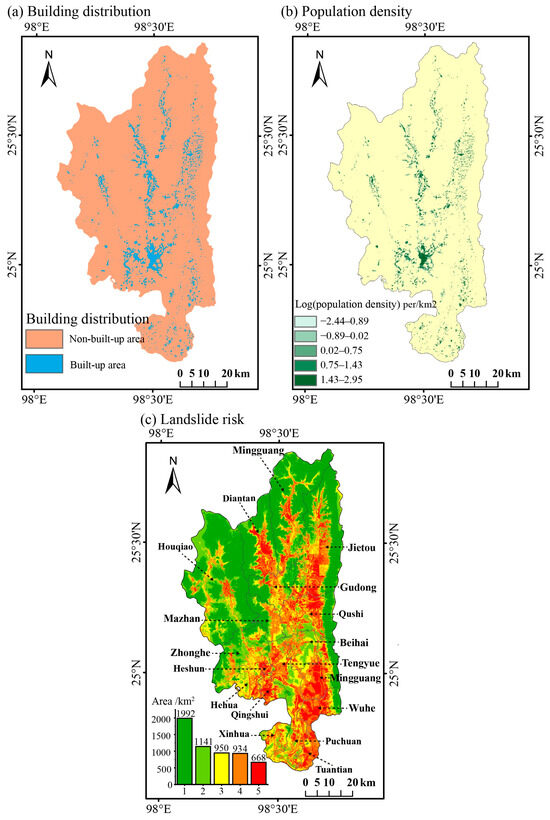
Figure 9.
Distribution of population density and building areas resulted in landslide risk. (a) Building distribution shows the built-up and the non-built-up areas. (b) the logarithm of the population density. (c) Landslide risk based on RF and AHP assessment. Landslide risk classification methodology is consistent with landslide susceptibility classification methodology. The horizontal axis indicates risk levels: 1 (very low), 2 (low), 3 (medium), 4 (high), and 5 (very high). The larger the value, the greater the risk.
The spatial distribution of landslide risk shows a negative correlation with area size, such that higher risk levels concentrate in progressively smaller zones (Figure 9c). Area, population, landslide count and density, and simulated landslide susceptibility and risk are averaged for every township (Table 7). The results indicate that the mean values of landslide susceptibility and risk are highest in Heshun, Tuantian, Wuhe, and Qingshui townships, whereas Houqiao, Mingguang, Zhonghe, and Mazhan townships exhibit relatively lower susceptibility and risk. Our simulation is in line with the number of recorded landslides per unit area. In detail, ~0.32 landslide per km2 is observed for the four cities with the highest susceptibility, while ~0.04 landslide per km2 is observed for the four cities with the lowest susceptibility. The Heshun township has a very high population density and landslide susceptibility, which collectively make it have the highest risk. Therefore, it is concluded that Heshun and Tuantian townships face a more severe threat from landslides, necessitating the enhancement of landslide early-warning mechanisms in these areas.

Table 7.
Area, population density, landslide count and density, and simulated landslide susceptibility and risk for every township.
4. Discussion
Geospatial analysis using machine learning models (e.g., Random Forest) demonstrates that the relative importance of key drivers (slope angle, curvature, land cover) exhibits spatially differentiated patterns across study regions, as revealed by permutation feature importance metrics [11,12,18,60]. For Tengchong, elevation, NDVI, lithology, and CWDs are the most critical factors for landslide assessment (Figure 7a). It is evident that these factors, which represent topographic, land surface, lithological, and climatic dimensions, respectively, underscore the multifaceted nature of landslide susceptibility. This highlights that such geological hazards are governed by complex interactions among diverse environmental variables.
Topography is usually the primary factor controlling landslides. Landslide occurrence declines with increasing altitude as colluvial deposits become thinner in mountainous areas [61,62,63]. Our results support this idea that landslides are concentrated in lowland regions of Tengchong with elevation less than 1800 m (Figure 6a). Theoretically, slope is also among the most critical factors, with a strong correlation existing between slope angle and landslide susceptibility [18]. However, this characteristic seems less pronounced in Tengchong, where landslides are more concentrated in low-slope areas (Figure 6b). Moreover, in the RF model, the slope factor demonstrates less prominence in susceptibility assessments, ranking last among all evaluated factors. The generally low slope gradient (<25°) in Tengchong might lead to this weaker impact on landslides.
Areas with denser vegetation are usually less susceptible to landslides and vice versa [64]. This aligns with our findings in this study that landslides in Tengchong are more concentrated in vegetation sparse areas with NDVI values below 0.57 (Figure 5h). As vegetation cover increases, the relative density of landslides decreases. Vegetation has a unique soil-stabilizing effect. Therefore, when vegetation is sparse, looser soils can provide essential land surface material conditions for landslides. Vegetation in southwestern China has been increasing due to the CO2 fertilization effect and land-use management [65]. As such, we expect that vegetation restoration may reduce landslide risk to some extent in Tengchong.
Human activities in this assessment are mainly reflected in the distance from roads. Landslides in Tengchong are relatively concentrated within 500 m of roads (Figure 6f; Table 5). On the one hand, owing to Tengchong’s average elevation at approximately 2 km and its rugged hilly-mountainous terrain, the accumulation of rock and soil materials during road construction, coupled with excavation activities, compromises the stability of the original rock or soil mass. This process is also seen in the Loess Plateau [42]. On the other hand, during the operational phase, dynamic loads and vibrations exerted by road traffic further induce stress on the surrounding geotechnical medium.
Landslides in Tengchong are concentrated in areas where the rock strata consist of Neogene sandstone and Quaternary alluvial deposits. Whether it is sandstone or alluvial deposits, the mechanism for landslide occurrence in these regions mainly lies in the instability of the rock-soil structure and high permeability [7]. These characteristics make the areas with sandstone and alluvial deposits highly susceptible to disturbance and prone to landslides. The distance from faults is not significantly correlated with landslides in Tengchong. First, we infer most of the landslides in Tengchong may not have been triggered by fault activity, or that the existing faults have not shown significant movement in recent years. Second, the fault structure data are not detailed enough, or other variables reflecting tectonic activity should be proposed. Third, the current landslide survey may exhibit spatial sampling bias in that more landslides threatening human populations have been documented, whereas those in remote mountainous regions have been overlooked. It may partially explain why recorded landslides are closer to roads/rivers than to faults (Figure 6e).
Globally, regional studies are necessary because landslides are sensitive to different factors in different regions. In southern Colombia, where the climate is similar to that of Tengchong, researchers used RF to evaluate landslide susceptibility. They found that elevation and soil silt content had the most significant impact, consistent with our results [66]. In this study, we found that landslides are concentrated in low-elevation areas, whereas in Sikkim Himalaya, India, at the same latitude, landslides are more likely to occur in high-elevation regions [67]. This may be because, in India, the monsoon winds encounter the Himalayas and are forced upwards by the terrain, generating significant rainfall and triggering landslides. In another region of Yunnan, researchers found that among their 12 evaluation factors, slope has the highest importance, making it the most significant controlling factor for landslides in Yulong County [68]. Their result is different from that of our study; highly undulating terrain (more than 4000 m) may be the reason, according to the elevation map they showed. These comparisons reveal that although certain controlling factors (e.g., elevation) are universally important, the landslide-environment relationship is highly region-specific. This relationship is primarily shaped by unique local geological and climatic conditions.
There are some uncertainties and implications that should be noted for future studies. First, the current landslide survey may be subject to spatial sampling bias. The dataset primarily documents landslides that pose a threat to human populations, which may lead to the omission of events in remote mountainous regions. This oversight may explain why distance from faults—a key geological factor—exhibits a weak correlation with landslide locations (Figure 6e), especially given Tengchong’s high frequency of geological activity. Additionally, the observed tendency of landslides to occur in low-slope areas (Figure 6b) is likely attributed to this same sampling bias. Second, as the study area is relatively small, variables may have spatial autocorrelation. It may therefore inflate accuracy metrics because nearby pixels share similar environmental conditions. For the extreme rainfall indicator, although the results showed their importance in landslide susceptibility assessment, their minimal variation may affect the accuracy of their impact. Third, future research could integrate field survey data with InSAR data to achieve more precise landslide identification, thereby addressing the temporal constraints of remote sensing data and the spatial coverage limitations of field surveys. Finally, the occurrence of landslides is influenced by a variety of factors that interact with each other in a complex way. Machine learning techniques may capture these complex interactions but are difficult to explain. Sensitivity analysis of factors should be implemented to diagnose the landslide susceptibility.
5. Conclusions
This study presents a comprehensive assessment of landslide susceptibility and risk in Tengchong of southwest China by integrating multi-source influencing factors and using four machine learning algorithms and the AHP. The RF model demonstrates the highest predictive reliability (AUC = 0.88), enabling the identification of highly susceptible zones. Notably, the analysis identifies elevation as the primary controlling factor, followed by NDVI, lithology, and CWDs, underscoring the critical roles of vegetation cover and precipitation patterns in modulating landslide susceptibility. Empirical results show that landslides predominantly occur in areas with low NDVI values (<0.57), suggesting that enhanced vegetation coverage may mitigate landslide hazards. Spatial distribution analysis reveals that high-susceptibility zones are concentrated within 500 m of river networks and road infrastructures, as well as in regions underlain by alluvial deposits or Neogene sandstone formations. The integrated risk map, developed by fusing machine learning predictions with AHP-based socio-economic analysis, pinpoints Heshun and Tuantian townships as high-risk hotspots. These findings provide a scientific basis for hierarchical disaster management and emergency resource optimization in Tengchong and also offer a typical case for the risk assessment framework in global mountainous areas prone to landslides.
Author Contributions
Conceptualization, W.C.; Data curation, C.L., Z.Q., K.Y., S.Z., L.Y., Y.G., Z.Z. and Q.G.; Formal analysis, C.L.; Funding acquisition, C.L. and W.C.; Investigation, W.C.; Methodology, W.C. and J.L.; Visualization, Z.Q. and K.Y.; Writing—original draft, C.L., Z.Q. and W.C.; Writing—review and editing, C.L., Z.Q., W.C., J.L., S.Z., L.Y., Y.G., Z.Z. and Q.G. All authors have read and agreed to the published version of the manuscript.
Funding
This study was supported by the National Natural Science Foundation of China (No. 42307556) and the China Geological Survey (DD20230101205).
Data Availability Statement
We thank the Geospatial Data Cloud Platform (http://www.gscloud.cn), the United States Geological Survey (USGS, https://www.usgs.gov), the Geoscientific Data and Discovery Publishing System (https://www.ngac.cn), the National Catalogue Service for Geographic Information (www.webmap.cn), GHSL (Global Human Settlement Layer, https://human-settlement.emergency.copernicus.eu), and Jielin Zhang for making their data freely accessible. The original contributions presented in this study are included in the article. Further inquiries can be directed to the corresponding author.
Conflicts of Interest
The authors declare that they have no known competing financial interests or personal relationships that could have appeared to influence the work reported in this paper.
References
- Das, I.; Stein, A.; Kerle, N.; Dadhwal, V.K. Landslide susceptibility mapping along road corridors in the Indian Himalayas using Bayesian logistic regression models. Geomorphology 2012, 179, 116–125. [Google Scholar] [CrossRef]
- Drid, I.; Achour, Y.; Zighmi, K.; Nouioua, T.; Khababa, O.; Rahmani, S.; Ouadfel, O.; Atoui, B. Designing gully erosion susceptibility maps (GESM) in the Algerian Eastern Tell: A case study of the K’sob River watershed. Arab. J. Geosci. 2022, 15, 1264. [Google Scholar] [CrossRef]
- Niu, C.; Zhang, H.; Liu, W.; Li, R.; Hu, T. Using a fully polarimetric SAR to detect landslide in complex surroundings: Case study of 2015 Shenzhen landslide. ISPRS J. Photogramm. Remote Sens. 2021, 174, 56–67. [Google Scholar] [CrossRef]
- Ministry of Natural Resources of the People’s Republic of China. 2024 China Natural Resources Bulletin. Available online: https://gi.mnr.gov.cn/202503/t20250314_2881937.html (accessed on 19 March 2025).
- Yunnan Provincial Department of Emergency Management. Disaster Situation in Yunnan Province in 2024. Available online: https://yjglt.yn.gov.cn/html/2025/tjfx_0110/4029810.html (accessed on 21 March 2025).
- Gui, Y.; Wang, J.; Li, X. A Novel Deep Learning Model for Landslide Susceptibility Mapping. Remote Sens. 2024, 16, 1234. [Google Scholar]
- Song, M.; Zhang, W.; Zou, Y.; Chen, J. Numerical Simulation of Uniaxial Compressive Strength and Failure Characteristics of Non-Uniform Water-Bearing Sandstone. Materials 2023, 16, 6396. [Google Scholar] [CrossRef] [PubMed]
- Wang, M.; Zhou, X.; Wu, Y.; Zhuo, L.; Xu, H.; Liu, Y. Hydrogeochemistry of trace elements in geothermal waters from the Rehai geothermal system in Yunnan of China, a magma-indirectly related geothermal system. Geothermics 2024, 124, 103134. [Google Scholar] [CrossRef]
- Li, C.; Liu, Y.; Lai, S.; Wang, D.; Ho, X.; Liu, Q. Landslide susceptibility analysis based on the coupling model of logistic regression and support vector machine. J. Nat. Disasters 2024, 33, 75–86. [Google Scholar]
- Xu, W.; Yang, H.; Zhang, J.; Zhou, H.; Lan, L.; Li, X.; Chen, G.; Chen, J. Evaluation of Landslide Geological Hazard Susceptibility Based on GIS and BP Neural Network Algorithm. Land Resour. Herald 2025, 22, 98–107. [Google Scholar]
- Yan, H.; Deying, L.; Songsong, M.; Yiqing, S. Landslide susceptibility evaluation in Badong County based on weights of evidence method. Bull. Geol. Sci. Technol. 2020, 39, 187–194. [Google Scholar]
- Fan, W.; Wei, X.; Cao, Y.; Zheng, B. Landslide susceptibility assessment using the certainty factor and analytic hierarchy process. J. Mt. Sci. 2017, 14, 906–925. [Google Scholar] [CrossRef]
- Li, T.; Tian, Y.; Wu, L.; Liu, L. Landslide Susceptibility Mapping Using Random Forest. Geogr. Geo-Inf. Sci. 2014, 30, 25–30+2. [Google Scholar]
- Yuan, X.; Liu, J.; Huang, L.; Li, X. Assessment of Landslide Susceptibility in Xinyuan County Based on Machine Learning Models. Sci. Technol. Eng. 2025, 25, 1815–1826. [Google Scholar]
- Zhang, Y.; Song, W. Spatial Susceptibility Evaluation of Landslide in Dongchuan District of Kunming Based on BP Neural Network and Decision Tree. Territ. Nat. Resour. Study 2023, 67–70. [Google Scholar] [CrossRef]
- Sun, C.; Tie, Y.; Ning, Z.; Xu, W.; Xiong, X. Landslide susceptibility mapping in Xide County, Sichuan Province based on frequency ratio-support vector machine coupling model. Sediment. Geol. Tethyan Geol. 2024, 44, 547–559. [Google Scholar]
- Chen, W.; Yang, Z. Landslide susceptibility modeling using bivariate statistical-based logistic regression, naïve Bayes, and alternating decision tree models. Bull. Eng. Geol. Environ. 2023, 82, 190. [Google Scholar] [CrossRef]
- Ohlmacher, G.C.; Davis, J.C. Using multiple logistic regression and GIS technology to predict landslide hazard in northeast Kansas, USA. Eng. Geol. 2003, 69, 331–343. [Google Scholar] [CrossRef]
- Ali, S.A.; Parvin, F.; Pham, Q.B.; Khedher, K.M.; Dehbozorgi, M.; Rabby, Y.W.; Anh, D.T.; Nguyen, D.H. An ensemble random forest tree with SVM, ANN, NBT, and LMT for landslide susceptibility mapping in the Rangit River watershed, India. Nat. Hazards 2022, 113, 1601–1633. [Google Scholar] [CrossRef]
- Bhattacharya, S.; Ali, T.; Chakravortti, S.; Pal, T.; Majee, B.K.; Mondal, A.; Pande, C.B.; Bilal, M.; Rahman, M.T.; Chakrabortty, R. Application of Machine Learning and Deep Learning Algorithms for Landslide Susceptibility Assessment in Landslide Prone Himalayan Region. Earth Syst. Environ. 2024, 9, 1427–1445. [Google Scholar] [CrossRef]
- Chang, K.-T.; Merghadi, A.; Yunus, A.P.; Pham, B.T.; Dou, J. Evaluating scale effects of topographic variables in landslide susceptibility models using GIS-based machine learning techniques. Sci. Rep. 2019, 9, 12296. [Google Scholar] [CrossRef]
- Zhan, Y.; Zhang, Y.; Zhang, J.; Xu, J.; Chen, H.; Liu, G.; Wan, Z. Risk assessment of land subsidence in Shanghai municipality based on AHP and EWM. Sci. Rep. 2025, 15, 7339. [Google Scholar] [CrossRef]
- Burayu, D.G.; Karuppannan, S.; Shuniye, G. Identifying flood vulnerable and risk areas using the integration of analytical hierarchy process (AHP), GIS, and remote sensing: A case study of southern Oromia region. Urban Clim. 2023, 51, 101640. [Google Scholar] [CrossRef]
- Skilodimou, H.D.; Bathrellos, G.D.; Chousianitis, K.; Youssef, A.M.; Pradhan, B. Multi-hazard assessment modeling via multi-criteria analysis and GIS: A case study. Environ. Earth Sci. 2019, 78, 47. [Google Scholar] [CrossRef]
- Yalcin Kavus, B.; Taskin, A. Assessment of landslides induced by earthquake risk of Istanbul: A comprehensive study utilizing an integrated DFS-AHP and DFS-EDAS approach. Soil Dyn. Earthq. Eng. 2025, 191, 109285. [Google Scholar] [CrossRef]
- Panchal, S.; Shrivastava, A.K. Landslide Hazard Assessment Using Analytic Hierarchy Process (AHP): A Case Study of National Highway 5 in India. Ain Shams Eng. J. 2022, 13, 101626. [Google Scholar] [CrossRef]
- Cao, Y.; Guo, W.; Wu, Y.; Li, L.; Zhang, Y.; Lan, H. An hourly shallow landslide warning model developed by combining automatic landslide spatial susceptibility and temporal rainfall threshold predictions. J. Mt. Sci. 2022, 19, 3370–3387. [Google Scholar] [CrossRef]
- Ciccarese, G.; Mulas, M.; Corsini, A. Combining spatial modelling and regionalization of rainfall thresholds for debris flows hazard mapping in the Emilia-Romagna Apennines (Italy). Landslides 2021, 18, 3513–3529. [Google Scholar] [CrossRef]
- Abraham, M.T.; Satyam, N.; Kushal, S.; Rosi, A.; Pradhan, B.; Segoni, S. Rainfall Threshold Estimation and Landslide Forecasting for Kalimpong, India Using SIGMA Model. Water 2020, 12, 1195. [Google Scholar] [CrossRef]
- Martelloni, G.; Segoni, S.; Fanti, R.; Catani, F. Rainfall thresholds for the forecasting of landslide occurrence at regional scale. Landslides 2012, 9, 485–495. [Google Scholar] [CrossRef]
- Melillo, M.; Brunetti, M.T.; Peruccacci, S.; Gariano, S.L.; Roccati, A.; Guzzetti, F. A tool for the automatic calculation of rainfall thresholds for landslide occurrence. Environ. Model. Softw. 2018, 105, 230–243. [Google Scholar] [CrossRef]
- Abraham, M.T.; Satyam, N.; Lokesh, R.; Pradhan, B.; Alamri, A. Factors Affecting Landslide Susceptibility Mapping: Assessing the Influence of Different Machine Learning Approaches, Sampling Strategies and Data Splitting. Land 2021, 10, 989. [Google Scholar] [CrossRef]
- Huang, F.; Yang, Y.; Jiang, B.; Chang, Z.; Zhou, C.; Jiang, S.-H.; Huang, J.; Catani, F.; Yu, C. Effects of different division methods of landslide susceptibility levels on regional landslide susceptibility mapping. Bull. Eng. Geol. Environ. 2025, 84, 276. [Google Scholar] [CrossRef]
- Ke, C.; Sun, P.; Zhang, S.; Li, R.; Sang, K. Influences of non-landslide sampling strategies on landslide susceptibility mapping: A case of Tianshui city, Northwest of China. Bull. Eng. Geol. Environ. 2025, 84, 123. [Google Scholar] [CrossRef]
- Qin, S.; Wang, J.; Li, X. Analysis of Rainfall Infiltration Law and Stability of Unsaturated Loess Slope. Rock Soil Mech. 2011, 32, 1902–1906. [Google Scholar]
- Zhang, J.; Liu, B.; Ren, S.; Han, W.; Ding, Y.; Peng, S. A 4 Km Daily Gridded Meteorological Dataset for China from 2000 to 2020. Sci. Data 2024, 11, 1230. [Google Scholar] [CrossRef]
- Chen, W.; Chen, X.; Peng, J.; Panahi, M.; Lee, S. Landslide susceptibility modeling based on ANFIS with teaching-learning-based optimization and Satin bowerbird optimizer. Geosci. Front. 2021, 12, 93–107. [Google Scholar] [CrossRef]
- Chen, C.-Y.; Chang, J.-M. Landslide dam formation susceptibility analysis based on geomorphic features. Landslides 2016, 13, 1019–1033. [Google Scholar] [CrossRef]
- Durán Zuazo, V.H.; Rodríguez Pleguezuelo, C.R.; Francia Martínez, J.R.; Cárceles Rodríguez, B.; Martínez Raya, A.; Pérez Galindo, P. Harvest intensity of aromatic shrubs vs. soil erosion: An equilibrium for sustainable agriculture (SE Spain). CATENA 2008, 73, 107–116. [Google Scholar] [CrossRef]
- Niraj, K.C.; Gupta, S.K.; Shukla, D.P. A Comparison of Image-Based and Physics-Based Atmospheric Correction Methods for Extracting Snow and Vegetation Cover in Nepal Himalayas Using Landsat 8 OLI Images. J. Indian Soc. Remote Sens. 2022, 50, 2503–2521. [Google Scholar] [CrossRef]
- Zhang, Y.; Su, S.; Li, P. Numerical Simulation on Mechanism of Fault-Controlled Liujiapo Landslide. J. Eng. Geol. 2015, 23, 1127–1137. [Google Scholar]
- Zhang, M.; Li, T. Triggering Factors and Forming Mechanism of Loess Landslides. J. Eng. Geol. 2011, 19, 530–540. [Google Scholar]
- Yang, B.; Miao, H.; Ma, C. Landslide susceptibility assessment of Yongjia County based on multi-model coupling. J. Henan Univ. Urban Constr. 2024, 33, 91–99+127. [Google Scholar] [CrossRef]
- Fang, K.; Wu, J.; Zhu, J.; Xie, B. A Review of Technologies on Random Forests. J. Stat. Inf. 2011, 26, 32–38. [Google Scholar]
- Hu, Y.; Du, H. Research on color recognition based on quadratic discriminant analysis. KEJIFENG 2016, 17–18. [Google Scholar] [CrossRef]
- Wang, D.; Han, L. Research on Intelligent Operation and Maintenance of Subway Fan and Water Pump Based on Logistic Regression Classification Algorithm. Intell. Build. Smart City 2024, 157–159. [Google Scholar] [CrossRef]
- Zuo, J. Research on Automatic Identification of Abnormal Nodes in Wireless Sensor Networks Based on Naive Bayesian Networks. Autom. Instrum. 2025, 40, 124–128. [Google Scholar]
- Al-Kordi, H.; Al-Amri, A.; Raju, G. Landslide susceptibility mapping using geospatial, analytical hierarchy process (AHP), and binary logistic regression (BLR) techniques—A study of Wadi Habban Basin, Shabwah, Yemen. Results Earth Sci. 2025, 3, 100103. [Google Scholar] [CrossRef]
- Olson, D.L. (Ed.) The Analytic Hierarchy Process. In Decision Aids for Selection Problems; Springer: New York, NY, USA, 1996; pp. 49–68. [Google Scholar]
- Aksoy, H. Determination of landslide susceptibility with Analytic Hierarchy Process (AHP) and the role of forest ecosystem services on landslide susceptibility. Environ. Monit. Assess. 2023, 195, 1525. [Google Scholar] [CrossRef]
- Chattaraj, D.; Paul, B.; Sarkar, S. Integrated Multi-parametric Analytic Hierarchy Process (AHP) and Geographic Information System (GIS) based Spatial modelling for Flood and Water logging Susceptibility Mapping: A case study of English Bazar Municipality of Malda, West Bengal, India. Nat. Hazards Earth Syst. Sci. Discuss. 2021, 2021, 1–20. [Google Scholar] [CrossRef]
- Demirel, B.; Yildirim, E.; Can, E. GIS-based landslide susceptibility mapping using AHP, FMEA, and Pareto systematic analysis in central Yalova, Türkiye. Eng. Sci. Technol. Int. J. 2025, 64, 102013. [Google Scholar] [CrossRef]
- Swain, K.C.; Singha, C.; Nayak, L. Flood Susceptibility Mapping through the GIS-AHP Technique Using the Cloud. ISPRS Int. J. Geo-Inf. 2020, 9, 720. [Google Scholar] [CrossRef]
- Kılıç, G.; Altıntaş, O. A Comparative Analysis of Classical AHP, Fuzzy AHP, and Z-Fuzzy AHP Methods for Flood Risk Assessment in Büyükçekmece District. In Intelligent and Fuzzy Systems; Kahraman, C., Cevik Onar, S., Cebi, S., Oztaysi, B., Tolga, A.C., Ucal Sari, I., Eds.; Springer: Cham, Switzerland, 2024; pp. 120–127. [Google Scholar]
- Batur, M.; Karaman, H.; Alkan, R.M.; Ozener, H. Mapping Social Vulnerability to Nuclear Accidents: A Comparative Framework Using BWM and AHP Methods. Appl. Spat. Anal. Policy 2025, 18, 45. [Google Scholar] [CrossRef]
- Saaty, T.L. How to make a decision: The analytic hierarchy process. Eur. J. Oper. Res. 1990, 48, 9–26. [Google Scholar] [CrossRef]
- Perera, E.N.C.; Jayawardana, D.T.; Jayasinghe, P. A Rainfall Intensity-Duration Threshold for Mass Movement in Badulla, Sri Lanka. GEP 2017, 5, 135–152. [Google Scholar] [CrossRef][Green Version]
- Cohen, J. Statistical Power Analysis for the Behavioral Sciences, 2nd ed.; Lawrence Erlbaum Associates: Hillsdale, NJ, USA, 1988; pp. 79–81. [Google Scholar]
- Schober, P.; Boer, C.; Schwarte, L.A. Correlation Coefficients: Appropriate Use and Interpretation. Anesth. Analg. 2018, 126, 1763–1768. [Google Scholar] [CrossRef]
- Althuwaynee, O.F.; Pradhan, B.; Park, H.-J.; Lee, J.H. A novel ensemble bivariate statistical evidential belief function with knowledge-based analytical hierarchy process and multivariate statistical logistic regression for landslide susceptibility mapping. CATENA 2014, 114, 21–36. [Google Scholar] [CrossRef]
- Nakileza, B.R.; Nedala, S. Topographic influence on landslides characteristics and implication for risk management in upper Manafwa catchment, Mt Elgon Uganda. Geoenviron. Disasters 2020, 7, 27. [Google Scholar] [CrossRef]
- Yi, Y.; Zhang, Z.; Zhang, W.; Xu, Q.; Deng, C.; Li, Q. GIS-based earthquake-triggered-landslide susceptibility mapping with an integrated weighted index model in Jiuzhaigou region of Sichuan Province, China. Nat. Hazards Earth Syst. Sci. 2019, 19, 1973–1988. [Google Scholar] [CrossRef]
- Herrera-Coy, M.C.; Calderón, L.P.; Herrera-Pérez, I.L.; Bravo-López, P.E.; Conoscenti, C.; Delgado, J.; Sánchez-Gómez, M.; Fernández, T. Landslide Susceptibility Analysis on the Vicinity of Bogotá-Villavicencio Road (Eastern Cordillera of the Colombian Andes). Remote Sens. 2023, 15, 3870. [Google Scholar] [CrossRef]
- Niraj, K.C.; Singh, A.; Shukla, D.P. Effect of the Normalized Difference Vegetation Index (NDVI) on GIS-Enabled Bivariate and Multivariate Statistical Models for Landslide Susceptibility Mapping. J. Indian Soc. Remote Sens. 2023, 51, 1739–1756. [Google Scholar] [CrossRef]
- Chen, C.; Park, T.; Wang, X.; Piao, S.; Xu, B.; Chaturvedi, R.K.; Fuchs, R.; Brovkin, V.; Ciais, P.; Fensholt, R.; et al. China and India lead in greening of the world through land-use management. Nat. Sustain. 2019, 2, 122–129. [Google Scholar] [CrossRef] [PubMed]
- Correa-Muñoz, N.A.; Martinez-Martinez, L.J.; Murillo-Feo, C.A. Landslide Susceptibility Mapping Using Supervised Learning Methods—Case Study: Southwestern Colombia. In Geopedology: An Integration of Geomorphology and Pedology for Soil and Landscape Studies; Zinck, J.A., Metternicht, G., del Valle, H.F., Angelini, M., Eds.; Springer International Publishing: Cham, Switzerland, 2023; pp. 315–335. [Google Scholar]
- Mandal, S.P.; Chakrabarty, A.; Maity, P. Comparative Evaluation of Information Value and Frequency Ratio in Landslide Susceptibility Analysis along National Highways of Sikkim Himalaya. Spat. Inf. Res. 2018, 26, 127–141. [Google Scholar] [CrossRef]
- Qin, Y.; Zhao, Z.; Zhou, D.; Chang, K.; Mou, Q.; Yang, Y.; Hu, Y. Landslide Susceptibility Assessment in Yulong County Using Contribution Degree Clustering Method and Stacking Ensemble Coupled Model Based on Certainty Factor. Remote Sens. 2024, 16, 3582. [Google Scholar] [CrossRef]
Disclaimer/Publisher’s Note: The statements, opinions and data contained in all publications are solely those of the individual author(s) and contributor(s) and not of MDPI and/or the editor(s). MDPI and/or the editor(s) disclaim responsibility for any injury to people or property resulting from any ideas, methods, instructions or products referred to in the content. |
© 2025 by the authors. Licensee MDPI, Basel, Switzerland. This article is an open access article distributed under the terms and conditions of the Creative Commons Attribution (CC BY) license (https://creativecommons.org/licenses/by/4.0/).

