1. Introduction
The QLB, situated on the northeastern margin of the Tibetan Plateau, constitutes a vital ecological security barrier in western China [
1] and serves as a core region supporting the sustainable development of alpine grassland animal husbandry in the northeastern Tibetan Plateau [
2]. As a typical fragile alpine ecosystem, the QLB features a relatively homogeneous ecological structure and weak resistance to disturbances, making it difficult to recover once damaged [
3]. Over recent decades, the QLB has undergone significant eco-environmental changes. From 1950 to 2004, under the dual pressures of climate change and human activities, the basin experienced a series of eco-environmental problems, including grassland degradation, land desertification, and biodiversity loss, posing severe threats to regional ecological security and socio-economic sustainable development [
4,
5,
6,
7]. However, since the beginning of the 21st century, against the backdrop of global warming, an improvement trend in the EEQ of the QLB has emerged. The mechanisms and sustainability of this shift, particularly its impact on the stability of alpine agro-pastoral ecosystems, require in-depth investigation.
Regarding the assessment of EEQ in the QLB, existing research methods primarily fall into three categories: (1) Traditional Ground-Based Assessment Methods: Xu et al. [
8] evaluated grassland EEQ in the Qinghai Lake lakeside area through field sampling integrated with climatic, biological, and edaphic factors, employing a hierarchical comprehensive evaluation method. Chen [
9] conducted ecological sensitivity analysis using field survey data, applying single- and multi-factor evaluation approaches to assess natural and anthropogenic drivers. While offering data precision advantages, these methods exhibit sampling density-dependent accuracy, limited spatial extrapolation capability, and inadequate suitability for large-scale continuous monitoring. (2) Multi-Indicator Comprehensive Evaluation Systems: Zhang [
10] developed an AHP-based ecological quality model incorporating climatic, vegetative, and socio-economic parameters to evaluate wetland EEQ. Yuan [
11] established a 2000–2013 EEQ assessment system integrating Landsat/MODIS data with Principal Component Analysis (PCA) and the analytic hierarchy process (AHP). These approaches remain constrained by subjective indicator weighting. (3) Remote Sensing Monitoring Methods: Wu [
12] employed a Pressure-State-Response (PSR) framework integrating remote sensing, meteorological, landscape, and statistical data to assess 2005–2019 ecological health. Wang et al. [
13] revealed desertification reversal using Enhanced Vegetation Index (EVI)-derived vegetation coverage. Such methods predominantly focus on singular ecological elements, offering limited holistic ecosystem characterization.
To overcome the subjectivity in weighting inherent to multi-indicator evaluations, Xu [
14] proposed the Remote Sensing Ecological Index (RSEI). This index integrates four key ecological parameters—greenness, wetness, heat, and dryness—and employs PCA for objective weighting, effectively circumventing human intervention. It has been extensively applied in EEQ assessments across various regions, including the Tibetan Plateau, the Three-River-Source Region, and the Yellow River Basin [
15,
16,
17,
18]. However, constructing long-term, large-scale RSEI datasets using conventional remote sensing processing methods faces significant technical bottlenecks, including inefficient acquisition, storage management, and computational processing of massive remote sensing data [
19,
20]. These challenges are particularly pronounced in high-altitude regions like the QLB, where frequent cloud cover and complex topography further complicate remote sensing data acquisition and analysis.
The emergence of GEE offers a novel technological pathway to address these challenges. GEE integrates massive remote sensing data resources and diverse algorithm libraries while delivering robust parallel computing capabilities, significantly enhancing processing efficiency and analytical capacity for large-scale remote sensing datasets [
21,
22]. Conducting RSEI computations on GEE enables efficient long-term remote sensing data processing for dynamic monitoring and assessment of regional-scale EEQ. It provides timely and accurate scientific support for ecological conservation and agri-pastoral resource management decision-making.
Given this context, this study aims to address these methodological gaps by developing a robust GEE-based framework to systematically investigate the EEQ dynamics in the QLB. To achieve this, our work is built upon the following integrated approach and innovations: First, we leverage the GEE cloud platform to overcome computational barriers, enabling the efficient construction of a long-term RSEI time series (2001–2022) from MODIS data for the data-scarce QLB. Second, we integrate Sen’s slope estimator and the Mann–Kendall test to provide a robust quantitative assessment of the spatiotemporal evolution trends of EEQ. Third, we employ the GD model to quantitatively identify key driving factors and their interactions. The selection of drivers was based on the QLB’s specific ecological context, encompassing both natural (e.g., climate, topography) and anthropogenic (e.g., land use, population density) dimensions to ensure a comprehensive analysis of the underlying mechanisms. Ultimately, this spatially explicit and mechanism-informed approach aims to propose a differentiated governance paradigm to support ecological management in alpine agro-pastoral ecosystems.
2. Materials and Methods
2.1. Study Area
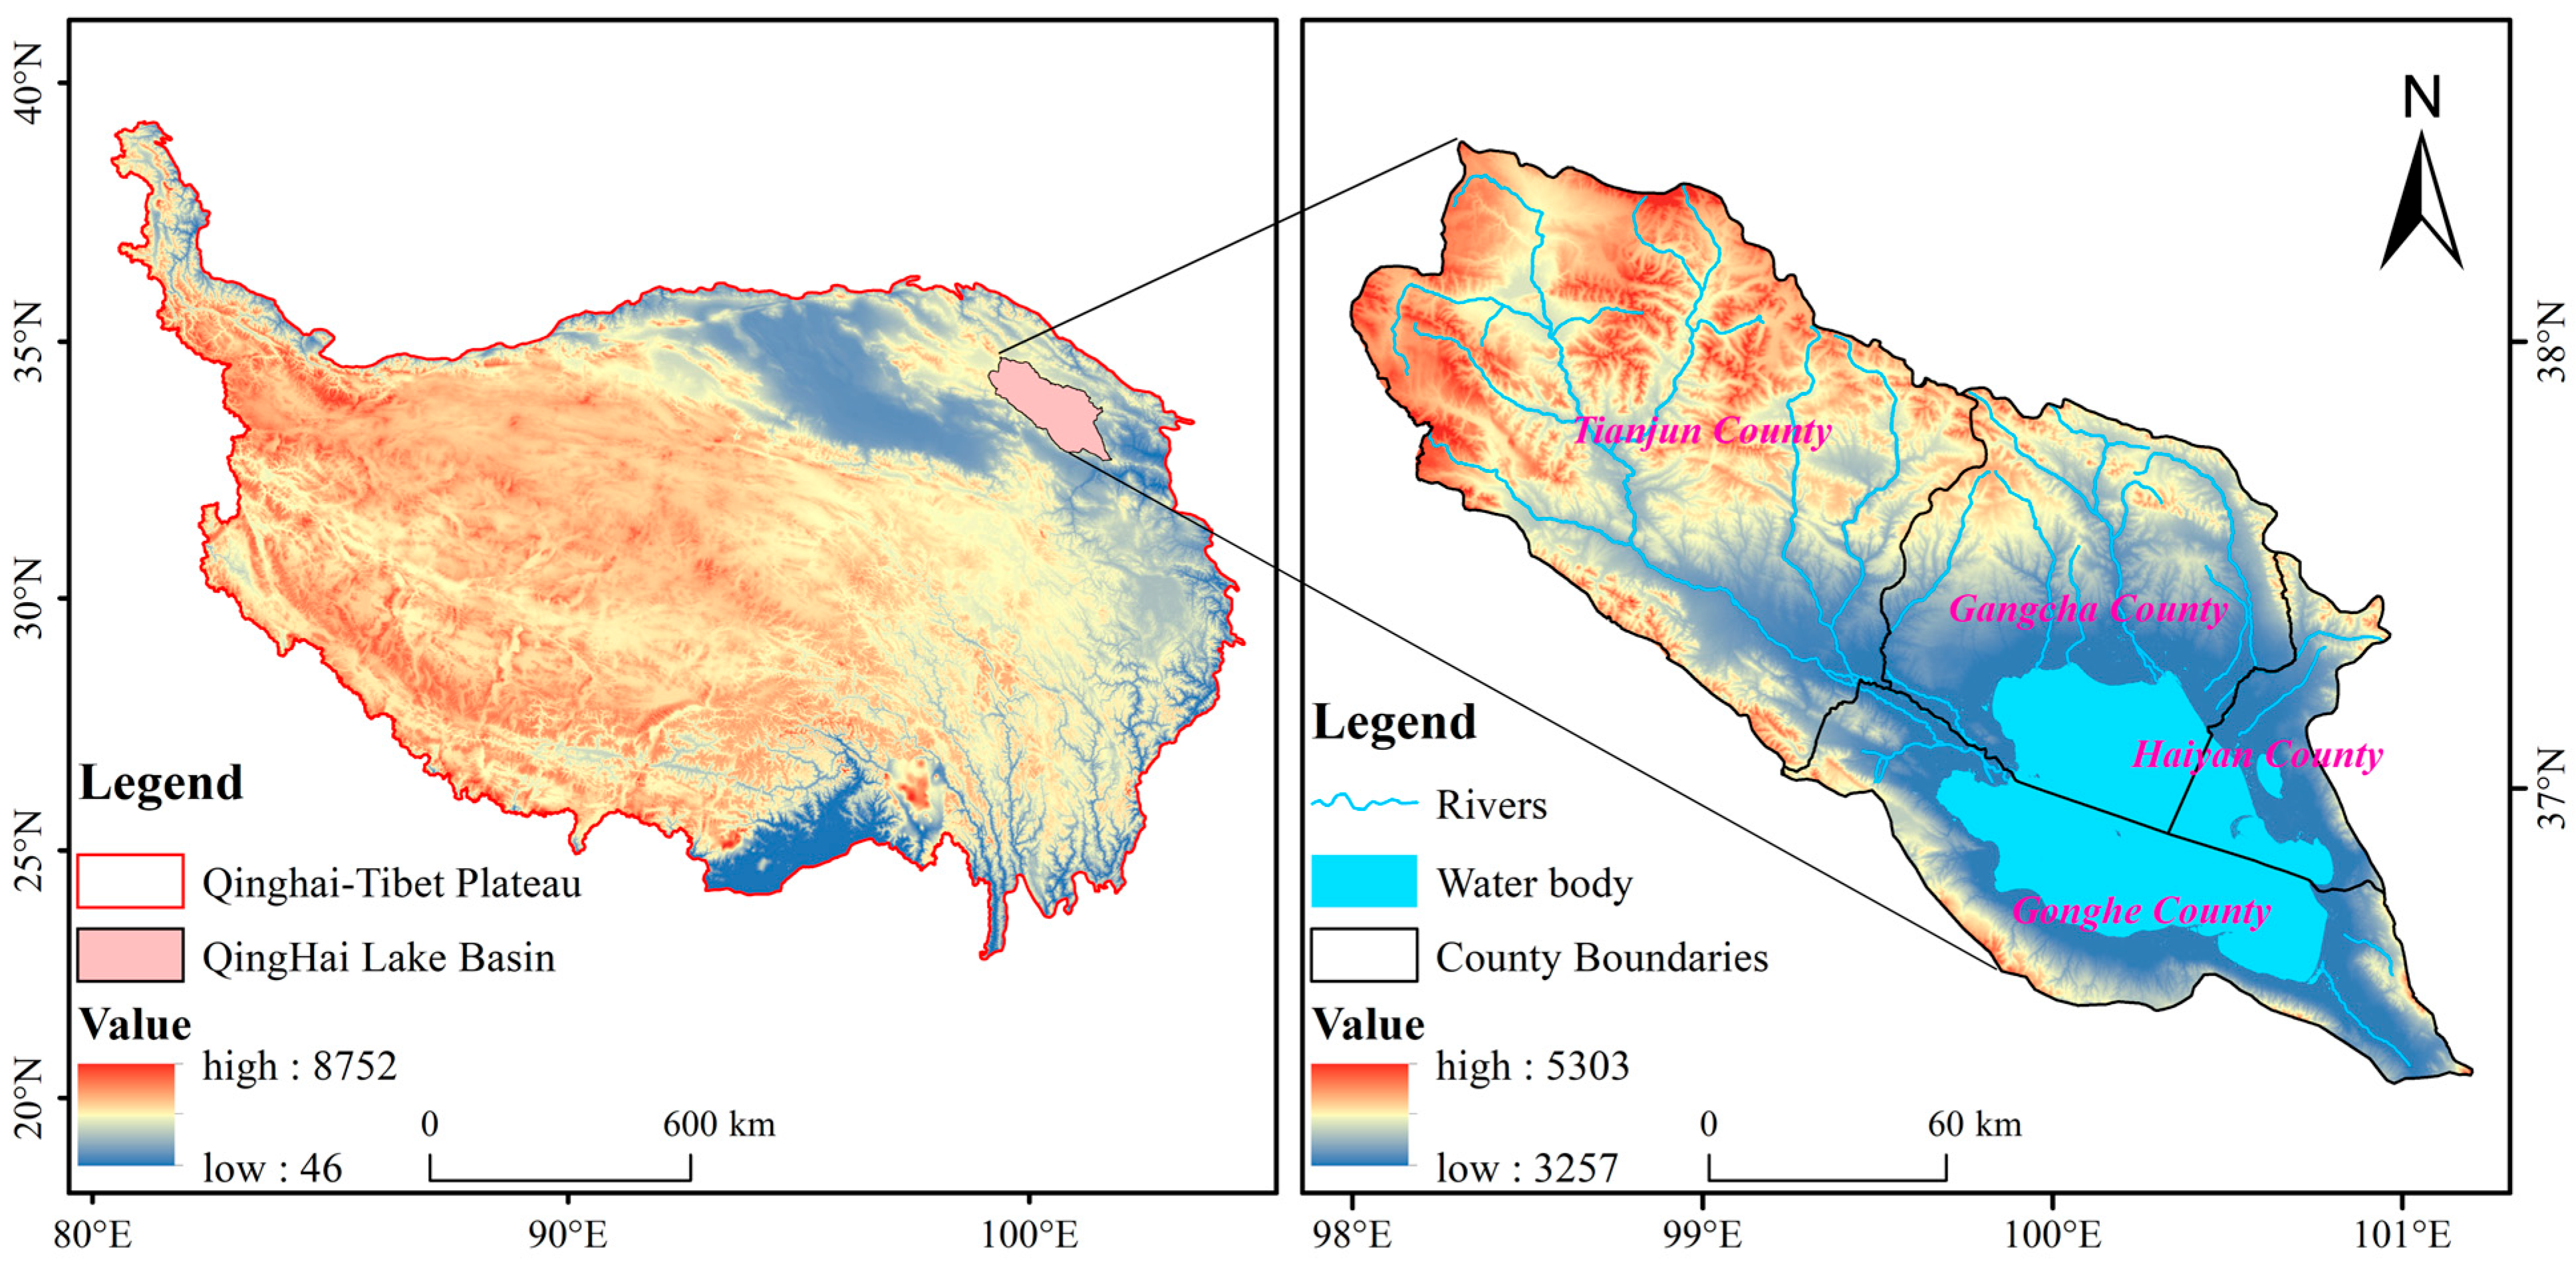
The QLB is situated in the northeastern Tibetan Plateau (36°15′–38°20′ N, 97°50′–101°15′ E), covering a total area of approximately 29,661 km
2 and encompassing Gangcha, Tianjun, Gonghe, and Haiyan counties (
Figure 1). This basin contains China’s largest inland lake, serving as a critical hydrological system for maintaining ecological equilibrium on the Tibetan Plateau and a vital environmental barrier against desertification eastward expansion. Elevations range from 3257 m to 5303 m, gradually ascending from southeast to northwest (
Figure 1). Characterized by a frigid climate, the basin experiences multi-year average temperatures of −4.6~4.0 °C and receives 291~579 mm of annual precipitation [
23]. Vegetation exhibits distinct vertical zonation, dominated by temperate steppe, alpine steppe, alpine meadow, and alpine scrub. High-elevation areas feature sparse vegetation on alpine scree slopes [
24]. Animal husbandry—primarily yaks and Tibetan sheep—constitutes the traditional leading industry and primary economic activity [
25], contributing > 82% to local income [
26]. Cultivated agriculture remains limited, concentrated primarily in southern Gangcha County and the eastern lakeside areas of Gonghe County.
2.2. Data and Preprocessing
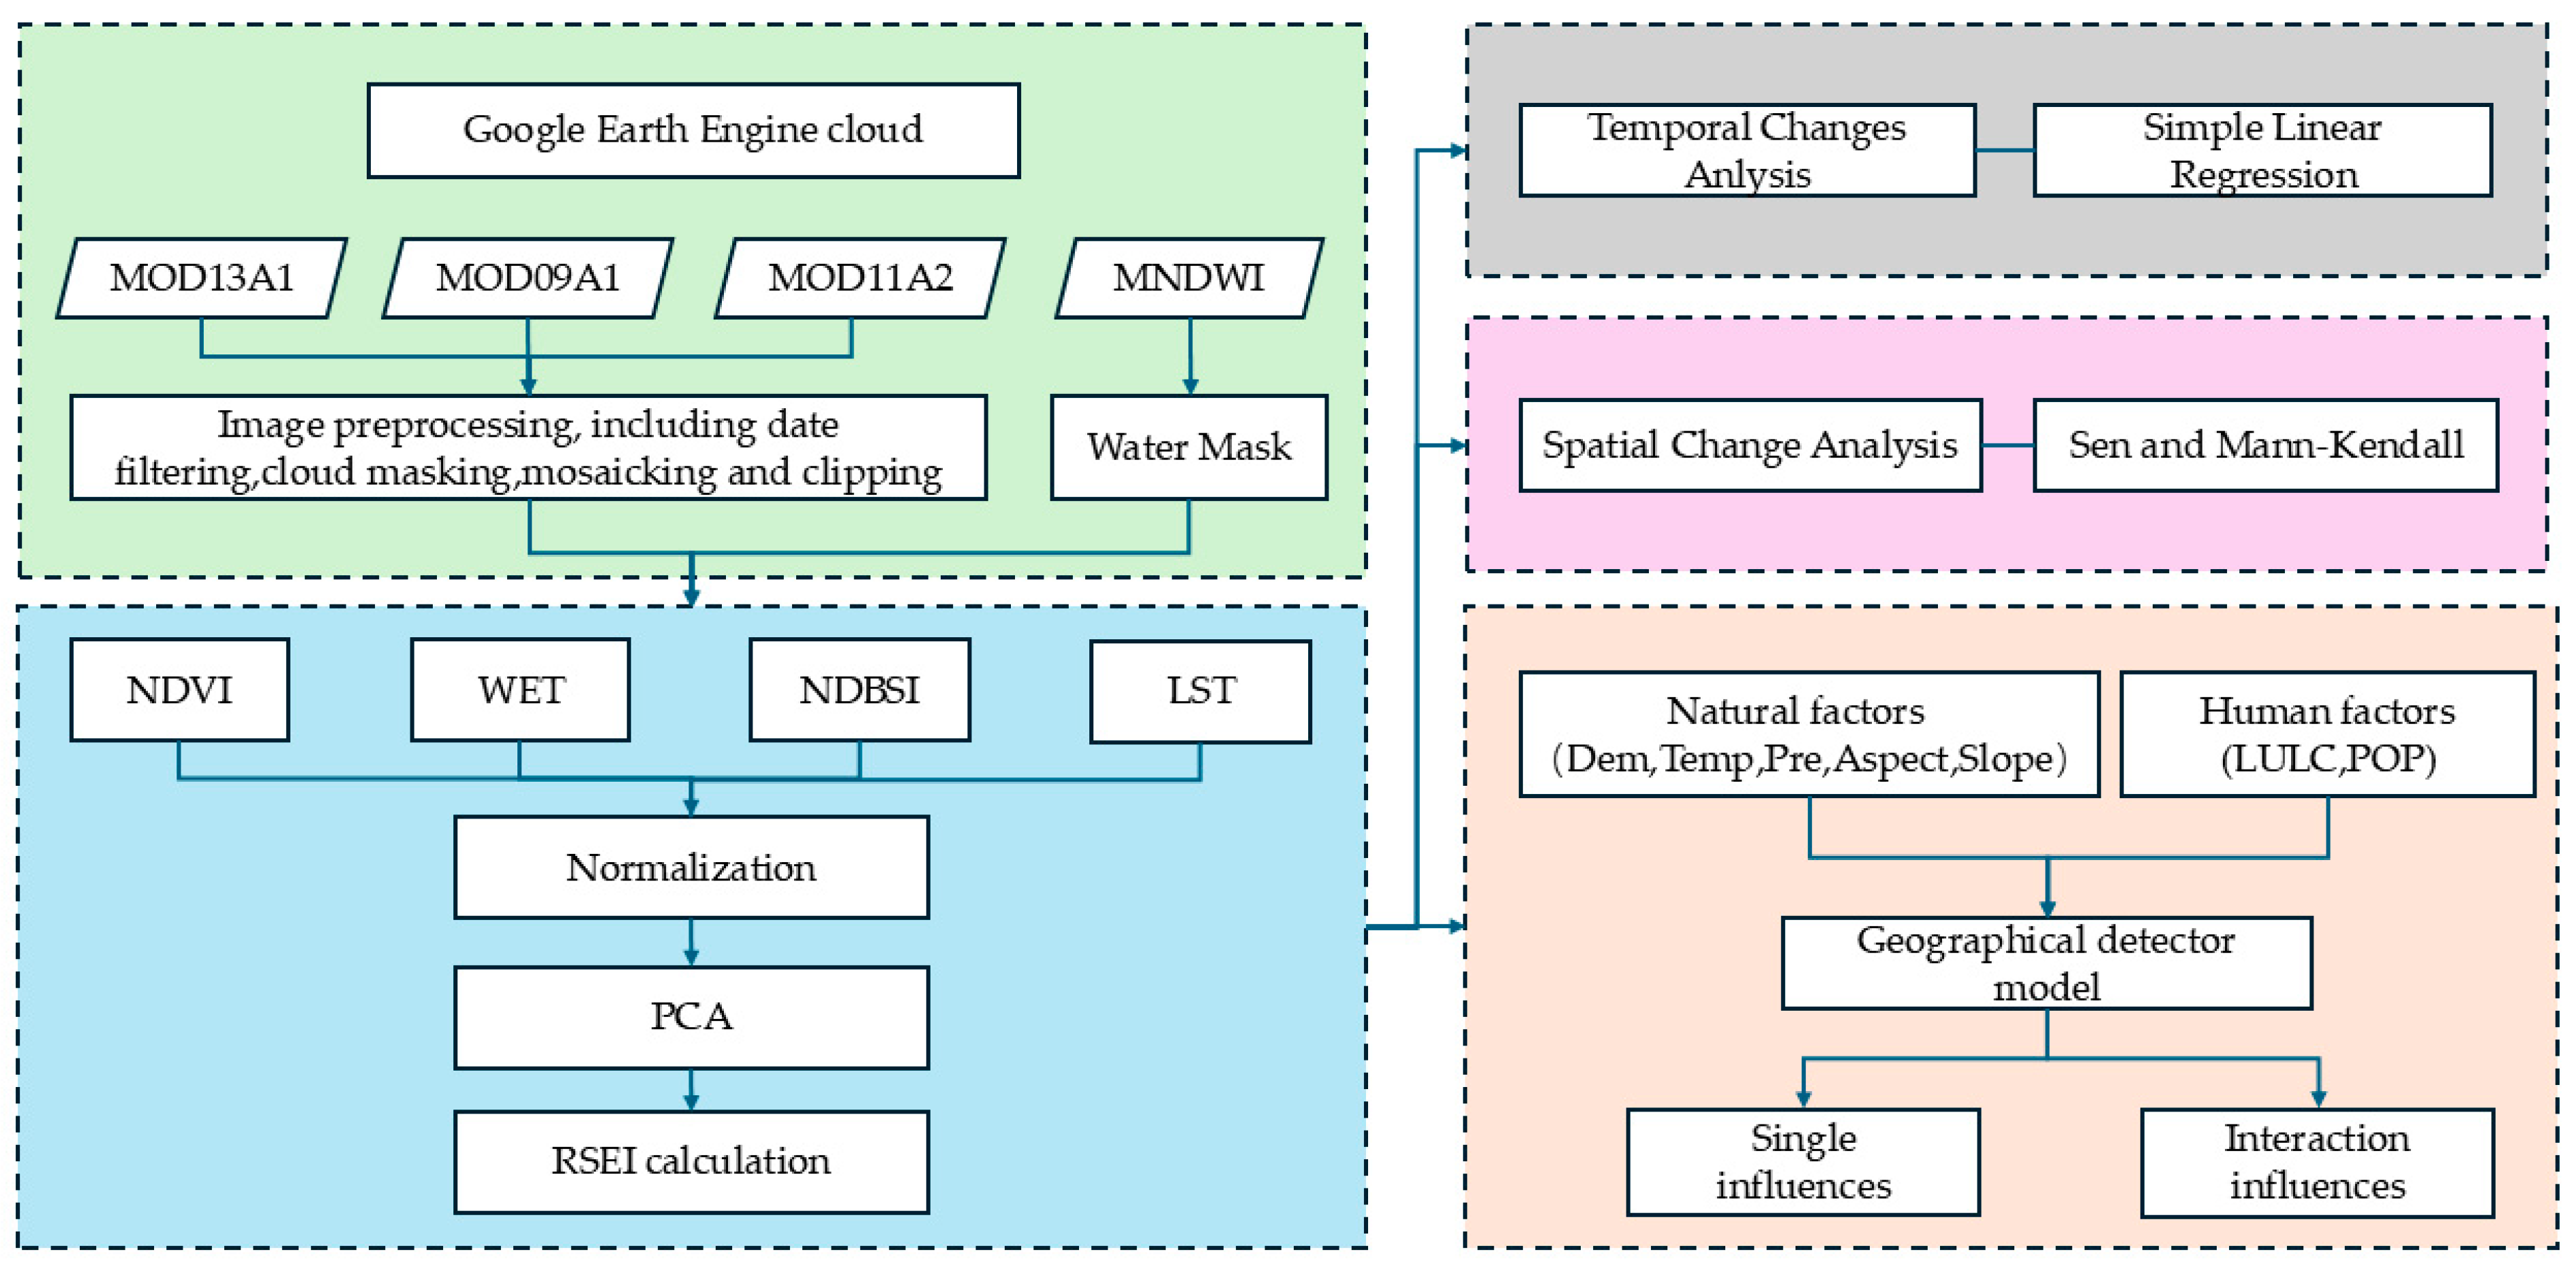
The QLB features complex topography and a highly variable climate, with frequent cloud cover during the growing season (June–August). Evaluation of 2001–2022 MODIS imagery on GEE revealed significant spatiotemporal heterogeneity in high-quality image availability due to plateau climate constraints. Through feasibility analysis of multiple temporal interval schemes, a 3-year interval was identified as the minimum viable temporal resolution that ensures sufficient valid imagery while meeting RSEI construction quality requirements. Consequently, this study implemented the following technical workflow (
Figure 2):
SEI Construction: After image filtration, selection, and cloud removal on GEE, we extracted four key ecological indicators for the growing seasons (June–August) of 2001, 2004, 2007, 2010, 2013, 2016, 2019, and 2022 using MOD09A1 (surface reflectance), MOD13A1 (vegetation indices), and MOD11A2 (land surface temperature) products. The indicators were: Greenness (Normalized Difference Vegetation Index, NDVI), Wetness (Tasseled Cap Wetness component, WET), Heat (Land Surface Temperature, LST), and Dryness (Normalized Difference Build-up and Soil Index, NDBSI). All indicators underwent normalization. PCA was applied to the normalized matrix, with the first principal component (PC1) used to construct RSEI for each period.
Spatiotemporal Change Analysis: Using the eight-phase RSEI data (2001, 2004, 2007, 2010, 2013, 2016, 2019, and 2022), we integrated Sen and MK to quantitatively assess spatiotemporal evolution patterns and changing trends of EEQ during 2001–2022.
Driving Mechanism Analysis: The GD model was employed to quantitatively identify dominant driving factors and their interactions affecting the spatial differentiation of EEQ from natural and anthropogenic dimensions.
Due to the vast area and sparse population of the QLB, data acquisition is challenging. To ensure data representativeness and scientific rigor, this study selected seven driving factors based on previous research into the ecosystem characteristics of alpine inland lake basins [
27,
28]. These factors encompass the fundamental natural and anthropogenic processes known to regulate ecosystem dynamics in high-altitude regions (
Table 1).
For natural factors, topographic elements—including Digital Elevation Model (DEM), slope, and aspect—characterize altitudinal gradients and terrain features. These directly influence vegetation distribution and ecosystem productivity by regulating the spatial distribution of water and thermal resources. Hydrothermal factors, namely growing season mean precipitation (Pre) and temperature (Temp), reflect the combination of water and heat conditions during the growing season, which form the foundational conditions for the formation and evolution of alpine ecosystems.
For anthropogenic factors, Land Use and Land Cover (LULC) data represent the intensity of land use change, while Population Density (POP) data help identify the spatial distribution characteristics of human activities. Together, these two types of factors reflect the primary manifestations of human activities in alpine pastoral regions.
All factor data were obtained from authoritative public platforms to ensure reliability and comparability. During preprocessing, all datasets were resampled to a unified resolution of 500 m to maintain spatial consistency with the RSEI, thereby meeting the data uniformity requirements of the Geodetector model.
2.3. Methods
2.3.1. The RSEI
This study employed the RSEI, integrating four component indicators—greenness, wetness, dryness, and heat—to evaluate EEQ [
29]. The indicators were defined as follows: Greenness: NDVI, Wetness: WET, Dryness: NDBSI (calculated as (SI + IBI)/2), Heat: LST. Before calculation, water bodies within the QLB were masked using MNDWI [
30] on GEE to eliminate water-body interference with component weighting. The computational formulas are as follows:
where
,
,
, and
denote greenness, wetness, heat, and dryness, respectively, and
are the reflectance values of bands 1–7 in the MOD09A1 imagery.
Given the differing units and data ranges among the four component indicators, each was normalized using the following equation:
where
denotes the normalized result;
is the component-indicator value;
represents the maximum value of the indicator in the study year; and
indicates the minimum value of the indicator in the study year.
Next, the PCA module in GEE is invoked to compute RSEI. Because the PC1 concentrates the dominant information of all components, PC1 is designated
. After normalizing
, the final
—ranging from 0 to 1—is obtained. The relevant equations are as follows:
where
denotes the RSEI;
is the minimum value of
; and
is the maximum value of
.
Finally, the
values were divided into five equal-interval classes [
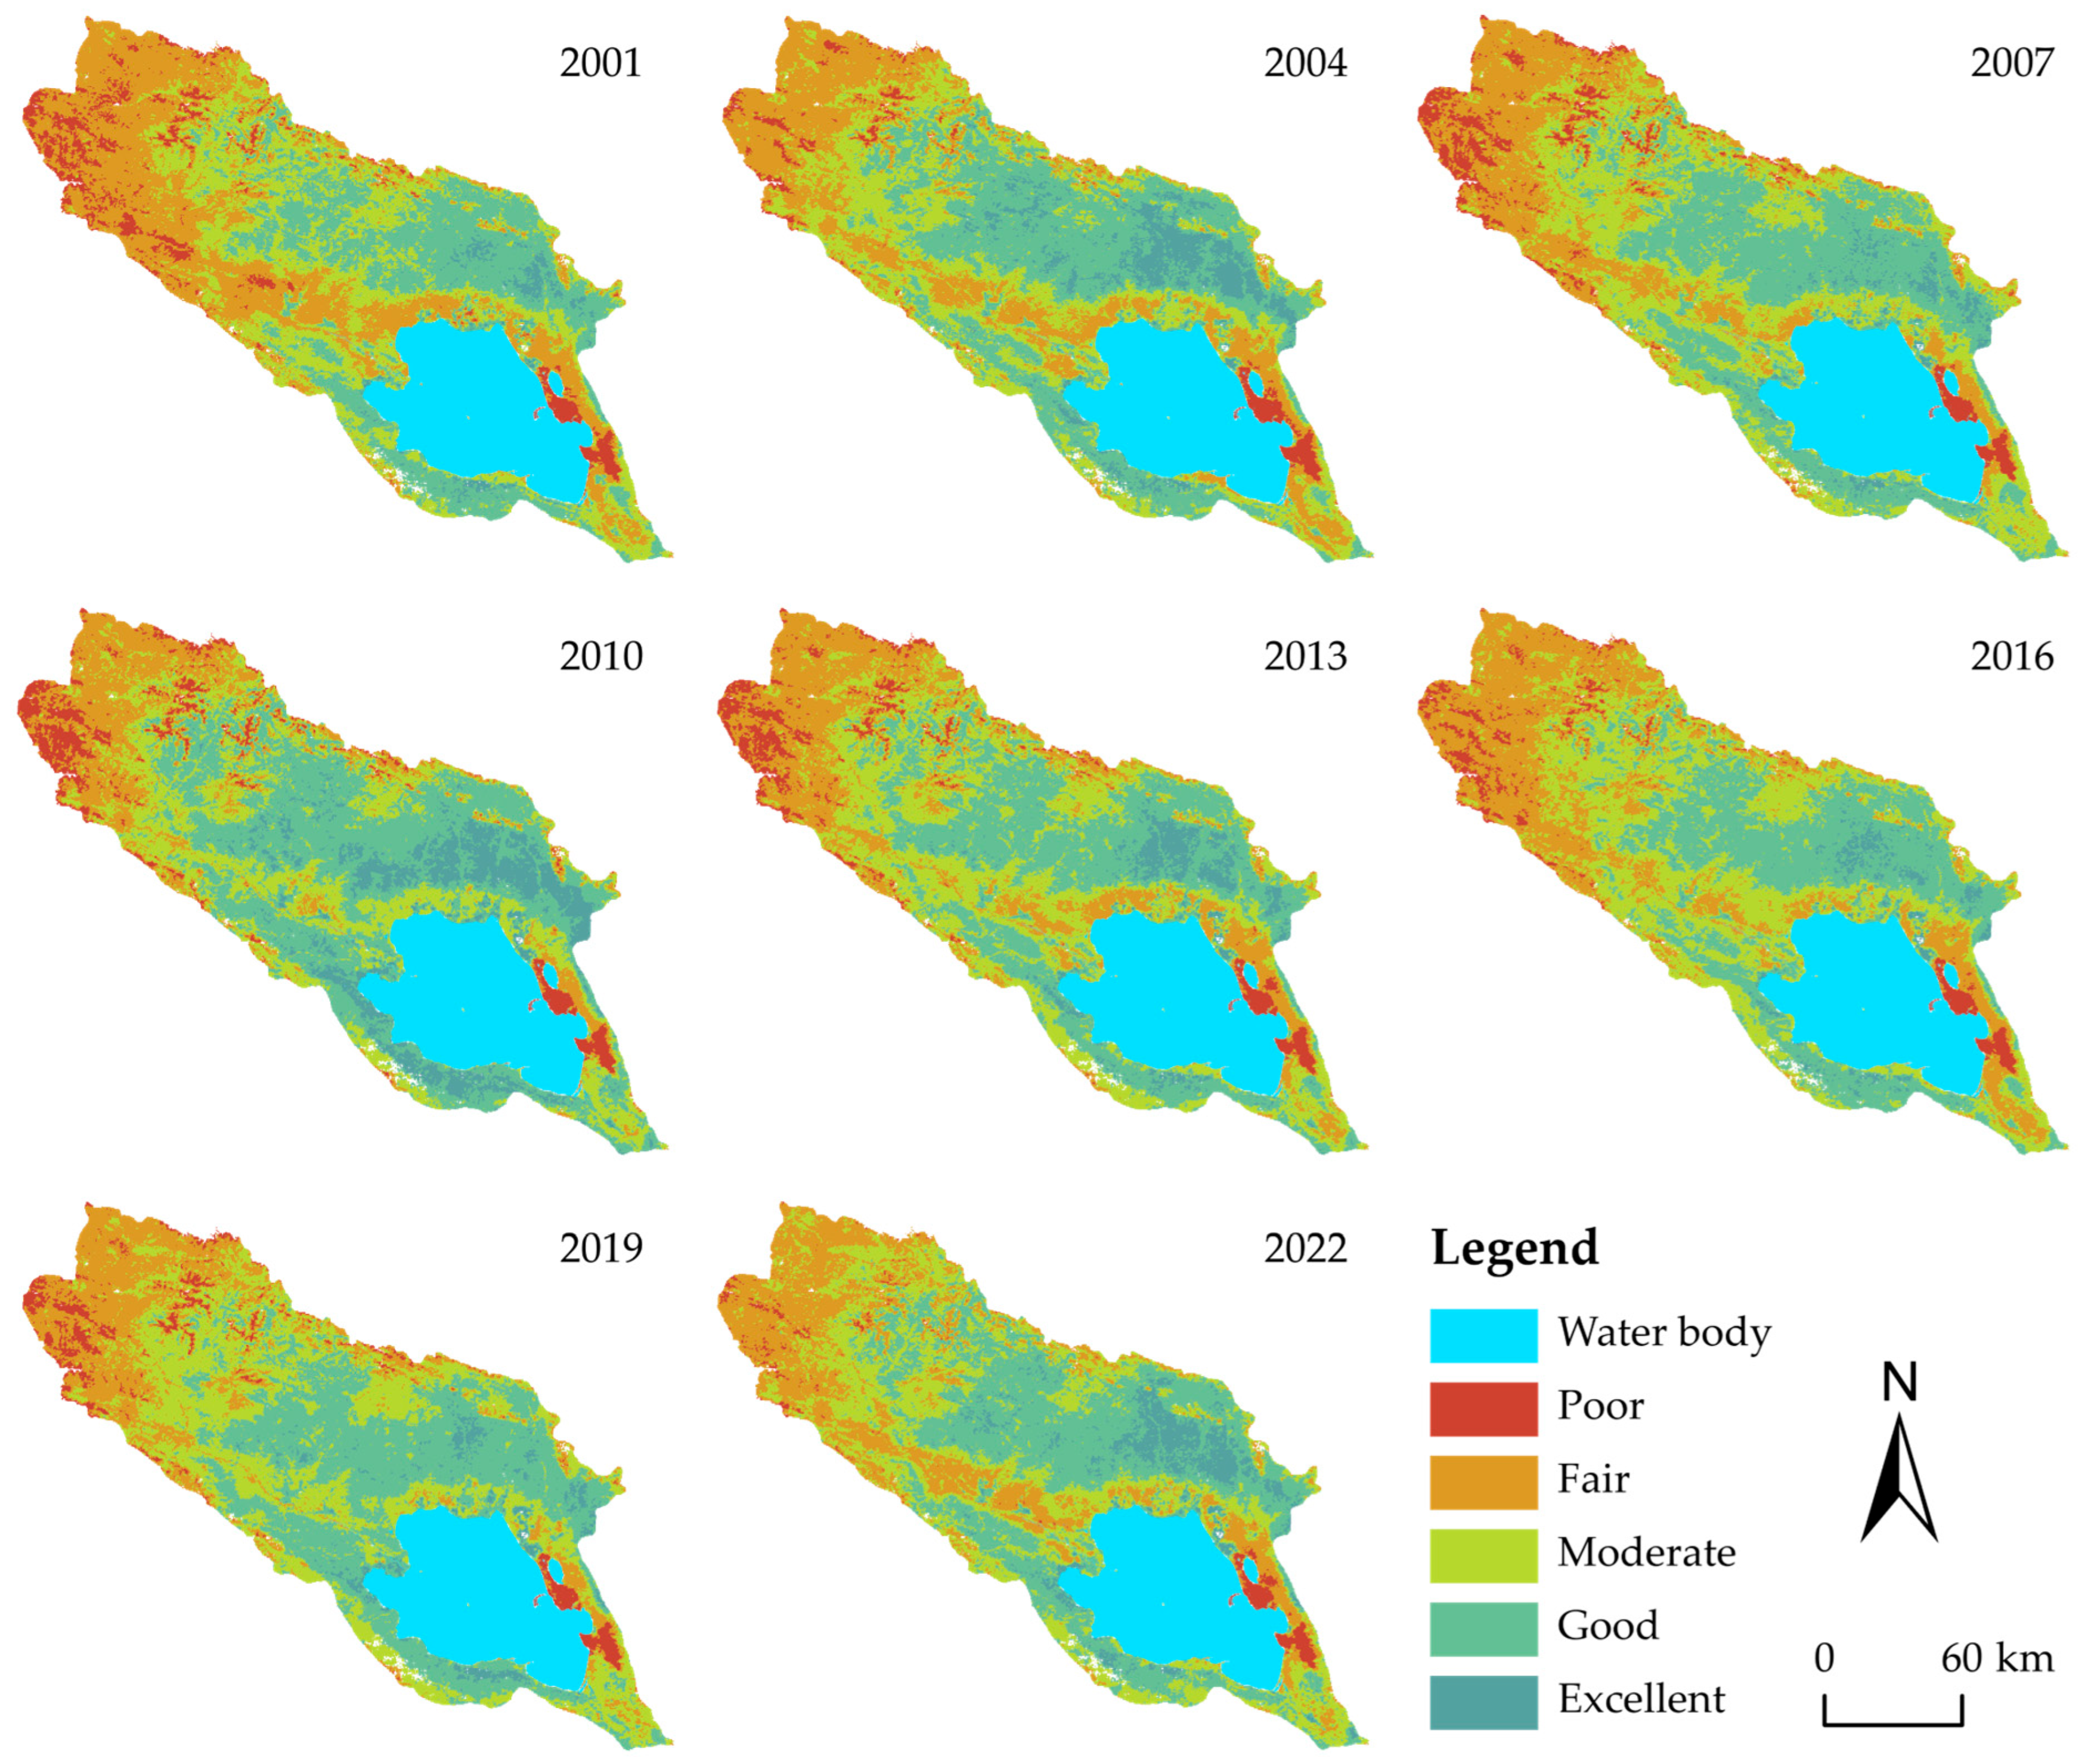
30]: Poor (0–0.2), Fair (0.2–0.4), Moderate (0.4–0.6), Good (0.6–0.8), and Excellent (0.8–1).
values closer to 1 indicate superior EEQ.
2.3.2. Sen and MK Trend Analysis
Sen [
31] is a robust nonparametric statistical method for trend calculation, characterized by high computational efficiency and strong resistance to measurement errors and outliers. It is particularly suitable for trend analysis in long-term time series data [
32,
33]. This study applied Sen to analyze trends within the RSEI time series dataset. The computational formula is as follows [
34]:
where
and
represent the
values in year
and year
, respectively.
denotes the slope magnitude: If
,
exhibits an increasing trend, If
,
exhibits a decreasing trend, If
,
shows no trend change.
The MK [
35] is a nonparametric statistical method for assessing trends in time series data. It requires no assumption of normality and maintains robustness against missing values and outliers. Particularly suitable for evaluating trend significance in long-term time series [
36], it utilizes the
Z statistic for hypothesis testing. At the significance level α = 0.05, the critical
Z value is 1.96: if
, RSEI change is statistically significant at 95% confidence level, if
the change is not statistically significant. The computational formula is as follows [
34]:
where
denote number of images in the study area (
),
is sign function,
is trend significance statistic.
The specific classification method for trend analysis is as follows (
Table 2).
2.3.3. GD
GD is a spatial statistical method designed to identify spatial differentiation patterns of geographical phenomena and uncover their underlying driving factors and interaction effects [
37]. This approach has been widely applied in EEQ assessments [
38,
39]. This study partitioned the QLB into 3 km × 3 km regular grids. We extracted RSEI values at centroid points within each grid unit and matched them with corresponding driver values. The factor and interaction detector modules were then employed to quantify each driver’s independent explanatory power (
q-statistic) on RSEI spatial differentiation and detect enhancement or weakening effects of pairwise driver interactions on RSEI spatial patterns.
The factor detector computes the q-value for each driver using the following formula [
37]:
where
denotes the number of strata/categories for variable Y (
) or X (drivers);
represents the number of units in stratum
;
is the total number of units across the entire basin;
indicates the variance of Y (
) within stratum
;
signifies the global variance of Y (
) in the whole basin;
constitutes the sum of within-stratum variances; and
represents the total variance of Y in the entire basin. The
q-statistic ranges between [0, 1], with higher values indicating more substantial driver influence on
spatial differentiation and lower values indicating weaker influence.
The interaction detector assesses the impact of interactions between any two driving factors on
spatial differentiation [
37] (
Table 3).
4. Discussion
4.1. Ecological Vulnerability and Methodological Rationale
The QLB represents a typical fragile alpine ecosystem characterized by relatively homogeneous ecological structure and low resistance to environmental disturbances [
1]. The high-altitude environment imposes stringent physiological constraints on biota through cold temperatures, thin atmosphere, and short growing seasons, resulting in generally low productivity and high sensitivity to environmental changes. Ecosystem recovery following degradation proves particularly challenging in such environments due to slow ecological processes, high vulnerability to soil erosion, and potential crossing of ecological thresholds [
2]. These inherent vulnerabilities highlight the critical importance of continuous monitoring and timely intervention for maintaining ecological security in the QLB and similar alpine regions.
Traditional assessment methodologies employed in the QLB, including field survey-based approaches [
3,
4] and multi-indicator comprehensive evaluations [
5,
6], have faced substantial limitations in achieving efficient, long-term, and basin-scale monitoring. Similar methodological challenges have been documented in other inland lake basins worldwide, such as the Aral Sea Basin where sparse monitoring networks hindered early detection of ecological collapse [
7], and the Bosten Lake Basin where inconsistent assessment approaches limited understanding of ecosystem dynamics [
8]. These constraints are particularly pronounced in this remote region characterized by sparse ground data and frequent cloud cover. While previous remote sensing investigations have yielded valuable insights [
9,
10], many have focused on singular ecological elements, providing limited characterization of holistic ecosystem conditions. The integrated GEE-RSEI-GD framework developed in this study effectively addresses these methodological gaps. Through leveraging the computational capabilities of the GEE, we achieved efficient processing of massive MODIS datasets to construct a consistent 22-year RSEI time series, a task that would be prohibitively time-consuming using conventional methods. Furthermore, the application of the GD model enables quantitative dissection of the complex, interactive driving mechanisms underlying spatial differentiation of EEQ, representing a significant methodological advancement over previous qualitative assessments in the QLB. Unlike previous studies that often relied on single indicators or subjective weighting systems, our approach provides objective integration of multiple ecological components and quantitative mechanistic analysis, representing a clear advancement in inland lake basin ecological assessment methodology [
7,
8].
4.2. Spatiotemporal Dynamics of EEQ
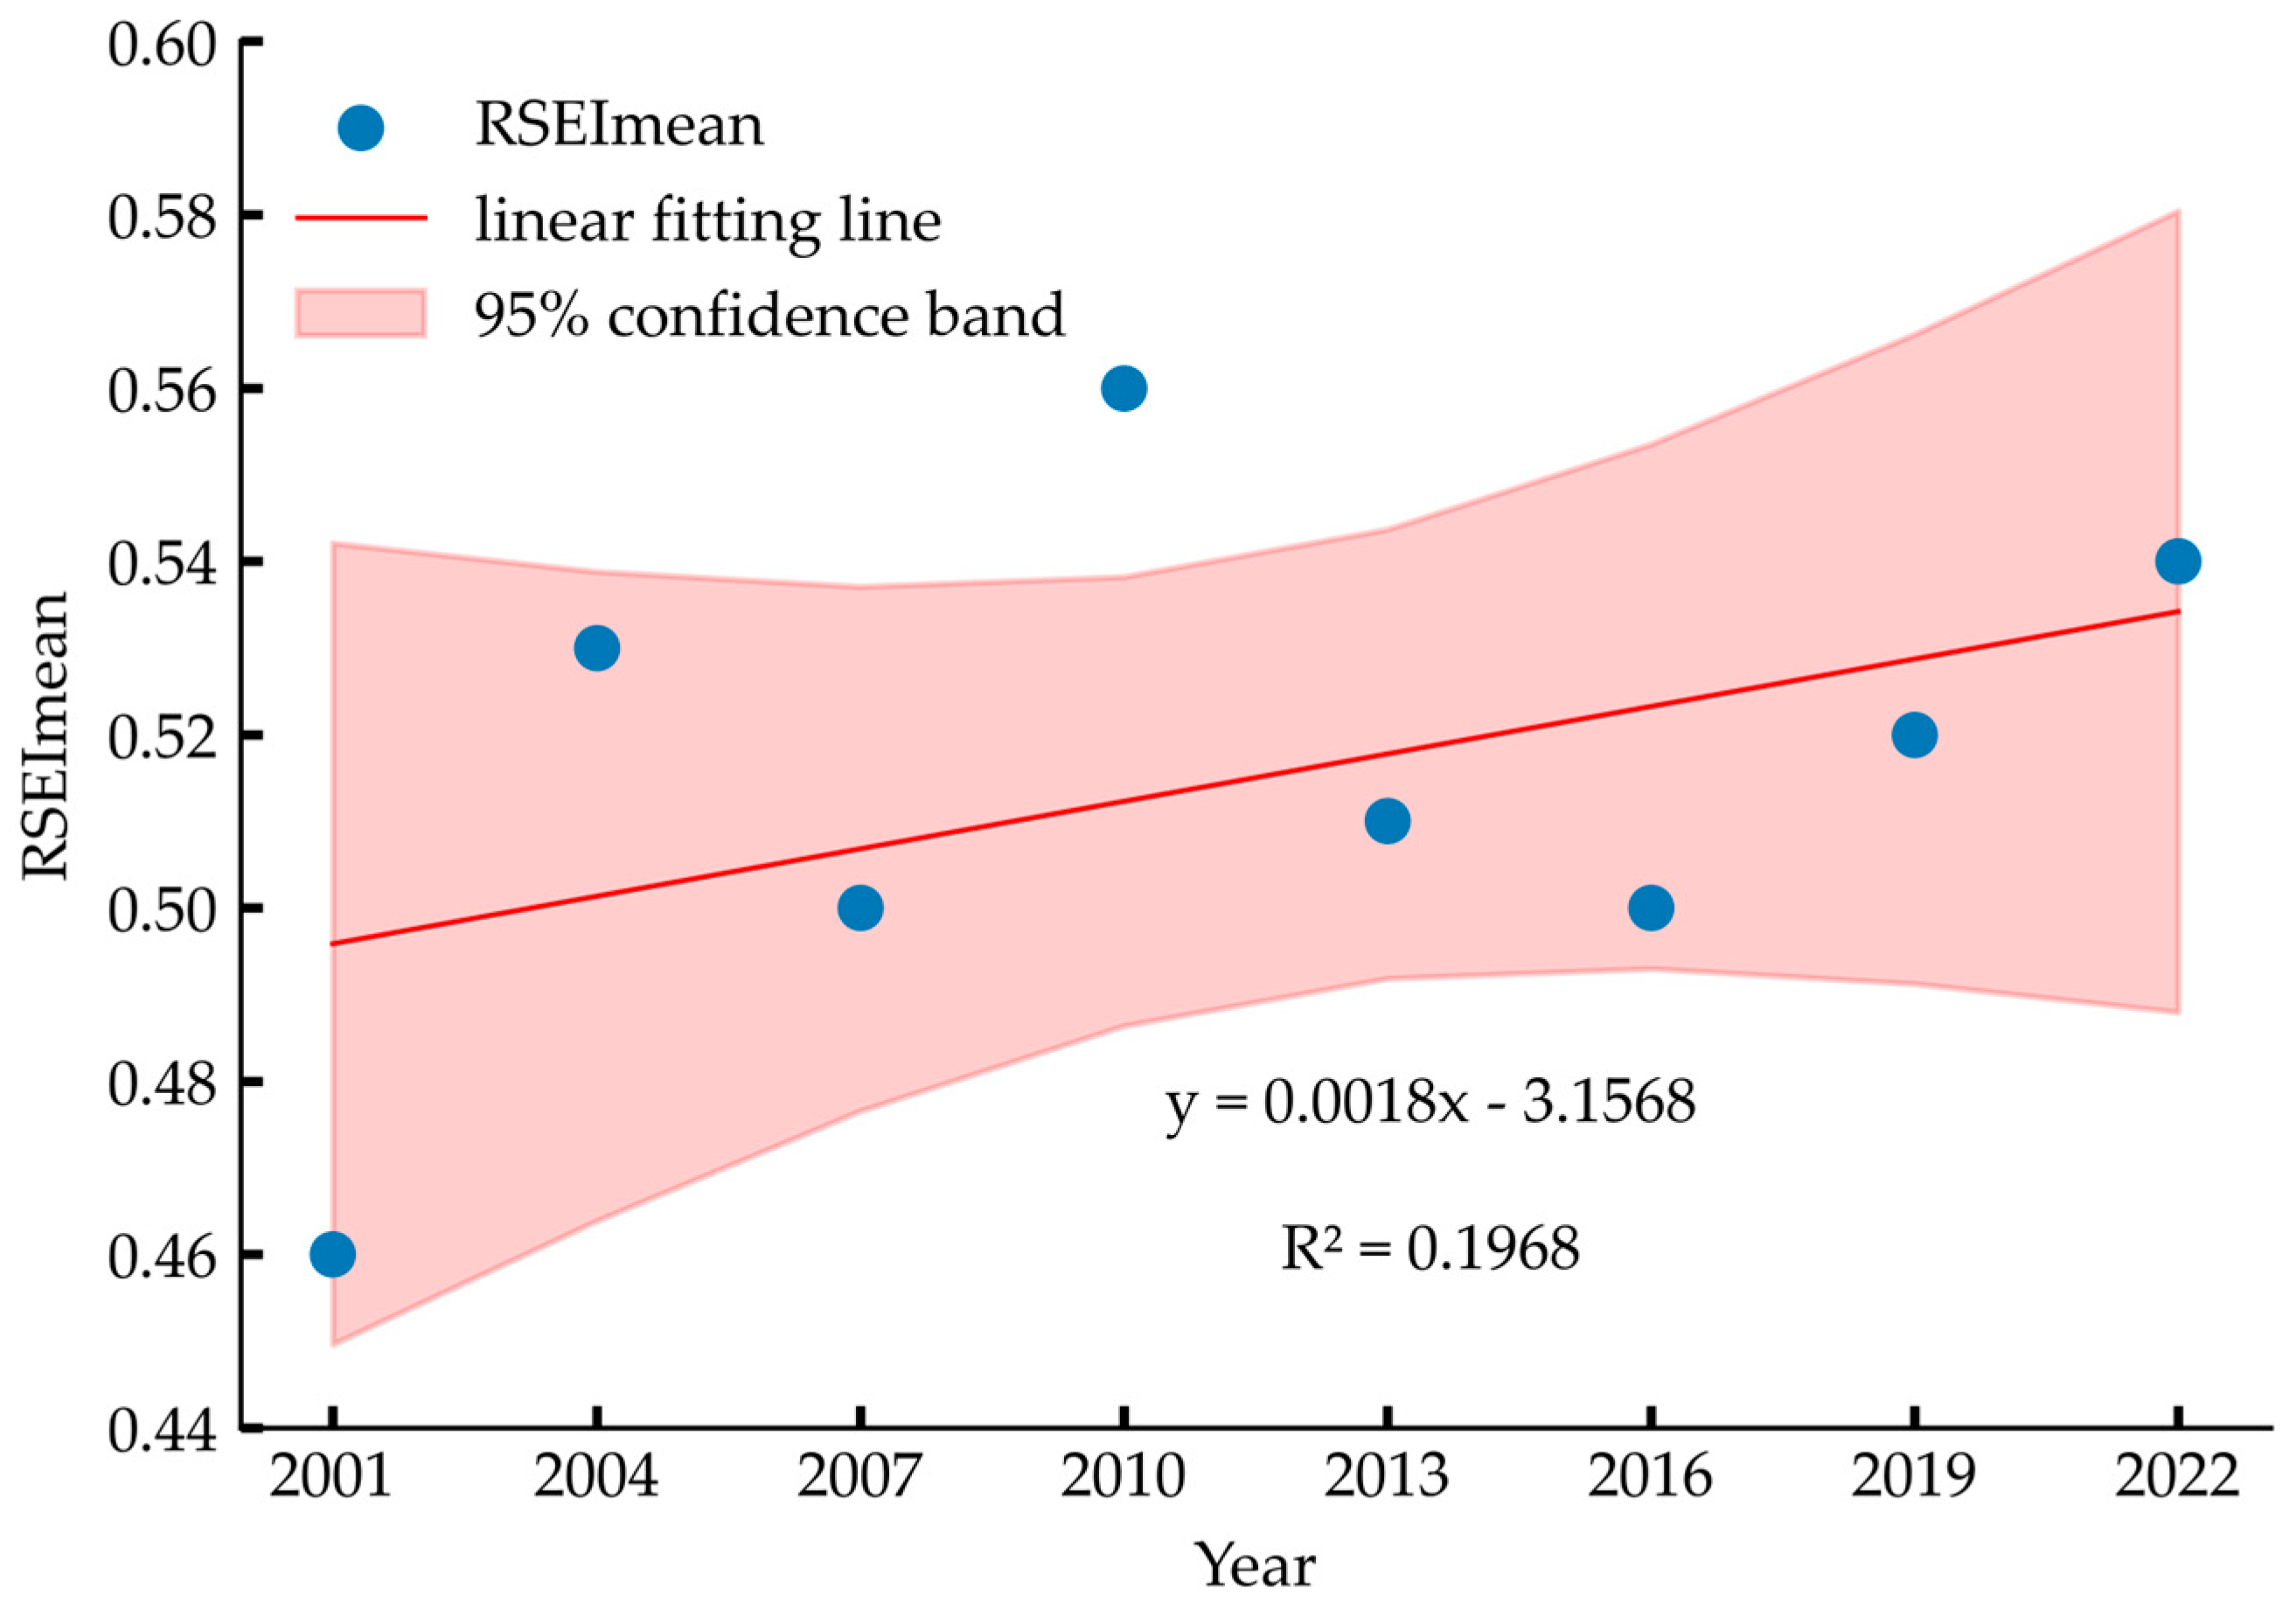
Our analysis reveals a fluctuating upward trend in mean RSEI from 2001 to 2022, which aligns with documented ecological improvements in the region during this period [
11,
12]. This pattern of climate-driven ecological recovery is consistent with observations in other inland lake basins. For instance, studies in Central Asian endorheic basins have similarly identified climatic variability as the primary driver of ecosystem dynamics [
7]. However, unlike the catastrophic and largely irreversible degradation observed in the Aral Sea due to massive water diversion [
7], the QLB demonstrates a recovery trajectory, suggesting that effective conservation policies can mitigate and even reverse ecological degradation when combined with favorable climatic conditions.
Similarly, research on Bosten Lake in Xinjiang has shown fluctuating ecological conditions driven by climate-water resource interactions [
8], but the QLB’s more pronounced recovery trend highlights the effectiveness of targeted conservation measures in alpine environments. However, our long-term monitoring provides novel insights by revealing greater interannual variability than previously reported, illuminating the basin’s complex dynamic response to environmental changes. The observed fluctuations demonstrate strong linkages to key climatic events and policy interventions. Specifically, the 2010 RSEI peak (0.56) resulted from synergistic natural and anthropogenic drivers: optimal hydrothermal conditions created by above-average accumulated temperature and precipitation [
13] coincided with ecological restoration projects initiated in 2008 [
14], collectively achieving a balance between degradation and recovery by 2010 [
15]. Conversely, the 2010–2016 RSEI decline primarily responded to reduced accumulated temperature and precipitation, which lowered vegetation coverage [
13] and revealed the acute sensitivity of plateau ecosystems to hydrothermal variability. The post-2016 recovery was driven by renewed warm-wetting conditions and enhanced conservation measures, including comprehensive ecological governance initiatives [
14].
Spatially, the identified “high in north and south, low in center” pattern corresponds with established vegetation distribution patterns described by Gao [
16], while providing a quantitative, spatially continuous validation using a comprehensive ecological index. This pattern fundamentally reflects the control exerted by the Tibetan Plateau’s vertical zonation laws on EEQ. Higher-grade areas concentrate in alpine meadows on the southern foothills of the Qilian Mountains and northern slopes of the Qinghai South Mountains, where vegetation coverage reaches 65–90% [
17,
18]. Lower-grade areas cluster in lakeside plains, Buha River valley, and western alpine regions, where vegetation becomes sparse due to combined effects of low-temperature constraints and human activities [
19].
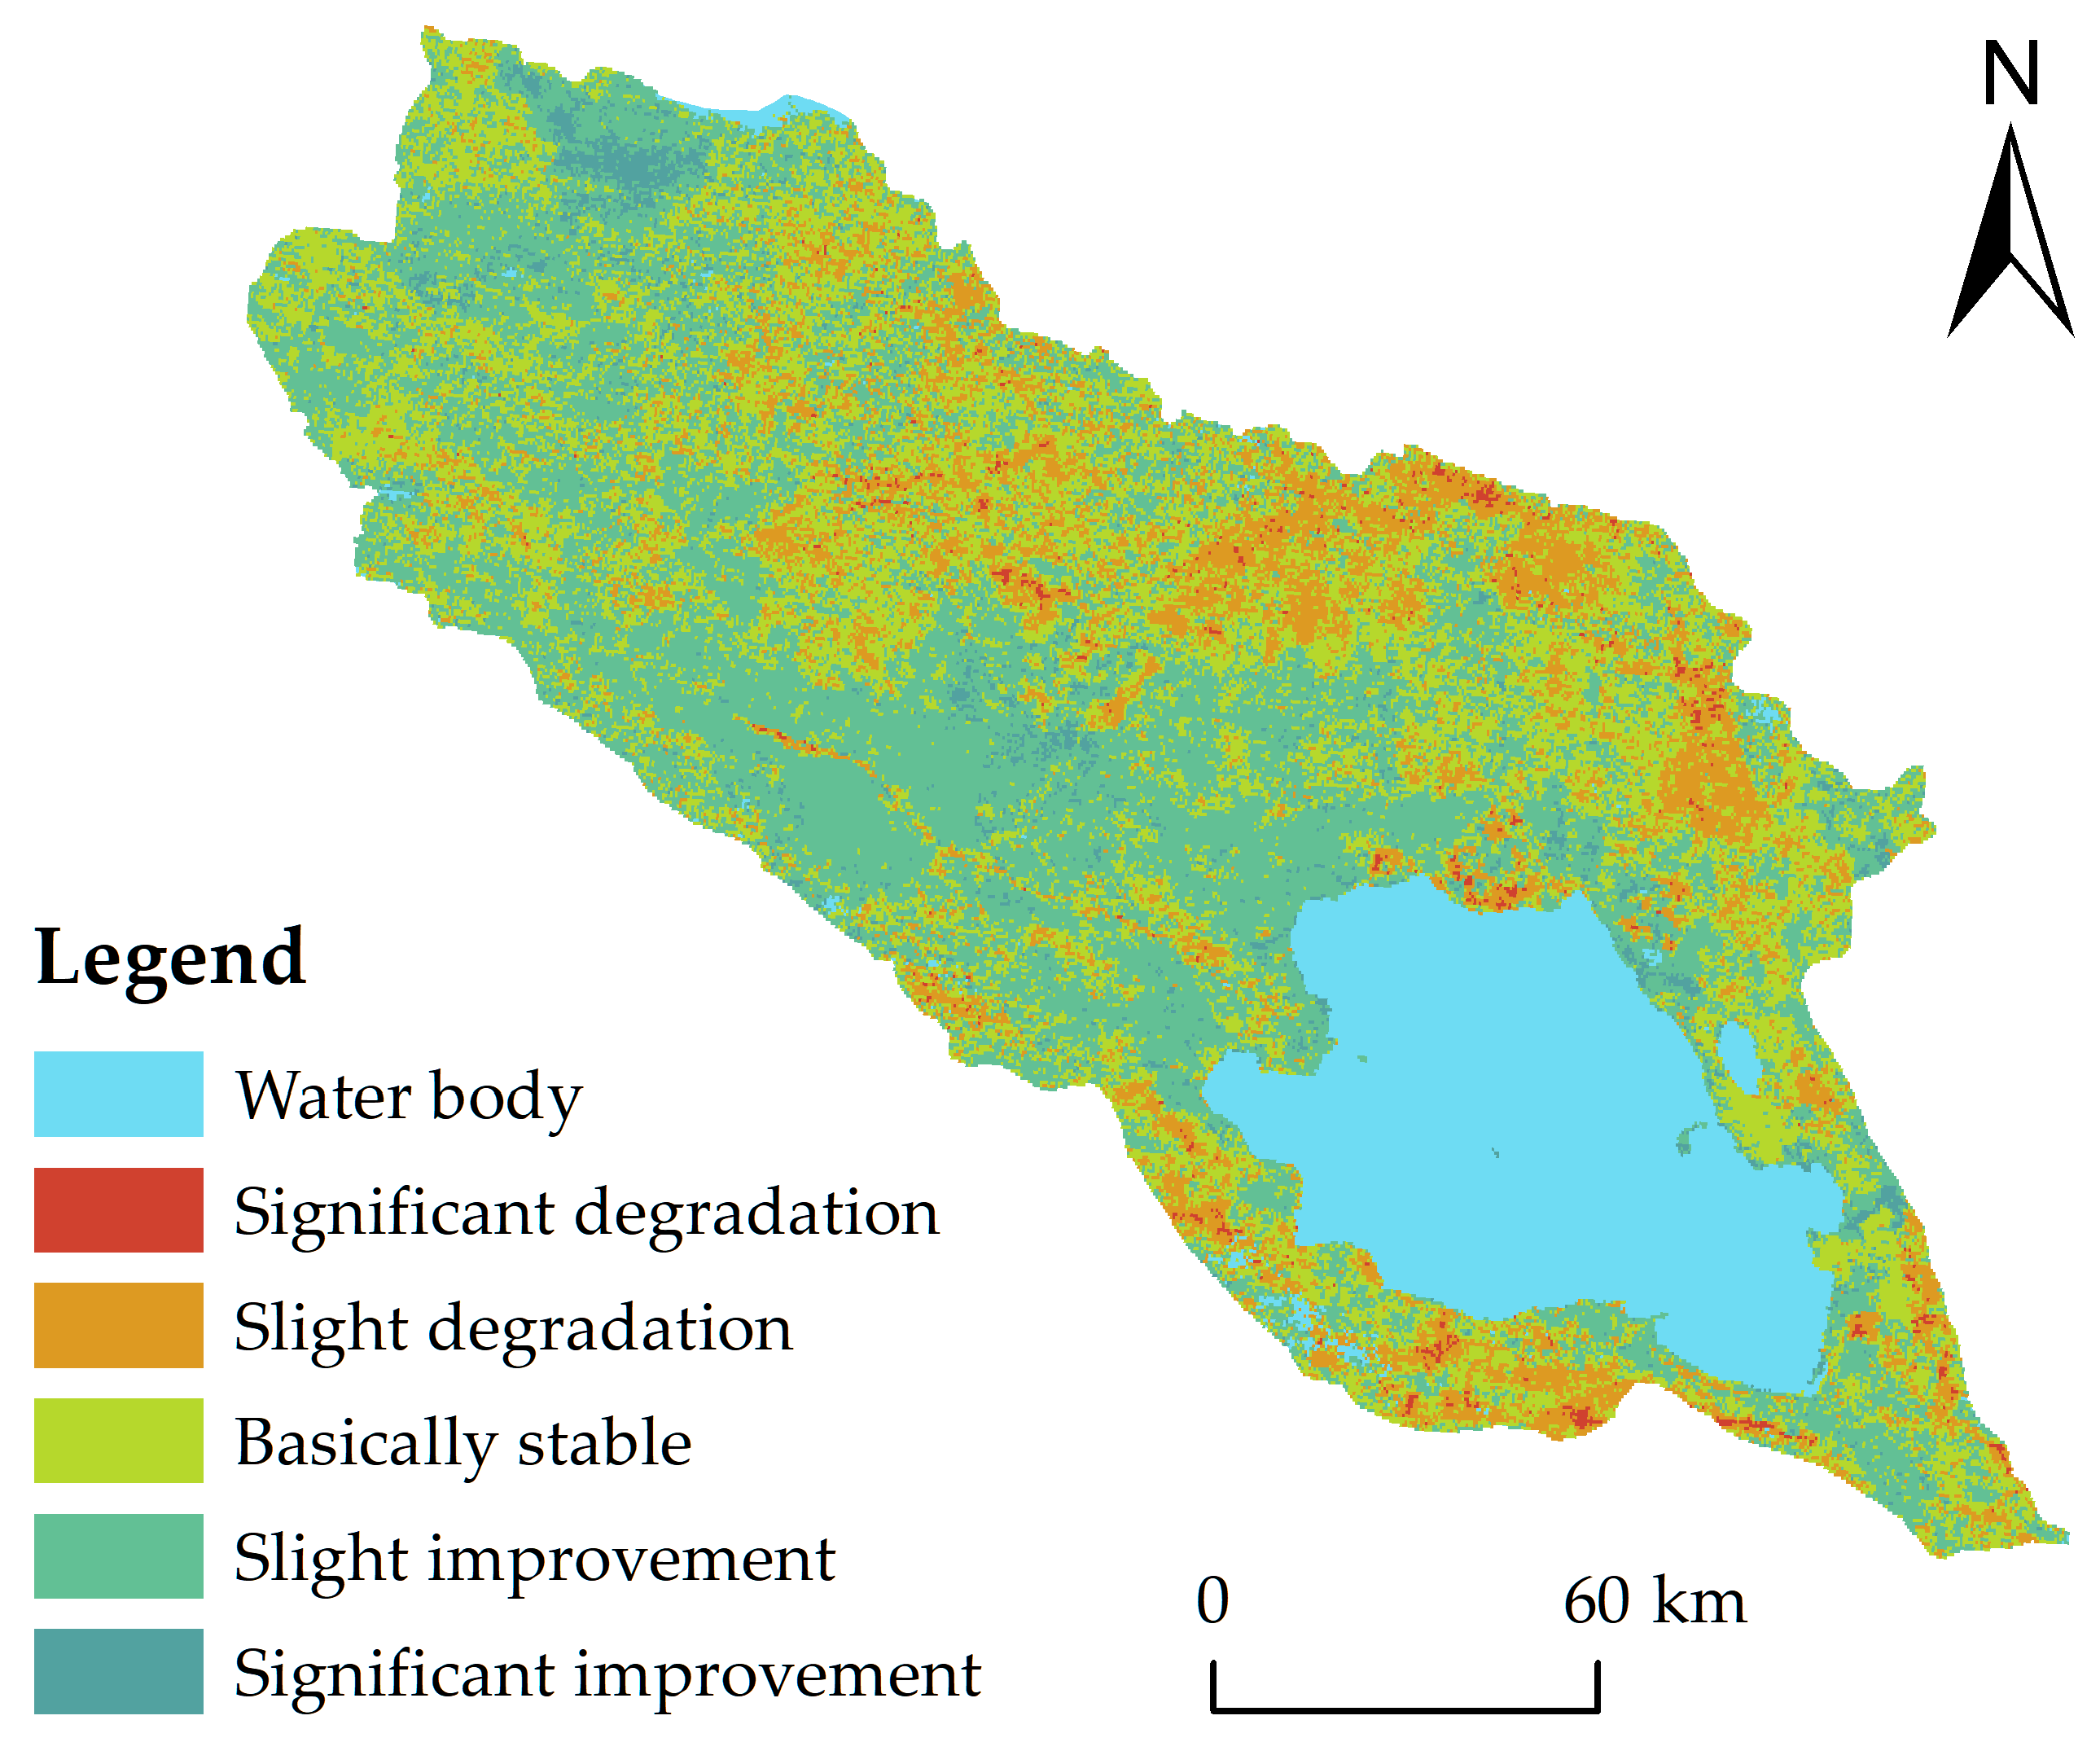
A particularly significant finding emerging from the trend analysis is the clear altitudinal dependence of ecological degradation, with degradation zones concentrating predominantly above 3827 m elevation. This pattern quantitatively demonstrates the vulnerability of high-altitude ecosystems to climate warming impacts including permafrost degradation and glacial retreat [
20], enabling more precise spatial targeting of conservation interventions than previously achievable.
4.3. Driving Mechanisms and Interactive Effects
The GD results provide a quantitative framework for assessing the drivers behind ecological patterns in the QLB. Our finding that natural factors dominate EEQ differentiation, with single-factor explanatory power ranked as temperature (0.340) > elevation (0.332) > precipitation (0.222), confirms the fundamental climate-sensitivity of this alpine ecosystem [
21,
22] and offers new perspective on the relative importance of these factors in similar alpine basin ecosystems. This finding is consistent with studies in other arid and semi-arid inland lake basins, such as research on the Ebinur Lake basin which also identified temperature and precipitation as dominant natural factors controlling vegetation dynamics [
23]. However, our quantitative ranking provides more precise insights into factor importance within alpine basin contexts.
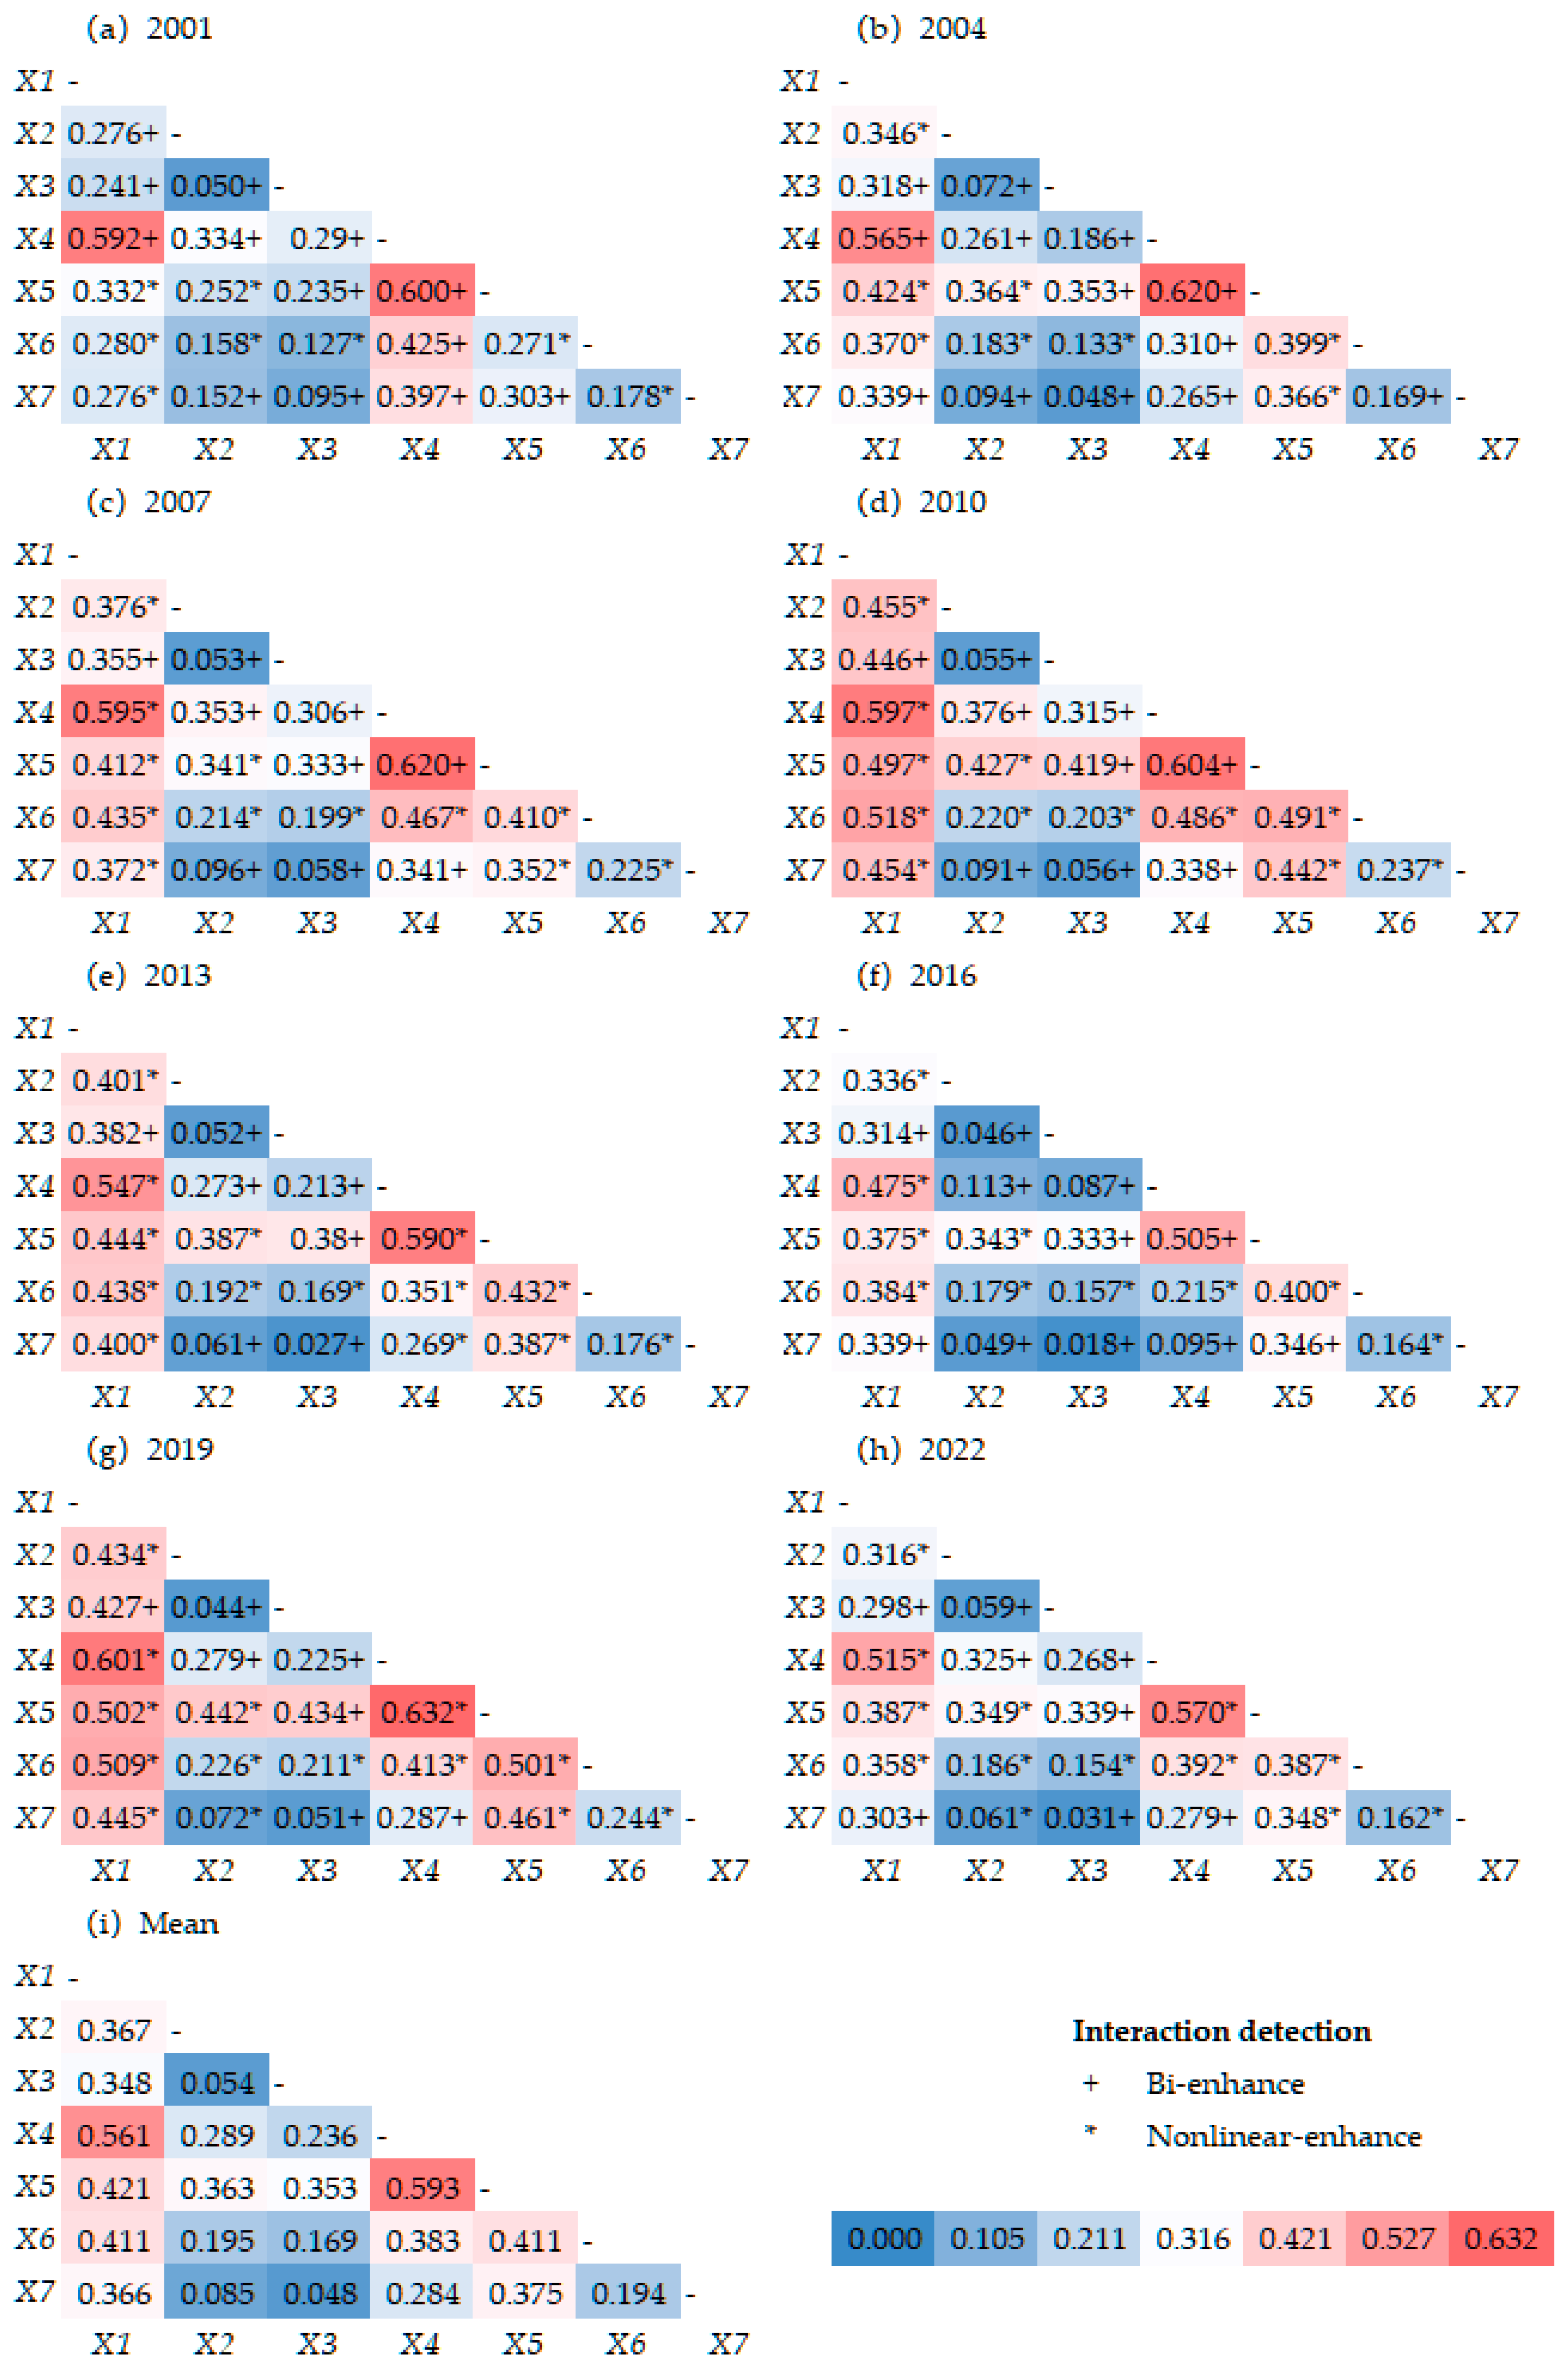
Most significantly, the interaction detection analysis revealed that all factor combinations enhanced the explanatory power for spatial differentiation of EEQ, with two-factor/nonlinear enhancement dominating. The interaction between temperature and precipitation (Temp ∩ Pre) exerted the strongest influence (q = 0.593), exceeding the explanatory power of any single factor. This demonstration of hydrothermal synergy provides a mechanistic understanding of climate-vegetation relationships in alpine regions that advances beyond previous qualitative assessments of these interactions. While hydrothermal interactions have been qualitatively acknowledged in previous inland basin studies [
7,
23], our quantitative demonstration of this synergy (q = 0.593) provides unprecedented mechanistic precision for understanding climate-ecosystem relationships in alpine regions. The precipitation-elevation interaction (mean q = 0.561) demonstrated topography’s dominance over hydrothermal spatial differentiation, where orographic barriers and uplift effects of the Qilian Mountains drive marked precipitation heterogeneity [
24], directly shaping vegetation gradients from high-altitude high-rainfall zones to low-altitude low-rainfall belts.
Notably, the detected increasing interactive effects between land use and climatic factors suggest growing ecosystem sensitivity to human activities under changing climatic conditions. This finding contrasts with heavily human-impacted systems like the Aral Sea where anthropogenic factors dominated [
7], highlighting the QLB’s transitional status where natural factors still predominate but human influence is intensifying. This nuanced relationship, not previously quantified for the QLB, carries critical implications for adaptive management of agro-pastoral systems in alpine regions, as improper practices in vulnerable high-altitude regions can cause severe degradation manifested as grassland deterioration and intensified desertification [
6].
4.4. Implications for Ecological Management
The findings of this study provide a more precise scientific basis and decision-making support for ecological management in the QLB. The precise mapping of spatiotemporal trends in EEQ enables, for the first time at the watershed scale, spatially explicit identification of priority areas for intervention, particularly the alpine degradation-sensitive zones above 3827 m. The quantitative analysis of driving mechanisms, especially the revelation of interaction effects between factors, establishes a mechanistic foundation for formulating differentiated and targeted management strategies.
Based on our results, corresponding governance paradigms can be proposed for different regional characteristics: alpine ecological degradation-sensitive areas (>3827 m) should focus on adaptive conservation, implementing measures such as grazing exclusion fencing and alpine meadow ecosystem restoration to enhance ecosystem resilience and mitigate secondary degradation caused by permafrost thawing; human-nature coupled areas in mid-low altitude regions (e.g., lakeside plains, river valleys) require regulatory governance, strictly enforcing the grassland-livestock balance system, scientifically determining carrying capacity, and optimizing agricultural and pastoral spatial layout to prevent human activities from exacerbating the negative impacts of climate change; areas with high ecological quality dominated by hydrothermal synergy should implement preventive conservation to avoid disruption of their natural state by development activities.
This spatially explicit governance approach, built upon previous research [
3,
4,
5,
6,
9,
10] and enhanced through deepened mechanistic understanding and improved spatial precision, significantly advances the comprehension of watershed ecological processes. It facilitates a shift from “single-element management” to “systematic comprehensive governance” and from “experience-based judgment” to “mechanism-informed guidance.” The quantitative insights provided herein offer a direct and solid scientific basis for implementing differentiated ecological management in the QLB based on ecological sensitivity and divergence in driving mechanisms.
4.5. Limitations and Future Perspectives
This study has systematically revealed the spatiotemporal evolution patterns and driving mechanisms of EEQ in the QLB using long-term remote sensing data and GD methods. However, several limitations warrant consideration in interpreting these findings. The MODIS spatial resolution (500 m) may insufficiently capture small-scale ecological heterogeneity, particularly in areas of complex topography or dispersed human settlements. The 22-year study period, while substantial, may still be insufficient to identify longer-term ecological trends associated with climate cycles or gradual vegetation community changes. Furthermore, the quantification of human activities through LULC and population density metrics may not fully capture nuanced pressures such as grazing intensity variation.
Future research should address these limitations through several promising directions: multi-source data fusion techniques integrating Landsat/Sentinel-2 imagery with spatiotemporal fusion algorithms could overcome MODIS resolution constraints; extended time-series analysis constructing 40+ year observational sequences since the 1980s would help capture vegetation phase-transition responses to hydrothermal thresholds; mechanistic model optimization incorporating grazing pressure indices, road density, and climate extremity metrics—combined with random forest/structural equation modeling—could quantify nonlinear interactions and time-lag effects, ultimately building an integrated “climate-topography-anthropogenic” driving framework to enhance our understanding of ecosystem dynamics in this fragile alpine region.
5. Conclusions
This study systematically investigated the spatiotemporal characteristics and driving mechanisms of EEQ in the QLB from 2001 to 2022 using an integrated approach combining GEE, the RSEI, and GD analysis. The main conclusions are as follows:
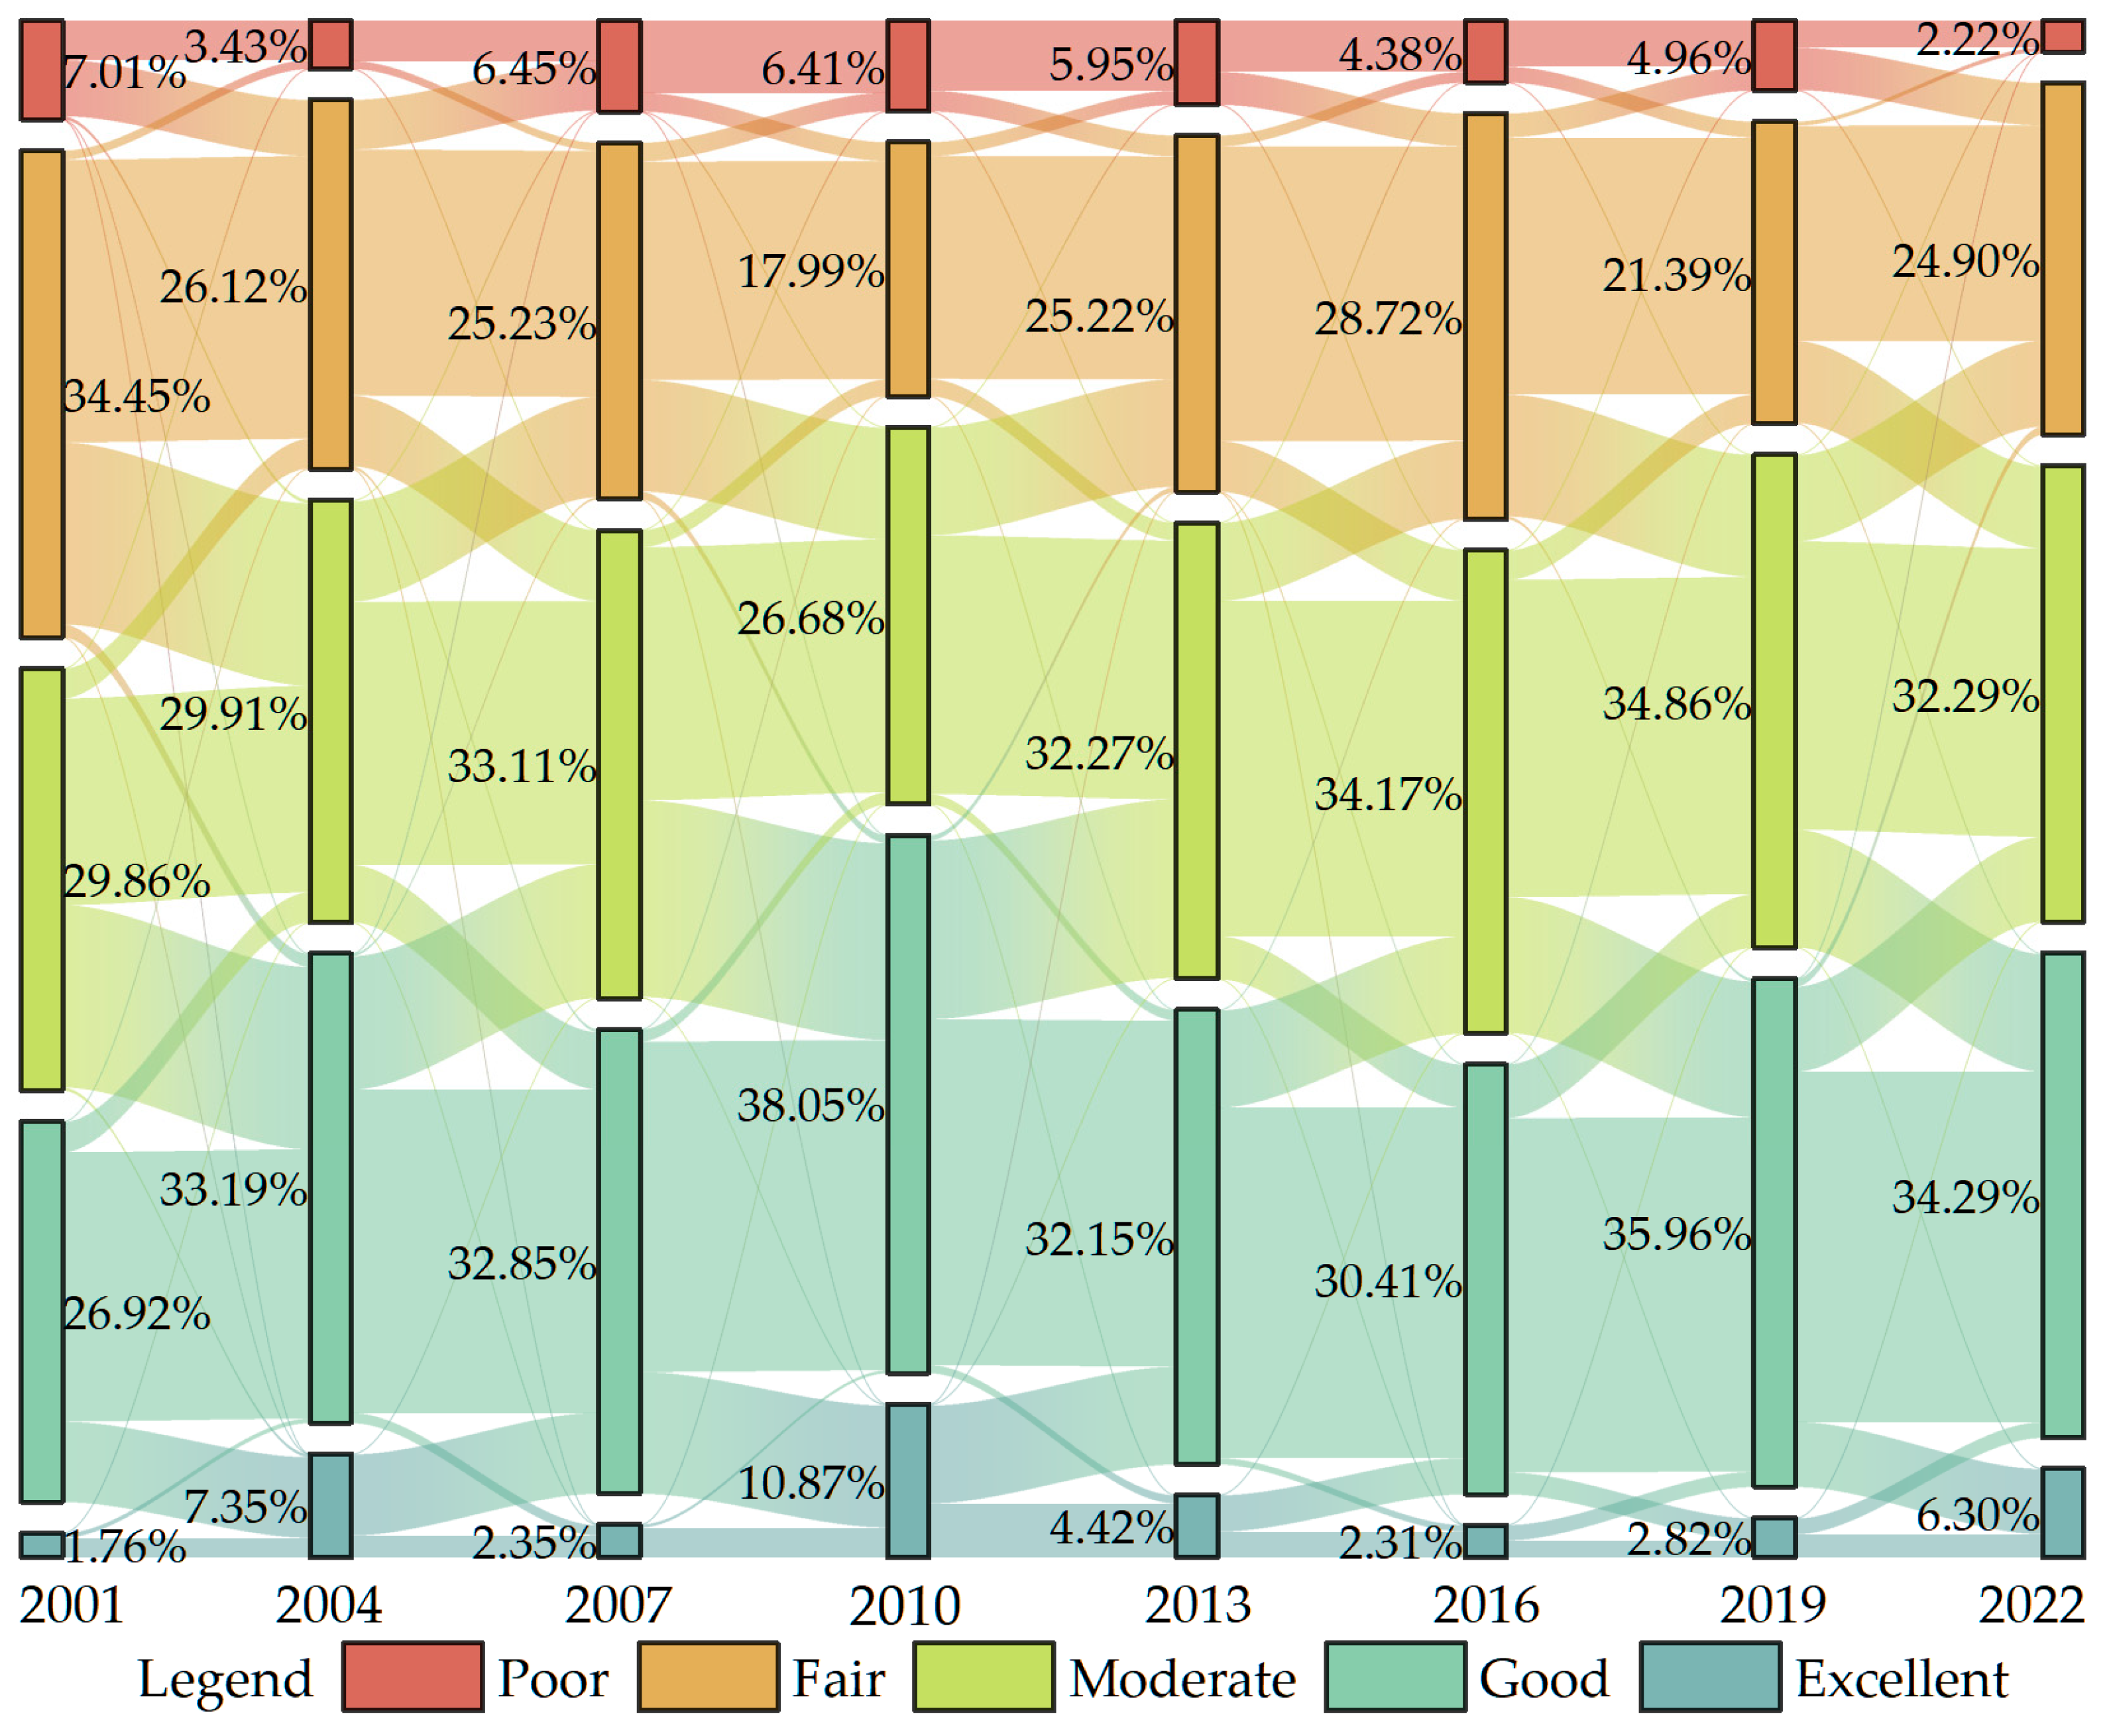
Over the 22-year study period, the basin’s EEQ exhibited a fluctuating but overall improving trend. The mean RSEI value increased from 0.46 to 0.51, while the basin underwent substantial ecological quality transitions characterized by a clear reduction in low-grade areas (from 41.46% to 27.12%) and expansion of high-grade areas (from 28.68% to 40.59%).
Spatially, EEQ displayed a consistent “high-north-south, low-center” distribution pattern. High-quality areas were predominantly distributed in the southern slopes of the Qilian Mountains and northern slopes of the Qinghai South Mountains, while low-quality areas were mainly concentrated in the Qinghai Lake lakeside plains, Buha River valley, and western alpine regions.
Trend analysis revealed that improvement areas (47.81%) significantly exceeded degradation areas (16.34%) across the basin. The spatial distribution of degradation zones showed distinct altitude dependence, with degradation concentrating predominantly in high-altitude areas.
GD analysis quantified the dominant role of natural factors in driving EEQ differentiation. Temperature (Temp, q = 0.340) and elevation (DEM, q = 0.332) exhibited the strongest explanatory power among individual factors. Most significantly, factor interaction analysis revealed that the temperature–precipitation (Temp ∩ Pre) interaction (q = 0.593) exerted the strongest influence on ecological patterns, demonstrating the crucial role of hydrothermal synergy in controlling alpine ecosystem dynamics.
This research provides a robust framework for long-term ecological monitoring in alpine regions and offers scientific support for spatially targeted ecological management. The findings highlight the importance of considering both individual and interactive effects of environmental factors in developing effective conservation strategies for fragile alpine ecosystems.
