Article

From Policy to Practice: Assessing Carbon Storage in Fujian Province Using Patch-Generating Land Use Simulation and Integrated Valuation of Ecosystem Services and Tradeoffs Models

College of Computer and Information Engineering, Xiamen University of Technology, Xiamen 361024, China
*
Author to whom correspondence should be addressed.
Land 2025, 14(1), 179; https://doi.org/10.3390/land14010179
Submission received: 28 November 2024 / Revised: 5 January 2025 / Accepted: 14 January 2025 / Published: 16 January 2025

Abstract

:
Simulating and predicting carbon storage under different development scenarios is crucial for formulating effective carbon management strategies and achieving carbon neutrality goals. However, studies that focus on specific regions and incorporate local policy context require further investigation. Taking Fujian Province as a case study, this research developed four policy-driven scenarios—natural development, farmland protection, urban development, and ecological protection—based on local policy frameworks. Using the PLUS (Patch-generating Land Use Simulation) and InVEST (Integrated Valuation of Ecosystem Services and Tradeoffs) models, the study simulated and predicted the carbon storage dynamics under each scenario. The results show that carbon storage declined from 1995 to 2020, mainly due to the conversion of forests and agricultural land into construction areas. The ecological protection scenario demonstrated the highest potential for carbon storage recovery, projecting an increase to 2.02 billion tons by 2030, driven by afforestation and conservation initiatives. Conversely, the urban development scenario posed the greatest risks, leading to substantial losses. Key conservation areas, including 12 priority districts, were identified in the western and northwestern regions, while coastal urban areas, comprising 31 vulnerable districts, face significant carbon storage losses. These findings emphasize the need for balanced land use policies that prioritize both urban development and ecological protection to achieve sustainable carbon management.

1. Introduction

The growing urgency to mitigate climate change has elevated the importance of understanding carbon storage dynamics across varying spatial and temporal scales. Globally, the transition toward carbon neutrality has become a central policy focus, with the Paris Agreement setting targets for reducing greenhouse gas emissions and enhancing carbon sinks [1]. Ecosystem carbon storage plays a critical role in achieving these objectives [2,3], with forests, wetlands, and grasslands identified as critical carbon sinks. In contrast, urbanization and land use changes are major drivers of carbon storage loss [4,5]. Against this backdrop, accurately simulating and predicting carbon storage under various policy scenarios has become a pivotal tool for formulating evidence-based strategies to balance economic growth with ecological preservation [6]. China, as one of the world’s largest emitters of carbon dioxide, has committed to peaking carbon emissions by 2030 and achieving carbon neutrality by 2060. This “dual carbon” goal underscores the country’s efforts to transition toward sustainable development, with a strong emphasis on integrating ecological conservation into regional planning frameworks [7]. These efforts align with the broader global push for carbon neutrality but also highlight the unique challenges and opportunities in balancing development and conservation in a rapidly growing economy [8].
The factors influencing carbon storage are inherently complex, with a range of drivers altering land cover types and, consequently, affecting the distribution of carbon storage. As a result, land use change serves as a primary driver of the spatiotemporal variability in carbon storage. Given this, future land use simulation forms a critical foundation for predicting carbon storage dynamics. Both climate change and socio-economic development play significant roles in driving land use/cover change (LUCC). This has led to the widespread use of SSP-RCP (shared socio-economic pathway–representative concentration pathway) scenarios [9] to model land use demand. For example, Li et al. [10] utilized these scenarios to predict changes in land use demand in Central Asia. However, such approaches are more effective at macro scales (e.g., national or global levels), with limited applicability at smaller, localized scales. In contrast, system dynamics (SD) models offer greater effectiveness in simulating land use demand changes at the urban level across multiple scenarios [11]. Models such as Logistic-CA [12], ANN-CA [13], CLUE-S [14], CLUMondo [15], and FLUS [16] have been widely applied in this context. Nevertheless, these models tend to be less adept at identifying the specific factors driving LUCC and lack the capacity to simulate the dynamic, spatiotemporal evolution of multiple land use patches, particularly for natural land cover types. The recently developed PLUS (Patch-generating Land Use Simulation) model [17], which integrates the random forest (RF) algorithm [18], offers a more sophisticated method for evaluating the growth potential of various land use types. This, in turn, allows for more accurate simulations of land use spatial distribution and its associated impact on carbon storage.
Recent years have witnessed an increasing number of studies focusing on the simulation and prediction of future carbon storage under various development scenarios [19,20,21,22,23,24,25,26,27,28,29]. The scenarios employed are primarily derived from extensive scientific research and data analysis related to socio-economic development pathways, environmental protection policies, land use/cover change, and carbon emission management policies. For instance, socio-economic development pathways combined with future climate change data are used to predict changes in carbon storage under different climate conditions. This approach helps assess the long-term impact of climate change on carbon storage. Moreover, environmental protection policies, such as afforestation, forest conservation, and wetland restoration, can significantly enhance carbon storage [25]. In parallel, land use policies, encompassing agricultural policies, urban planning, and land management strategies directly affect carbon storage levels [21,26]. Additionally, carbon emission management policies, including carbon taxes, carbon trading, and the promotion of low-carbon technologies, exert a significant indirect influence on carbon storage [27,28]. Despite significant progress in the simulation and prediction of carbon storage, the development scenarios currently employed are often characterized by their broad, macro-level applicability, which may not be sufficiently tailored to specific study areas. There is a need for greater consideration of localized development scenarios that integrate local development plans and context-dependent variables. Therefore, studies that focus on specific regions and incorporate local policy contexts warrant further investigation.
Setting up different scenarios based on varying local policies is a more scientific approach to exploring future carbon storage, providing valuable information for future urban planning. Although some regions have developed detailed ecological protection and land use plans, these policies are often inadequately represented in the models, reflecting an insufficient consideration of the regional policy context. This gap highlights the need for more context-specific research. Furthermore, the application of future planning policies, such as urban expansion plans and ecological restoration projects, in models can lead to more accurate predictions of future carbon storage changes. By integrating these planning policies into the models, researchers can better anticipate the effects of policy decisions on carbon storage, thereby providing more precise and actionable insights for urban and regional planning. Fujian Province, located on the southeastern coast of China, boasts rich forest resources and diverse ecosystems, making it a crucial ecological barrier and carbon sink region in China. However, with rapid economic development and accelerating urbanization, Fujian Province faces ecological and environmental challenges brought about by land use changes. In recent years, with the release of the “Fujian Provincial Territorial Spatial Planning (2021–2035)” and the “Fujian Provincial Ecological Restoration Plan (2021–2035)”, there has been a pressing need to conduct policy-driven carbon storage simulations in this region, characterized by its unique ecological environment and economic background. Such simulations aim to scientifically evaluate and predict the impact of different policy scenarios on carbon storage.
Therefore, this study aims to establish multiple policy-driven scenarios based on Fujian Province’s regional policy documents and employ a combination of the Markov model, PLUS model, and InVEST (Integrated Valuation of Ecosystem Services and Tradeoffs) model to simulate and predict land use changes and carbon storage variations under different scenarios. The study seeks to quantify the impact of various policy measures on carbon storage and propose policy recommendations for optimizing land use and ecological protection. The specific research objectives are as follows: (1) to characterize the spatiotemporal evolution of carbon storage in Fujian Province over a long time series; (2) to simulate and predict the spatiotemporal changes in carbon storage under different future scenarios driven by regional policies; (3) to identify regional differences in carbon storage and key protection areas under various future scenarios.

2. Materials and Methods

2.1. Study Area

Fujian Province is located on the southeastern coast of China, between latitudes 23°33′ N and 28°20′ N and longitudes 115°50′ E and 120°40′ E. The province features a diverse topography, with 80% of its land area covered by mountains and hills. This varied landscape is further enriched by a subtropical monsoon climate, characterized by average annual temperatures ranging from 17 °C to 21 °C and annual precipitation between 1400 mm and 2000 mm, which supports rich forest resources and diverse ecosystems. Designated as an ecological civilization pilot zone, Fujian emphasizes its commitment to sustainable development and ecological conservation. However, the province has also experienced rapid economic development and urbanization, leading to significant land use changes and environmental pressures. This unique combination of natural richness and developmental challenges makes Fujian an ideal case study for evaluating and predicting the impact of regional policies on carbon storage. The insights gained from this study will aid in optimizing land use planning and promoting sustainable development both locally and in similar regions globally.

2.2. Data

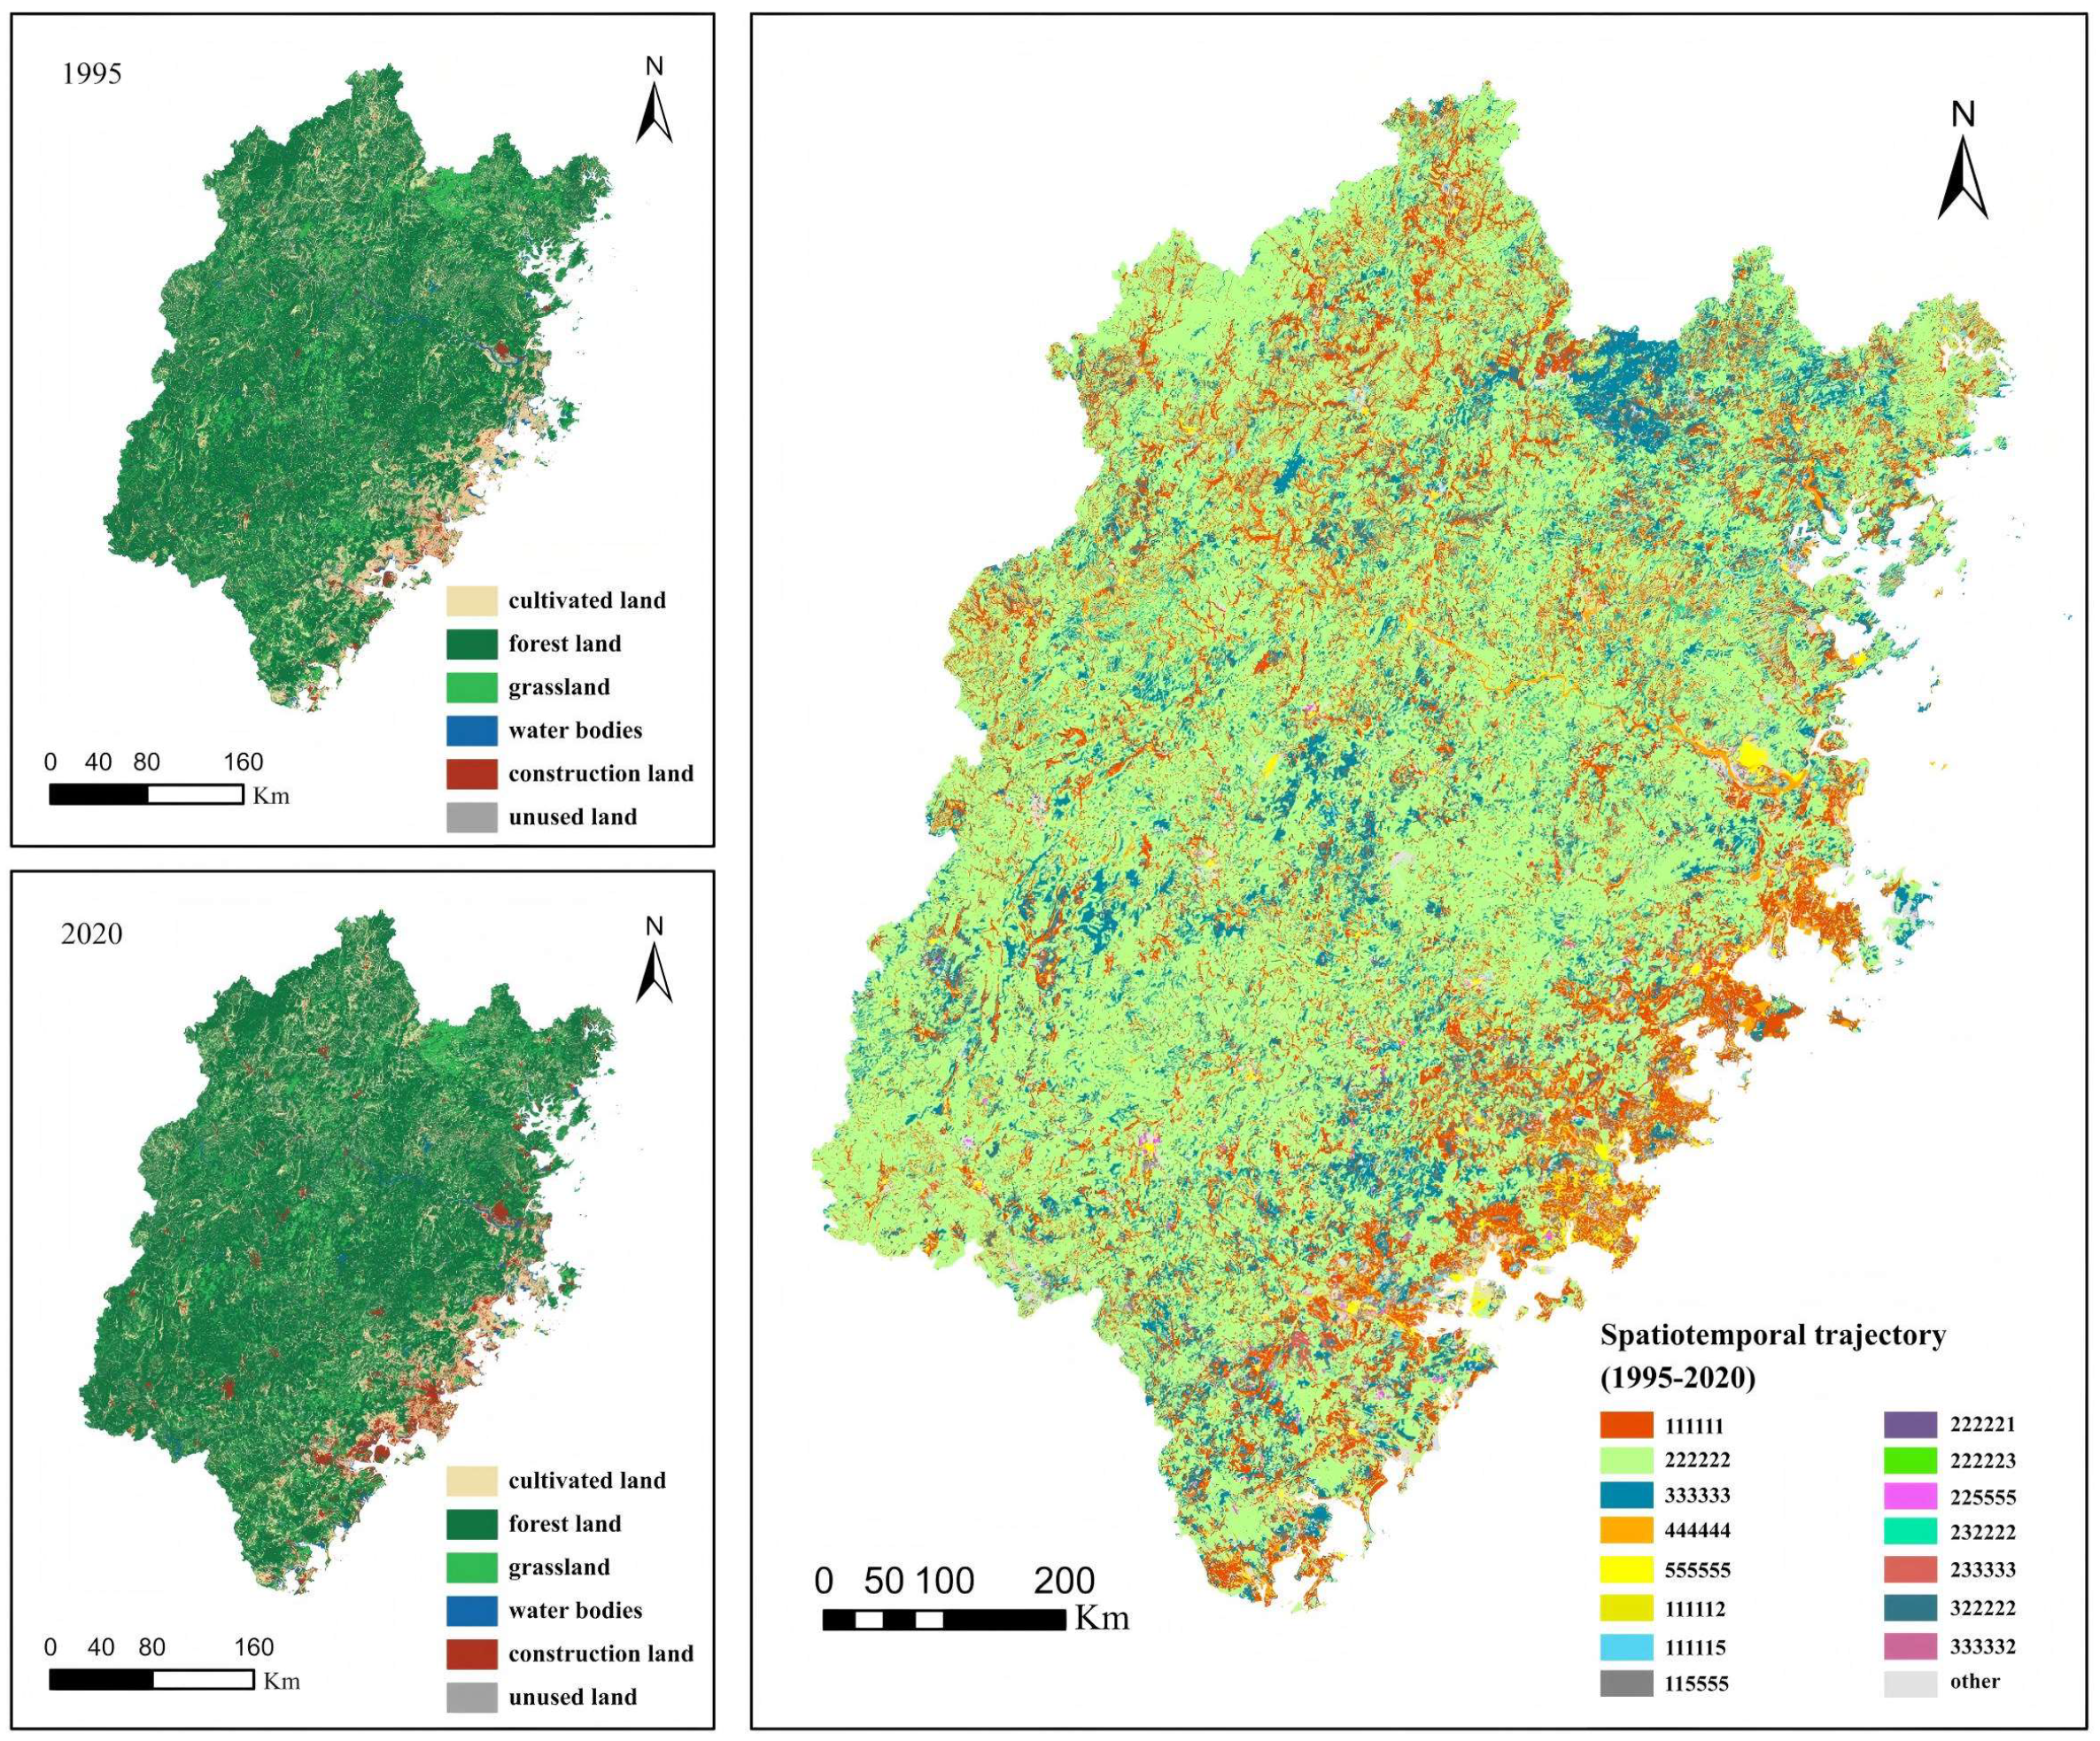
Land use and land cover classification data for the years 1995, 2000, 2005, 2010, 2015, and 2020 were obtained from the China Multi-Period Land Use Remote Sensing Monitoring Dataset (CNLUCC), developed by Xu Xinliang’s team at the Data Center for Resource and Environmental Sciences (RESDC), Chinese Academy of Sciences (https://www.resdc.cn/, accessed on 10 February 2023). The CNLUCC is primarily based on Landsat remote sensing imagery, and it was constructed through manual visual interpretation to create a national-scale multi-temporal land use/land cover database for China. This dataset, with a spatial resolution of 30 × 30 m, was initially categorized into 25 land cover types. For the purposes of this study, these were reclassified into six main categories: cultivated land, forest land, grassland, water bodies, construction land, and unused land. The datasets are reported to have an overall accuracy greater than 90% [30].
Meteorological data, including annual precipitation and average temperature, were sourced from the Annual Spatial Interpolation Dataset of Meteorological Elements in China, also prepared by Xu Xinliang’s team at RESDC (https://www.resdc.cn/, accessed on 10 February 2023). Topographic data, such as elevation, slope, and aspect, were derived from the GDEMV3 series (https://www.gscloud.cn/home, accessed on 10 February 2023). Information on administrative boundaries, roads, and rivers was extracted from the National Geographic Information Resources Directory Service System (https://www.webmap.cn/main.do?method=index, accessed on 15 February 2023). Economic indicators, such as GDP and population data, were gathered from the Statistical Yearbook of the Fujian Provincial Bureau of Statistics (https://tjj.fujian.gov.cn/, accessed on 15 February 2023). The datasets used in this study have been rigorously verified and validated through extensive scholarly research [31].

2.3. Scenario Settings Based on Local Policies

The historical land use transfer matrix from 2010 to 2020, in conjunction with the “Fujian Provincial Territorial Spatial Planning (2021–2035)” and the “Fujian Provincial Ecological Restoration Plan (2021–2035)”, serves as the foundation for this analysis. These local policies, which outline the key strategic directions for land use and ecological protection in Fujian, are used as the guiding principles and constraints for scenario development. Based on these policy documents, four scenarios are established to predict the spatial pattern of land use in Fujian Province by 2030: natural development scenario (ND), farmland protection scenario (FP), urban development scenario (UD), ecological protection scenario (EP) (Table 1).
The development of these scenarios is deeply rooted in the regional policy documents of Fujian Province. Each scenario is designed to reflect the goals and directives of the Fujian Provincial Territorial Spatial Planning (2021–2035) and the Fujian Provincial Ecological Restoration Plan (2021–2035). The policy-driven factors were incorporated into the PLUS model to simulate land use changes. For example, the FP scenario was specifically developed to reflect the “farmland red line” policy, which restricts the conversion of agricultural land to construction land. This is achieved by reducing the probability of farmland being converted by 60%, ensuring that farmland preservation is prioritized. The UD scenario reflects Fujian’s policy to promote urbanization and industrial growth, which is modeled by increasing the likelihood of land use conversion from farmland, forest, and grassland to construction land. The increased urbanization is in line with the strategic directions laid out in the Fujian Provincial Territorial Spatial Planning. The EP scenario was modeled to enhance ecological protection, which is a core goal of the Fujian Provincial Ecological Restoration Plan. This scenario simulates a 30% reduction in the probability of farmland and forest land being converted to construction land, in line with the policy’s commitment to ecological restoration.
Each scenario was carefully tailored to reflect local policies, ensuring that the simulated outcomes are both realistic and representative of the policy goals set for 2030. The use of the PLUS model allows us to incorporate these policy constraints into a spatial simulation, ensuring that the predicted land use changes are not only scientifically grounded but also aligned with the policy vision of Fujian Province.

2.4. PLUS Model

To simulate future land use changes, the PLUS model integrates a rule-mining framework based on LEAS and a cellular automata (CA) module that utilizes multi-type random patch seeds (CARS). In this study, the LEAS module is first used to extract land expansion data for the study area from 2010 to 2020. Following this, the random forest algorithm is employed to determine the development probabilities for various land types and to assess the contributions of driving factors to land expansion. Specifically, from the natural, social, and economic dimensions, ten driving factors—elevation, slope, aspect, annual precipitation, average annual temperature, distance to rivers, distance to highways, distance to railways, population density, and GDP—are employed to compute the occurrence probabilities of six land use types. These probabilities are then incorporated into the CARS module, which combines random seed generation with a threshold decline mechanism. By utilizing neighborhood weights and a cost matrix as constraints, the CARS module effectively simulates future land use, ensuring a realistic and dynamic representation of spatial changes. For this study, we set neighborhood weights of cultivated land, forest land, grassland, water, construction land, and unused land as 0.01, 0.08, 0.48, 0.52, 1, and 0.4, respectively. The cost matrix in different simulation scenarios is shown in Table 2. Assuming the CARS model’s accuracy is robust, different development scenarios are then established to forecast the future land use pattern in Fujian Province for the year 2030 using 2020 as the baseline.
To evaluate the simulation performance and accuracy of the PLUS model for predicting future land use, this study utilized land use data from Fujian Province for the years 2000 and 2010. By employing the PLUS model, we simulated the land use of Fujian Province for the year 2020. The simulated results were then compared with the actual land use data for 2020. The comparison revealed a model accuracy of 0.948 and a kappa coefficient of 0.908, demonstrating that the PLUS model possesses high accuracy in predicting future land use in Fujian Province, thus confirming the reliability of the simulation results.

2.5. InVEST Model Carbon Module

This study employs the carbon module of the InVEST model to compute the spatiotemporal distribution of carbon storage in Fujian Province across different years. Carbon storage in terrestrial ecosystems is typically classified into four primary sinks: aboveground biomass, belowground biomass, soil, and dead organic matter. The total carbon storage in the study area is the sum of these four components. The carbon storage for each type is calculated by multiplying the area of each land use type by the corresponding average carbon density for each sink.
Carbon density data are mainly sourced from the existing literature pertaining to the study area or nearby regions, with a preference for field-collected data. Earlier research has established a significant positive correlation between vegetation and soil carbon density changes with annual precipitation, and a weaker correlation with average annual temperature. This study uses national and Fujian Province annual precipitation to calculate the correction coefficient between actual and simulated carbon density. The correction coefficient formula is as follows:
K vp = 6.789 e 0.0054 MAP 1 6.789 e 0.0054 MAP 2
K sp = 3.3968 M A P 1 + 3996.1 3.3968 M A P 2 + 3996.1
K v p and K s p represent the correction coefficient of vegetation biomass and soil carbon density precipitation factor; M A P 1 and M A P 2 denote the annual precipitation of Fujian Province and the whole country, respectively.
Root–shoot ratios for different land use types are obtained from relative references, among which, crop 0.19, forest 0.17–0.36, shrub 0.91, desert 5.5, and grassland 5.2. Using these ratios, the carbon density of aboveground and belowground parts for each land use type can be determined. The carbon density of dead organic matter is estimated to be 10–15% of the aboveground carbon density. Table 3 provides a detailed summary of the carbon density data for the study area.

3. Results

3.1. Spatiotemporal Dynamics of Carbon Storage from 1995 to 2020

3.1.1. Dynamics of Land Use

From 1995 to 2020, the predominant land use types in Fujian Province were forest land, cultivated land, and grassland, collectively accounting for over 90% of the province’s terrestrial area. Forest land, in particular, constituted the largest share, covering approximately 62% of the total land area. Cultivated land followed, consistently occupying more than 16% of the province’s land area throughout the study period. Grassland maintained a steady presence, comprising around 15% of the land area. In terms of spatial distribution (Figure 1), forest land was predominantly situated in the western and central mountainous and hilly regions of Fujian Province. Conversely, grassland exhibited a scattered, spot-like distribution across the entire province. Cultivated land was primarily arranged in a strip-like pattern along the southeastern coastal areas, with occasional patches in the northwestern regions. Additionally, construction land was largely concentrated in the southeastern coastal urban agglomerations, reflecting the region’s urbanization trends. This spatial analysis underscores the significant geographical variations and land use dynamics within Fujian Province over the 25-year period.
Land use changes in Fujian Province during the study period of 1995–2020 have been characterized by a continuous decrease in the areas of cultivated land and forest land, alongside a consistent increase in construction land (Table 4). Specifically, the forest land area decreased from 76,721.98 km2 in 1995 to 75,711.29 km2 in 2020, with the most significant reduction occurring between 2005 and 2010, amounting to a decrease of 419.32 km2. Similarly, the cultivated land area decreased from 22,494.69 km2 in 1995 to 20,596 km2 in 2020, with the largest reduction recorded between 2000 and 2005. Subsequently, the rate of reduction in cultivated land area gradually diminished: 398.08 km2 between 2005 and 2010, 356.83 km2 between 2010 and 2015, and 207.99 km2 between 2015 and 2020. Despite these reductions, the proportion of cultivated land remained stable at over 16% of the province’s total land area throughout the study period. In contrast, the grassland area exhibited minor fluctuations around 18,600 km2, maintaining a steady proportion of approximately 15% of the province’s total land area. Meanwhile, construction land experienced significant expansion, increasing from 2371.54 km2 in 1995 to 5423.09 km2 in 2020, which represents a growth rate of 1.29%. The most substantial increase in construction land occurred between 2000 and 2005, with an expansion of 1200.19 km2. The growth rate of construction land then gradually declined in each subsequent five-year period, with increases of 770.78 km2, 514.72 km2, and 494.96 km2, respectively. These findings underscore the dynamic nature of land use in Fujian Province over the past quarter-century, highlighting the significant reductions in forest and cultivated lands and the concomitant increase in construction land. This trend reflects broader socio-economic developments and urbanization processes within the region.
The Land Use Dynamic Degree Index has been employed to reflect the intensity of changes in a specific land use type over a given period. The formula is as follows:
K = U b U a U a × 1 T × 100 %
where U a and U b represent the area of a specific land use type at time points a and b, respectively. T is the study period (in years). K indicates the dynamic degree of a specific land use type over a certain period.
Over the period from 1995 to 2020, the dynamic degree of land use for forest land in Fujian Province was the smallest, at −0.26, followed closely by grassland and cultivated land, with dynamic degrees of −0.28 and −1.69, respectively. The relatively minor fluctuations in these land types are attributed to their substantial base areas. In stark contrast, the dynamic degree of construction land use has consistently been the highest throughout the years. Notably, between 2000 and 2005, the dynamic degree of construction land use surged to 9.83%. This significant increase underscores the substantial expansion of construction land, which predominantly encroached upon the areas previously designated as cultivated land and forest land. These trends illustrate the aggressive urbanization and development strategies that have been implemented in Fujian Province, leading to a marked shift in land use patterns over the 25-year period.

3.1.2. Dynamics of Carbon Storage

The carbon storage in Fujian Province has exhibited a consistent downward trend, decreasing at an average rate of 0.01 billion tons per year, from 2.042 billion tons in 1995 to 2.017 billion tons in 2020. Significantly, the decade from 2000 to 2010 marked the most pronounced decline in carbon storage, with an accelerated reduction rate of 0.019 billion tons per year. In contrast, post-2010 data reveals a deceleration in this trend, with the rate of decline attenuating to 0.005 billion tons per year, indicating a more gradual reduction of carbon storage in the latter phase of the study period.
The spatial distribution of carbon storage in Fujian Province exhibited significant regional disparities from 1995 to 2020, as illustrated in Figure 2. Notably, carbon storage in the western and northwestern mountainous areas was substantially higher than that in the eastern and southeastern coastal and urban regions. High-value carbon storage areas were predominantly contiguous in the western part of the province. Jian’ou City, which had the highest carbon storage of 72.5355 million tons, accounted for 3.6% of the total carbon storage in Fujian Province. This was followed by Youxi County, Jianyang District, Changting County, and Pucheng County, all located in densely forested and grassland-rich regions of western Fujian. Conversely, low-value carbon storage areas were concentrated in the southeastern coastal urban agglomerations, including Fuzhou, Putian, and the Xiamen–Zhangzhou–Quanzhou region. Taijiang District had the lowest carbon storage at only 52,000 tons, followed by Gulou District, Huli District, Licheng District, and Siming District. These districts, situated in the highly urbanized eastern coastal areas, have a high proportion of construction land, which contributes to their lower carbon storage capacities.
The study employed the natural break method to classify the carbon storage levels across the region, categorizing them into three levels: general, higher, and key protection areas (Figure 2). The key protection areas encompassed the largest proportion of carbon storage, accounting for 94.02% of the total. Areas with higher carbon storage represented 4.44%, while those with general carbon storage comprised 1.54%. The higher and general carbon storage areas were primarily located in the eastern and southeastern part of Fujian Province, particularly in districts with extensive construction land such as Huli District, Siming District, Jimei District, Longwen District, Jinjiang City, Licheng District, and Gulou District.
To elucidate the regions where carbon storage changes occurred over the past 25 years, a differential analysis was performed on the spatial distribution maps of carbon storage for the study years, followed by reclassification into three categories: decrease, stable, and increase (Figure 2). The results revealed that most areas within the study region maintained relatively stable carbon storage from 1995 to 2020. Regions with increased carbon storage were sporadically distributed across Fujian Province, while areas with decreased carbon storage were primarily concentrated in Licheng District, Huli District, Jimei District, Longwen District, and Cangshan District. These areas, characterized by relatively weak carbon sequestration capacities and limited forest and grassland vegetation, have undergone significant urban expansion over the past 25 years. The conversion of cultivated land to urban use has led to a discernible reduction in carbon storage.

3.2. Land Use Scenario Simulations for 2030

3.2.1. Land Use Changes Under Different Scenarios

Under the four projected scenarios for 2030, land use in Fujian Province will continue to be predominantly forest land, followed by cultivated land and grassland (Figure 3). The western region of Fujian will remain extensively covered with forest land, while the southeastern coastal areas will be primarily occupied by cultivated land, construction land, and other land use types. Despite this general distribution pattern, the characteristics of land use changes exhibit significant variability under different development scenarios, reflecting the differential impacts of policy interventions, economic drivers, and environmental conditions on land use dynamics.
Under the natural development scenario for 2030, Fujian Province’s land use types are primarily characterized by a significant increase in construction land and a decrease in unused land and natural ecological land (such as water bodies, cultivated land, grassland, and forest land). Specifically, construction land is projected to increase by 802.39 km2, with a dynamic degree of 14.80%, reflecting the rapid pace of urbanization and infrastructure development, making it the most significant change among all the land types (Figure 3). Conversely, unused land is expected to decrease by 31.23 km2, with a dynamic degree of −29.61%, indicating that previously undeveloped land is being extensively utilized and converted for other purposes. Similarly, water bodies are anticipated to decrease by 110.07 km2, with a dynamic degree of −6.21%, suggesting significant impacts from climate change and human activities on water resources. Cultivated land is forecasted to decrease by 493.90 km2, with a dynamic degree of −2.40%, showing that agricultural land is gradually being replaced by other types, mainly construction land. Grassland and forest land are projected to show slight decreases, with dynamic degrees of −0.32% and −0.14%, respectively, indicating more gradual changes. These changes collectively reflect the driving forces of urbanization and industrialization and their significant impacts on agricultural and natural ecological land. Consequently, future land use policies must balance development and conservation to achieve sustainable land use and environmental protection.
Under the cultivated land protection scenario for 2030, the land use dynamics in Fujian Province exhibit a pronounced increase in cultivated and construction land, coupled with a decrease in forest land, grassland, water bodies, and unused land. Specifically, cultivated land is projected to increase by 248.73 km2, with a dynamic degree of 1.21%, underscoring the effectiveness of cultivated land protection policies and marking it as the most significant land use change in this scenario. Construction land is anticipated to see a modest increase of 107.00 km2, with a dynamic degree of 1.97%, reflecting the ongoing urbanization processes that persist even amid efforts to protect agricultural land. This suggests a nuanced interaction between land protection policies and urban development imperatives. In contrast, water bodies are expected to decline by 70.90 km2, with a dynamic degree of −4.00%, indicating the potential reallocation of water resources for alternative uses, which may have implications for regional water management strategies. Forest land and grassland are forecasted to decrease by 216.32 km2 and 55.69 km2, respectively, with dynamic degrees of approximately −0.3%. These more gradual reductions point to the secondary effects of prioritizing agricultural land protection, potentially at the expense of other ecological land types. The observed decreases in forest and grassland highlight the complex tradeoffs inherent in land use policy decisions. Overall, the increase in cultivated land is the dominant feature of this scenario, affirming the success of the protection measures. However, the concomitant decrease in other natural ecological land types emphasizes the need for a more balanced approach to land use planning. This scenario elucidates the critical necessity of harmonizing agricultural land conservation with the sustainable management of other land types to ensure a holistic and ecologically sound land use strategy. Future policies must consider these multifaceted impacts to achieve an optimal equilibrium between development and conservation objectives.
Under the urban development scenario projected for 2030, Fujian Province’s land use dynamics reveal pronounced transformations, predominantly characterized by a substantial increase in construction land, juxtaposed with a decline in cultivated land, forest land, water bodies, and unused land. By 2030, construction land is expected to encompass 6509.15 km2, representing 5.33% of the total land area, which marks an increase of 1086.06 km2 from 2020, with a dynamic degree of 20.03%. This substantial growth reflects the accelerated pace of urbanization and infrastructure development, positioning construction land as the most prominent change within this scenario. However, this rapid urbanization process incurs significant encroachment upon and the conversion of natural ecological land. Cultivated land is projected to decrease by 620.05 km2, with a dynamic degree of −3.01%, indicating the extensive conversion of agricultural land into construction land. Similarly, forest land is anticipated to decrease by 339.35 km2, with a dynamic degree of −0.45%, highlighting the pressures exerted by urban expansion on forest resources. Water bodies are expected to decrease by 126.18 km2, with a dynamic degree of −7.12%, underscoring the substantial loss of water resources as a consequence of urban development. In contrast, grassland exhibits the least significant change, with a slight increase and a dynamic degree of 0.09%, reflecting relatively stable conditions for this land type amidst the broader changes. The dramatic increase in construction land serves as the primary characteristic of this scenario, illustrating the extensive urbanization efforts underway. The concurrent decline in cultivated land, forest land, and water bodies underscores the detrimental impacts of urban expansion on natural ecological areas. This scenario highlights the critical necessity for comprehensive urban planning that not only facilitates growth but also emphasizes the preservation and restoration of natural ecosystems. Achieving a balance between urban development and ecological conservation will be imperative to ensure sustainable land use and the maintenance of environmental integrity in the context of rapid urbanization.
Under the ecological protection scenario, land use dynamics in Fujian Province for 2030 exhibit significant changes, primarily characterized by an increase in forest land, construction land, and water bodies, alongside a decrease in cultivated land, grassland, and unused land. Forest land is projected to increase by 420.45 km2, with a dynamic degree of 0.56%, reflecting the effectiveness of ecological protection measures in promoting forest recovery and increasing vegetation cover. Construction land is anticipated to grow by 213.68 km2, with a dynamic degree of 3.94%. Although this increase is relatively modest compared to the other scenarios, it indicates that urbanization processes are continuing under ecological protection policies but are somewhat controlled. Concurrently, cultivated land is expected to decrease by 561.33 km2, with a dynamic degree of −2.73%, a substantial reduction suggesting that some agricultural land is being converted to forest land or other ecological protection areas, highlighting the impact of ecological protection measures on agricultural land use. Grassland shows the mildest change, with a dynamic degree of −0.46%, indicating a relatively stable condition. Overall, the increase in forest land, construction land, and water bodies under this scenario underscores the positive impact of ecological protection measures. However, the notable decrease in cultivated land and the minor reduction in grassland suggest a tradeoff between agricultural land use and ecological conservation. This scenario emphasizes the necessity of rational land use planning to achieve a balance between ecological environment protection and economic development. Sustainable policies must integrate ecological conservation goals with urban and agricultural land use to ensure harmonious and sustainable development.

3.2.2. Land Use Changes Across Different Scenarios

The land use in Fujian Province exhibits significant changes under different scenarios, reflecting the impact of local policies on land use and the ecological environment. These changes provide crucial insights for future land use policy formulation, emphasizing the necessity of balancing development and conservation to achieve sustainable land use and ecological protection.
Cultivated land shows a marked decrease in both the natural development scenario and the urban development scenario, with reductions of 493.90 km2 (dynamic degree −2.40%) and 620.05 km2 (dynamic degree −3.01%), respectively. These declines reflect the encroachment of urban expansion on agricultural land, underscoring the impact of urbanization on reducing agricultural areas. In the ecological protection scenario, cultivated land decreases by 561.33 km2 (dynamic degree −2.73%), indicating that some agricultural land is being converted into construction or ecological protection areas. This trend emphasizes the prioritization of ecological protection measures. Conversely, under the cultivated land protection scenario, cultivated land increases by 248.73 km2 (dynamic degree 1.21%), showcasing the effectiveness of protection policies in expanding agricultural land and preventing its conversion to other uses. Similarly, forest land exhibits a decreasing trend in both the natural development and urban development scenarios, with reductions of 107.38 km2 (dynamic degree −0.14%) and 339.35 km2 (dynamic degree −0.45%), respectively. These reductions highlight the significant pressure that urban expansion exerts on forest resources, reflecting the challenges of maintaining forest areas amidst urban growth. However, in the cultivated land protection scenario, forest land decreases by 216.32 km2 (dynamic degree −0.29%), indicating a more moderate decline compared to the other scenarios. In stark contrast, under the ecological protection scenario, forest land increases significantly by 420.45 km2 (dynamic degree 0.56%), demonstrating the effectiveness of ecological protection measures in promoting forest recovery and increased vegetation cover. Grassland experiences slight increases or decreases across all the development scenarios, with relatively stable changes.
However, construction land increases significantly across all the scenarios. In the natural development scenario, construction land increases by 802.39 km2, with a dynamic degree of 14.80%, reflecting the rapid pace of urbanization and infrastructure development. In the cultivated land protection scenario, construction land increases by 107.00 km2, with a dynamic degree of 1.97%. Although the increase is smaller, it still indicates ongoing urbanization alongside efforts to protect agricultural land. In the urban development scenario, construction land sees the most substantial increase, rising by 1086.06 km2 with a dynamic degree of 20.03%, highlighting the intense demand for land resources driven by rapid urban expansion. Finally, in the ecological protection scenario, construction land increases by 213.68 km2, with a dynamic degree of 3.94%. Although the increase is more moderate, it suggests that urbanization continues, albeit under a more controlled and balanced approach within the context of ecological protection.
Under different scenarios, water bodies and unused land in Fujian Province consistently show a decreasing trend, although water bodies slightly increase under the ecological protection scenario. This trend is particularly pronounced in the natural development and urban development scenarios, where the changes in water bodies and unused land are most dramatic. In the natural development scenario, the dynamic degree for water bodies is −6.21%, and for unused land, it is −29.61%. These significant reductions reflect the impacts of climate change and human activities, such as water resource exploitation, river diversion, and pollution, on water resources and unused land.

3.3. Carbon Storage Scenario Simulations for 2030

3.3.1. Carbon Storage Projections Under Different Scenarios

The simulation results of the total carbon storage in Fujian Province under the four projected development scenarios reveal that by 2030, the overall carbon storage in the region is expected to follow this order: ecological protection scenario (2.02 billion tons) > natural development scenario (2.014 billion tons) > cultivated land protection scenario (2.013 billion tons) > urban development scenario (2.01 billion tons). This hierarchy underscores the differential impacts of various land use strategies on the province’s carbon sequestration capabilities.
In the natural development scenario, the total carbon storage is anticipated to reach 2.014 billion tons, representing a reduction of 0.03 billion tons relative to 2020. This decline is primarily attributable to the significant expansion of construction land, which occurs at the expense of unused land, water bodies, cultivated land, grassland, and forest land. The encroachment of construction land, characterized by a lower carbon density, into areas previously dominated by higher carbon density land types will lead to a net decrease in the overall carbon storage by 2030.
Conversely, under the ecological protection scenario, carbon storage is projected to increase to 2.02 billion tons, an increment of 0.05 billion tons compared to 2020. This positive outcome is primarily attributed to the implementation of ecological protection measures, such as afforestation, reforestation, and soil conservation. Consequently, there has been a notable expansion of both forest land and construction land, while cultivated land, grassland, and unused land have contracted. The conversion of cultivated land to forest land, characterized by higher carbon density, coupled with the more controlled expansion of construction land—possessing lower carbon sequestration potential—underscores the success of Fujian Province’s afforestation efforts and the strategic conversion of farmland to forest in enhancing carbon storage.
In contrast, the cultivated land protection scenario forecasts a carbon storage of 2.013 billion tons, reflecting a reduction of 0.04 billion tons from 2020 levels. The magnitude of carbon storage loss in this scenario surpasses that observed in the natural development scenario. This is due to the significant increase in both cultivated land and construction land under the influence of cultivated land protection policies, accompanied by a concurrent reduction in forest land, grassland, water bodies, and unused land. While the expansion of construction land is less pronounced than in the natural development scenario, the more substantial reduction in forest land suggests that the primary driver of carbon storage loss is the conversion of high-carbon-density forest land to lower-carbon-density cultivated land.
Finally, the urban development scenario predicts a total carbon storage of 2.01 billion tons, the lowest across all the scenarios, marking a decrease of 0.07 billion tons compared to 2020. This significant decline in carbon storage is predominantly a consequence of the extensive increase in construction land, which comes at the expense of cultivated land, forest land, water bodies, and unused land. The accelerated urbanization process exerts severe pressure on natural ecological land, leading to its erosion and conversion. This scenario emphasizes the critical need for sustainable urban planning strategies that can mitigate the adverse impacts of rapid urbanization on carbon storage.

3.3.2. Regional Differences of Carbon Storage Under Future Scenarios

The spatial distribution of carbon storage in 2030 under various development scenarios exhibits pronounced regional disparities (Figure 4). Notably, carbon storage is consistently higher in the western and northwestern mountainous regions than in the eastern and southeastern coastal urban areas. This pattern remains consistent across all the scenarios, where areas rich in forests and grasslands in the west and northwest exhibit high carbon storage, while areas dominated by construction land and farmland in coastal and urban regions show significantly lower storage levels.
A differential analysis of carbon storage between 2020 and 2030, followed by a reclassification into three categories—decrease, stability, and increase—reveals that most regions exhibit stable carbon storage across all the scenarios. However, regions experiencing an increase in carbon storage are sporadically distributed across Fujian Province, lacking significant spatial clustering. Conversely, areas with a decrease in carbon storage are closely correlated with the expansion of construction land, predominantly in economically developed coastal urban areas such as Fuzhou, Putian, Xiamen, Zhangzhou, and Quanzhou. The decrease in carbon storage is most pronounced under the urban development scenario, while it is comparatively mitigated under the ecological protection scenario. These findings underscore the influence of urbanization and land use changes on carbon storage patterns, highlighting the critical need for targeted conservation strategies. While urban development poses substantial risks to carbon storage, particularly in coastal regions, ecological protection measures can play a pivotal role in preserving and enhancing carbon sequestration capacities in vulnerable areas.

3.3.3. Key Protection Areas and Vulnerable Regions Under Future Scenarios

To further refine the identification of key protection areas and vulnerable regions in the spatial distribution of carbon storage under various future scenarios, the study first applied a hotspot analysis to the projected carbon storage distribution in 2030. This analysis targeted the hotspot regions identified within each scenario, with the subsequent statistical evaluation of carbon storage at the district and county levels. This process allowed for the identification of critical areas for protection and zones at risk. As shown in Figure 5, the consistency of the results across all four scenarios—highlighting 12 districts/counties as key protection areas and 31 as vulnerable regions—underscores the importance of targeted conservation efforts.
The key conservation areas are situated in Longyan City in the eastern part of Fujian Province, Sanming City in the west and northwest, and Nanping City in the northern region of the study area. Specifically, these 12 areas include Qingliu County, Changting County, Liancheng County, Wuping County, Shanghang County, and Xinluo District in the eastern region; Youxi County and Datian County in the central region; and Wuyishan City, Jianyang District, Jian’ou City, and Jianping District in the northern region. These regions are distinguished by dense forest cover and favorable ecological conditions, resulting in significant carbon storage and the formation of high-value carbon clusters, thereby prioritizing them for conservation and carbon management initiatives. Notably, Jian’ou City is projected to have the highest carbon storage among all the districts by 2030. Under the natural development scenario, carbon storage is expected to increase by 277,000 tons compared to 2020, primarily driven by a 17.7 km2 expansion of high-carbon-density forest areas. Conversely, under the cultivated land protection scenario, carbon storage is anticipated to decrease by 389,200 tons due to the expansion of cultivated land, which has lower carbon density. Similarly, the urban development scenario predicts a reduction of 366,800 tons, reflecting the impact of accelerated urbanization and forest loss. Under the ecological protection scenario, however, Jian’ou’s carbon storage is projected to reach 72.784 million tons, reflecting an increase of 248,500 tons from 2020, highlighting the benefits of conservation-focused land use policies.
The vulnerable areas of carbon storage are predominantly concentrated in the coastal regions of Fuzhou City in the east, Putian City in the central region, and the Xiamen–Zhangzhou–Quanzhou metropolitan area in the south of Fujian Province, encompassing 31 districts and counties. These regions are characterized by high levels of urbanization and extensive construction land use, resulting in lower carbon storage capacities. The spatial clustering of low carbon storage values in these areas underscores their significance in regional carbon management and conservation strategies. Notably, Taijiang District exhibits the lowest carbon storage among all the districts, with a total of 53,700 tons. Under the cultivated land protection scenario, there is a slight decrease compared to the natural development scenario, primarily due to the district’s minimal cultivated land area (0.0072 km2), which limits the impact of protection policies. Conversely, the urban development scenario predicts a modest increase in carbon storage by 1900 tons, attributed to land use conversion from water bodies to construction land. Districts with carbon storage below 300,000 tons, such as Gulou, Huli, and Licheng, display higher carbon storage under the cultivated land protection scenario than under natural development, indicating that such policies can effectively slow urban expansion and enhance carbon sequestration in southeastern Fujian cities. However, the urban development scenario predicts a decline in carbon storage compared to 2020 levels, underscoring the heightened ecological pressure from urbanization. In contrast, the ecological protection scenario projects higher carbon storage than the natural development scenario, illustrating that conservation measures can effectively mitigate soil erosion and enhance carbon sequestration.

4. Discussion

4.1. From Policy to Practice to Assess Future Carbon Storage

In the context of carbon storage research, modeling and predicting future carbon dynamics based on local policy frameworks offer a more targeted and scientifically rigorous approach. This method aligns with the unique characteristics of the region, generating insights that are highly relevant and practical for urban planning and policy-making. Since the 18th National Congress of the Communist Party of China, the nation has increasingly focused on ecological conservation and sustainable development under the strategic guidance of the ecological civilization framework. This shift has been formalized through policies such as the “National Major Projects Plan for the Protection and Restoration of Important Ecosystems (2021–2035)” and the “National Territorial Spatial Plan Outline (2021–2035),” which integrates multiple planning frameworks into a cohesive strategy. These policies represent China’s comprehensive and sustainable development model, referred to as the “Chinese solution,” for managing and utilizing national territorial spaces.
In alignment with these national strategies, provincial-level spatial plans and ecological restoration initiatives have been systematically developed, including the “Fujian Provincial Territorial Spatial Plan (2021–2035)” and the “Fujian Provincial Ecological Restoration Plan (2021–2035).” These plans represent the region-specific implementations of national policies and emphasize the importance of integrating regional policy contexts into carbon storage models. Such integration enhances the precision of future carbon storage predictions, providing actionable insights for urban and regional planning that align development trajectories with sustainable ecological objectives.
This study establishes four distinct policy-driven scenarios—natural development, farmland protection, urban development, and ecological protection—based on the historical land use transition matrix of Fujian Province. These scenarios are specifically aligned with Fujian’s regional policies, ensuring the seamless integration between policy directives and model projections. The findings reveal that among the four scenarios evaluated, the ecological protection scenario is the most effective in enhancing carbon stocks, with a projected increase to 2.02 billion tons by 2030, followed by the natural development scenario (2.014 billion tons), the cultivated land protection scenario (2.013 billion tons), and the urban development scenario (2.01 billion tons). This hierarchy underscores the varying impacts of different land use strategies on the province’s carbon sequestration potential. The ecological protection scenario underscores the critical importance of ecological protection and restoration policies, emphasizing measures such as forest conservation, ecological agriculture, and the control of urban sprawl. These actions, when combined with the region’s economic development needs, highlight the necessity of rational land use planning to maintain ecosystem health and stability. In contrast, the urban development scenario results in the most significant reduction in carbon stocks, with a decrease of 0.007 billion tons compared to 2020, highlighting the environmental risks associated with unchecked urban expansion.
By quantifying the changes in carbon storage from policy implementation to practical outcomes, this research provides a critical assessment of the future effectiveness of policy measures. The findings offer valuable scientific data to support government efforts in policy formulation and adjustment. Moreover, the results serve as a guide for ecological restoration and land use planning in Fujian Province, with the potential to enhance ecosystem services and promote sustainable regional development. Therefore, this study holds significant theoretical and practical implications.

4.2. Refining Regional Analysis: Identifying Regional Differences and Key Areas in Future Carbon Storage

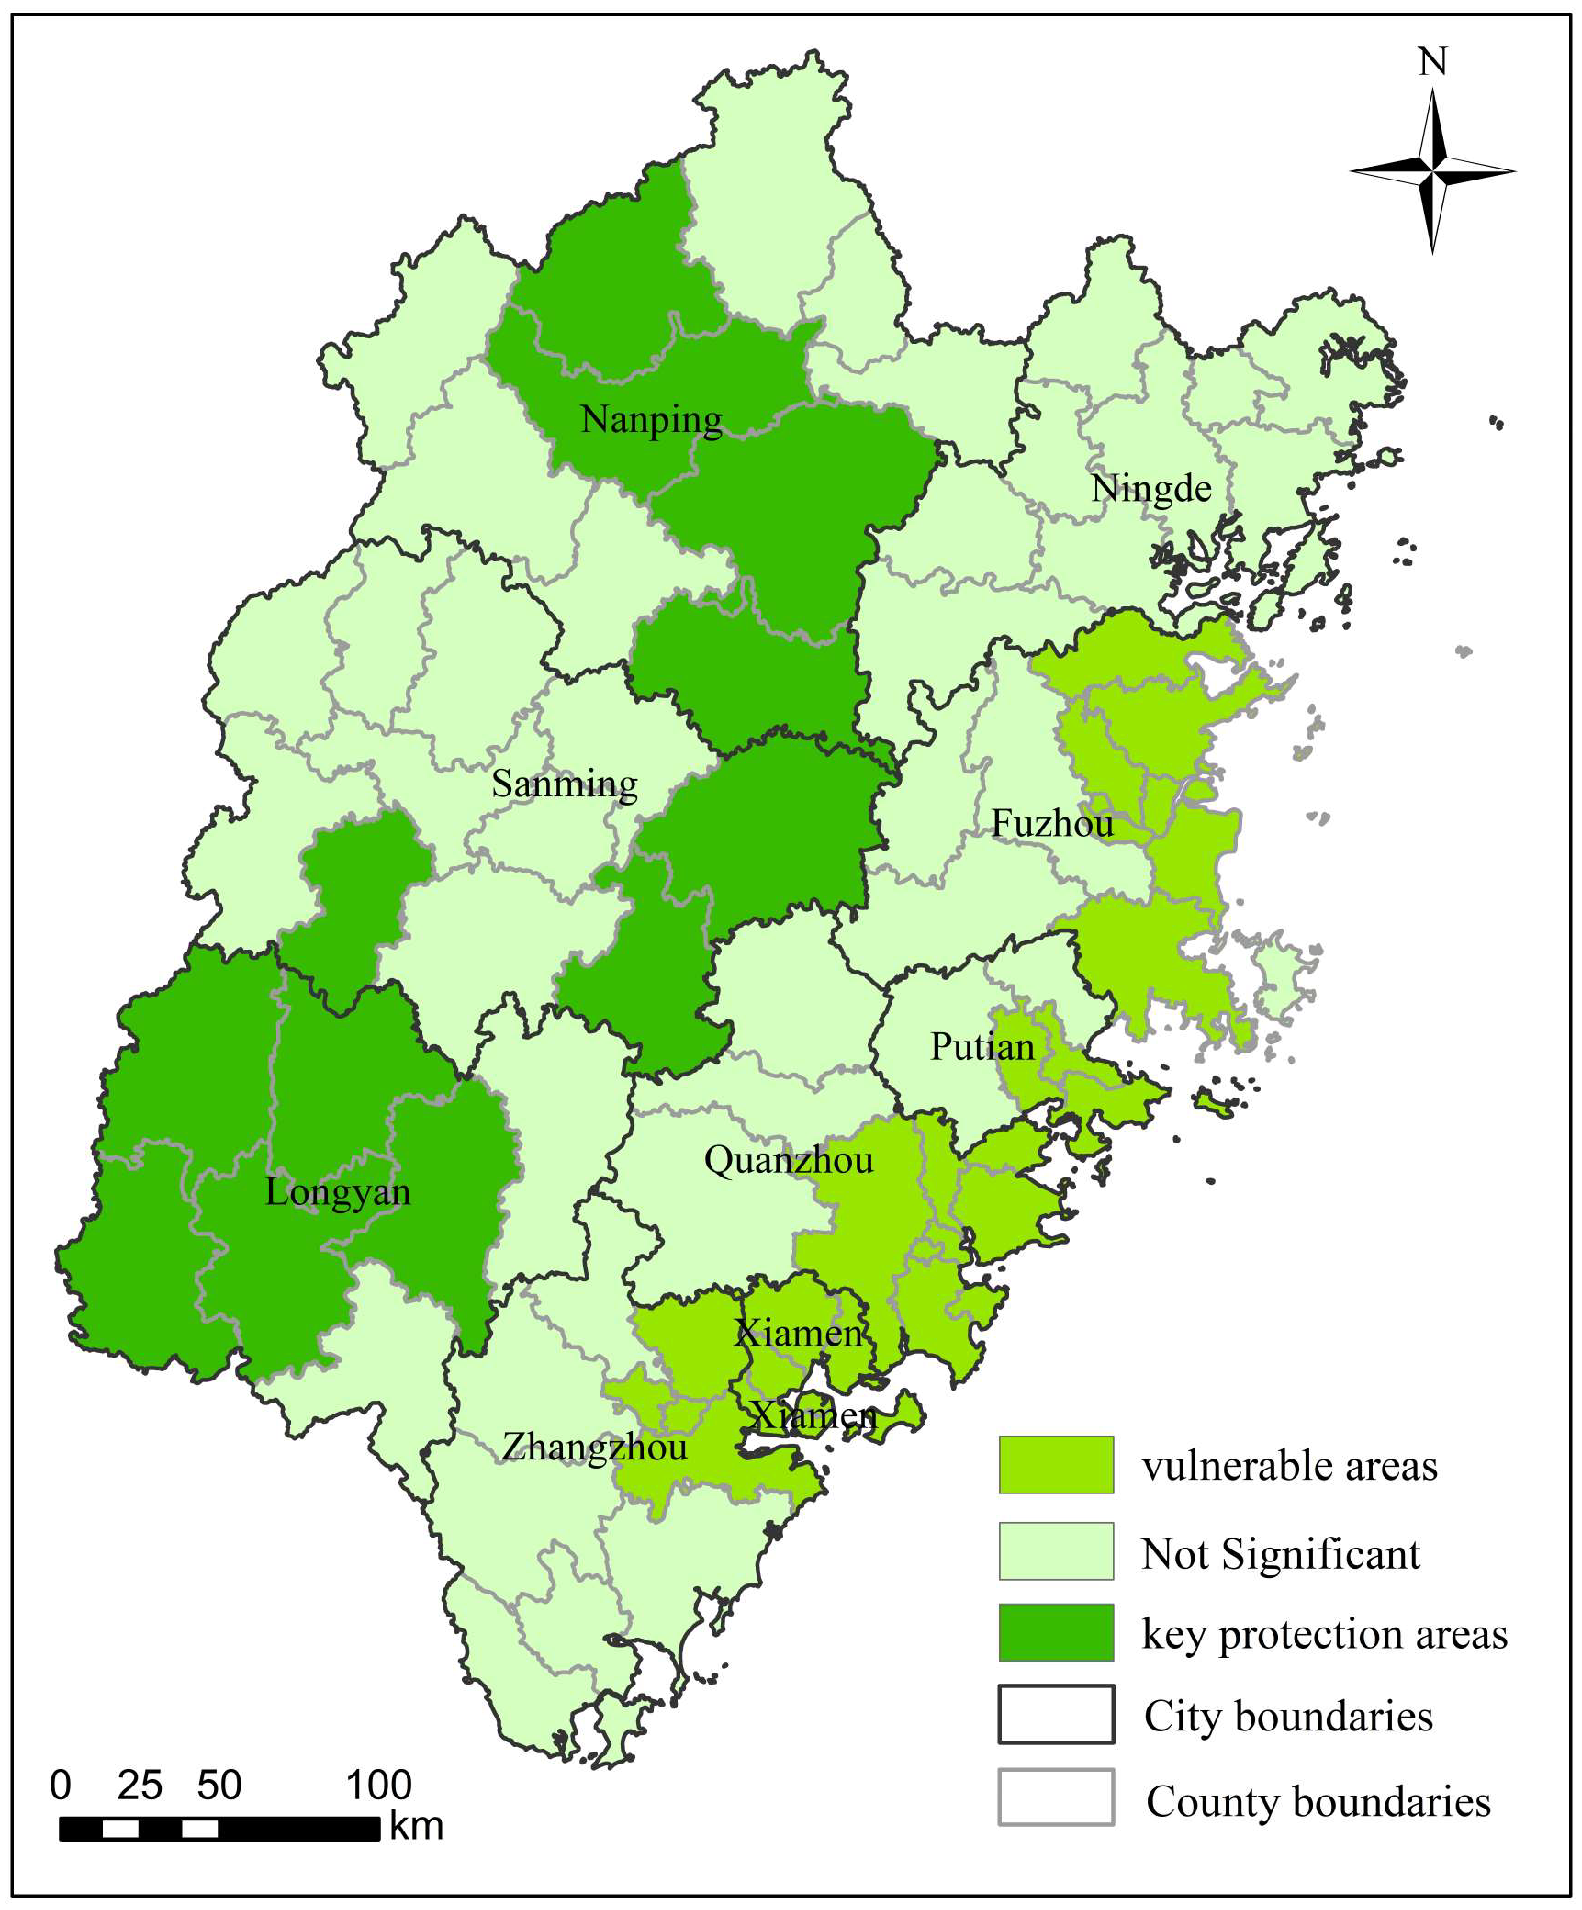
This study provides a refined analysis of carbon storage distribution in Fujian Province, revealing significant regional disparities in future carbon storage under the four simulated scenarios. The analysis identifies a clear spatial pattern, with higher carbon storage projected in the western and northwestern mountainous regions and lower storage in the eastern and southeastern coastal areas. Importantly, the identification of key protection areas and vulnerable regions remains consistent across all the scenarios.
Twelve districts and counties in Longyan, Sanming, and Nanping have been identified as key conservation areas due to their dense forest cover and favorable ecological conditions, which play a crucial role in carbon storage. Recognized as high-value carbon aggregation zones, these areas have been prioritized for conservation and carbon management initiatives. Fujian Province has actively implemented a range of measures in these regions aimed at protecting the ecological environment and enhancing carbon storage, thereby strengthening efforts to safeguard ecological integrity and promote carbon sequestration. For instance, Sanming has initiated pilot projects focused on forestry carbon sequestration, enabling carbon trading through forest management projects. In Meicun Village, Jiangshan Town, Xinluo District, Longyan, a carbon sink forest base has been established, planting broadleaf tree species to enhance the forest’s carbon sequestration capacity. Additionally, the introduction of the first national forestry carbon sink index insurance provides risk protection and ensures the restoration of carbon sequestration capacity following environmental disturbances. Meanwhile, Nanping has accelerated the development of a comprehensive green, low-carbon, and circular economy, focusing on optimizing industrial, energy, and transportation structures to reduce carbon emission intensity. In key ecological function areas such as Wuyi Mountain National Park, ecological protection and restoration projects have been implemented to improve ecosystem quality and stability.
Conversely, 31 districts and counties in Fujian’s coastal areas, particularly in highly urbanized regions such as Fuzhou, Putian, and the Xiamen–Zhangzhou–Quanzhou metropolitan area, have been identified as vulnerable zones with relatively low carbon storage capacity due to extensive urban development. In response, Fujian Province has undertaken proactive measures to enhance carbon storage in these vulnerable areas, driving a comprehensive green transformation of its economy and society. As a major coastal province, Fujian boasts abundant marine carbon sink resources, including ecosystems such as mangroves, seagrass beds, and salt marshes, which are characterized by their high carbon sequestration potential and long-term carbon storage capacity. Fujian Province is actively advancing research on marine carbon sinks and exploring carbon trading pilot projects through policy support and scientific initiatives, contributing to broader strategies aimed at achieving carbon peaking and carbon neutrality. Furthermore, Fujian supports the accelerated development of a zero-carbon demonstration zone on Meizhou Island in Putian, promoting green and low-carbon transformation through various measures, including green building initiatives, eco-friendly landscaping, and the utilization of renewable energy. These efforts have already yielded significant carbon reduction outcomes.

4.3. The Chinese Experience: Balancing Ecological Protection and Urban Development

This study highlights a critical trend: under the ecological protection scenario, carbon storage in Fujian Province is projected to increase significantly between 2020 and 2030, while under the urban development scenario, carbon storage is expected to decline the most. Urbanization brings opportunities for economic development but also presents ecological challenges, particularly in balancing growth with environmental sustainability. This finding aligns with research conducted both domestically and internationally. For example, He et al. [32] predicted carbon storage changes in Guilin, noting that carbon storage was highest under the ecological protection scenario and lowest under the economic priority scenario. This underscores a critical question: how can ecological protection be balanced with urban expansion? This issue is pivotal for enhancing ecosystem carbon storage and achieving sustainable development goals.
Fujian Province, as China’s first national ecological civilization pilot zone and a vital ecological barrier in the southern region, faces unique challenges in balancing ecological protection with urban development. China has adopted a multi-dimensional approach to this challenge, successfully exploring a sustainable development path through policy guidance, technological innovation, and social participation.
Firstly, China has made ecological civilization a central component of its national development strategy, encapsulated in the concept that “lucid waters and lush mountains are invaluable assets.” This philosophy emphasizes that economic development must be integrated with ecological protection, driving green development. This approach has been deeply embedded into urban planning, land use, and economic policies, providing clear guidance for balancing ecosystem carbon sinks with urban expansion. For instance, the “Fujian Provincial Territorial Spatial Planning (2021–2035)” and the “Fujian Provincial Ecological Restoration Plan (2021–2035)” were developed under this guiding philosophy.
Secondly, China has implemented a strict “ecological red line” policy, designating key ecological areas where any form of development is prohibited. This policy ensures the protection of critical ecosystems, such as forests, wetlands, and grasslands, allowing these areas to maintain their carbon sink functions despite urban expansion. Additionally, many Chinese cities are committed to green urban development by promoting green buildings, expanding public transportation, increasing urban green spaces, and implementing low-carbon energy projects. These efforts have successfully mitigated the negative impacts of urban expansion on ecosystems while enhancing the carbon sequestration capacity within cities. For example, increasing urban parks and green spaces has not only improved carbon sink capabilities but also effectively reduced carbon emissions.
Moreover, China has undertaken large-scale ecological restoration projects, such as the Grain for Green Project (returning farmland to forests) and desertification control initiatives, to restore vast degraded ecosystems. In Fujian Province, for instance, four ecological protection and restoration zones have been delineated based on the ecological security framework of “Two Screens, One Belt, Six Rivers, Two Streams”, with 59 key ecological restoration areas identified. The “Fujian Provincial Ecological Restoration Plan (2021–2035)” aims to increase the province’s forest coverage rate to over 65.37% by 2035. These restoration projects have not only improved the quality of the ecological environment but also provided green buffer zones for urban expansion.
Finally, in advancing new urbanization, China has emphasized the construction of smart cities, using technological innovation to optimize urban planning and management. Smart city technologies, including the Internet of Things (IoT), big data, and artificial intelligence (AI), enable better management of urban ecosystems and carbon emissions, supporting the balance between carbon sinks and urban development. Fujian’s smart city initiatives, centered on “Digital Fujian,” focus on leveraging IoT, big data, and AI to enhance urban management efficiency and improve residents’ quality of life. The province is also advancing the construction of a “digital ecology” demonstration, enhancing the “One Map” for ecological monitoring, conducting satellite remote sensing applications, and automating sound environment quality monitoring. Additionally, Fujian is accelerating the development of an integrated natural resources information platform and the “Smart Forestry 123” project, constructing a comprehensive “sky–earth” integrated sensing and application system.
These strategies illustrate how China has successfully balanced ecological protection with urban development, offering valuable lessons for sustainable development. Fujian Province’s experience, as detailed in this study, highlights the importance of aligning regional strategies with national priorities to achieve sustainable growth and carbon neutrality.

4.4. Uncertainty, Limitations, and Prospects

Although this study has produced valuable findings, it also has certain limitations. One key limitation concerns the carbon density data used, which primarily derives from the existing literature for the study area and nearby regions, with a preference for field-collected data. Additionally, the study utilizes national and Fujian Province annual precipitation data to calculate a correction coefficient between the actual and simulated carbon densities. While the corrected carbon density values closely align with the actual data for the study area, environmental changes and human activities continue to influence carbon density, introducing a degree of uncertainty into the estimated carbon storage. To improve the reliability of carbon storage estimates in future studies, it is essential to validate carbon density values with dynamic, region-specific field data. This would provide a more robust foundation for accurate carbon storage assessments.
Secondly, the InVEST model, used to estimate carbon storage, relies on land use types, which overlooks several critical factors influencing carbon sequestration, such as photosynthesis rates and soil microbial activity. Additionally, the model does not account for variations in carbon sequestration capacity due to differences in internal land use structure and vegetation age. As a result, this leads to errors in the spatial distribution of carbon storage, ultimately affecting the accuracy of the results. On the other hand, the PLUS model assumes fixed transition rules based on historical land conversion patterns when simulating future land use changes. However, these transition rules may evolve as a region develops, and future development plans, along with related policy documents, may not be directly incorporated into the model’s constraint rules. To address these limitations, future research could consider estimating carbon storage based on surface cover materials. Additionally, more advanced cellular automata (CA) models, such as the landscape-driven patch-based CA, could be employed to better capture the dynamics of land use changes and carbon sequestration processes.
Finally, despite considering different scenarios, the simulation results for future land use still show a degree of uncertainty. The factors influencing carbon storage are multifaceted, and this study has made simplifications by selecting only 10 driving factors. However, the actual determinants of land use change are often more intricate, and both the quantity and nature of these factors may vary over time. Additionally, the feasibility of policy implementation within a given region, as well as the interactions between different policy measures, play a significant role in influencing carbon storage outcomes. Furthermore, the potential impact of future policy shifts, technological advancements, and market dynamics on carbon sequestration must be accounted for. Future research should, thus, delve deeper into the evolving trends in carbon storage, identify the key factors that influence these trends, and examine the implications under different policy scenarios. Moreover, the feasibility and challenges of policy implementation, as well as the synergies and tradeoffs between policies, should be investigated to provide more comprehensive and actionable policy recommendations. In parallel, the integration of technological progress, market dynamics, and potential future policy changes into carbon storage models is crucial to enhance the robustness of projections for future carbon sequestration.

5. Conclusions

This study integrates the “Fujian Provincial Territorial Spatial Planning (2021–2035)” and the “Fujian Provincial Ecological Restoration Plan (2021–2035)” to analyze the impacts of policy-driven land use changes on carbon storage in Fujian Province. The findings indicate the following:
(1) Spatiotemporal Evolution of Carbon Storage
The spatiotemporal evolution of carbon storage in Fujian Province shows a significant decline from 1995 to 2020, primarily due to the conversion of forests and agricultural lands into construction areas. The FLUS and InVEST models highlight the negative impact of urban expansion on carbon storage.
(2) Carbon Storage Under Different Future Scenarios
The simulations of future scenarios reveal that the ecological protection scenario achieves the highest carbon storage by 2030. This outcome underscores the benefits of afforestation and conservation efforts. In contrast, the urban development scenario results in the lowest carbon storage, emphasizing the risks associated with unchecked urban growth and the importance of sustainable land use policies.
(3) Regional Differences in Carbon Storage and Key Protection Areas
The western and northwestern areas are prioritized as conservation zones, with 12 districts deemed critical for protection. Conversely, the eastern coastal urban regions, comprising 31 vulnerable districts, face the greatest risks to their carbon storage potential. These findings highlight the need for targeted conservation efforts in these regions to balance ecological protection with economic development.

Author Contributions

Conceptualization, Q.N. and W.M.; methodology, X.W. and Z.L.; software, Z.L.; validation, Z.L.; writing—original draft preparation, Q.N.; writing—review and editing, Q.N. and W.M.; visualization, X.W.; supervision, Q.N. and W.M.; funding acquisition, W.M. All authors have read and agreed to the published version of the manuscript.

Funding

This research was funded by The Guiding Project of Fujian Province Science and Technology Program (No. 2021H0026), the Xiamen City Open Competition for Leadership Project (No. 3502Z20231038) and the Natural Science Foundation of Fujian Province (No. 2024J011194).

Data Availability Statement

Data will be made available upon request.

Conflicts of Interest

The authors declare no conflicts of interest.

References

  1. IPCC. Global Warming of 1.5 °C. An IPCC Special Report on the Impacts of Global Warming of 1.5 °C Above Pre-Industrial Levels and Related Global Greenhouse Gas Emission Pathways; Intergovernmental Panel on Climate Change: Geneva, Switzerland, 2018. [Google Scholar]
  2. Foley, J.A.; DeFries, R.; Asner, G.P.; Barford, C.; Bonan, G.; Carpenter, S.R.; Chapin, F.S.; Coe, M.T.; Daily, G.C.; Gibbs, H.K.; et al. Global consequences of land use. Science 2005, 309, 570–574. [Google Scholar] [CrossRef] [PubMed]
  3. Smith, P.; Bustamante, M.; Ahammad, H.; Clark, H.; Dong, H.; Elsiddig, E.A.; Haberl, H.; Harper, R.; House, J.; Jafari, M.; et al. Agriculture, Forestry and Other Land Use (AFOLU). In Climate Change 2014: Mitigation of Climate Change. Contribution of Working Group III to the Fifth Assessment Report of the Intergovernmental Panel on Climate Change; Cambridge University Press: Cambridge, UK, 2014. [Google Scholar]
  4. Turner, B.L.; Lambin, E.F.; Reenberg, A. The emergence of land change science for global environmental change and sustainability. Proc. Natl. Acad. Sci. USA 2007, 104, 20666–20671. [Google Scholar] [CrossRef] [PubMed]
  5. Seto, K.C.; Güneralp, B.; Hutyra, L.R. Global forecasts of urban expansion to 2030 and direct impacts on biodiversity and carbon pools. Proc. Natl. Acad. Sci. USA 2012, 109, 16083–16088. [Google Scholar] [CrossRef] [PubMed]
  6. Griscom, B.W.; Adams, J.; Ellis, P.W.; Houghton, R.A.; Lomax, G.; Miteva, D.A.; Schlesinger, W.H.; Shoch, D.; Siikamäki, J.V.; Smith, P.; et al. Natural climate solutions. Proc. Natl. Acad. Sci. USA 2017, 114, 11645–11650. [Google Scholar] [CrossRef]
  7. Zhang, X.; Liu, Y.; Chen, W.; Li, J. China’s energy transitions for carbon neutrality: Challenges and opportunities. Sustain. Energy Transit. 2022, 3, 123–145. [Google Scholar] [CrossRef]
  8. Liu, Z.; Deng, Z.; He, G.; Wang, H.; Zhang, X.; Lin, J.; Qi, Y.; Liang, X. Challenges and opportunities for carbon neutrality in China. Nat. Rev. Earth Environ. 2022, 3, 141–155. [Google Scholar] [CrossRef]
  9. Gao, F.; Xin, X.; Song, J.; Li, X.; Zhang, L.; Zhang, Y.; Liu, J. Simulation of LUCC Dynamics and Estimation of Carbon Stock under Different SSP-RCP Scenarios in Heilongjiang Province. Land 2023, 12, 1665. [Google Scholar] [CrossRef]
  10. Li, J.; Chen, X.; Kurban, A.; Van de Voorde, T.; De Maeyer, P.; Zhang, C. Coupled SSPs-RCPs scenarios to project the future dynamic variations of water-soil-carbonbiodiversity services in Central Asia. Ecol. Ind. 2021, 129, 107936. [Google Scholar] [CrossRef]
  11. Tan, J.; Li, A.; Lei, G.; Xie, X. A SD-MaxEnt-CA model for simulating the landscape dynamic of natural ecosystem by considering socio-economic and natural impacts. Ecol. Model. 2019, 410, 108783. [Google Scholar] [CrossRef]
  12. Chen, Y.; Li, X.; Liu, X.; Ai, B. Modeling urban land-use dynamics in a fast developing city using the modified logistic cellular automaton with a patch-based simulation strategy. Int. J. Geogr. Inf. Sci. 2014, 28, 234–255. [Google Scholar] [CrossRef]
  13. Lin, J.; Chen, Q. Analyzing and Simulating the Influence of a Water Conveyance Project on Land Use Conditions in the Tarim River Region. Land 2023, 12, 2073. [Google Scholar] [CrossRef]
  14. Luo, G.; Yin, C.; Chen, X.; Xu, W.; Lu, L. Combining system dynamic model and CLUE-S model to improve land use scenario analyses at regional scale: A case study of Sangong watershed in Xinjiang, China. Ecol. Complex. 2010, 7, 198–207. [Google Scholar] [CrossRef]
  15. Zhu, W.; Gao, Y.; Zhang, H.; Liu, L. Optimization of the land use pattern in Horqin Sandy Land by using the CLUMondo model and Bayesian belief network. Sci. Total Environ. 2020, 739, 139929. [Google Scholar] [CrossRef] [PubMed]
  16. Ding, Q.; Chen, Y.; Bu, L.; Ye, Y. Multi-scenario analysis of habitat quality in the yellow river delta by coupling FLUS with InVEST model. Int. J. Environ. Res. Public Health 2021, 18, 2389. [Google Scholar] [CrossRef] [PubMed]
  17. Liang, X.; Guan, Q.; Clarke, K.C.; Liu, S.; Wang, B.; Yao, Y. Understanding the drivers of sustainable land expansion using a patch-generating land use simulation (PLUS) model: A case study in Wuhan, China. Comput. Environ. Urban Syst. 2021, 85, 101569. [Google Scholar] [CrossRef]
  18. Zhai, H.; Lv, C.; Liu, W.; Yang, C.; Fan, D.; Wang, Z.; Guan, Q. Understanding spatio-temporal patterns of land use/land cover change under urbanization in Wuhan, China, 2000–2019. Remote Sens. 2021, 13, 3331. [Google Scholar] [CrossRef]
  19. Zhang, G.; Shi, P.; Jiang, L.; Hu, X.; Zhong, H.; Chen, Y. Carbon Emission Risk and Governance. Int. J. Disaster Risk Sci. 2021, 13, 249–260. [Google Scholar]
  20. Wu, X.; Zhang, Y.; Liu, H.; Zhao, Z.; Zhou, X.; Li, Y. Land Use Optimization in Ningbo City with a Coupled GA and PLUS Model. J. Clean. Prod. 2023, 375, 134004. [Google Scholar]
  21. Wen, D.; He, N.P. Spatial Patterns and Control Mechanisms of Carbon Storage in Forest Ecosystem: Evidence from the North-South Transect of Eastern China. Ecol. Indic. 2016, 61, 960–967. [Google Scholar] [CrossRef]
  22. Sun, J.; Zhang, Y.; Qin, W.; Chai, G. Estimation and Simulation of Forest Carbon Stock in Northeast China Forestry Based on Future Climate Change and LUCC. Remote Sens. 2022, 14, 3653. [Google Scholar] [CrossRef]
  23. Sun, X.; Wang, S.; Xue, J.; Dong, L. Assessment and Simulation of Ecosystem Carbon Storage in Rapidly Urbanizing Areas Based on Land Use Cover: A Case Study of the Southern Jiangsu Urban Agglomeration, China. Front. Environ. Sci. 2022, 10, 647. [Google Scholar] [CrossRef]
  24. Ke, N.; Lu, X.; Zhang, X.; Kuang, B.; Zhang, Y. Urban Land Use Carbon Emission Intensity in China under the “Double Carbon” Targets: Spatiotemporal Patterns and Evolution Trend. Environ. Sci. Pollut. Res. 2023, 30, 18213–18226. [Google Scholar] [CrossRef] [PubMed]
  25. Li, L.; Fu, W.; Luo, M. Spatial and Temporal Variation and Prediction of Ecosystem Carbon Stocks in Yunnan Province Based on Land Use Change. Int. J. Environ. Res. Public Health 2022, 19, 16059. [Google Scholar] [CrossRef]
  26. Xu, D.; Yu, C.; Lin, W.; Yao, J.; Zhou, W. Spatiotemporal Evolution and Prediction of Land Use and Carbon Stock in Shanghai. Land 2024, 13, 267. [Google Scholar] [CrossRef]
  27. Petrokofsky, G.; Kanamaru, H.; Achard, F.; Goetz, S.J.; Joosten, H.; Holmgren, P.; Lehtonen, A.; Menton, M.C.S.; Pullin, A.S.; Wattenbach, M. Comparison of Methods for Measuring and Assessing Carbon Stocks and Carbon Stock Changes in Terrestrial Carbon Pools. How do the accuracy and precision of current methods compare? A systematic review protocol. Environ. Evid. 2012, 1, 6. [Google Scholar] [CrossRef]
  28. Pan, H.; Wu, C. Bayesian Optimization + XGBoost Based Life Cycle Carbon Emission Prediction for Residential Buildings-An Example from Chengdu, China. Build. Simul. 2023, 16, 1451–1466. [Google Scholar] [CrossRef]
  29. Nandal, A.; Yadav, S.S.; Rao, A.S.; Meena, R.S.; Lal, R. Advance Methodological Approaches for Carbon Stock Estimation in Forest Ecosystems. Environ. Monit. Assess. 2023, 195, 315. [Google Scholar] [CrossRef]
  30. Xu, X.; Liu, J.; Zhang, S.; Li, R.; Yan, C.; Wu, S. China’s Multi-Period Land Use Land Cover Remote Sensing Monitoring Data Set (CNLUCC); Resource and Environment Data Cloud Platform: Beijing, China, 2018. [Google Scholar]
  31. Wang, H.; Cai, L.; Wen, X.; Fan, D.; Wang, Y. Land Cover Change and Multiple Remotely Sensed Datasets Consistency in China. Ecosyst. Health Sustain. 2022, 8, 2040385. [Google Scholar] [CrossRef]
  32. He, Y.; Ma, J.; Zhang, C.; Yang, H. Spatio-Temporal Evolution and Prediction of Carbon Storage in Guilin Based on FLUS and InVEST Models. Remote Sens. 2023, 15, 1445. [Google Scholar] [CrossRef]
Figure 1. Land use distribution in Fujian from 1995 to 2020. Note: 1~6 indicates cultivated land, forest land, grassland, water, construction land, and unused land, respectively.
Land 14 00179 g001
Figure 2. Spatial distribution of carbon storage in Fujian in 2020.
Land 14 00179 g002
Figure 3. Land use of various forecast scenarios in Fujian Province by 2030.
Land 14 00179 g003
Figure 4. Spatial pattern of carbon storage under various scenarios in Fujian Province in 2030.
Land 14 00179 g004
Figure 5. Key protection areas and vulnerable regions in the spatial distribution of carbon storage.
Land 14 00179 g005
Table 1. Scenario settings for predicting carbon storage.
ScenarioPolicy BackgroundSetup MethodCharacteristics
NDProjected land use areas in Fujian Province for 2030, based on transfer probability matrices from 2010 and 2020.This scenario is developed using the PLUS model with a 10-year step, where the 2030 land use areas are estimated based on the historical land use transfer matrix. Conversion to construction land is prohibited due to difficulty in transition.Land use changes driven by natural growth and market forces, without additional policy interventions or ecological restoration measures. This scenario serves as a baseline reflecting natural trends in land use.
FPIn compliance with the “Fujian Provincial Territorial Spatial Planning (2021–2035)”, this scenario strictly protects the farmland red line, rigorously controls and minimizes the occupation of farmland, and implements the “occupation and compensation” policy to ensure the preservation of farmland area.This scenario reduces the probability of farmland converting to construction land by 60%, in accordance with the stringent farmland protection policies, while keeping the other land use changes aligned with the natural development scenario.Prioritizes farmland conservation to maintain food security and limit the expansion of construction land. The policies directly influence land use change by enforcing the strict protection of farmland.
UDReflecting the directives of the “Fujian Provincial Territorial Spatial Planning (2021–2035)”, this scenario strengthens urban areas through population concentration and industrial development, facilitating moderate urban expansion.Based on the policy’s urbanization goals, the scenario increases the probability of converting farmland, forest land, and grassland into construction land by 20%, and reduces the probability of construction land converting to other land types (except farmland) by 30%. This models urban growth according to policy priorities.Aims to support urbanization and industrialization in Fujian, with a focus on urban land use expansion, while reducing the conversion of construction land to other uses.
EPGuided by the “Fujian Provincial Ecological Restoration Plan (2021–2035)”, this scenario focuses on ecological restoration and environmental protection.The probability of farmland and forest land converting to construction land is reduced by 30%, while the conversion of construction land to forest land is increased by 10%, reflecting ecological restoration policies. Additionally, the conversion of grassland and water bodies is limited by 20%.Prioritizes ecological protection by reducing construction land expansion and restoring forests and grasslands. Policy-driven actions, such as afforestation and ecosystem restoration, are modeled to enhance environmental quality.
Table 2. Cost matrix of land use transfer in different simulation scenarios in Fujian Province.
Scenario SettingsLand Use TypeL1L2L3L4L5L6
NDL1111111
L2111111
L3111111
L4111111
L5000010
L6111111
FPL1100000
L2111000
L3111110
L4100100
L5000010
L6111111
UDL1100010
L2111110
L3101010
L4111110
L5100010
L6111111
EPL1111111
L2010000
L3011100
L4000100
L5000010
L6111111
“0” indicates that conversion is not allowed, while “1” indicates that conversion is permitted. L1, L2, L3, L4, L5, and L6 indicate cultivated land, forest land, grassland, water, construction land, and unused land, respectively.
Table 3. Carbon density of different land use types in the study area (t/hm2).
TypesAbove GroundBelow GroundSoilDead Mass
cultivated land9.780.1935.80.98
Forest land39.19.77159.383.91
Grassland3.2216.73138.770.32
Water0.060.30.660.27
Construction land11.392.2817.680
Unused land15.423.082.120
Table 4. Land use area change (C/km2) and dynamic degree (K/%) during 1995–2020.
Land Use Types1995–20002000–20052005–20102010–20152015–20201995–2020
CKCKCKCKCKCK
Cultivated land−148.85−0.13−786.94−0.70−398.08−0.37−356.83−0.34−207.99−0.20−1898.68−1.69
Forest land−286.18−0.07−78.22−0.02−419.32−0.11−57.73−0.02−169.24−0.04−1010.70−0.26
Grassland316.390.34−635.49−0.67108.200.12−41.36−0.04−11.93−0.01−264.19−0.28
Water31.820.4196.291.23214.342.57−61.03−0.65−48.88−0.54232.543.02
Construction land70.900.601200.199.83770.784.23514.722.33494.962.013051.565.1
Unused land14.133.7911.762.652.050.41−0.51−0.103.430.6730.878.28
Disclaimer/Publisher’s Note: The statements, opinions and data contained in all publications are solely those of the individual author(s) and contributor(s) and not of MDPI and/or the editor(s). MDPI and/or the editor(s) disclaim responsibility for any injury to people or property resulting from any ideas, methods, instructions or products referred to in the content.

