Article

Visual Gradation of Biological Soil Crust Development: A Simple and Effective Recording Method

1
Ecological Institute, Chinese Research Academy of Environmental Sciences, Beijing 100012, China
2
State Environment Protection Key Laboratory of Regional Eco-Process and Function Assessment, Beijing 100012, China
3
State Key Laboratory of Environmental Criteria and Risk Assessment, Beijing 100012, China
*
Author to whom correspondence should be addressed.
Land 2025, 14(1), 180; https://doi.org/10.3390/land14010180
Submission received: 22 December 2024 / Revised: 3 January 2025 / Accepted: 15 January 2025 / Published: 16 January 2025

Abstract

:
Biological soil crusts are important components of dryland ecosystems, showing variations in appearance, morphology, and function across developmental stages. However, the methods for recording biocrust developmental stages have not been simplified and standardized. In this study, three developmental grades for both cyanobacterial crust and moss crust were defined based on visual indicators such as color, thickness, and moss height. A field survey was conducted across three precipitation regions in northern China, during which the developmental grades of cyanobacterial and moss crusts were visually recorded. Key biocrust developmental indicators, including shear strength, penetration resistance, coverage, chlorophyll a content, and bulk density were measured for each grade. The results showed that both cyanobacterial and moss crusts could be effectively classified into three developmental grades based on these indicators, with a 90% concordance between the measured indicators and the defined grading method. This finding validated that the method could accurately reflect biocrust developmental stages while simplifying field recordings. Developmental indicators in various grades of cyanobacterial and moss crusts showed a moderate (30% < CV < 100%) to strong (CV > 100%) variation, highlighting the importance of environmental heterogeneity at the regional scale. Moreover, the grading method proved effective across varying spatial scales, highlighting its broad applicability. However, its validation across the comprehensiveness of target objects and the geographical scope remains limited. Future research should focus on expanding the grading method to include lichen crust, refining it across diverse ecosystems, and exploring the integration of advanced technologies such as hyperspectral imaging and machine learning to automate and improve the classification process. This study provides a simple and effective grading method for visually recording the developmental stages of biological soil crusts, which is useful for ecological research and field applications.

1. Introduction

Biological soil crusts (biocrusts), which consist of varying proportions of photoautotrophic (e.g., cyanobacteria, mosses, and lichens) and heterotrophic organisms (e.g., bacteria, fungi, archaea), along with tightly bound topsoil particles, are known to cover extensive areas of drylands [1,2]. These biocrusts provide critical ecological functions, including the enhancement of soil physical and chemical properties, resistance to wind erosion, regulation of soil hydrological processes, and contributions to carbon and nitrogen fixation [3,4]. Biocrusts have been studied from various perspectives, including their formation mechanisms and developmental processes [5,6] and their impacts on ecosystems and landscapes, as well as their response mechanisms [7,8], relationships with both aboveground and belowground organisms [9,10], and the methods of artificial cultivation and ecological restoration [11,12]. However, due to the small size of biocrust components, knowledge regarding moss taxonomy and the classification of cyanobacterial species is limited. Therefore, accurately and visually identifying biocrust species in the field remains a challenge [13]. Only a few studies have conducted species-level classifications of biocrusts [14,15], with the majority opting to categorize biocrusts into broader classifications, such as cyanobacterial crust, moss crust, or mixed crusts [16,17]. Common indicators employed to characterize the developmental stages of biocrusts include coverage, thickness, bulk density, biomass, chlorophyll a content, moisture content, shear strength, and penetration resistance [18,19,20]. The variability in the selected indicators across different studies hinders the comparability and sharing of data related to biocrusts.
In order to tackle complex issues within community ecology, ecologists often use functional groups rather than systematic taxonomy [21]. Functional groups consist of species that share similar morphological, functional, physiological, or ecological characteristics, thereby simplifying the classification of species [22]. Similarly, functional groups based on the morphological and compositional characteristics of biocrusts are commonly used for recording classification in the field study. At the primary study, Eldridge [23] classified biocrusts based on their composition and morphology into several categories, including cyanobacterial crust, gelatinous lichen, crustose lichen, squamulose lichen, foliose lichen, moss, and liverwort, finding that this morphological classification was more effective than traditional taxonomic methods in arid and semi-arid environments [24]. Similarly, Belnap et al. [25] categorized biological soil crusts into four morphological types: smooth, rugose, convoluted, and pinnacled. Further distinctions within the categories of cyanobacterial, lichen, and moss crusts reflect the morphological and functional changes associated with various developmental stages [26,27]. As moss crusts develop, their thickness increases, and soil stability and erosion resistance improve, as well as soil organic matter and enzyme activity being enhanced [28,29]. Later successional cyanobacterial crusts, characterized by their dark color, contribute newly fixed nitrogen to the surrounding soils and provide ultraviolet protection to the lighter-colored crusts at earlier successional stages [30,31]. Yin et al. [32] classified biocrusts into three developmental grades based on color and thickness: light gray cyanobacterial crust (3–5 mm), dark brown cyanobacterial crust (5–8 mm), and moss crust (10–12 mm). As the developmental stages progressed, there was an increase in the fine particle and nutrient content within the surface soil. Li [33] recorded cyanobacterial and moss crusts with three succession stages characterized by color, thickness, and moss height. The study found that carbon storage increased corresponding to the development of the succession stage. Belnap et al. [34] further constructed six levels of development for cyanobacterially dominated biocrusts based on color gradient, and Caster et al. [35] found that these developmental levels correlated positively with biocrust biomass, soil aggregate stability, and soil roughness, making this method useful for visually assessing the level of development and ecosystem functions of biocrusts [25]. These grading methods reduced reliance on taxonomic knowledge, but they have not yet been simplified into a standardized recording method.
As the importance of biocrusts is increasingly acknowledged and dryland restoration practices gain momentum, it is essential to establish a simplified grading method specifically designed for the visual record of biocrusts. Our aim is to promote and establish a standardized grading method for the field recording of biocrusts. It was hypothesized that the visual grading method was closely related to the developmental indicators of biocrusts and was sensitive to both local and regional spatial scales, and the grading method was then validated by cluster analysis and canonical correspondence analysis combined with the recording grades in the field. This simplified grading method will enable non-specialists to efficiently record the developmental stages of cyanobacterial and moss crusts, thereby promoting repeatable observations and comparative studies.

2. Materials and Methods

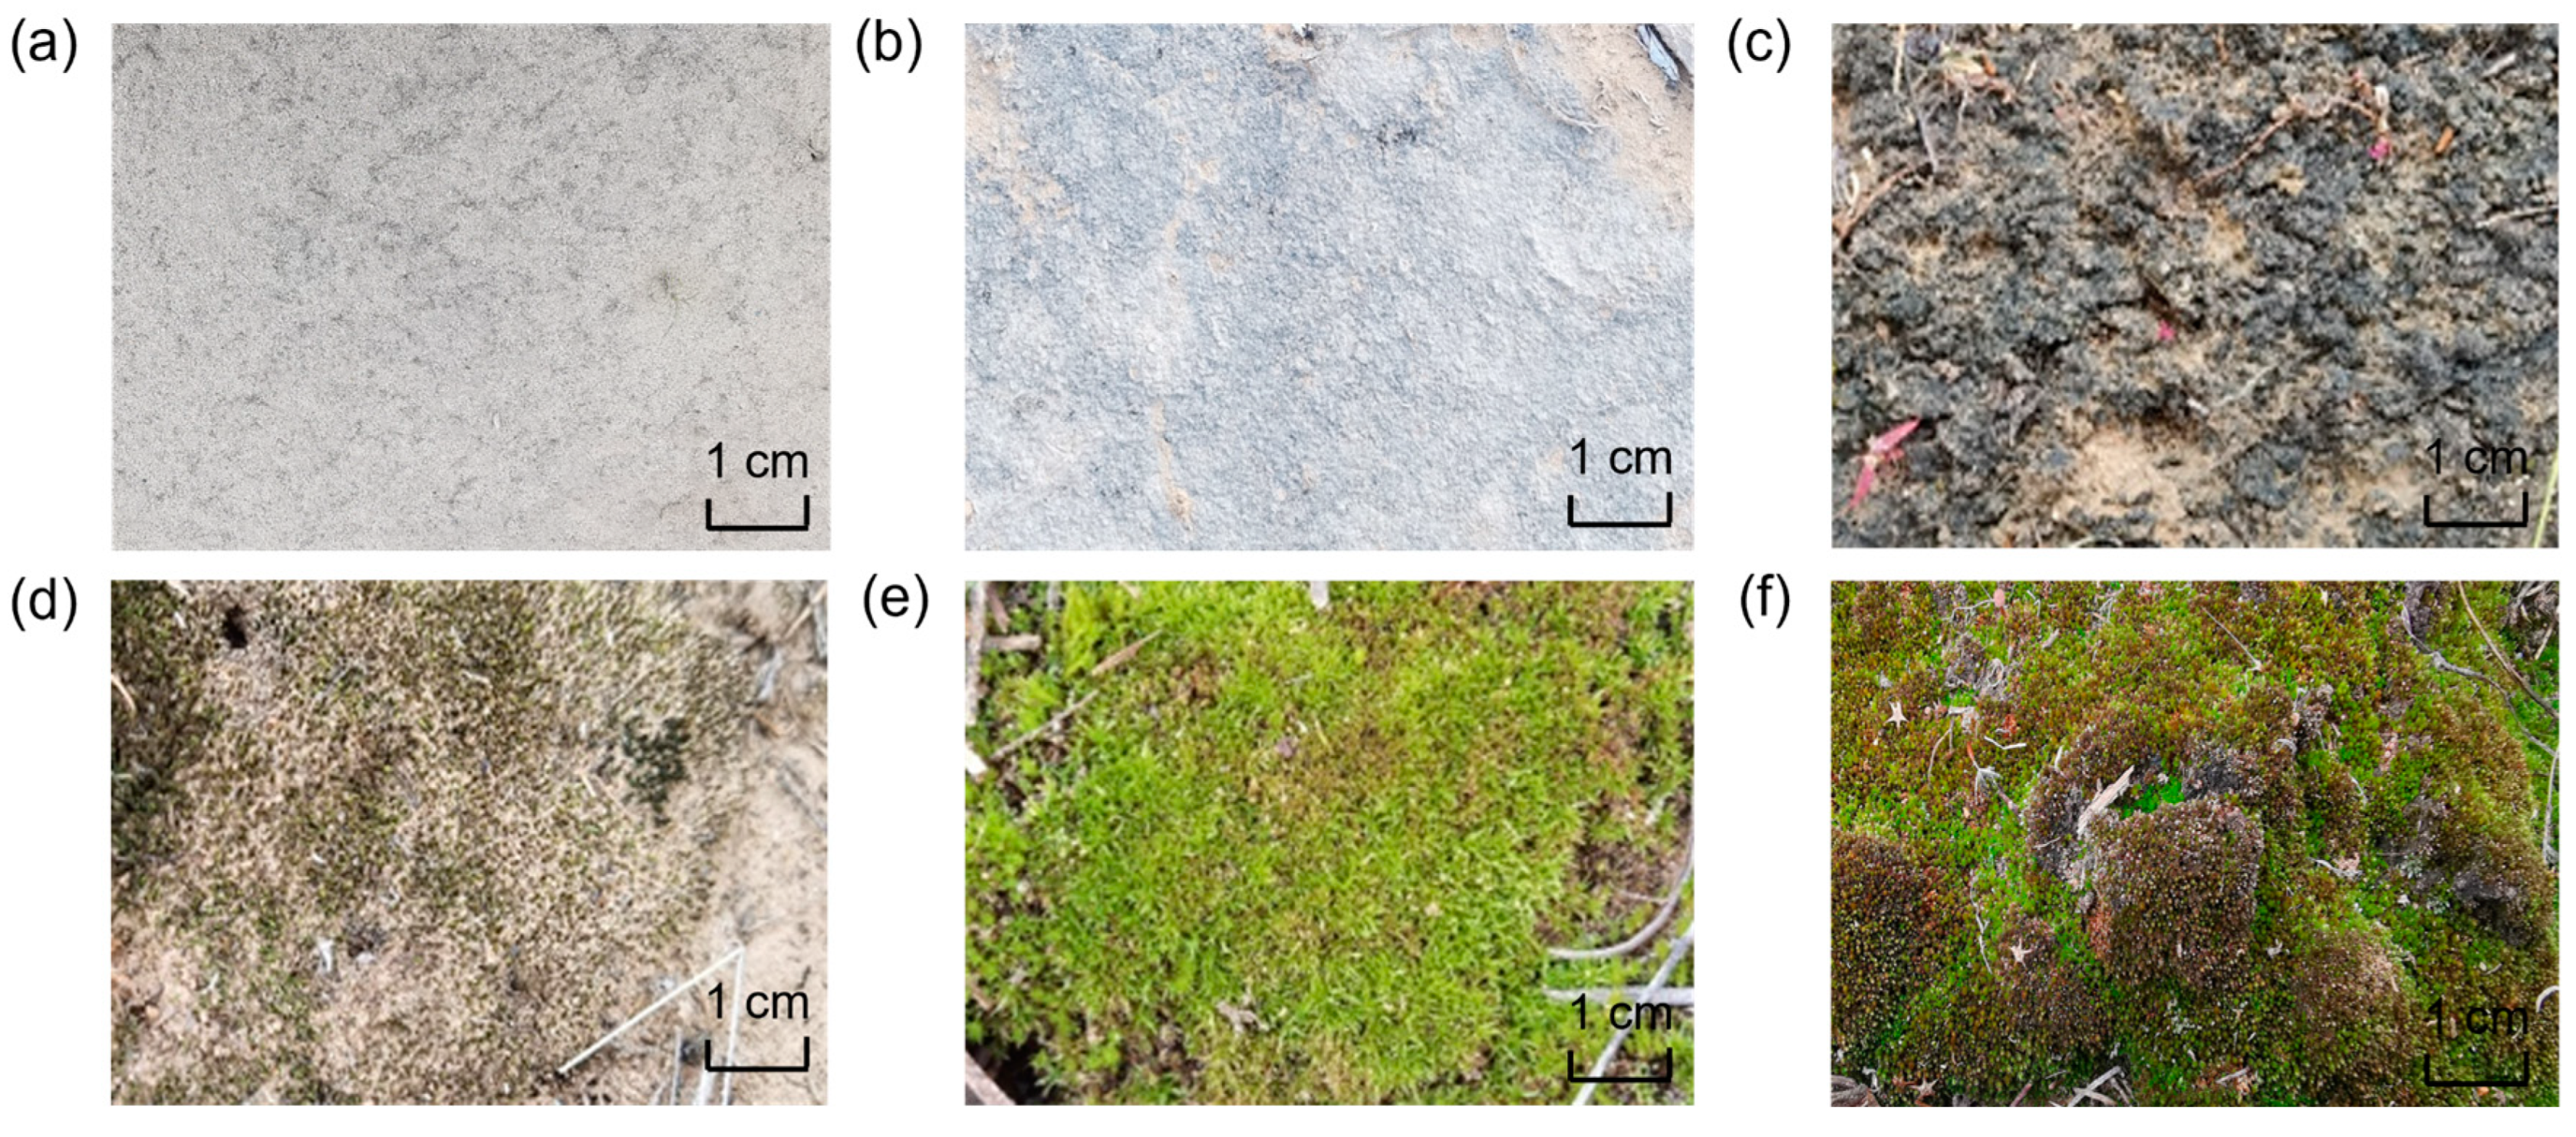
2.1. Refining the Grading Method for Cyanobacterial and Moss Crusts

The grading method was refined based on our survey experiences and previous research [33], which included visual developmental indicators such as biocrust color, surface features, thickness, and moss height (Table 1). Both cyanobacterial and moss crusts were classified into three distinct developmental grades corresponding to early, middle, and late succession. Cyanobacterial crusts were designated as Cyanobacterial I, II, and III (C I, C II, C III), while moss crusts were designated as Moss I, II, and III (M I, M II, M III) (Figure 1). Developmental grades of biocrusts were assessed and verified by multiple observations from investigators based on the grading method. For cyanobacterial crust, color, surface features, and thickness determined the grades, while, for moss crusts, color, thickness, and moss height were used. Results from their assessments verified that the grades were easily distinguishable based on the grading method. Mixed biocrusts were represented by the developmental grades of both cyanobacterial and moss crusts, along with their respective composition ratios.

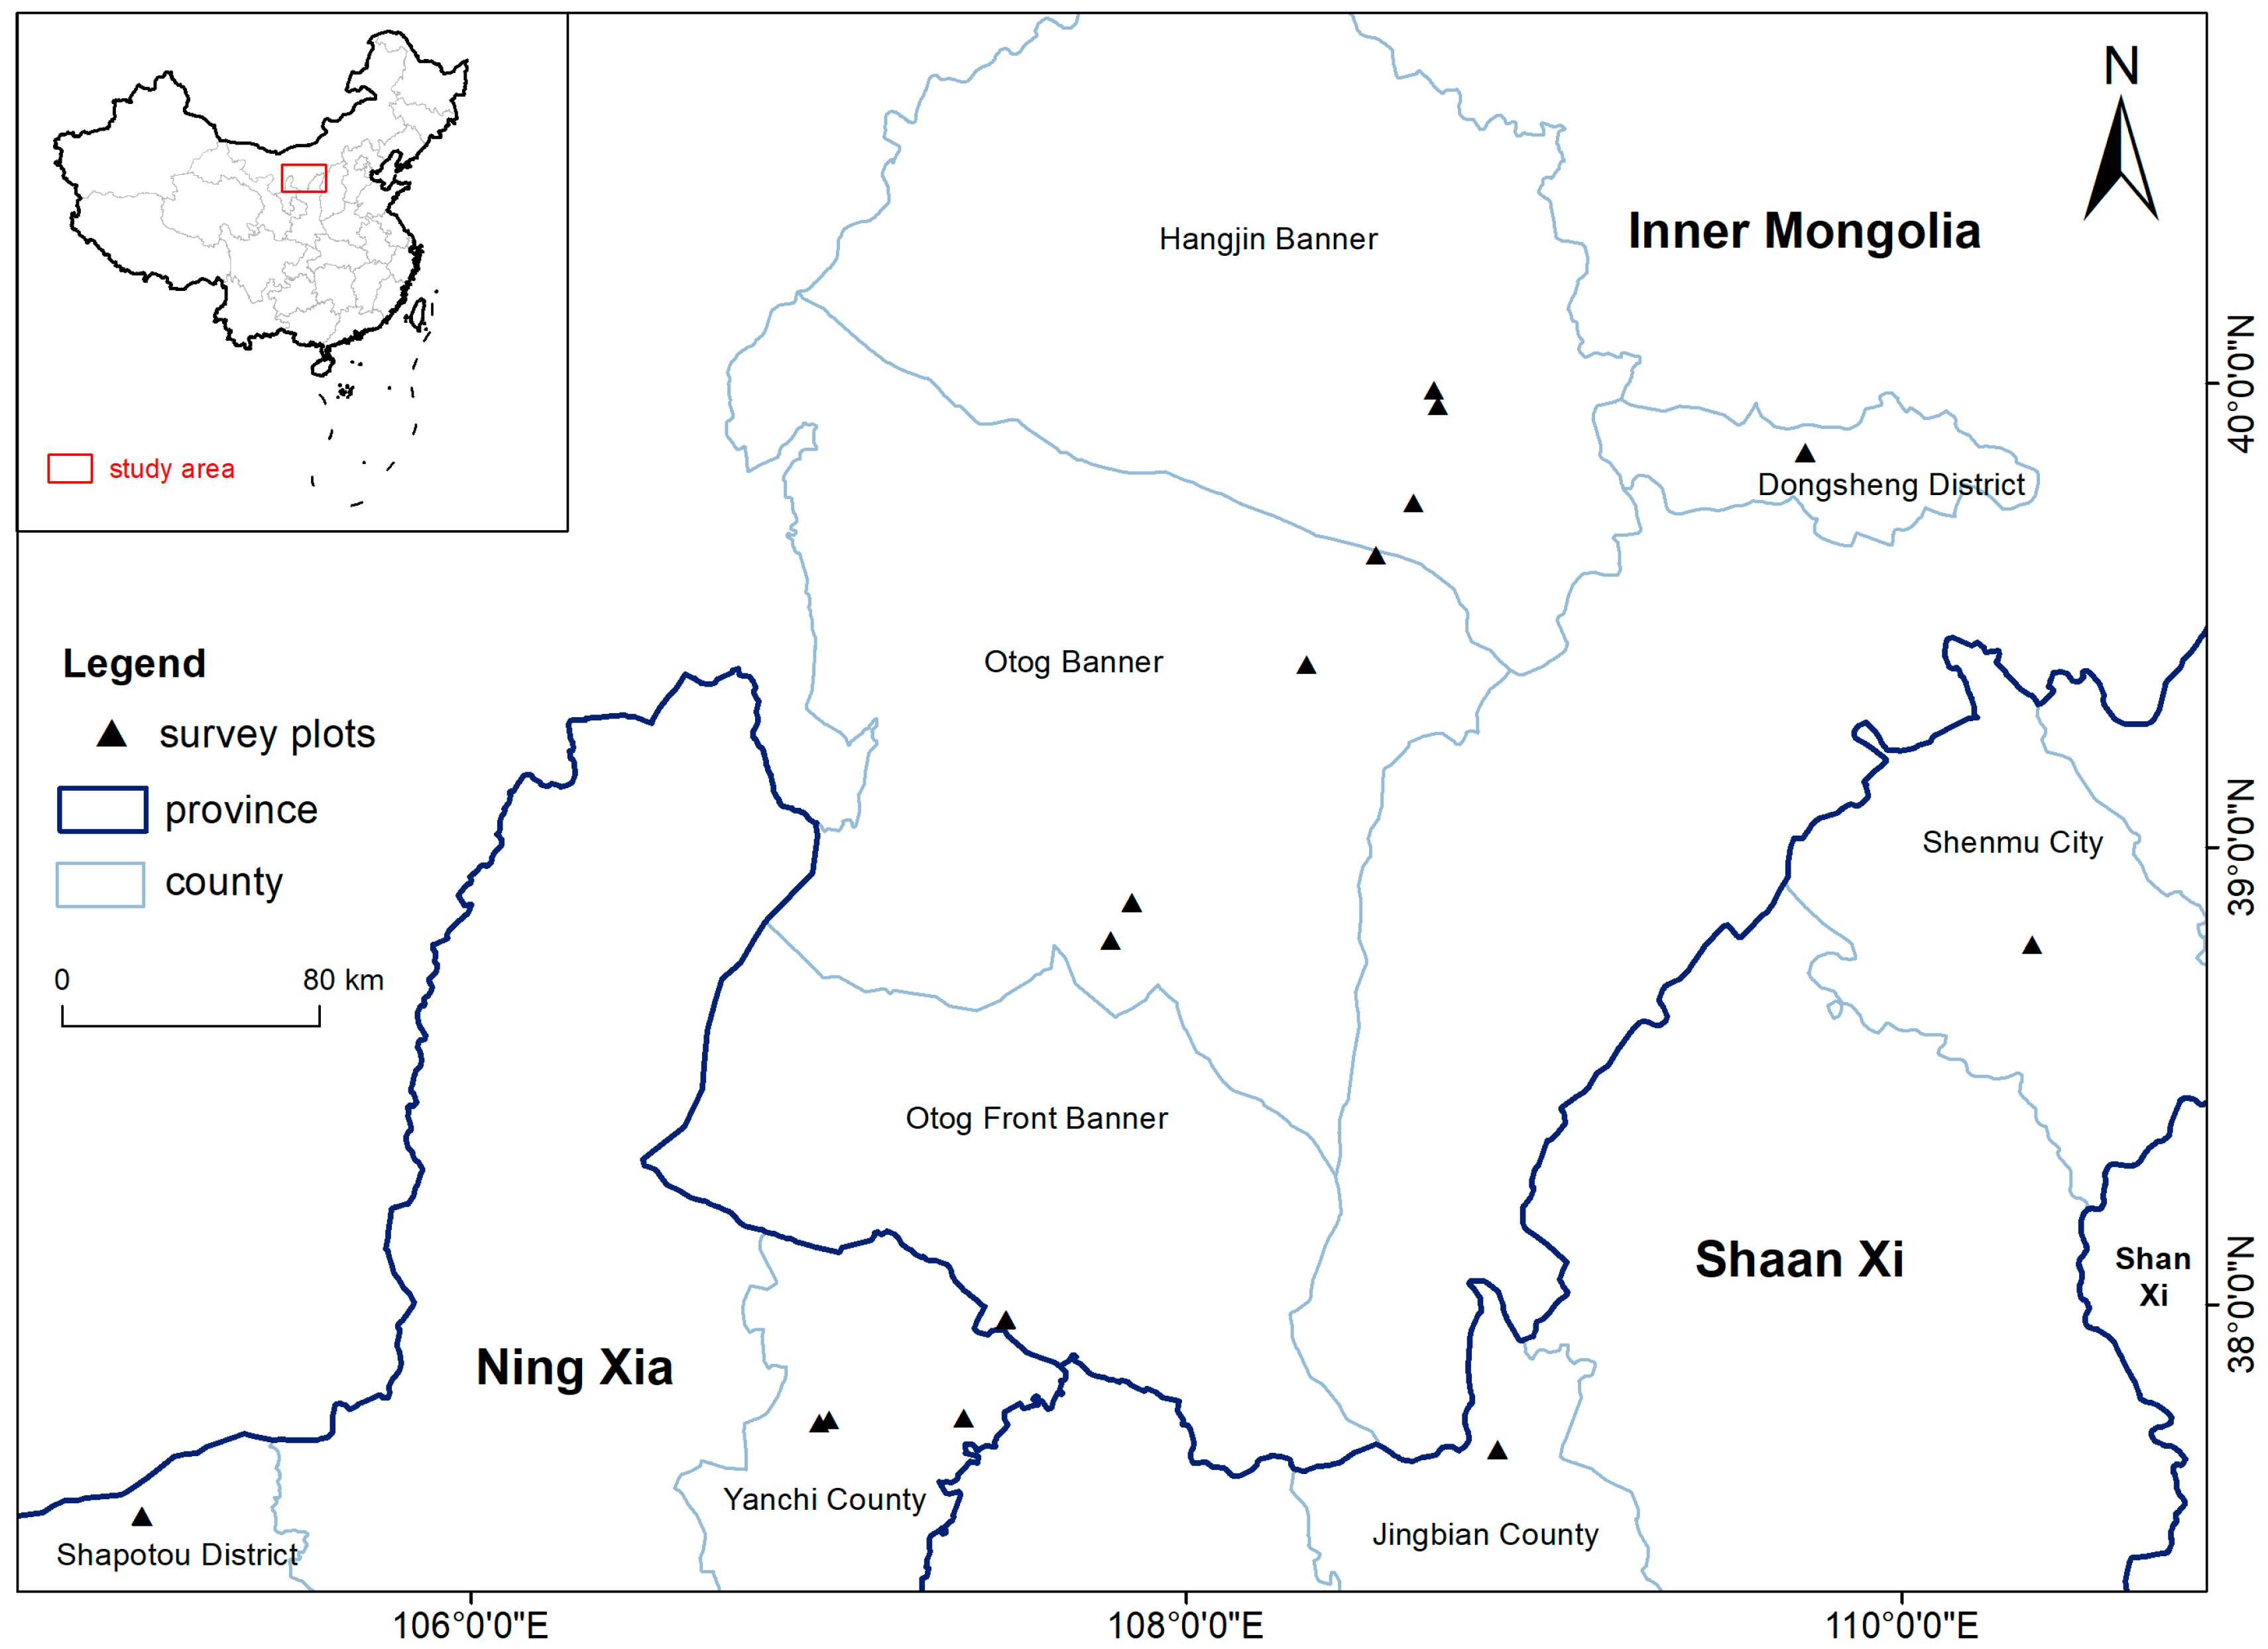
2.2. Study Site Description

The study sites were located at northern Ningxia, western Inner Mongolia, and northern Shaanxi, China (37°31′44.94″–39°57′3.42″ N, 105°4′52.36″–110°21′58.75″ E) (Figure 2). Data on precipitation were obtained from the National Centers for Environmental Information (NCEI) of the National Oceanic and Atmospheric Administration (NOAA) (https://www.ncei.noaa.gov (accessed on 17 June 2024)). Based on average annual precipitation data from 2003 to 2022 in China, the study sites were categorized into three distinct precipitation regions at 100 mm intervals (Table 2): 200–300 mm (Hangjin Banner, Otog Banner, Shapotou District), 300–400 mm (Otog Front Banner, Yanchi County), and 400–500 mm (Dongsheng District, Shenmu City, Jingbian County). The soil textures at these sites are characterized by sandy soil, sandy loam, and loamy sand, with approximately 75% biocrust coverage on the soil surface, predominantly consisting of cyanobacterial and moss crusts.

2.3. Field Measurements and Sampling

The field investigation and sampling for this study were conducted in October 2023, during a period of several days without rainfall prior to the survey. In each precipitation region, at least six survey plots were selected to represent a range of conditions, including free-grazing areas with varying levels of disturbance and abandoned lands with no human disturbance, as well as diverse soil substrate types, thus totaling 29 survey plots in the entire study (Table 2). In each plot, three 1 × 1 m representative quadrats containing well-developed mixed biocrusts were selected, aiming to encompass all developmental stages of cyanobacterial and moss crusts in the plot wherever possible.
During the sampling at each quadrat, the developmental stages of the biocrusts were assessed and recorded visually based on the grading method at first. Disturbance intensity was classified into four categories: none, light, moderate, and heavy [36]. Biocrust thickness, moss height (excluding sporophyte components), shear strength, and penetration resistance were measured three times and averaged in situ using a millimeter ruler (ENDO KEIKI, Tokyo, Japan), a portable shear strength tester (H-4212MH, Humboldt, Elgin, IL, USA), and a soil penetrometer (TYD-2, Saiyasi, Zhengzhou, China), respectively. Biocrust coverage was visually recorded by three staff members and averaged for each quadrat. Different developmental grades of biocrusts in each quadrat were sampled three times using 5 cm diameter cutting rings, which were then mixed into a single composite sample per developmental grade for chlorophyll a content analysis. Bulk density samples were collected using cutting rings, including the top 2 cm of soil beneath the biocrust. In the laboratory, the mechanical composition of the soil was analyzed using a particle size analyzer (MS2000, Malvern Panalytical, Malvern, UK) to determine the proportions of sand, silt, and clay particles [37], and the soil particle ratio was calculated as the ratio of silt and clay content to sand content. Furthermore, soil texture was determined by triangle coordinates of the international system of soil texture classification. The chlorophyll a content of the biocrusts was determined through spectrophotometry [38]. The bulk density of the biocrusts was measured using the coating film method [39].

2.4. Data Analysis

The intrinsic consistency between the developmental indicators measured and the developmental grades of biocrusts recorded in the field was assessed by a cluster analysis in R (4.3.2). Principal component analysis (PCA) was used to reduce the dimensionality of the data in R (4.3.2), which was combined with hierarchical clustering based on Ward’s method to conduct a cluster analysis. Additionally, the silhouette coefficient was used to determine the optimal number of clusters. The statistical characteristics of developmental indicators for cyanobacterial and moss crusts across different developmental grades were analyzed using classical statistical methods in IBM SPSS Statistics 26. The distribution characteristics of cyanobacterial and moss crusts at different developmental grades were conducted by hierarchical clustering in R (4.3.2) using the “NbClust” package, with Euclidean distance as the metric and average linkage as the clustering criterion. The relationship between the developmental grades of cyanobacterial and moss crusts and environmental factors was assessed using canonical correspondence analysis (CCA), conducted with the “vegan” package in R (4.3.2).

3. Results

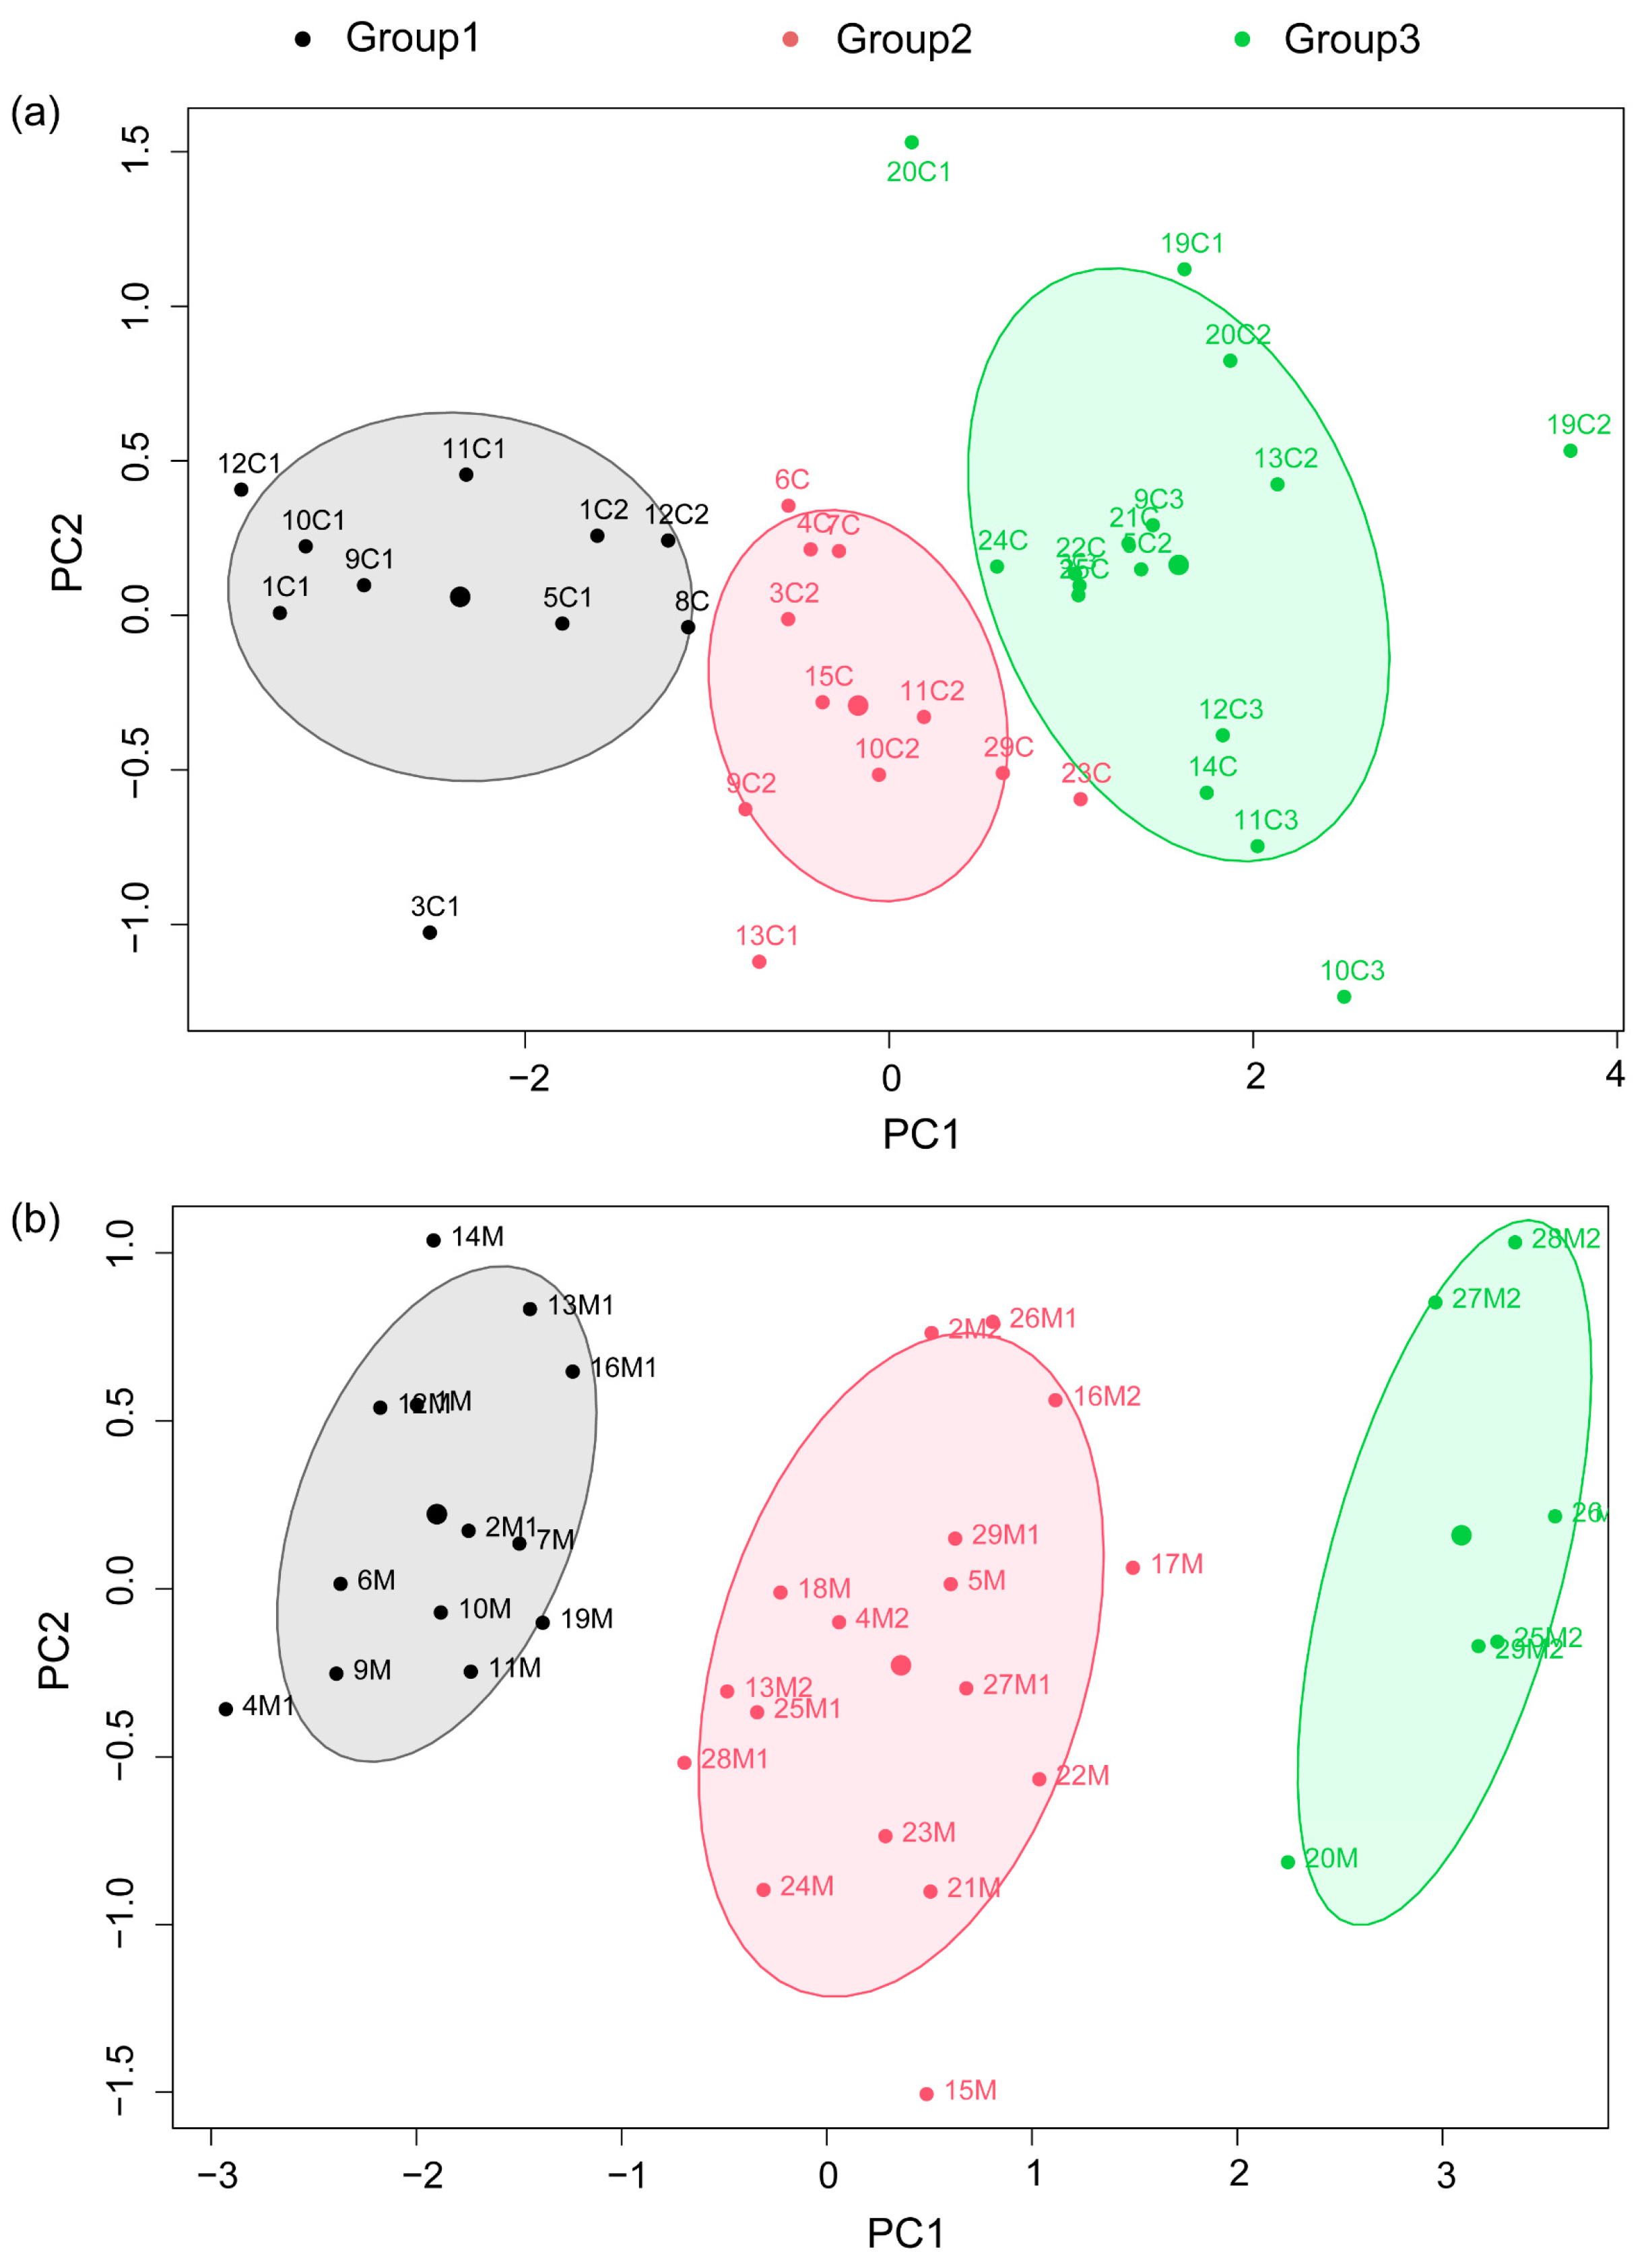
3.1. Verification of the Validity of the Grading Method

There was a 90% concordance between the clustering based on the developmental indicators of biocrusts measured and the developmental grades that were visually recorded in the field. Clustering analysis based on the measured developmental indicators of the cyanobacterial and moss crusts (shear strength, penetration resistance, chlorophyll a content, and thickness) showed that the best clustering numbers of both types formed three categories (Figure 3). The cyanobacterial crusts were clustered into three groups, which predominantly corresponded to cyanobacterial I, II, and III, respectively (Figure 3a). Similarly, the moss crusts were classified into three groups, mainly corresponding to moss I, II, and III (Figure 3b).

3.2. Characteristics of Developmental Indicators in Various Grades of Cyanobacterial and Moss Crusts Based on the Grading Method

The developmental indicators of cyanobacterial and moss crusts at different grades exhibited a regular trend (Figure 4). Shear strength, penetration resistance, and chlorophyll a content was observed in the following order: Moss III > Moss II > Moss I > Cyanobacterial III > Cyanobacterial II > Cyanobacterial I. In contrast, bulk density showed a trend of Cyanobacterial I > Cyanobacterial II > Cyanobacterial III > Moss I > Moss II > Moss III.
The coefficient of variation (CV) was used to illustrate the spatial variation of developmental indicators for cyanobacterial and moss crusts at the same developmental grade (Table 3), suggesting the significant influence of environmental factors. Biocrust coverage was at a moderate level (30% < CV < 100%), with the lowest CV observed in the M III (39.27%). Shear strength in the cyanobacterial crusts was also at a moderate level (30% < CV < 50%), while the shear strength of M I and M II showed strong variation (CV > 100%); however, M III exhibited a moderate CV (64.76%). Both penetration resistance (30% < CV < 90%) and chlorophyll a content (40% < CV < 80%) all indicated moderate variation. However, bulk density showed weak variation (10% < CV < 20%). Furthermore, cyanobacterial crusts showed higher CVs in both biocrust coverage and chlorophyll a content than moss crusts. Conversely, moss crusts showed higher CVs in shear strength and penetration resistance than cyanobacterial crusts. Additionally, the CV of bulk density between the two types of crusts showed minimal variation.

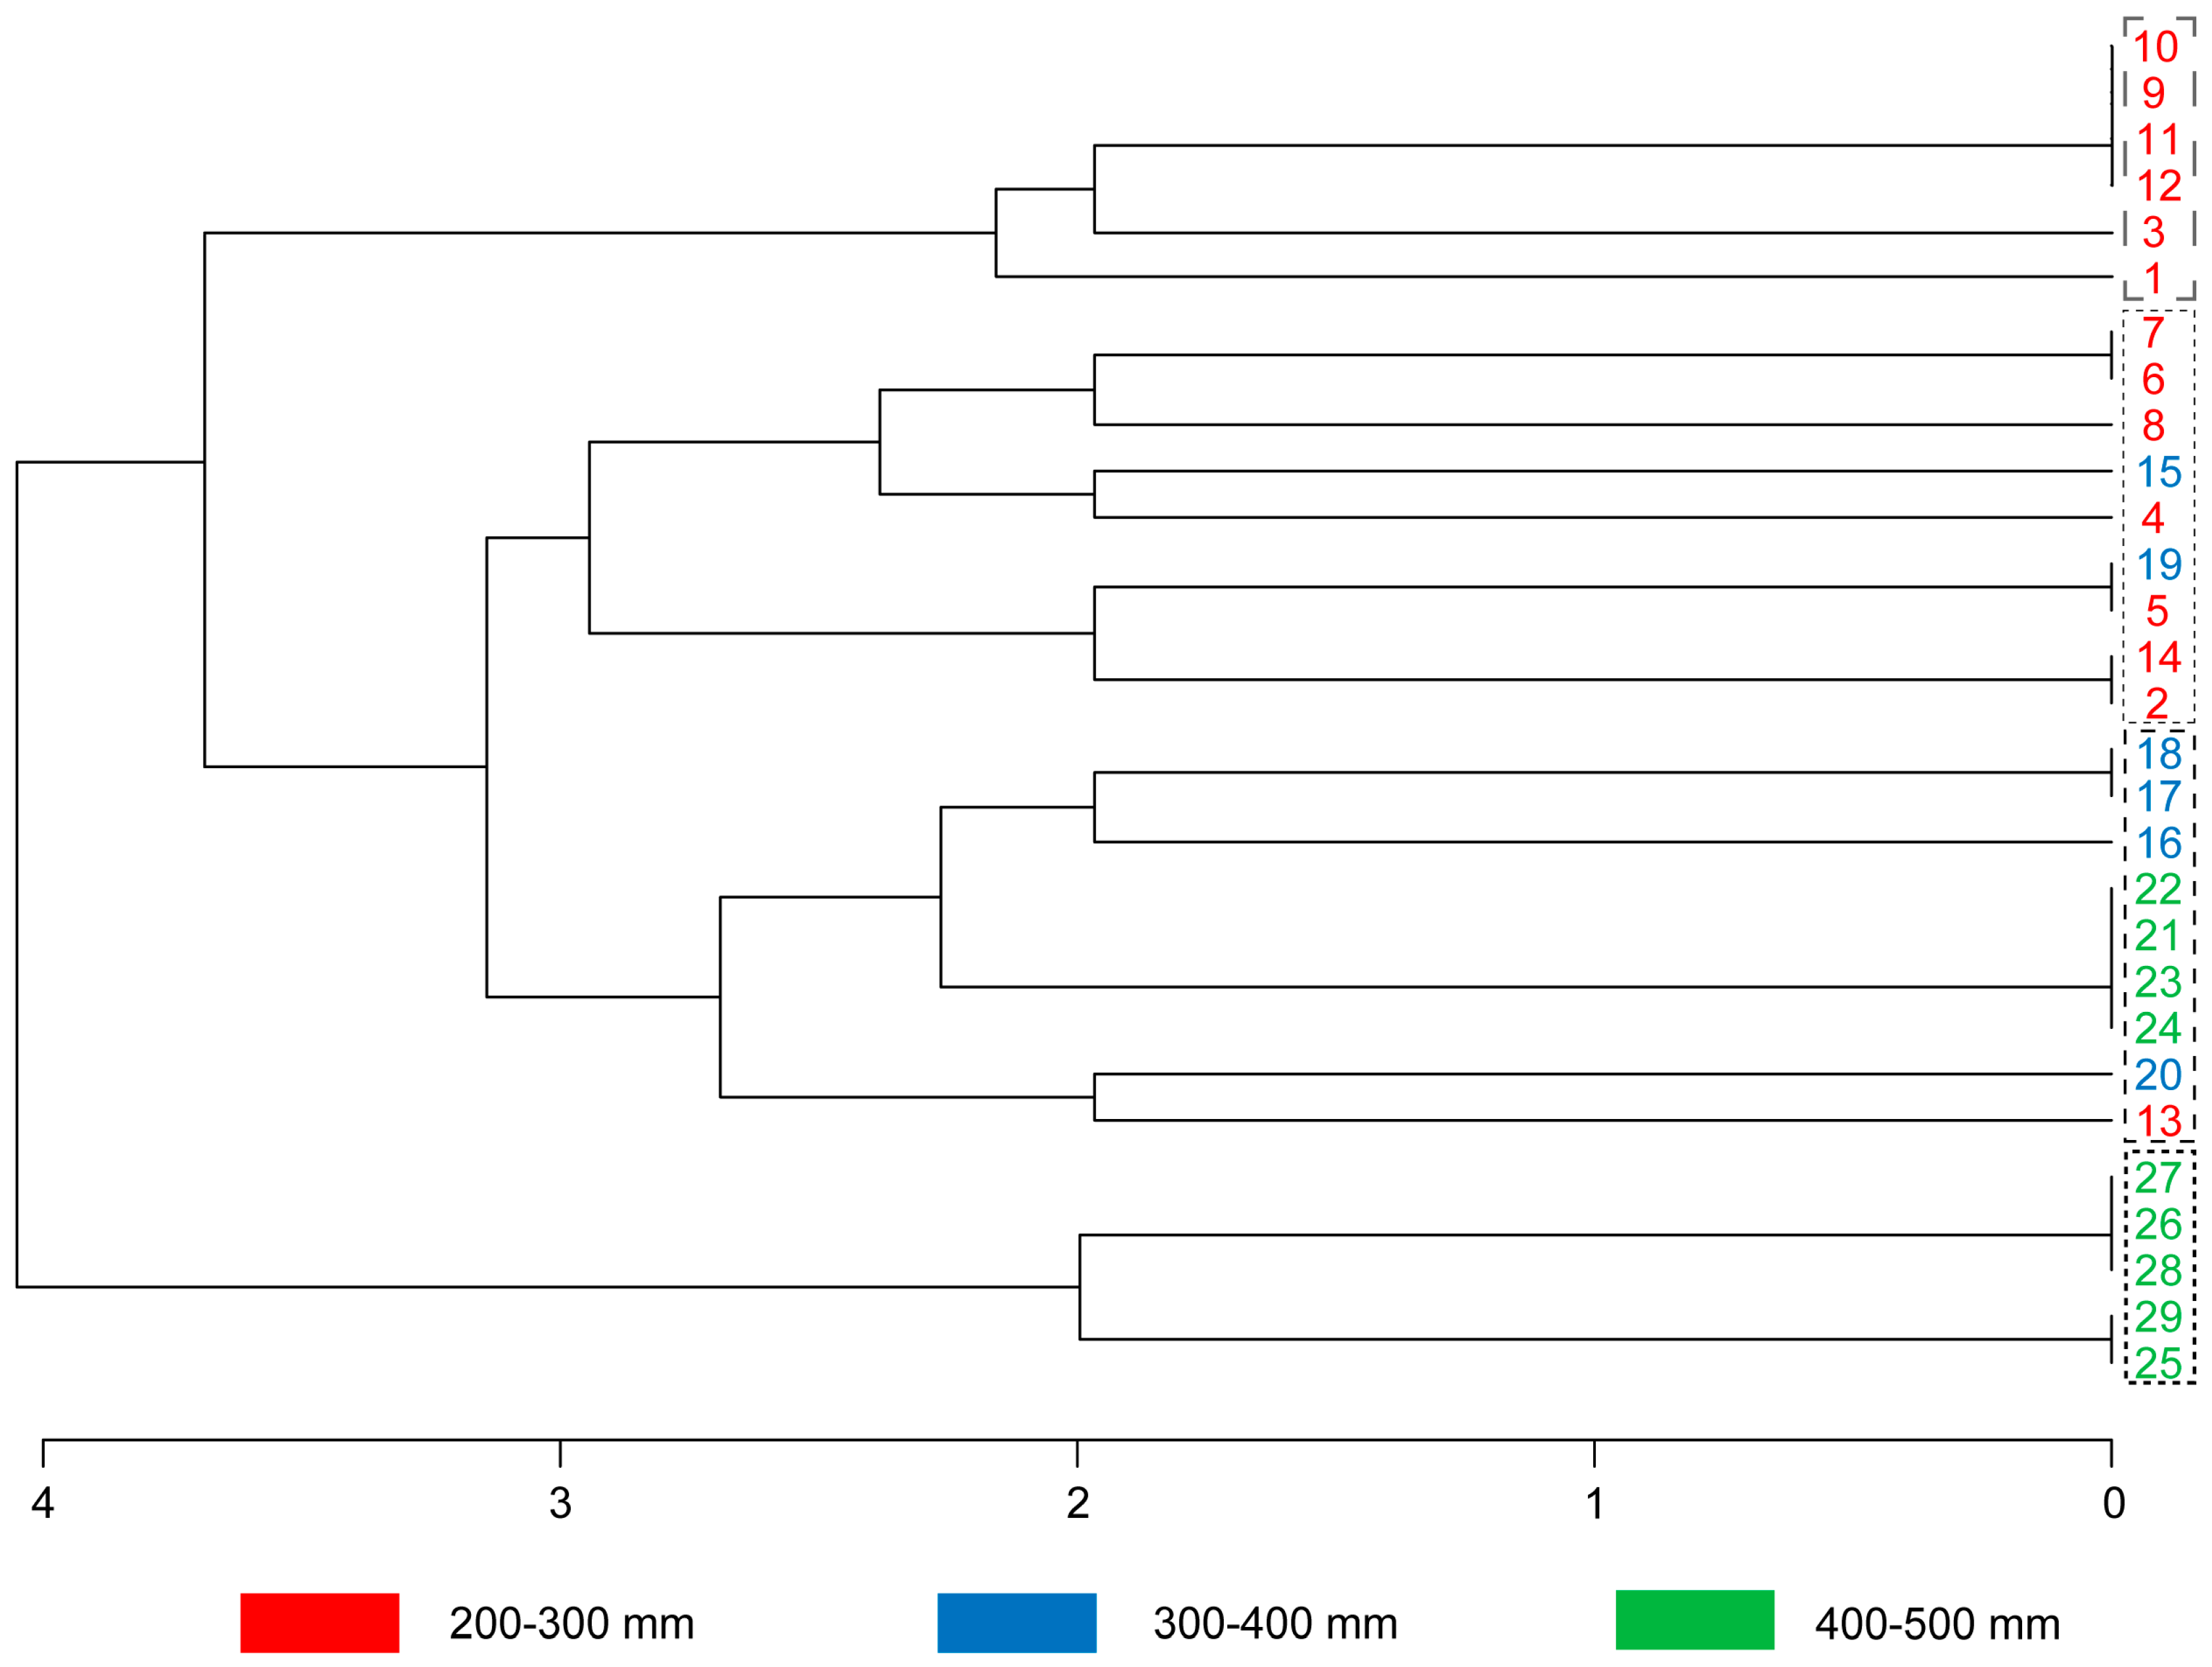
3.3. Application of Grading Method at Both Regional and Local Scale

At the regional scale, the 29 survey plots were classified into three groups based on hierarchical clustering (Figure 5). Group 1 included six plots within the 200–300 mm precipitation region, where soils were primarily sandy and the C I, C II, C III, and M I developmental grades of biocrusts predominated. Group 2 contained nine plots within the 200–400 mm precipitation region, dominated by sandy and sandy loam soils, with C II, C III, M I, and M II grades. Group 3 also included nine plots within the 300–500 mm precipitation region, dominated by sandy loam and sandy soils, with dominant C III and M II grades. Group 4 included five plots in the 400–500 mm precipitation region, where sandy loam soils and M II and M III grades prevailed. At the local scale, the grading method distinguished each developmental grade of biocrusts in the survey plot.

3.4. Relationship Between Developmental Grades of Biocrusts and Environmental Factors

The developmental grades of biocrusts had a strong significant correlation with precipitation (R2 = 0.838, p < 0.001) and relatively weak correlations with soil particle ratio (R2 = 0.373, p = 0.002) and disturbance intensity (R2 = 0.321, p = 0.005), while still statistically significant (p < 0.01) (Table 4). According to the Canonical Correspondence Analysis (CCA) ordination plot (Figure 6), the first ordination axis accounted for 86.02% of the total information, containing most of the relevant data. The distribution of cyanobacterial crusts was primarily observed in relatively arid environments characterized by frequent disturbances and higher sand content in the soil. For example, C I and C II distributed in the second quadrant, primarily influenced by disturbance intensity, while C III was found in the third quadrant. In contrast, moss crust was found in the first and fourth quadrants. M III was primarily influenced by higher precipitation, which was associated with more humid conditions, a relatively stable environment, and finer soil particles predominantly composed of silt and clay. Whereas M I and M II were distributed in environments characterized by lower precipitation compared to M III, coarser soil textures, and moderate disturbance intensities.

4. Discussion

4.1. Simplicity of the Grading Method

Based on cluster analysis, developmental indicators for cyanobacterial and moss crusts were classified into three categories, consistent with the defined three-grade method (Figure 3). The high consistency indicated that the grading method was closely associated with the developmental indicators of biocrusts, making it easier to apply in field surveys. As the developmental grade of cyanobacterial and moss crusts increased, their shear strength, penetration resistance, and chlorophyll a content also increased, while bulk density showed a decreasing trend (Figure 4). Previous studies have shown that biocrust coverage, thickness, chlorophyll a content, and surface roughness increase following power or exponential functions during development, serving as key indicators for assessing developmental stages [40,41]. Consequently, the defined grading method effectively represents the developmental status of biocrusts. Additionally, Belnap et al. [34] constructed six levels of development (LODs) for cyanobacterially dominated biocrusts based on visual color differentiation. However, during field applications, it was found that six LODs of cyanobacterial crust posed challenges in visual distinction due to variability in personal experience, ambient light, and moisture conditions. Hence, simplifying this grading method to three grades is enough to visually distinguish and record.

4.2. Applicability of the Grading Method at Various Spatial Scales

At the local scale, biocrust development was significantly influenced by microtopography, showing significant differences in developmental characteristics [28,42]. Applying the grading method in different sampling plots across various precipitation regions allowed cyanobacterial and moss crusts at different developmental stages (Table 2) to be distinguished, demonstrating the method’s sensitivity at the local scale.
At the regional scale, precipitation was the dominant environmental factor influencing the developmental grades of biocrusts. While disturbance intensity and soil particle ratio exhibited relatively weak correlations with these developmental grades, they remained statistically significant (Table 4). This could be attributed to the complex interplay of environmental conditions. Previous studies have shown that precipitation, soil texture, and distribution significantly influenced the development of cyanobacterial and moss crusts [43,44]. The development of biocrusts displayed a degree of convergence within regions with similar precipitation and soil texture (Figure 5). However, developmental indicators for cyanobacterial and moss crusts varied moderately to strongly across regions (Table 3), reflecting the influence of environmental heterogeneity at the regional scale. These findings highlight that the three-grade grading method effectively captures the impact of environmental differentiation on biocrust development across different spatial scales.

4.3. Scientificity of the Grading Method

The survey was conducted in October, a time when cyanobacterial and moss crusts were prominently exposed on the ground and easily identifiable, making it ideal for observing biocrusts in China’s dryland regions. During spring and summer, biocrusts benefit from ample water and sunlight, achieving high biomass accumulation and stable development by the summer–autumn transition. Therefore, conducting surveys during this period ensures reliable measurements of biocrust biomass and metabolic activity [45,46]. Seasonal dynamics primarily occur through variations in temperature and precipitation, which significantly influence the structure and diversity of microbial communities in biocrusts and their accumulated biomass [47,48]. Thus, it is crucial to select the optimal time for the field survey to collect a comprehensive range of biocrusts at various developmental stages. The survey spanned diverse habitats, including forested regions of the Loess Plateau, ecologically restored sandy lands, and desert margins, with annual precipitation ranging from 200 to 500 mm. The soil substrates included sandy soil, sandy loam, and loamy sand, with varying degrees of human disturbance in closed or abandoned lands. These diverse environmental conditions validated the general applicability of the grading method for biocrust developmental stages across different habitats and disturbance gradients.

4.4. Future Research Directions on Optimizing the Grading Method

This study refined and validated a grading method of cyanobacterial and moss crusts, demonstrating that it is simple and effective across various spatial scales, making it useful for recording in the field survey. Given that the developmental processes of biocrusts generally follow similar successional trajectories regardless of location, the grading method showed broad applicability in China’s dryland regions. However, certain limitations persist, particularly regarding the comprehensiveness of target objects and the geographical scope of validation. It is essential to further validate the grading method by applying it to other geographic areas for a more comprehensive understanding of biocrust succession at broader spatial and temporal scales.
Future research should aim to improve the grading method in the following aspects. Firstly, for lichen crusts, an effective visual grading method can be developed based on existing morphological classifications (e.g., foliose, squamulose, fruticose, crustose). Secondly, spatially, expanding the study to encompass a broader range of ecosystems and regions will facilitate the development of a standardized grading method for biocrusts. Temporally, the long-term application of the method at established observation sites is critical for tracking biocrust developmental processes, enabling iterative refinement of the grading method. Moreover, integrating advanced technologies such as molecular biology and high-throughput sequencing can enhance the validation of the grading method and provide deeper insights into the intrinsic differences among biocrust developmental grades. More importantly, integrating technological advancements such as hyperspectral imaging, machine learning, and advanced remote sensing techniques would enhance automated visual classification and enable multi-scale, large-area dynamic monitoring of biocrusts at various developmental stages, which would not only improve the applicability of the grading method but also support field researchers and non-specialists in identifying biocrust developmental stages efficiently.

5. Conclusions

The grading method is simple, effective, and applicable to drylands, enabling observers to visually distinguish and record the developmental stages of cyanobacterial and moss crusts. In dryland regions where cyanobacterial and moss crusts predominate within mixed biocrusts, this grading method will be useful for rapid field recording and surveying. The developmental grades of biocrusts corresponded with their developmental indicators, which represented the various stages of biocrust development. As the developmental grades of cyanobacterial and moss crusts increase, there was a concomitant rise in shear strength, penetration resistance, and chlorophyll a content, while bulk density decreased. Cyanobacterial and moss crusts at different developmental stages showed homogeneity within regions characterized by similar precipitation, soil texture, and disturbance intensity, while reflecting distinct environmental conditions across diverse regions.
However, the grading method has certain limitations. The comprehensiveness of the target objects remains limited, particularly concerning lichen crusts. The method’s validity has not been extensively applied in ecosystems with significantly different climatic conditions. Future research should focus on expanding the geographical scope of the method’s application and incorporating long-term monitoring to refine the grading method. Moreover, integrating advanced technologies will not only enhance the validation process but also improve automated visual gradation and large-area monitoring capabilities, which will support both experts and non-specialists in efficiently identifying and understanding biocrust developmental stages. In summary, while the grading method works well in the spatial differentiation of complex environmental variables and effectively reflects variations of biocrusts across different spatial scales, addressing its limitations and expanding its applicability will significantly enhance its utility and accuracy in future studies.

Author Contributions

Conceptualization, P.H. and X.Z.; methodology, X.Z.; software, X.Z.; validation, P.H., J.X. and X.Z.; formal analysis, J.X.; investigation, P.H., J.X. and X.Z.; resources, P.H.; data curation, X.Z.; writing—original draft preparation, X.Z.; writing—review and editing, P.H.; visualization, J.X.; supervision, P.H.; project administration, P.H.; funding acquisition, P.H. All authors have read and agreed to the published version of the manuscript.

Funding

This research was funded by the Joint Study on Ecological Protection and High-quality Development in the Yellow River Basin (Phase I) Project on Ecological Monitoring Network Construction and Ecological Quality Assessment in the Yellow River Basin (2022-YRUC-01-0101-02-01).

Data Availability Statement

The data presented in this study are available upon request from the corresponding author.

Conflicts of Interest

The authors declare no conflict of interest.

References

  1. Weber, B.; Belnap, J.; Büdel, B.; Antoninka, A.J.; Barger, N.N.; Chaudhary, V.B.; Darrouzet-Nardi, A.; Eldridge, D.J.; Faist, A.M.; Ferrenberg, S.; et al. What is a biocrust? A refined, contemporary definition for a broadening research community. Biol. Rev. Camb. Philos. Soc. 2022, 97, 1768–1785. [Google Scholar] [CrossRef]
  2. Zhou, H.; Gao, Y.; Jia, X.; Wang, M.; Ding, J.; Cheng, L.; Bao, F.; Wu, B. Network analysis reveals the strengthening of microbial interaction in biological soil crust development in the Mu Us Sandy Land, northwestern China. Soil Biol. Biochem. 2020, 144, 107782. [Google Scholar] [CrossRef]
  3. Ming, J.; Zhao, Y.; Wu, Q.; He, H.; Gao, L. Soil temperature dynamics and freezing processes for biocrustal soils in frozen soil regions on the Qinghai–tibet plateau. Geoderma 2022, 409, 115655. [Google Scholar] [CrossRef]
  4. Sun, F.H.; Xiao, B.; Ghanbarian, B. Increasing effect of biocrusts on evaporation is evidenced by simulating evaporation and diffusion experiments and water stable isotope analysis. J. Hydrol. 2024, 637, 131427. [Google Scholar] [CrossRef]
  5. Xu, L.; Zhu, B.; Li, C.; Yao, M.; Zhang, B.; Li, X. Development of biological soil crust prompts convergent succession of prokaryotic communities. Catena 2020, 187, 104360. [Google Scholar] [CrossRef]
  6. Zhou, X.; An, X.; De Philippis, R.; Ye, C.; Ke, T.; Zhang, Y.; Chen, L. The facilitative effects of shrub on induced biological soil crust development and soil properties. Appl. Soil Ecol. 2019, 137, 129–138. [Google Scholar] [CrossRef]
  7. Chen, N.; Wang, X.P.; Zhang, Y.F.; Yu, K.L.; Zhao, C.M. Ecohydrological effects of biological soil crust on the vegetation dynamics of restoration in a dryland ecosystem. J. Hydrol. 2018, 563, 1068–1077. [Google Scholar] [CrossRef]
  8. Xu, H.K.; Zhang, Y.J.; Shao, X.Q.; Liu, N. Soil nitrogen and climate drive the positive effect of biological soil crusts on soil organic carbon sequestration in drylands: A Meta-analysis. Sci. Total Environ. 2022, 803, 150030. [Google Scholar] [CrossRef]
  9. Steggles, E.K.; Facelli, J.M.; Ainsley, P.J.; Pound, L.M. Biological soil crust and vascular plant interactions in Western Myall open woodland in South Australia. J. Veg. Sci. 2019, 30, 756–764. [Google Scholar] [CrossRef]
  10. Su, Y.G.; Chen, Y.W.; Padilla, F.M.; Zhang, Y.M.; Huang, G. The influence of biocrusts on the spatial pattern of soil bacterial communities: A case study at landscape and slope scales. Soil Biol. Biochem. 2020, 142, 107721. [Google Scholar] [CrossRef]
  11. Bu, C.F.; Li, R.X.; Wang, C.; Bowker, M.A. Successful field cultivation of moss biocrusts on disturbed soil surfaces in the short term. Plant Soil 2018, 429, 227–240. [Google Scholar] [CrossRef]
  12. Chiquoine, L.P.; Abella, S.R.; Bowker, M.A. Rapidly restoring biological soil crusts and ecosystem functions in a severely disturbed desert ecosystem. Ecol. Appl. 2016, 26, 1260–1272. [Google Scholar] [CrossRef] [PubMed]
  13. Lan, S.B.; Thomas, A.D.; Rakes, J.B.; Garcia-Pichel, F.; Li, W.; Hu, C.X. Cyanobacterial community composition and their functional shifts associated with biocrust succession in the Gurbantunggut Desert. Environ. Microbiol. Rep. 2021, 13, 884–898. [Google Scholar] [CrossRef] [PubMed]
  14. Liu, Y.R.; Delgado-Baquerizo, M.; Trivedi, P.; He, J.Z.; Wang, J.T.; Singh, B.K. Identity of biocrust species and microbial communities drive the response of soil multifunctionality to simulated global change. Soil Biol. Biochem. 2017, 107, 208–217. [Google Scholar] [CrossRef]
  15. Sosa-Quintero, J.; Godínez-Alvarez, H.; Camargo-Ricalde, S.L.; Gutiérrez-Gutiérrez, M.; Huber-Sannwald, E.; Jiménez-Aguilar, A.; Maya-Delgado, Y.; Mendoza-Aguilar, D.; Montaño, N.M.; Pando-Moreno, M. Biocrusts in Mexican deserts and semideserts: A review of their species composition, ecology, and ecosystem function. J. Arid Environ. 2022, 199, 104712. [Google Scholar] [CrossRef]
  16. Chamizo, S.; Cantón, Y.; Lázaro, R.; Solé-Benet, A.; Domingo, F. Crust composition and disturbance drive infiltration through biological soil crusts in semiarid ecosystems. Ecosystems 2012, 15, 148–161. [Google Scholar] [CrossRef]
  17. Zhang, L. Effects of mixed biocrusts on soil nutrients and bacterial community structure: A case study from Hilly Loess Plateau, China. Sci. Rep. 2024, 14, 21265. [Google Scholar] [CrossRef] [PubMed]
  18. Bertrand, I.; Ehrhardt, F.; Alavoine, G.; Joulian, C.; Issa, O.M.; Valentin, C. Regulation of carbon and nitrogen exchange rates in biological soil crusts by intrinsic and land use factors in the Sahel area. Soil Biol. Biochem. 2014, 72, 133–144. [Google Scholar] [CrossRef]
  19. Sun, F.; Xiao, B.; Kidron, G.J.; Heitman, J.L. Insights about biocrust effects on soil gas transport and aeration in drylands: Permeability, diffusivity, and their connection to hydraulic conductivity. Geoderma 2022, 427, 116137. [Google Scholar] [CrossRef]
  20. Zhao, Y.; Xu, W.; Wang, N. Effects of covering sand with different soil substrates on the formation and development of artificial biocrusts in a natural desert environment. Soil Tillage Res. 2021, 213, 105081. [Google Scholar] [CrossRef]
  21. Bengtsson, J. Which species? What kind of diversity? Which ecosystem function? Some problems in studies of relations between biodiversity and ecosystem function. Appl. Soil Ecol. 1998, 10, 191–199. [Google Scholar] [CrossRef]
  22. McLaren, J.R.; Turkington, R. Ecosystem properties determined by plant functional group identity. J. Ecol. 2010, 98, 459–469. [Google Scholar] [CrossRef]
  23. Eldridge, D.J.; Rosentreter, R. Morphological groups: A framework for monitoring microphytic crusts in arid landscapes. J. Arid Environ. 1999, 41, 11–25. [Google Scholar] [CrossRef]
  24. Read, C.F.; Duncan, D.H.; Vesk, P.A.; Elith, J. Biocrust morphogroups provide an effective and rapid assessment tool for drylands. J. Appl. Ecol. 2014, 51, 1740–1749. [Google Scholar] [CrossRef]
  25. Belnap, J.; Wilcox, B.P.; Van Scoyoc, M.W.; Phillips, S.L. Successional stage of biological soil crusts: An accurate indicator of ecohydrological condition. Ecohydrology 2013, 6, 474–482. [Google Scholar] [CrossRef]
  26. Kidron, G.J.; Lichner, L.; Fischer, T.; Starinsky, A.; Or, D. Mechanisms for biocrust-modulated runoff generation-A review. Earth Sci. Rev. 2022, 231, 104100. [Google Scholar] [CrossRef]
  27. Webber, C.L.; Bremer, U.F.; Taghizadeh-Mehrjardi, R.; Weber, B.; Rosa, A.; Scholten, T.; Seitz, S. Biological soil crusts as a major ecosystem component in sandization areas of the Brazilian Pampa. Geoderma Reg. 2023, 34, e00682. [Google Scholar] [CrossRef]
  28. Wang, Y.F.; Xiao, B.; Wang, W.F.; Revillini, D.; Delgado-Baquerizo, M. Biocrust adaptations to microhabitat alter bacterial communities in a semiarid ecosystem. Plant Soil 2023, 492, 413–427. [Google Scholar] [CrossRef]
  29. Zhao, Y.; Xu, M.; Belnap, J. Potential nitrogen fixation activity of different aged biological soil crusts from rehabilitated grasslands of the hilly Loess Plateau, China. J. Arid Environ. 2010, 74, 1186–1191. [Google Scholar] [CrossRef]
  30. Bowker, M.A.; Reed, S.C.; Belnap, J.; Phillips, S.L. Temporal variation in community composition, pigmentation, and Fv/Fm of desert cyanobacterial soil crusts. Microb. Ecol. 2002, 43, 13–25. [Google Scholar] [CrossRef]
  31. Housman, D.C.; Powers, H.H.; Collins, A.D.; Belnap, J. Carbon and nitrogen fixation differ between successional stages of biological soil crusts in the Colorado Plateau and Chihuahuan Desert. J. Arid Environ. 2006, 66, 620–634. [Google Scholar] [CrossRef]
  32. Yin, R.; Wu, Y.; Zhang, X.; Ha, S.; Ren, J.; Tian, X.; Wang, J.; Li, Z.; Miao, H. Study on Physicochemical Properties of Biological Crusts and Subsurface Sediments in Southern Edge of Mu Us Desert. J. Soil Water Conserv. 2013, 27, 120–124. [Google Scholar] [CrossRef]
  33. Li, Y.P. Study on Characteristics of Soil Nutrients and Carbon Storage in Biocrusts and Underlying Soil of Mu Us Sandland. Master’s Thesis, Northwest A&F University, Xianyang, China, 2018. [Google Scholar]
  34. Belnap, J.; Phillips, S.L.; Witwicki, D.L.; Miller, M.E. Visually assessing the level of development and soil surface stability of cyanobacterially dominated biological soil crusts. J. Arid Environ. 2008, 72, 1257–1264. [Google Scholar] [CrossRef]
  35. Caster, J.; Sankey, T.T.; Sankey, J.B.; Bowker, M.A.; Buscombe, D.; Duniway, M.C.; Barger, N.; Faist, A.; Joyal, T. Biocrust and the soil surface: Influence of climate, disturbance, and biocrust recovery on soil surface roughness. Geoderma 2021, 403, 115369. [Google Scholar] [CrossRef]
  36. Ma, X.X.; Zhao, Y.G.; Ma, N.; Li, W.; Sun, H.; Xu, M.X. Effects of grazing on soil organic carbon stocks in the revegetated grasslands on the Loess Plateau, China. J. Appl. Ecol 2022, 33, 67–75. [Google Scholar] [CrossRef]
  37. Zhang, P.; Wang, D.; Zhang, Z.; Ding, C.; Li, P.; Liu, R.; Zhang, X.; Wen, W. Variation of soil water stability and dominant influencing factors after sparse forestation in the loess alpine hills of northwest China. J. Hydrol. Reg. Stud. 2023, 48, 101458. [Google Scholar] [CrossRef]
  38. Lan, S.; Wu, L.; Zhang, D.; Hu, C. Effects of light and temperature on open cultivation of desert cyanobacterium Microcoleus vaginatus. Bioresour. Technol. 2015, 182, 144–150. [Google Scholar] [CrossRef] [PubMed]
  39. Gao, L.; Bowker, M.A.; Sun, H.; Zhao, J.; Zhao, Y. Linkages between biocrust development and water erosion and implications for erosion model implementation. Geoderma 2020, 357, 113973. [Google Scholar] [CrossRef]
  40. Gao, L.Q.; Bowker, M.A.; Xu, M.X.; Sun, H.; Tuo, D.F.; Zhao, Y.G. Biological soil crusts decrease erodibility by modifying inherent soil properties on the Loess Plateau, China. Soil Biol. Biochem. 2017, 105, 49–58. [Google Scholar] [CrossRef]
  41. Li, S.L.; Bowker, M.A.; Xiao, B. Biocrust impacts on dryland soil water balance: A path toward the whole picture. Glob. Change Biol. 2022, 28, 6462–6481. [Google Scholar] [CrossRef] [PubMed]
  42. Li, X.R.; He, M.Z.; Zerbe, S.; Li, X.J.; Liu, L.C. Micro-geomorphology determines community structure of biological soil crusts at small scales. Earth Surf. Process. Landf. 2010, 35, 932–940. [Google Scholar] [CrossRef]
  43. Rodríguez-Caballero, E.; Román, J.R.; Chamizo, S.; Roncero Ramos, B.; Cantón, Y. Biocrust landscape-scale spatial distribution is strongly controlled by terrain attributes: Topographic thresholds for colonization in a semiarid badland system. Earth Surf. Process. Landf. 2019, 44, 2771–2779. [Google Scholar] [CrossRef]
  44. Wu, L.; Zhang, Y. Precipitation and soil particle size co-determine spatial distribution of biological soil crusts in the Gurbantunggut Desert, China. J. Arid Land 2018, 10, 701–711. [Google Scholar] [CrossRef]
  45. Han, Y.; Wang, Q.; Li, Q.; Hu, C. Active metabolism and biomass dynamics of biocrusts are shaped by variation in their successional state and seasonal energy sources. Sci. Total Environ. 2022, 831, 154756. [Google Scholar] [CrossRef]
  46. Zhang, X.C.; Li, J.Y.; Liu, J.L.; Yuan, C.X.; Li, Y.N.; Liu, B.R.; Yan, X.F. Temporal shifts in cyanobacterial diversity and their relationships to different types of biological soil crust in the southeastern Tengger Desert. Rhizosphere 2021, 17, 100322. [Google Scholar] [CrossRef]
  47. Maestre, F.T.; Delgado-Baquerizo, M.; Jeffries, T.C.; Eldridge, D.J.; Ochoa, V.; Gozalo, B.; Quero, J.L.; García-Gómez, M.; Gallardo, A.; Ulrich, W.; et al. Increasing aridity reduces soil microbial diversity and abundance in global drylands. Proc. Natl. Acad. Sci. USA 2015, 112, 15684–15689. [Google Scholar] [CrossRef]
  48. Nevins, C.J.; Inglett, P.W.; Reardon, C.L.; Strauss, S.L. Seasonality drives microbiome composition and nitrogen cycling in soil below biocrusts. Soil Biol. Biochem. 2022, 166, 108551. [Google Scholar] [CrossRef]
Figure 1. Cyanobacterial crust and moss crust of different developmental grades. (a) Cyanobacterial I. (b) Cyanobacterial II. (c) Cyanobacterial III. (d) Moss I. (e) Moss II. (f) Moss III.
Land 14 00180 g001
Figure 2. The study area location and the survey site distribution.
Land 14 00180 g002
Figure 3. Cluster analysis of development indicators of cyanobacterial crust and moss crust. The serial number meaning is survey plot number, C (Cyanobacterial crust)/M (Moss crust), developmental grades, respectively. (a) Cluster analysis of cyanobacterial crust. (b) Cluster analysis of moss crust.
Land 14 00180 g003
Figure 4. Characteristics of developmental indicators of cyanobacterial and moss crusts at different developmental grades. C I, C II, and C III are developmental grades of cyanobacterial crust, meaning Cyanobacterial I, Cyanobacterial II, and Cyanobacterial III. M I, M II, and M III are developmental grades of moss crust, meaning Moss I, Moss II, and Moss III.
Land 14 00180 g004
Figure 5. Hierarchical cluster analysis of 29 survey plots, divided into four groups. The plots in each group had similar combinations of biocrust developmental grades, precipitation, and soil texture. The plot details of developmental grades and soil texture are as follows. Plot 1: C I, C II, M I, sandy soil; Plot 2: M I, M II, loamy sandy soil; Plot 3: C I, C II, C III, sandy soil; Plot 4: C II, C I, M II, sandy soil; Plot 5: C II, C III, MII, sandy soil; Plot 6: C II, M I, sandy soil; Plot 7: C II, M I, sandy soil; Plot 8: C II, sandy soil; Plot 9: C I, C II, C III, M I, sandy soil; Plot 10: C I, C II, C III, M I, sandy soil; Plot 11: C I, C II, C III, M I, sandy soil; Plot 12: C I, C II, C III, M I, sandy soil; Plot 13: C II, C III, M I, M II, sandy soil; Plot 14: C III, M I, sandy soil; Plot 15: C II, M II, sandy loam; Plot 16: M I, M II, sandy soil; Plot 17: M II, sandy soil; Plot 18: M II, loamy sandy soil; Plot 19: C II, C III, M I, sandy loam; Plot 20: C II, C III, M II, sandy soil; Plot 21: C III, M II, loamy sandy soil; Plot 22: C III, M II, loamy sandy soil; Plot 23: C III, M II, loamy sandy soil; Plot 24: C III, M II, loamy sandy soil; Plot 25: C III, M II, M III, loamy sandy soil; Plot 26: M II, M III, sandy soil; Plot 27: M II, M III, sandy soil; Plot 28: M II, M III, sandy soil; Plot 29: C III, M II, M III, sandy soil.
Land 14 00180 g005
Figure 6. CCA analysis between environmental factors and different developmental grades of biocrusts. C I, C II, and C III are developmental grades of cyanobacterial crust, meaning Cyanobacterial I, Cyanobacterial II, and Cyanobacterial III. M I, M II, and M III are developmental grades of moss crust, meaning Moss I, Moss II, and Moss III.
Land 14 00180 g006
Table 1. Visual developmental indicators of biocrusts and their threshold interval used in the grading method.
Developmental GradesC IC IIC IIIM IM IIM III
ColorNot obvious slightly grayishGrey-white, light grey-grey blackDark brown-blackNot obvious
green-light green
Green-dark greenBrownish green
Surface featuresSmooth surface, closely adhering to soil surface featuresIntermediate state, slightly roughRough surface with pronounced undulations
Thickness/mm1~33~5>53~77~12>12
Moss height/mm0~1.51.5~4>4
Table 2. Basic information of the study site and 29 survey plots, including the survey plot names, locations, soil texture characteristics, developmental grades of biocrusts, and the corresponding precipitation region.
LocationsAverage Annual Precipitation/mmPrecipitation Region/mmNumberSurvey
Plot Name
Soil TextureDevelopmental Grades
Hangjin Banner, Ordos, Inner Mongolia, China261.71200–3001Hangjin-1Sandy soilC I, C II, M I
2Hangjin-2Loamy sandy soilM I, M II
Otog Banner, Ordos, Inner Mongolia, China293.893Otog-1Sandy soilC I, C II, C III
4Otog-2Sandy soilC I, C II, M II
5Otog-3Sandy soilC II, C III, MII
6Otog-4Sandy soilC II, M I
7Otog-5aSandy soilC II, M I
8Otog-5bSandy soilC II
9Otog-5cSandy soilC I, C II, C III, M I
Shapotou District, Zhongwei, Ningxia Province, China296.7410Shapotou-1Sandy soilC I, C II, C III, M I
11Shapotou-2Sandy soilC I, C II, C III, M I
12Shapotou-3Sandy soilC I, C II, C III, M I
13Shapotou-4Sandy soilC II, C III, M I, M II
14Shapotou-5Sandy soilC III, M I
Otog Front Banner, Ordos, Inner Mongolia, China357.90300–40015OtogF-1Sandy loamC II, M II
Yanchi County, Wuzhong, Ningxia Province, China378.4716Yanchi-1aSandy soilM I, M II
17Yanchi-1bSandy soilM II
18Yanchi-1cLoamy sandy soilM II
19Yanchi-2Sandy loamC II, C III, M I
20Yanchi-3Sandy soilC II, C III, M II
Dongsheng District, Ordos, Inner Mongolia, China415.84400–50021Dongsheng-1Loamy sandy soilC III, M II
22Dongsheng-2Loamy sandy soilC III, M II
23Dongsheng-3Loamy sandy soilC III, M II
24Dongsheng-4Sandy loamC III, M II
25Dongsheng-5Loamy sandy soilC III, M II, M III
Shenmu City, Yulin, Shaanxi Province, China440.8026Shenmu-1Sandy soilM II, M III
Jingbian County, Yulin, Shaanxi Province, China453.5027Jingbian-1Sandy soilM II, M III
28Jingbian-2aSandy soilM II, M III
29Jingbian-2bSandy soilC III, M II, M III
Table 3. Coefficient of Variation (CV) of cyanobacterial crust and moss crust developmental indicators at different developmental grades. CV is categorized into three levels: weak variation (CV < 10%), moderate variation (10% ≤ CV ≤ 100%), and strong variation (CV > 100%).
Developmental Indicators of BiocrustsCoefficient of Variation
C IC IIC IIIM IM IIM III
Coverage90.2376.44126.2970.7962.5039.27
Shear strength37.4548.2144.46107.04124.7364.76
Penetration resistance60.1947.8330.2882.4778.6664.43
Chlorophyll a content100.5078.6652.6555.9751.5246.34
Bulk density19.5916.6710.0013.519.2313.43
Table 4. Permutation test between environmental factors and distribution of cyanobacterial crust and moss crust at different developmental grades.
Environmental FactorR2p
Precipitation0.8380.001
Disturbance intensity0.3210.005
Soil particle ratio0.3730.002
Disclaimer/Publisher’s Note: The statements, opinions and data contained in all publications are solely those of the individual author(s) and contributor(s) and not of MDPI and/or the editor(s). MDPI and/or the editor(s) disclaim responsibility for any injury to people or property resulting from any ideas, methods, instructions or products referred to in the content.

