Abstract
Land use/cover change (LUCC) is a vital aspect representing global change and humans’ impact on Earth’s surface. This study utilized the ESRI Land Cover 2020 and China Land Cover Dataset (CLCD), along with historical imagery from Google Earth, to develop a method for the assessment of land use data quality. Based on the assessment, the CLCD was updated to generate an improved Re-CLCD for the Pan-Pearl River Basin (PPRB) from 1985 to 2020, and to analyze LUCC in the PPRB over the past 35 years. The results indicate the following: (1) Among the seven land uses, built-up land experienced the most dramatic change, followed by cropland, forestland, grassland, shrubland, waterbody, and bare land, with notable increases in built-up land and forestland, and rapid decreases in cropland, grassland, and shrubland. (2) The magnitude of land use changed very widely, with the highest change in the Pearl River Delta, followed by small coastal river basins in southern Guangdong and western Guangxi, the Dongjiang River Basin, the Hanjiang River Basin, the Xijiang River Basin, the Beijiang River Basin, and lastly, Hainan Island. (3) The largest increase happened in built-up land, with a total increase of 12,184 km2, mainly due to the occupation of cropland and forestland, corresponding to the highest decrease in cropland, with a net loss of 10,435 km2, which was primarily converted to forestland and built-up land. The study results are valuable in providing a scientific basis for policy overhaul regarding land resources and management to safeguard ecological balance and promote sustainable development in the Pan-Pearl River Basin.
1. Introduction
Land use encompasses the utilization of land by individuals for purposes like development, conservation, or various activities such as residential, commercial, or agricultural endeavors, whereas land cover pertains to the physical characteristics or surface features of the land, including vegetation, built-up areas, and forests. Land use and land cover are usually used together, as they complement each other to provide a comprehensive understanding of the spatial and functional diversity of land. Land use/cover change (LUCC) emerges as a consequence of the interplay between human activities and biophysical processes [1], reflecting the land utilization pattern within a region and holding significant importance in land use monitoring and management. LUCC not only captures the spatiotemporal dynamics of the Earth’s surface but also objectively documents alterations to the Earth’s surface brought about by human actions [2]. Previous studies indicate that over 70% of the Earth’s land surface has undergone some form of anthropogenic alteration [3] that has impacted biophysical and biogeochemical processes [4]. With rapid economic expansion, particularly in developing nations, at the end of the 20th century and the onset of the 21st century, the swift growth in population has accelerated transformations in land use, intensifying the rate of LUCCs [5]. Since the 1980s, China’s urbanization pace has accelerated, leading to a sharp increase in land use intensity and significant transformations in land use patterns, including a continual reduction in cropland and a corresponding rise in built-ups [6,7]. Land use practices such as deforestation, land reclamation, and urban expansion have had multifaceted impacts on society and the environment, resulting in heightened vulnerability to floods and droughts, environmental degradation, loss of ecosystem services, groundwater depletion, landslide disasters, and soil erosion, among other consequences [8,9].
The study of LUCC has its origins in the 1990s [10]. In 1993, two prominent international organizations, namely the International Geosphere-Biosphere Programmer (IGBP) and the International Human Dimensions Programmer (IHDP), introduced the LUCC scientific research program as a pivotal aspect of global change study [11,12]. Following LUCC, the inception of the Global Land Project (GLP) in 2005 underscored the significance of integrating and simulating the interconnected human–environment system, leading to LUCC gradually emerging as a “hotspot” [13,14,15,16,17,18]. In China, the rapid changes in land use driven by economic development have sparked increasing interest among scholars in understanding China’s land use dynamics [19,20], its driving forces and mechanisms [21,22], as well as simulations of future dynamics [23,24,25].
In recent decades, the increased availability of high-resolution satellite imagery has spurred growing interest in high-resolution land cover mapping [26,27]. Consequently, a greater number of land use datasets have been generated. Presently, some prominent global land use datasets include GlobeLand30, World Cover, and ESRI Land Cover, etc. Among these, the GlobeLand30 dataset [28], developed by China, stands out as one of the world’s first 30 m resolution global land cover datasets, spanning the years 2000, 2010, and 2020, with an overall accuracy of 83.5%. This dataset contains a detailed spatial distribution of global surface cover, enabling better depiction of most anthropogenic land use activities and resultant landscape patterns. World Cover, produced by the European Space Agency (ESA), provides an initial batch of 10 m resolution global land cover products for 2020 and 2021 [29]. It was developed and validated using near-real-time Sentinel-1 and Sentinel-2 data and achieves an overall accuracy of 74.4%. Another global 10 m land cover dataset—ESRI Landcover [30]—provided by ESRI for the period of 2017-2022, was created using ESA Sentinel-2 satellite imagery, possessing an overall accuracy of approximately 80%. These high-resolution global land surface cover datasets offer more detailed land cover patterns, enabling the detection of land cover changes at the scale of most human land activities, providing a better understanding of landscape change, and improving the accuracy of modeling and simulation [31]. However, in tropical and subtropical regions, such as south China, the accuracy of land cover datasets is relatively low due to cloud coverage or shadow effects. In these regions, ongoing updates to the datasets are necessary to obtain more accurate land use dynamics.
The Pan-Pearl River Basin (PPRB) constitutes 6% of China’s land area, accommodates 19% of its population, and contributes over 17% to its total economic output [32]. Since the 1980s, the PPRB has experienced rapid yet imbalanced economic development and a significant transformation in land use; notably, a consistent reduction in cropland and an expansion of built-ups are particularly evident in the Pearl River Delta region [33]. Analyzing the characteristics and driving forces of LUCC holds paramount importance for ensuring the sustainable development of the regional ecological environment and socio-economic aspects. Previous studies on the PPRB’s LUCC have predominantly concentrated on investigating the response of land use change to ecological and hydrological factors [34,35,36,37], with fewer studies examining LUCC over a long period. Zhang et al. [38], utilizing a 1 km resolution Chinese land use dataset, conducted an investigation of land use changes and the driving forces across the PPRB from 1990 to 2015. They revealed that the most significant land use change happened in the Guangdong-Hong Kong-Macao Greater Bay Area, the central to southeastern parts of Guangxi Province, and the northern part of Hainan Island. As a key determinant of the variations in environment and natural resources within the PPRB, land use reflects the intricate interplay between natural and human processes. Accurate and up-to-date information on LUCC is essential for comprehending and evaluating its impacts on the environment.
In summary, the study of LUCC in the PPRB necessitates higher accuracy and more detailed land use data, with a clear identification of recent land use change patterns across the entire basin. The objectives of this paper are as follows: (1) Develop a comparative scheme for land use classification results based on existing global land use data (ESRI Land Cover 2020) and the China Land Use Data Set (CLCD) to generate a series of land use datasets with a 5-year time interval from 1985 to 2020. (2) Analyze the land use changes occurring in the PPRB and its sub-basins using the newly generated dataset to provide more accurate spatial and temporal insights into the key driving forces to land use changes within the PPRB. Ultimately, this study seeks to offer a scientific reference for the formulation of land resource management policies in the basin, thereby contributing to the preservation of ecological balance and the promotion of sustainable development in the river basin.
2. Study Area and Data Sources
2.1. Study Area
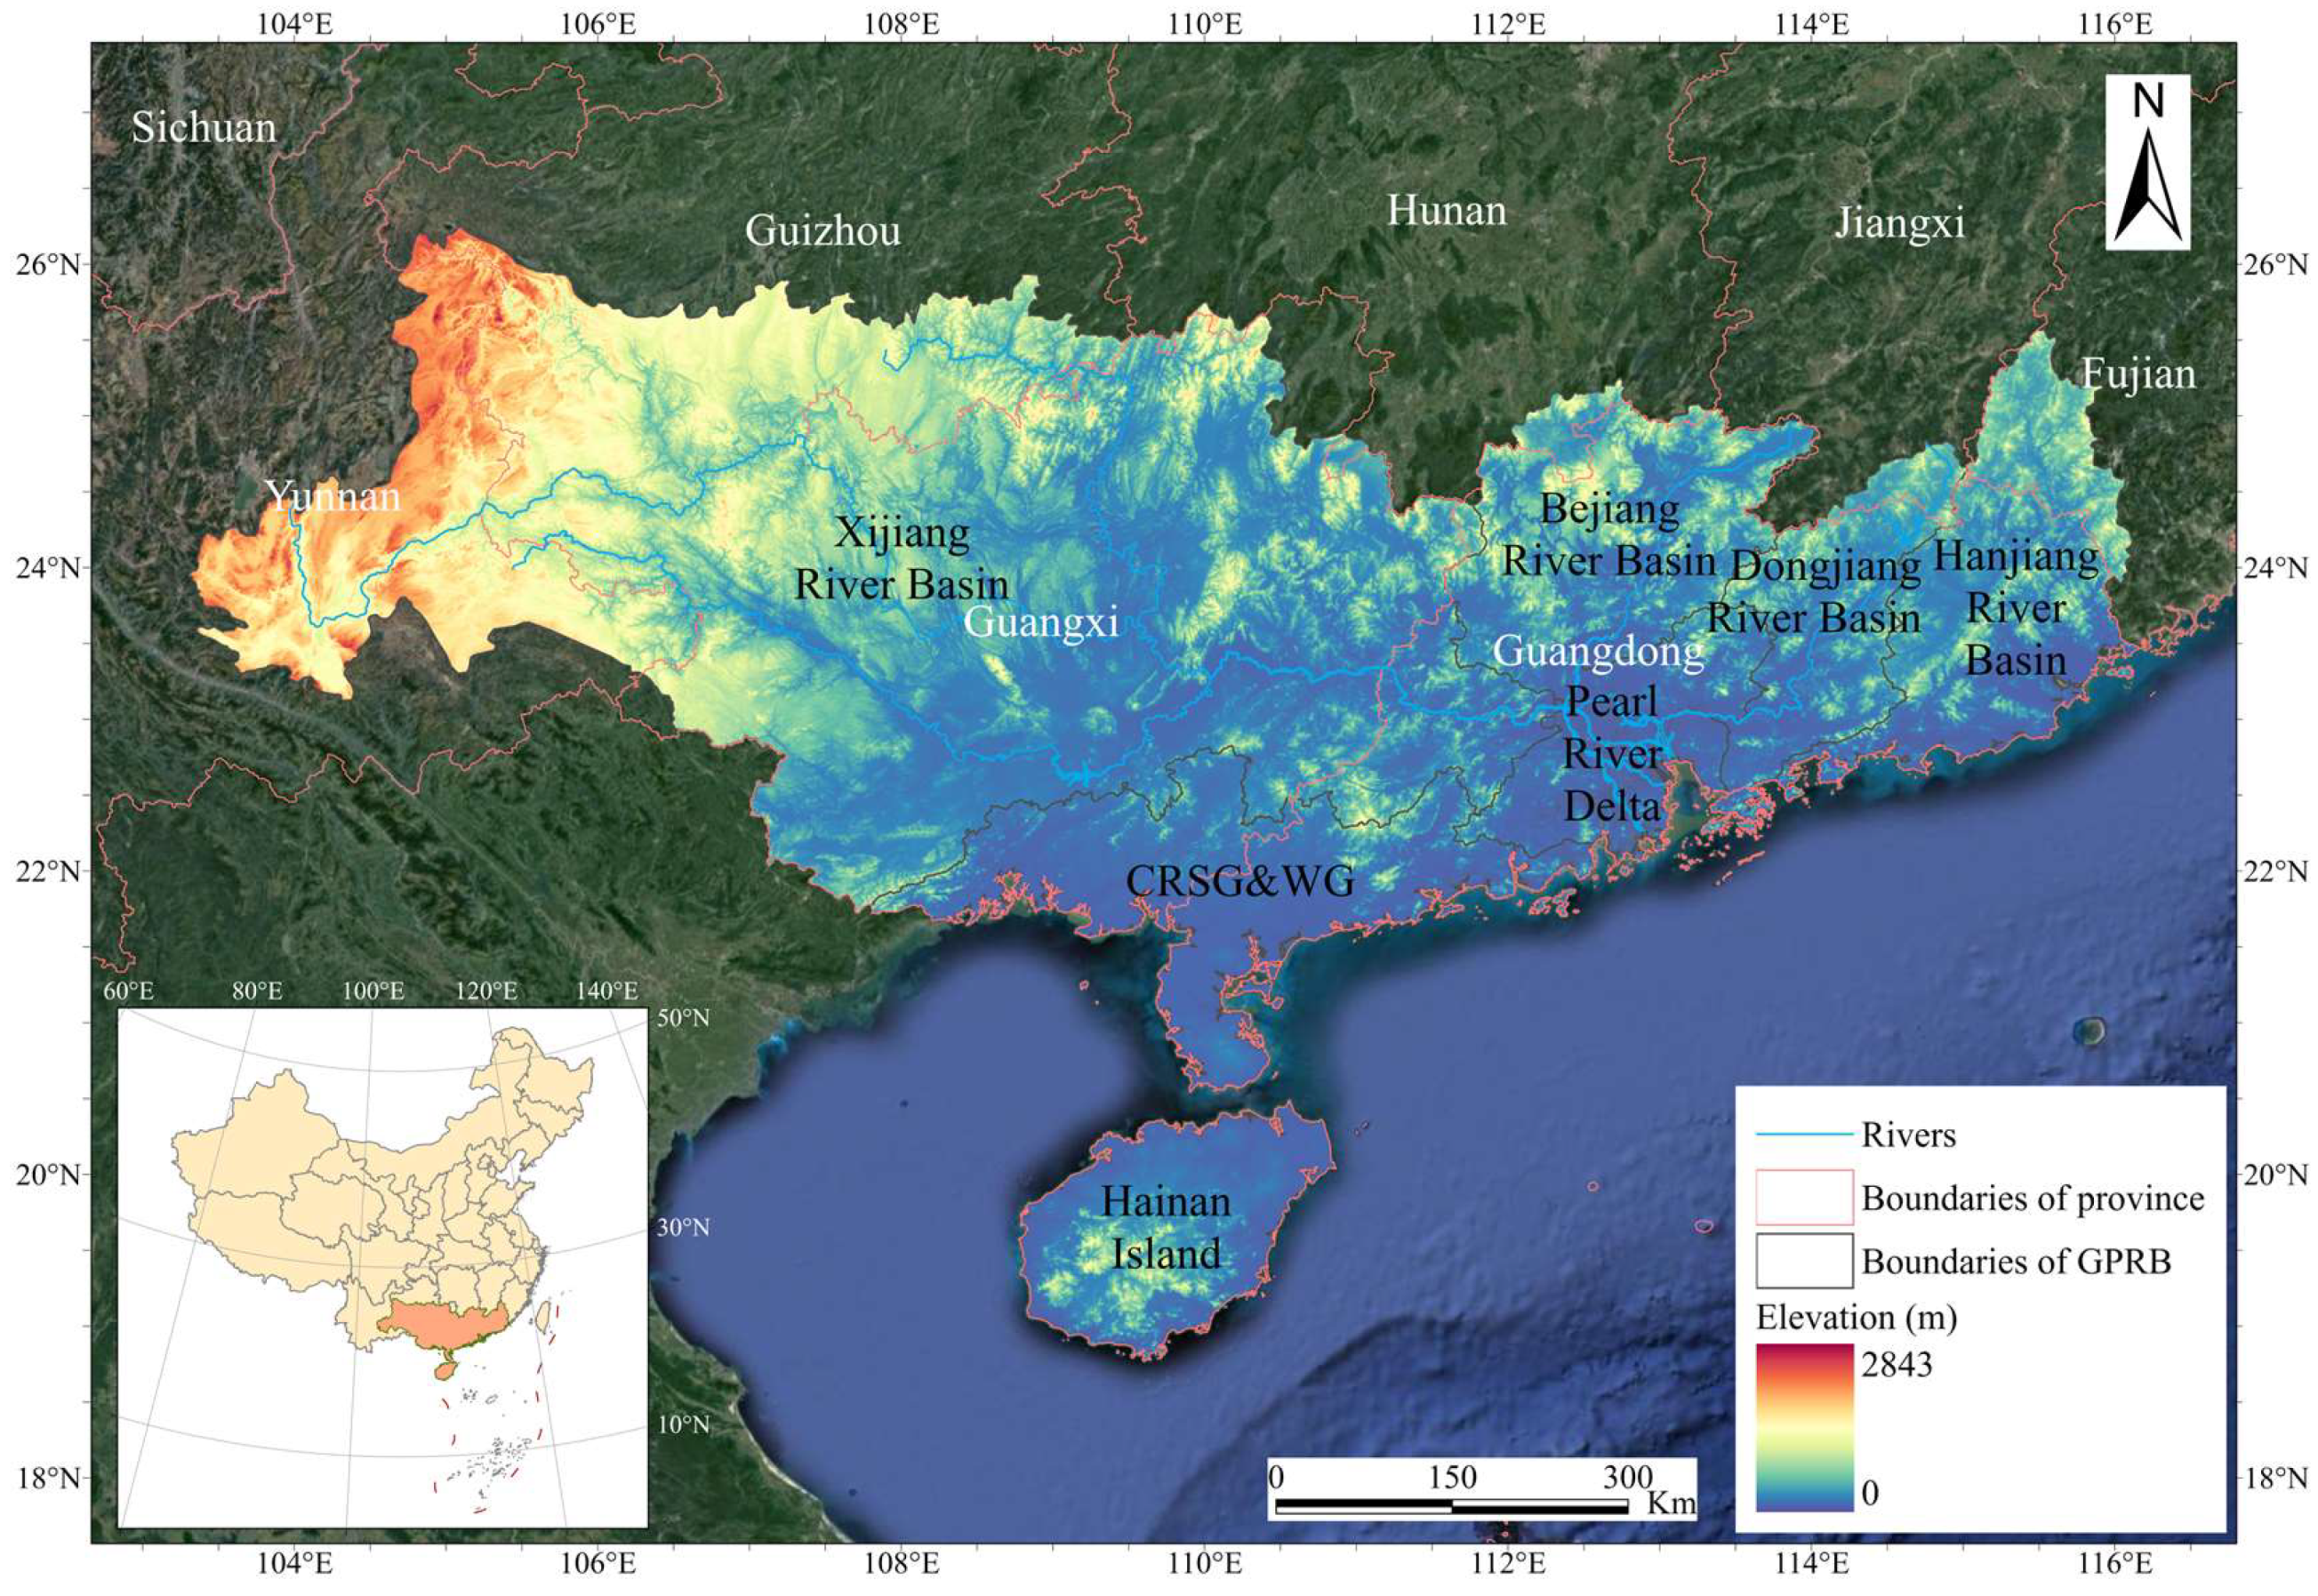
The Pan-Pearl River Basin (PPRB) comprises the original Pearl River Basin, Hanjiang River Basin, the small coastal rivers in southern Guizhou and western Guangdong provinces (CRSG and WG), and the rivers on Hainan Island (Figure 1). It spans across 8 provinces (Yunnan, Guizhou, Guangxi, Guangdong, Hunan, Jiangxi, and Fujian provinces) and 2 special administrative regions (Hong Kong and Macau), covering a total area of 571,000 km2. The terrain of the PPRB gradually ascends from southeast to northwest, characterized by mountains and hills, with floodplains relatively scarce and scattered. Originating from the Yunnan–Guizhou Plateau, the Pearl River is formed by three major tributaries: the Xijiang River, Beijiang River, and Dongjiang River. These tributaries collectively define the landscape of the PPRB, providing abundant natural resources and diverse ecological scenery for the basin’s inhabitants.
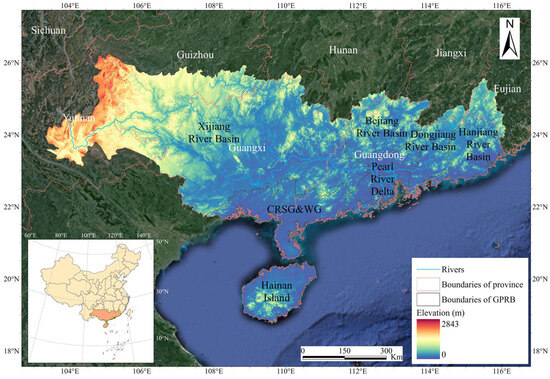
Figure 1.
The location of the PPRB.
The PPRB primarily experiences a subtropical climate in South Asia, characterized by an annual average temperature ranging from 14 to 22 °C and an annual average precipitation between 1200 and 2200 mm [39]. Precipitation distribution across the PPRB generally decreases from east to west, with variations in rainfall influenced by topographic changes and other factors. Precipitation is unevenly distributed throughout the year, with approximately 70% to 85% of the total annual precipitation occurring in the monsoon season from April to September. The basin features a complex and interconnected river network with high annual water discharges but low sediment loads.
The PPRB stands out not only for its geographical location and abundant natural resources but also for its significant potential for economic, cultural, and social development. Over the past three decades, amidst China’s globalization, the PPRB has increasingly played a vital role in national economic growth. Encompassing approximately 6% of China’s land area and accommodating 19% of its population, the PPRB contributes over 17% to China’s economic output. Land use within the basin includes forestland, cropland, built-up land, shrubland, grassland, and bare land. Forestland, covering over 60% of the PPRB, is predominantly found in Guangxi Province, Yunnan Province, and Guizhou Province. Cropland is concentrated in Guangxi Province, Guangdong Province, and Yunnan Province, while built-up land is primarily situated in the Pearl River Delta region, the fastest-growing and most populous zone of the PPRB. Shrubland is prevalent in the northern part of Guangxi Province and the southern part of Guizhou Province, while grassland predominates in Yunnan Province and Guizhou Province, among other regions.
2.2. Data Sources and Data Processing
The CLCD utilized in this study [40] was generated by integrating all available land satellite images on Google Earth Engine, employing multi-temporal training samples, and utilizing random forest classification algorithms. This dataset classifies land cover into 9 classes, with a spatial resolution of 30 m and an overall accuracy of 79.13%. ESRI Land Cover 2020 (https://livingatlas.arcgis.com/landcover/, accessed on 28 October 2022), publicly released by ESRI in June 2021, provides high-resolution global land cover maps for 2020. Derived from European Space Agency Sentinel-2 satellite imagery, this dataset was created using a deep learning artificial intelligence land classification model [41]. ESRI Land Cover 2020 consists of 10 classes with a spatial resolution of 10 m and a global average accuracy of 86%. The classification of CLCD data and ESRI Land Cover 2020 is presented in Table 1.
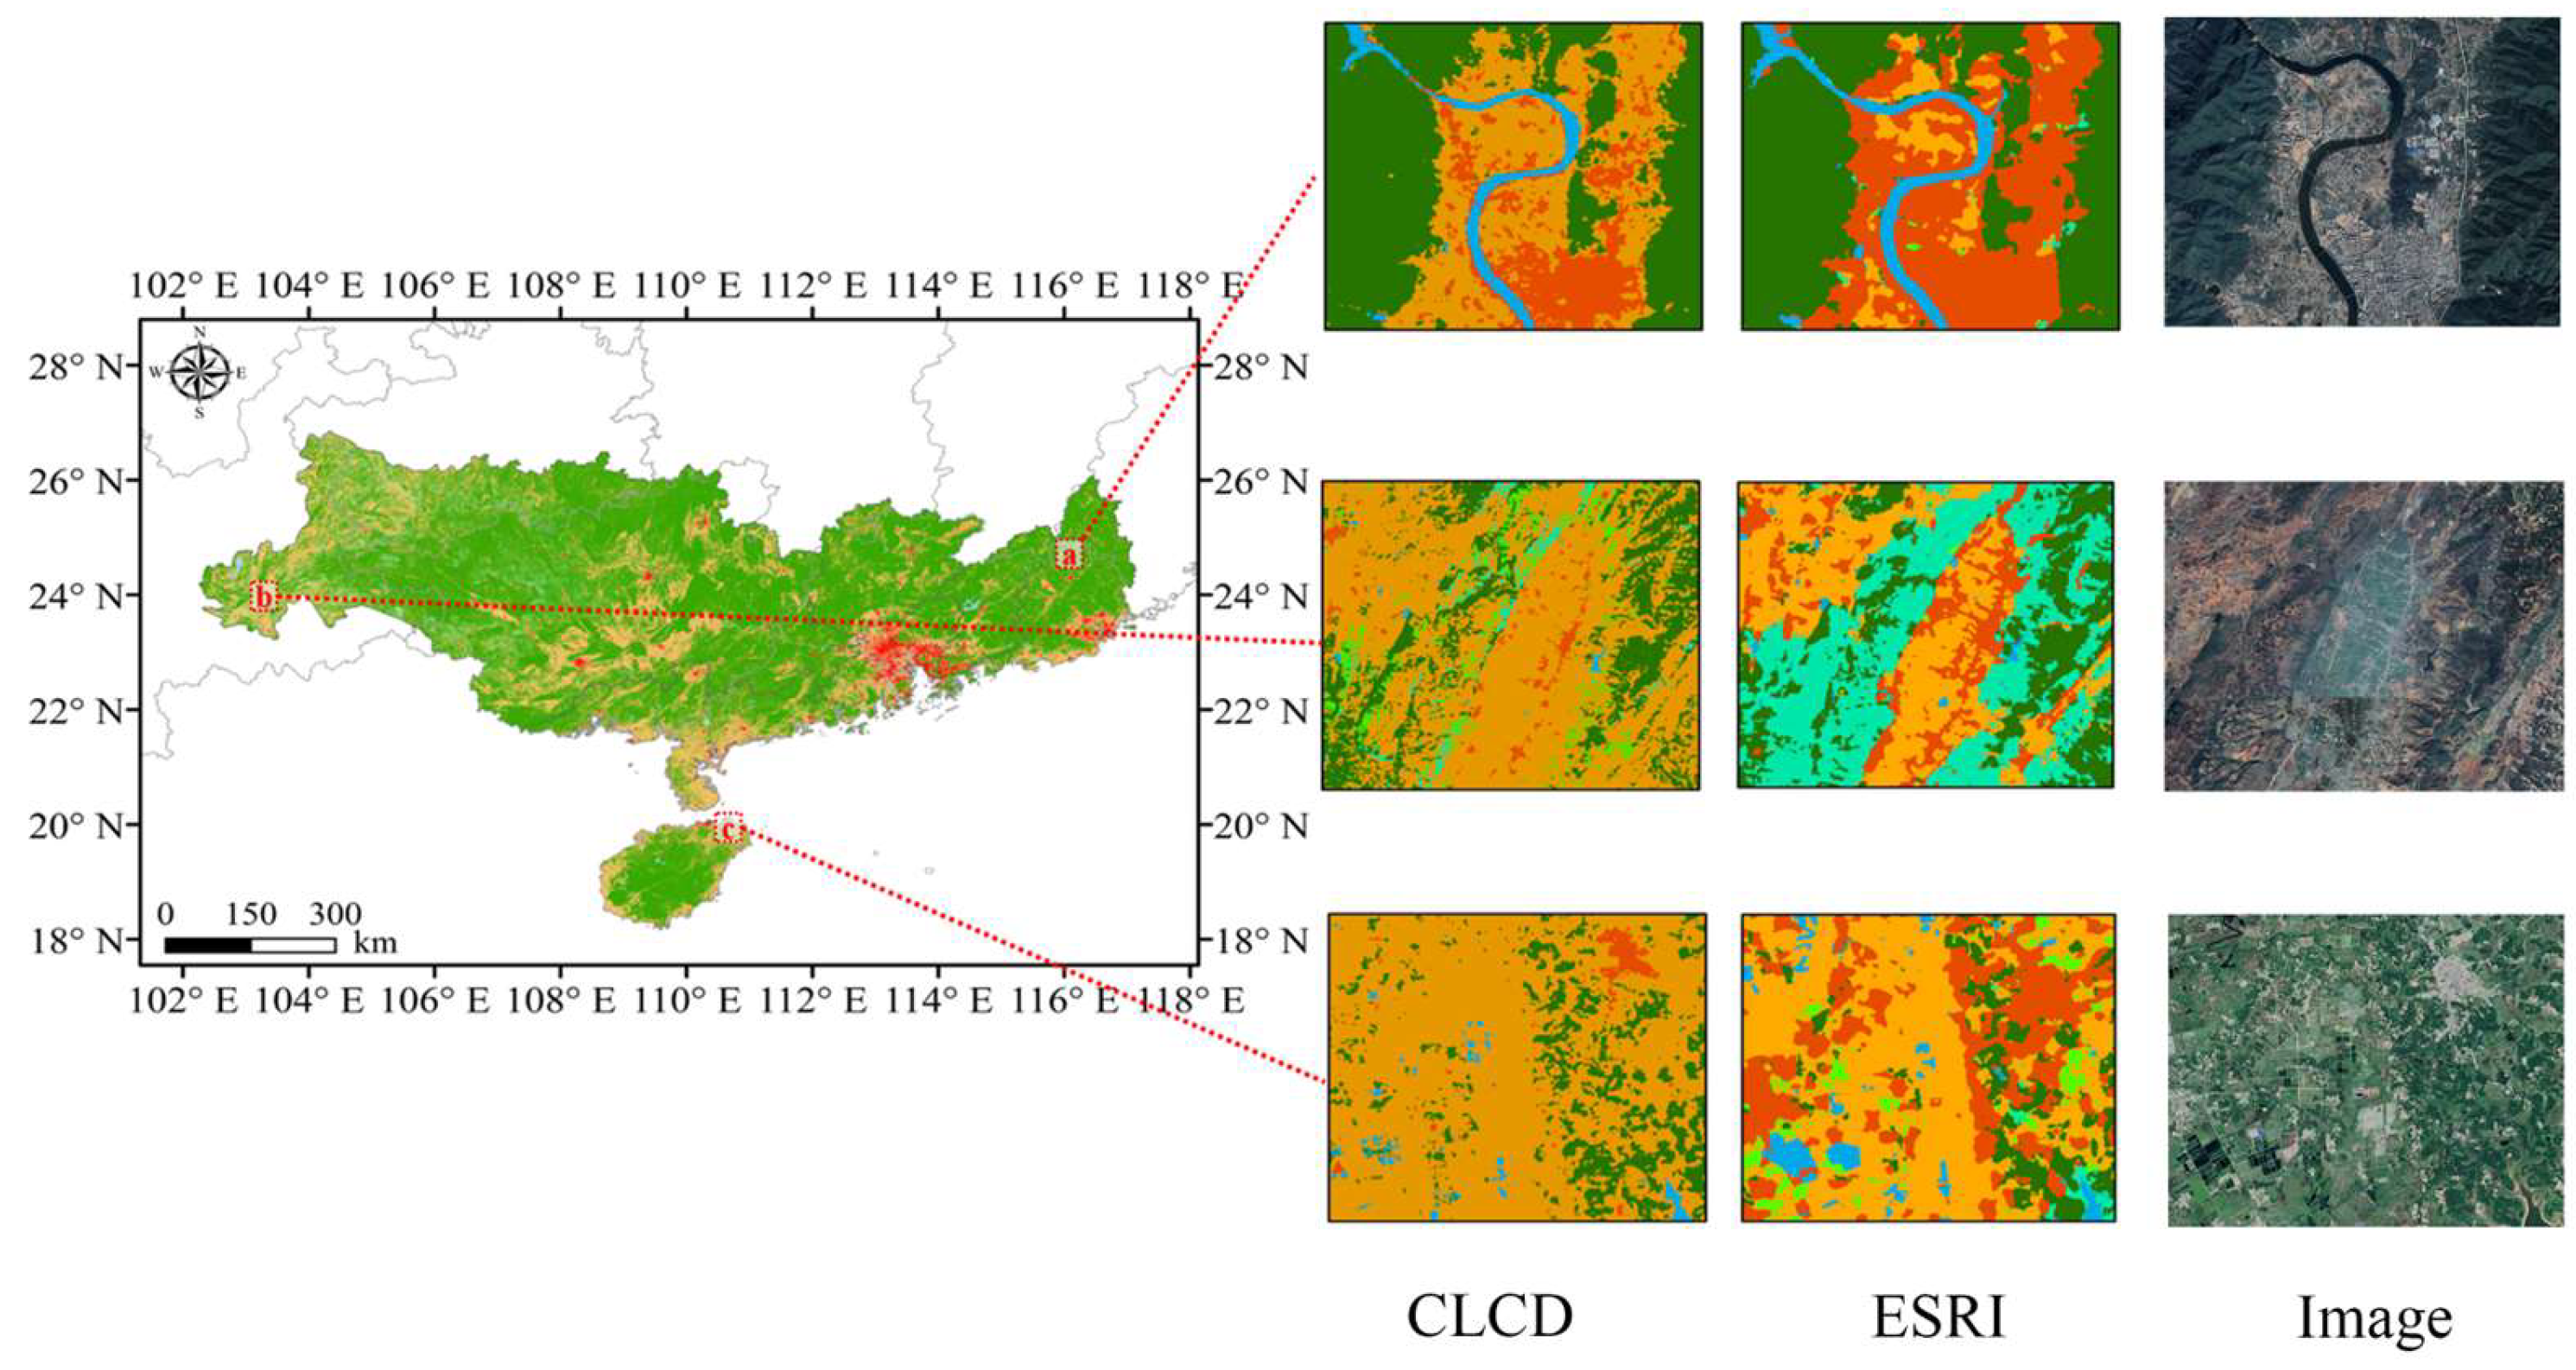
Due to the predominantly cloudy and rainy weather in the PPRB, images are significantly affected by clouds, terrain, and shadows, which have a substantial impact on the land use classification results in both the CLCD and ESRI Land Cover 2020 [42]. Additionally, the physical parameters of the satellite sensor, image characteristics (including spatial and temporal resolution), processing software, hardware, and other factors also influence the accuracy of land use/cover classification [43]. Therefore, in the context of the PPRB, there are numerous misclassified pixels in the CLCD (Figure 2). In this study, utilizing ESRI Land Cover 2020 as a reference and combining it with historical imagery from Google Earth, the CLCD was updated to improve its accuracy and to generate a LUCC dataset at a five-year interval for later land use change analysis. Before auxiliary correction, both the CLCD and ESRI Land Cover 2020 require the following preprocessing:
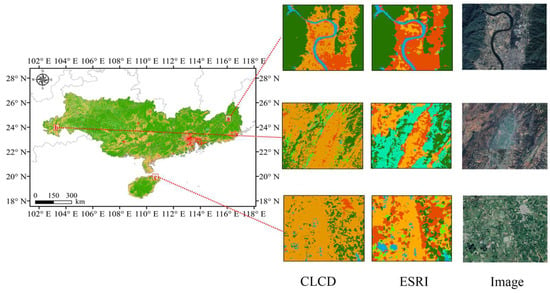
Figure 2.
Comparison of CLCD and ESRI land use datasets.
- (a)
- Given the disparities in projection, spatial resolution, and land use classes (Table 1) between the datasets, reprojection and resampling procedures were implemented.
- (b)
- The resampled data underwent reclassification, adhering to the classification standards proposed by Zander et al. [30]. Notably, the ESRI data introduce a distinct class merely for clouds, preserved during reclassification, while the remaining land types are meticulously matched one by one.

Table 1.
The schemes of land use/cover classifications used in this study.
Table 1.
The schemes of land use/cover classifications used in this study.
| CLCD | ESRI | Re_CLCD | ||||||
|---|---|---|---|---|---|---|---|---|
| Class | Id | Class | Class | Id | Class | Class | Id | Class |
| Cropland | 1 | Lands with distinct characteristics of intensive human activity, ranging from crop rotation, seeding, crop cultivation, to harvesting stages, which are identifiable by the boundary or textures, particularly within a large land. | waterbodies | 1 | Regions with predominant presence of various waters, including areas with dams, reservoirs, and harbors. Typical features include streams, lakes, seas, and inundated salt fields. | Cropland | 1 | Land covered with crops that is sowed/planted and harvestable at least once within a year. |
| Forest | 2 | Lands covered chiefly with trees, discernible within the landscape depicted in the images. | Trees | 2 | Notable clusters of dense vegetation, with individual plants reaching heights of approximately 15 m or more, particularly evident within savannas, ranches, marshes, or mangrove ecosystems. | Forestland | 2 | Areas dominated by trees with a cover of 10% or more. Areas planted with trees for afforestation purposes and plantations (e.g., oil palm, olive trees) are included. |
| Shrub | 3 | Lands with vegetations characterized by a texture finer than tree canopies but coarser than grasslands. | Grass | 3 | Open regions covered by homogeneous grass, with no evident human plotting. They include open savannas featuring green spaces, yards, and pastures. | Shrubland | 3 | Lands dominated by natural shrubs, having a cover of 10% or more. |
| Grassland | 4 | Lands suitable for grazing purposes are identifiable, including natural grasslands characterized by their native vegetation. | Flooded vegetation | 4 | Areas of vegetation intersected by water for a significant portion of the year, including mangroves, rice paddies, and other locations subjected to intensive flooding for horticultural purposes. | Grassland | 4 | Lands dominated by natural herbaceous plants (plants without persistent stem or shoots above ground and lacking definite firm structure) (grasslands, prairies, steppes, savannahs, pastures) with a cover of 10% or more. |
| Water | 5 | All inland waterbodies with a width of more than 3 pixels or an area of at least 8 pixels by 8 pixels (equivalent to 6 hectares), including artificial fish ponds too. The spectral characteristics of these waterbodies vary widely, and their area may change with seasons. | Crops | 5 | Areas where cereals and vegetables are cultivated in a planned or plotted manner, typically not reaching the height of trees. Examples include cornfields, wheat fields, soybean plantations, as well as neglected plots of organized land. | waterbodies | 5 | Lands covered for most of the year (more than 9 months) by waterbodies: lakes, reservoirs and rivers. |
| Snow/Ice | 6 | Distributed in the polar regions and high mountains. | Shrub | 6 | Mixture of small clusters of plants or individual plants scattered across a landscape with a moderate to sparse coverage of shrubs, bushes, and tufts of grass, characteristic of savannas. | Snow/Ice | 6 | Areas persistently covered by snow or glaciers. |
| Barren | 7 | Lands with the landscape dominated by exposed soil, sand, gravel, and rocky backgrounds. | Build area | 7 | Areas designated for construction purposes, such as major roads, parking structures, and residential housing. Examples include houses, densely populated villages, towns, and cities, as well as paved roads and concrete infrastructure. | Bare land | 7 | Lands with exposed soil, sand or rocks and never more than 10% vegetated cover during any time of the year. |
| Imperious | 8 | Areas with artificial cover materials such as asphalt, concrete, sand and stone, bricks, glass, and other similar materials. | Bare | 8 | Areas characterized by rocks or bare soil devoid of vegetation throughout the year. They encompass vast expanses of sand, including deserts and sand dunes, as well as areas affected by mining activities. | Built-up land | 8 | Lands covered by buildings, roads, and other man-made structures, such as railroads. Buildings include both residential and industrial buildings. |
| Wetland | 9 | Marshland with distinctly high reflectivity in the NIR band. Additionally, low relief areas containing perched bogs, playas, and potholes may also be included, depending on the season of image acquisition. | Snow/Ice | 9 | Areas characterized by permanent snow or ice, primarily found in mountainous regions or glaciers. They also include permanent snowpack and snowfields. | Wetland | 9 | Lands dominated by natural herbaceous vegetation (cover of 10% or more) that is permanently or regularly flooded by fresh, brackish, or salt water. |
| 10 | N/A | Clouds | 10 | Cloud cover over the area that obscures visibility of land cover information. | 10 | N/A | ||
The classification of the CLCD was obtained from the study [44] and the classification of the ESRI Land Cover 2020 was obtained from the study [41].
3. Methods
3.1. Misclassification Identification
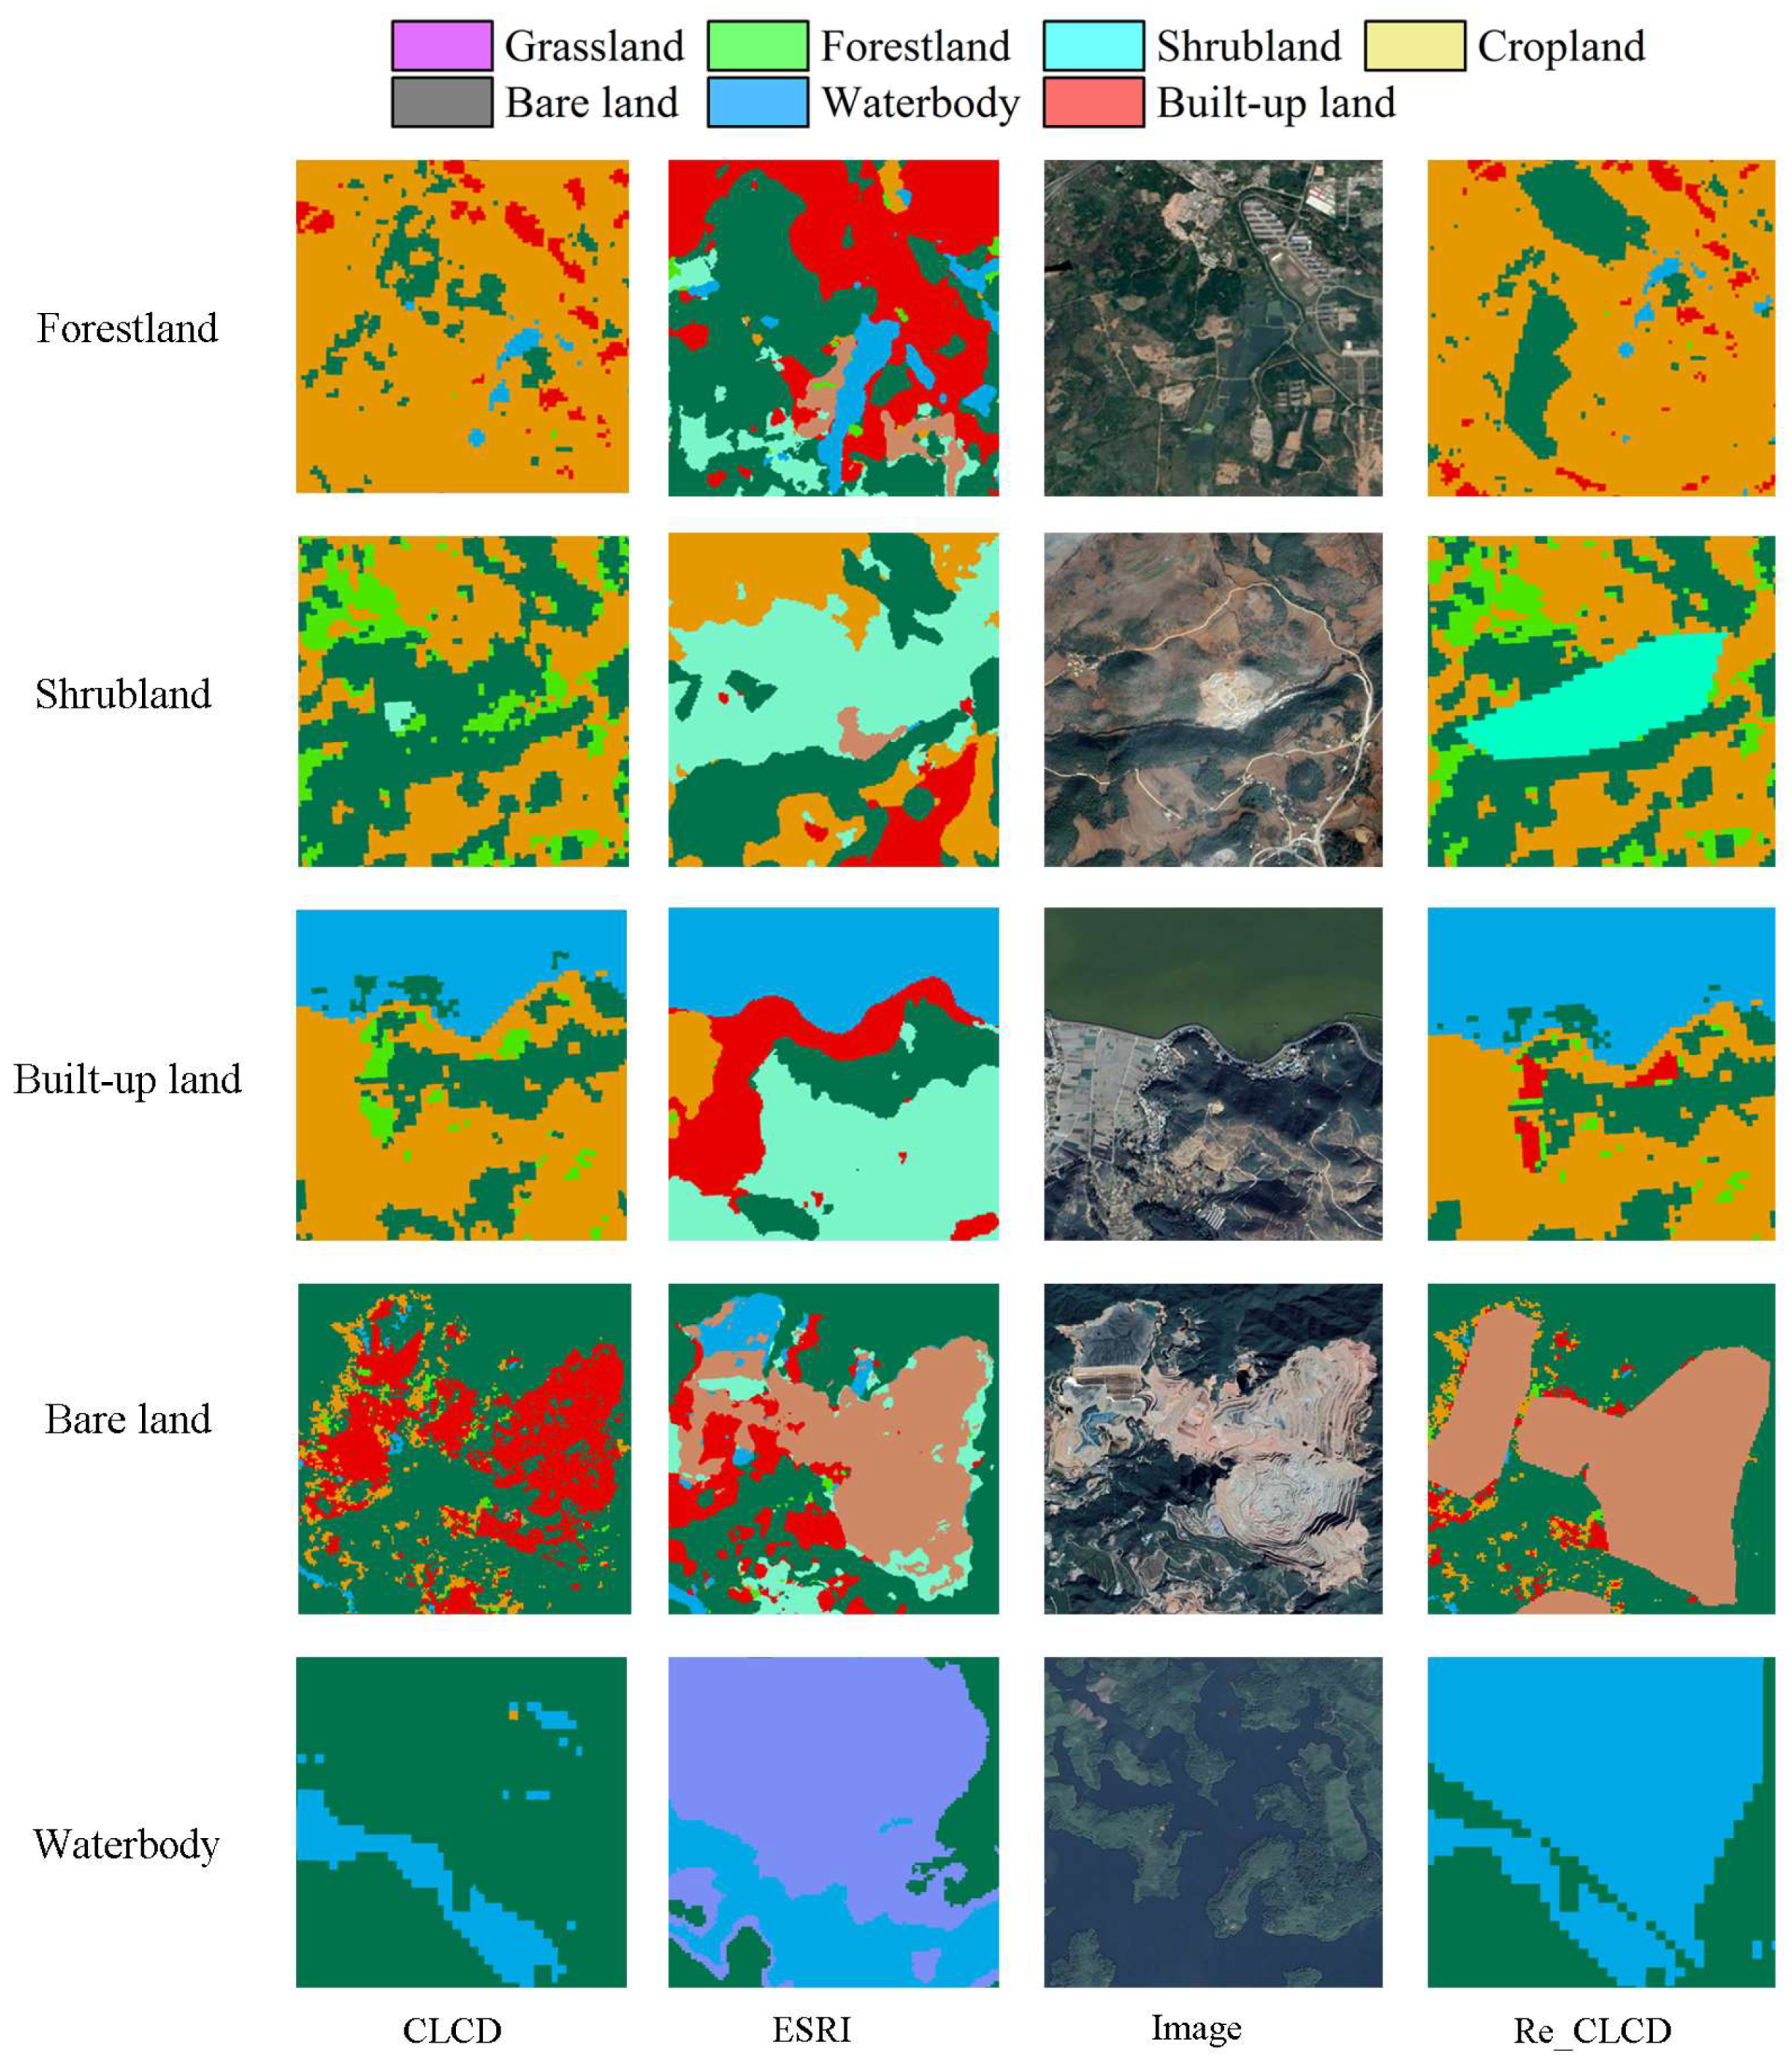
In this study, the CLCD and ESRI Land Cover 2020 datasets were utilized to analyze land use changes in the PPRB. The CLCD incorporates all available Landsat SR images within a given year and employs the random forest classifier to classify them based on spectral, spectral index, phenological, and geographical information, thus generating land use data for a specific year. The PPRB is situated in tropical and subtropical regions, characterized by frequent cloudy and rainy weather. Due to the significant time lag in image coverage and the extensive and intricate terrain of the PPRB, several commonly misclassified scenarios exist in the CLCD (Figure 3). The utilization of all available images from different seasons to generate the CLCD leads to large spectral discrepancies; consequently, the same land use classes are often misclassified. Also, shadows caused by rugged terrain result in misclassification of land uses in the shadows. Likewise, in regions covered by clouds, dense clouds cast shadows and display water-like spectral characteristics, potentially resulting in misclassification as waterbodies. In addition, due to the similarity in texture between grasslands and sparsely vegetated areas, such as sparse shrubland and fallow croplands, their identification during classification is also a challenging task. These are the major misclassified land uses in the CLCD. Lastly, as the time span between the acquisition dates of images-to-be-classified and sampling image increases, the classification accuracy gradually decreases [45].
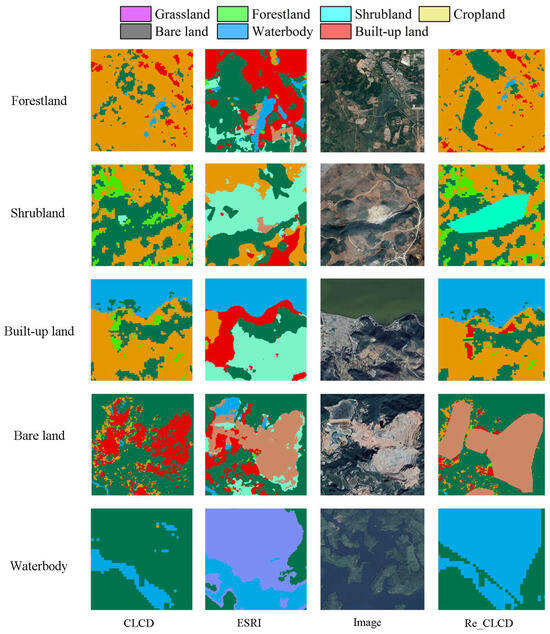
Figure 3.
Identification and correction of landforms misclassified in CLCD data.
The aforementioned misclassifications are addressed in this study to update the CLCD through an assessment based on transition matrices. The assessment assumes that there are N land uses, and the transition matrix can be represented as Sij, where i represents the land use in a given year, j represents the land use in its previous year, and Sij denotes the transition of land use from type i to type j. When i equals j, it indicates that no transition occurred. When i and j are not equal to each other, two scenarios will be considered: The first scenario addresses land uses in the CLCD that are difficult to transfer between, such as conversion from built-up land to waterbodies or to cropland. Such transitions are considered unreasonable due to the high human interference needed in built-ups, making them extremely unlikely to transition to other land uses in a short period. The second scenario involves cases where land use i is changeable, but the transition to land use j cannot be confirmed. In such cases, comparison with historical imagery from Google Earth or Satellite images was conducted through visual verification to confirm the transitions. Through this assessment, the updated land use dataset for the PPRB (Re-CLCD) is ultimately obtained.
To verify the accuracy of the Re-CLCD data, they underwent a comparison with China’s Land Use/Land Cover Dataset (CLUDs) [7], which documents detailed land use classifications for China during the 1980s, 1990s, 1995, 2000, 2005, 2010, and 2015 periods. CLUDs were created through an interactive interpretation of Landsat imagery and encompassed six primary categories (cropland, forestland, grassland, waterbody, built-up land, bare land) and twenty-five secondary categories, boasting an overall classification accuracy exceeding 94.3%. Upon scrutiny and validation, the classification outcomes of the Re_CLCD and CLUD datasets exhibited similarities, particularly in terms of forestland and built-up land, where they were nearly identical. Nonetheless, significant disparities surfaced in the classification results concerning cropland and grassland within the central and western regions of the PPRB. Upon cross-validation with historical imagery on Google Earth, it became apparent that these areas, characterized by mountainous and hilly terrain, are predominantly cultivated as terraced fields. Consequently, the classification results of the Re_CLCD in these regions were considered to be more satisfactory.
The enhanced Re-CLCD demonstrates markedly enhanced precision and is now suitable for analyzing land use changes in the PPRB. As there were unsignificant changes in wetland before 2010 and their coverage was limited, we categorized wetlands as waterbodies. Consequently, this study employed seven land use categories—cropland, forestland, shrubland, grassland, waterbody, build-up land, and bare land—to analyze land use changes in the PPRB.
3.2. The Dynamics for Individual Land Uses
The Land Use Dynamic Degree (LUDD) is a model utilized to depict the transformation magnitude of an individual land use within a land use transition matrix. It signifies the rate of change in a particular land use across the study area [46]. The LUDD metrics were also used as a control of the assessment of land use change, with the assumption that the changes individual land use could be independently evaluated. The mathematical expression for LUDD is as follows:
In the equation, Ua and Ub, respectively, represent the area of a given land use in periods a and b; T represents the duration of the study period from a to b. When T is measured in years, LUDD denotes the annual change rate of the land use.
3.3. The Overall Land Use Dynamic Degree
The overall land use dynamics degree (LO) describes the overall magnitude of land use change in the study area, representing the annual land use change rate in that region. It can be utilized to study regional differences in land use dynamics [47]. The formula is as follows:
In the equation, LO represents the overall Land Use Dynamic Degree; Ui and Uj denote the areas of a given land use at the beginning and end of the study, respectively; n is the number of land uses (n = 1, 2, 3, …); T stands for the duration of the study period.
3.4. Land Use Transfer Matrix
The land use transfer matrix illustrates the conversion relationships among various land uses across a given period, presented in a matrix [48]. In this study, this model was employed to scrutinize the shifts between land uses and to unveil the quantitative conversion rate (annual change rate). The formula is as follows:
In the equation, Sij represents the area (km2) of land use transition from i to j between years T1 and T2, while n denotes the number of land uses. In the land use transfer matrix, rows represent land uses at year T1, while columns represent land uses at year T2. The sum of each column represents the total area of land use at the end of the study.
4. Results
4.1. Spatial Patterns of Land Use Change
To elucidate the dynamics of land use and the conversions that occurred among various land uses from 1985 to 2020, this study examined the transitions among the seven land uses and computed the dynamic degrees for each land use, quantifying the change rate. The analysis revealed substantial alterations in land use across the PPRB. Notably, built-up land experienced the most pronounced fluctuations, followed by cropland, forestland, grassland, shrubland, waterbody, and bare land, respectively (Table 2). Over this period, built-up land and forestland expanded notably, while cropland, grassland, and shrubland decreased significantly. The total area of waterbodies exhibited a slight increase. The extent of bare land remained relatively stable.

Table 2.
Statistical analysis of land use changes in the PPRB.
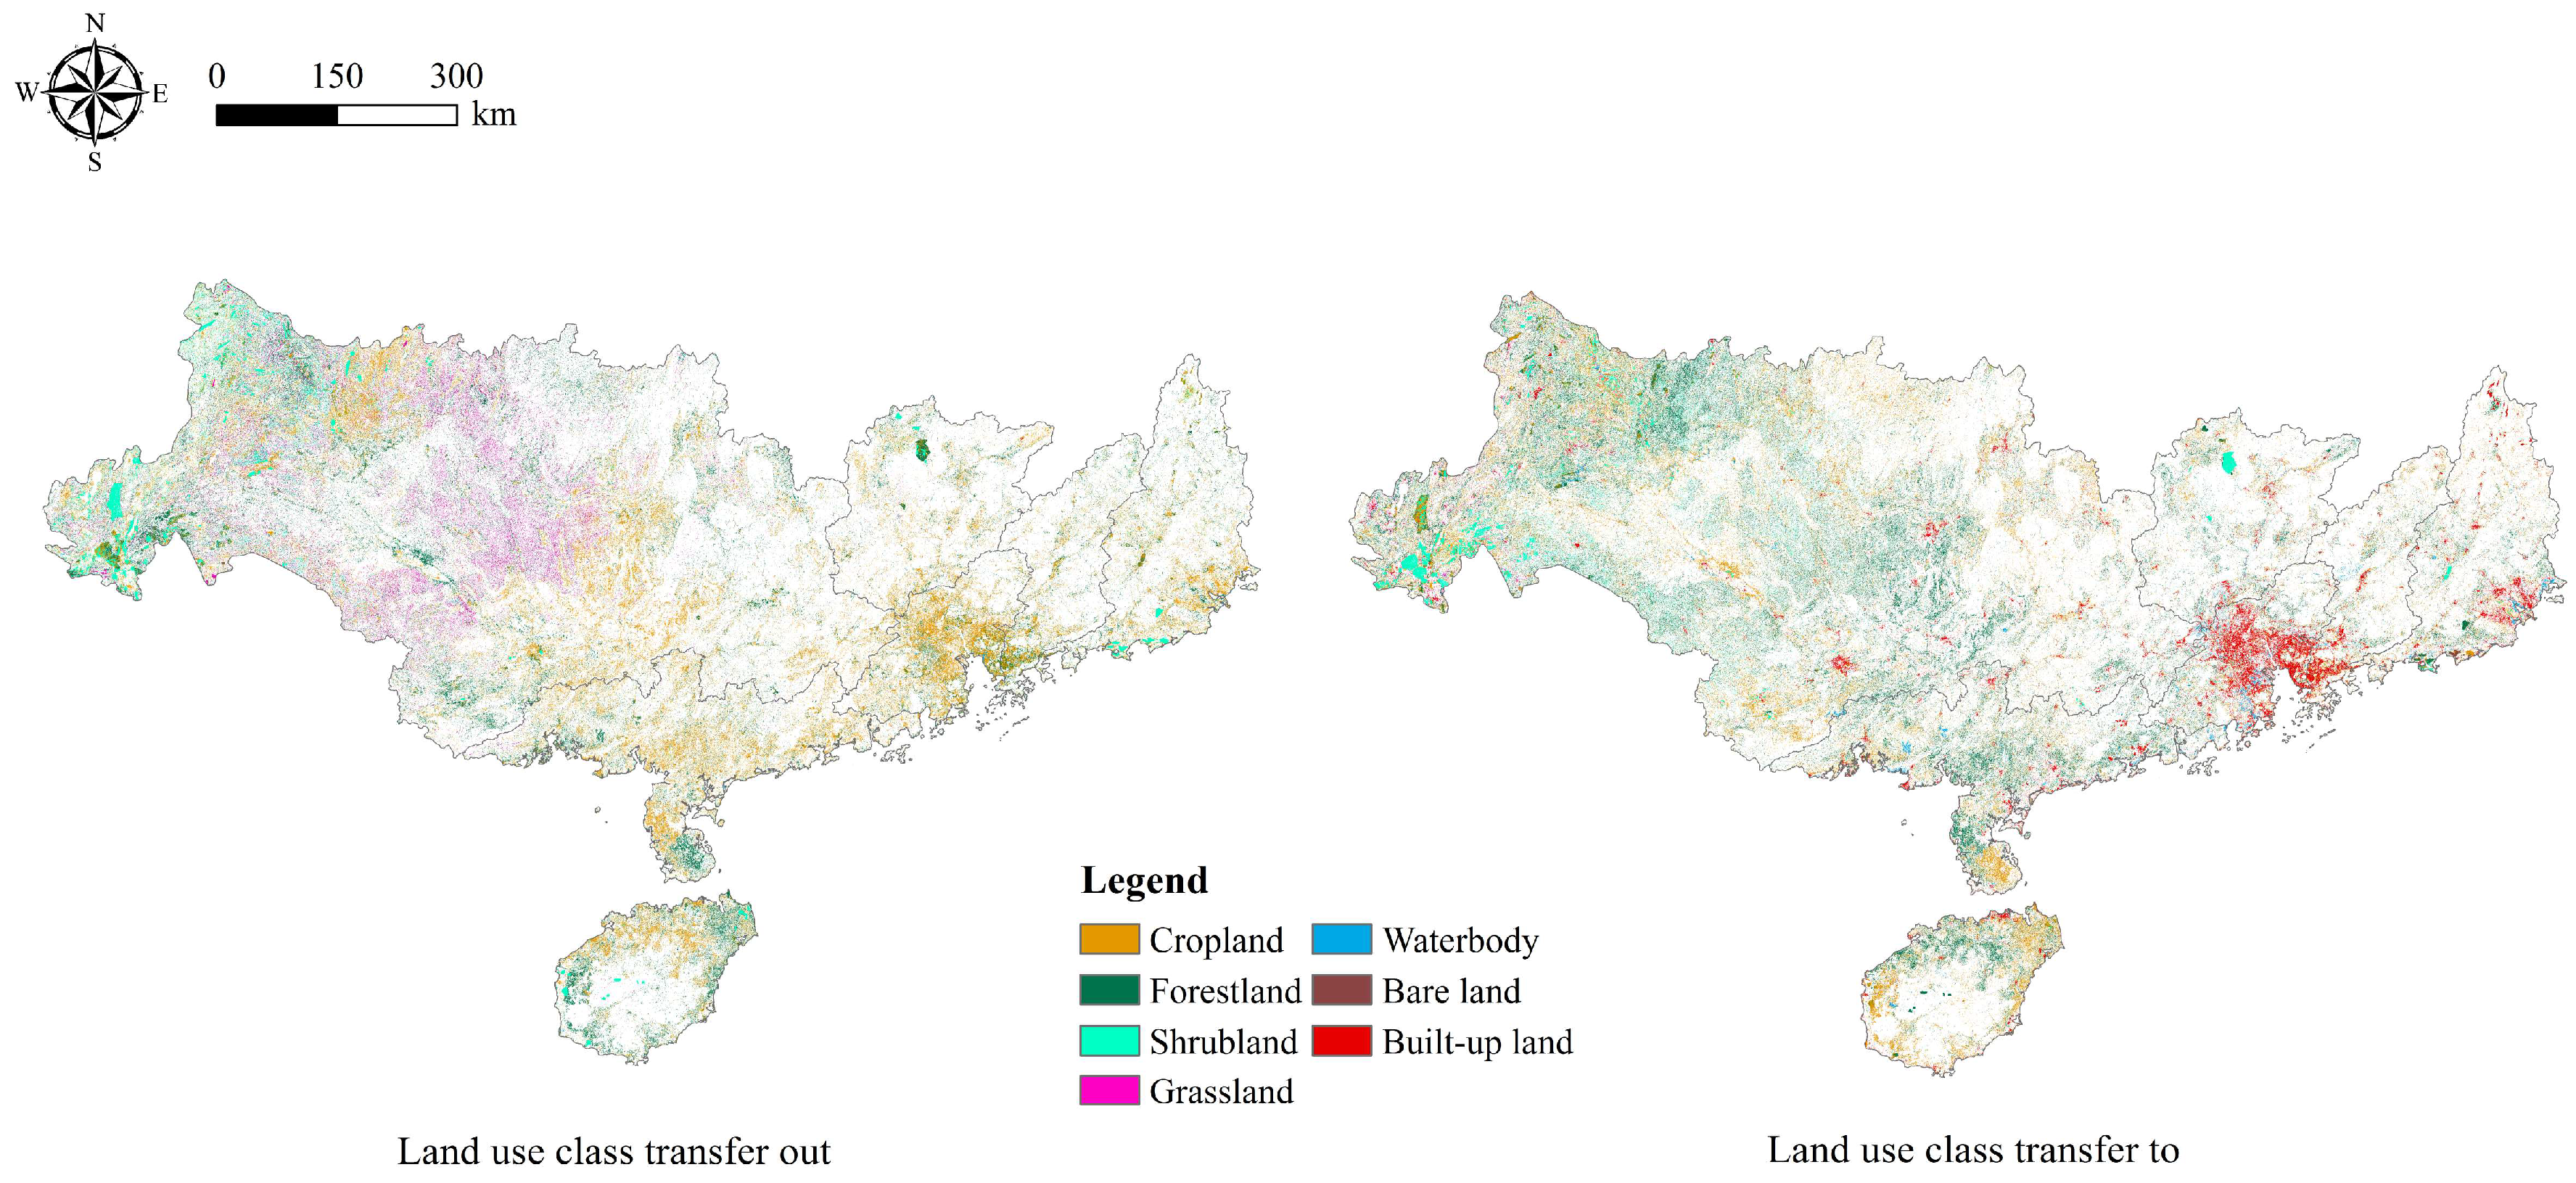
Over the past 35 years, land use changes have exhibited three distinct regional characteristics, as depicted in Figure 4, in the northeastern and northwestern parts of the basin, the coastal areas of southern Guangdong and western Guangxi, the northern coastal regions of Hainan Island, and the Pearl River Delta region. Consistent with a previous study [38], areas such as the Hanjiang River Basin and Dongjiang River Basin in the northeast, as well as the Xijiang River Basin in the northwest, have demonstrated a common trend of mutual conversion among forestland, shrubland, and grassland. In the Yunnan–Guizhou Plateau, in the upper reaches of the Xijiang River, a large amount of shrubland and grassland have been lost to forestland and cropland. There was also a common conversion from grassland to shrubland and from cropland to forestland in the middle reaches of the Xijiang River. Another prevalent phenomenon of land reclamation for urban expansion also persisted, leading to a notable increase in built-up land in some cities in the Xijiang River Basin. In addition, a reciprocal conversion between cropland and forestland is also evident in the southern coastal areas and the northern coastal regions of Hainan Island.
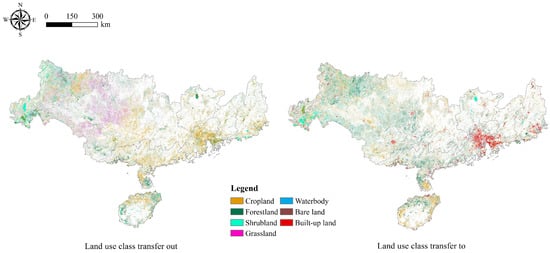
Figure 4.
Land use change in the PPRB from 1985 to 2020.
In the Pearl River Delta, the most notable conversion involved a significant surge in built-up land, attributed to its robust industries and unique geographical positioning. Extensive urbanization efforts have led to the fast conversion of cropland into built-up land, particularly in the central part of the Pearl River Delta, signaling a pronounced urbanization [49]. Moreover, the disappearance of waterbodies and forestland along the coastline due to urban development is conspicuous in this area. This phenomenon underscores the fast urban expansion in a radial outward expansion from an old downtown are along major roads or highways in the Pearl River Delta [38].
4.2. Land Use Changes in the Sub-Basins
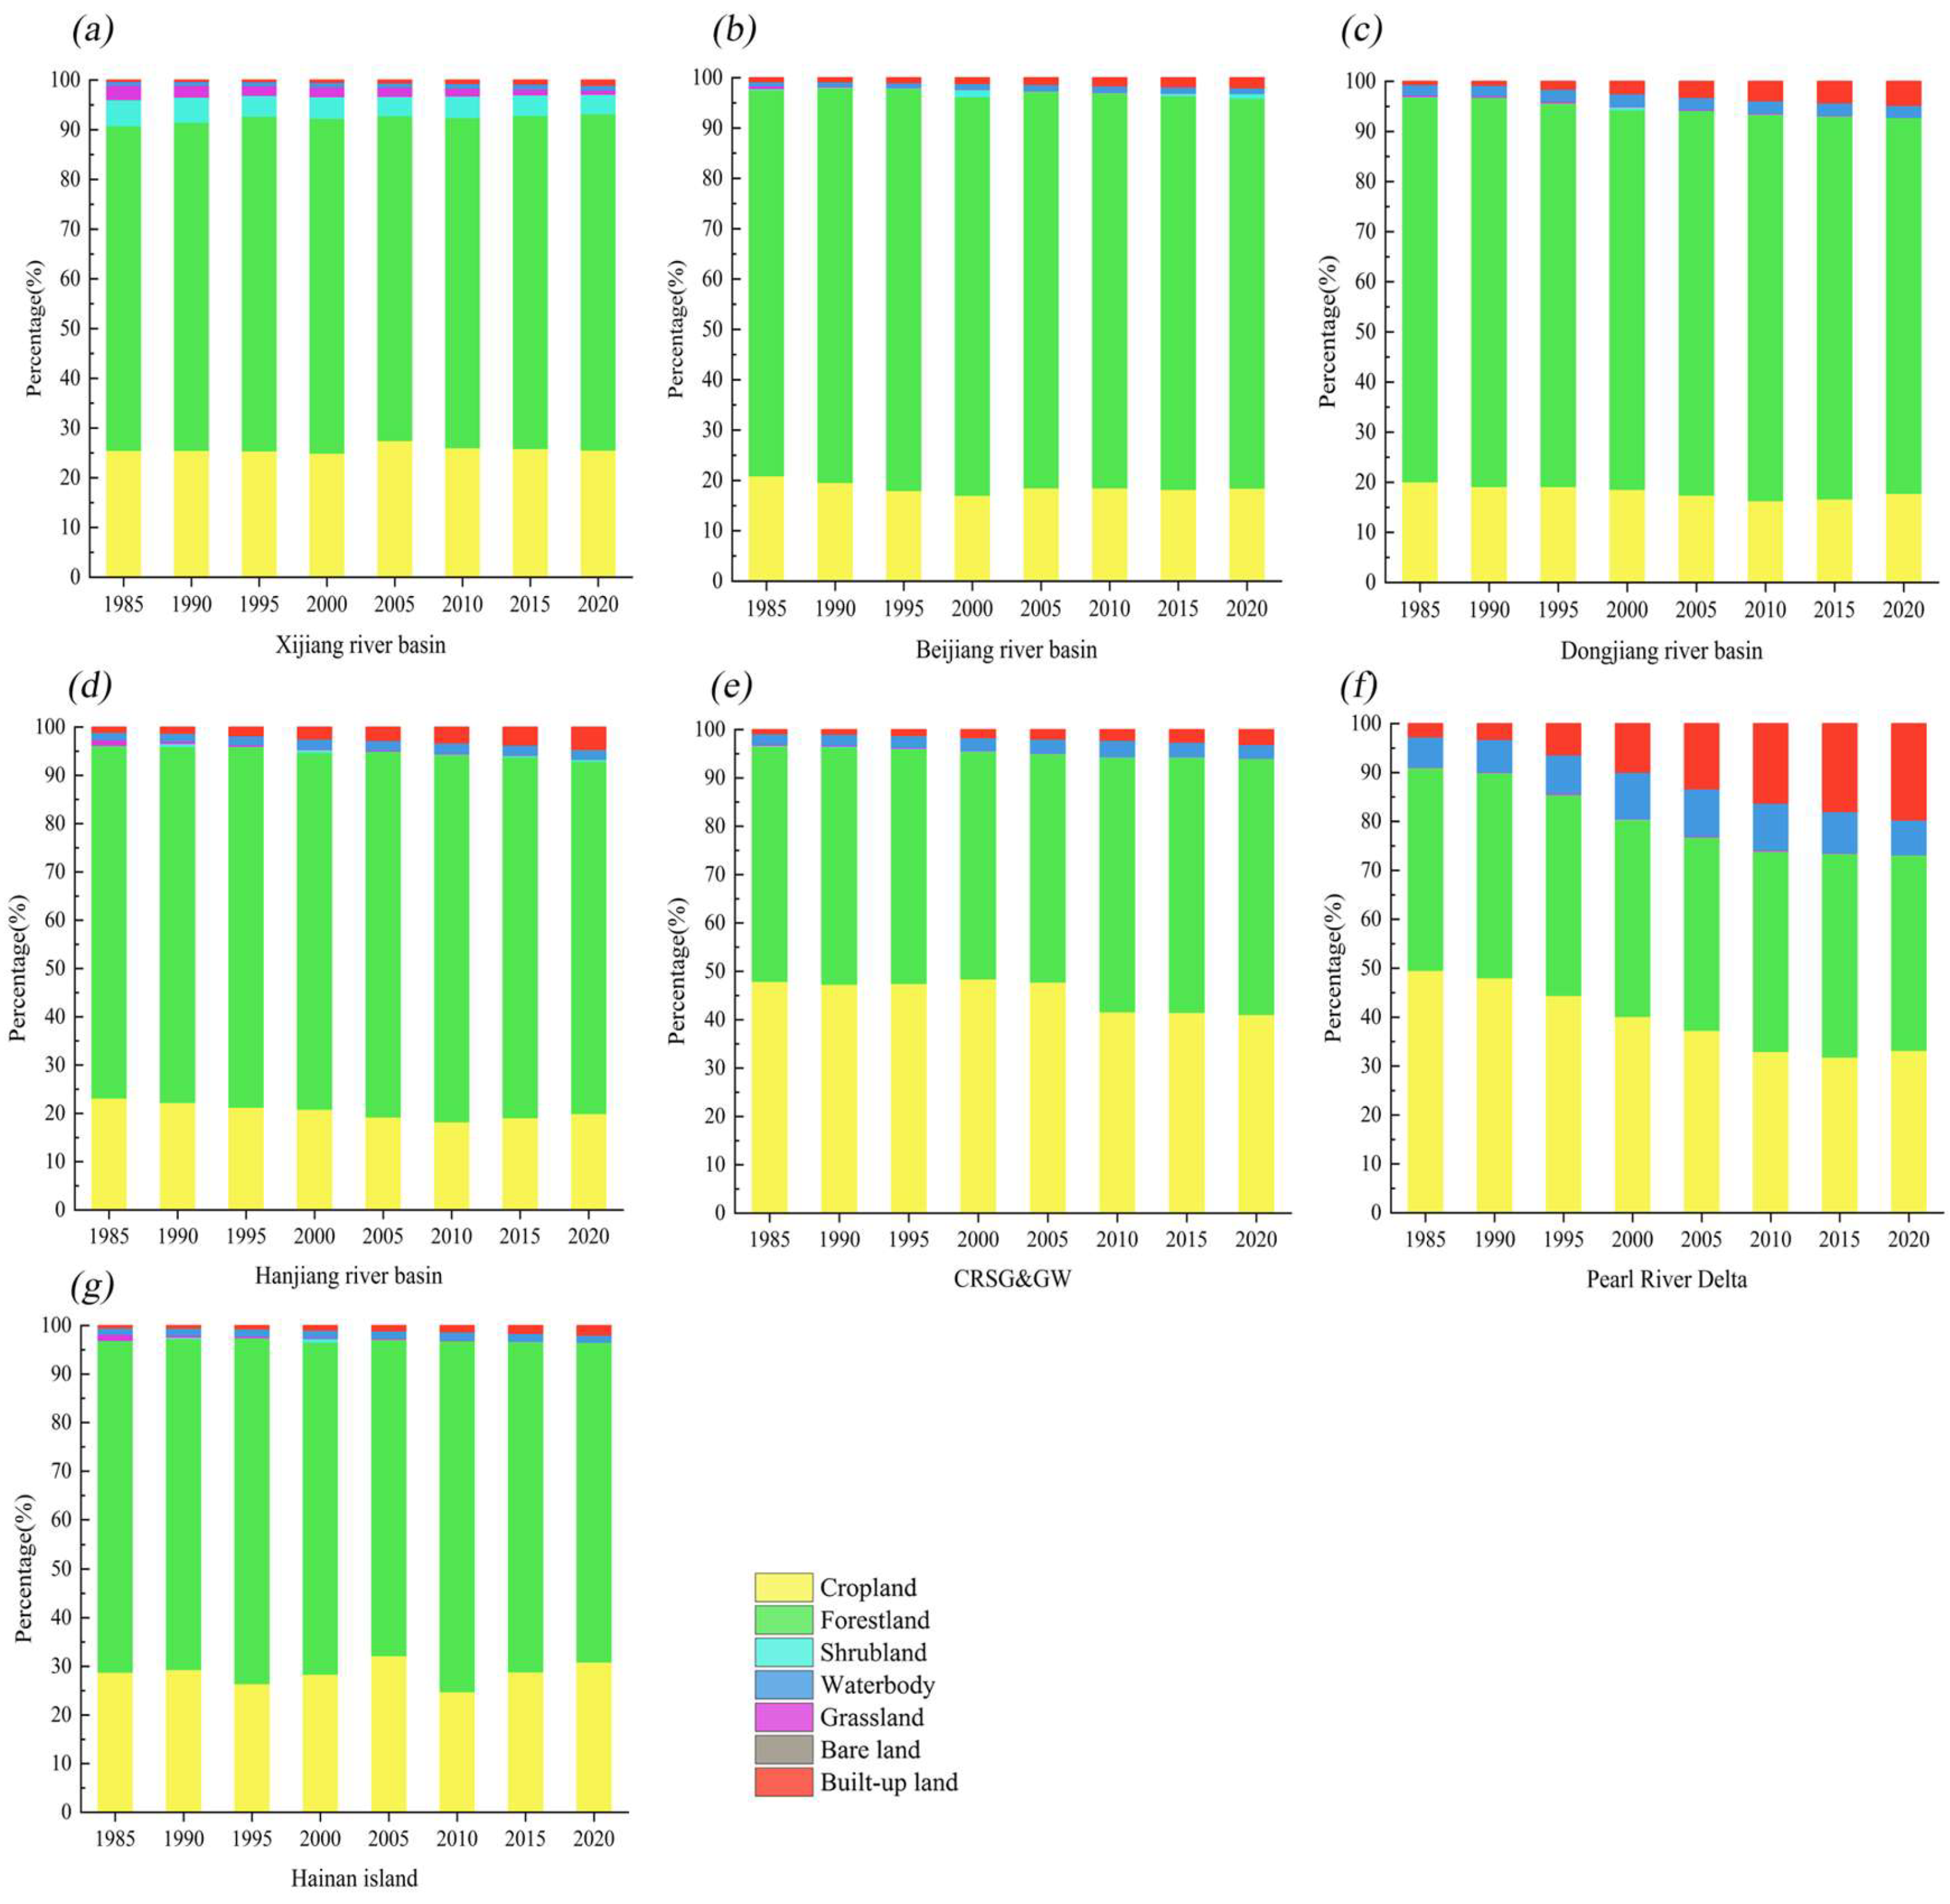
To explore the spatiotemporal dynamics of land use changes across the sub-basins and the conversion between different land uses from 1985 to 2020, this study computed the land use dynamics degree and the proportion of land use changes in each major tributary basin. As outlined in Table 3, cropland and forestland were the predominant land uses in all the sub-basins, but their changes occurred at different rates. Among the sub-basins, built-up land and waterbodies exhibited positive increases (Figure 5). In the Xijiang River Basin and Hainan Island, cropland also experienced a decline, indicating a gradual loss of cropland to alternative land uses. A reduction in grassland was also observed in all sub-basins. In comparison, forestland underwent a relatively modest alteration. It is noteworthy that while shrubland in the Beijiang River Basin and Hanjiang River Basin saw a rapid increase, their proportions remained lower than in other sub-basins. Furthermore, bare land in the Hanjiang River Basin underwent swift growth, making it standing out the as most rapid change (9.7%) among the sub-basins. The rapid expansion of bare land could have significant implications for the degradation of ecosystems and the environment.

Table 3.
Land use dynamics in the sub-basins from 1985 to 2020.
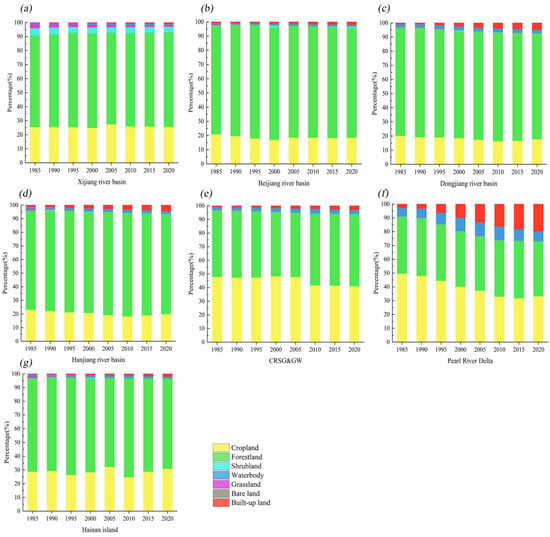
Figure 5.
The fluctuation in areal proportion of different land uses in different sub-basins from 1985 to 2020: (a) Xijiang River Basin; (b) Beijiang River Basin; (c) Dongjiang River Basin; (d) Hanjiang River Basin; (e) CRSG and GW; (f) Pearl River Delta; (g) Hainan Island.
Land use changes in the Xijiang River Basin were relatively minor. The most rapidly increasing land use was built-up land, followed by slight increases in forestland and cropland, while the proportions of grassland and shrubland declined. In the Beijiang River Basin, shrubland experienced the fastest change, followed by built-up land, while grassland and cropland decreased. In the Dongjiang River Basin, built-up land underwent the most rapid expansion, with an annual increase rate of 18.52%. The proportion of waterbodies marginally rebounded, whereas the proportions of other land uses have declined to varying degrees. In the Hanjiang River Basin, shrubland, bare land, and built-up land increased over the study period, with built-up land exhibiting the most significant upward trend. Conversely, the proportions of cropland and grassland slightly decreased. In the small coastal river basins in southern Guangdong and western Guangxi, built-up land experienced the fastest growth, and water and forestland indicated slight increases, while other land uses declined. Similarly, in the Pearl River Delta region, built-up land demonstrated the most rapid increase, with an annual rate of 17.83%, corresponding the fast decrease in cropland. Water initially increased before declining in the Pearl River Delta. On Hainan Island, built-up land also underwent the most rapid changes, with slight increases in water and cropland, while the proportions of the other four land uses decreased. Overall, built-up land emerged as the fastest-increasing land use in the Pearl River Delta region, owing to its unique geographical location and swift urban development. Consequently, land use for urbanization in the Pearl River Delta has reached 1.09%, which is significantly higher than other sub-basins.
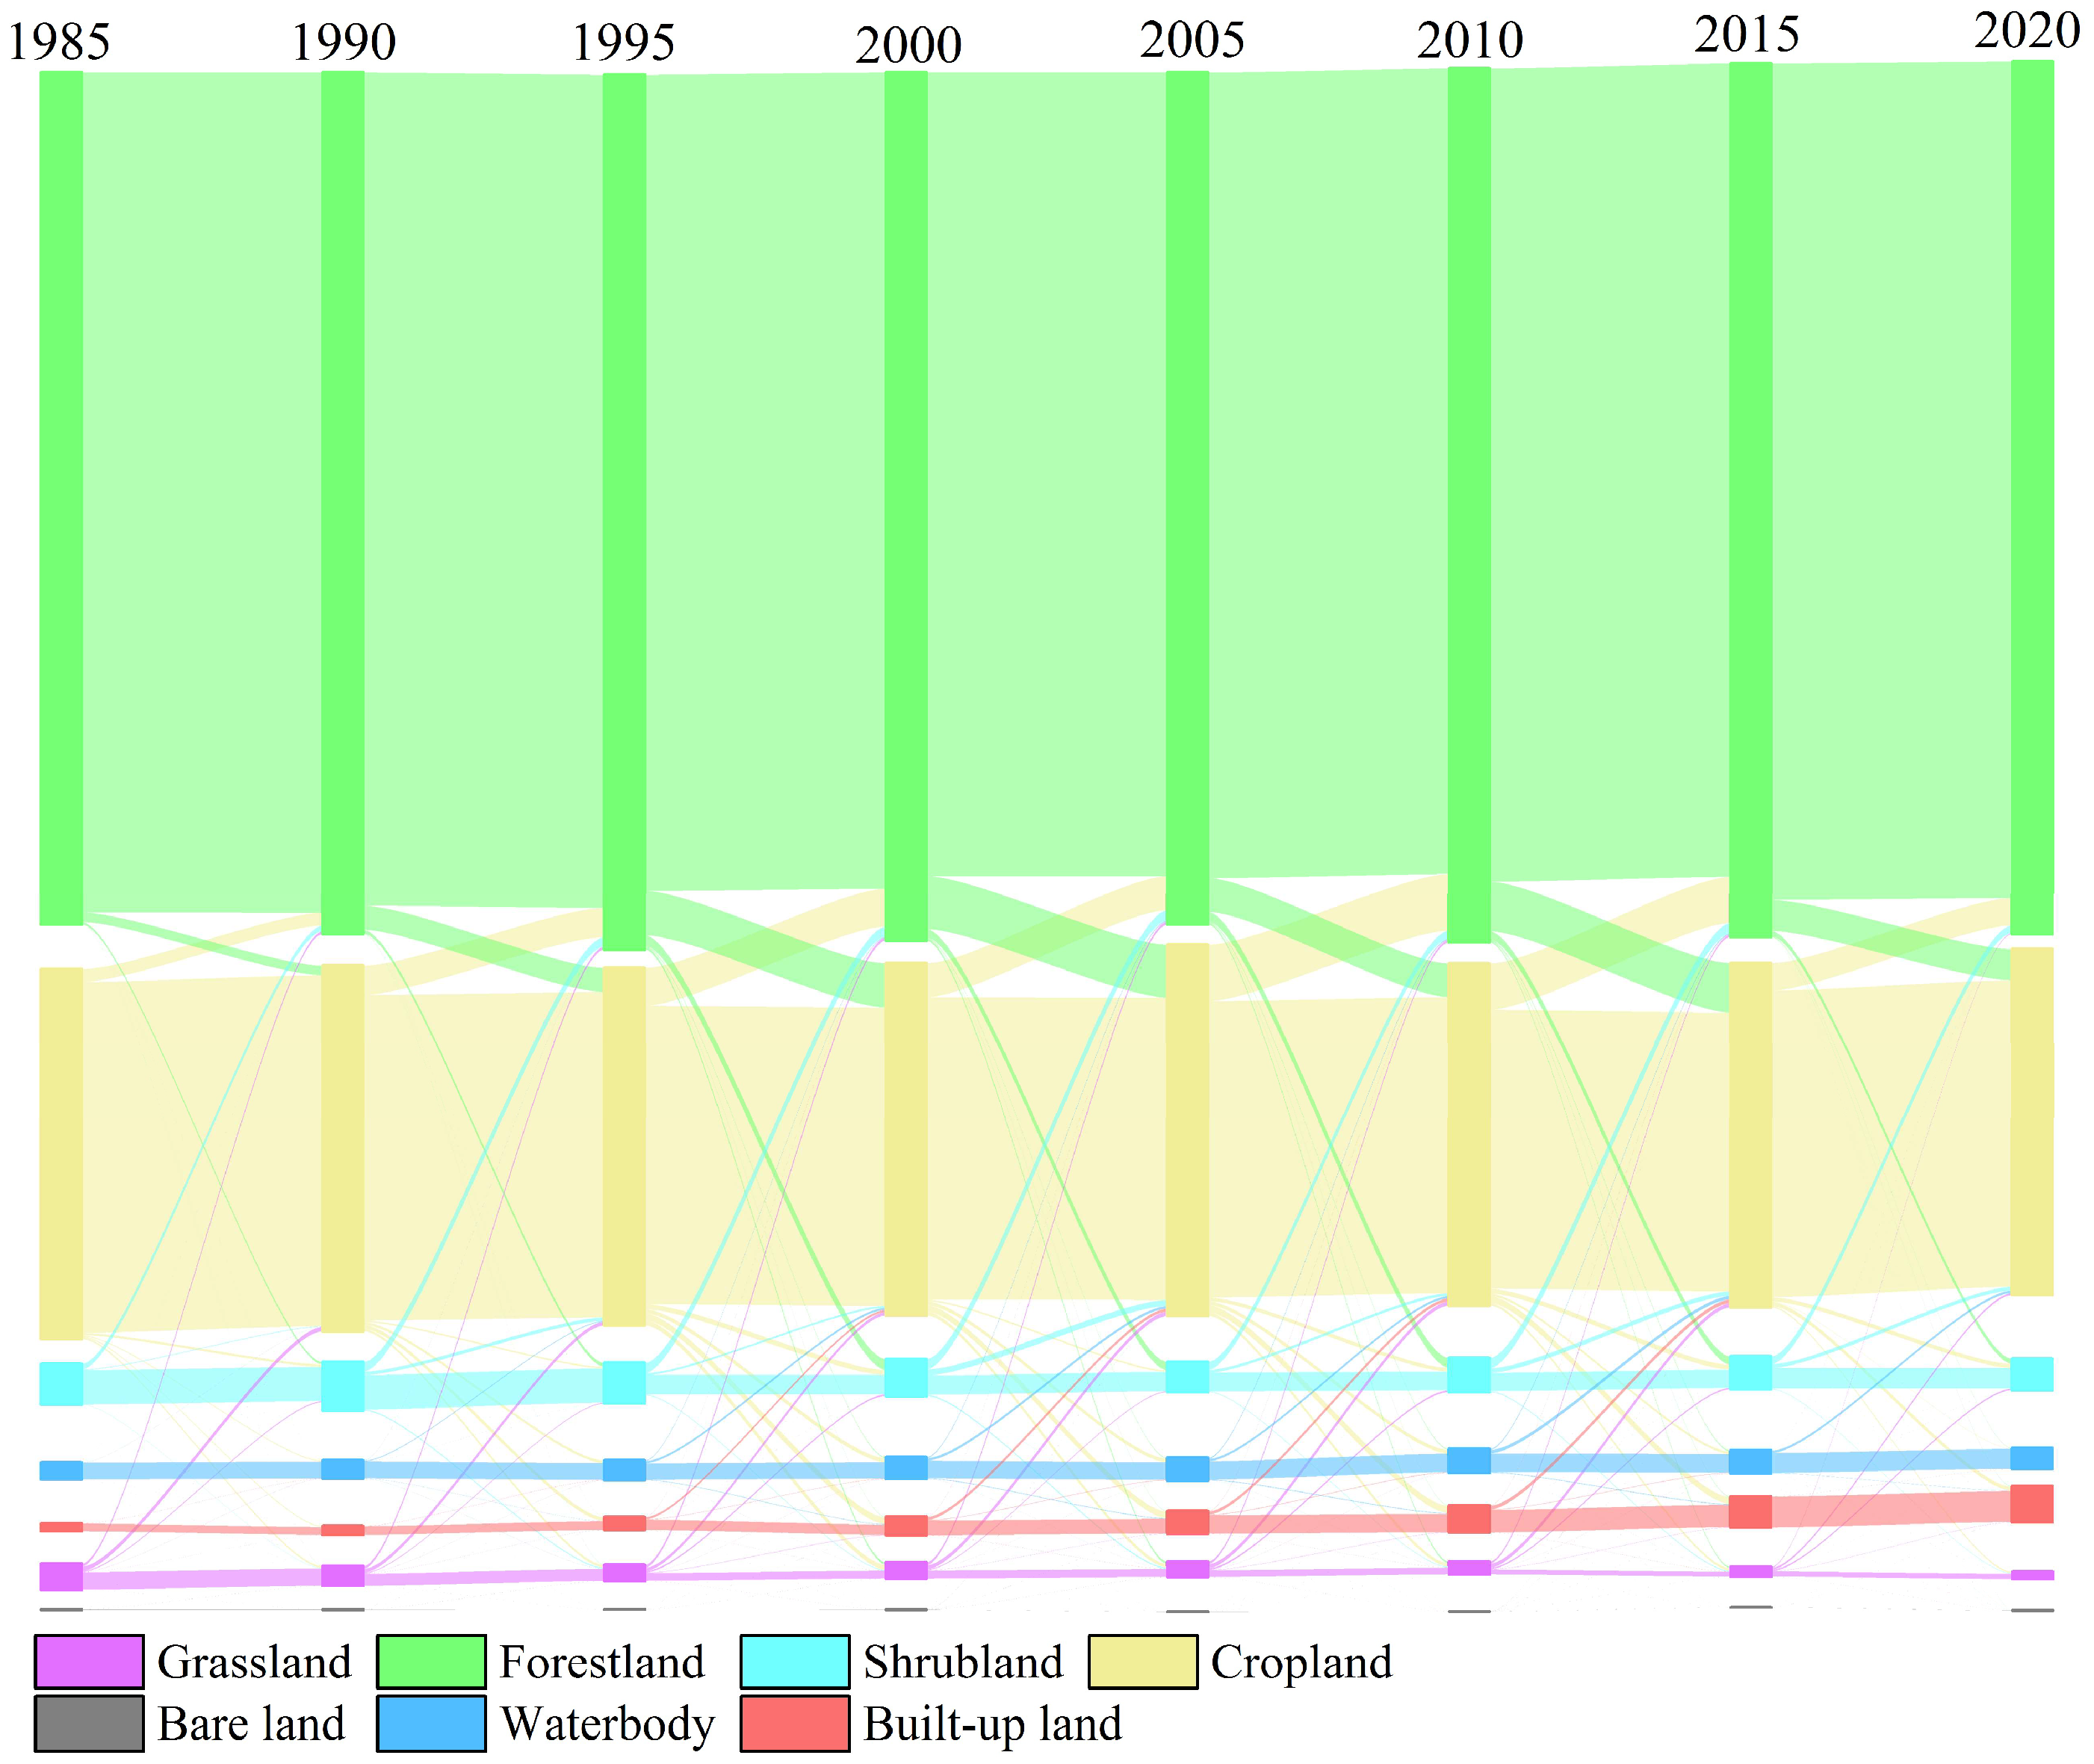
In addition, this study analyzed land use changes from 1985 to 2020 at 5-year intervals in seven sub-basins to investigate the land use transitions across various sub-basins. The results are presented in Figure 6, Figure 7, Figure 8, Figure 9, Figure 10, Figure 11 and Figure 12.
4.2.1. Land Use Dynamics in the Xijiang River Basin
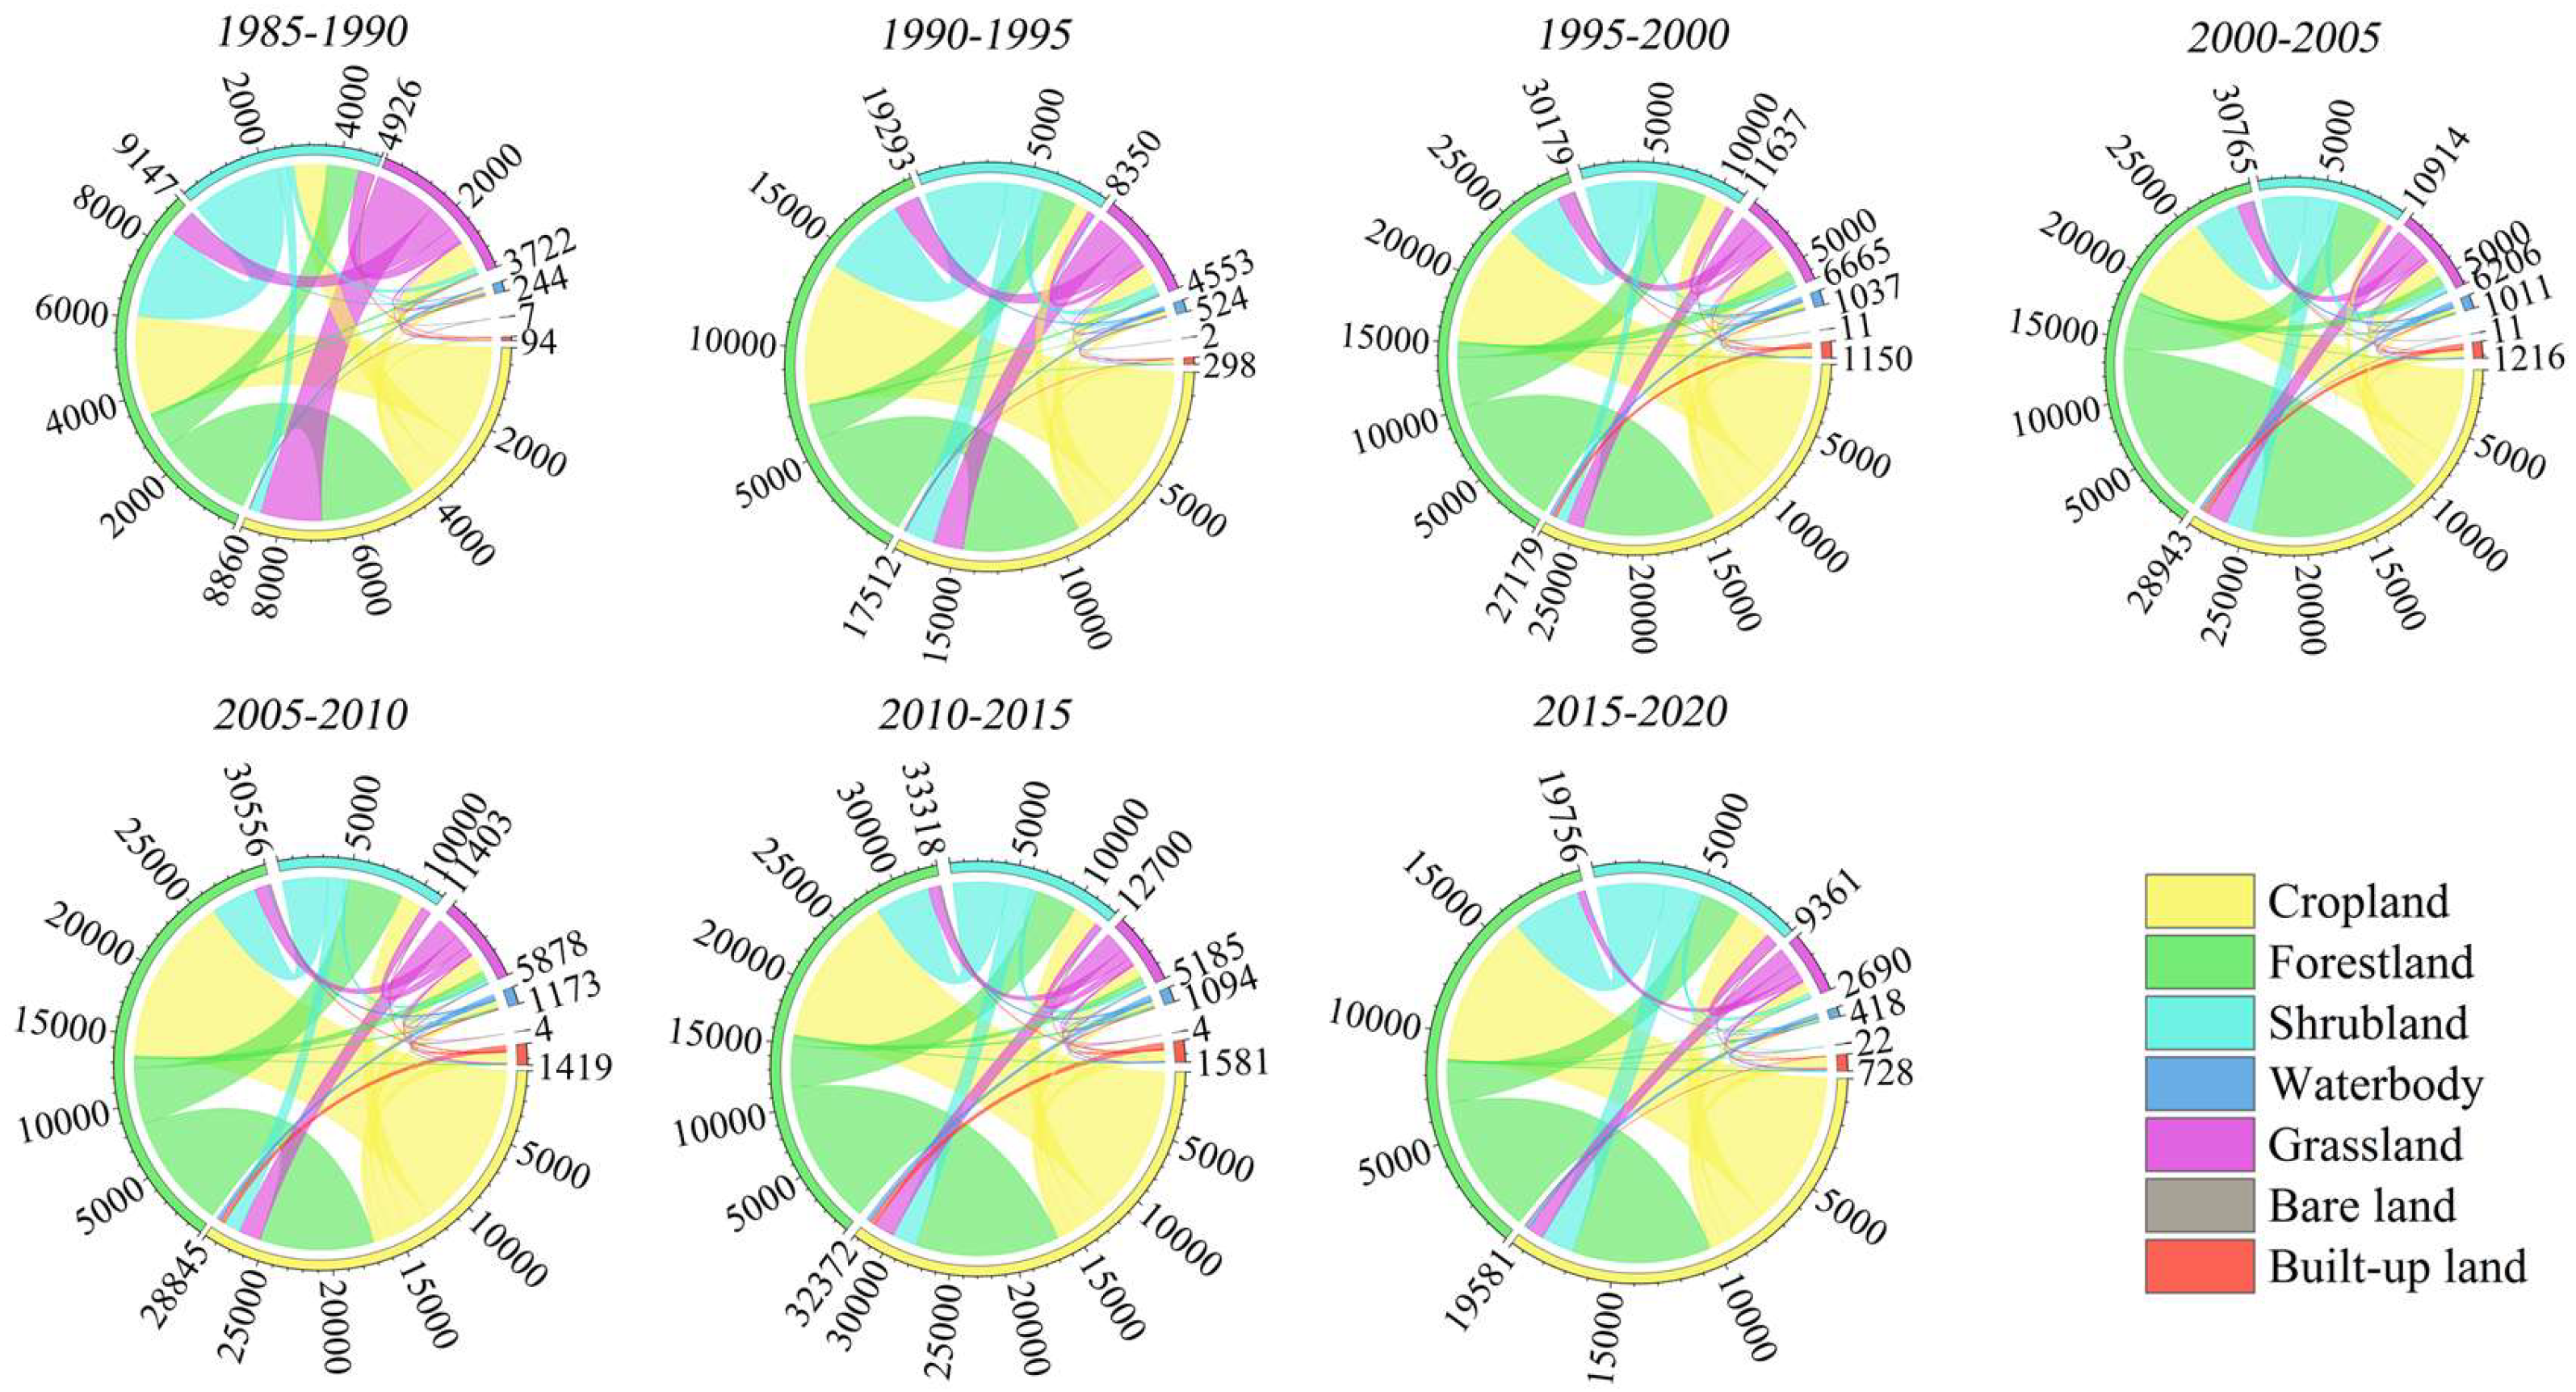
During 1985–2020, noticeable changes in land uses occurred in the Xijiang River Basin, particularly in forestland, grassland, shrubland, and built-up land (Figure 6). Forestland experienced the fastest growth among all land uses, with a total gain of 7790 km2, which primarily came from shrubland and grassland. From 1995 to 2005, there was a continuous decline in forestland, mainly due to large-scale deforestation and land reclamation in central Guangxi and southern Guizhou. However, after 2005, cropland converted to forestland and made the proportion of forestland show an upward trend. Built-up land ranked the second in growth rate in the Xijiang River Basin, showing a significant expansion with a total gain of 2554 km2. This increase possibly came transformation from cropland and forestland. From 2005 to 2020, built-up land witnessed the highest growth in total area, with a total increase of 1612 km2, while grassland experienced the most significant decrease, with a total loss of 6737 km2 and was mainly converted into forestland and cropland. Shrubland also exhibited a decreasing trend, with a total loss of 4461 km2, and primarily transformed to cropland and forestland. The largest decrease in shrubland occurred during 1990–1995, with a total loss of 3063 km2. Changes in waterbodies were relatively inconspicuous, with a total gain of 623 km2, mainly coming from cropland and forestland, probably due to inundation by reservoirs. In the Xijiang River Basin, the mutual conversion between cropland and forestland remained the main phenomenon in land use change, although the conversion between cropland and bare land was relatively low.
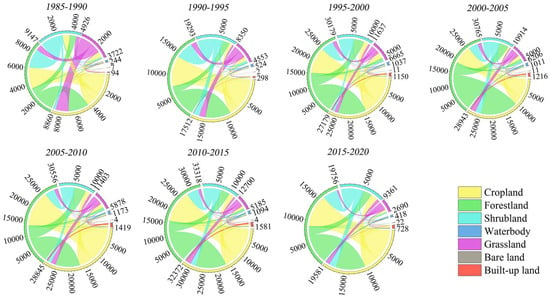
Figure 6.
Chord diagrams of land use change in the Xijiang River Basin during 1985–2020.
Figure 6.
Chord diagrams of land use change in the Xijiang River Basin during 1985–2020.
4.2.2. Land Use Dynamics in the Beijiang River Basin
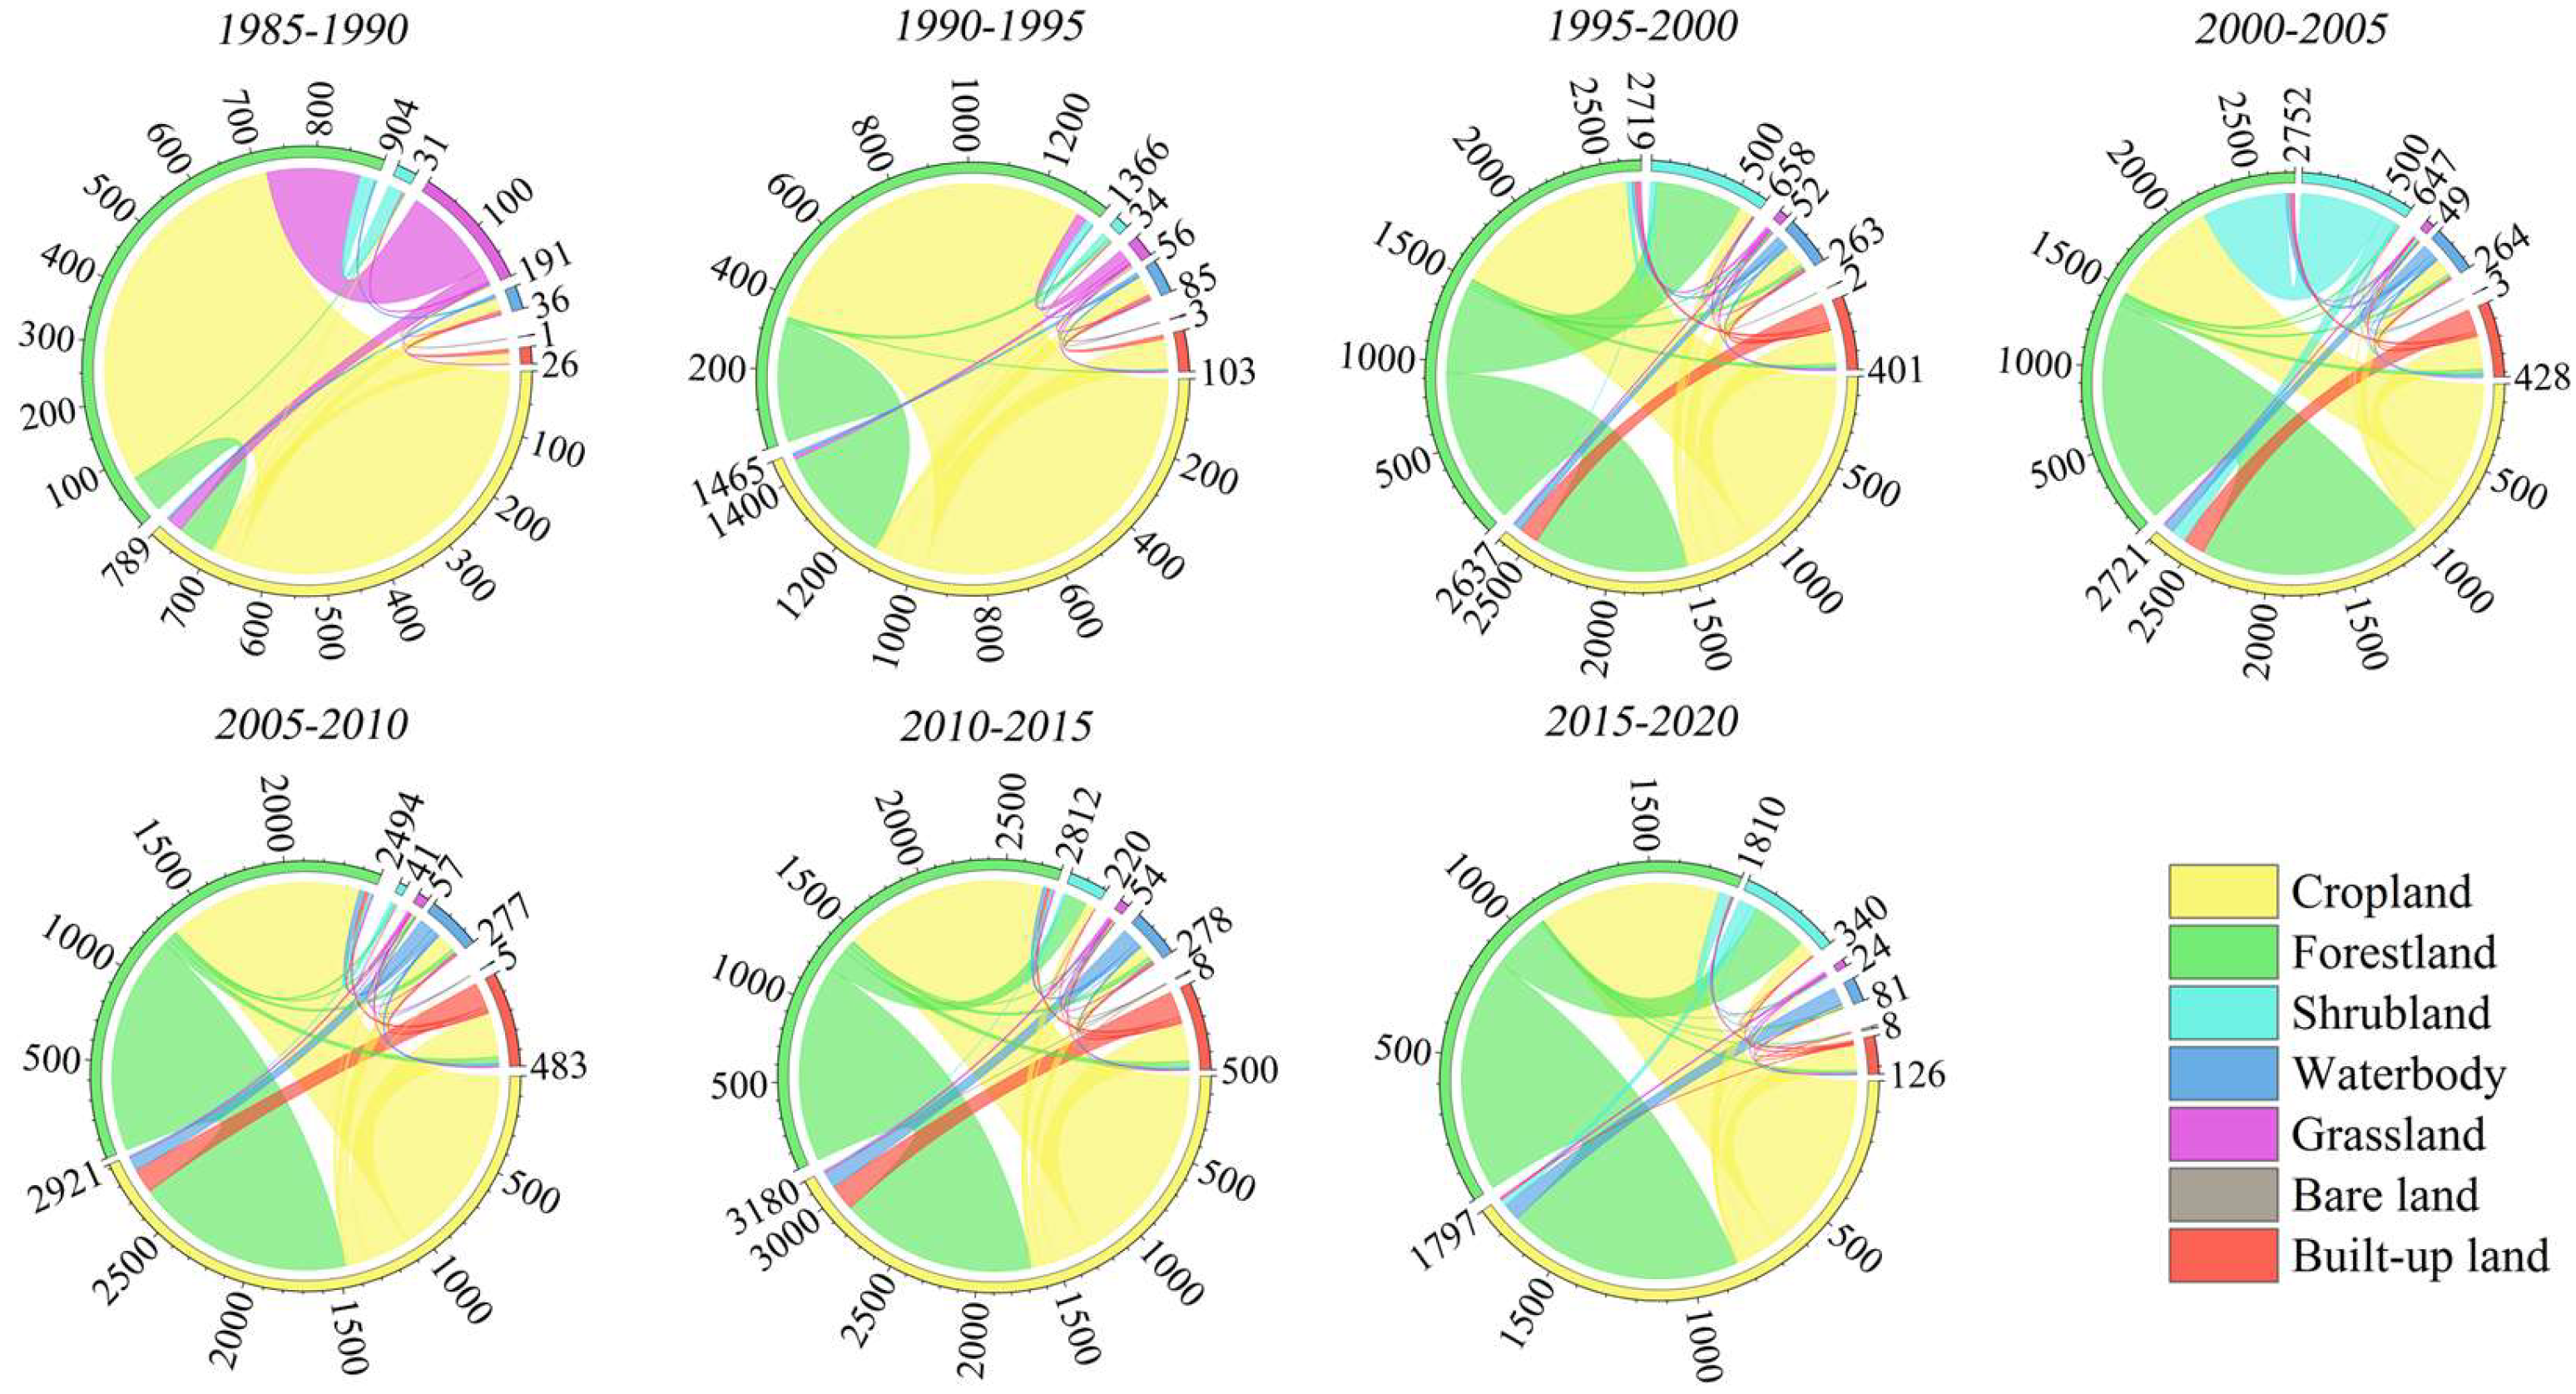
During 1985–2020, changes in land use in the Beijiang River Basin primarily in-volved the transition between cropland, forestland, shrubland, and built-up land (Figure 7). Cropland exhibited a decreasing trend, with a total loss of 1134 km2. The reductions in cropland were mainly concentrated between 1985 and 2000, primarily converting into forestland, shrubland, and built-up land. From 1985 to 2020, built-up land showed the fastest growth, with a total gain of 571 km2, and mainly came from cropland. Forestland also showed a slight increase of 340 km2 during the same period, and primarily transformed from cropland. The increase in forestland was mainly concentrated between 1985 and 1995, while after 1995, forestland exhibited a steadily decreased. From 1985 to 2020, the increase in shrubland was almost similar to the increase in forestland area, with a total gain of 322 km2, mostly due to the degradation of forestland between 1995 and 2000. Grassland had the second-highest decrease, showing a continuous declining trend. Especially between 1985 and 1990, grassland decreased by 183 km2, primarily converting into forestland. Waterbodies exhibited an increasing trend, with a total gain of 149 km2. The changes in barren bare land were relatively low and remained stable.
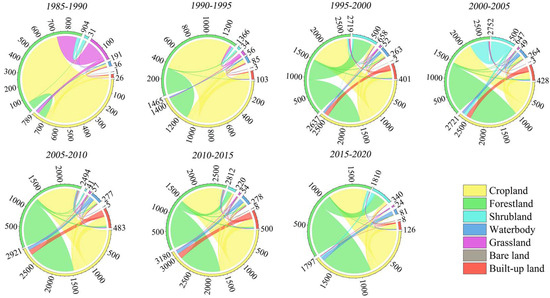
Figure 7.
Chord diagrams of land use change in the Beijiang River Basin during 1985–2020.
Figure 7.
Chord diagrams of land use change in the Beijiang River Basin during 1985–2020.
4.2.3. Land Use Dynamics in the Dongjiang River Basin
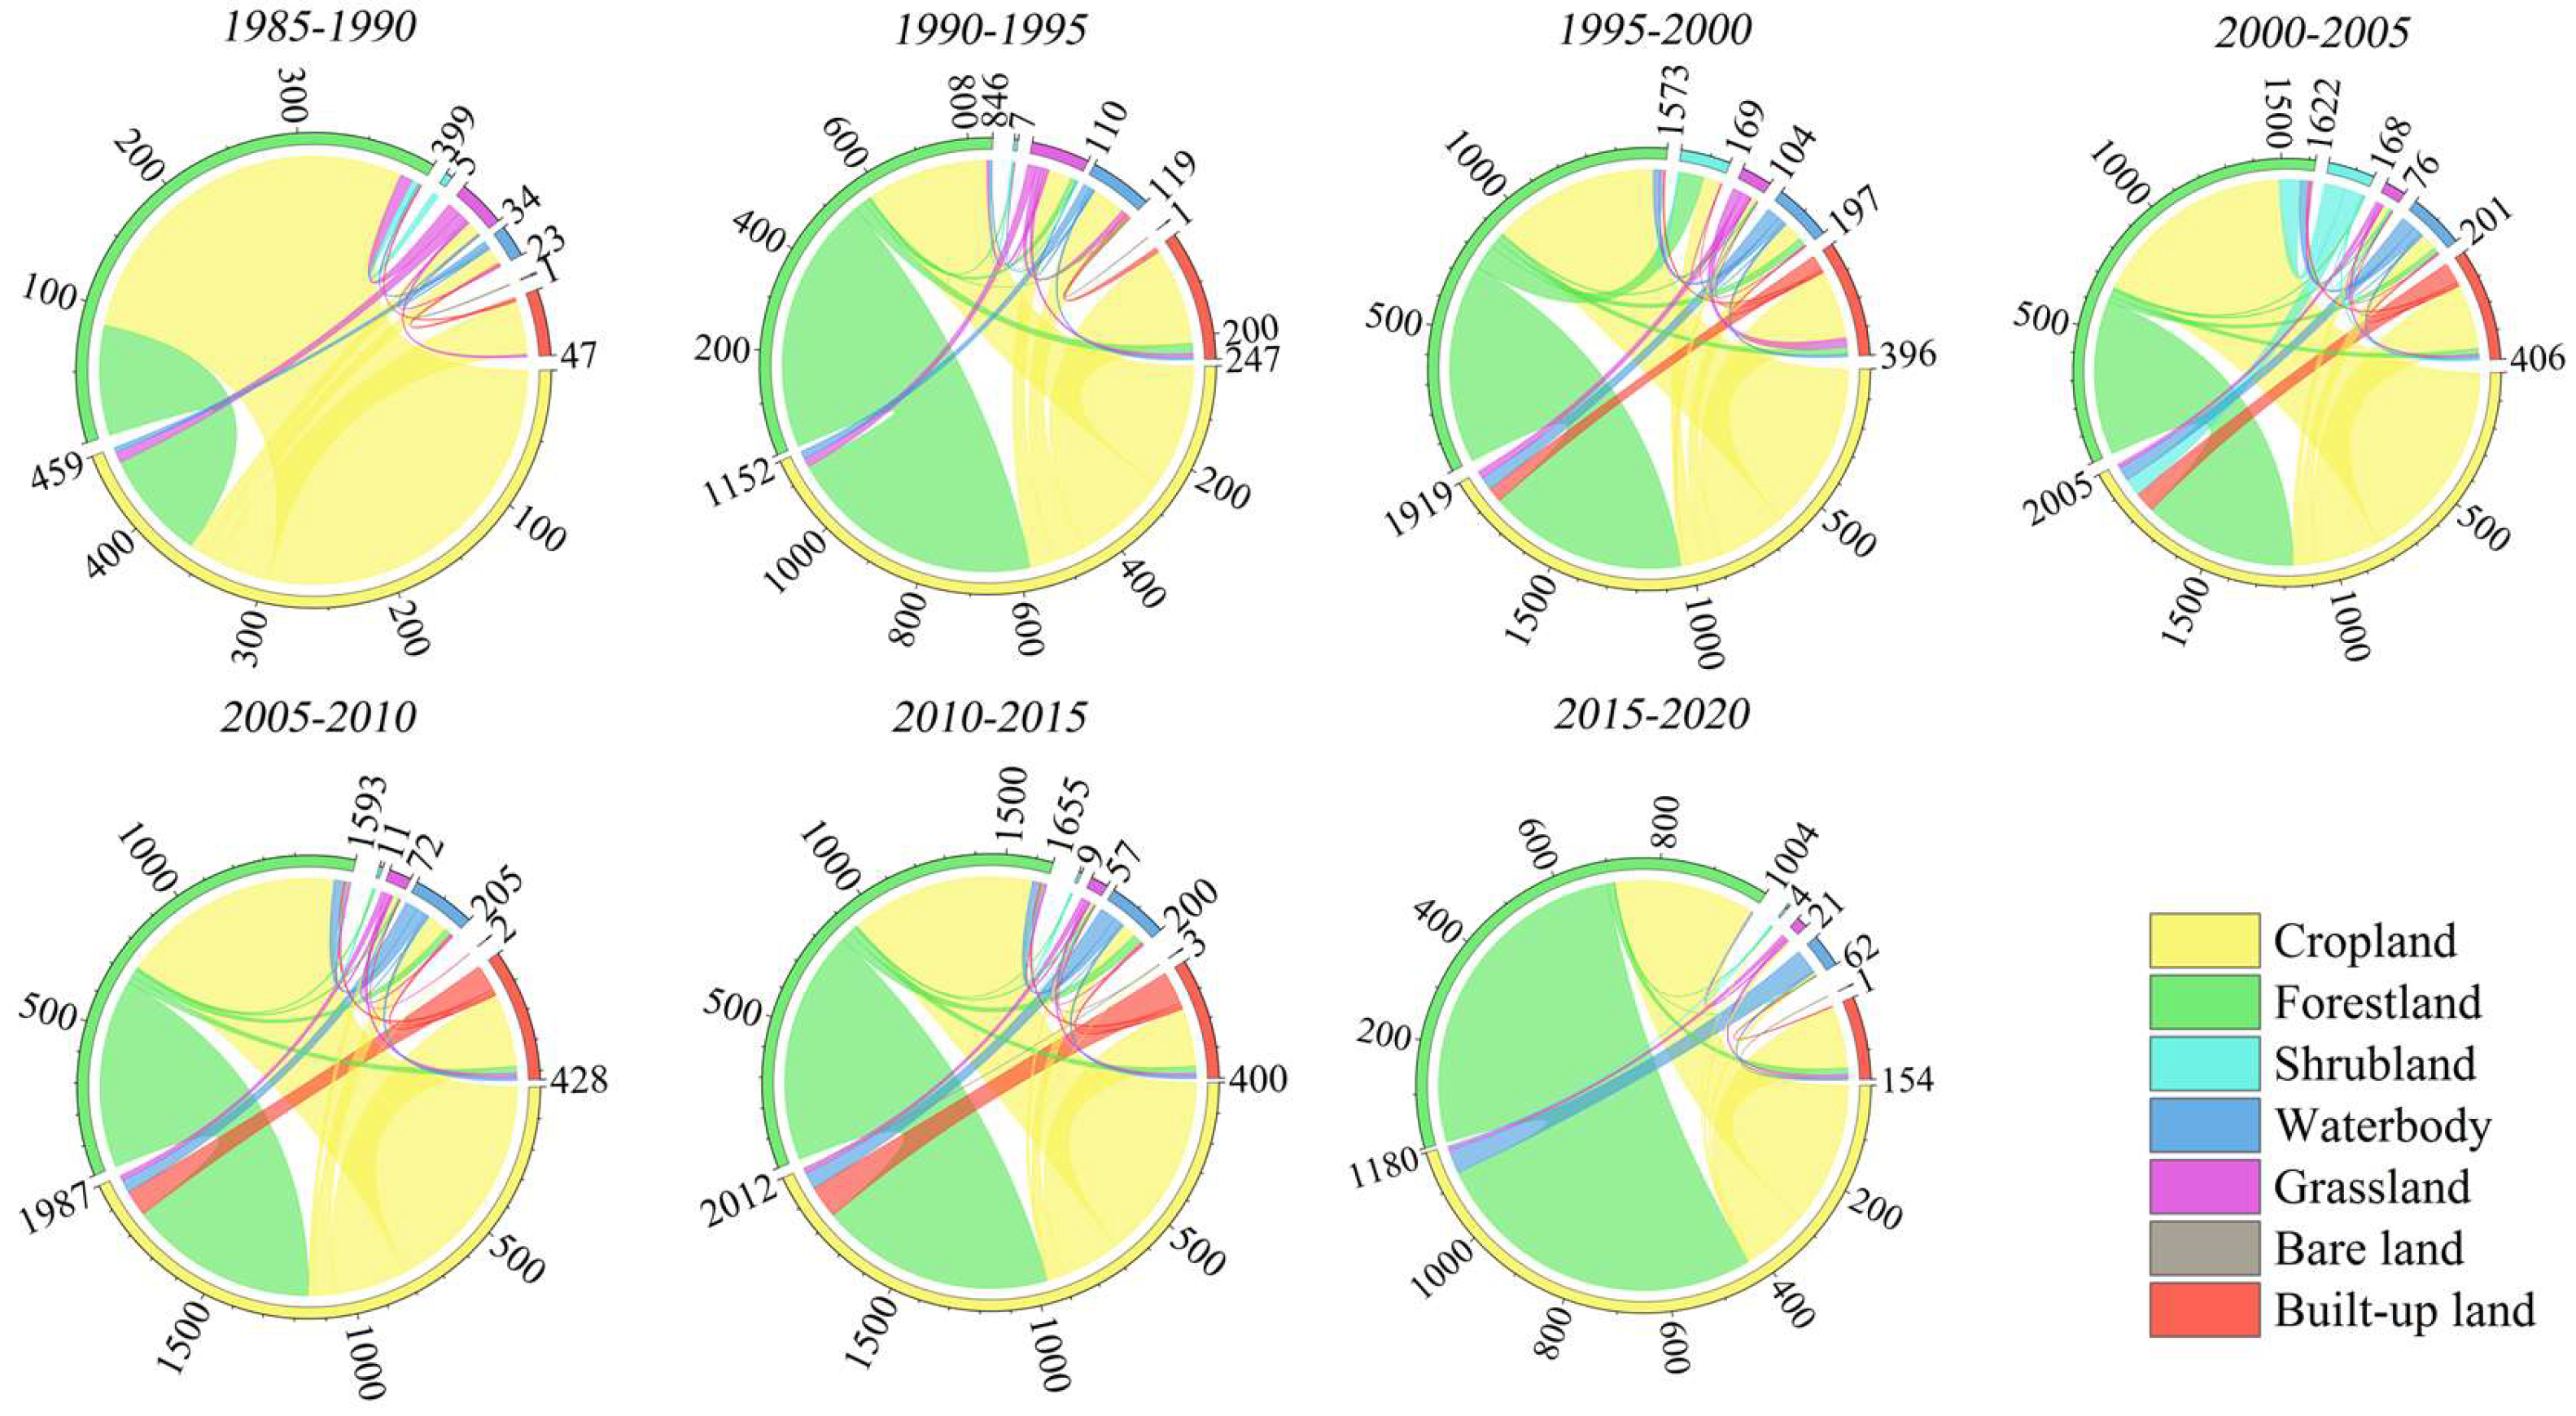
From 1985 to 2020, built-up land, cropland, and forestland changed rapidly in the Dongjiang River Basin (Figure 8). Among these, the fastest increase in land use types was built-up land, with a total gain of 1194 km2. The peak increase occurred between 1990 and 2010, primarily resulting from occupations of cropland and forestland. Cropland exhibited a fluctuating trend, with a continuous decrease from 1985 to 2010, followed by an increase from 2010 to 2020. Forestland also decreased with a total loss of 526 km2, out of which 322 km2 were transformed to cropland. The decrease in forestland occurred in 1990–2000 and 2010–2020. Waterbodies showed a slight increase trend, with a total gain of 67 km2 over the study period, mostly sourced from cropland. However, part of the waterbodies was slowly converted to cropland from 2015 to 2020. The changes among other land use types were insignificant.
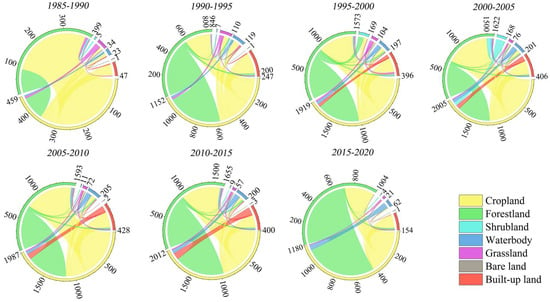
Figure 8.
Chord diagrams of land use change in the Dongjiang River Basin during 1985–2020.
Figure 8.
Chord diagrams of land use change in the Dongjiang River Basin during 1985–2020.
4.2.4. Land Use Dynamics in the Hanjiang River Basin
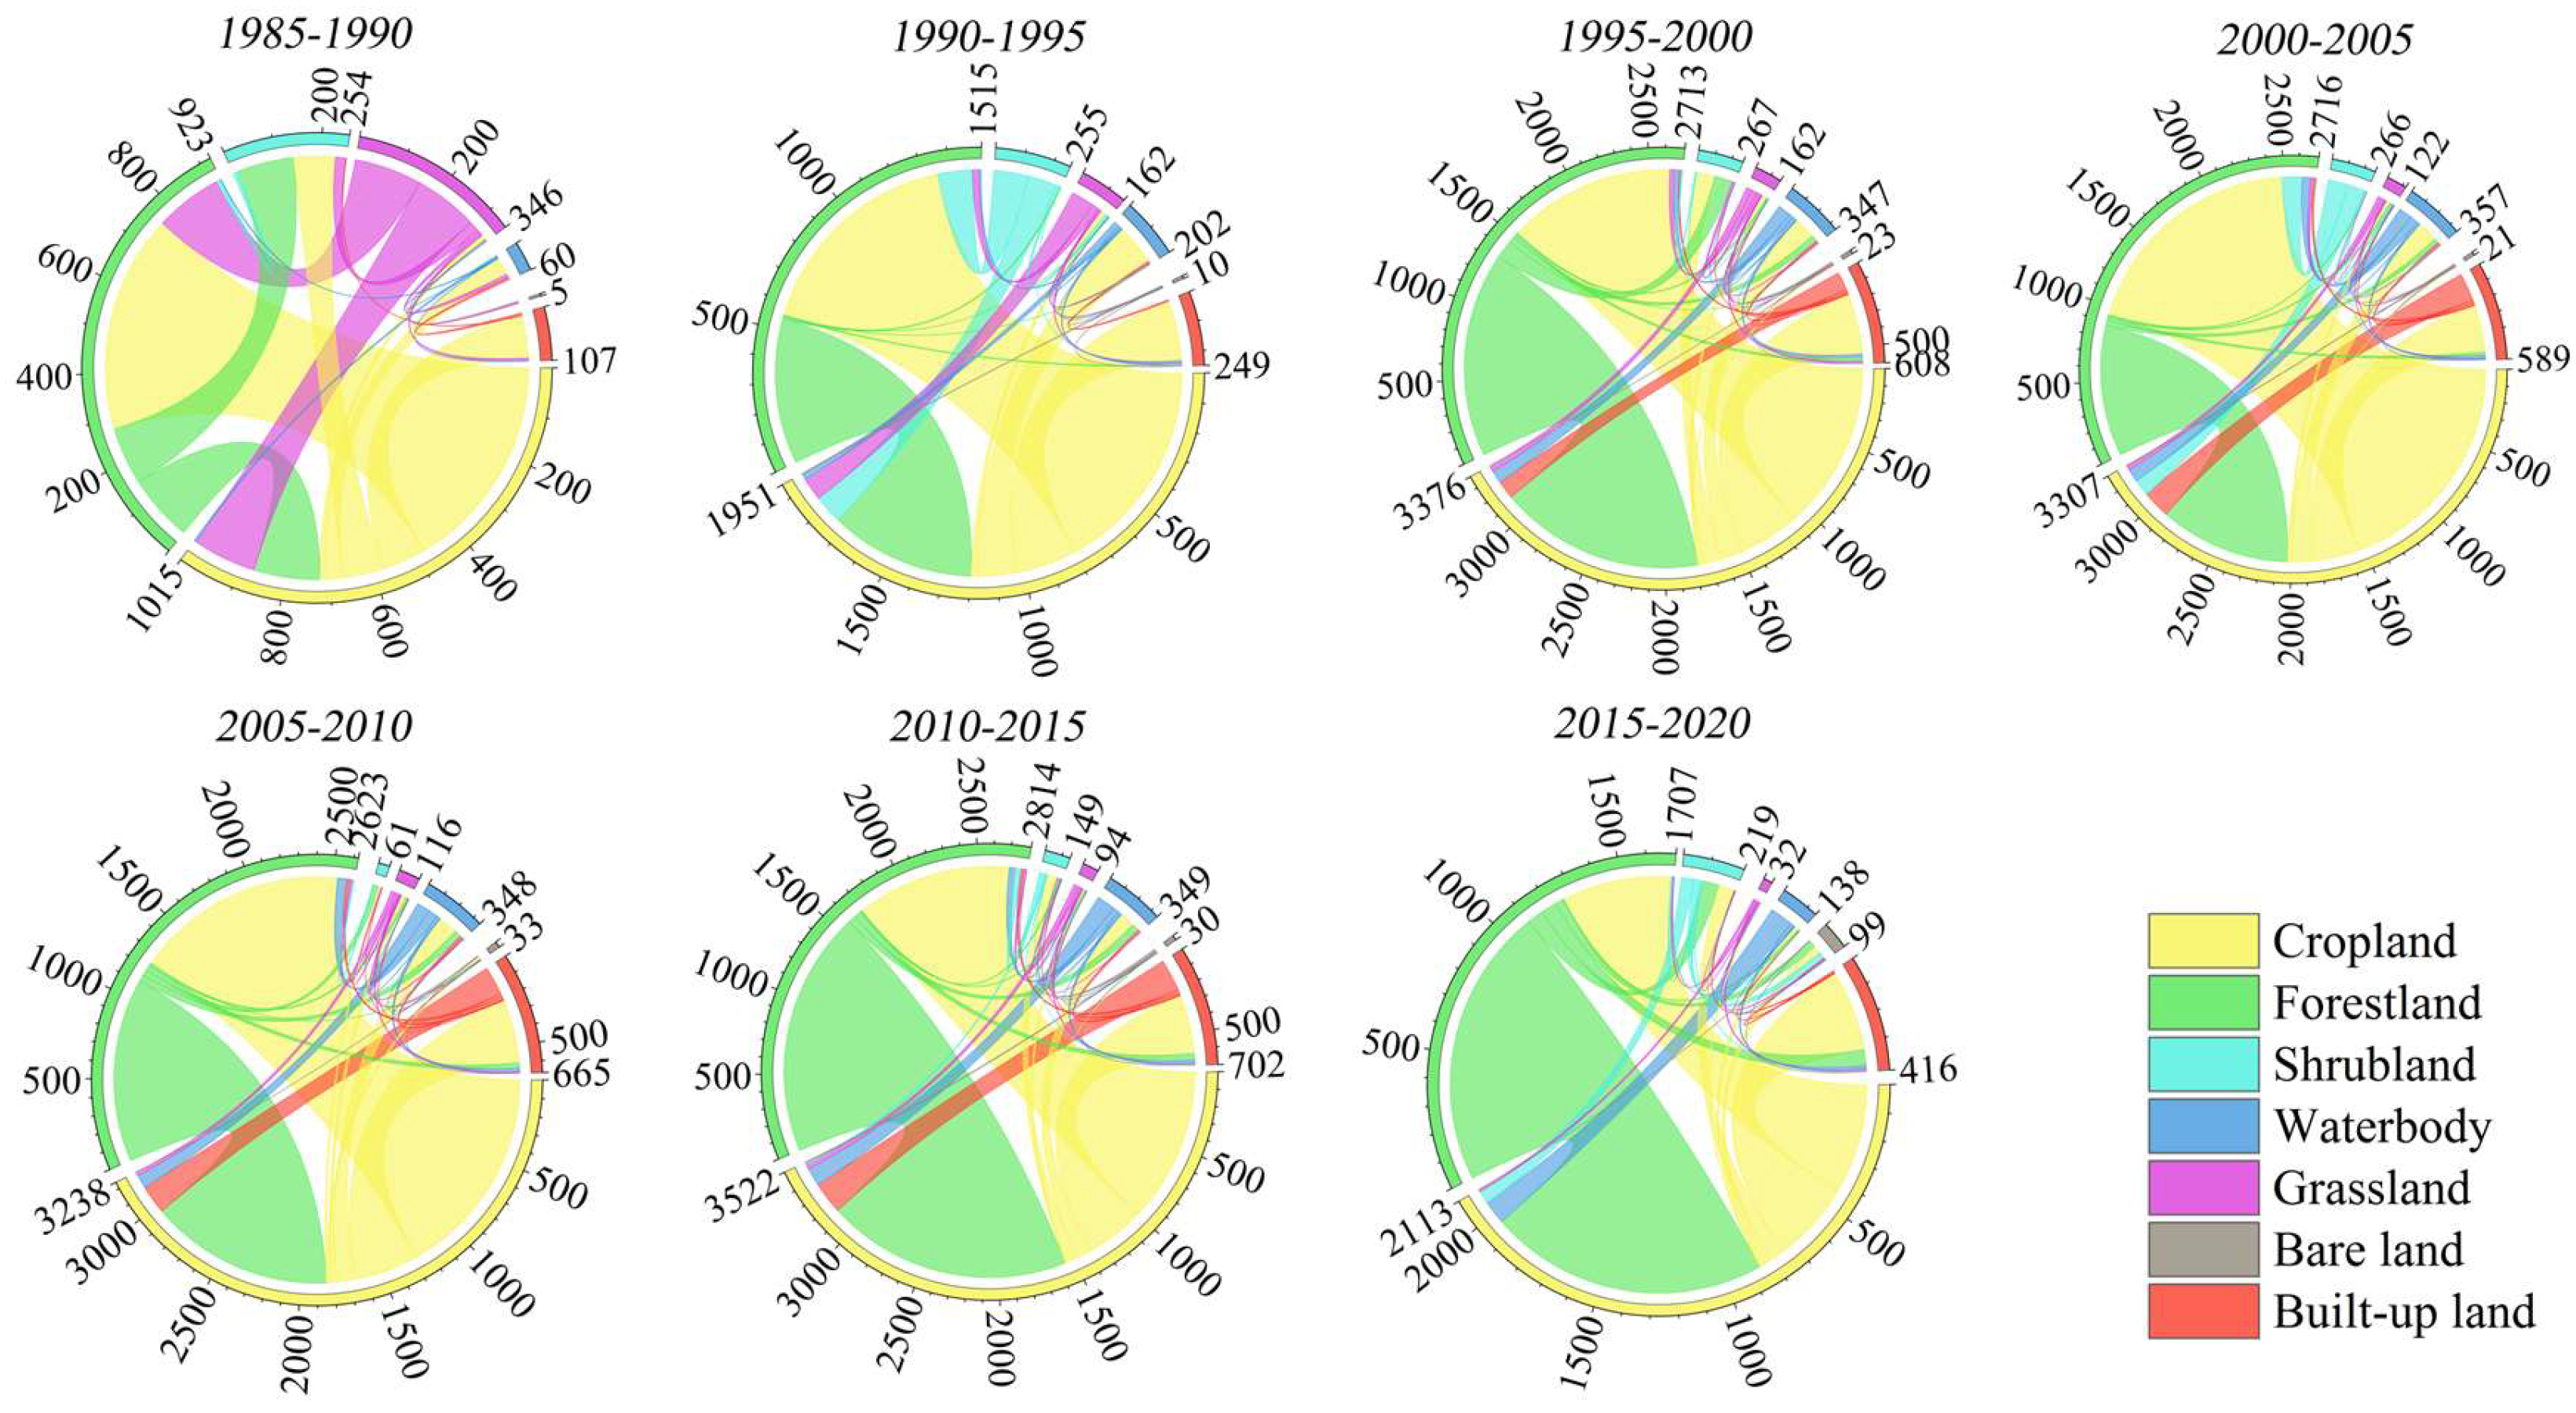
During the period 1985–2020, the most significant decrease occurred in cropland (Figure 9), with a total loss of 1477 km2, primarily resulting from the occupation of cropland by built-up land. From 1985 to 2010, cropland exhibited a steady decline, while there was a slight increase in cropland from 2010 to 2020. Grassland experienced a total decrease of 532 km2, with a loss of 314 km2 during 1985–1990, primarily converting into forestland and cropland. Built-up land also showed a continuous increase, with a total gain of 1608 km2. Waterbodies and cropland underwent mutual transitions during 1985 to 2020. From 1985 to 2010, waterbodies exhibited a continuous increasing trend, primarily deriving from cropland, while from 2010 to 2020, waterbodies converted into cropland. In addition, the conversions among other land uses remained low and stable.
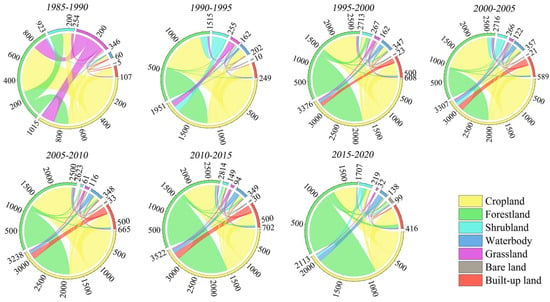
Figure 9.
Chord diagrams of land use change in the Hanjiang River Basin during 1985–2020.
Figure 9.
Chord diagrams of land use change in the Hanjiang River Basin during 1985–2020.
4.2.5. Land Use Dynamics in the CRSG and GW Region
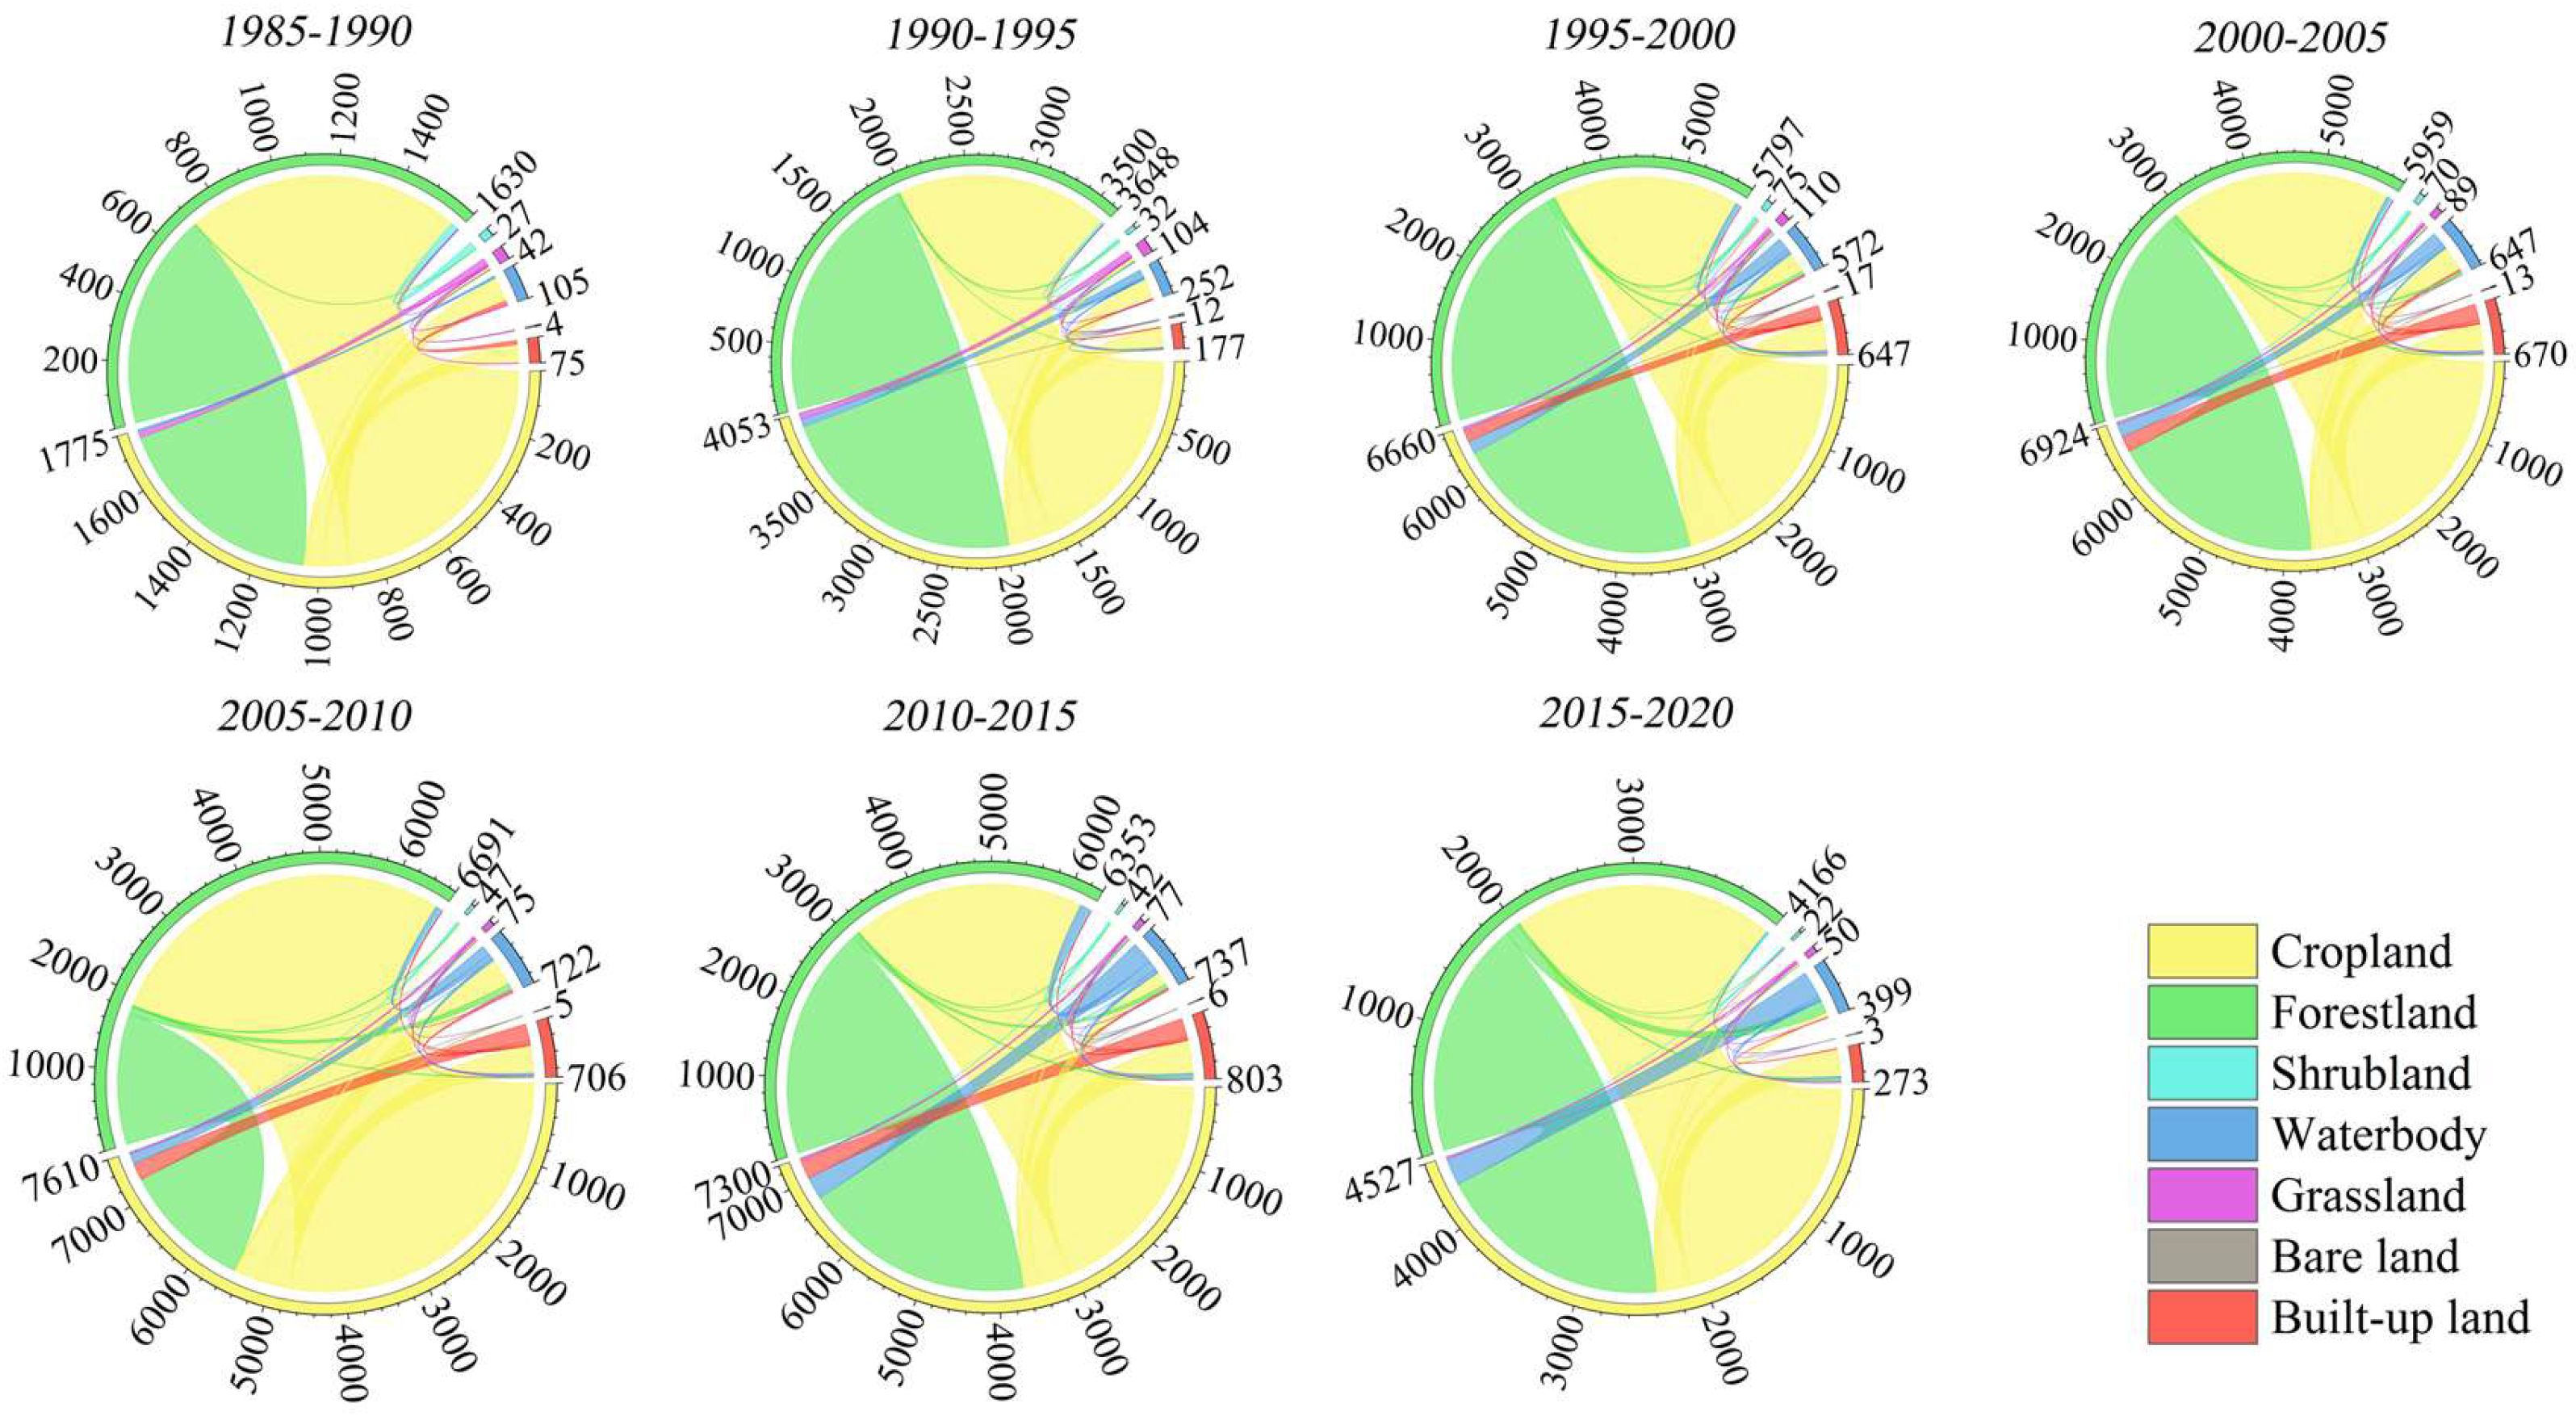
During 1985–2020, the CRSG and GW regions experienced significant changes in cropland, forestland, and built-up land (Figure 10). Cropland exhibited a noticeable decrease, with a total loss of 3768 km2. The peak decline occurred between 2005 and 2010, mostly converting into forestland and built-up land. Forestland showed the fastest increase, with a fluctuating trend, gaining a total of 2349 km2. Built-up land showed a continuous expansion, with a total gain of 1240 km2. Additionally, waterbodies demonstrated an increasing trend followed by a decreasing trend, with a total gain of 355 km2. The increase in waterbodies mainly occurred between 1985 and 2010, while from 2010 to 2020, there was a decrease as it transformed primarily into cropland and forestland.
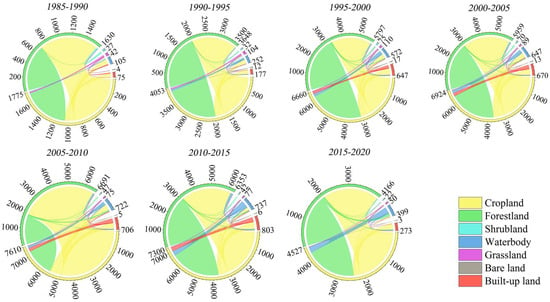
Figure 10.
Chord diagrams of land use change in the CRSG and GW region during 1985–2020.
Figure 10.
Chord diagrams of land use change in the CRSG and GW region during 1985–2020.
4.2.6. Land Use Dynamics in Hainan Island
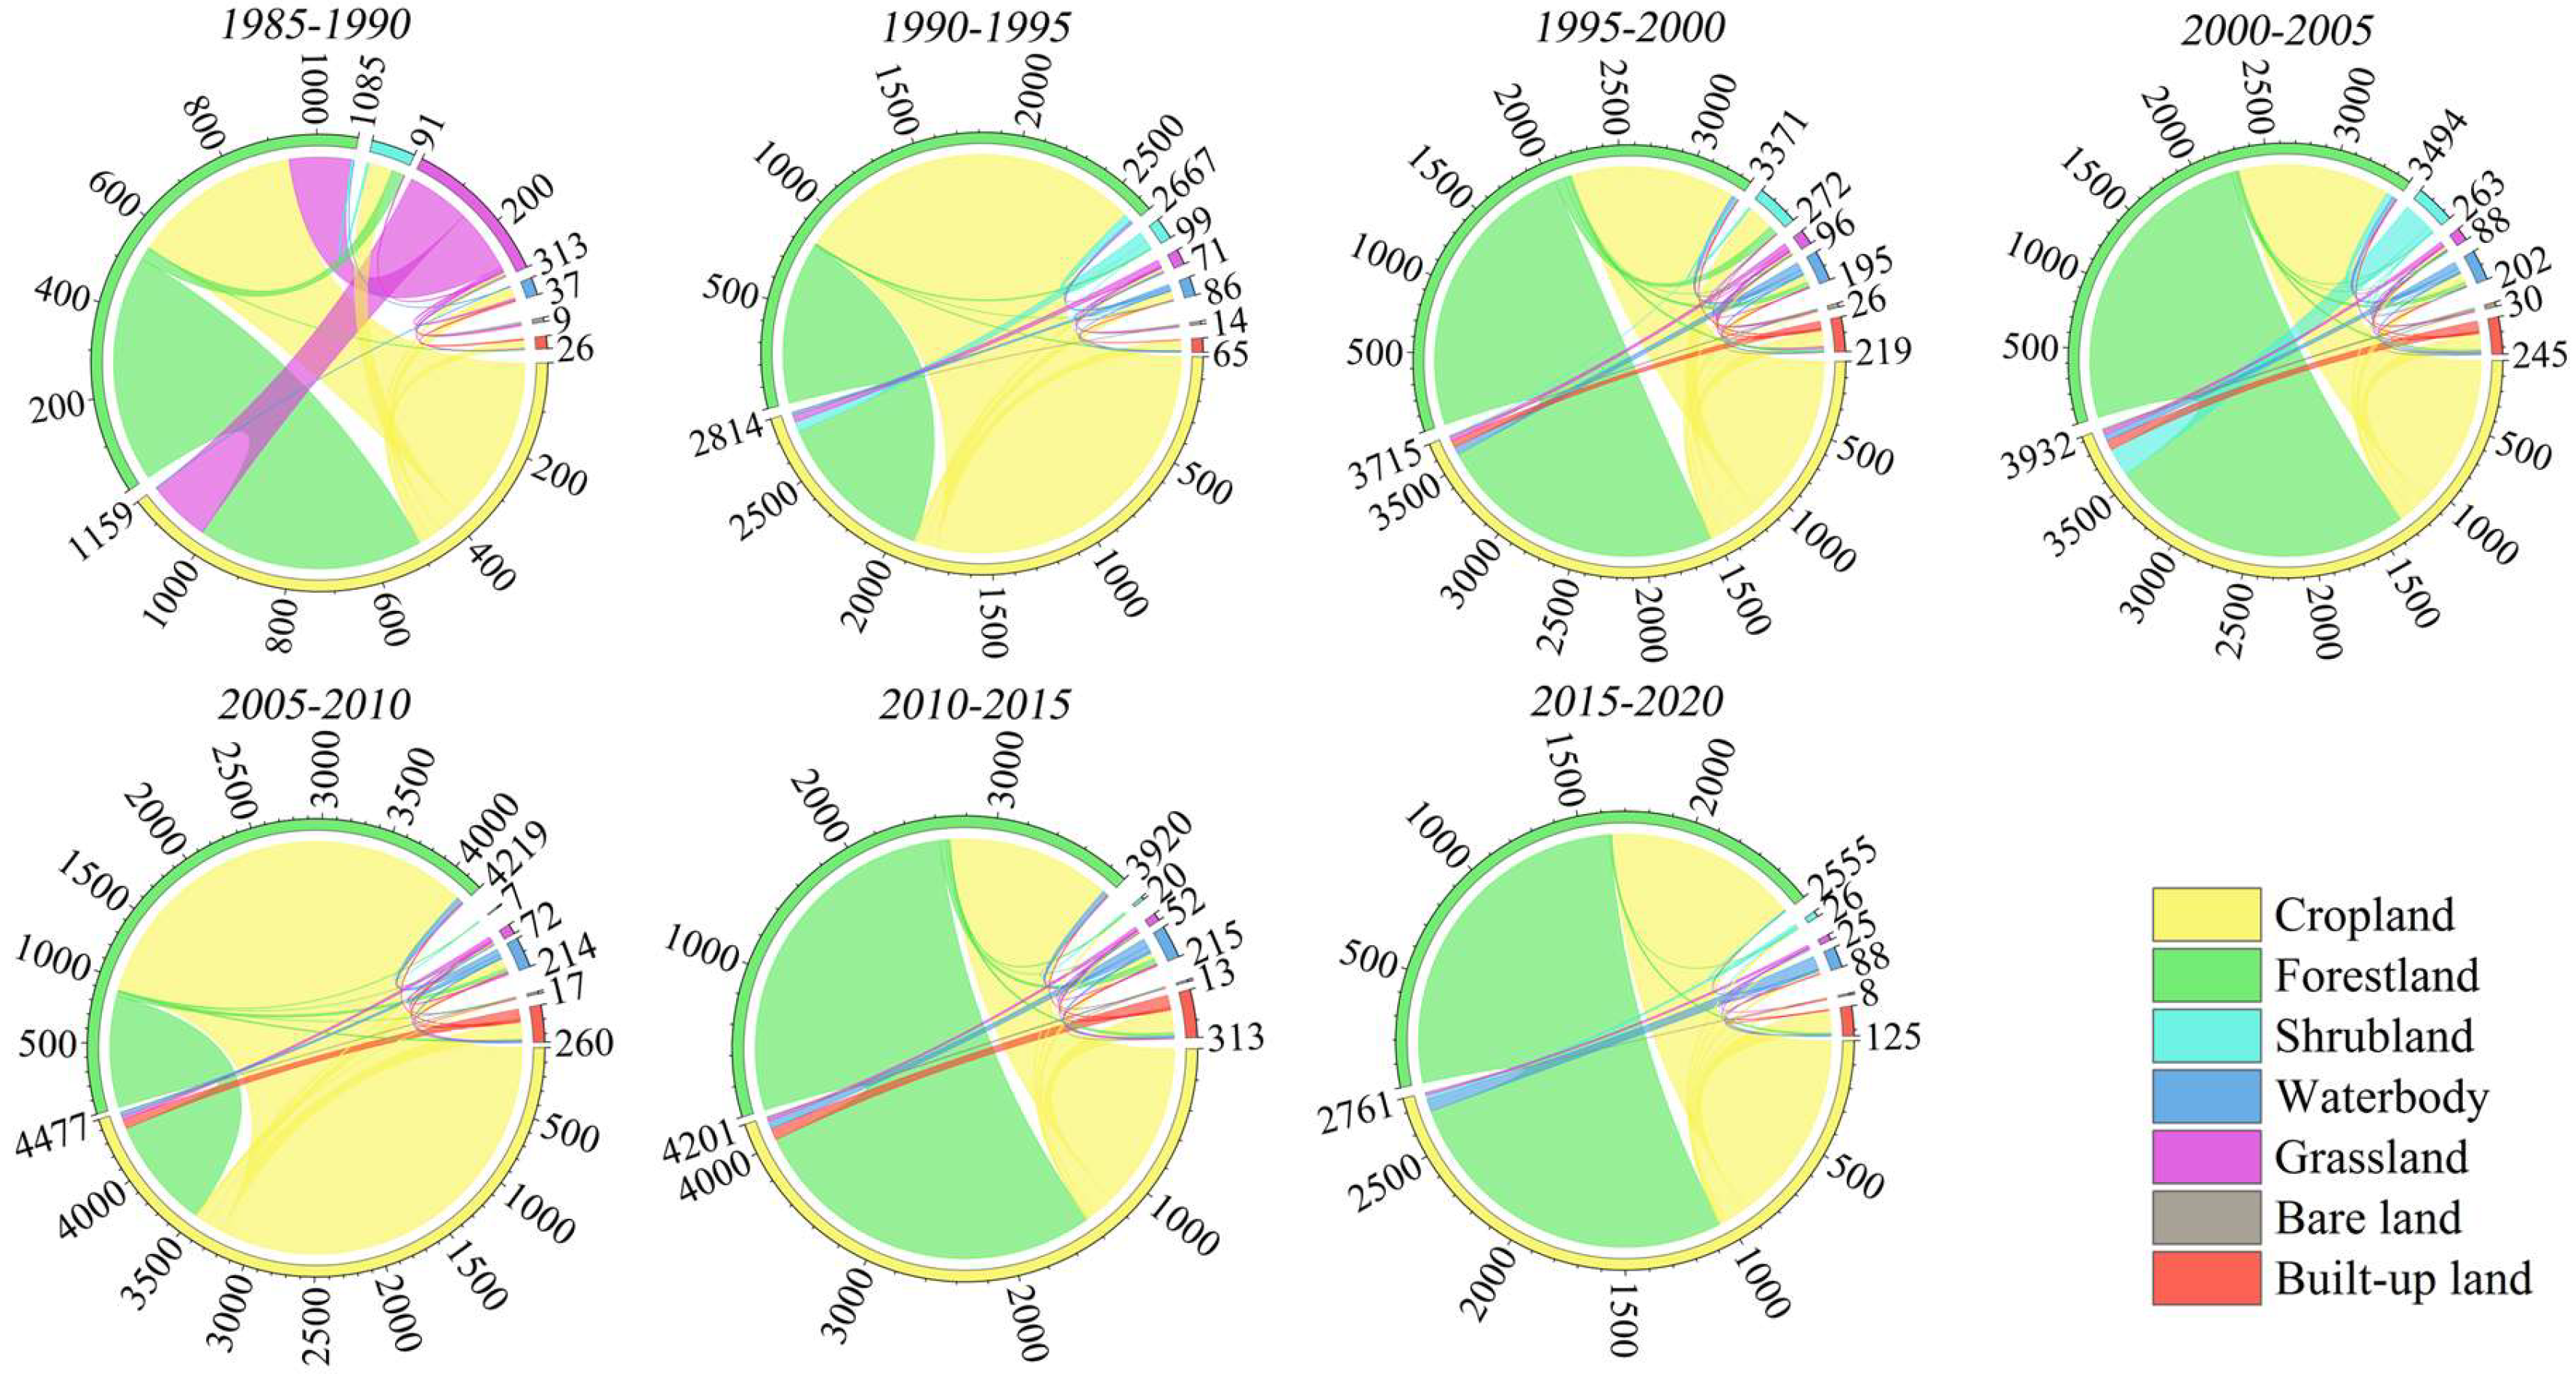
Between 1985 and 2020, the most significant decrease in land use in Hainan Island occurred in forestland (Figure 11), with a total loss of 814 km2. The most noticeable decrease took place between 2010 and 2020, primarily resulting from the transition of forestland into cropland and built-up land. Grassland showed a continuous decline, with a total loss of 405 km2, and was mainly converted into cropland and forestland. The biggest expansion was observed in cropland, with a total gain of 695 km2, which primarily came from forestland and shrubland. Built-up land also displayed a continuous expansion, with a total gain of 514 km2, mainly through the occupation of cropland and forestland. In addition, a total of 207 km2 of shrubland was replaced by cropland between 2000 and 2005. Other land uses, such as waterbodies and bare land, experienced relatively insignificant changes.
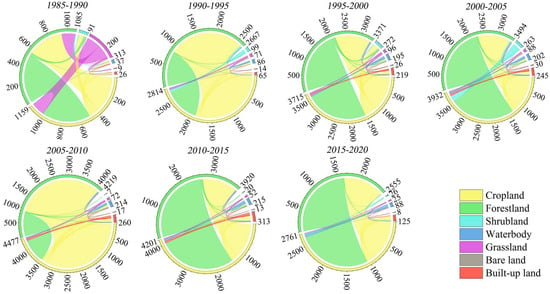
Figure 11.
Chord diagrams of land use change in Hainan Island during 1985–2020.
Figure 11.
Chord diagrams of land use change in Hainan Island during 1985–2020.
4.2.7. Land Use Dynamics in the Pearl River Delta
The Pearl River Delta experienced a total decrease of 4307 km2 in cropland from 1985 to 2020, with 89% of the cropland being converted into built-up land (Figure 12). From 1985 to 2015, cropland exhibited a continuous decrease, with 5-year decreases of 402 km2, 948 km2, 1128 km2, 748 km2, 1135 km2, and 307 km2, respectively. The primary results of the converted cropland were built-up land, with a smaller portion going to forestland. Forestland decreased by 398 km2, mainly converting into built-up land and cropland. Among the converted forestland, 88.1% was occupied by built-up land and 7.7% was transferred to cropland. The highest growth rate was observed in built-up land, showing continuous expansion with a total gain of 4472 km2. The conversions mainly involved cropland, forestland, and waterbodies. Approximately 85.7% of the increase in built-up land came from cropland, 7.8% from forestland, and 6% from waterbodies. The significant increase in built-up land primarily occurred between 1990 and 2010. During this period, the coastal cities of the Pearl River Delta experienced rapid economic development, resulting in an increase of 3433 km2 in built-up land. Waterbodies showed an initial increase followed by a decrease, with a total gain of 240 km2, primarily resulting from cropland and forestland.
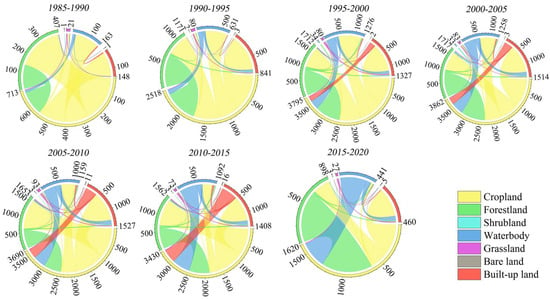
Figure 12.
Land use transfer in the Pearl River Delta during 1985–2020.
Figure 12.
Land use transfer in the Pearl River Delta during 1985–2020.
4.3. Land Use Transfer in the PPRB
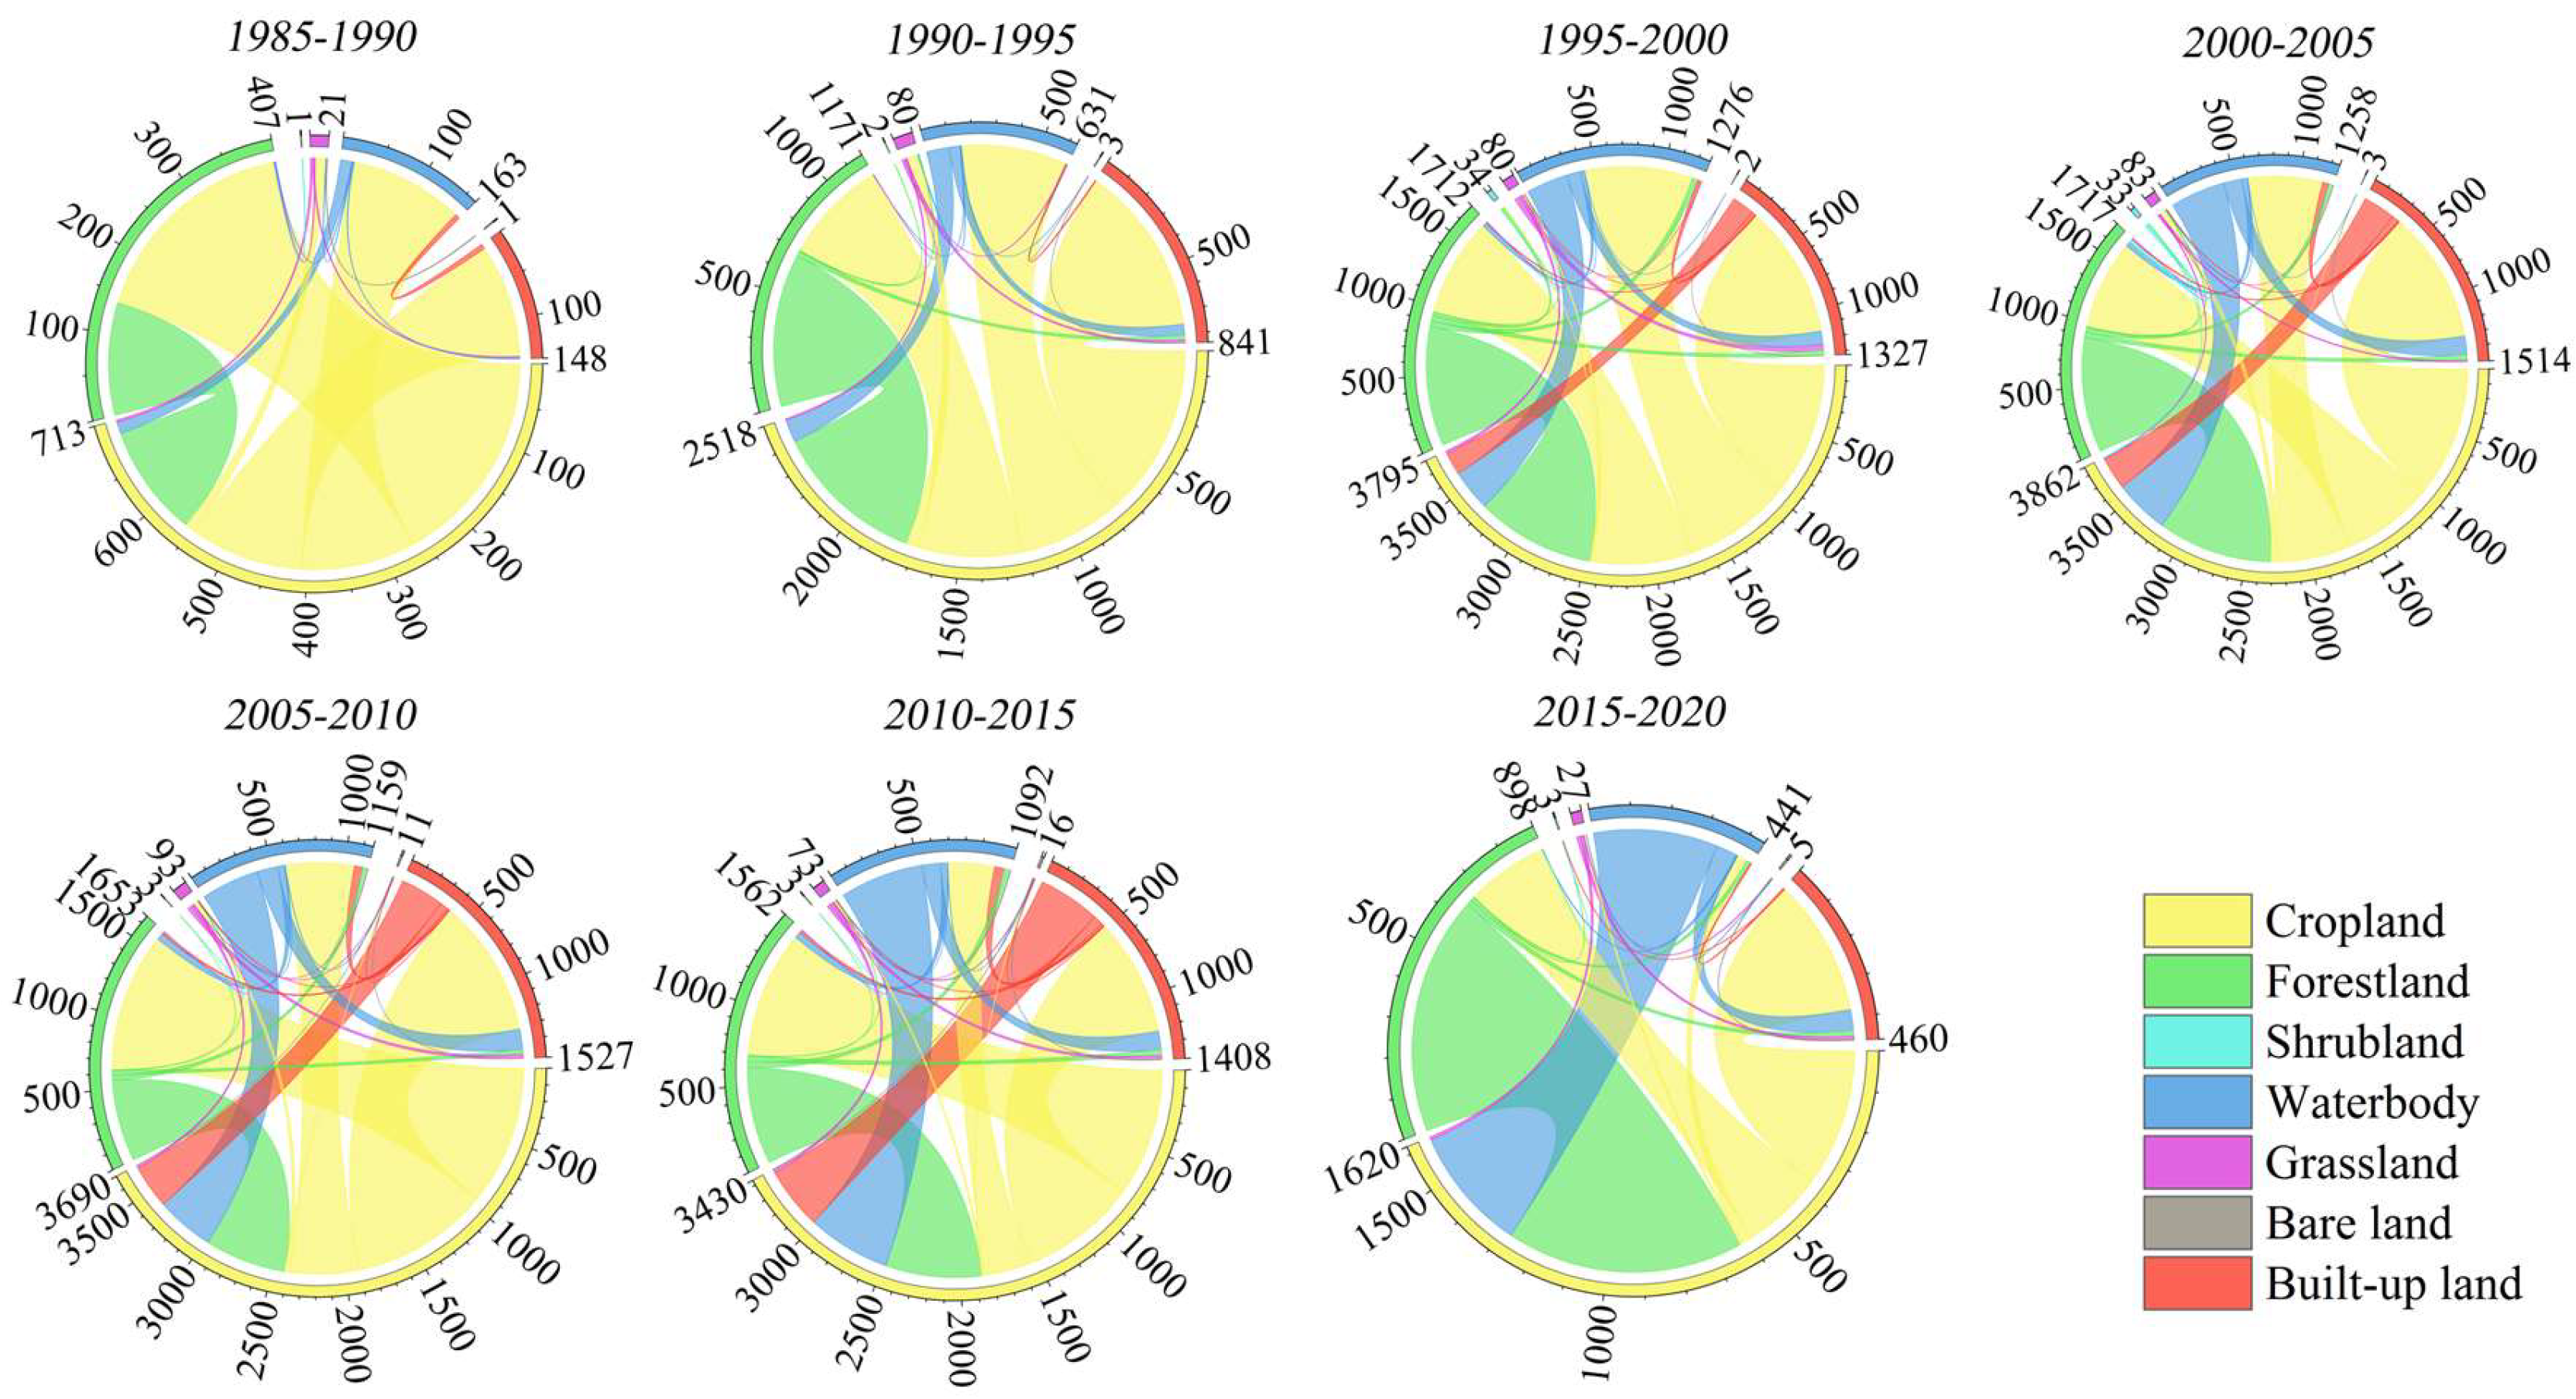
This study divided the land use changes in the Pan-Pearl River Basin from 1985 to 2020 into seven periods at 5-year intervals and conducted a transfer matrix analysis over the seven periods (Figure 13). From 1985 to 2020, land use changes in the PPRB display a very clear trend, with decreases in cropland, forestland, shrubland, and grassland into built-up land; specifically, the largest reduction happened in cropland (10,435 km2), with major conversion to forestland and built-up land in southern Guizhou, central Guangxi, the southern areas of CRSG and WG, and the Pearl River Delta. From 1990 to 2010, rapid urbanization in the Pearl River Basin reclaimed a large amount of cropland, resulting in the disappearance of 10,723 km2 of cropland. Secondly, grassland continued to decrease rapidly, with a total reduction of 8114 km2, caused by the conversion of most of the grassland in Yunnan, Guizhou, and northern Guangxi into artificial cropland, despite a small amount of grassland being designated as forestland. The shrubland also decreased, mainly in Yunnan and Guizhou provinces, with a total reduction of 4095 km2.
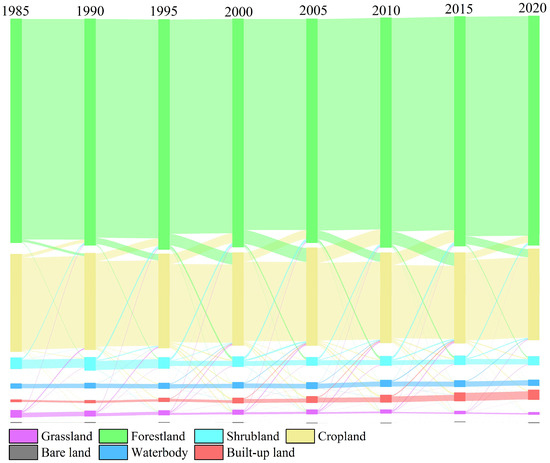
Figure 13.
Land use transfer in the PPRB between 1985 and 2020.
From 1990 to 1995, shrubland decreased most significantly and was mainly converted to forestland and cropland. The total area of built-up land has kept increasing, with a total increase of 12,184 km2, mainly due to the occupation of cropland, forestland, and waterbodies, especially in the Pearl River Delta region. Forestland showed a slightly increase, with multiple fluctuations due to coexisting deforestation and afforestation, with a net increase of 8743 km2. The total area of waterbodies initially increased, followed by a decrease, with a net increase of 1668 km2, and was mainly converted from cropland and forestland.
Before 2010, the total area of waterbodies maintained an increasing trend, due mainly to the rapid expansion of the aquaculture industry in the Pearl River Delta, occupying a large amount of cropland and forestland. The areas that increased in each period were 515 km2, 765 km2, 888 km2, 888 km2, 276 km2, and 552 km2, respectively. However, from 2010 to 2020, the waterbody area exhibited a decrease, primarily resulting from to its conversion back to cropland and forestland (the Pearl River Delta is mainly dedicated to built-up land). The change in bare land was relatively negligible, and its total area is relatively stable.
5. Discussion
5.1. Drivers of Land Use Change
The changes in land use were influenced by multiple factors, including population growth, economic development, urbanization, ecological conservation, land use policies, topography, and climate change. The impacts of these factors vary significantly, with considerable differences in magnitude [50,51]. Previous studies have shown that rapid socio-economic and industrial development, along with rising living standards, are the primary drivers of land use changes in the PPRB [38]. During the period 1985–2020, these changes were mainly driven by economic development and policy initiatives [38]. In this context, built-up land expanded intensively, leading to major land use changes in the PPRB. A notable phenomenon was the mutual conversion between cropland and built-up land, followed by changes between forestland, grassland, and shrubland. The encroachment of built-up land on cropland was particularly significant in the Pearl River Delta during the study period. After 1978, China began to implement reform and open up policy, the economy of the PPRB obtained new opportunities for development, and the government increased its endeavor in the construction of irrigation infrastructure, increasing the area of irrigated cropland. Previous studies [52] have concluded that anthropogenic factors such as population size, industrialization level, living standards, and technological advances can regulate changes in cropland. Among them, economic growth is regarded as the primary driving force behind reductions in cropland. reductions in cropland are observed to gradually weaken from developed regions to rural ones [53]. This study found that the decline in grassland primarily occurred in the northwestern PPRB, while the decrease in cropland was mainly observed in the central region as well as the coastal and Pearl River Delta areas, which is consistent with the findings of Ou et al. [54]. Land management policies are also crucial driving forces for land use changes in the PPRB [55]. After implementation of the Contract Responsibility System for forests in the 1980s, farmers, worrying about policy uncertainty, cut down almost all of the forests on their contracted land for economic profits, and the area of cropland increased dramatically [56]. In 2000, the country initiated the Grain for Green Program, focusing on converting cropland into forestland and grassland [57,58]. Overall, this initiative has achieved favorable ecological benefits; however, it has not halted the ongoing loss of forestland and grassland in the PPRB. Between 1985 and 2020, forestland and grassland decreased by a total of 3467 km2 across the entire PPRB, and this mainly occurred in the Xijiang River Basin, especially in the upper Xijiang River Basin, where a large amount of forestland and grassland was reclaimed for cropland. In the Pearl River Delta, the total area of fish ponds in the region showed a continuous expansion during 1986–2013 due to the economic profits brought by fish ponds [59], while the cropland and forestland also showed a decreasing trend due to urbanization.
In addition, land use change is influenced by other factors such as topography, particularly altitude, which affects land use changes in mountainous areas [60]. Chen et al. [61] demonstrated that human activity was most intense at altitudes between 0 and 500 m, with grassland mainly converting to forestland and built-up land between 500 and 1000 m. The greatest area of land use transition occurred between 1000 and 1500 m, and the transition of grassland was most significant at above 1500 m. The PPRB’s topography is characterized by mountains and hills, with elevation increasing from southeast to northwest (Figure 1). In this study, several typical areas of land use change were observed in the PPRB, including the northwestern PPRB, the coastal areas of southern Guangdong and western Guangxi provinces, the northern coastal regions of Hainan Island, and the Pearl River Delta. At the Yunnan–Guizhou Plateau, large amounts of shrubland and grassland were replaced. In low-altitude coastal areas, such as southern Guangdong, western Guangxi province, and the northern coastal regions of Hainan Island, significant cropland and forestland replacement of was observed.
5.2. The Impacts of Land Use Change
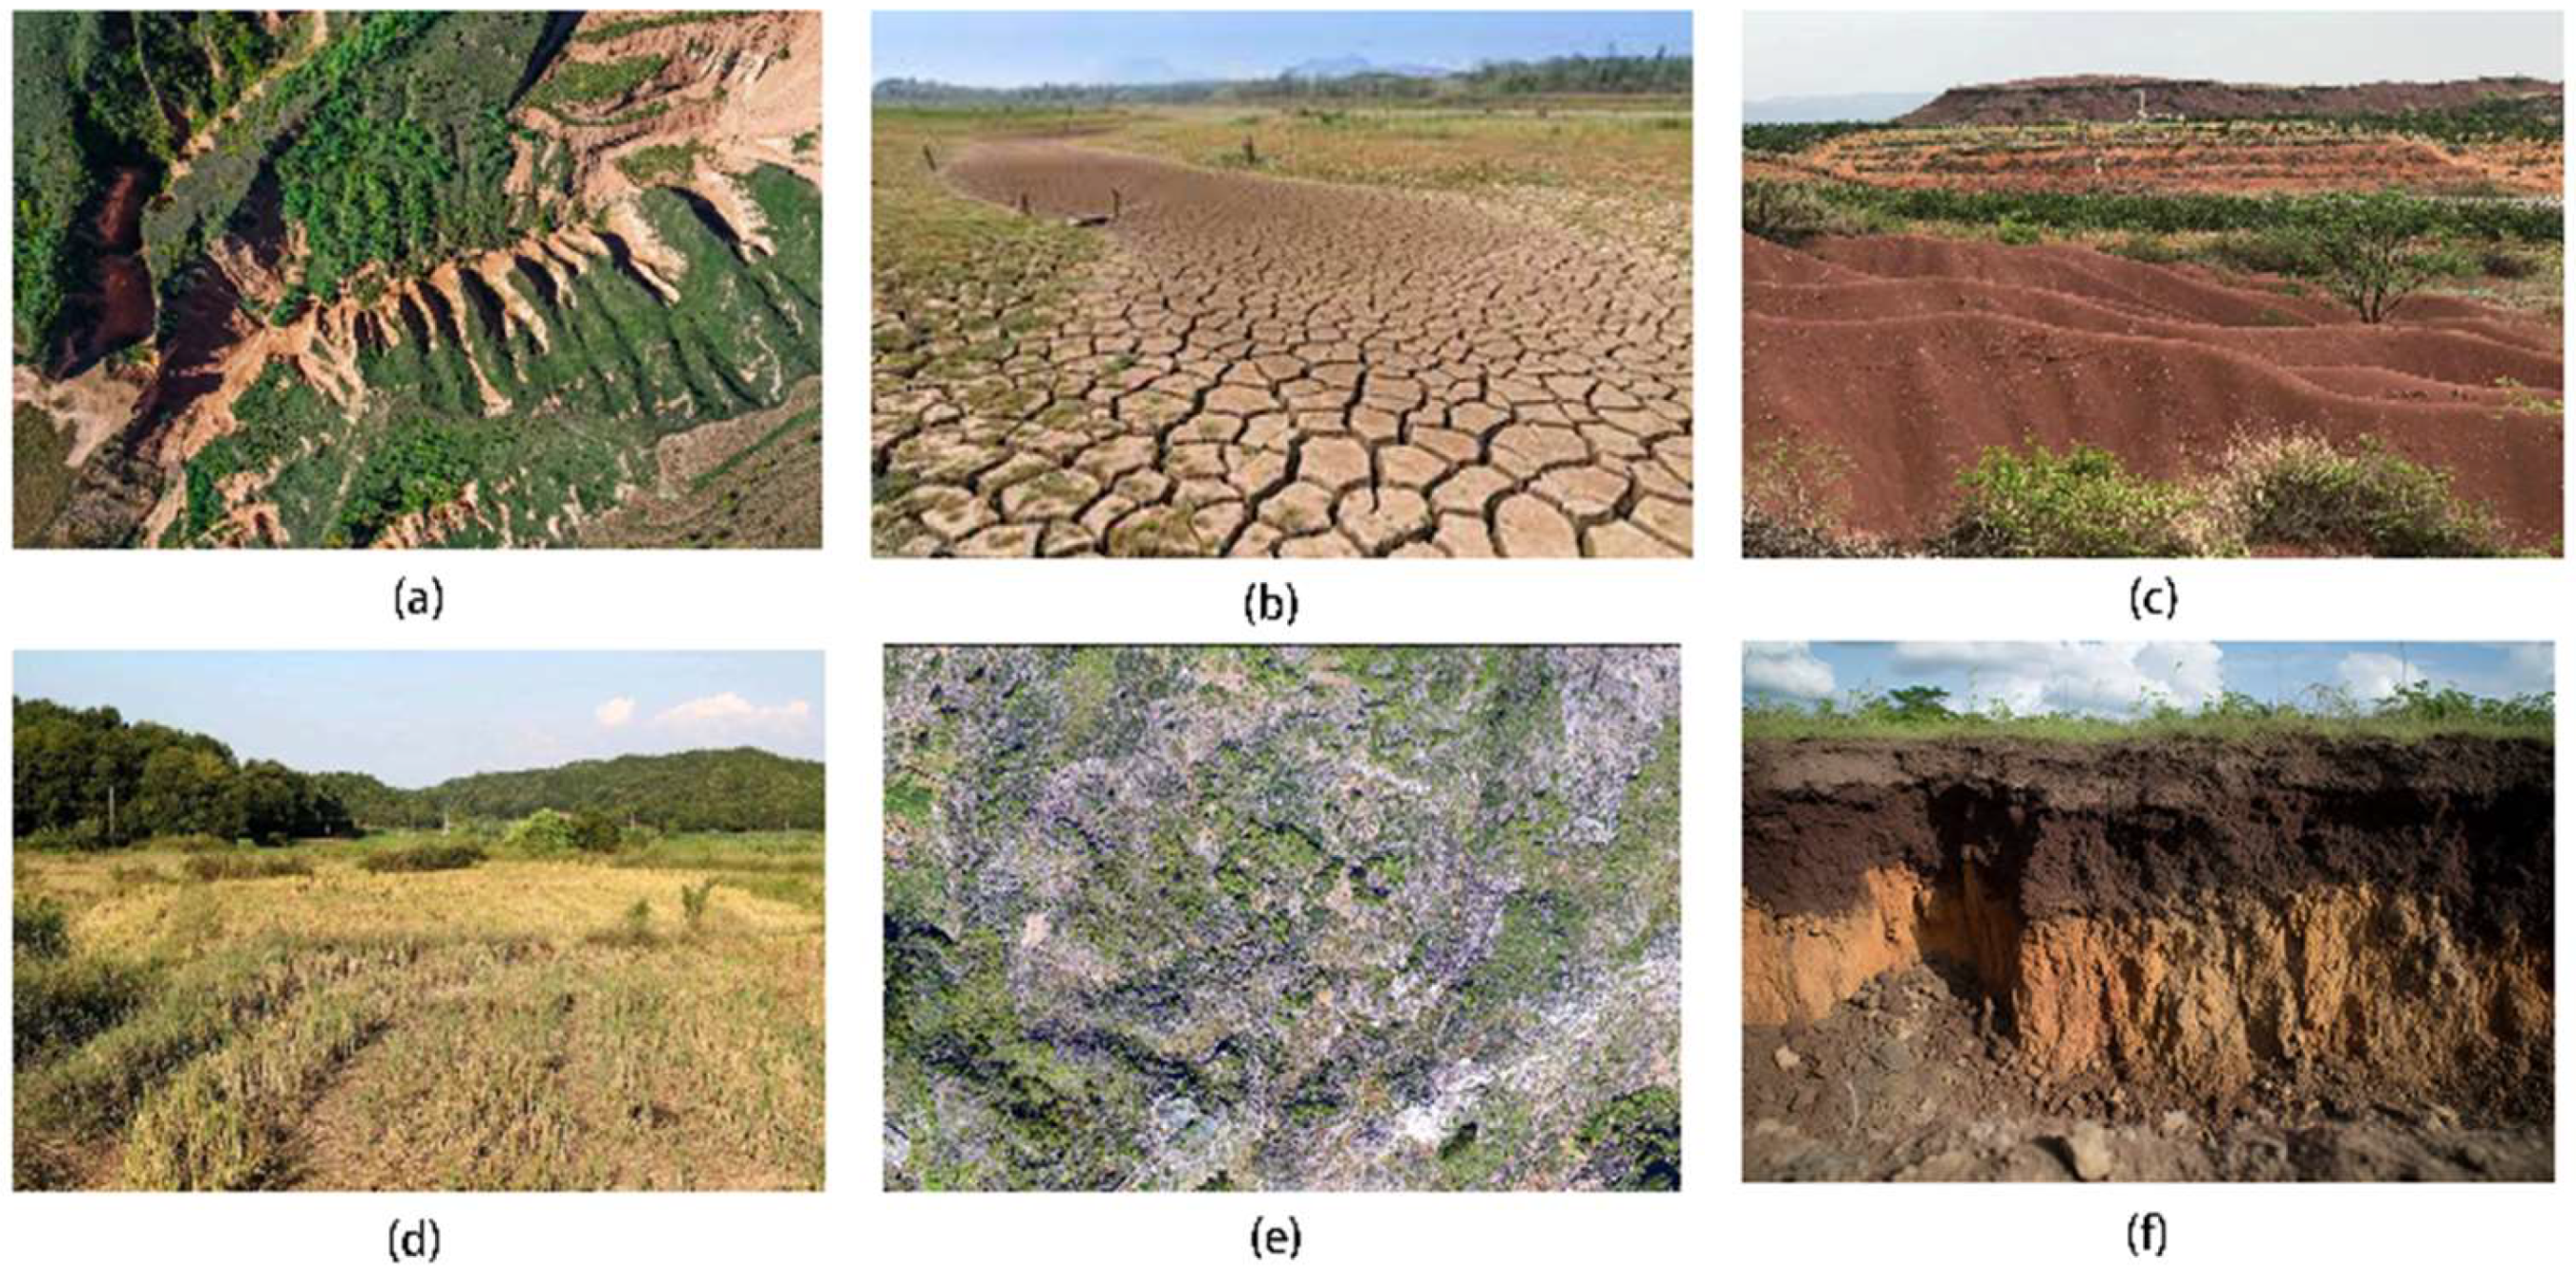
LUCC not only describes changes in the patterns of soil erosion and deposition, pollutant transport, groundwater discharge, and surface runoff [62], but is also associated with various ecological and environmental problems, such as land degradation, soil erosion, and natural hazards (Figure 14), which affect the ecological environment, water cycle, and the sustainable development of the PPRB. Studies have revealed that rational land use can improve soil quality, enhance water and nutrient retention, and increase soil resistance to external environmental changes. Conversely, irrational land use practices can disrupt soil structure, leading to nutrient loss and exacerbating soil erosion and degradation [63]. The transition of land use from cropland, grassland, and forestland to built-up land development directly impacts environmental sustainability. Improper land conversion can lead to land fragmentation and degraded ecosystem services [64]. However, some studies have also confirmed that converting cropland to forestland and grassland reduces the risk of soil erosion, which can improve ecosystem services in the long run [65]. Additionally, LUCC alters the local energy balance and physical exchange by altering surface radiation and, therefore, reshaping evapotranspiration, which directly affects the water cycle through hydrological systems [66]. Studies have concluded that the replacement of vegetation by bare land can influence atmospheric circulation and cloud generation [67]. Changes in hydrological factors can further lead to variations in floods, droughts, and groundwater, consequently affecting water flow into the sea.
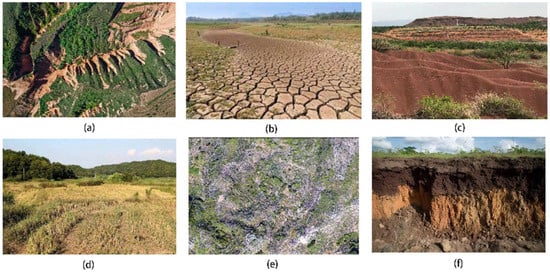
Figure 14.
Ecological issues caused by land use change, (a) soil erosion; (b) droughts; (c) soil degradation; (d) cropland abandonment; (e) rocky desertification; (f) destruction of soil structure.
This study shows that the rapid expansion of built-up land in the PPRB from 1985 to 2020, especially the rapid development of urbanization in the Pearl River Delta and the eastern coastal areas, during which the most occupied land use was cropland at varying rates, corresponds to the dramatic expansion of built-up land at different rates. Changes in cropland and built-up land show a remarkable negative correlation [68]. The persistent decrease in cropland may also pose an effect on national food security. Some studies have revealed that the land use changes induced by rapid urbanization led to a decline in both the overall quantity and quality of cropland, particularly in rural areas where numerous croplands were abandoned. This reduction can weaken the food supply, exerting pressure on food security [69]. At the same time, there are more serious rocky desertification and soil erosion in the upper PPRB, which directly affect water conservancy and hydropower facilities as well as water ecological safety in the basin, ultimately impacting the sustainable development of the PPRB [70]. Furthermore, variations in land cover also influence the magnitude of runoff and sediment transport [71], subsequently impacting sediment transport in rivers. Existing studies indicate that areas with moderate-to-severe soil erosion in the PPRB are the regions with a slope greater than 15°, predominantly occurring in croplands and poorly vegetated forestland and grassland. These areas are primarily distributed in the Xijiang River Basin, followed by the Hanjiang and Beijiang River Basins [39]. In 2008, the National Development and Reform Commission put forward a flood control plan in the PPRB, planning to focus on implementing key soil and water conservations in the upper reaches of the PPRB over the next 20 years. According to the results based on a remote sensing investigation in 1990 [39], the sediment delivery ratio in the PPRB is 0.39. After effective management, the land cover of the area was improved to a better status, with an increase in forestland and consequent decrease in soil erosion in the PPRB.
5.3. Uncertainty Analysis
In this study, the CLCD and the ESRI Land Cover 2020 datasets were used to analyze the LUCC in the PPRB from 1985 to 2020. However, due to the differences in the remote sensing images, satellite sensors, and processing methods for the production of the two datasets, the land use classification results have some inherent uncertainties. Therefore, in order to obtain a final dataset for LUCC analysis in the PPRB, we used the ESRI Land Cover 2020 with higher spatial resolution as the baseline data and combined it with Google Earth historical images to make auxiliary corrections to the CLCD. Improvements to the CLCD after updating are shown in the table below (Table 4). In this amendment to the CLCD, grassland and shrubland accounted for the largest proportion. Among the major land uses in the PPRB, cropland and forestland accounted for the largest proportion, but in the upper reaches of the Xijiang River, most of the forestland in this region was degraded to shrubland and grassland due to cultivation and indiscriminate deforestation in the 1980s. However, these land classes were categorized as cropland in the CLCD, which was updated in this study. After comparative updating, the accuracy of the Re-CLCD was significantly improved.

Table 4.
Statistics of updated land use in the CLCD.
6. Conclusions
In this study, CLCD and ESRI Land Cover 2020 data combined with Google Earth historical images were used to generate an improved land use dataset of the PPRB from 1985 to 2020. LUCC was analyzed based on the new dataset, and the following conclusions were obtained:
- (1)
- Out of the seven land use types, the most noticeable changes in total area were observed in built-up land, cropland, forestland, grassland, shrubland, waterbody, and bare land. Notably, built-up land and forestland saw substantial increases in area, while cropland, grassland, and shrubland experienced significant decreases. Waterbodies showed a slight increase in area.
- (2)
- At the sub-basin level, the dominant land uses with the most significant changes varied significantly. The magnitude of land use changes from high to low are the Pearl River Delta, the coastal river basins in southern Guangdong and western Guangxi, the Dongjiang River Basin, the Hanjiang River Basin, the Xijiang River Basin, the Beijiang River Basin, and Hainan Island, respectively.
- (3)
- The expansion of built-up land is notably significant, with a cumulative increase of 12,184 km2, primarily attributed to encroachments on cropland, forestland, and waterbodies. The most substantial reduction occurred in cropland, with a total decrease of 10,435 km2, largely resulting from conversions to forestland and built-up land. A conversion from cropland to built-up land was also particularly prevalent, especially in the Pearl River Delta. Forestland increased slightly, with multiple fluctuations due to the coexistence of deforestation and afforestation, with a net increase of 8743 km2. Notably, grassland in the Xijiang River Basin experienced a significant decrease, primarily converting into forestland, cropland, and built-up land.
Through an in-depth examination of land use changes in the PPRB and its sub-basins, this study has unveiled the trajectories of significant changes in built-up land, cropland, forestland, and other key land uses. These insights not only provide vital guidance for land use governance and sustainable development in the PPRB but also furnish essential backing for scientifically informed land planning and management initiatives.
Author Contributions
Conceptualization, D.W. and X.Y.; data process, W.F.; writing—original draft preparation, W.F.; writing—review and editing, S.C., H.O., T.Z. and X.Y.; supervision, X.Y. All authors have read and agreed to the published version of the manuscript.
Funding
The National Key R&D Program of China (Grant No.: 2021YFE0117300) and Major Project of High-Resolution Earth Observation System (Grant No.: 30-Y60B01-9003-22/23).
Data Availability Statement
The processed data cannot be shared at this time as the data also form part of an ongoing study.
Acknowledgments
We are grateful to the scholars for their contributions to the production of land use data, and to the anonymous reviewers and editors for their valuable comments to improve the quality of the paper.
Conflicts of Interest
The authors declare no conflicts of interest.
References
- Van Asselen, S.; Verburg, P.H. Land cover change or land-use intensification: Simulating land system change with a global-scale land change model. Glob. Chang. Biol. 2013, 19, 3648–3667. [Google Scholar] [CrossRef]
- GLP. Science Plan and Implementation Strategy; IGBP Report No. 53/IHDP Report No. 19; IGBP Secretariat: Stockholm, Sweden, 2005; p. 64. Available online: https://www.research-collection.ethz.ch/handle/20.500.11850/48916 (accessed on 28 October 2022).
- Luyssaert, S.; Jammet, M.; Stoy, P.C.; Estel, S.; Pongratz, J.; Ceschia, E.; Churkina, G.; Don, A.; Erb, K.; Ferlicoq, M.; et al. Land management and land-cover change have impacts of similar magnitude on surface temperature. Nat. Clim. Chang. 2014, 4, 389–393. [Google Scholar] [CrossRef]
- Keys, E.; McConnell, W.J. Global change and the intensification of agriculture in the tropics. Glob. Environ. Chang. 2005, 15, 320–337. [Google Scholar] [CrossRef]
- Dutta, I.; Das, A. Application of geo-spatial indices for detection of growth dynamics and forms of expansion in English Bazar Urban Agglomeration, West Bengal. J. Urban Manag. 2019, 8, 288–302. [Google Scholar] [CrossRef]
- Ning, J.; Liu, J.; Kuang, W.; Xu, X.; Zhang, S.; Yan, C.; Li, R.; Wu, S.; Hu, Y.; Du, G.; et al. spatio-temporal patterns and characteristics of land-use change in China during 2010–2015. J. Geogr. Sci. 2018, 73, 789–802. (In Chinese) [Google Scholar] [CrossRef]
- Liu, J.; Kuang, W.; Zhang, Z.; Xu, X.; Qin, Y.; Ning, J.; Zhou, W.; Zhang, S.; Li, R.; Yan, C. Spatiotemporal characteristics, patterns, and causes of land-use changes in china since the late 1980s. J. Geogr. Sci. 2014, 69, 3–14. [Google Scholar] [CrossRef]
- Guo, X.; Chen, L.; Fu, B. Effects of land use/land cover changes on regional ecological environment. Chin. J. Environ. Eng. 1999, 7, 66–75. Available online: https://kns.cnki.net/kcms2/article/abstract?v=fsvnL9wA1q1k3Z5li8RQincoEYCjaO-qNf1Ga6xQtzQgyktg3aQIl4JesuEjjXK4SHSjjdoqjhAFdZQkMrJ9AgHPBvUWDT5w1DGJ7wmjsGcy3kiYt45dqHYLfcJcyjaTWs-TA0Hxh6I=&uniplatform=NZKPT&language=CHS (accessed on 18 January 2023). (In Chinese).
- Zhao, J.; Yang, Z.; Govers, G. Soil and water conservation measures reduce soil and water losses in China but not down to background levels: Evidence from erosion plot data. Geoderma 2019, 337, 729–741. [Google Scholar] [CrossRef]
- Lin, G.C.S.; Ho, S.P.S. China’s land resources and land-use change: Insights from the 1996 land survey. Land Use Policy 2003, 20, 87–107. [Google Scholar] [CrossRef]
- Ojima, D. Terrestrial human-environment systems: The future of land research in IGBP II. IGBP NewsLetter 2002, 50, 31–34. [Google Scholar]
- Turner, B.L.; Skole, D.; Sanderson, S.; Fischer, G.; Fresco, L.; Leemans, R. Land-Use and Land-Cover Change: Science/Research Plan; IGBP: Stockholm, Sweden; Geneva, Switzerland, 1995; Available online: https://asu.elsevierpure.com/en/publications/land-use-and-land-cover-change-scienceresearch-plan-2 (accessed on 22 January 2023).
- Gutman, G.; Janetos, A.C.; Justice, C.O.; Moran, E.F.; Mustard, J.F.; Rindfuss, R.R.; Skole, D.; Turner, B.L., II; Cochrane, M.A. Land Change Science: Observing, Monitoring and Understanding Trajectories of Change on the Earth’s Surface; Springer Science & Business Media: Berlin/Heidelberg, Germany, 2004; Volume 6, Available online: https://link.springer.com/book/10.1007/978-1-4020-2562-4 (accessed on 12 March 2023).
- Lambin, E.F.; Meyfroidt, P. Global land use change, economic globalization, and the looming land scarcity. Proc. Natl. Acad. Sci. USA 2011, 108, 3465–3472. [Google Scholar] [CrossRef]
- McMahon, G. Geography for a Changing World: A Science Strategy for the Geographic Research of the US Geological Survey, 2005–2015; US Department of the Interior, US Geological Survey: Reston, VA, USA, 2005; Volume 1281. Available online: https://play.google.com/store/books/details?id=j6yjGwCrGE4C&rdid=book-j6yjGwCrGE4C&rdot=1 (accessed on 21 June 2023).
- Song, X.-P.; Hansen, M.C.; Stehman, S.V.; Potapov, P.V.; Tyukavina, A.; Vermote, E.F.; Townshend, J.R. Global land change from 1982 to 2016. Nature 2018, 560, 639–643. [Google Scholar] [CrossRef]
- Turner, B.L.; Lambin, E.F.; Reenberg, A. The emergence of land change science for global environmental change and sustainability. Proc. Natl. Acad. Sci. USA 2007, 104, 20666–20671. [Google Scholar] [CrossRef] [PubMed]
- Turner, B.L.; Robbins, P. Land-change science and political ecology: Similarities, differences, and implications for sustainability science. Annu. Rev. Environ. Resour. 2008, 33, 295–316. [Google Scholar] [CrossRef]
- Deng, J.S.; Wang, K.; Hong, Y.; Qi, J.G. Spatio-temporal dynamics and evolution of land use change and landscape pattern in response to rapid urbanization. Landsc. Urban Plan. 2009, 92, 187–198. [Google Scholar] [CrossRef]
- Seto, K.C.; Fragkias, M. Quantifying spatiotemporal patterns of urban land-use change in four cities of China with time series landscape metrics. Landsc. Ecol. 2005, 20, 871–888. [Google Scholar] [CrossRef]
- Liu, J.; Zhang, Z.; Xu, X.; Kuang, W.; Zhou, W.; Zhang, S.; Li, R.; Yan, C.; Yu, D.; Wu, S.; et al. Spatial patterns and driving forces of land use change in China during the early 21st century. J. Geogr. Sci. 2010, 20, 483–494. [Google Scholar] [CrossRef]
- Zhou, Y.; Li, X.; Liu, Y. Land use change and driving factors in rural China during the period 1995–2015. Land Use Policy 2020, 99, 105048. [Google Scholar] [CrossRef]
- He, C.; Shi, P.; Chen, J.; Li, X.; Pan, Y.; Li, J.; Li, Y.; Li, J. Developing land use scenario dynamics model by the integration of system dynamics model and cellular automata model. Sci. China Ser. D Earth Sci. 2005, 48, 1979–1989. [Google Scholar] [CrossRef]
- Zhi, J.; Han, C.; Wang, X.; Zhang, L.; Chu, C. Future construction land expansion under multiple simulation development scenarios and its impacts on landscape pattern evolution in China. Geogr. Res. 2024, 43, 843–860. Available online: https://kns.cnki.net/kcms2/article/abstract?v=fsvnL9wA1q3nSkmos8k4dH0BHRYevav9c6vV-ZQvawU91ot4pfJj59ZgRy0TxYYcbP46iHEaOlxFypUfR_nGfl0O8nZB36jutEDA15P1YarkVSPCtuLyoXBhHc8U8lE-0g7BIMwsnIg=&uniplatform=NZKPT&language=CHS (accessed on 27 March 2024). (In Chinese).
- Shen, Q.; Chen, Q.; Tang, B.-S.; Yeung, S.; Hu, Y.; Cheung, G. A system dynamics model for the sustainable land use planning and development. Habitat Int. 2009, 33, 15–25. [Google Scholar] [CrossRef]
- Myint, S.W.; Gober, P.; Brazel, A.; Grossman-Clarke, S.; Weng, Q. Per-pixel vs. object-based classification of urban land cover extraction using high spatial resolution imagery. Remote Sens. Environ. 2011, 115, 1145–1161. [Google Scholar] [CrossRef]
- Senf, C.; Leitão, P.J.; Pflugmacher, D.; van der Linden, S.; Hostert, P. Mapping land cover in complex Mediterranean landscapes using Landsat: Improved classification accuracies from integrating multi-seasonal and synthetic imagery. Remote Sens. Environ. 2015, 156, 527–536. [Google Scholar] [CrossRef]
- Chen, J.; Cao, X.; Peng, S.; Ren, H. Analysis and applications of GlobeLand30: A review. ISPRS Int. J. Geo-Inf. 2017, 6, 230. [Google Scholar] [CrossRef]
- Zanaga, D.; Van De Kerchove, R.; Daems, D.; De Keersmaecker, W.; Brockmann, C.; Kirches, G.; Wevers, J.; Cartus, O.; Santoro, M.; Fritz, S. ESA WorldCover 10 m 2021 v200. 2022. Available online: https://zenodo.org/records/7254221 (accessed on 15 December 2022).
- Venter, Z.S.; Barton, D.N.; Chakraborty, T.; Simensen, T.; Singh, G. Global 10 m Land Use Land Cover Datasets: A Comparison of Dynamic World, World Cover and Esri Land Cover. Remote Sens. 2022, 14, 4101. [Google Scholar] [CrossRef]
- Giri, C.; Pengra, B.; Long, J.; Loveland, T.R. Next generation of global land cover characterization, mapping, and monitoring. Int. J. Appl. Earth Obs. Geoinf. 2013, 25, 30–37. [Google Scholar] [CrossRef]
- Venetoulis, J.; Talberth, J. Refining the ecological footprint. Environ. Dev. Sustain. 2008, 10, 441–469. Available online: https://www.taylorfrancis.com/chapters/edit/10.1201/9781439820636-9/refining-ecological-footprint-jason-venetoulis-john-talberth (accessed on 21 December 2022). [CrossRef]
- He, Y.; Wang, S.; Yuan, Z.; Zheng, M.; Huang, B.; Liang, C. Land Use Change and Its Response to Urbanization in the Pearl River Delta. Ecol. Environ. Sci. 2020, 29, 303. (In Chinese) [Google Scholar] [CrossRef]
- Liu, H.; Jiang, H.; Hu, B. Eco-environmental Effects of Land Use Change in the Xijiang River Basin of Guangxi. J. Nanning Norm. Univ. (Nat. Sci. Ed.) 2020, 37, 104–111. (In Chinese) [Google Scholar] [CrossRef]
- Li, J.; Luo, X.; Zhu, S.; Zhang, W.; Xu, Z.; Huo, Z.; Tian, Z.; Huo, G. Effect of LUCC on hydrological response in Beijiang basin. Yangtze River 2020, 51, 89–94+129. (In Chinese) [Google Scholar] [CrossRef]
- Guang, Y.; Jiao, Y.; Zang, C. Land Use Chane in Hanjiang River Basin: Spatio-temporal Characteristics and Its Ecological Security. Chin. Agric. Sci. Bull. 2023, 1–9. Available online: https://kns.cnki.net/kcms/detail/11.1984.S.20230321.1120.004.html (accessed on 27 December 2023). (In Chinese).
- Luan, Y.; Huang, G.; Zheng, G. The Influence of Land Use Change on Ecological Environmental Quality in Hainan Island. J. Hunan Univ. Sci. Technol. Nat. Sci. Ed. 2023, 38, 101–108. (In Chinese) [Google Scholar] [CrossRef]
- Zhang, S.-X.; Zhang, J.-M.; Zhang, W.-K.; Zhang, D.-N.; Fu, J.-Y.; Zang, C.-F. Spatiotemporal variability characteristics and driving forces of land use in the Pan-Pearl River Basin, China. Chin. J. Appl. Ecol. 2020, 31, 573–580. (In Chinese) [Google Scholar] [CrossRef]
- Mu, X.; Qiu, J.; Cao, B.; Cai, S.; Niu, K.; Yang, X. Mapping Soil Erosion Dynamics (1990–2020) in the Pearl River Basin. Remote Sens. 2022, 14, 5949. [Google Scholar] [CrossRef]
- Yang, J.; Huang, X. 30 m annual land cover and its dynamics in China from 1990 to 2019. Earth Syst. Sci. Data Discuss. 2021, 13, 3907–3925. [Google Scholar] [CrossRef]
- Karra, K.; Kontgis, C.; Statman-Weil, Z.; Mazzariello, J.C.; Mathis, M.; Brumby, S.P. Global land use/land cover with Sentinel 2 and deep learning. In Proceedings of the 2021 IEEE International Geoscience and Remote Sensing Symposium IGARSS, Brussels, Belgium, 11–16 July 2021; pp. 4704–4707. [Google Scholar]
- Talukdar, S.; Singha, P.; Mahato, S.; Pal, S.; Liou, Y.-A.; Rahman, A. Land-use land-cover classification by machine learning classifiers for satellite observations—A review. Remote Sens. 2020, 12, 1135. [Google Scholar] [CrossRef]
- Deng, J.; Wang, K.; Deng, Y.; Qi, G. PCA-based land-use change detection and analysis using multitemporal and multisensor satellite data. Int. J. Remote Sens. 2008, 29, 4823–4838. [Google Scholar] [CrossRef]
- Gong, P.; Wang, J.; Yu, L.; Zhao, Y.; Zhao, Y.; Liang, L.; Niu, Z.; Huang, X.; Fu, H.; Liu, S. Finer resolution observation and monitoring of global land cover: First mapping results with Landsat TM and ETM+ data. Int. J. Remote Sens. 2013, 34, 2607–2654. [Google Scholar] [CrossRef]
- Kang, Y.; Ma, Y.; Yao, W.; Long, A.; Ren, Y.; Zeng, Y. Analysis of influence factors and straregies of long-time series remote sensing image classification using transfer learning. J. For. Eng. 2022, 7, 160–168. (In Chinese) [Google Scholar] [CrossRef]
- Wang, S.; Liu, J.; Zhang, Z.; Zhou, Q.; Zhao, X. Analysis on Spatial-Temporal Features of Land Use in China. J. Geogr. Sci. 2001, 56, 631–639. Available online: https://kns.cnki.net/kcms2/article/abstract?v=7P8mTOHD94Hpc4S30oGjhkg4bTvu-NDz8p-c8DlFb2WPjx58F3we5WipshFk33R7Gm8y1nfUez0I48XastKd976t4nFhftQmE2XOayK1lvTwZbtZqdLPA7LjUJ5id2ivfMk6M8_RafU=&uniplatform=NZKPT&language=CHS (accessed on 10 July 2023). (In Chinese).
- Liu, S.; He, S. A spatial analysis model for measuring the rate of land use change. J. Nat. Resour. 2002, 17, 533–540. (In Chinese) [Google Scholar] [CrossRef]
- Qiao, W.; Sehng, Y.; Fang, B.; Wang, Y. Land use information mining in highly urbanized area based on transfer matrix: A case study of Suzhou, Jiangsu Province. Geogr. Res. 2013, 32, 1497–1507. Available online: https://kns.cnki.net/kcms2/article/abstract?v=7P8mTOHD94HI5rdW4CvzczkklwsL7yfT4DnRlG0oiJbmhO6ctbxlHVPP6ITXXammaiS8t5IeXckhN14ScSFfYbZJ7lESSYVHulMy5IHJ2_Yy819-GzYdJr8Ot3n9gpgFFa20GS1TRro=&uniplatform=NZKPT&language=CHS (accessed on 16 July 2023). (In Chinese).
- Hu, M.; Xia, B. Land-Use Variations in Regions with Rapid Economic Development-A Case Study in the Pearl River Delta. J. Environ. Inform. Lett. 2020, 3, 49–58. [Google Scholar] [CrossRef]
- Shao, J.; Li, Y.; Wei, C.; Xie, D. The Drivers of Land Use Change at Regional Scale: Assessment and Prospects. Adv. Earth Sci. 2007, 22, 798–809. (In Chinese) [Google Scholar] [CrossRef]
- Yang, M.; Zhang, G.; Hou, Y. Advances and Prospects of the Driving Force of Regional Land Use Change Researches. Geogr. Geo-Inf. Sci. 2011, 27, 95–100. Available online: https://kns.cnki.net/kcms2/article/abstract?v=7P8mTOHD94GNW-D6sXOxj8fYRSFJl5CR40TLmtVMjhVa8nTr4jJh0WTd4KNyJD3bHiTmR07QCFvLzjzhrpOvgtHladwJm1l7w2Lvbq4kvSosiLo8_tddBglsscwfRSctFEYqs4GOlrs=&uniplatform=NZKPT&language=CHS (accessed on 25 August 2023). (In Chinese).
- Wang, X.; Li, X. China’s agricultural land use change and its underlying drivers: A literature review. J. Geogr. Sci. 2021, 31, 1222–1242. [Google Scholar] [CrossRef]
- Huang, N. Spatial Distribution of Cultivated Land Loss with Its Correlation to Economic and Population Growth in Guangdong Province. Trop. Geogr. 1999, 19, 29–34. Available online: https://kns.cnki.net/kcms2/article/abstract?v=7P8mTOHD94FSn3yCXpSz7acusHVbU1c95AAp5Ni2KFny5LjpKVeVVp-MRxFQZNwW-x5S6Z9iJ6n3ZKkCQ44wsPbi9v0gMRlQEchEzeG5MD558offy8u2wQVEGos5XA1hKWZh0y7WkVU=&uniplatform=NZKPT&language=CHS (accessed on 11 January 2024). (In Chinese).
- Ou, H.; Cai, S.; Fan, W.; Qiu, J.; Mu, X.; Zhou, T.; Yang, X.; Picco, L. Sustaining the Pearl River: A Critical Review of Changes in Fluvial Geomorphological Processes and the Driving Forces in the Pearl River Basin. Water 2024, 16, 1001. [Google Scholar] [CrossRef]
- Bryan, B.A.; Gao, L.; Ye, Y.; Sun, X.; Connor, J.D.; Crossman, N.D.; Stafford-Smith, M.; Wu, J.; He, C.; Yu, D. China’s response to a national land-system sustainability emergency. Nature 2018, 559, 193–204. [Google Scholar] [CrossRef]
- Qianling, W. A discussion on ecological problems in Guangxi. Acad. Forum 2001, 2, 80–83. (In Chinese) [Google Scholar] [CrossRef]
- Komarek, A.M.; Shi, X.; Heerink, N. Household-level effects of China’s Sloping Land Conversion Program under price and policy shifts. Land Use Policy 2014, 40, 36–44. [Google Scholar] [CrossRef]
- Long, H. Land Use Policy in China: Introduction; Elsevier: Amsterdam, The Netherlands, 2014; Volume 40, pp. 1–5. [Google Scholar]
- Zhang, W.; Cheng, Z.; Qiu, J.; Park, E.; Ran, L.; Xie, X.; Yang, X. Spatiotemporal changes in mulberry-dyke-fish ponds in the Guangdong-Hong Kong-Macao Greater Bay Area over the past 40 years. Water 2021, 13, 2953. [Google Scholar] [CrossRef]
- Ha, K.; Ding, Q.; Men, M.; Xu, H. Spatial distribution of land use and its relationship with terrain factors in hilly area. Geogr. Res. 2015, 34, 909–921. [Google Scholar] [CrossRef]
- Chen, T.-T.; Peng, L.; Liu, S.-Q.; Wang, Q. Land cover change in different altitudes of Guizhou-Guangxi karst mountain area, China: Patterns and drivers. J. Mt. Sci. 2017, 14, 1873–1888. [Google Scholar] [CrossRef]
- Huang, T.C.C.; Lo, K.F.A. Effects of land use change on sediment and water yields in Yang Ming Shan National Park, Taiwan. Environments 2015, 2, 32–42. [Google Scholar] [CrossRef]
- Nasiyev, B.; Vassilina, T.; Zhylkybay, A.; Shibaikin, V.; Salykova, A. Physicochemical and biological indicators of soils in an organic farming system. Sci. World J. 2021, 2021, 9970957. [Google Scholar] [CrossRef]
- Larson, K.L.; Nelson, K.C.; Samples, S.R.; Hall, S.J.; Bettez, N.; Cavender-Bares, J.; Groffman, P.M.; Grove, M.; Heffernan, J.B.; Hobbie, S.E. Ecosystem services in managing residential landscapes: Priorities, value dimensions, and cross-regional patterns. Urban Ecosyst. 2016, 19, 95–113. [Google Scholar] [CrossRef]
- Tarimo, B.; Mtalo, E.; Liwa, E. Land use change detection and impact assessment on an agricultural area. J. Sustain. Dev. 2013, 6, 55. [Google Scholar] [CrossRef][Green Version]
- Ping, Y.; Bojie, F. Land Use Change and Land-Ocean Interaction. Adv. Earth Sci. 2000, 15, 723. [Google Scholar] [CrossRef]
- Rimmelin, P.; Dumon, J.C.; Maneux, E.; Gonçalves, A. Study of annual and seasonal dissolved inorganic nitrogen inputs into the Arcachon Lagoon, Atlantic Coast (France). Estuar. Coast. Shelf Sci. 1998, 47, 649–659. [Google Scholar] [CrossRef]
- Huang, Y.; Nan, Z.; Xu, Q.; Zhao, K. Characteritics and driving forces of the arable land loss in Dongguan. World Reg. Stud. 2017, 26, 44–55. Available online: https://kns.cnki.net/kcms2/article/abstract?v=7P8mTOHD94HtAknBjSDHUfonMo6WMD4SiEmrJfGUog1wdv436Vc3AszedQkYzK6QCYdzNRI8YQQYoDydlSqBVUvTv-CaWsOiBZCjCqpWMljJXkprxbQfiPwXNAg-rNwh9LOxuBYrJ5nE_t400cBb6A==&uniplatform=NZKPT&language=CHS (accessed on 18 October 2023). (In Chinese).
- Jaradat, A.A.; Boody, G. Modeling agroecosystem services under simulated climate and land-use changes. Int. Sch. Res. Not. 2011, 2011, 568723. [Google Scholar] [CrossRef]
- Wu, X.; Huang, J.; Ning, X.; Song, J.; Wu, Z.; Dan, X.; Wang, H.; Lu, L. Dynamic Change of Land Rocky Desertification and River Sediment Content in Pearl River Basin. Bull. Soil Water Conserv. 2021, 41, 22–30. (In Chinese) [Google Scholar] [CrossRef]
- Qiu, Y.; Fu, B.; Wang, Y. Spatiotemporal Variation in Soil Erosion and Its Relation to Environmental Factors. J. Soil Water Conserv. 2002, 1, 108–111. (In Chinese) [Google Scholar] [CrossRef]
Disclaimer/Publisher’s Note: The statements, opinions and data contained in all publications are solely those of the individual author(s) and contributor(s) and not of MDPI and/or the editor(s). MDPI and/or the editor(s) disclaim responsibility for any injury to people or property resulting from any ideas, methods, instructions or products referred to in the content. |
© 2024 by the authors. Licensee MDPI, Basel, Switzerland. This article is an open access article distributed under the terms and conditions of the Creative Commons Attribution (CC BY) license (https://creativecommons.org/licenses/by/4.0/).

