


Analyzing and Simulating the Influence of a Water Conveyance Project on Land Use Conditions in the Tarim River Region


Abstract
:1. Introduction
2. Materials and Methods
2.1. Study Area and Spatial Data
2.2. Land Use and Land Cover Change Monitoring
2.3. Land Use and Land Cover Change Modeling
3. Implementation and Results
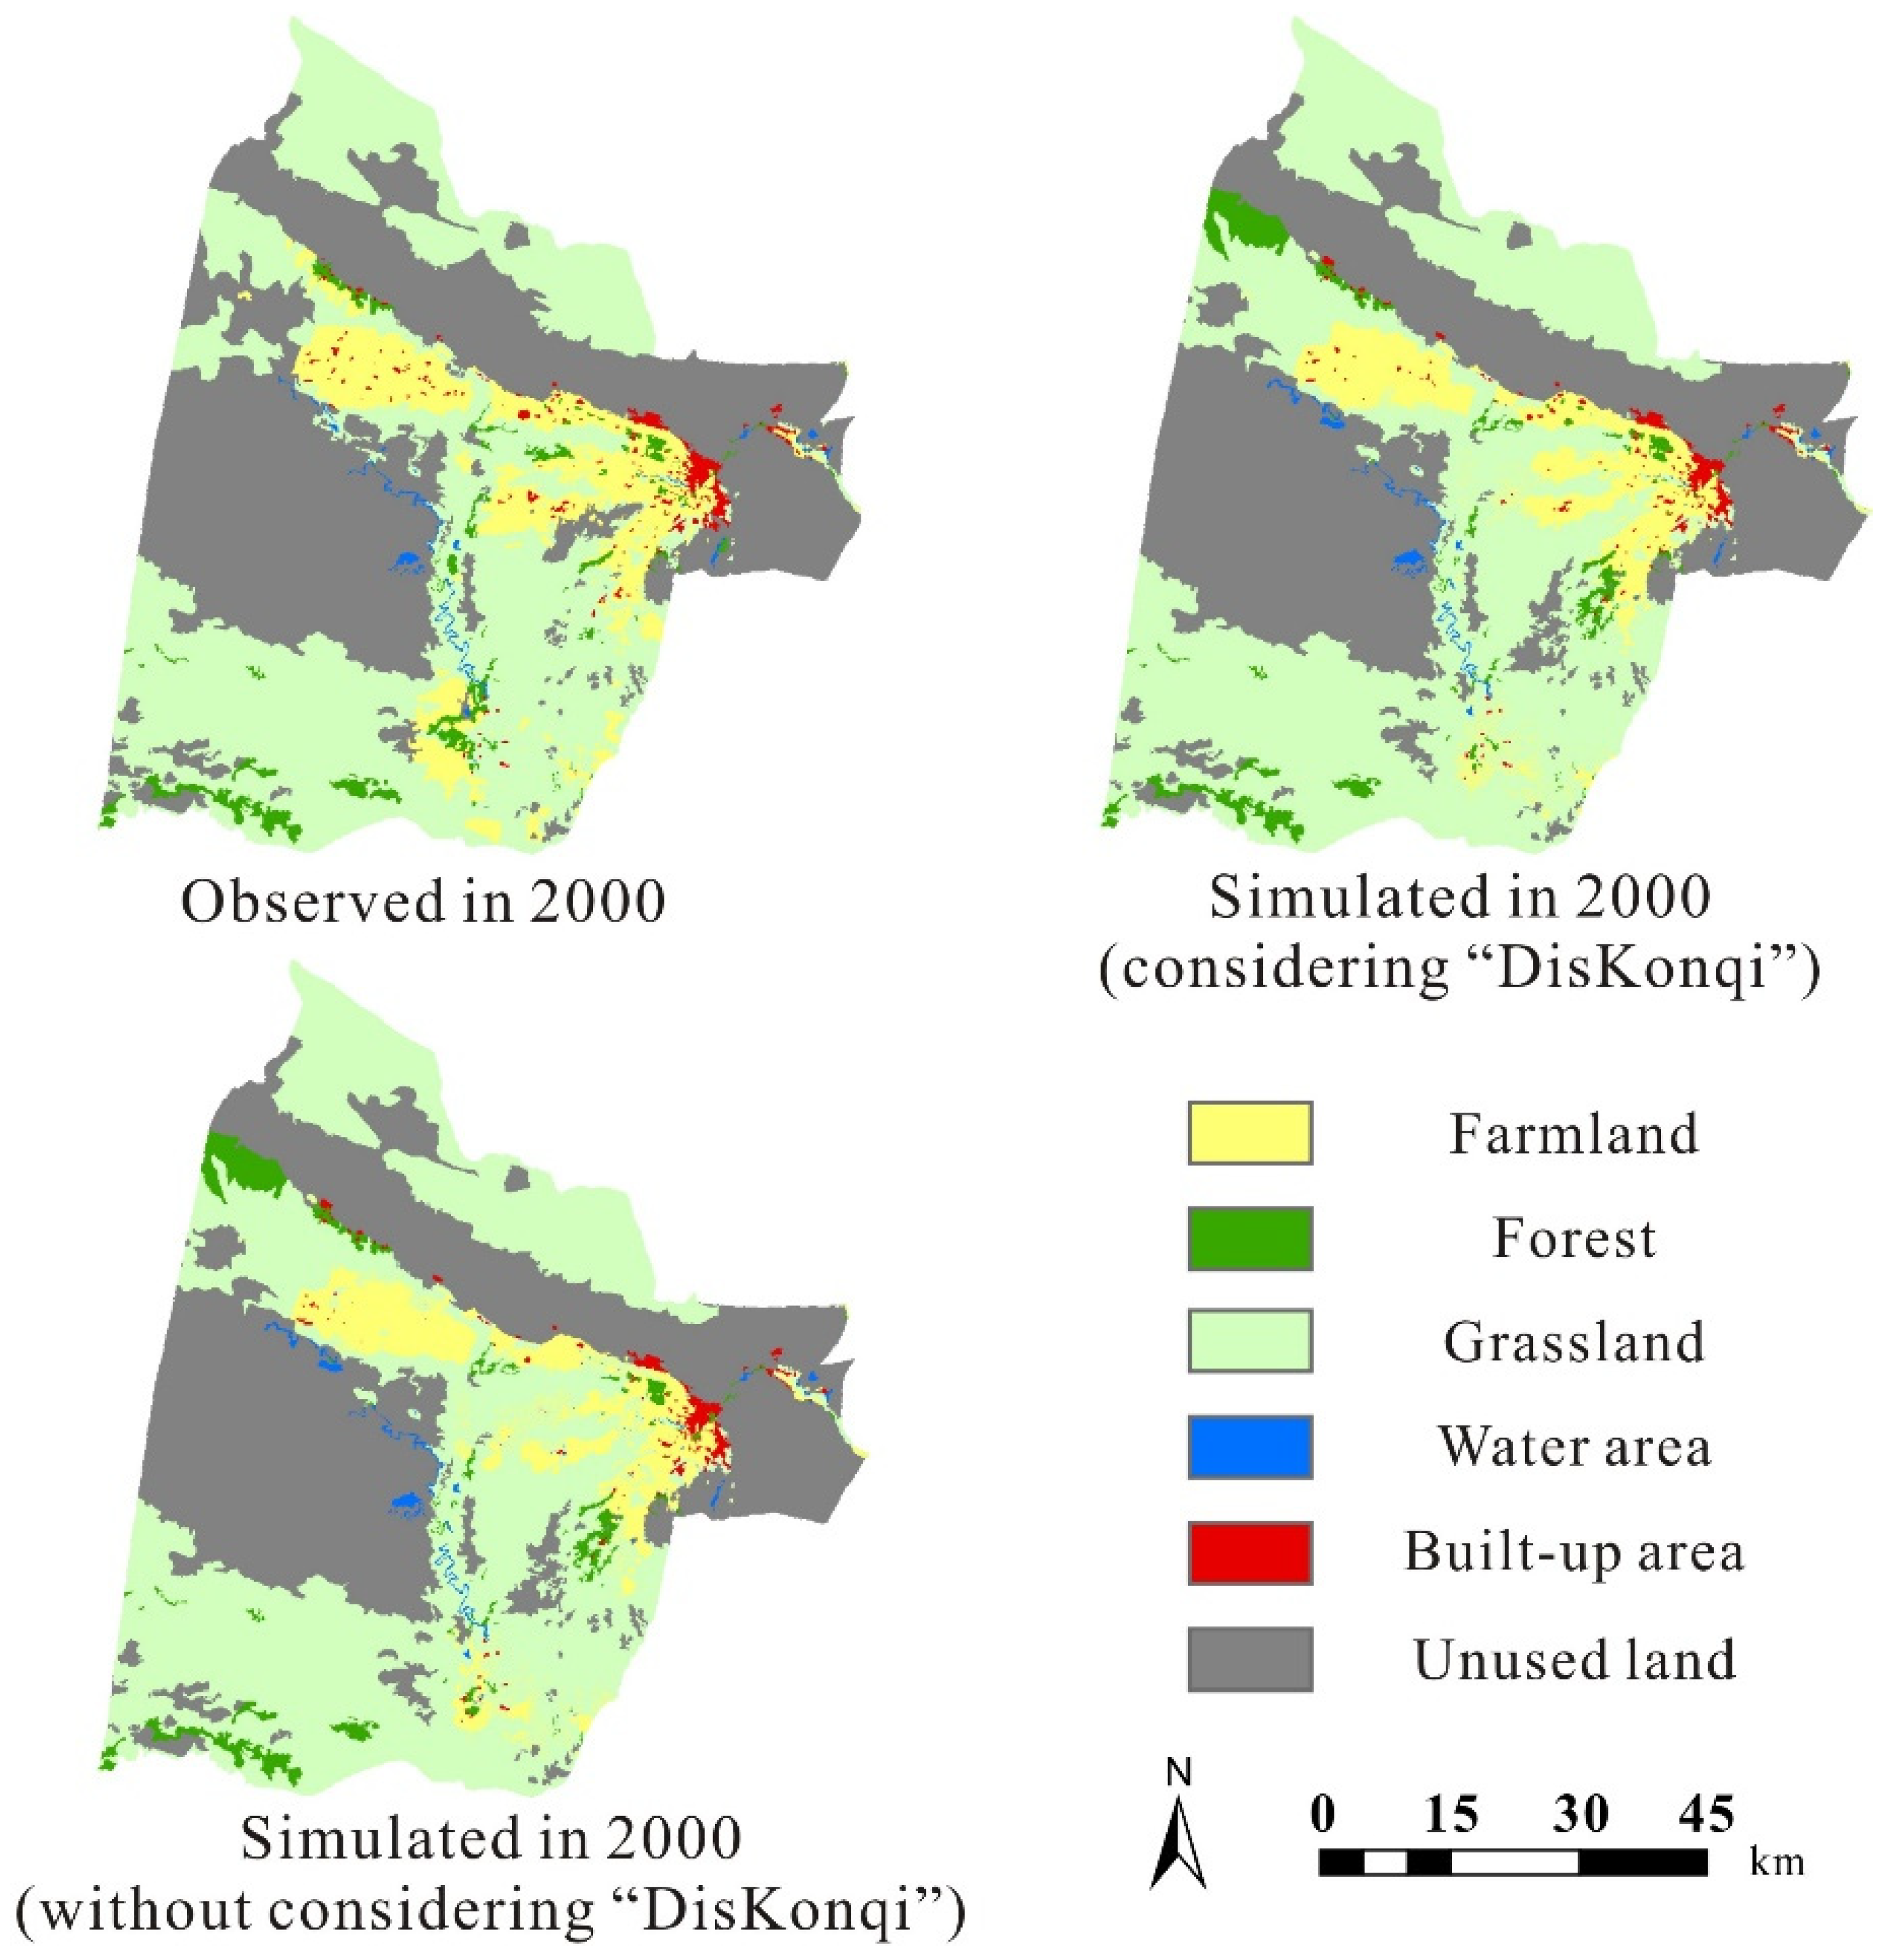
3.1. Modeling Land use and Land Cover Changes in Korla Using ANN-CA
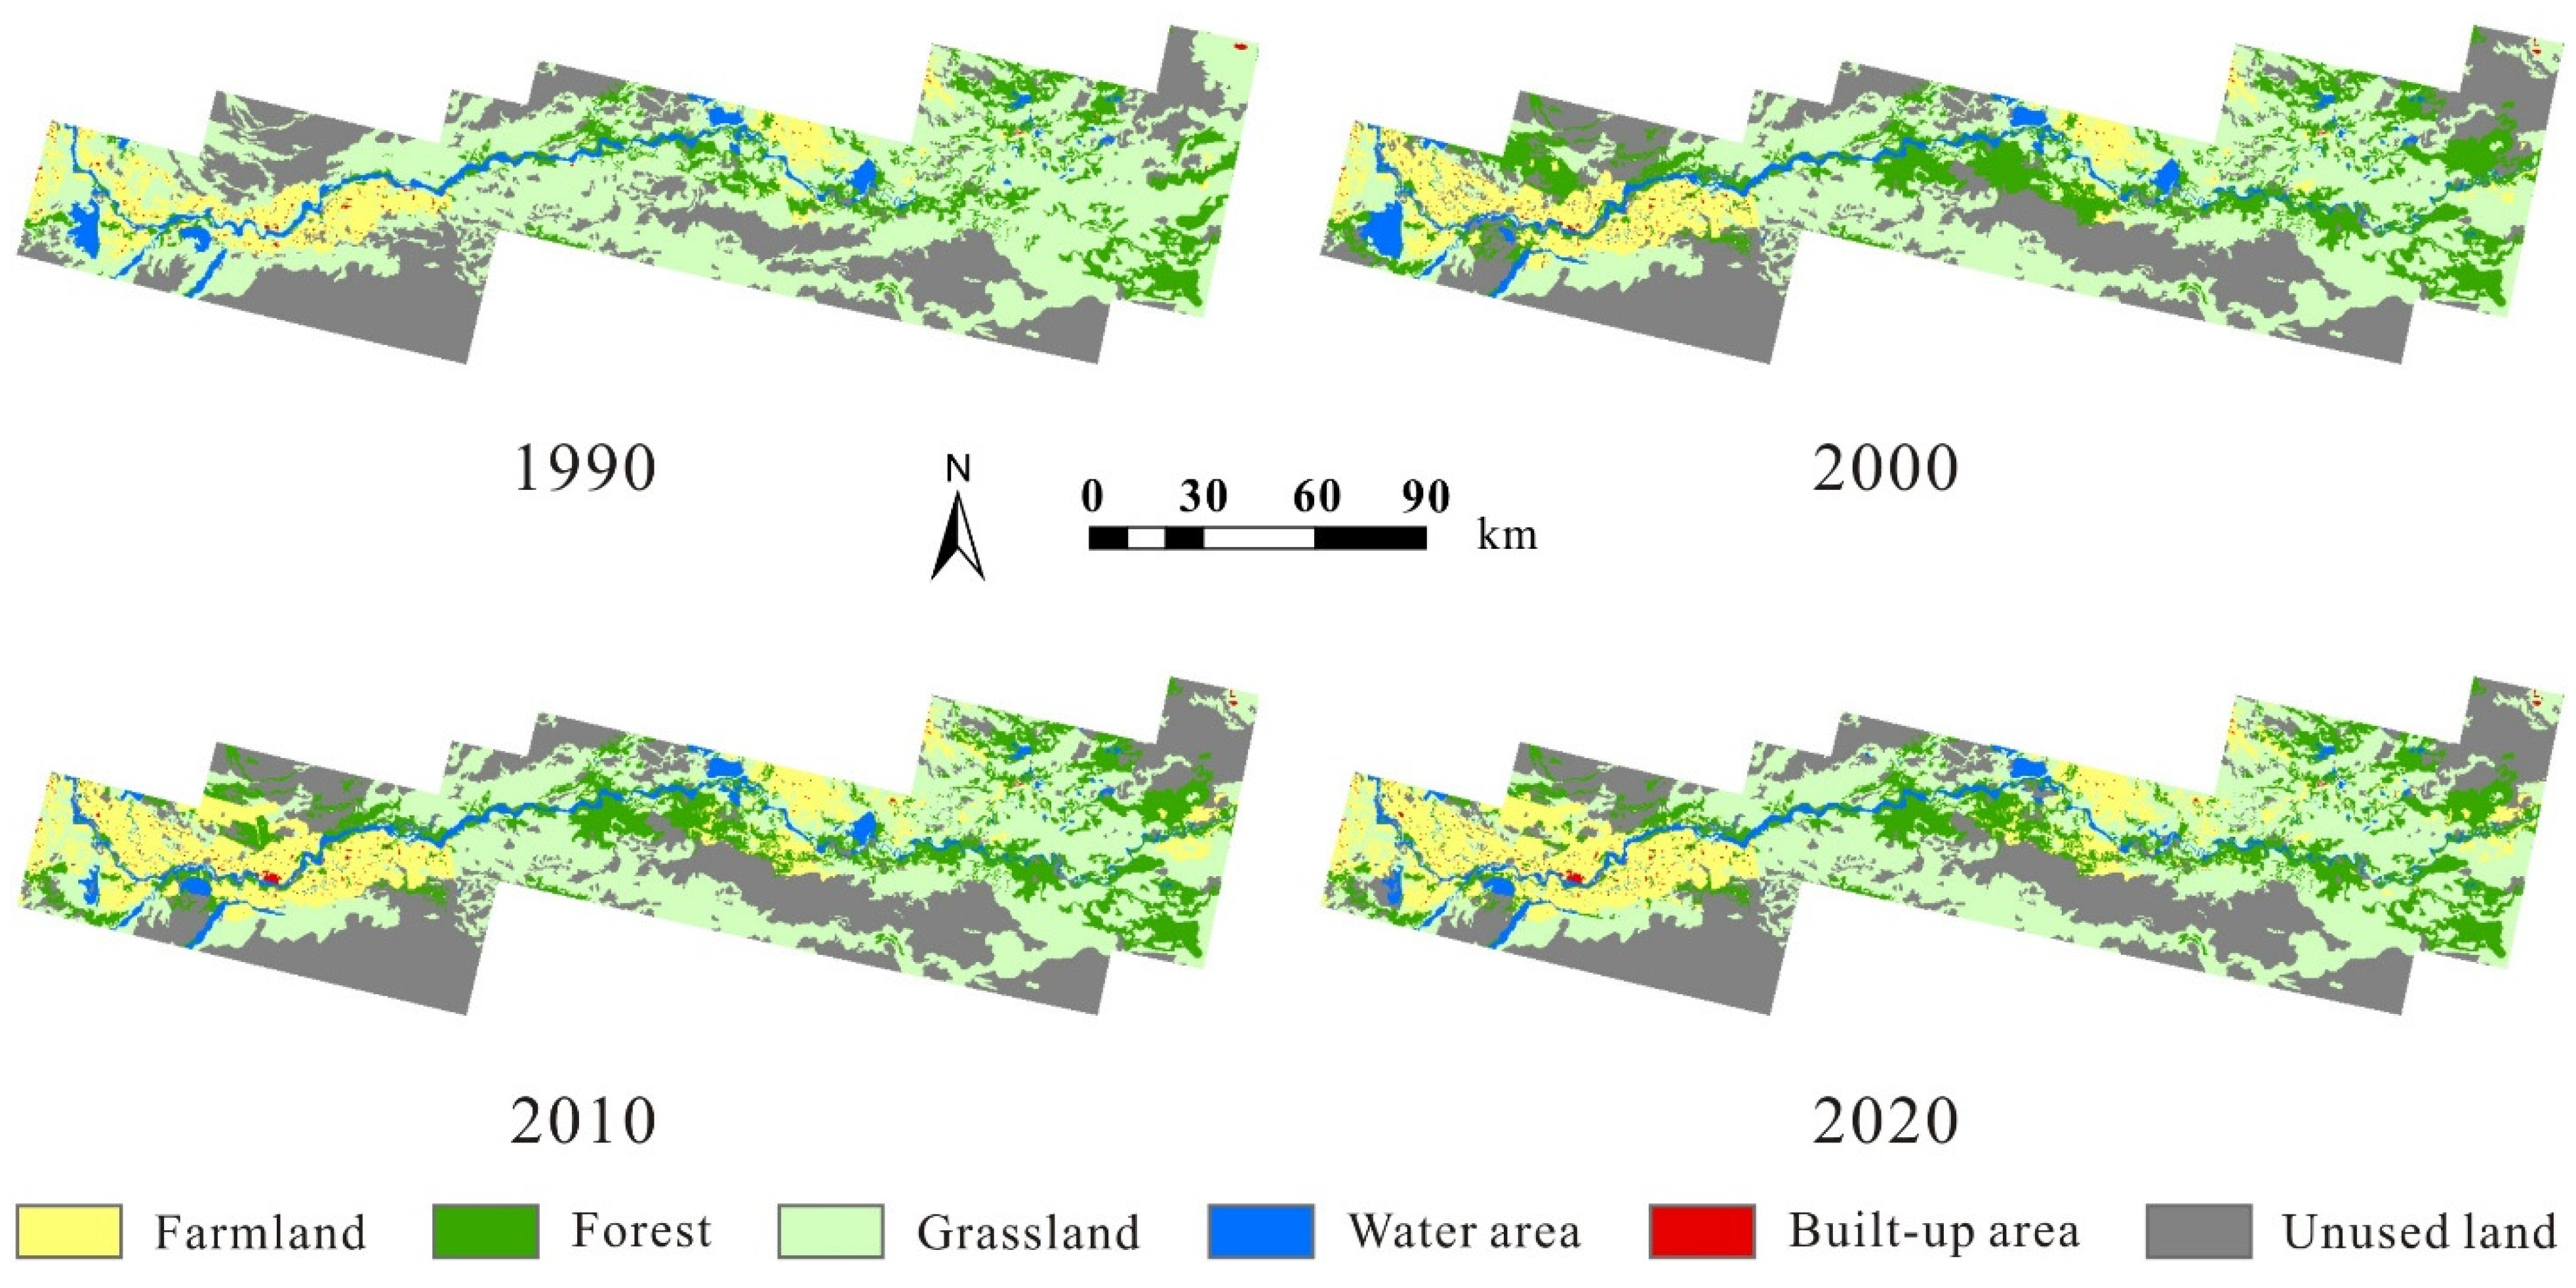
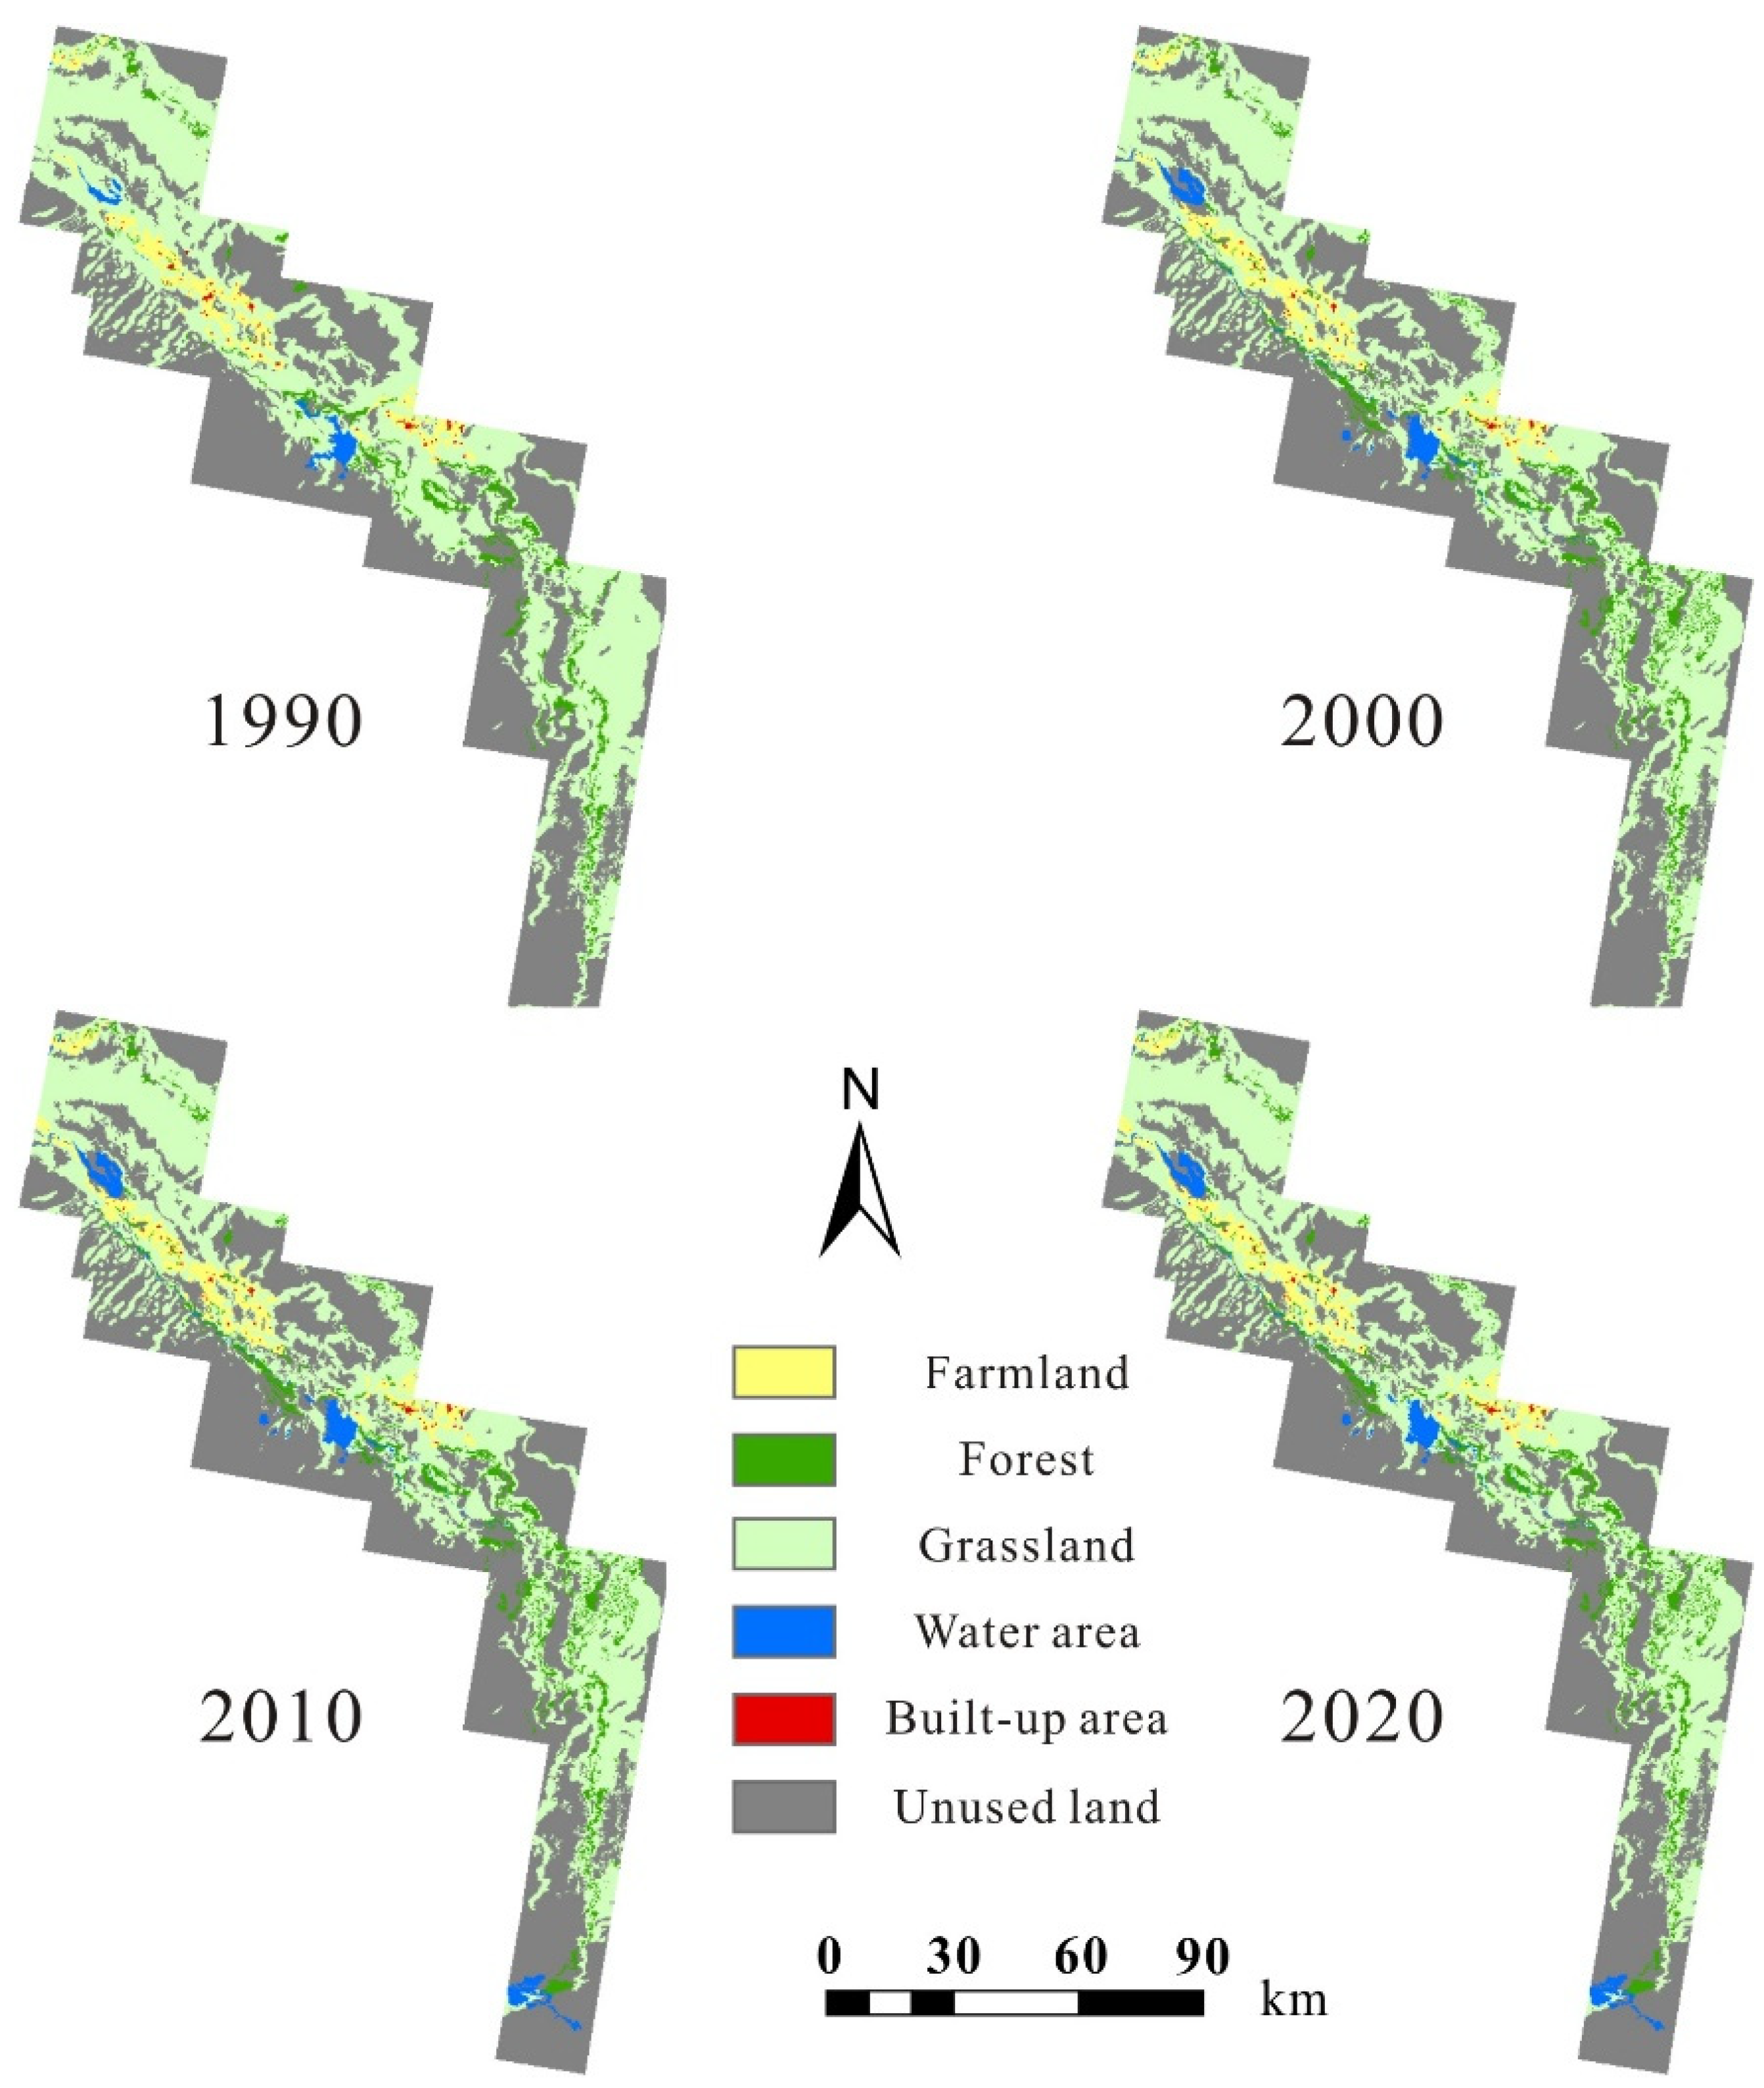
3.2. Comparing LULC Changes in the Xinjiang and Tarim River Regions
4. Discussion and Policy Implications
5. Conclusions
Supplementary Materials
Author Contributions
Funding
Data Availability Statement
Conflicts of Interest
References
- Verburg, P.H.; Crossman, N.; Ellis, E.C.; Heinimann, A.; Hostert, P.; Mertz, O.; Nagendra, H.; Sikor, T.; Erb, K.-H.; Golubiewski, N.; et al. Land system science and sustainable development of the earth system: A global land project perspective. Anthropocene 2015, 12, 29–41. [Google Scholar] [CrossRef]
- Cao, M.; Zhu, Y.; Quan, J.; Zhou, S.; Lü, G.; Chen, M.; Huang, M. Spatial Sequential Modeling and Predication of Global Land Use and Land Cover Changes by Integrating a Global Change Assessment Model and Cellular Automata. Earth’s Future 2019, 7, 1102–1116. [Google Scholar] [CrossRef]
- Marques-Carvalho, R.; Almeida, C.M.d.; Escobar-Silva, E.V.; Oliveira Alves, R.B.d.; Anjos Lacerda, C.S.d. Simulation and Prediction of Urban Land Use Change Considering Multiple Classes and Transitions by Means of Random Change Allocation Algorithms. Remote Sens. 2023, 15, 90. [Google Scholar] [CrossRef]
- Guan, Q.; Shi, X.; Huang, M.; Lai, C. A hybrid parallel cellular automata model for urban growth simulation over GPU/CPU heterogeneous architectures. Int. J. Geogr. Inf. Sci. 2016, 30, 494–514. [Google Scholar] [CrossRef]
- Li, H.; Peng, Y.; Li, M.; Zhuang, Y.; He, X.; Lin, J. Analyzing spatial patterns and influencing factors of different illegal land use types within ecological spaces: A case study of a fast-growing city. J. Clean. Prod. 2023, 424, 138883. [Google Scholar] [CrossRef]
- Liu, X.; Huang, Y.; Xu, X.; Li, X.; Li, X.; Ciais, P.; Lin, P.; Gong, K.; Ziegler, A.D.; Chen, A.; et al. High-spatiotemporal-resolution mapping of global urban change from 1985 to 2015. Nat. Sustain. 2020, 3, 564–570. [Google Scholar] [CrossRef]
- Gao, C.; Wang, J.; Wang, M.; Zhang, Y. Simulating Urban Agglomeration Expansion in Henan Province, China: An Analysis of Driving Mechanisms Using the FLUS Model with Considerations for Urban Interactions and Ecological Constraints. Land 2023, 12, 1189. [Google Scholar] [CrossRef]
- Li, M.; Luo, H.; Qin, Z.; Tong, Y. Spatial-Temporal Simulation of Carbon Storage Based on Land Use in Yangtze River Delta under SSP-RCP Scenarios. Land 2023, 12, 399. [Google Scholar] [CrossRef]
- Li, M.; Lin, J.; Ji, Z.; Chen, K.; Liu, J. Grid-Scale Poverty Assessment by Integrating High-Resolution Nighttime Light and Spatial Big Data—A Case Study in the Pearl River Delta. Remote Sens. 2023, 15, 4618. [Google Scholar] [CrossRef]
- Lin, J.; Qiu, S.; Tan, X.; Zhuang, Y. Measuring the relationship between morphological spatial pattern of green space and urban heat island using machine learning methods. Build. Environ. 2023, 228, 109910. [Google Scholar] [CrossRef]
- Zhong, J.; Jiao, L.; Droin, A.; Liu, J.; Lian, X.; Taubenböck, H. Greener cities cost more green: Examining the impacts of different urban expansion patterns on NPP. Build. Environ. 2023, 228, 109876. [Google Scholar] [CrossRef]
- Yang, J.; Yang, Y.; Sun, D.; Jin, C.; Xiao, X. Influence of urban morphological characteristics on thermal environment. Sustain. Cities Soc. 2021, 72, 103045. [Google Scholar] [CrossRef]
- Guan, X.; Li, J.; Yang, C.; Xing, W. Development Process, Quantitative Models, and Future Directions in Driving Analysis of Urban Expansion. ISPRS Int. J. Geo-Inf. 2023, 12, 174. [Google Scholar] [CrossRef]
- He, C.; Gao, B.; Huang, Q.; Ma, Q.; Dou, Y. Environmental degradation in the urban areas of China: Evidence from multi-source remote sensing data. Remote Sens. Environ. 2017, 193, 65–75. [Google Scholar] [CrossRef]
- Huang, Q.; Liu, Z.; He, C.; Gou, S.; Bai, Y.; Wang, Y.; Shen, M. The occupation of cropland by global urban expansion from 1992 to 2016 and its implications. Environ. Res. Lett. 2020, 15, 084037. [Google Scholar] [CrossRef]
- Ke, X.; van Vliet, J.; Zhou, T.; Verburg, P.H.; Zheng, W.; Liu, X. Direct and indirect loss of natural habitat due to built-up area expansion: A model-based analysis for the city of Wuhan, China. Land Use Policy 2018, 74, 231–239. [Google Scholar] [CrossRef]
- Yu, Y.; He, J.; Tang, W.; Li, C. Modeling Urban Collaborative Growth Dynamics Using a Multiscale Simulation Model for the Wuhan Urban Agglomeration Area, China. ISPRS Int. J. Geo-Inf. 2018, 7, 176. [Google Scholar] [CrossRef]
- Wang, Q.; Liu, D.; Gao, F.; Zheng, X.; Shang, Y. A Partitioned and Heterogeneous Land-Use Simulation Model by Integrating CA and Markov Model. Land 2023, 12, 409. [Google Scholar] [CrossRef]
- Li, S.; Zhuang, C.; Tan, Z.; Gao, F.; Lai, Z.; Wu, Z. Inferring the trip purposes and uncovering spatio-temporal activity patterns from dockless shared bike dataset in Shenzhen, China. J. Transp. Geogr. 2021, 91, 102974. [Google Scholar] [CrossRef]
- McDonald, R.I.; Weber, K.; Padowski, J.; Flörke, M.; Schneider, C.; Green, P.A.; Gleeson, T.; Eckman, S.; Lehner, B.; Balk, D.; et al. Water on an urban planet: Urbanization and the reach of urban water infrastructure. Glob. Environ. Chang. 2014, 27, 96–105. [Google Scholar] [CrossRef]
- Liao, J.; Tang, L.; Shao, G. Coupling Random Forest, Allometric Scaling, and Cellular Automata to Predict the Evolution of LULC under Various Shared Socioeconomic Pathways. Remote Sens. 2023, 15, 2142. [Google Scholar] [CrossRef]
- Zuo, Y.; Zhang, L. Research on Local Ecosystem Cultural Services in the Jiangnan Water Network Rural Areas: A Case Study of the Ecological Green Integration Demonstration Zone in the Yangtze River Delta, China. Land 2023, 12, 1373. [Google Scholar] [CrossRef]
- Zhou, Q.; Li, B.; Chen, Y. Remote Sensing Change Detection and Process Analysis of Long-Term Land Use Change and Human Impacts. Ambio 2011, 40, 807–818. [Google Scholar] [CrossRef] [PubMed]
- Feng, Y.; Chen, S.; Tong, X.; Lei, Z.; Gao, C.; Wang, J. Modeling changes in China’s 2000–2030 carbon stock caused by land use change. J. Clean. Prod. 2020, 252, 119659. [Google Scholar] [CrossRef]
- Liu, Y.; He, Q.; Tan, R.; Liu, Y.; Yin, C. Modeling different urban growth patterns based on the evolution of urban form: A case study from Huangpi, Central China. Appl. Geogr. 2016, 66, 109–118. [Google Scholar] [CrossRef]
- Li, F.; Li, Z.; Chen, H.; Chen, Z.; Li, M. An agent-based learning-embedded model (ABM-learning) for urban land use planning: A case study of residential land growth simulation in Shenzhen, China. Land Use Policy 2020, 95, 104620. [Google Scholar] [CrossRef]
- Li, X.; Zhou, Y.; Gong, P. Diversity in global urban sprawl patterns revealed by Zipfian dynamics. Remote Sens. Lett. 2023, 14, 565–575. [Google Scholar] [CrossRef]
- Shu, B.; Zhu, S.; Qu, Y.; Zhang, H.; Li, X.; Carsjens, G.J. Modelling multi-regional urban growth with multilevel logistic cellular automata. Comput. Environ. Urban Syst. 2020, 80, 101457. [Google Scholar] [CrossRef]
- Long, Y.; Wu, K. Simulating Block-Level Urban Expansion for National Wide Cities. Sustainability 2017, 9, 879. [Google Scholar] [CrossRef]
- Evans, J.M.; Calabria, J.; Borisova, T.; Boellstorf, D.E.; Sochacka, N.; Smolen, M.D.; Mahler, R.L.; Risse, L.M. Effects of local drought condition on public opinions about water supply and future climate change. Clim. Chang. 2015, 132, 193–207. [Google Scholar] [CrossRef]
- Hammer, M.; Balfors, B.; Mörtberg, U.; Petersson, M.; Quin, A. Governance of Water Resources in the Phase of Change: A Case Study of the Implementation of the EU Water Framework Directive in Sweden. Ambio 2011, 40, 210–220. [Google Scholar] [CrossRef] [PubMed]
- Destouni, G.; Jaramillo, F.; Prieto, C. Hydroclimatic shifts driven by human water use for food and energy production. Nat. Clim. Chang. 2013, 3, 213–217. [Google Scholar] [CrossRef]
- Xu, H.; Ye, M.; Li, J. The water transfer effects on agricultural development in the lower Tarim River, Xinjiang of China. Agric. Water Manag. 2008, 95, 59–68. [Google Scholar] [CrossRef]
- Zhang, X.; Chen, Y.; Li, W.; Yu, Y.; Sun, Z. Restoration of the lower reaches of the Tarim River in China. Reg. Environ. Chang. 2013, 13, 1021–1029. [Google Scholar] [CrossRef]
- Smith, H.M.; Blackstock, K.L.; Wall, G.; Jeffrey, P. River basin management, development planning, and opportunities for debate around limits to growth. J. Hydrol. 2014, 519, 2624–2631. [Google Scholar] [CrossRef]
- Chen, Y.; Chen, Y.; Xu, C.; Ye, Z.; Li, Z.; Zhu, C.; Ma, X. Effects of ecological water conveyance on groundwater dynamics and riparian vegetation in the lower reaches of Tarim River, China. Hydrol. Process. 2010, 24, 170–177. [Google Scholar] [CrossRef]
- Ye, Z.; Chen, Y.; Li, W.; Yan, Y. Effect of the ecological water conveyance project on environment in the Lower Tarim River, Xinjiang, China. Environ. Monit. Assess. 2009, 149, 9–17. [Google Scholar] [CrossRef]
- Chipman, J.W.; Shi, X.; Magilligan, F.J.; Chen, Y.; Li, B. Impacts of land cover change and water management practices on the Tarim and Konqi river systems, Xinjiang, China. J. Appl. Remote Sens. 2016, 10, 046020. [Google Scholar] [CrossRef]
- Liu, J.; Zang, C.; Tian, S.; Liu, J.; Yang, H.; Jia, S.; You, L.; Liu, B.; Zhang, M. Water conservancy projects in China: Achievements, challenges and way forward. Glob. Environ. Chang. 2013, 23, 633–643. [Google Scholar] [CrossRef]
- Bao, A.; Huang, Y.; Ma, Y.; Guo, H.; Wang, Y. Assessing the effect of EWDP on vegetation restoration by remote sensing in the lower reaches of Tarim River. Ecol. Indic. 2017, 74, 261–275. [Google Scholar] [CrossRef]
- Zhang, S.; Ye, Z.; Chen, Y.; Xu, Y. Vegetation responses to an ecological water conveyance project in the lower reaches of the Heihe River basin. Ecohydrology 2017, 10, e1866. [Google Scholar] [CrossRef]
- Armitage, D.; de Loë, R.C.; Morris, M.; Edwards, T.W.D.; Gerlak, A.K.; Hall, R.I.; Huitema, D.; Ison, R.; Livingstone, D.; MacDonald, G.; et al. Science–policy processes for transboundary water governance. Ambio 2015, 44, 353–366. [Google Scholar] [CrossRef]
- Chen, Y.; Ye, Z.; Shen, Y. Desiccation of the Tarim River, Xinjiang, China, and mitigation strategy. Quat. Int. 2011, 244, 264–271. [Google Scholar] [CrossRef]
- Xu, H.; Ye, M.; Song, Y.; Chen, Y. The Natural Vegetation Responses to the Groundwater Change Resulting from Ecological Water Conveyances to the Lower Tarim River. Environ. Monit. Assess. 2007, 131, 37–48. [Google Scholar] [CrossRef] [PubMed]
- Li, W.; Hao, X.; Chen, Y.; Zhang, L.; Ma, X.; Zhou, H. Response of groundwater chemical characteristics to ecological water conveyance in the lower reaches of the Tarim River, Xinjiang, China. Hydrol. Process. 2010, 24, 187–195. [Google Scholar] [CrossRef]
- Zhou, Q.; Li, B.; Kurban, A. Spatial pattern analysis of land cover change trajectories in Tarim Basin, northwest China. Int. J. Remote Sens. 2008, 29, 5495–5509. [Google Scholar] [CrossRef]
- Akron, A.; Ghermandi, A.; Dayan, T.; Hershkovitz, Y. Interbasin water transfer for the rehabilitation of a transboundary Mediterranean stream: An economic analysis. J. Environ. Manag. 2017, 202, 276–286. [Google Scholar] [CrossRef]
- Genereux, D.P.; Wood, S.J.; Pringle, C.M. Chemical tracing of interbasin groundwater transfer in the lowland rainforest of Costa Rica. J. Hydrol. 2002, 258, 163–178. [Google Scholar] [CrossRef]
- Zhao, R.; Chen, Y.; Shi, P.; Zhang, L.; Pan, J.; Zhao, H. Land use and land cover change and driving mechanism in the arid inland river basin: A case study of Tarim River, Xinjiang, China. Environ. Earth Sci. 2013, 68, 591–604. [Google Scholar] [CrossRef]
- Guo, Q.; Feng, Q.; Li, J. Environmental changes after ecological water conveyance in the lower reaches of Heihe River, northwest China. Environ. Geol. 2009, 58, 1387. [Google Scholar] [CrossRef]
- Gohari, A.; Eslamian, S.; Mirchi, A.; Abedi-Koupaei, J.; Massah Bavani, A.; Madani, K. Water transfer as a solution to water shortage: A fix that can Backfire. J. Hydrol. 2013, 491, 23–39. [Google Scholar] [CrossRef]
- Barnett, J.; Rogers, S.; Webber, M.; Finlayson, B.; Wang, M. Sustainability: Transfer project cannot meet China’s water needs. Nature 2015, 527, 295. [Google Scholar] [CrossRef] [PubMed]
- Mubako, S.; Nnko, H.J.; Peter, K.H.; Msongaleli, B. Evaluating historical and predicted long-term land use/land-cover change in Dodoma Urban District, Tanzania: 1992–2029. Phys. Chem. Earth Parts A/B/C 2022, 128, 103205. [Google Scholar] [CrossRef]
- Hou, Y.; Chen, Y.; Li, Z.; Li, Y.; Sun, F.; Zhang, S.; Wang, C.; Feng, M. Land Use Dynamic Changes in an Arid Inland River Basin Based on Multi-Scenario Simulation. Remote Sens. 2022, 14, 2797. [Google Scholar] [CrossRef]
- Mamitimin, Y.; Simayi, Z.; Mamat, A.; Maimaiti, B.; Ma, Y. FLUS Based Modeling of the Urban LULC in Arid and Semi-Arid Region of Northwest China: A Case Study of Urumqi City. Sustainability 2023, 15, 4912. [Google Scholar] [CrossRef]
- Xie, L.; Wang, H.; Liu, S. The ecosystem service values simulation and driving force analysis based on land use/land cover: A case study in inland rivers in arid areas of the Aksu River Basin, China. Ecol. Indic. 2022, 138, 108828. [Google Scholar] [CrossRef]
- Alqadhi, S.; Mallick, J.; Balha, A.; Bindajam, A.; Singh, C.K.; Hoa, P.V. Spatial and decadal prediction of land use/land cover using multi-layer perceptron-neural network (MLP-NN) algorithm for a semi-arid region of Asir, Saudi Arabia. Earth Sci. Inform. 2021, 14, 1547–1562. [Google Scholar] [CrossRef]
- Hao, X.; Li, W. Impacts of ecological water conveyance on groundwater dynamics and vegetation recovery in the lower reaches of the Tarim River in northwest China. Environ. Monit. Assess. 2014, 186, 7605–7616. [Google Scholar] [CrossRef]
- Chen, Y.; Li, W.; Liu, J.; Yang, Y. Effects of water conveyance embankments on riparian forest communities at the middle reaches of the Tarim River, Northwest China. Ecohydrology 2013, 6, 937–948. [Google Scholar] [CrossRef]
- Tayyebi, A.; Pijanowski, B.C. Modeling multiple land use changes using ANN, CART and MARS: Comparing tradeoffs in goodness of fit and explanatory power of data mining tools. Int. J. Appl. Earth Obs. Geoinf. 2014, 28, 102–116. [Google Scholar] [CrossRef]
- Li, X.; Chen, G.; Liu, X.; Liang, X.; Wang, S.; Chen, Y.; Pei, F.; Xu, X. A New Global Land-Use and Land-Cover Change Product at a 1-km Resolution for 2010 to 2100 Based on Human–Environment Interactions. Ann. Am. Assoc. Geogr. 2017, 107, 1040–1059. [Google Scholar] [CrossRef]
- Li, S.; Lyu, D.; Liu, X.; Tan, Z.; Gao, F.; Huang, G.; Wu, Z. The varying patterns of rail transit ridership and their relationships with fine-scale built environment factors: Big data analytics from Guangzhou. Cities 2020, 99, 102580. [Google Scholar] [CrossRef]
- Lin, J.; Li, X.; Wen, Y.; He, P. Modeling urban land-use changes using a landscape-driven patch-based cellular automaton (LP-CA). Cities 2023, 132, 103906. [Google Scholar] [CrossRef]
- He, Q.; Zhou, J.; Tan, S.; Song, Y.; Zhang, L.; Mou, Y.; Wu, J. What is the developmental level of outlying expansion patches? A study of 275 Chinese cities using geographical big data. Cities 2020, 105, 102395. [Google Scholar] [CrossRef]
- Lin, J.; Zhang, W.; Wen, Y.; Qiu, S. Evaluating the association between morphological characteristics of urban land and pluvial floods using machine learning methods. Sustain. Cities Soc. 2023, 99, 104891. [Google Scholar] [CrossRef]
- Pontius, R.G.; Boersma, W.; Castella, J.C.; Clarke, K.; Nijs, T.D.; Dietzel, C.; Duan, Z.; Fotsing, E.; Goldstein, N.; Kok, K. Comparing the input, output, and validation maps for several models of land change. Ann. Reg. Sci. 2008, 42, 11–37. [Google Scholar]
- Liu, X.; Liang, X.; Li, X.; Xu, X.; Ou, J.; Chen, Y.; Li, S.; Wang, S.; Pei, F. A future land use simulation model (FLUS) for simulating multiple land use scenarios by coupling human and natural effects. Landsc. Urban Plan. 2017, 168, 94–116. [Google Scholar] [CrossRef]
- Liang, X.; Guan, Q.; Clarke, K.C.; Liu, S.; Wang, B.; Yao, Y. Understanding the drivers of sustainable land expansion using a patch-generating land use simulation (PLUS) model: A case study in Wuhan, China. Comput. Environ. Urban Syst. 2021, 85, 101569. [Google Scholar] [CrossRef]
- Wu, H.; Luo, W.; Lin, A.; Hao, F.; Olteanu-Raimond, A.-M.; Liu, L.; Li, Y. SALT: A multifeature ensemble learning framework for mapping urban functional zones from VGI data and VHR images. Comput. Environ. Urban Syst. 2023, 100, 101921. [Google Scholar] [CrossRef]
- Wang, H.; Zhang, B.; Xia, C.; He, S.; Zhang, W. Using a maximum entropy model to optimize the stochastic component of urban cellular automata models. Int. J. Geogr. Inf. Sci. 2020, 34, 924–946. [Google Scholar] [CrossRef]
- Xu, Q.; Zhu, A.X.; Liu, J. Land-use change modeling with cellular automata using land natural evolution unit. Catena 2023, 224, 106998. [Google Scholar] [CrossRef]
- He, J.; Li, C.; Yu, Y.; Liu, Y.; Huang, J. Measuring urban spatial interaction in Wuhan Urban Agglomeration, Central China: A spatially explicit approach. Sustain. Cities Soc. 2017, 32, 569–583. [Google Scholar] [CrossRef]
- Lin, J.; He, P.; Yang, L.; He, X.; Lu, S.; Liu, D. Predicting future urban waterlogging-prone areas by coupling the maximum entropy and FLUS model. Sustain. Cities Soc. 2022, 80, 103812. [Google Scholar] [CrossRef]


| Level-1 Classification | Level-2 Classification | Level-1 Classification | Level-2 Classification |
|---|---|---|---|
| Farmland | Paddy field | Built-up area | Urban land |
| Dryland farming | Rural settlement | ||
| Forest | Dense forest | Other built-up area | |
| Shrubland | Unused land | Desert | |
| Sparse forest | Gobi | ||
| Other forest | Saline-alkali soil | ||
| Grassland | Dense grassland | Swampland | |
| Moderate grassland | Bare soil | ||
| Sparse grassland | Bare rock | ||
| Water area | River | Other unused land | |
| Lake | – | – | |
| Reservoir and pond | |||
| Snow cover | |||
| Bottomland |
| Spatial Factor | Acquisition Method |
|---|---|
| Distance from a cell to the nearest country center | Euclidean Distance function in ArcMap |
| Distance from a cell to the nearest city road | |
| Distance from a cell to the nearest country road | |
| Distance from a cell to the nearest water body | |
| Distance from a cell to the Konqi River (DisKonqi) | |
| Slope | Digital Elevation Model |
| Area of farmland within a cell’s 3 × 3 neighborhood | Focal Statistics function in ArcMap |
| Area of forest within a cell’s 3 × 3 neighborhood | |
| Area of grassland within a cell’s 3 × 3 neighborhood | |
| Area of water area within a cell’s 3 × 3 neighborhood | |
| Area of built-up area within a cell’s 3 × 3 neighborhood | |
| Area of unused land within a cell’s 3 × 3 neighborhood | |
| Current LULC category | LULC classification data |
| Observed in 2000 | Farmland | Forest | Grassland | Water | Built-Up | Unused | |
|---|---|---|---|---|---|---|---|
| Simulated in 2000 (without considering “DisKonqi”) | Farmland | 17.65 | 0.31 | 3.43 | 0.01 | 0.60 | 0.19 |
| Forest | 0.15 | 4.27 | 3.48 | 0.01 | 0.02 | 0.04 | |
| Grassland | 11.28 | 1.71 | 113.43 | 0.06 | 0.26 | 10.54 | |
| Water | 0.02 | 0.01 | 0.14 | 0.96 | 0.01 | 0.37 | |
| Built-up | 0.15 | 0.02 | 0.04 | 0.00 | 1.90 | 0.12 | |
| Unused | 0.67 | 0.16 | 4.89 | 0.18 | 0.10 | 110.90 | |
| FoM | 0.075 | Overall accuracy | 86.47% | ||||
| Simulated in 2000 (considering “DisKonqi”) | Farmland | 19.26 | 0.36 | 2.54 | 0.01 | 0.49 | 0.19 |
| Forest | 0.13 | 4.40 | 3.46 | 0.01 | 0.02 | 0.04 | |
| Grassland | 9.74 | 1.53 | 114.35 | 0.06 | 0.11 | 10.56 | |
| Water | 0.01 | 0.01 | 0.12 | 0.96 | 0.00 | 0.37 | |
| Built-up | 0.12 | 0.02 | 0.05 | 0.00 | 2.16 | 0.12 | |
| Unused | 0.66 | 0.16 | 4.89 | 0.18 | 0.11 | 110.89 | |
| FoM | 0.081 | Overall accuracy | 87.48% | ||||
| Observed in 2010 | Farmland | Forest | Grassland | Water | Built-Up | Unused | |
|---|---|---|---|---|---|---|---|
| Simulated in 2010 (without considering “DisKonqi”) | Farmland | 34.11 | 0.59 | 10.20 | 0.00 | 0.03 | 0.11 |
| Forest | 0.28 | 4.88 | 0.00 | 0.00 | 0.00 | 0.00 | |
| Grassland | 9.65 | 0.03 | 100.44 | 0.00 | 0.02 | 0.00 | |
| Water | 0.01 | 0.00 | 0.00 | 1.15 | 0.00 | 0.05 | |
| Built-up | 1.15 | 0.11 | 0.05 | 0.00 | 2.96 | 0.00 | |
| Unused | 1.25 | 1.20 | 0.02 | 0.00 | 1.04 | 118.76 | |
| FoM | 0.177 | Overall accuracy | 91.04% | ||||
| Simulated in 2010 (considering “DisKonqi”) | Farmland | 35.64 | 0.56 | 6.36 | 0.29 | 0.09 | 2.65 |
| Forest | 0.12 | 5.03 | 0.00 | 0.00 | 0.00 | 0.00 | |
| Grassland | 9.21 | 0.02 | 104.34 | 0.01 | 0.05 | 0.00 | |
| Water | 0.01 | 0.00 | 0.01 | 0.86 | 0.00 | 0.05 | |
| Built-up | 0.75 | 0.01 | 0.01 | 0.00 | 2.89 | 0.03 | |
| Unused | 0.73 | 1.19 | 0.00 | 0.00 | 1.02 | 116.18 | |
| FoM | 0.228 | Overall accuracy | 91.96% | ||||
| 1990 | Farmland | Forest | Grassland | Water | Built-Up | Unused | Total | |
| 2000 | ||||||||
| Farmland | 1197.00 | 14.85 | 341.95 | 3.55 | 12.45 | 95.74 | 1665.52 | |
| Forest | 25.89 | 1631.41 | 1123.96 | 19.35 | 1.37 | 251.36 | 3053.34 | |
| Grassland | 15.47 | 93.35 | 6595.33 | 23.91 | 5.94 | 208.32 | 6942.32 | |
| Water | 9.59 | 26.70 | 140.99 | 549.31 | 0.15 | 8.94 | 735.69 | |
| Built-up | 11.28 | 0.12 | 4.46 | 0.02 | 25.70 | 0.20 | 41.77 | |
| Unused | 20.12 | 35.69 | 726.18 | 36.94 | 0.79 | 4808.08 | 5627.79 | |
| Total | 1279.34 | 1802.11 | 8932.87 | 633.07 | 46.40 | 5372.65 | ||
| R | 6.04% | 13.89% | −4.46% | 3.24% | −1.99% | 0.95% | ||
| 2000 | Farmland | Forest | Grassland | Water | Built-Up | Unused | Total | |
| 2010 | ||||||||
| Farmland | 1654.06 | 263.76 | 295.87 | 15.51 | 0.17 | 91.13 | 2320.49 | |
| Forest | 0.00 | 2767.99 | 3.07 | 0.21 | 0.00 | 15.79 | 2787.06 | |
| Grassland | 3.65 | 15.15 | 6635.55 | 77.81 | 0.00 | 41.34 | 6773.50 | |
| Water | 0.00 | 3.68 | 5.67 | 639.97 | 0.00 | 15.56 | 664.90 | |
| Built-up | 7.81 | 0.00 | 1.06 | 0.00 | 41.60 | 0.01 | 50.48 | |
| Unused | 0.00 | 2.75 | 1.10 | 2.20 | 0.00 | 5463.96 | 5470.01 | |
| Total | 1665.52 | 3053.34 | 6942.32 | 735.69 | 41.77 | 5627.79 | ||
| R | 7.87% | −1.74% | −0.49% | −1.92% | 4.17% | −0.56% | ||
| 2010 | Farmland | Forest | Grassland | Water | Built-Up | Unused | Total | |
| 2020 | ||||||||
| Farmland | 2256.75 | 110.02 | 93.98 | 16.63 | 1.59 | 29.38 | 2508.34 | |
| Forest | 14.95 | 2625.40 | 19.97 | 3.07 | 0.25 | 16.62 | 2680.26 | |
| Grassland | 42.43 | 37.05 | 6595.90 | 34.94 | 0.10 | 11.36 | 6721.79 | |
| Water | 2.03 | 4.70 | 3.68 | 597.08 | 0.04 | 2.24 | 609.76 | |
| Built-up | 2.80 | 0.05 | 0.41 | 0.01 | 48.49 | 0.03 | 51.79 | |
| Unused | 1.54 | 9.86 | 59.56 | 13.16 | 0.03 | 5410.37 | 5494.51 | |
| Total | 2320.49 | 2787.06 | 6773.50 | 664.90 | 50.48 | 5470.01 | ||
| R | 1.62% | −0.77% | −0.15% | −1.66% | 0.52% | 0.09% | ||
| 1990 | Farmland | Forest | Grassland | Water | Built-Up | Unused | Total | |
| 2000 | ||||||||
| Farmland | 237.85 | 7.13 | 177.65 | 0.47 | 0.29 | 15.76 | 439.15 | |
| Forest | 1.49 | 839.78 | 514.42 | 14.81 | 0.05 | 97.14 | 1467.69 | |
| Grassland | 79.35 | 130.94 | 6504.48 | 18.49 | 0.18 | 333.54 | 7066.98 | |
| Water | 0.04 | 17.66 | 35.34 | 60.01 | 0.01 | 8.02 | 121.08 | |
| Built-up | 0.87 | 0.06 | 0.02 | 0.00 | 9.07 | 0.00 | 10.02 | |
| Unused | 0.17 | 25.39 | 1004.17 | 10.46 | 0.00 | 2012.55 | 3052.74 | |
| Total | 319.77 | 1020.95 | 8236.07 | 104.25 | 9.60 | 2467.02 | ||
| R | 7.47% | 8.75% | −2.84% | 3.23% | 0.88% | 4.75% | ||
| 2000 | Farmland | Forest | Grassland | Water | Built-Up | Unused | Total | |
| 2010 | ||||||||
| Farmland | 439.07 | 39.80 | 277.33 | 0.01 | 0.00 | 26.31 | 782.52 | |
| Forest | 0.00 | 1427.89 | 0.01 | 0.00 | 0.00 | 0.00 | 1427.90 | |
| Grassland | 0.09 | 0.00 | 6789.64 | 1.21 | 0.00 | 0.00 | 6790.94 | |
| Water | 0.00 | 0.00 | 0.00 | 119.85 | 0.00 | 0.00 | 119.85 | |
| Built-up | 0.00 | 0.00 | 0.00 | 0.00 | 10.02 | 0.00 | 10.02 | |
| Unused | 0.00 | 0.00 | 0.00 | 0.00 | 0.00 | 3026.43 | 3026.43 | |
| Total | 439.15 | 1467.69 | 7066.98 | 121.08 | 10.02 | 3052.74 | ||
| R | 15.64% | −0.54% | −0.78% | −0.20% | 0.00% | −0.17% | ||
| 2010 | Farmland | Forest | Grassland | Water | Built-Up | Unused | Total | |
| 2020 | ||||||||
| Farmland | 768.33 | 8.24 | 50.62 | 0.87 | 0.39 | 5.97 | 834.42 | |
| Forest | 1.38 | 1390.31 | 12.63 | 2.16 | 0.06 | 5.79 | 1412.34 | |
| Grassland | 8.27 | 21.63 | 6709.66 | 6.76 | 0.00 | 17.03 | 6763.35 | |
| Water | 0.48 | 2.28 | 2.53 | 100.85 | 0.00 | 1.17 | 107.31 | |
| Built-up | 0.37 | 0.05 | 0.05 | 0.01 | 9.57 | 0.00 | 10.06 | |
| Unused | 3.69 | 5.39 | 15.46 | 9.20 | 0.00 | 2996.47 | 3030.20 | |
| Total | 782.52 | 1427.90 | 6790.94 | 119.85 | 10.02 | 3026.43 | ||
| R | 1.33% | −0.22% | −0.08% | −2.09% | 0.07% | 0.02% | ||
| 1990 | Farmland | Forest | Grassland | Water | Built-Up | Unused | Total | |
| 2000 | ||||||||
| Farmland | 293.45 | 9.47 | 56.06 | 0.39 | 7.75 | 4.11 | 371.23 | |
| Forest | 9.48 | 317.00 | 209.11 | 0.25 | 0.36 | 22.60 | 558.80 | |
| Grassland | 25.16 | 52.96 | 3831.37 | 3.40 | 0.82 | 104.39 | 4018.09 | |
| Water | 0.28 | 5.22 | 51.24 | 70.05 | 0.01 | 12.30 | 139.10 | |
| Built-up | 2.83 | 0.05 | 0.44 | 0.01 | 16.46 | 0.13 | 19.92 | |
| Unused | 3.56 | 15.82 | 377.10 | 10.41 | 0.09 | 5204.98 | 5611.96 | |
| Total | 334.75 | 400.53 | 4525.31 | 84.50 | 25.49 | 5348.50 | ||
| R | 2.18% | 7.90% | −2.24% | 12.92% | −4.37% | 0.99% | ||
| 2000 | Farmland | Forest | Grassland | Water | Built-Up | Unused | Total | |
| 2010 | ||||||||
| Farmland | 371.19 | 0.00 | 25.06 | 0.68 | 0.00 | 0.47 | 397.40 | |
| Forest | 0.00 | 557.76 | 3.66 | 0.00 | 0.00 | 22.96 | 584.38 | |
| Grassland | 0.00 | 0.73 | 3969.62 | 0.00 | 0.00 | 7.13 | 3977.48 | |
| Water | 0.04 | 0.30 | 19.74 | 138.42 | 0.00 | 37.56 | 196.05 | |
| Built-up | 0.00 | 0.00 | 0.00 | 0.00 | 19.92 | 0.00 | 19.92 | |
| Unused | 0.00 | 0.00 | 0.00 | 0.00 | 0.00 | 5543.85 | 5543.85 | |
| Total | 371.23 | 558.80 | 4018.09 | 139.10 | 19.92 | 5611.96 | ||
| R | 1.41% | 0.92% | −0.20% | 8.19% | 0.00% | −0.24% | ||
| 2010 | Farmland | Forest | Grassland | Water | Built-Up | Unused | Total | |
| 2020 | ||||||||
| Farmland | 390.42 | 1.32 | 9.48 | 0.12 | 0.74 | 1.09 | 403.18 | |
| Forest | 0.68 | 565.32 | 12.26 | 1.50 | 0.04 | 4.22 | 584.03 | |
| Grassland | 4.98 | 12.45 | 3931.65 | 1.62 | 0.12 | 51.77 | 4002.58 | |
| Water | 0.11 | 1.56 | 1.04 | 191.53 | 0.01 | 1.34 | 195.58 | |
| Built-up | 0.80 | 0.03 | 0.14 | 0.00 | 19.01 | 0.00 | 19.98 | |
| Unused | 0.41 | 3.69 | 22.92 | 1.28 | 0.01 | 5485.43 | 5513.74 | |
| Total | 397.40 | 584.38 | 3977.48 | 196.05 | 19.92 | 5543.85 | ||
| R | 0.29% | −0.01% | 0.13% | −0.05% | 0.06% | −0.11% | ||
Disclaimer/Publisher’s Note: The statements, opinions and data contained in all publications are solely those of the individual author(s) and contributor(s) and not of MDPI and/or the editor(s). MDPI and/or the editor(s) disclaim responsibility for any injury to people or property resulting from any ideas, methods, instructions or products referred to in the content. |
© 2023 by the authors. Licensee MDPI, Basel, Switzerland. This article is an open access article distributed under the terms and conditions of the Creative Commons Attribution (CC BY) license (https://creativecommons.org/licenses/by/4.0/).
Share and Cite
Lin, J.; Chen, Q. Analyzing and Simulating the Influence of a Water Conveyance Project on Land Use Conditions in the Tarim River Region. Land 2023, 12, 2073. https://doi.org/10.3390/land12112073
Lin J, Chen Q. Analyzing and Simulating the Influence of a Water Conveyance Project on Land Use Conditions in the Tarim River Region. Land. 2023; 12(11):2073. https://doi.org/10.3390/land12112073
Chicago/Turabian StyleLin, Jinyao, and Qitong Chen. 2023. "Analyzing and Simulating the Influence of a Water Conveyance Project on Land Use Conditions in the Tarim River Region" Land 12, no. 11: 2073. https://doi.org/10.3390/land12112073
APA StyleLin, J., & Chen, Q. (2023). Analyzing and Simulating the Influence of a Water Conveyance Project on Land Use Conditions in the Tarim River Region. Land, 12(11), 2073. https://doi.org/10.3390/land12112073