Article

A Simulated Assessment of Land Use and Carbon Storage Changes in the Yanqi Basin under Different Development Scenarios

1
College of Geography and Remote Sensing Science, Xinjiang University, Urumqi 830017, China
2
Xinjiang Key Laboratory of Oasis Ecology, Xinjiang University, Urumqi 830017, China
*
Author to whom correspondence should be addressed.
Land 2024, 13(6), 744; https://doi.org/10.3390/land13060744
Submission received: 25 March 2024 / Revised: 18 May 2024 / Accepted: 21 May 2024 / Published: 26 May 2024

Abstract

:
The most extensive carbon reservoir system on Earth is found in the vegetation and soil in terrestrial ecosystems, which are essential to preserving the stability of ecosystems. Land use/cover change (LUCC) patterns in terrestrial ecosystems significantly impact carbon storage (CS). Therefore, it is imperative to investigate the relationship between LUCC and CS to coordinate regional ecological conservation and industrial development. In this study, the characteristics of spatial and temporal changes in land use and CS in the Yanqi Basin from 2000 to 2020 were revealed using the PLUS (patch-generating land use simulation) model and the CS module of the InVEST (Integrated Valuation of Ecosystem Services and Tradeoffs) model. This study also predicted the spatial and temporal evolution of CS and the response mechanism of the Yanqi Basin from four scenarios—natural development scenario (NDS), ecological protection scenario (EPS), cropland protection scenario (CPS), and urban development scenario (UDS) for the years 2030, 2040, and 2050. This study shows the following: (1) Between 2000 and 2020, the Yanqi Basin witnessed an expansion in cropland and construction land, the order of the land use dynamic degree which is as follows: construction land > cropland > woodland > unused land > water > grassland. At the same time, the CS exhibited a trend of growth that was followed by a decline, a cumulative decrease of 3.61 Tg. (2) Between 2020 and 2050, woodland, grassland, and unused land decreased under the NDS and UDS. Meanwhile, grassland and woodland showed an expanding trend, and there was a decrease in cropland and construction land under the EPS; the CPS projected an increase in cropland to 3258.06 km2 by 2050. (3) CS under the UDS is always the lowest, and CS under the EPS is the highest; moreover, by 2050, CS under the EPS is projected to increase by 1.18 Tg compared with that under the UDS. The spatial distribution of CS shows a high value in the western part of the region and a low value in the eastern part of the region, which is more in line with the historical spatial distribution. (4) The development of land by human activities is one of the major factors leading to the change of CS. The direct cause of the decrease in CS is the transformation of large areas of cropland and woodland into construction land. Therefore, woodlands must be protected to improve CS and prevent ecological degradation. At the same time, future land use planning in the Yanqi Basin needs to limit the conversion rate of various types of land, control the construction land, optimize the urban pattern, improve the regional CS level, adhere to the concept of striving to achieve carbon neutrality, and realize the sustainable development of the region to provide scientific suggestions for carrying out macro-decision making regarding land use planning in arid areas.

1. Introduction

Land use/cover change (LUCC) refers to the process of altering land functions that occur under the impact of natural circumstances and human interventions [1]; it is a long-term or cyclical management activity carried out by us for production and living purposes [2]. LUCC causes changes in natural phenomena and ecological processes, uniquely influencing global environmental changes [3]. Therefore, rational land use is essential for implementing environmental civilization [4,5]. Carbon storage (CS) refers to the amount of carbon in a given carbon pool (e.g., forests, oceans, land) [6], while carbon density is the amount of CS per unit area [7,8]. With the global climate change issue attracting much attention [9], research hotspots focus on carbon balance, CS, and their changes in terrestrial ecosystems [10,11]. Terrestrial ecosystems in the northern hemisphere play a vital role in maintaining the global carbon cycle and balance equilibrium [12,13]. The process of LUCC is often accompanied by carbon exchange, which affects CS [14]. Wen et al. [15] analyzed the LUCC in China and showed that the loss of CS in vegetation and soils was mainly due to the occupation of ecological land by construction land. Zhu et al. [16] evaluated the impacts of LUCC on CS in China’s coastal areas using CA and InVEST models, and the results showed that CS has been lost due to accelerated urbanization. Zhu et al. [17] analyzed the causes of CS reduction due to LUCC in China’s arid areas using CA and InVEST models. They proposed the direction of better land use structure development. Therefore, quantifying the relationship between LUCC and CS as well as enhancing CS through the rational management of LUCC contributes to mitigating environmental issues, being crucial for the carbon sequestration capacity of ecosystems [18,19,20].
China is committed to achieving “carbon neutrality” [21]. Researching ways to increase terrestrial ecosystems’ CS and CS capacity is essential [22]. Arid ecosystems cover almost half of the world’s land area, significantly impacting global carbon balance [23]. Xinjiang, a semi-arid region, is particularly sensitive to global changes and profoundly impacts CS in terrestrial ecosystems and environmental climate change in China [24]. The Yanqi Basin in Xinjiang is a typical arid tourist basin and a core demonstration area for oasis agriculture development on the Tianshan Mountains’ southern flank [25]. Significant LUCC has recently occurred in the Yanqi Basin due to national policy adjustments, human activities, and climate change [26]. This rapid economic development and transformation have caused changes in the dryland area [27], which has a substantial influence on the ecosystem in the basin. The Yanqi Basin has become an area where human activities are strongly impacted in China [28].
The key to land use modeling and prediction lies in its driving factors, and the research on driving factors has matured internationally [29]. Lambin et al. [30] propose a framework to prove that the leading cause of LUCC is the interaction of resource scarcity and synergistic influencing elements. Biazin et al. [31] found that drought vulnerability is intimately linked to land use type and social background through remote sensing technology, drought vulnerability analysis and field observation, and social context. Niu et al. [32] used principal component analysis and multivariate stepwise regression to analyze LUCC in Vietnam. They showed that LUCC in Vietnam is affected by economic development, population, and urbanization rate. Uncontrolled land development, climate change, and human activities are the primary factors contributing to land degradation in arid regions [33]. Shao et al. [34] explored the critical LDD (land degradation) processes in the Heihe River Basin (HRB) during 1990–2010. Then, the driving mechanism of the cultivated land development process, grassland degradation process, and water resource change process were analyzed with a simultaneous equations model which took the interaction of the three processes into account. The results showed that LDD process changes were mainly due to the interaction of LDD processes, as well as socio-economic and climate changes. Among these factors, the authors distinguished whether the main grain-producing county is the main driver of grassland and water resource degradation in this region. This view has also been expressed by scholars studying China’s arid regions. Wang et al. [35] used the FLUS coupled model to analyze the driving factor affecting the LUCC in the Lanzhou area, and the results showed that the economic impact on LUCC is very significant. Zhang et al. [36] used system dynamics and the PLUS model to analyze the LUCC in the Tien Shan mountainous region of Central Asia and selected the driving factors (including natural and human economic activities) affecting land use to construct a prediction model with an accuracy of 91%, which indicates that the selection of driving factors is essential. To summarize, the drivers of LUCC primarily include natural and human factors [37,38,39,40].
In the initial land use prediction research, scholars usually use non-spatial methods for simulations [41], such as the quantitative dynamic simulation model, empirical statistical model, and economic optimization model [42]. Then, they add spatial simulation content based on this to ensure a more precise and intuitive reflection of the pattern of land usage in the future; moreover, the most widely used models (including meta cellular automata) for this process include the regression model [43,44,45,46], CLUE-S model [47,48], FLUS model, etc. [49,50]. Ku et al. [51] incorporated the regression model into the CA (cellular automata) model to imitate the LUCC, and the outcomes demonstrated that the technique enhanced the efficiency of the land use model in the area, but there is still uncertainty. The PLUS model preserves the adaptive inertia competition and roulette wheel competition methods in current and future land use simulation models; it can better reveal the drivers of various types of LUCCs [52,53,54]. The RF (random forest) algorithm in the PLUS model can be used to estimate each land use type’s potential for development [55], and it can more precisely mirror the variations in the spatial distribution of land usage. Xu et al. [56] simulated the LUCC in the Yellow River Basin based on the PLUS model, with results indicating a simulation accuracy of 90% or higher. Xu et al. [57] used the PLUS model to simulate land expansion in the Hangzhou metropolitan area, with results indicating a simulation accuracy of 84% or higher. The InVEST model is widely used to estimate CS since it has fewer model parameters and requires less data [58]. At present, researchers have adopted quantitative modeling methods to study a series of impacts of LUCC on the carbon cycle, mainly including the “bookkeeping” model; the models allow for the calculation of base carbon stock data but do not allow for a comprehensive consideration of carbon cycling processes and changes in ecosystems [59]. For this, the CASA model is widely used, but data requirements are high and complex [60]. The InVEST model has low data requirements and dashes, and it can dynamically quantify the relationship between LUCC and CS [61]. Ma et al. [62] and Yan et al. [63] used the InVEST model to assess the impact of LUCC on CS, and the results of their studies provide a reference for the rational allocation of land resources at the local level. The InVEST model’s carbon module offers a quick and easy method for predicting CS and is frequently used for regional carbon estimation.
Some studies have shown that the trend of LUCC in the Yanqi Basin over the recent 50 years has been the substitution of cropland for grassland, resulting in a continuous change in the CS function of the terrestrial ecosystems in this area [64]. However, there has yet to be a systematic study of land use and CS change in the Yanqi Basin under various development scenarios. There is no research to fully understand the change rule of soil CS under different LUCC methods, and there is still a particular gap in understanding the mechanism of the impact of LUCC on CS [26,64]. Examining changes in LUCC and CS under different scenarios and analyzing the linkages between them can inform the rational allocation of resources. Therefore, this paper integrates and utilizes the PLUS and InVEST models to obtain the LUCC and the CS changes based on different scenarios. Consequently, this study first utilizes the land use data of the Yanqi Basin in 2000, 2010, and 2020 to analyze the current status of LUCC. It also explores the trends in quantity changes and spatial characteristics of land use types in the Yanqi Basin from 2000 to 2020 and examines the underlying natural and anthropogenic processes and mechanisms. Next, setting scenarios and selecting driving factors that influence LUCC as predictive variables, the PLUS model simulates and predicts the spatial distribution characteristics of land use in the Yanqi Basin for 2030, 2040, and 2050 under four different development scenarios. Lastly, the InVEST model evaluates the CS of terrestrial ecosystems under various scenarios and their spatiotemporal changes. This study helps to assess the impact of LUCC on CS in the ecosystem and quantify the correlation between LUCC and CS, thus providing data support for land use planning in the Yanqi Basin and increasing regional carbon sequestration. The specific research framework is shown in Figure 1.

2. Materials and Methods
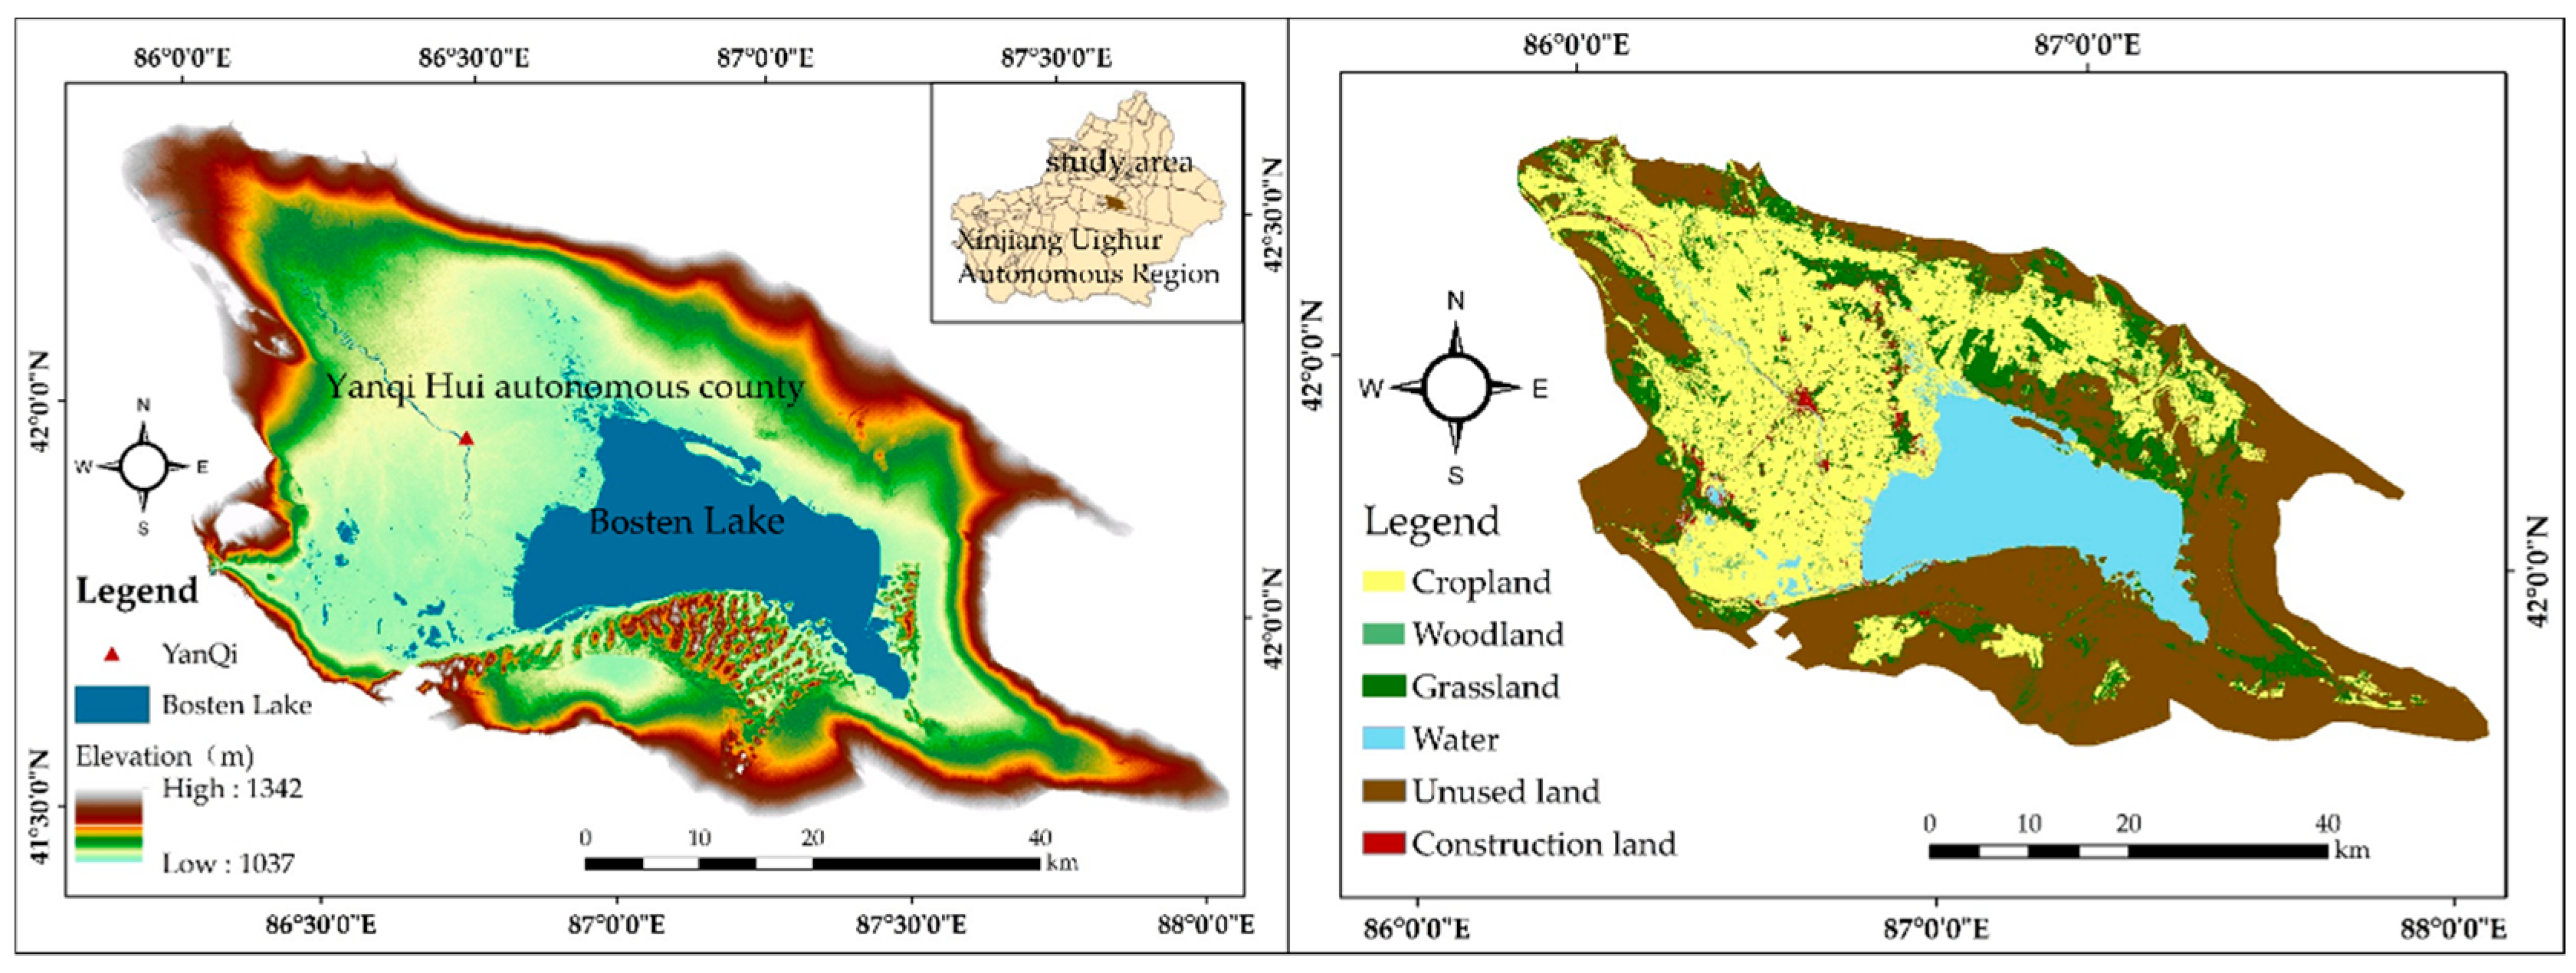
2.1. Study Area

The Yanqi Basin is situated in the northeastern region of Xinjiang’s Bayin’guol Mongol Autonomous Prefecture (41°40′~42°25′ N, 85°55′~87°26′ E), located within the Tarim Basin of Xinjiang, between the Tianshan and Kunlun Mountains [64], with the precise geographic location being shown in Figure 2. The Yanqi Basin is roughly 80 km wide vertically in the north–south direction and 170 km long horizontally in the east–west direction; the basin’s elevation is about 1200 m high at the edge and low in the middle, with the lowest level of Bosten Lake being at about 1047 m above sea level. The Yanqi Basin belongs to the warm temperate continental arid and semi-arid climate [27]. The long-term range of precipitation is 76.27~200.25 mm, the average annual temperature of the mountains and oasis areas is −4.8~8.6 °C, and potential evapotranspiration is 1294.8~1551.3 mm [65]. Because of its rich light and heat resources, local agriculture and fishery have become a high-quality industry [66]. In February 2021, the Bayin’guoleng Mongol Autonomous Prefecture government proposed several initiatives in response to China’s “dual-carbon” goal to optimize the spatial pattern of the land, control carbon emissions, and improve CS. In the long term, sensible resource allocation is crucial to achieving sustainable growth, considering the advantages of available resources [27,65].

2.2. Data Sources

The PLUS model requires data on land use and driving factors. The land use data were extracted from the land use coverage dataset spanning from 1985 to 2020—which is available at (https://doi.org/10.5194/essd-13-3907-2021, accessed on 11 April 2022)—were compiled by Prof Huang Xin’s team at Wuhan University, and had a spatial resolution of 30 m. The driver data used included socio-economic data (GDP, population density, and nighttime lighting) and natural environmental data (temperature, precipitation, dryness, soil type, and erosion intensity) (all at 1 km spatial resolution), which were acquired from the Data Center for Resource and Environmental Sciences of the Chinese Academy of Sciences (https://www.resdc.cn/, accessed on 20 April 2022). DEM data were derived from Geospatial Data Cloud (https://www.gscloud.cn/, accessed on 20 April 2022) (30 m spatial resolution). DEM data were used to calculate the slope. The data that were needed for the road network, water system, and government points were obtained from Open Street Map (https://openmaptiles.org/, accessed on 20 October 2022), and the traffic factor data were acquired by using ArcGIS Euclidean distance calculation; the above data were projected, transformed, and resampled to develop the ultimate required dataset. Carbon density data needed for InVEST were obtained from the literature and corrected based on previous research results [67,68].

2.3. Methods

The research structure of this study consists of three main parts. First, the current situation of LUCC and CS in the Yanqi Basin will be analyzed to comprehensively understand the actual distribution of LUCC and CS in the basin. Secondly, future development scenarios will be constructed, the PLUS model will be utilized to predict future land development, and the spatial distribution of land type will be simulated across various scenarios. Finally, the InVEST model will be used to estimate the spatial and temporal distribution of CS in the study area and to explore the impacts of LUCC on CS.

2.3.1. Land Use Dynamic Index

Land use dynamic K is utilized to characterize the extent and speed of change of a specific land use type at a particular point in time, and it is frequently employed to forecast future trends in LUCC [69,70]. It can be calculated using the following formula:
K = U b U a U a × 1 T × 100 %
Ua and Ub denote the land use type’s area at the start and the end of the study, and T is the period of the study.

2.3.2. LUCC Simulation Projections Based on the PLUS Model

The Markov model is a mathematical, statistical model based on transfer probability, which is a standard method for analyzing a present condition and changing trend [71]. LUCC characteristics also have more obvious Markov characteristics [72,73]. The PLUS model combines the Land Expansion Analysis Strategy (LEAS) model with the CA model to simulate LUCC [74]. It can generate land use simulations from the patch level, explore the factors influencing land use, and unveil each land use type’s changing patterns and development potential [75]. Prior research has demonstrated that the PLUS model can accurately simulate the spatial distribution of land use [76,77].

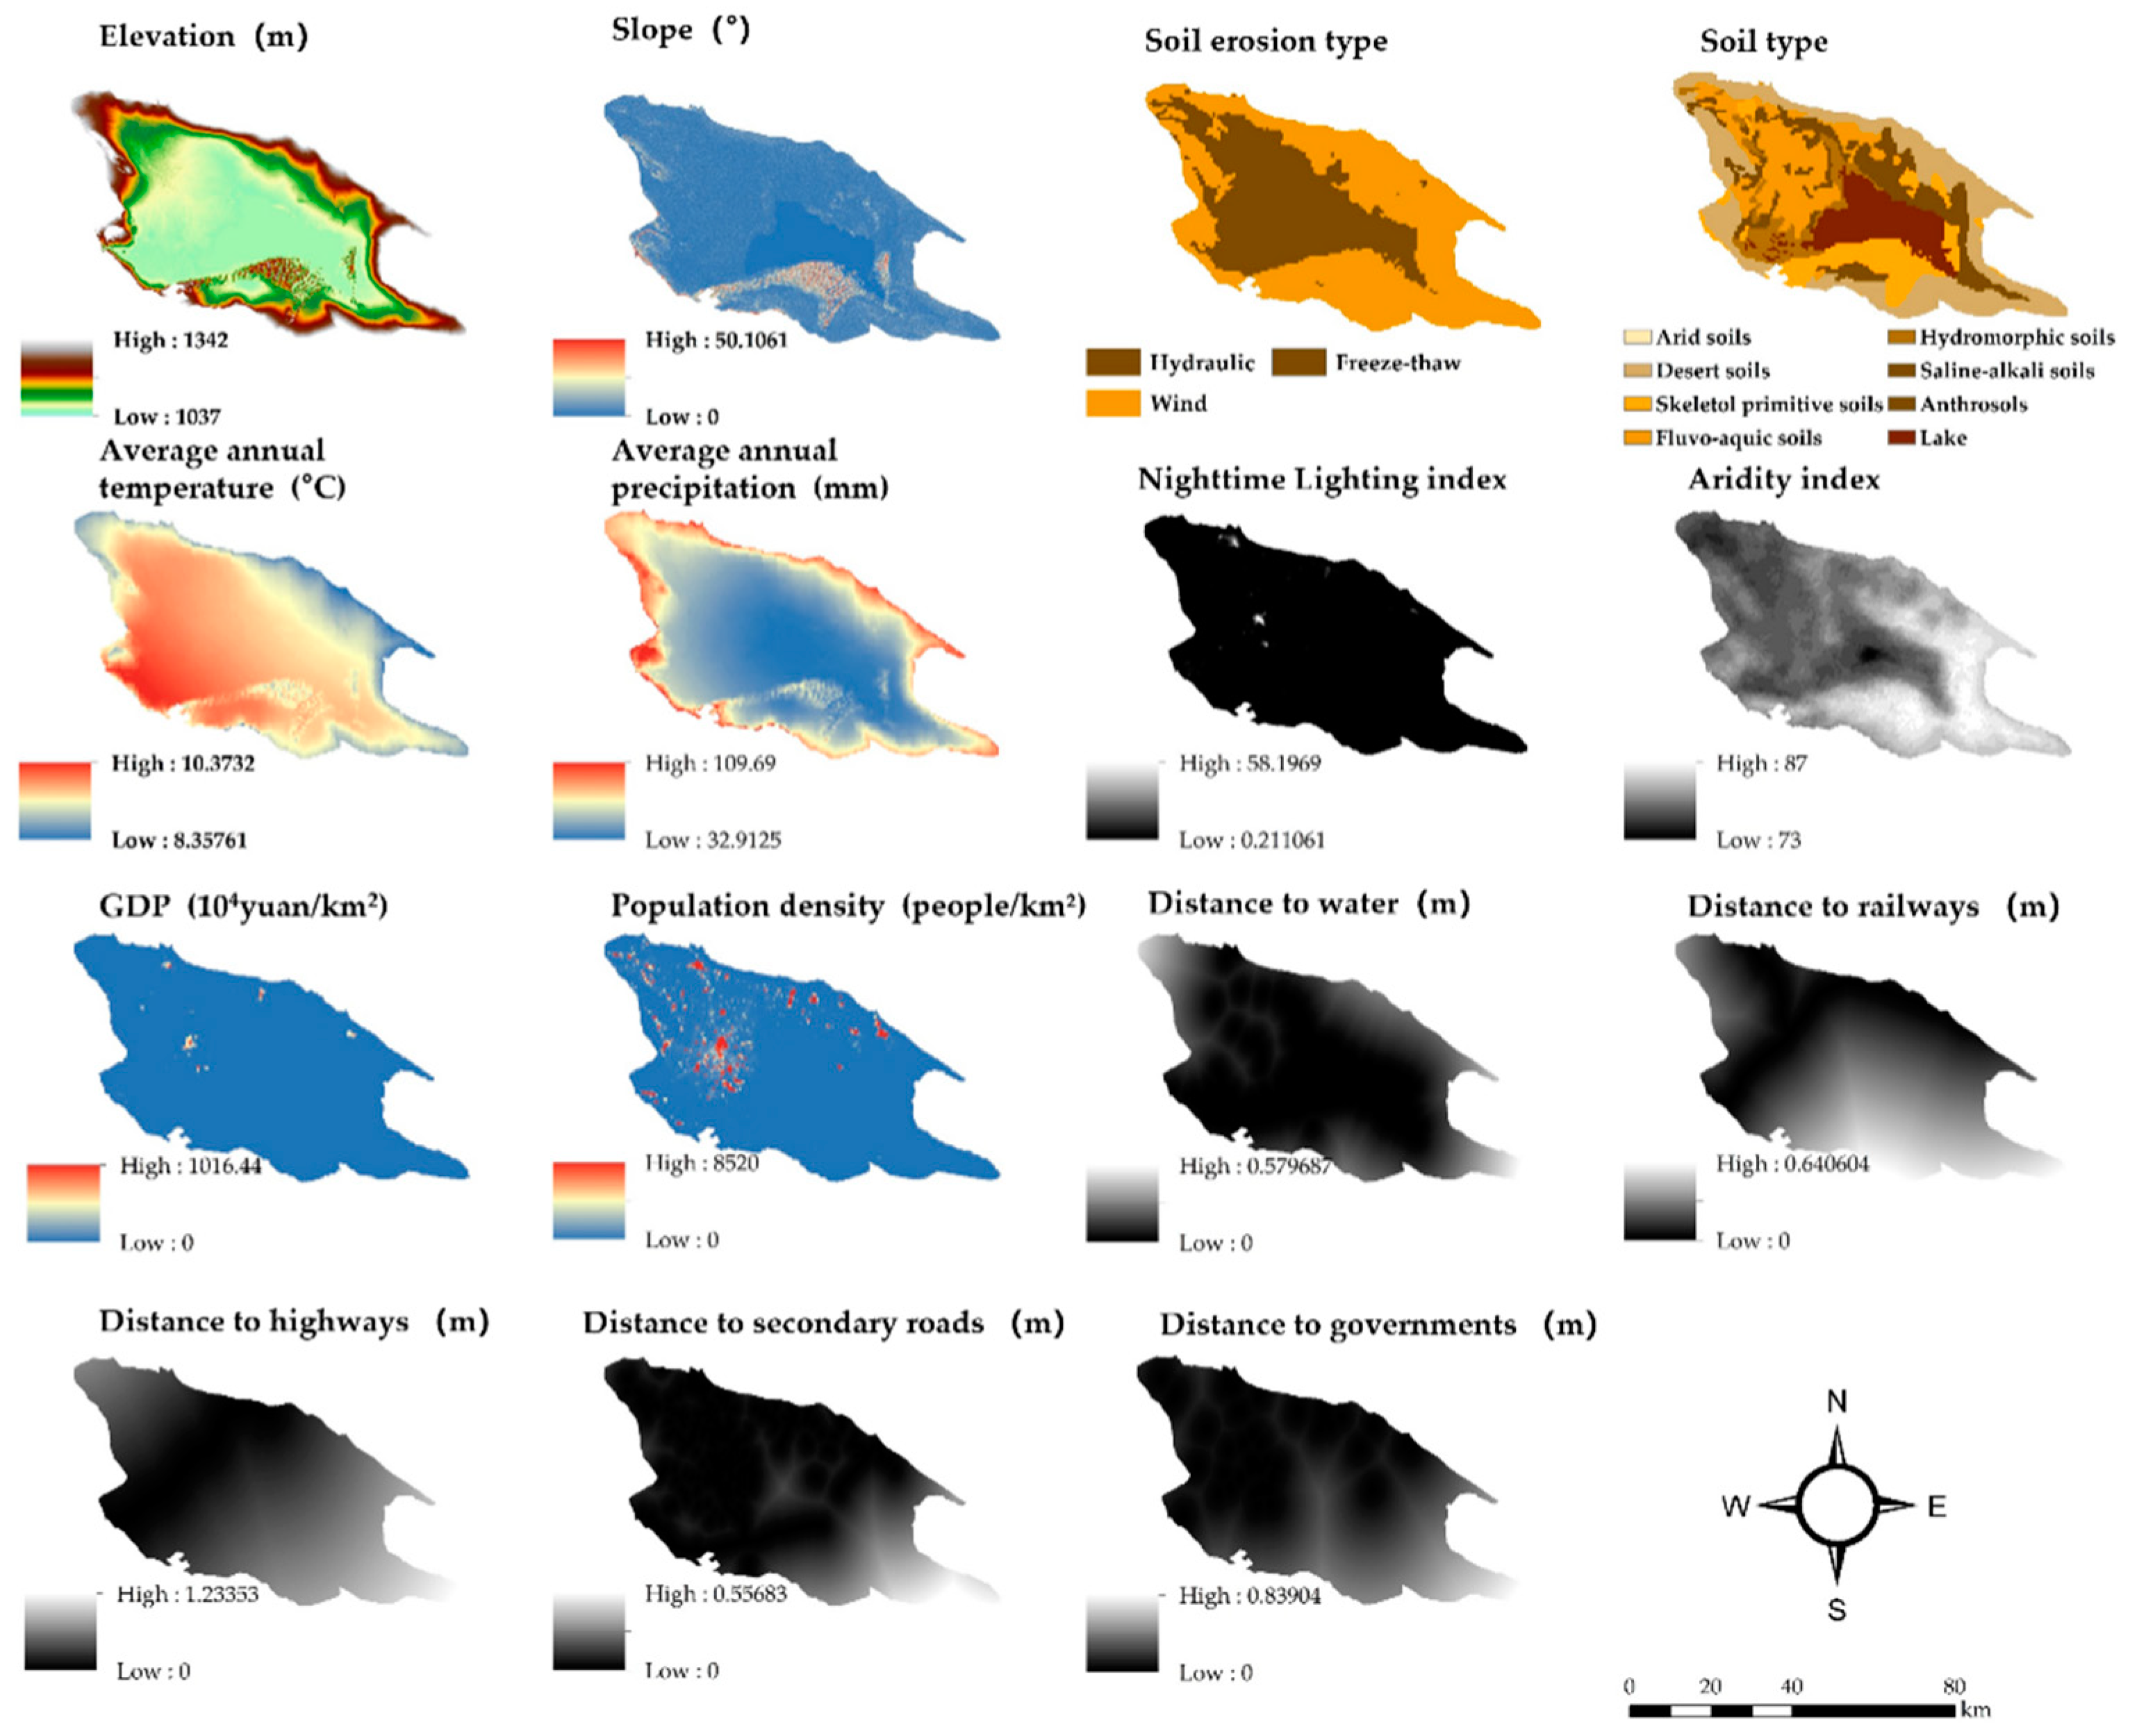
Selection of Driving Factors

Driving factors are the dominant factors influencing LUCC. Based on the current status of LUCC in the Yanqi Basin, 15 driving factors were selected based on the literature and previous studies [64,78,79,80]—as shown in Figure 3—including temperature, precipitation, elevation, slope, soil type, soil erosion, GDP, population density, night light, aridity index, distance from secondary roads, distance from railroads, highway, distance from rivers, and distance from governmental points. The contribution of each driver was analyzed when predicting simulated LUCC.

Domain Weights (Parameter)

Domain weights reflect each land type’s expansion capacity, with a parameter ranging from 0 to 1, and the closer it is to 1, the stronger its capability for expansion [53]. The expression is as follows:
W i = TA i TA min TA max TA min
Wi is the domain weight of land type i, TAi is the area of land use of type i, TAmin is the minimum expansion area of every kind of land use, and TAmax is the maximum expansion area of each type of land use. The domain weights were set with the LUCC from 2000 to 2020 in the study area (Table 1).

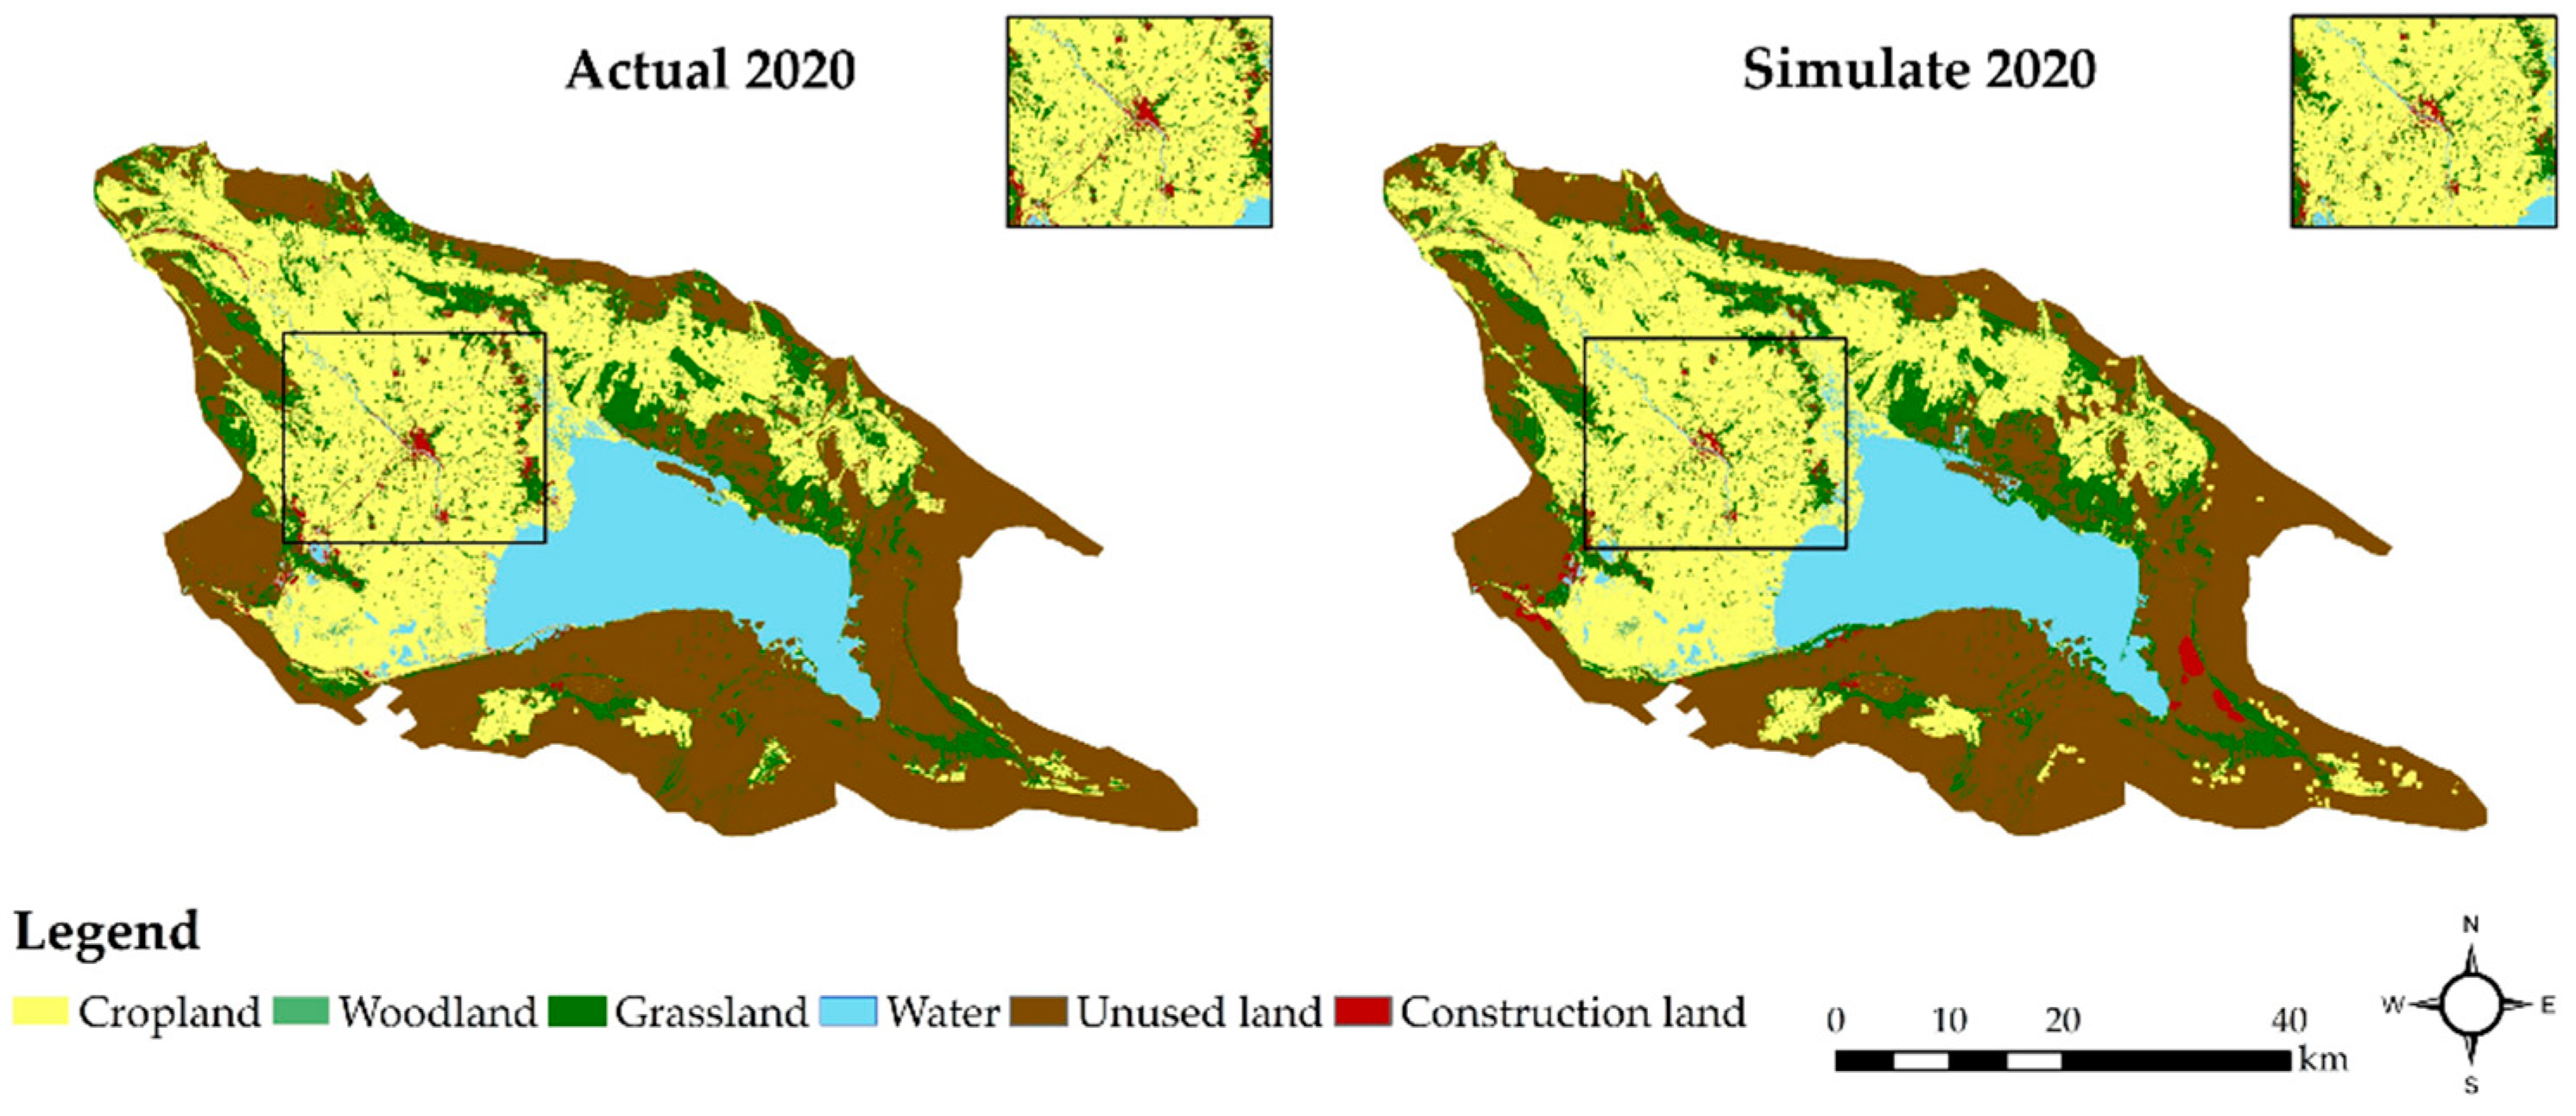
PLUS Model Accuracy Validation

In this study, to ensure the accuracy of the prediction results, the Kappa coefficient and overall accuracy were used to evaluate the accuracy of spatial land use simulation [81]. First, the probability of land class development was determined using land use data from the Yanqi Basin from 2000 to 2010. Next, The PLUS model predicted the land use results for 2020, using 2010 as the reference year, and compared it to the actual 2020 Yanqi Basin land use data (Figure 4). After the accuracy assessment, the PLUS model’s Kappa was 0.83. Overall accuracy was 0.88, indicating good application and simulation accuracy at the Yanqi Basin scale.

Future Development Scenario Setting

Based on the overall requirements of the Xinjiang Uygur Autonomous Region’s land space action plan to implement the national objectives and strategies and to realize the overall goal of land spatial planning that prioritizes security, ecology, high level of openness, high quality of life, and high efficiency of governance, this study sets up four development scenarios, considering the current circumstances in the Xinjiang region. This study predicts the changes in land use patterns in the Yanqi Basin by 2030, 2040, and 2050 under different scenarios. It is expected to provide reasonable development suggestions for the Yanqi Basin from the scenario analysis process.
(1) Natural development scenario (NDS). In this scenario, the land use development pattern does not restrict the interconversion of all types of land use, and a change scenario that does not involve government and market intervention is consistent with the historical land use change trend.
(2) Ecological protection scenario (EPS). This scenario mainly considers the development of an ecological environment. It implements and practices the primary goal of Xinjiang’s territorial spatial planning, focuses on environmental security, and reduces the probability of transferring ecological land to other land. Moreover, it reduces the likelihood of converting woodland and grassland to construction land by 50%, reduces the possibility of converting cropland to construction land by 30%, and increases the probability of converting construction land to woodland and grasslands by 10%.
(3) Cropland protection scenario (CPS). This situation ensures the preservation of cropland and safeguards it by limiting the conversion of cropland into other types of land, reducing the probability of converting arable land to building land by 60%. The main crops in the Yanqi basin are cotton, wheat, and corn, which guarantee regional food security.
(4) Urban development scenario (UDS). This scenario considers the local economic development, limits construction land transfer to other types of land, and makes every effort to develop the economy and expand construction land. Further, it increases the probability of converting cropland, woodland, and grassland to construction land by 20% and decreases the likelihood of converting construction land to woodland, grassland, unused land, and water by 30%.

2.3.3. Ecosystem CS Assessment Based on the InVEST Model

The InVEST model was jointly developed by Stanford University, The Nature Conservancy (TNC), and the World Wide Fund for Nature (WWF) [82]. The InVEST model is mainly used to evaluate the ecosystem service function and economic value, and can assist with decisions for ecosystem management, including CS, habitat quality, and other panels, which are widely used [83,84,85,86,87]. The InVEST model’s biggest advantage over previous ecosystem service function assessment methods is the visual expression of the assessment results, which solves the problem of previous ecosystem service function assessments not being intuitive enough because they had to be expressed in words when drawing up an abstract [88,89,90,91]. In this study, we mainly used the running CS module of the InVEST model to predict and estimate CS within the research domain.

CS Formula

The CS module of the InVEST model requires the user to input different types of carbon density data for different land use types, and then the CS module summarizes the amount of carbon stored in the four carbon pools based on the carbon density data of different land use types and the land area provided by us [92,93,94]. CS [95] is measured by the CS module using the following formula:
C i = C a + C b + C s + C d
CS total = i = 1 n C i × S i
Ci denotes total carbon intensity for land use type i. Ca is the carbon density of above-ground vegetation for land use type i; Cb is the carbon density of below-ground living roots for land use type i; Cs is the carbon density in the soil for land use type i; and Cd is the carbon density of dead organic matter for land use type i. At the same time, this study does not consider the carbon density of dead organic matter due to their small proportion in the carbon pool. CStotal denotes the total amount of CS; Si represents the total area of land use type i; and n denotes the total number of land use types.

Carbon Density Correction

Carbon density values vary with climate, soil properties, and land use [96,97,98]. Therefore, the correction formulae for carbon density were chosen based on the principle of high generalization and similar climatic conditions to correct carbon density at the national level [99,100,101,102,103]. The relationship between annual precipitation and biomass and soil carbon density was based on Equation (5) from Alam et al. The equation only examined the impact of precipitation on soil carbon density because the association between air temperature and soil carbon density was substantially lower than precipitation [104]. The relationship between mean annual temperature and biomass carbon density was based on Equations (6) and (7) from the research of Giardina et al. [105].
C s p = 3.3968 × M A P + 3996.1 ( R 2 = 0.11 )
C B P = 6.798 × e 0.0054 × M A P ( R 2 = 0.70 )
C B T = 28 × M A T + 398 ( R 2 = 0.47 ,   p < 0.01 )
where CSP is the soil carbon density based on annual precipitation (t/m2); CBP and CBT are the biomass carbon densities based on annual precipitation and annual temperature (t/m2), respectively; MAP is the mean annual precipitation (mm); and MAT is the mean annual air temperature (°C).
K B P = C B P C B P K B T = C BT C BT
K B = K B P × K B T
K S = C S P C S P
In the formula, KBP and KBT are the correction coefficients of the precipitation factor and temperature factor for biomass carbon density, respectively. KB and KS are the correction coefficients of biomass carbon density and soil carbon density, respectively. C′ and C″ indicate relevant carbon density data for the study area and the country. A description of carbon density data in the national study area used to obtain carbon density data in the Yanqi Basin is shown in Table 2.

3. Results

3.1. Analysis of Historical Patterns of LUCC and CS Changes in the Yanqi Basin

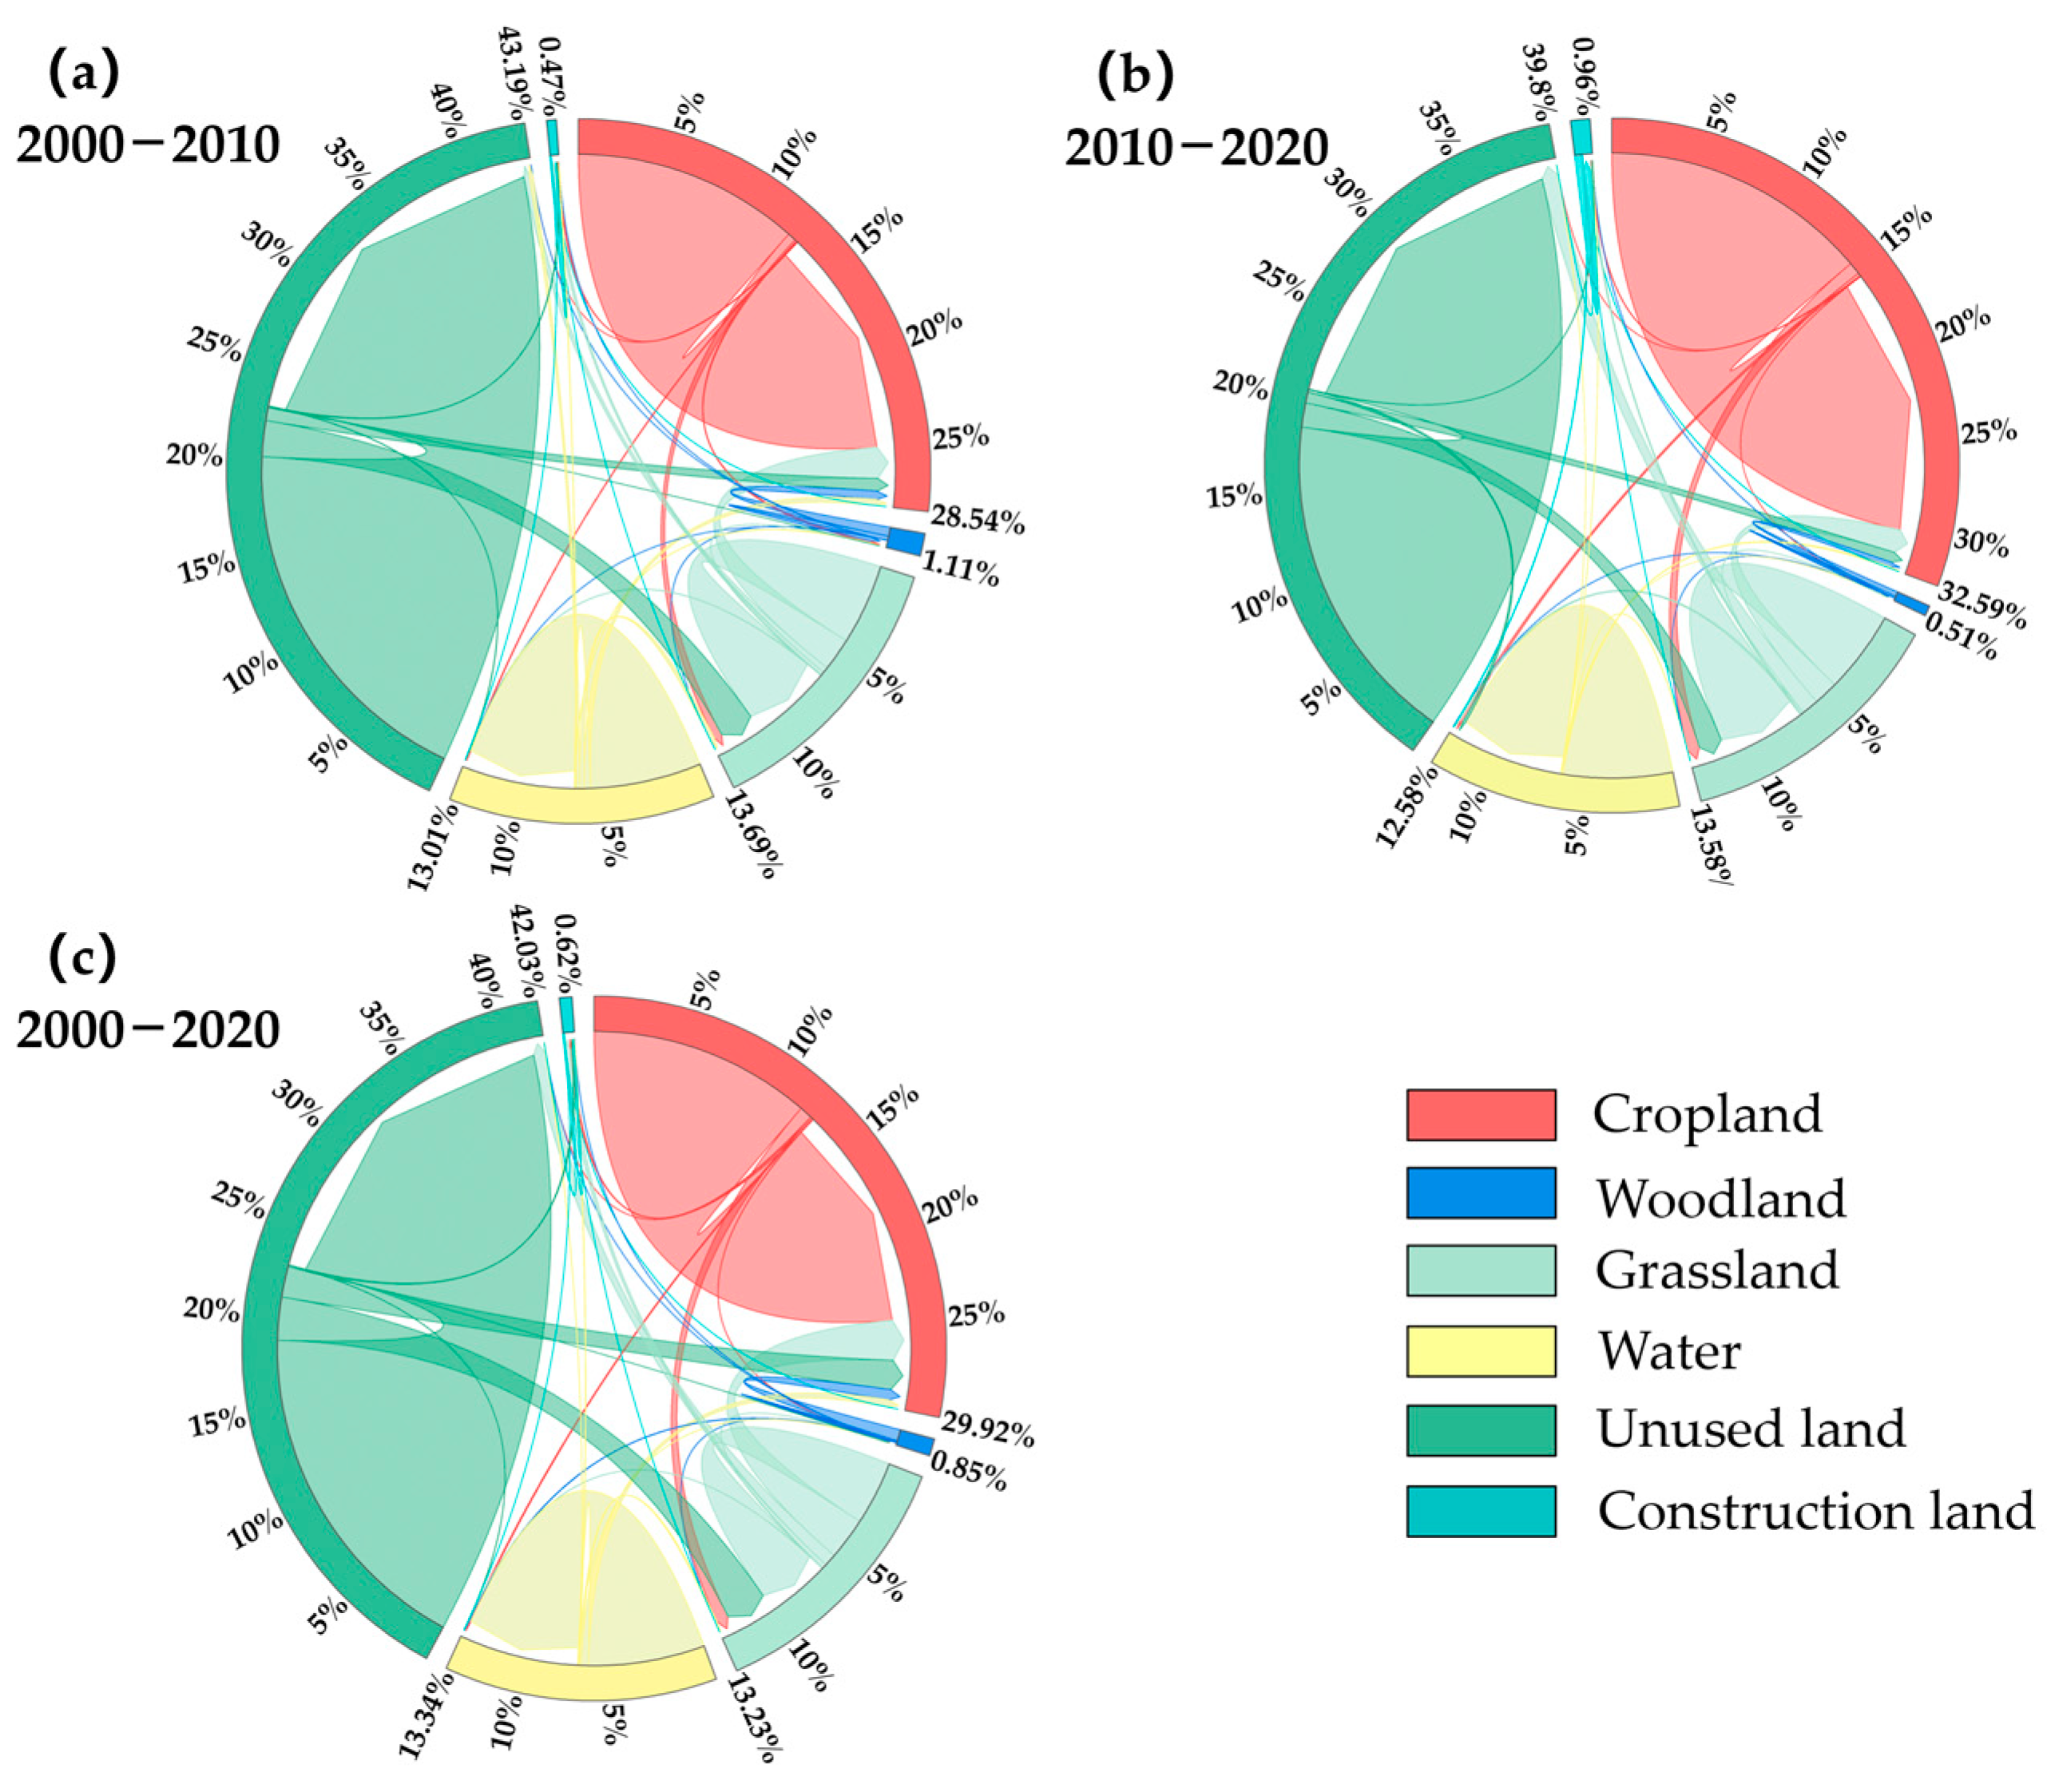
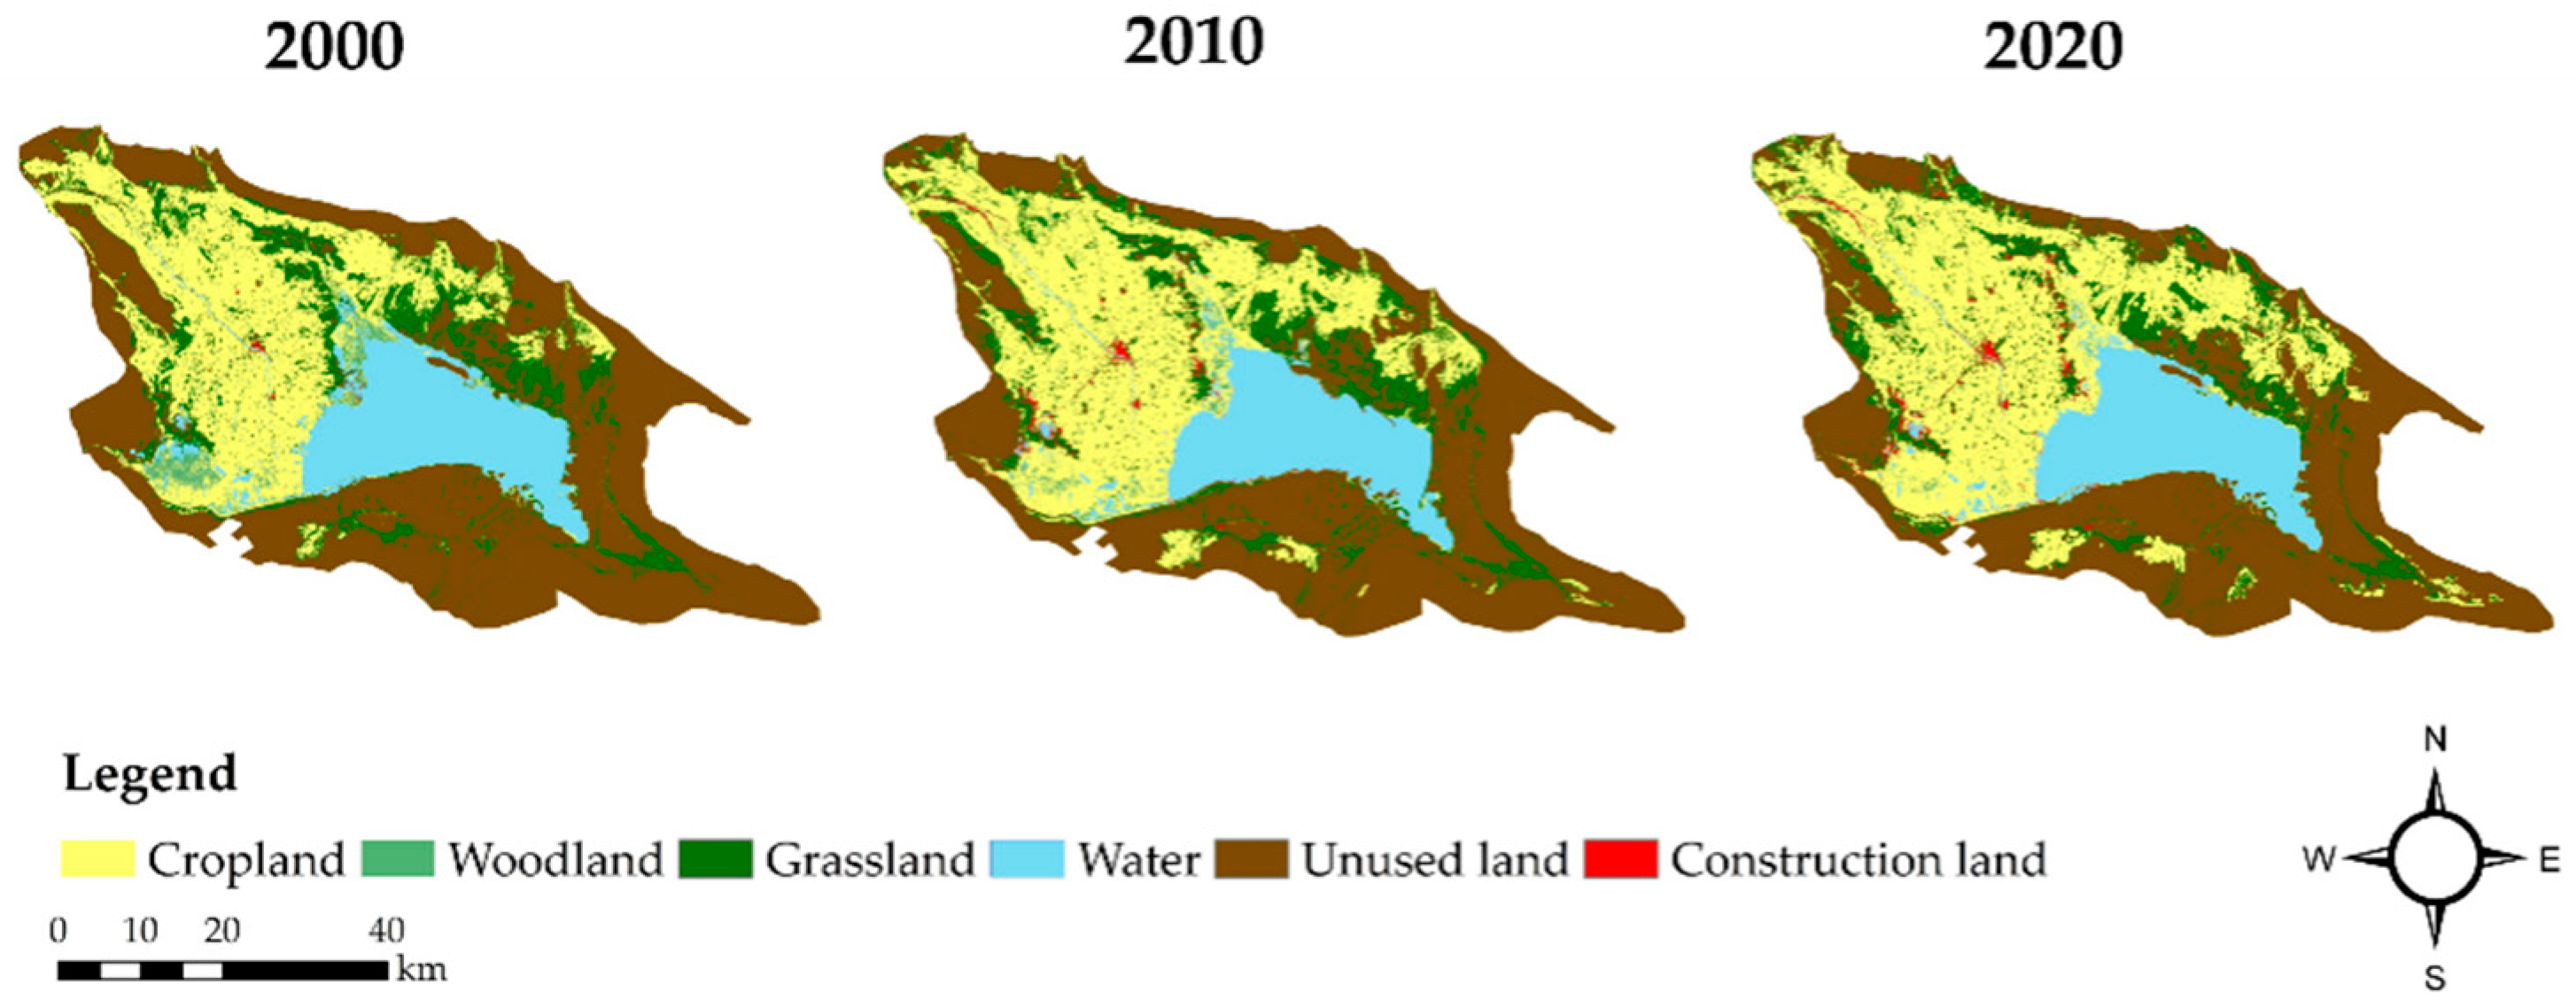
3.1.1. Analysis of Spatial and Temporal LUCC in the Yanqi Basin from 2000 to 2020

The changes in land use areas over the three periods of 2000–2010, 2010–2020, and 2000–2020 were determined by analyzing the land use data of the Yanqi Basin from 2000 to 2020 (Table 3) (Figure 5). Over these 20 years, various land types in the Yanqi Basin changed, with cropland construction land increasing and other land types decreasing. The cropland area increased by 675.02 km2, representing 33.98% of the total area, and the K-value was 1.57%. The primary factor contributing to the expanding extent of cropland was the steady rise in people’s demands for production and living necessities. The construction land area increased by 80.61 km2, representing 1.1% of the total area, and the K-value was 36.37%. Unused land decreased by 564.94 km2, which was the most significant and most noticeable change in each category. The number of other kinds of land transferring in and out was insignificant. In 2000, cropland, woodland, grassland, water, unused land, and construction land accounted for 25.87%, 1.45%, 13.35%, 13.77%, 45.42%, and 0.13% of the area, respectively. In 2020, the corresponding percentages were 33.98%, 0.25%, 13.12%, 12.91%, 38.64%, and 47.2%, respectively. Woodland had the most significant change during 2010–2020, and this expansion was also influenced by economic development. During these 20 years, the K-value for land categories with an increased area was construction land > cropland; the K-value for land categories with a decreased area was woodland > unused land > water > grassland.
The land use transfer matrix describes the shifting number of land use categories over a specific period. It is represented as a two-dimensional matrix that showcases the changing patterns during the period and the interchanging dynamics between the different land use classes. Figure 6 presents the land use transfer changes in the Yanqi Basin during 2000–2010 (a), 2010–2020 (b), and 2000–2020 (c). The values in the figure represent the percentage of land transferred, and the thickness of the transfer line in the center represents the size of the transferred area; the thicker the transferred area, the more significant it is. The transfer trends between 2000–2010 and 2010–2020 are consistent. In the Yanqi Basin, mutual transfers between cropland, grassland, and unused land dominate. Furthermore, although the amount of transfer is limited, it is essential to note the transfer of woodland and grassland to cropland as well as the phenomenon of decreasing land area due to the destruction of woodland, grassland, and watersheds in the process of urbanization. This phenomenon is detrimental to the environmental security of the Yanqi Basin. To guarantee that Yanqi Basin’s land resources are used rationally, it is necessary to protect natural elements such as water, woodland, and grassland.
From the perspective of spatial differentiation, the distribution of land classes in the Yanqi Basin shows heterogeneity, as shown in Figure 7. The central area is mainly concentrated in cropland and construction land and shows a pattern of rapid expansion. The distribution of woodland is relatively sparse, mainly in the southwestern corner and the northern edge of Lake Bosten. Meanwhile, grassland is distributed on Bosten Lake’s north and south sides. As cropland and construction land expanded, the grassland area also shrank. The unused land is dispersed in a ring-like arrangement around the edge of the research area.

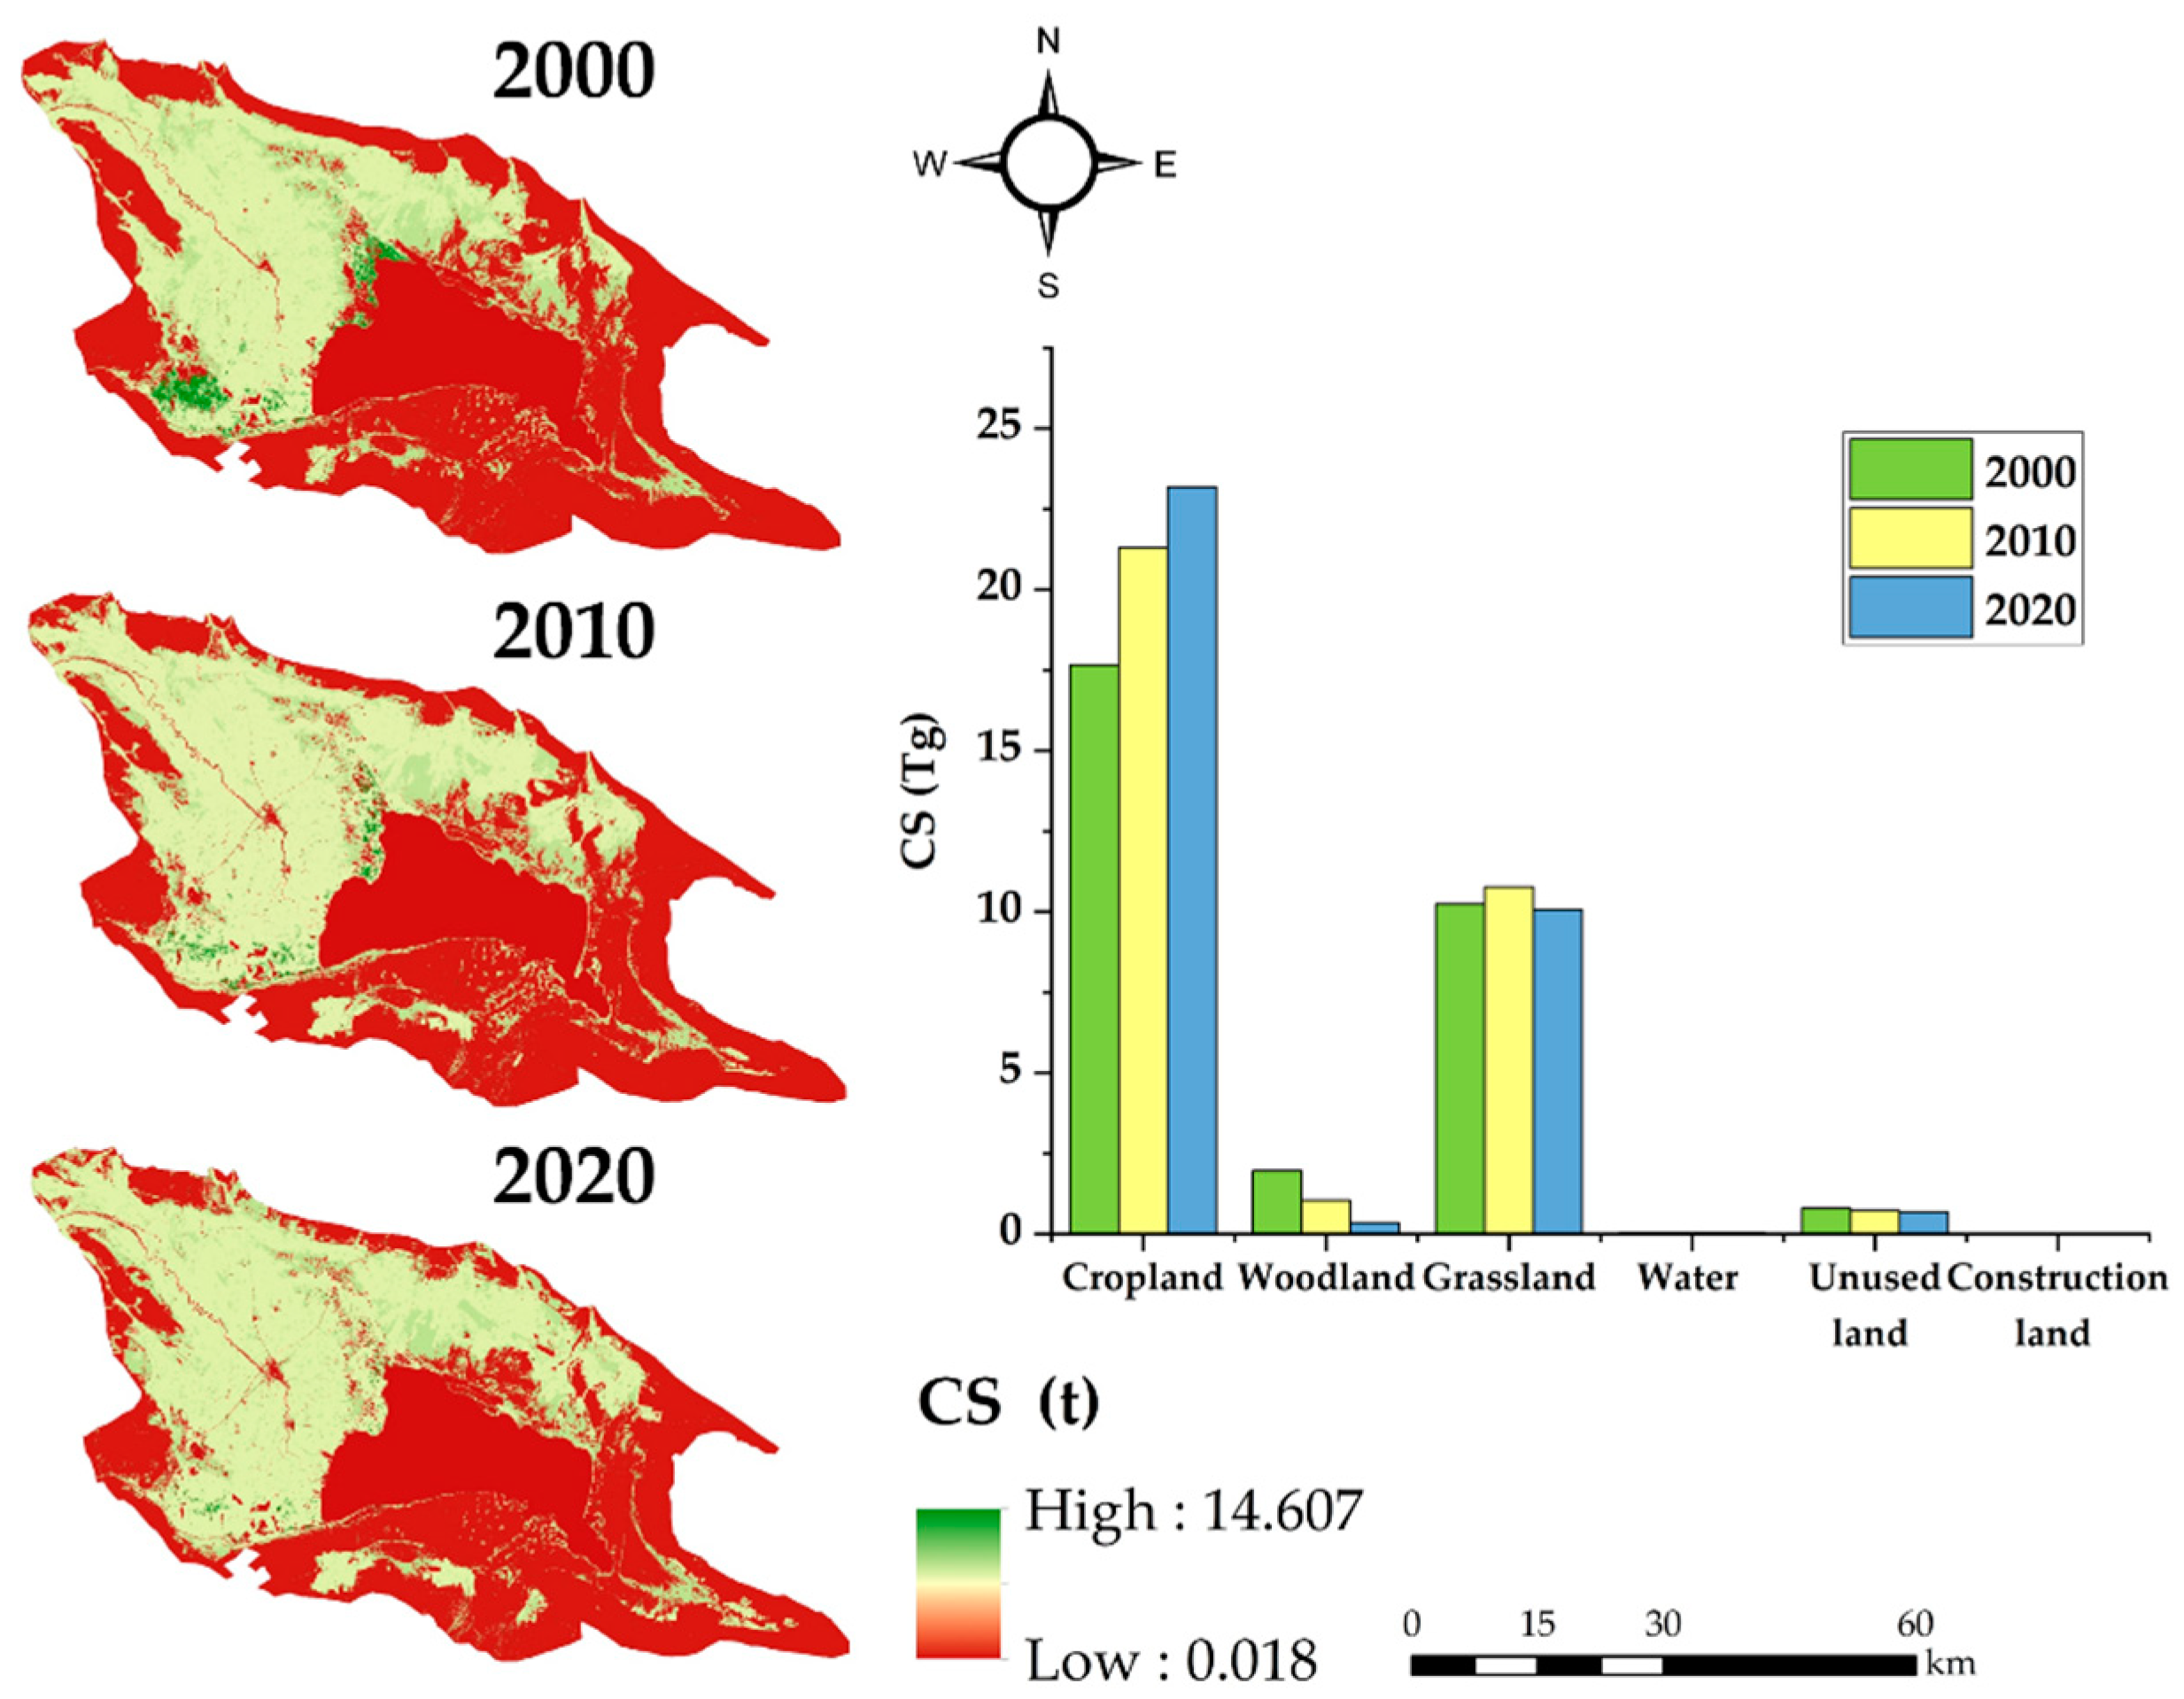
3.1.2. Analysis of Spatial and Temporal Variation of CS in the Yanqi Basin from 2000 to 2020

Based on the land use data from 2000 to 2020, the CS in land classes was calculated using the InVEST model. The total CS in the Yanqi Basin in 2000, 2010, and 2020 were 30.68 Tg, 33.84 Tg, and 34.30 Tg, respectively, demonstrating an overall upward trend, with a sharp decline in CS in 2015 and a recovery in 2020, as shown in (Figure 8). The average annual CS per unit area varied considerably among various land classes. The land categories with the largest to most minor average yearly CS per unit area were woodland, grassland, cropland, unused land, water, and construction land, and the largest annual average CS per unit area was 0.02 Tg. In contrast, the smallest one was 0.2 × 10⁻⁴ Tg. From the time distribution, the CS of cropland and construction land demonstrated a rising tendency, and the woodland and unused land demonstrated a declining pattern. The CS of grassland exhibited a pattern of initial increase followed by a decline, while that of water showed a decline, followed by a rise. Regarding spatial distribution, the regions where the land categories with more prominent CS are concentrated are generally the areas with high values of CS; for example, the area where the woodland in the southwest is located shows high values of CS. Regions where land types with smaller CS are concentrated are generally areas with low CS; for example, the central region where construction land is located has low CS. This also shows that changes in the structure and function of land use greatly influence the changes in CS.

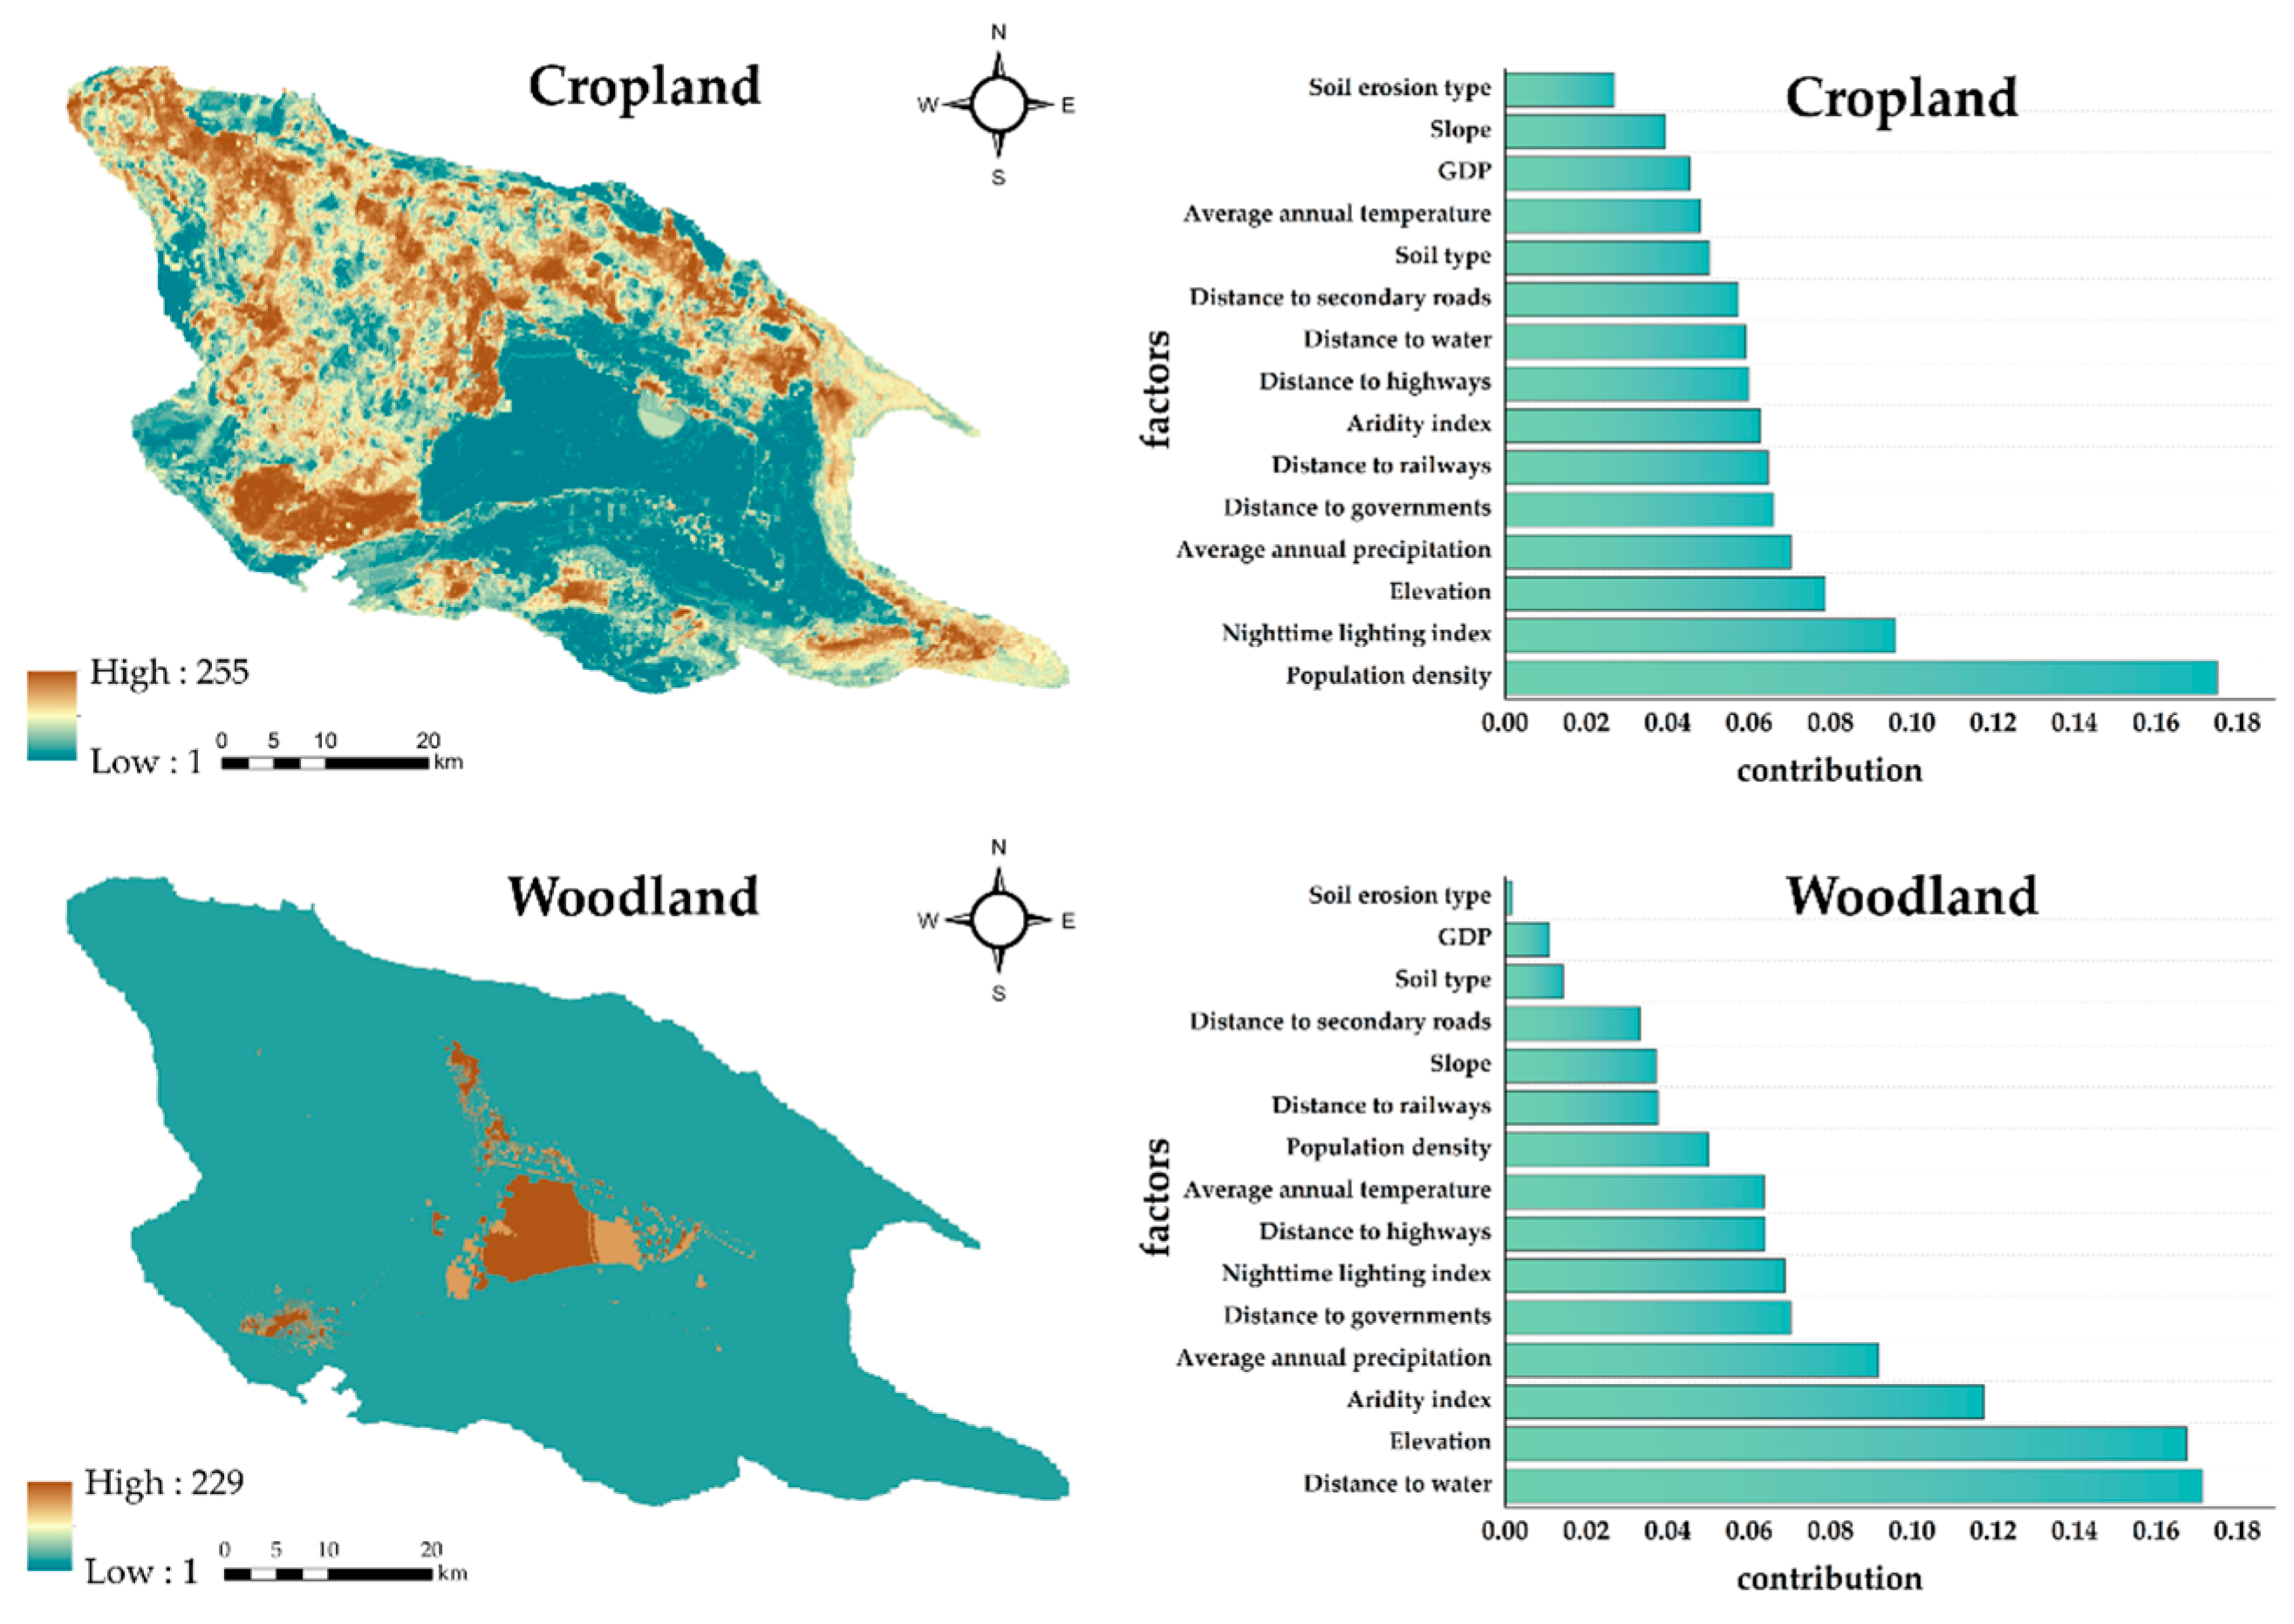
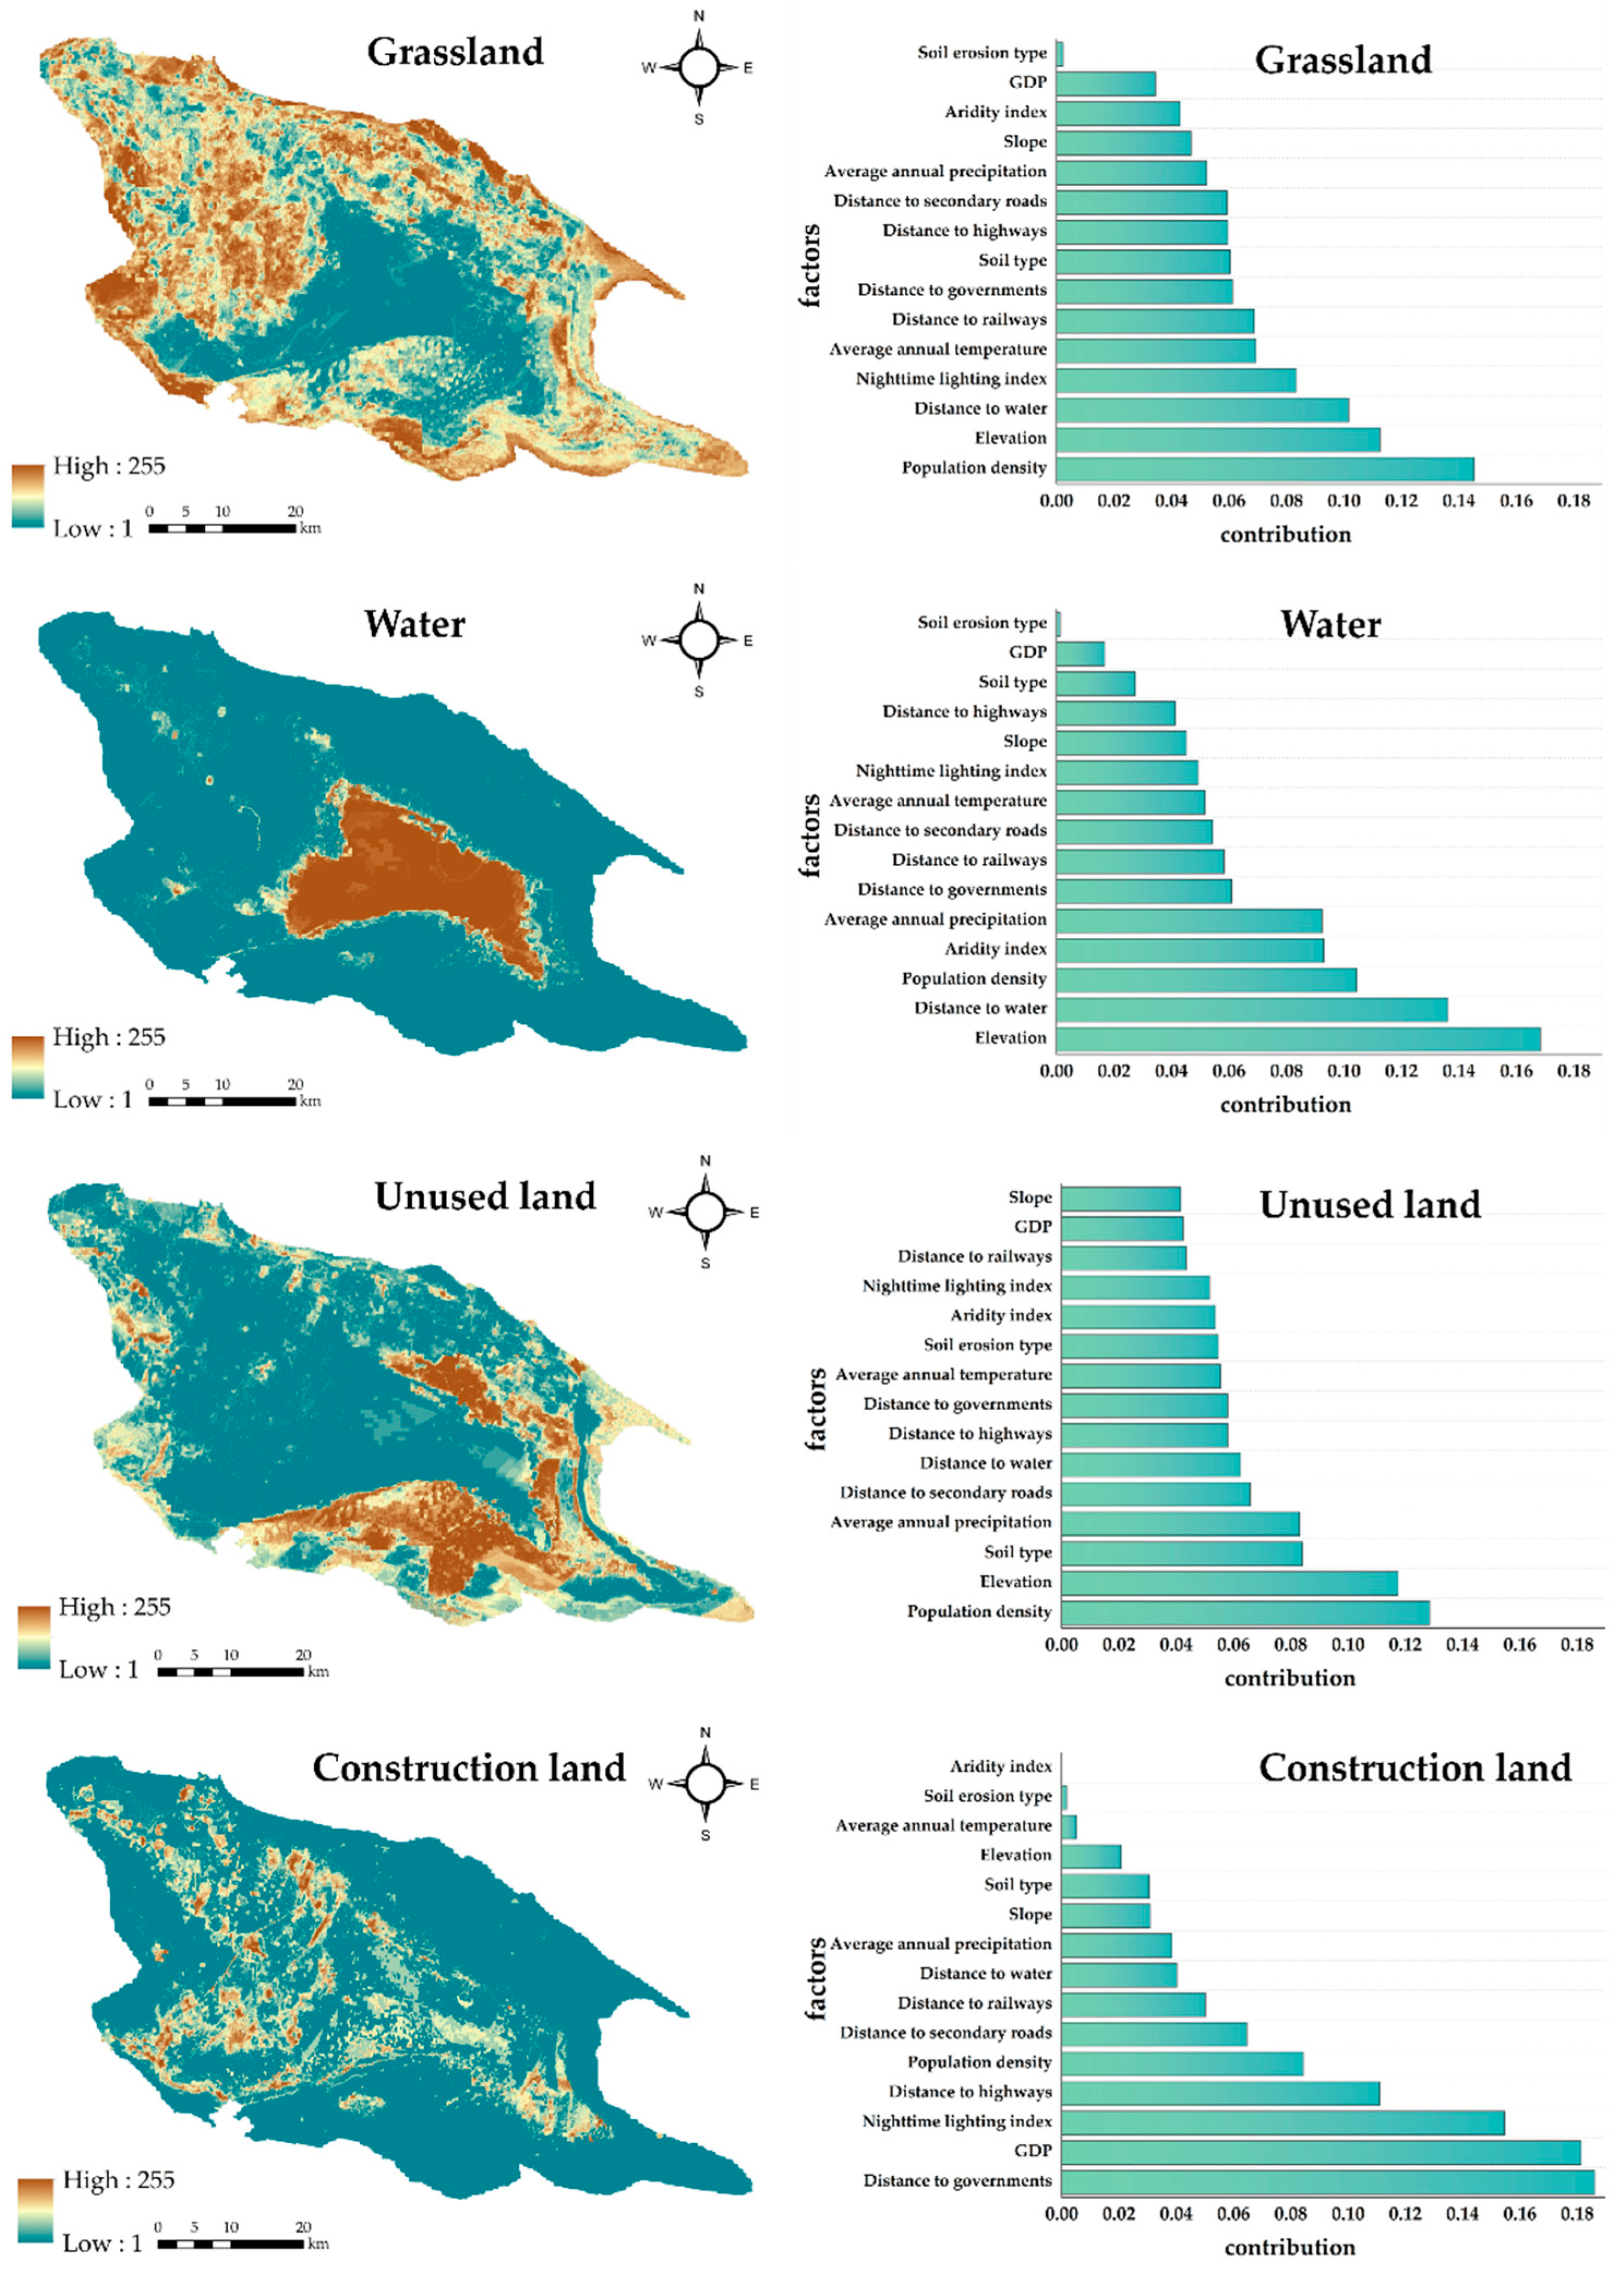
3.1.3. Analysis of the Contribution of Drivers in the Yanqi Basin from 2000 to 2020

Based on the land use data from 2000 and 2020, using the LEAS analysis in the PLUS model, the spatial development potential of six land types is shown in Figure 9, and the contribution of driving factors to the expansion of the six land types is shown in Figure 9. The RMSE analysis of the model shows a value of around 0.1, which aligns with the error range. The results have a high degree of accuracy. The graph indicates that the population density significantly influences cropland, grassland, and unused land with the highest contribution The driver with the most significant influence on water is elevation. In contrast, the most critical impact on woodland is the distance to water, and the distance to government points and GDP are the drivers with the highest contribution to construction land. The influence of driving factors on land use expansion is more apparent, and selecting appropriate driving factors can help improve the accuracy of land use prediction.

3.2. Multi-Scenario Simulation Prediction of LUCC in the Yanqi Basin Based on PLUS Modeling

The study area uses the 2020 Yanqi Basin land use data as the base data. Four development scenarios are set up to predict the spatial and temporal LUCC in 2030, 2040, and 2050, as shown in Figure 10. Under the NDS, other driving factors and policies do not affect it. Cropland and construction land show an increasing trend, and the cropland area is predicted to be 3000.22 km2, 3137.31 km2, and 3252.89 km2 in 2030, 2040, and 2050, respectively. Construction land is predicted to be 113.05 km2, 132.38 km2, and 150.08 km2 in 2030, 2040, and 2050, respectively. Every other land category exhibits a downward trajectory, which is consistent with the historical development from 2000 to 2020. Under the EPS, the main focus is afforestation, combating land desertification, and preventing soil erosion. In this scenario, the areas of woodland, grassland, and water show an upward trend, predicting to increase by 0.83 km2, 566.17 km2, and 5.75 km2, respectively, by 2050. The other land categories expand slower and decrease in area under the scenario, the conversion rate of each land type to construction land can be slowed down, and the ecological environment is significantly improved. Under the CPS, the cropland is the largest, with the protection of cropland being the main focus, and the area is projected to reach 3258.07 km2 in 2050, an increase of 427.35 km2 compared with 2020. Under the UDS, the economy is vigorously developed, and the area of the city is constantly expanding. Overall, the construction land is growing uncontrollably, increasing by 52.92 km2 compared to 2020. Moreover, in this simulation, woodland and unused land decrease more drastically.
Based on land use data from 2020, this study predicted LUCC in the Yanqi Basin for 2030, 2040, and 2050 under several scenarios (Figure 11). The spatial distribution of each category under various scenarios was determined to be consistent with the historical period when compared to the land use pattern in 2020. Specifically, cropland is primarily distributed in the north-central and west-central regions, with sporadic distribution in the southern region; woodland is distributed in the southwestern region; grassland is more dispersed; and unused land is distributed on the edge of the study area and around lakes. Overall, the spatial distribution of land use from 2000 to 2020 did not change significantly. From the figure, it can be seen that from all four development scenarios, cropland shows a significant expansion trend. In the middle portion of the study region, grassland and woodland are significantly reduced due to the fast spread of cropland. Under the NDS, it is increasingly evident that construction land is expanding. Within the EPS, grassland and woodland are significantly expanded around the construction land and near the area’s northernmost portion, but the overall spatial distribution characteristics remain consistent. At the same time, unused land in the northern part of the region is converted to grassland in large quantities, and the expansion trend of grassland is more significant. In the cropland development scenario, cropland expansion is substantial; in the EPS, the expansion of woodland and grassland is more prominent, while the contraction of unused land is also relatively apparent. In contrast, under the UDS, the construction land area in the Yanqi Basin demonstrates a notable upward trend, expanding from the center to the periphery. In summary, ecological and cropland protection is influential in realizing the region’s sustainable development of a green economy with class expansion.

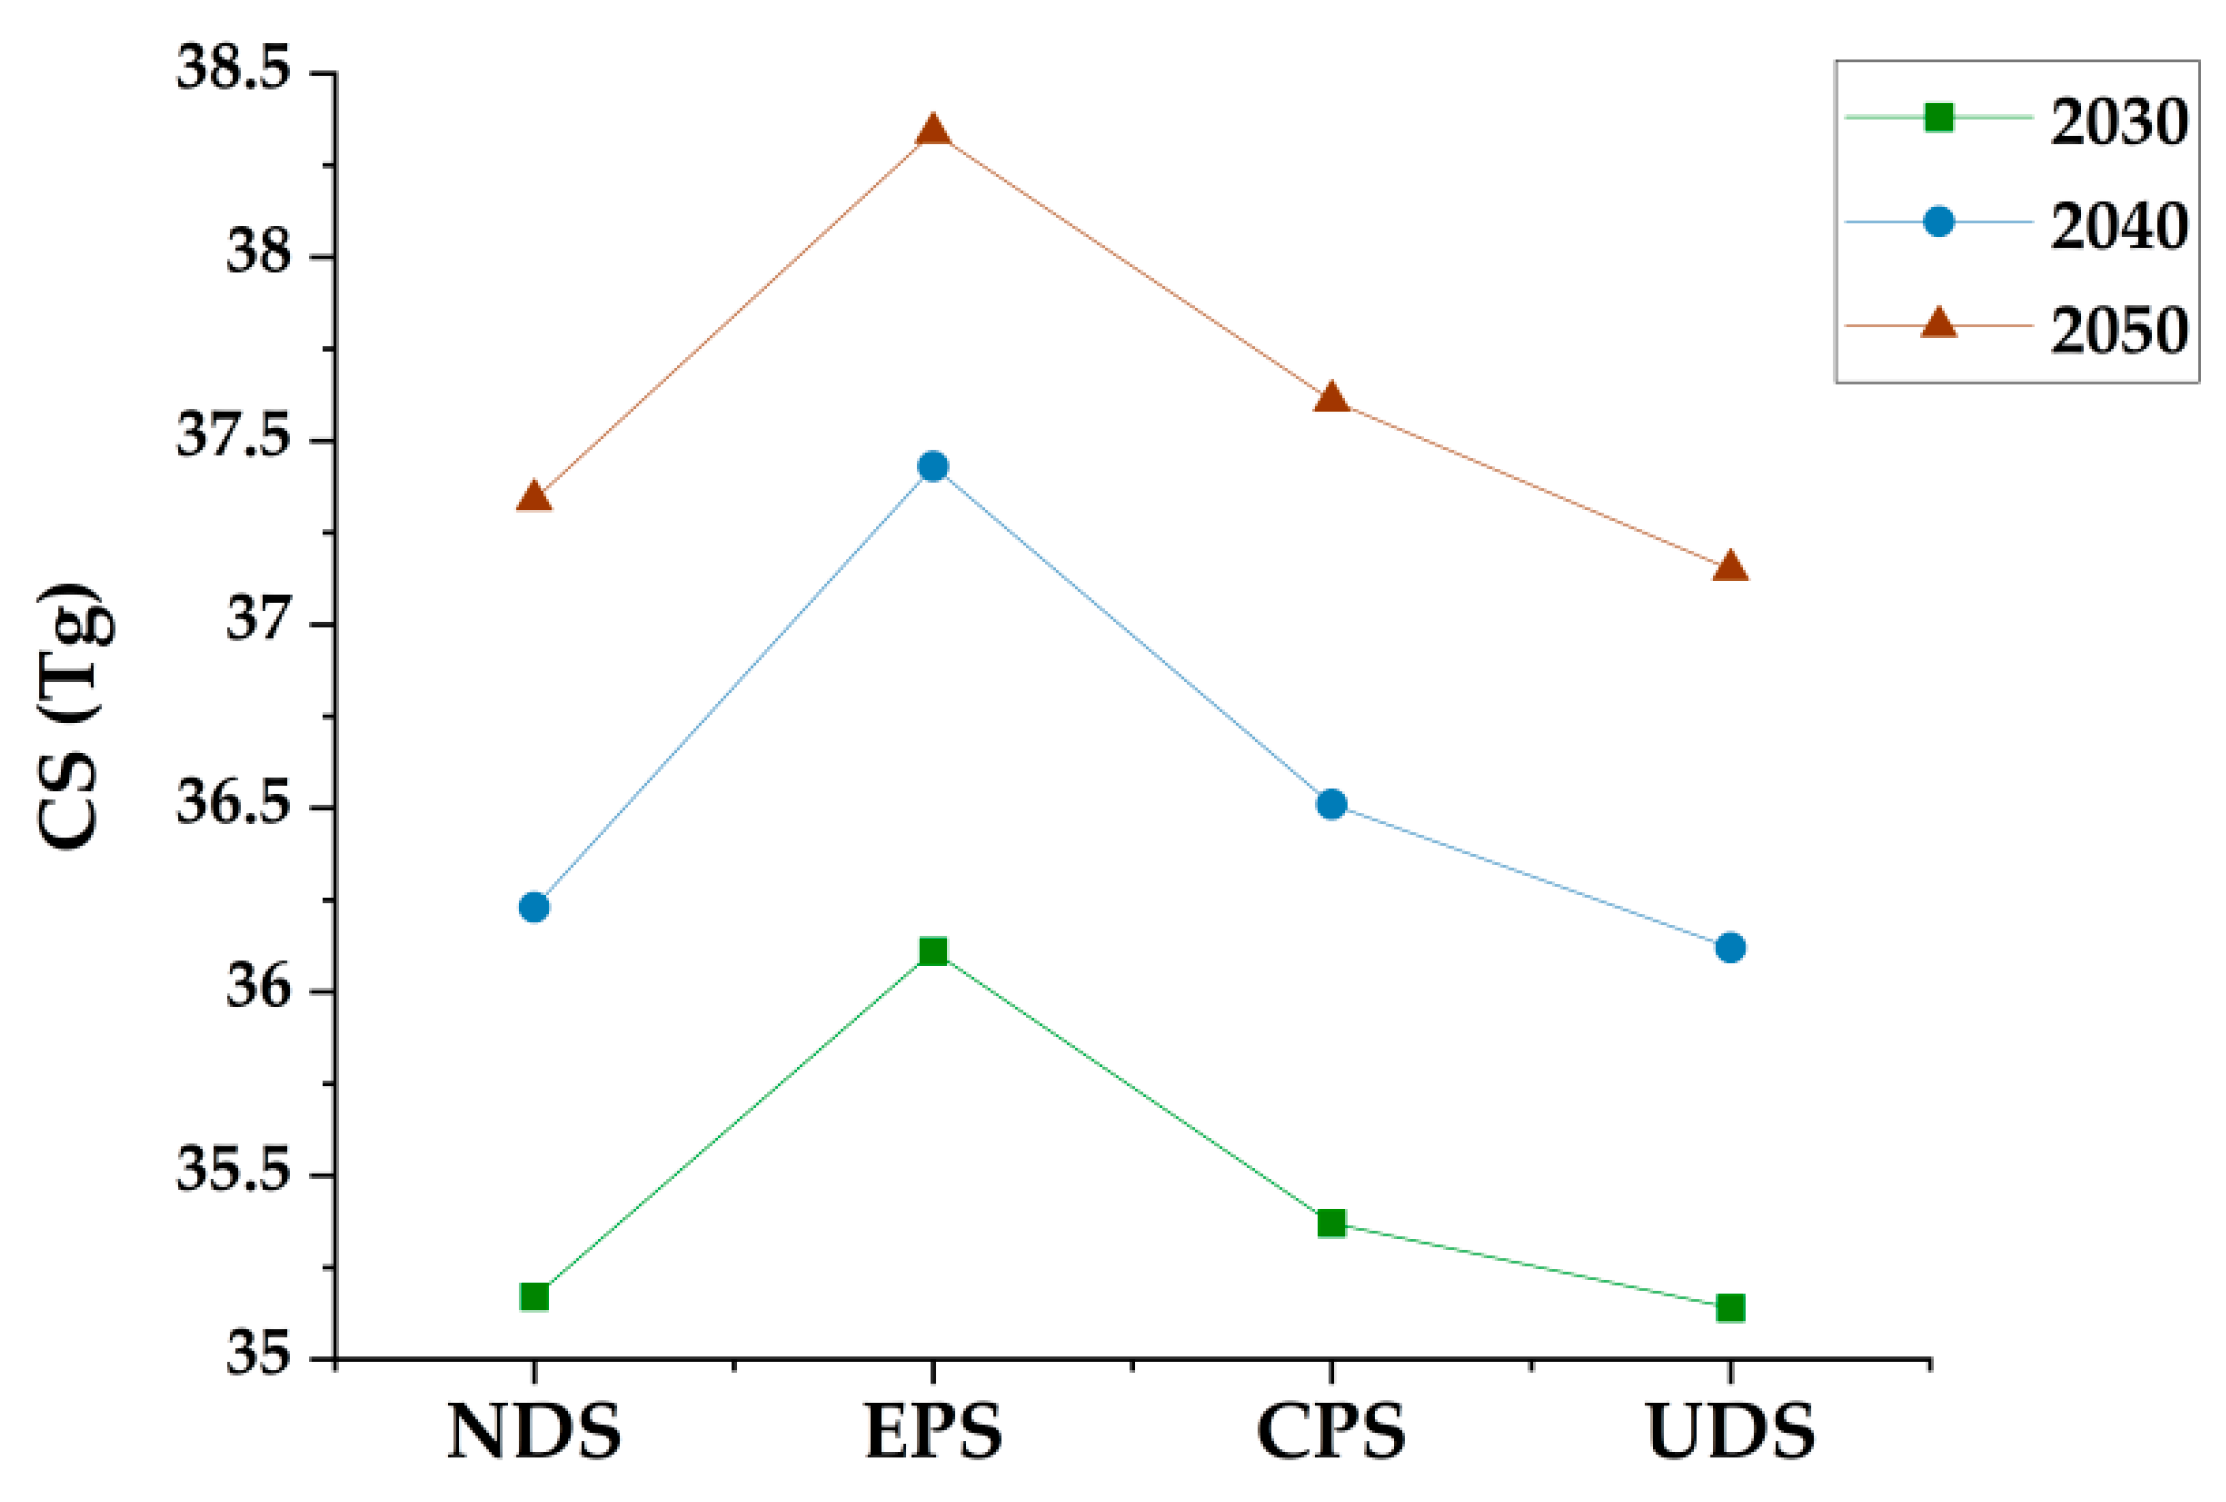
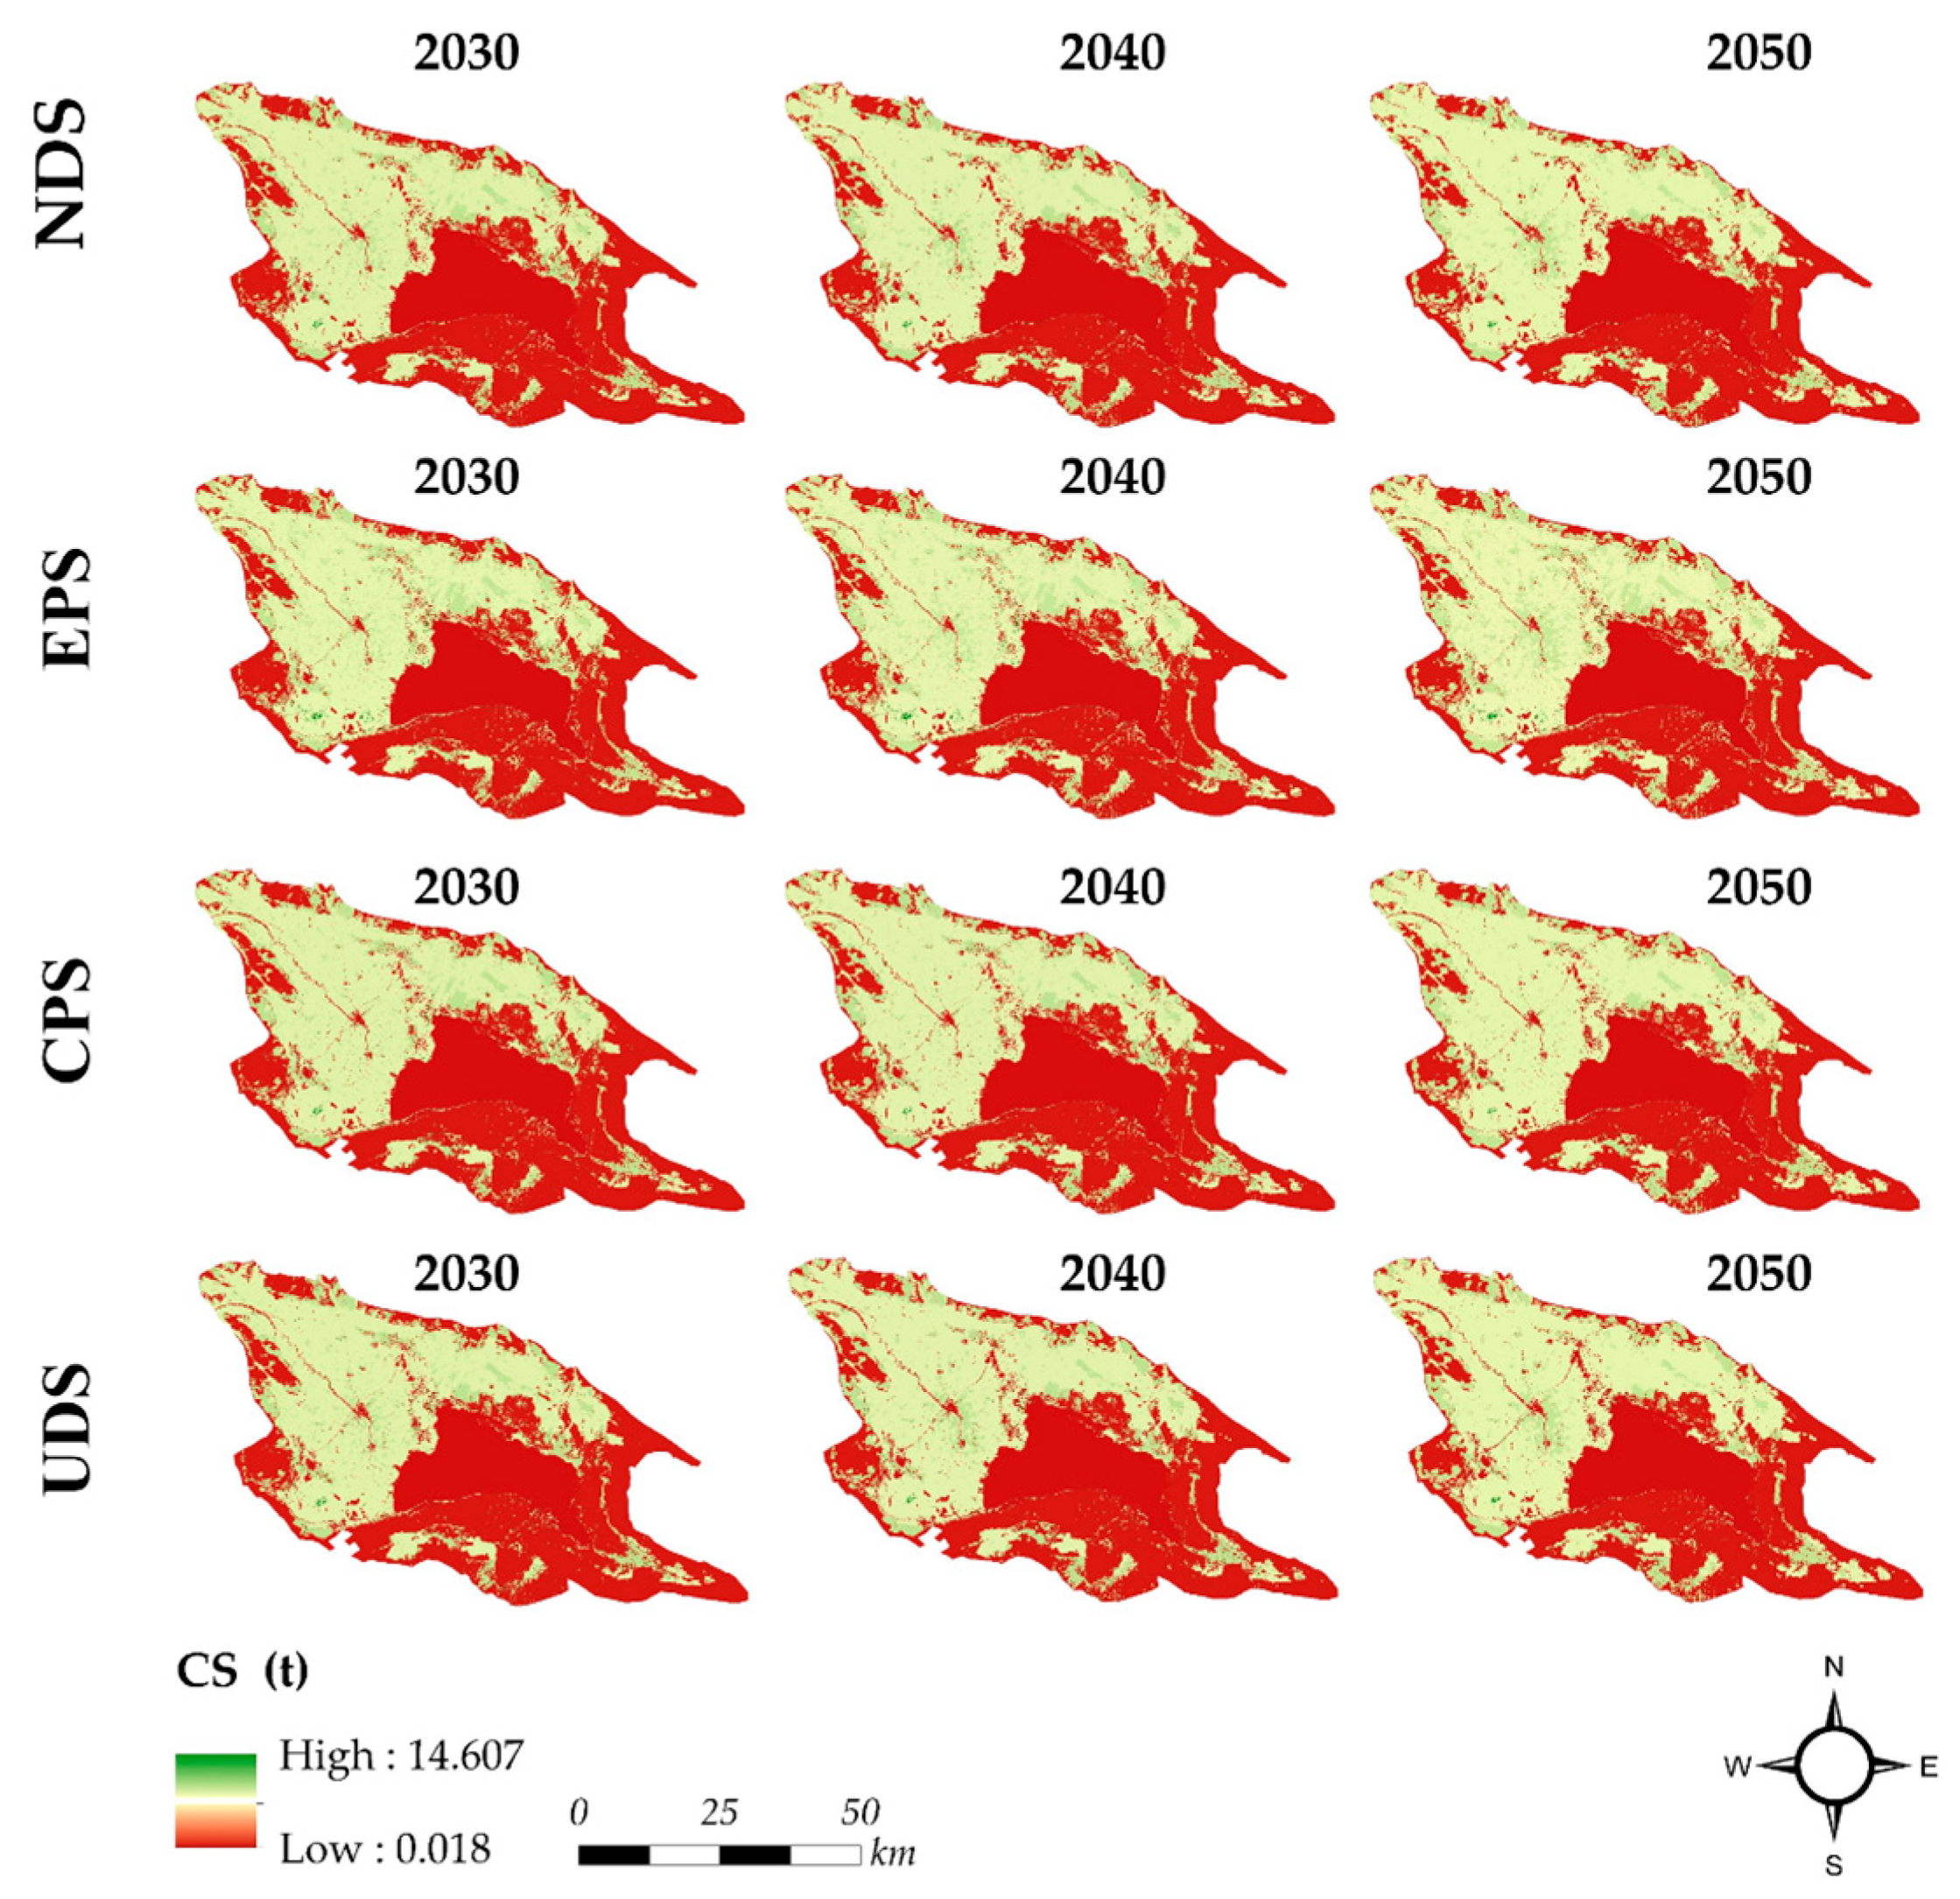
3.3. Multi-Scenario Simulation Prediction of CS in Yanqi Basin Based on InVest Modeling

The InVEST model was used to evaluate the changes in CS under various scenarios from 2030 to 2050 using the findings of future land use simulations (Figure 12). The changes in CS varied from scenario to scenario. Due to modifications in the range of land use categories, the CS values under the NDS, EPS, CPS, and UDS were 35.17 Tg, 36.11 Tg, 35.38 Tg, and 35.14 Tg by 2030 and 37.34 Tg, 38.34 Tg, 37.61 Tg, and 37.15 Tg by 2050, respectively. The total CS under all four development scenarios showed an increasing trend, and the CS value of UDS was always the lowest, while the CS value of EPS was the highest. Under EPS, CS reached the highest value; under CPS, cultivated land and grassland increased at the same time, cultivated land was developed moderately, and CS also showed an increasing trend; under UDS, although other land types were restricted to create land for construction vigorously, due to the increase in the demand for cultivated land, the development of land use area was too fast, which lead to an increasing trend of CS. Still, compared with the EPS, the CS was lower. Suppose it is under UDS for an extended period, with the economic urbanization of the economy. In that case, the CS value will always be the lowest, while the CS in EPS will be the highest. Under UDS, the trend of CS will change with the rapid development of economic urbanization and the accelerated increase in carbon emissions.
This study used land use data from 2020 to forecast the CS of the Yanqi Basin under several scenarios in 2030, 2040, and 2050, as depicted in Figure 13. Overall, the Yanqi Basin’s CS spatial dispersion under the four development scenarios tends to be consistent, showing the traits of being low in the west and high in the east, with minor changes within the spatial dispersion pattern. High-value CS areas are concentrated in the woodland in the southwest and northern edge of Lake Bosten, which has a high rate of woodland cover; medium-value CS areas are mainly located in the cropland in the middle of the west; and low-value CS sites are sporadically dispersed throughout the basin’s water and unused land in the eastern and southeastern parts of the basin, and centrally inside the construction land. Under the EPS, the CS values in the southwestern and central parts of the basin increase significantly due to increased woodland and decreased construction land, but the overall spatial distribution characteristics remain consistent.

4. Discussion

4.1. Response Relationship between LUCC and CS in the Yanqi Basin

Generally, CS is influenced by environmental variables, soil properties, parent material, and land use; however, all these factors are impacted by land use, and areas of LUCC are also hotspots of terrestrial CS change [106,107]. Zhang et al. analyzed the relationship between LUCC and CS in the Yanqi Basin, and the results of their study showed that the conversion of native land to cropland and woodland in arid regions not only improves soil organic CS but also promotes long-term organic CS [27]. The development and transformation of land by human activities are the dominant factors leading to CS changes, and the transformation of large areas of other land categories into construction land is the direct cause of a reduction in CS [107,108]. On the time scale, the Yanqi Basin will most likely develop a carbon sink effect under the EPS. Due to the high-value CS of woodland areas, EPS increases the probability of conversion of other land types to woodland, and conversion of other land types to woodland and grassland leads to carbon storage in vegetation, which can slow down GHG emissions. Under the UDS, urban sprawl leads to converting natural landscapes to built environments, resulting in the loss of carbon stored in vegetation and soils. CS significantly reduced compared to the EPS scenario, with the growth of the urban economy leading to increased carbon emissions and warming of the climate environment [109]. Under the CPS, although cover crops can contribute to the accumulation of soil organic carbon, they can also lead to a slight loss of soil carbon if they are over-farmed. Although the CS of the UDS and CPS is also gradually increasing, the CS is lower than EPS. With the long-term rapid economic development and the impact of urban pollution, it is necessary to regulate the urban development strategy based on the EPS. Thus, limiting the overexploitation of land types in the Yanqi Basin can help mitigate local issues and increase CS. Regarding spatial distribution, the changes in the spatial distribution pattern of CS are in response to the changes that occur in LUCC. The area where forest land is located coincides precisely with the high-value point of CS, while the built-up land area coincides with the low-value area of CS. Therefore, the future development of the Yanqi Basin needs to restrict the conversion rate of woodland and grassland to construction land and focus on protecting the woodland in the southwest and the water bodies in the central region, with a specific focus on woodland protection under the EPS while controlling construction land use, integrating the content of the UDS to develop the economy in an orderly manner, optimize urban layout, maintain regional carbon sink balance, achieve the “dual carbon goals”, and construct a safe and green ecological space.

4.2. Model Strengths and Weaknesses

The coupling of the PLUS model and the InVEST model in this paper reduces the complexity of the land use simulation and CS simulation in terrestrial ecosystems, which is more feasible, and the results are more accurate [74]. In this research, the PLUS model partially addresses the limitations of the CA model in the conversion rule mining method and the landscape dynamics emulate technique, which provides better insights into various LUCC scenarios [110,111] and achieves sustainable development [74,112]. The InVEST model has been extensively used for land use-driven regional-scale CS estimations during the recent few years due to its simple operation, good visualization effect, and comprehensive solid function. A large number of research results have been achieved, mainly including CS estimations and spatial and temporal change analyses of the InVEST model [113], optimization of the InVEST model using the net ecosystem productivity of the vegetation, and the exploration of the driving factors of CS. The simulation predicts future CS under different land use scenarios by combining the InVEST and PLUS models. The above studies confirmed the potential of the InVEST model for regional CS estimation and verified the model’s value in predicting future CS changes. However, the complex climatic factors, social policy changes, and dynamic economic policy shifts could not be effectively simulated in the PLUS model, making the simulation results lack timeliness. The carbon density value fails to consider the dynamic effects of multiple factors. Therefore, subsequent studies need to incorporate dynamic factors affecting LUCC into the simulation process to improve the accuracy of the simulation.

4.3. Prospects and Recommendations

The research results indicate that unquestioningly developing the economy while neglecting ecology will lead to a CS imbalance. Future research must fully consider the PLUS and INVEST models’ limitations and integrate a more comprehensive correction model that incorporates broader environmental and social impact factors to predict LUCC and CS. To mitigate global warming, one of the critical tasks of China’s 14th Five-Year Plan is to “do a good job of carbon peaking and carbon neutralization”. Therefore, the Yanqi Basin should be scientifically planned and managed as an essential ecological region. The government should avoid excessive development and utilization of land resources; actively carry out sustainable land use projects, including ecotourism, agricultural production, and ecological restoration, and promote local storage of CS; utilize agricultural advantages to achieve diversified planting, agricultural recycling, and increase CS; and establish a sound carbon emission regulatory mechanism, controlling carbon emissions in industries, such as industry and agriculture, as protecting the climate and environment is conducive to increasing the CS. In the future, the spatial distribution of ecological, agricultural, and urban land should be made clear in the Yanqi Basin, land use should be rationally planned and managed, and the amount of new construction and cropland should be sized sensibly to prevent occupying woodland areas. This study is essential to protect and restore the scarce woodland areas in the Yanqi Basin to prevent desertification and to leave space for urban development to help the sustainable development of the regional ecosystem.

5. Conclusions

Based on this study, the following conclusions were drawn:
(1) There were substantial changes made to the area’s land use between 2000 and 2020. During this period, there was an increase in cropland and construction land, with the most significant increase being seen in cultivated land, which increased by 675.02 km2, accounting for 33.98% of the total area, while other land types decreased. This rise in cropland is mainly due to the development of agriculture and social progress. The central part of the Yanqi Basin is where most of the cropland and construction land is concentrated, showing an expansion trend. Woodland is scarce, and grassland is distributed on Bosten Lake’s north and south sides. Unfortunately, the amount of grassland has reduced due to the growth of cropland and construction land, and unused land now surrounds the study area.
(2) Over the 20 years, CS showed an overall increasing trend but suddenly decreased in 2015 and rebounded in 2020 with a cumulative decrease of 3.61 Tg. Areas with large CS are usually areas with high CS per unit of land, whereas areas with small CS are traditionally areas with low CS per unit of land. This study suggests that changes in LUCC structure and function significantly impact CS.
(3) LUCC also varies under different scenarios. Under the NDS, cropland and construction land increase while other land categories decrease. Under the EPS, woodland, grassland, and waters increase while other land categories decrease, with the ecological environment being significantly improved. Under the CPS, the cropland area is the largest. Finally, under the UDS, the area of the city is expanding.
(4) Under the UDS, the CS is the lowest; under the EPS, the CS is the highest. By 2050, the CS in the EPS will increase by 1.18 Tg compared to the UDS. The spatial distribution is characterized by high CS in the west and low CS in the east, but the change is small.
(5) Exploitation and land modification by human activities are the dominant factors leading to changes in CS. In terms of CS, the ecological conservation scenario is optimal.

Author Contributions

This research article is the joint work of five authors. Y.A. designed the experiments; Y.J. used the PLUS model and the CS module of the InVEST model to analyze the spatial and temporal characteristics of land use and CS in the Yanqi Basin from 2000 to 2050; P.F., P.Y., and J.F. helped to review and prepare this paper for publication. All authors have read and agreed to the published version of the manuscript.

Funding

This study was supported by the Xinjiang Uygur Autonomous Region Natural Science Foundation (No. 2023D01C196), the 2024 Intramural Cultivation Program of Philosophy and Social Sciences (Commissioned by the Institute of Central Asian Studies) (No. 24FPY002), and the State Key Laboratory of Desert and Oasis Ecology, Xinjiang Institute of Ecology and Geography, Chinese Academy of Sciences, Open-ended fund (No. G2022-02-05).

Data Availability Statement

The data presented in this paper are contained within this article.

Conflicts of Interest

The authors declare no conflicts of interest.

References

  1. Batunacun; Nendel, C.; Hu, Y.; Lakes, T. Land-use change and land degradation on the Mongolian Plateau from 1975 to 2015—A case study from Xilingol, China. Land Degrad. Dev. 2018, 29, 1595–1606. [Google Scholar] [CrossRef]
  2. Han, L.F.; Xu, Y.P.; Shi, Y. The effect of land use and land cover change on the stream structure: Case study in the Qinhuai River Basin, China. Appl. Mech. Mater. 2012, 212, 186–192. [Google Scholar] [CrossRef]
  3. Gao, H.; Gong, J.; Liu, J.; Ye, T. Effects of land use/cover changes on soil organic carbon stocks in Qinghai-Tibet plateau: A comparative analysis of different ecological functional areas based on machine learning methods and soil carbon pool data. J. Clean. Prod. 2024, 434, 139854. [Google Scholar] [CrossRef]
  4. Junk, W.J.; An, S.; Finlayson, C.M.; Gopal, B.; Květ, J.; Mitchell, S.A.; Mitsch, W.J.; Robarts, R.D. Current state of knowledge regarding the world’s wetlands and their future under global climate change: A synthesis. Aquat. Sci. 2013, 75, 151–167. [Google Scholar] [CrossRef]
  5. Xie, H.; Zhang, Y.; Zeng, X.; He, Y. Sustainable land use and management research: A scientometric review. Landsc. Ecol. 2020, 35, 2381–2411. [Google Scholar] [CrossRef]
  6. Liu, H.; Ren, H.; Hui, D.; Wang, W.; Liao, B.; Cao, Q. Carbon stocks and potential carbon storage in the mangrove forests of China. J. Environ. Manag. 2014, 133, 86–93. [Google Scholar] [CrossRef] [PubMed]
  7. Kusumaningtyas, M.A.; Hutahaean, A.A.; Fischer, H.W.; Pérez-Mayo, M.; Ransby, D.; Jennerjahn, T.C. Variability in the organic carbon stocks, sources, and accumulation rates of Indonesian mangrove ecosystems. Estuar. Coast. Shelf Sci. 2019, 218, 310–323. [Google Scholar] [CrossRef]
  8. Rahman, M.; Islam, M.; Islam, R.; Sobuj, N.A. Towards sustainability of tropical forests: Implications for enhanced carbon stock and climate change mitigation. J. For. Environ. Sci. 2017, 33, 281–294. [Google Scholar]
  9. Yu, G.; Li, X.; Wang, Q.; Li, S. Carbon storage and its spatial pattern of terrestrial ecosystem in China. J. Resour. Ecol. 2010, 1, 97–109. [Google Scholar]
  10. Seo, S.N. Wading into the Century of Global Warming and Adaptation Strategies; Advances in Global Change Research; Springer: Berlin/Heidelberg, Germany, 2015; pp. 81–93. [Google Scholar]
  11. Doblas-Miranda, E.; Martínez-Vilalta, J.; Lloret, F.; Álvarez, A.; Ávila, A.; Bonet, F.; Brotons, L.; Castro, J.; Curiel Yuste, J.; Díaz, M.; et al. Reassessing global change research priorities in Mediterranean terrestrial ecosystems: How far have we come and where do we go from here? Glob. Ecol. Biogeogr. 2015, 24, 25–43. [Google Scholar] [CrossRef]
  12. Schimel, D.S. Terrestrial ecosystems and the carbon cycle. Glob. Chang. Biol. 1995, 1, 77–91. [Google Scholar] [CrossRef]
  13. Zhang, X.; Wang, Y.P.; Peng, S.; Rayner, P.J.; Ciais, P.; Silver, J.D.; Piao, S.; Zhu, Z.; Lu, X.; Zheng, X. Dominant regions and drivers of the variability of the global land carbon sink across timescales. Glob. Chang. Biol. 2018, 24, 3954–3968. [Google Scholar] [CrossRef] [PubMed]
  14. Chang, X.; Xing, Y.; Wang, J.; Yang, H.; Gong, W. Effects of land use and cover change (LUCC) on terrestrial carbon stocks in China between 2000 and 2018. Resour. Conserv. Recycl. 2022, 182, 106333. [Google Scholar] [CrossRef]
  15. Wen, J.; Chuai, X.; Zuo, T.; Cai, H.H.; Cai, L.; Zhao, R.; Chen, Y. Land use change on the surface area and the influence on carbon. Ecol. Indic. 2023, 153, 110400. [Google Scholar] [CrossRef]
  16. Zhu, L.; Song, R.; Sun, S.; Li, Y.; Hu, K. Land use/land cover change and its impact on ecosystem carbon storage in coastal areas of China from 1980 to 2050. Ecol. Indic. 2022, 142, 109178. [Google Scholar] [CrossRef]
  17. Zhu, G.; Qiu, D.; Zhang, Z.; Sang, L.; Liu, Y.; Wang, L.; Zhao, K.; Ma, H.; Xu, Y.; Wan, Q. Land-use changes lead to a decrease in carbon storage in arid region, China. Ecol. Indic. 2021, 127, 107770. [Google Scholar] [CrossRef]
  18. Deng, L.; Zhu, G.-y.; Tang, Z.-s.; Shangguan, Z.-p. Global patterns of the effects of land-use changes on soil carbon stocks. Glob. Ecol. Conserv. 2016, 5, 127–138. [Google Scholar] [CrossRef]
  19. Gilkes, R.; Prakongkep, N.; Gilkes, R.; Prakongkep, N. Proceedings of the 19th World Congress of Soil Science; Soil Solutions for a Changing World; International Union of Soil Sciences: Brisbane, Australia, 2010. [Google Scholar]
  20. Gao, Y.; Jia, J.; Lu, Y.; Yang, T.; Lyu, S.; Shi, K.; Zhou, F.; Yu, G. Determining dominating control mechanisms of inland water carbon cycling processes and associated gross primary productivity on regional and global scales. Earth-Sci. Rev. 2021, 213, 103497. [Google Scholar] [CrossRef]
  21. Wang, B.; Yu, J.; Wu, R. Achieving carbon neutrality in China: Legal and policy perspectives. Front. Environ. Sci. 2022, 10, 1043404. [Google Scholar] [CrossRef]
  22. Zhang, L.; Du, Q.; Zhou, D.; Zhou, P. How does the photovoltaic industry contribute to China’s carbon neutrality goal? Analysis of a system dynamics simulation. Sci. Total Environ. 2022, 808, 151868. [Google Scholar] [CrossRef]
  23. Zhang, D.; Li, A.; Lam, S.K.; Li, P.; Zong, Y.; Gao, Z.; Hao, X. Increased carbon uptake under elevated CO2 concentration enhances water-use efficiency of C4 broomcorn millet under drought. Agric. Water Manag. 2021, 245, 106631. [Google Scholar] [CrossRef]
  24. Yang, H.; Mu, S.; Li, J. Effects of ecological restoration projects on land use and land cover change and its influences on territorial NPP in Xinjiang, China. Catena 2014, 115, 85–95. [Google Scholar] [CrossRef]
  25. Fontana, L.; Sun, M.; Huang, X.; Xiang, L. The impact of climate change and human activity on the ecological status of Bosten Lake, NW China, revealed by a diatom record for the last 2000 years. Holocene 2019, 29, 1871–1884. [Google Scholar] [CrossRef]
  26. Ariken, M.; Zhang, F.; Liu, K.; Fang, C.; Kung, H.-T. Coupling coordination analysis of urbanization and eco-environment in Yanqi Basin based on multi-source remote sensing data. Ecol. Indic. 2020, 114, 106331. [Google Scholar] [CrossRef]
  27. Zhang, J.; Wang, X.; Wang, J. Impact of land use change on profile distributions of soil organic carbon fractions in the Yanqi Basin. Catena 2014, 115, 79–84. [Google Scholar] [CrossRef]
  28. Wang, S.; Wang, S. Land use/land cover change and their effects on landscape patterns in the Yanqi Basin, Xinjiang (China). Environ. Monit. Assess. 2013, 185, 9729–9742. [Google Scholar] [CrossRef] [PubMed]
  29. Stephenne, N.; Lambin, E.F. A dynamic simulation model of land-use changes in Sudano-sahelian countries of Africa (SALU). Agric. Ecosyst. Environ. 2001, 85, 145–161. [Google Scholar] [CrossRef]
  30. Lambin, E.F.; Geist, H.J.; Lepers, E. Dynamics of land-use and land-cover change in tropical regions. Annu. Rev. Environ. Resour. 2003, 28, 205–241. [Google Scholar] [CrossRef]
  31. Biazin, B.; Sterk, G. Drought vulnerability drives land-use and land cover changes in the Rift Valley dry lands of Ethiopia. Agric. Ecosyst. Environ. 2013, 164, 100–113. [Google Scholar] [CrossRef]
  32. Niu, X.; Hu, Y.; Lei, Z.; Yan, H.; Ye, J.; Wang, H. Temporal and spatial evolution characteristics and its driving mechanism of land use/cover in Vietnam from 2000 to 2020. Land 2022, 11, 920. [Google Scholar] [CrossRef]
  33. Kgaphola, M.J.; Ramoelo, A.; Odindi, J.; Mwenge Kahinda, J.-M.; Seetal, A.R.; Musvoto, C. Impact of land use and land cover change on land degradation in rural semi-arid South Africa: Case of the Greater Sekhukhune District Municipality. Environ. Monit. Assess. 2023, 195, 710. [Google Scholar] [CrossRef] [PubMed]
  34. Shao, Y.; Jiang, Q.o.; Wang, C.; Wang, M.; Xiao, L.; Qi, Y. Analysis of critical land degradation and development processes and their driving mechanism in the Heihe River Basin. Sci. Total Environ. 2020, 716, 137082. [Google Scholar] [CrossRef] [PubMed]
  35. Wang, Q.; Guan, Q.; Lin, J.; Luo, H.; Tan, Z.; Ma, Y. Simulating land use/land cover change in an arid region with the coupling models. Ecol. Indic. 2021, 122, 107231. [Google Scholar] [CrossRef]
  36. Zhang, Z.; Li, X.; Liu, X.; Zhao, K. Dynamic simulation and projection of land use change using system dynamics model in the Chinese Tianshan mountainous region, central Asia. Ecol. Model. 2024, 487, 110564. [Google Scholar] [CrossRef]
  37. He, S.; Wang, D.; Li, Y.; Zhao, P. Land use changes and their driving forces in a debris flow active area of Gansu Province, China. Sustainability 2018, 10, 2759. [Google Scholar] [CrossRef]
  38. Cendrero, A.; Forte, L.M.; Remondo, J.; Cuesta-Albertos, J.A. Anthropocene geomorphic change. Climate or human activities? Earth’s Future 2020, 8, e2019EF001305. [Google Scholar] [CrossRef]
  39. Qin, W.; Zhang, Y.; Li, G. Driving mechanism of cultivated land transition in Yantai Proper, Shandong Province, China. Chin. Geogr. Sci. 2015, 25, 337–349. [Google Scholar] [CrossRef]
  40. Liu, J.; Xia, M.; Liu, Y.; Zhang, K.; Zhang, Z. Driving mechanism of rural land use change based on multi-agent system and cellular automata. Trans. Chin. Soc. Agric. Eng. 2018, 34, 242–252. [Google Scholar]
  41. Ren, Y.; Lü, Y.; Comber, A.; Fu, B.; Harris, P.; Wu, L. Spatially explicit simulation of land use/land cover changes: Current coverage and future prospects. Earth-Sci. Rev. 2019, 190, 398–415. [Google Scholar] [CrossRef]
  42. Lambin, E.F.; Rounsevell, M.D.; Geist, H. Are agricultural land-use models able to predict changes in land-use intensity? Agric. Ecosyst. Environ. 2000, 82, 321–331. [Google Scholar] [CrossRef]
  43. Larkin, A.; Geddes, J.A.; Martin, R.V.; Xiao, Q.; Liu, Y.; Marshall, J.D.; Brauer, M.; Hystad, P. Global Land Use Regression Model for Nitrogen Dioxide Air Pollution. Environ. Sci. Technol. 2017, 51, 6957–6964. [Google Scholar] [CrossRef]
  44. Wong, P.-Y.; Lee, H.-Y.; Chen, Y.-C.; Zeng, Y.-T.; Chern, Y.-R.; Chen, N.-T.; Lung, S.-C.C.; Su, H.-J.; Wu, C.-D. Using a land use regression model with machine learning to estimate ground level PM2.5. Environ. Pollut. 2021, 277, 116846. [Google Scholar] [CrossRef] [PubMed]
  45. Zheng, L.; Li, Q.; Ren, H.; Shi, R.; Bai, K.; Lu, L. Exploring the relationship between dengue fever epidemics and social-environmental factors using land use regression model. Chin. J. Vector Biol. Control 2018, 29, 226–234. [Google Scholar]
  46. Chen, Y.; Li, X.; Liu, X.; Ai, B. Modeling urban land-use dynamics in a fast developing city using the modified logistic cellular automaton with a patch-based simulation strategy. Int. J. Geogr. Inf. Sci. 2014, 28, 234–255. [Google Scholar] [CrossRef]
  47. Liu, Q.; Liu, J.; Song, K.; Li, F.; Wang, Z. Simulation on spatial pattern of land use change in Bielahong River Basin based on CLUE-S model. J. Northeast For. Univ. 2010, 38, 64–73. [Google Scholar]
  48. Peng, K.; Jiang, W.; Deng, Y.; Liu, Y.; Wu, Z.; Chen, Z. Simulating wetland changes under different scenarios based on integrating the random forest and CLUE-S models: A case study of Wuhan Urban Agglomeration. Ecol. Indic. 2020, 117, 106671. [Google Scholar] [CrossRef]
  49. Ding, Q.; Chen, Y.; Bu, L.; Ye, Y. Multi-scenario analysis of habitat quality in the Yellow River delta by coupling FLUS with InVEST model. Int. J. Environ. Res. Public Health 2021, 18, 2389. [Google Scholar] [CrossRef]
  50. Liang, X.; Liu, X.; Li, D.; Zhao, H.; Chen, G. Urban growth simulation by incorporating planning policies into a CA-based future land-use simulation model. Int. J. Geogr. Inf. Sci. 2018, 32, 2294–2316. [Google Scholar] [CrossRef]
  51. Ku, C.-A. Incorporating spatial regression model into cellular automata for simulating land use change. Appl. Geogr. 2016, 69, 1–9. [Google Scholar] [CrossRef]
  52. Wang, Q.; Guan, Q.; Sun, Y.; Du, Q.; Xiao, X.; Luo, H.; Zhang, J.; Mi, J. Simulation of future land use/cover change (LUCC) in typical watersheds of arid regions under multiple scenarios. J. Environ. Manag. 2023, 335, 117543. [Google Scholar] [CrossRef]
  53. Li, C.; Wu, Y.; Gao, B.; Zheng, K.; Wu, Y.; Li, C. Multi-scenario simulation of ecosystem service value for optimization of land use in the Sichuan-Yunnan ecological barrier, China. Ecol. Indic. 2021, 132, 108328. [Google Scholar] [CrossRef]
  54. Li, J.; Chen, X.; Kurban, A.; Van de Voorde, T.; De Maeyer, P.; Zhang, C. Coupled SSPs-RCPs scenarios to project the future dynamic variations of water-soil-carbon-biodiversity services in Central Asia. Ecol. Indic. 2021, 129, 107936. [Google Scholar] [CrossRef]
  55. Zhai, H.; Lv, C.; Liu, W.; Yang, C.; Fan, D.; Wang, Z.; Guan, Q. Understanding spatio-temporal patterns of land use/land cover change under urbanization in Wuhan, China, 2000–2019. Remote Sens. 2021, 13, 3331. [Google Scholar] [CrossRef]
  56. Xu, X.; Kong, W.; Wang, L.; Wang, T.; Luo, P.; Cui, J. A novel and dynamic land use/cover change research framework based on an improved PLUS model and a fuzzy multiobjective programming model. Ecol. Inform. 2024, 80, 102460. [Google Scholar] [CrossRef]
  57. Xu, L.; Liu, X.; Tong, D.; Liu, Z.; Yin, L.; Zheng, W. Forecasting urban land use change based on cellular automata and the PLUS model. Land 2022, 11, 652. [Google Scholar] [CrossRef]
  58. Zhu, J.; Hu, X.; Xu, W.; Shi, J.; Huang, Y.; Yan, B. Regional Carbon Stock Response to Land Use Structure Change and Multi-Scenario Prediction: A Case Study of Hunan Province, China. Sustainability 2023, 15, 12178. [Google Scholar] [CrossRef]
  59. Houghton, R.; Hobbie, J.; Melillo, J.M.; Moore, B.; Peterson, B.; Shaver, G.; Woodwell, G. Changes in the Carbon Content of Terrestrial Biota and Soils between 1860 and 1980: A Net Release of CO2 to the Atmosphere. Ecol. Monogr. 1983, 53, 235–262. [Google Scholar] [CrossRef]
  60. Cao, S.; Sanchez-Azofeifa, G.; Duran, S.; Calvo-Rodriguez, S. Estimation of aboveground net primary productivity in secondary tropical dry forests using the Carnegie–Ames–Stanford Approach (CASA) model. Environ. Res. Lett. 2016, 11, 075004. [Google Scholar] [CrossRef]
  61. Zhao, M.; He, Z.; Du, J.; Chen, L.; Lin, P.; Fang, S. Assessing the effects of ecological engineering on carbon storage by linking the CA-Markov and InVEST models. Ecol. Indic. 2019, 98, 29–38. [Google Scholar] [CrossRef]
  62. Maanan, M.; Maanan, M.; Karim, M.; Ait Kacem, H.; Ajrhough, S.; Rueff, H.; Snoussi, M.; Rhinane, H. Modelling the potential impacts of land use/cover change on terrestrial carbon stocks in north-west Morocco. Int. J. Sustain. Dev. World Ecol. 2019, 26, 560–570. [Google Scholar] [CrossRef]
  63. Yan, X.; Wei, C.; Li, X.; Cui, S.; Zhong, J. New insight into blue carbon stocks and natural-human drivers under reclamation history districts for sustainable coastal development: A case study from Liaohe River Delta, China. Sci. Total Environ. 2023, 872, 162162. [Google Scholar] [CrossRef] [PubMed]
  64. Mamat, Z.; Yimit, H.; Eziz, A.; Ablimit, A. Oasis land-use change and its effects on the eco-environment in Yanqi Basin, Xinjiang, China. Environ. Monit. Assess. 2014, 186, 335–348. [Google Scholar] [CrossRef] [PubMed]
  65. Wang, S.; Wu, B.; Yang, P. Assessing the changes in land use and ecosystem services in an oasis agricultural region of Yanqi Basin, Northwest China. Environ. Monit. Assess. 2014, 186, 8343–8357. [Google Scholar] [CrossRef] [PubMed]
  66. Kayumba, P.M.; Fang, G.; Chen, Y.; Mind’je, R.; Hu, Y.; Ali, S.; Mindje, M. Modeling the Near-Surface Energies and Water Vapor Fluxes Behavior in Response to Summer Canopy Density across Yanqi Endorheic Basin, Northwestern China. Remote Sens. 2021, 13, 3764. [Google Scholar] [CrossRef]
  67. Yang, Y.; Li, W.; Zhu, C.; Wang, Y.; Huang, X. Impact of land use/cover changes on carbon storage in a river valley in arid areas of Northwest China. J. Arid Land 2017, 9, 879–887. [Google Scholar] [CrossRef]
  68. Lai, L.; Huang, X.; Yang, H.; Chuai, X.; Zhang, M.; Zhong, T.; Chen, Z.; Chen, Y.; Wang, X.; Thompson, J.R. Carbon emissions from land-use change and management in China between 1990 and 2010. Sci. Adv. 2016, 2, e1601063. [Google Scholar] [CrossRef] [PubMed]
  69. Pontius, R.G.; Huang, J.; Jiang, W.; Khallaghi, S.; Lin, Y.; Liu, J.; Quan, B.; Ye, S. Rules to write mathematics to clarify metrics such as the land use dynamic degrees. Landsc. Ecol. 2017, 32, 2249–2260. [Google Scholar] [CrossRef]
  70. Sapena, M.; Ruiz, L.Á. Analysis of land use/land cover spatio-temporal metrics and population dynamics for urban growth characterization. Comput. Environ. Urban Syst. 2019, 73, 27–39. [Google Scholar] [CrossRef]
  71. Ghosh, P.; Mukhopadhyay, A.; Chanda, A.; Mondal, P.; Akhand, A.; Mukherjee, S.; Nayak, S.K.; Ghosh, S.; Mitra, D.; Ghosh, T. Application of Cellular automata and Markov-chain model in geospatial environmental modeling-A review. Remote Sens. Appl. Soc. Environ. 2017, 5, 64–77. [Google Scholar] [CrossRef]
  72. Yang, X.; Zheng, X.-Q.; Chen, R. A land use change model: Integrating landscape pattern indexes and Markov-CA. Ecol. Model. Ecol. Model. 2014, 283, 1–7. [Google Scholar] [CrossRef]
  73. Faichia, C.; Tong, Z.; Zhang, J.; Liu, X.; Kazuva, E.; Ullah, K.; Al-Shaibah, B. Using RS data-based CA–Markov model for dynamic simulation of historical and future LUCC in Vientiane, Laos. Sustainability 2020, 12, 8410. [Google Scholar] [CrossRef]
  74. Liang, X.; Guan, Q.; Clarke, K.C.; Liu, S.; Wang, B.; Yao, Y. Understanding the drivers of sustainable land expansion using a patch-generating land use simulation (PLUS) model: A case study in Wuhan, China. Comput. Environ. Urban Syst. 2021, 85, 101569. [Google Scholar] [CrossRef]
  75. Lin, Z.; Peng, S. Comparison of multimodel simulations of land use and land cover change considering integrated constraints-A case study of the Fuxian Lake basin. Ecol. Indic. 2022, 142, 109254. [Google Scholar] [CrossRef]
  76. Zhang, Z.; Hu, B.; Jiang, W.; Qiu, H. Spatial and temporal variation and prediction of ecological carrying capacity based on machine learning and PLUS model. Ecol. Indic. 2023, 154, 110611. [Google Scholar] [CrossRef]
  77. Hua, L.; Liao, J.; Chen, H.; Chen, D.; Shao, G. Assessment of ecological risks induced by land use and land cover changes in Xiamen City, China. Int. J. Sustain. Dev. World Ecol. 2018, 25, 439–447. [Google Scholar] [CrossRef]
  78. Briassoulis, H. Factors influencing land-use and land-cover change. Land Cover. Land Use Glob. Chang. Encycl. Life Support Syst. (EOLSS) 2009, 1, 126–146. [Google Scholar]
  79. Gao, C.; Zhou, P.; Jia, P.; Liu, Z.; Wei, L.; Tian, H. Spatial driving forces of dominant land use/land cover transformations in the Dongjiang River watershed, Southern China. Environ. Monit. Assess. 2016, 188, 1–15. [Google Scholar] [CrossRef] [PubMed]
  80. Wang, G.; Liu, Y.; Li, Y.; Chen, Y. Dynamic trends and driving forces of land use intensification of cultivated land in China. J. Geogr. Sci. 2015, 25, 45–57. [Google Scholar] [CrossRef]
  81. Shi, M.; Wu, H.; Fan, X.; Jia, H.; Dong, T.; He, P.; Baqa, M.F.; Jiang, P. Trade-offs and synergies of multiple ecosystem services for different land use scenarios in the yili river valley, China. Sustainability 2021, 13, 1577. [Google Scholar] [CrossRef]
  82. Piyathilake, I.; Sumudumali, R.; Udayakumara, E.; Ranaweera, L.; Jayawardana, J.; Gunatilake, S. Modeling predictive assessment of soil erosion related hazards at the Uva province in Sri Lanka. Model. Earth Syst. Environ. 2021, 7, 1947–1962. [Google Scholar] [CrossRef]
  83. Li, M.; Liang, D.; Xia, J.; Song, J.; Cheng, D.; Wu, J.; Cao, Y.; Sun, H.; Li, Q. Evaluation of water conservation function of Danjiang River Basin in Qinling Mountains, China based on InVEST model. J. Environ. Manag. 2021, 286, 112212. [Google Scholar] [CrossRef] [PubMed]
  84. Bagstad, K.J.; Semmens, D.J.; Waage, S.; Winthrop, R. A comparative assessment of decision-support tools for ecosystem services quantification and valuation. Ecosyst. Serv. 2013, 5, 27–39. [Google Scholar] [CrossRef]
  85. Wu, F.; Wang, Z. Assessing the impact of urban land expansion on ecosystem carbon storage: A case study of the Changzhutan metropolitan area, China. Ecol. Indic. 2023, 154, 110688. [Google Scholar] [CrossRef]
  86. García-Ontiyuelo, M.; Acuña-Alonso, C.; Valero, E.; Álvarez, X. Geospatial mapping of carbon estimates for forested areas using the InVEST model and Sentinel-2: A case study in Galicia (NW Spain). Sci. Total Environ. 2024, 922, 171297. [Google Scholar] [CrossRef] [PubMed]
  87. Caro, C.; Marques, J.C.; Cunha, P.P.; Teixeira, Z. Ecosystem services as a resilience descriptor in habitat risk assessment using the InVEST model. Ecol. Indic. 2020, 115, 106426. [Google Scholar] [CrossRef]
  88. Li, K.; Cao, J.; Adamowski, J.F.; Biswas, A.; Zhou, J.; Liu, Y.; Zhang, Y.; Liu, C.; Dong, X.; Qin, Y. Assessing the effects of ecological engineering on spatiotemporal dynamics of carbon storage from 2000 to 2016 in the Loess Plateau area using the InVEST model: A case study in Huining County, China. Environ. Dev. 2021, 39, 100641. [Google Scholar] [CrossRef]
  89. Zarandian, A.; Mohammadyari, F.; Mirsanjari, M.M.; Visockiene, J. Scenario modeling to predict changes in land use/cover using Land Change Modeler and InVEST model: A case study of Karaj Metropolis, Iran. Environ. Monit. Assess. 2023, 195, 273. [Google Scholar] [CrossRef] [PubMed]
  90. Du, S.; Zhou, Z.; Huang, D.; Zhang, F.; Deng, F.; Yang, Y. The Response of Carbon Stocks to Land Use/Cover Change and a Vulnerability Multi-Scenario Analysis of the Karst Region in Southern China Based on PLUS-InVEST. Forests 2023, 14, 2307. [Google Scholar] [CrossRef]
  91. Zhao, H.; Guo, B.; Wang, G. Spatial-Temporal Changes and Prediction of Carbon Storage in the Tibetan Plateau Based on PLUS-InVEST Model. Forests 2023, 14, 1352. [Google Scholar] [CrossRef]
  92. Bagstad, K.J.; Cohen, E.; Ancona, Z.H.; McNulty, S.G.; Sun, G. The sensitivity of ecosystem service models to choices of input data and spatial resolution. Appl. Geogr. 2018, 93, 25–36. [Google Scholar] [CrossRef]
  93. Nie, X.; Lu, B.; Chen, Z.; Yang, Y.; Chen, S.; Chen, Z.; Wang, H. Increase or decrease? Integrating the CLUMondo and InVEST models to assess the impact of the implementation of the Major Function Oriented Zone planning on carbon storage. Ecol. Indic. 2020, 118, 106708. [Google Scholar] [CrossRef]
  94. Zhang, Y.; Liao, X.; Sun, D. A Coupled InVEST-PLUS Model for the Spatiotemporal Evolution of Ecosystem Carbon Storage and Multi-Scenario Prediction Analysis. Land 2024, 13, 509. [Google Scholar] [CrossRef]
  95. Xu, L.; Yu, G.; He, N.; Wang, Q.; Gao, Y.; Wen, D.; Li, S.; Niu, S.; Ge, J. Carbon storage in China’s terrestrial ecosystems: A synthesis. Sci. Rep. 2018, 8, 2806. [Google Scholar] [CrossRef] [PubMed]
  96. Alidoust, E.; Afyuni, M.; Hajabbasi, M.A.; Mosaddeghi, M.R. Soil carbon sequestration potential as affected by soil physical and climatic factors under different land uses in a semiarid region. Catena 2018, 171, 62–71. [Google Scholar] [CrossRef]
  97. Don, A.; Schumacher, J.; Freibauer, A. Impact of tropical land-use change on soil organic carbon stocks–a meta-analysis. Glob. Chang. Biol. 2011, 17, 1658–1670. [Google Scholar] [CrossRef]
  98. Yu, X.; Zhou, W.; Chen, Y.; Wang, Y.; Cheng, P.; Hou, Y.; Wang, Y.; Xiong, X.; Yang, L. Spatial variation of soil properties and carbon under different land use types on the Chinese Loess Plateau. Sci. Total Environ. 2020, 703, 134946. [Google Scholar] [CrossRef]
  99. Raich, J.W.; Nadelhoffer, K.J. Belowground carbon allocation in forest ecosystems: Global trends. Ecology 1989, 70, 1346–1354. [Google Scholar] [CrossRef]
  100. Zhang, J.; Li, M.; Ao, Z.; Deng, M.; Yang, C.; Wu, Y.J. Estimation of soil organic carbon storage of terrestrial ecosystem in arid western China. J. Arid Land Resour. Environ. 2018, 32, 132–137. [Google Scholar]
  101. Chen, L.-J.; Liu, G.-H.; Li, H.-G. Estimating net primary productivity of terrestrial vegetation in China using remote sensing. J. Remote Sens. 2002, 6, 129–135. [Google Scholar]
  102. Li, K.; Wang, S.; Cao, M. Vegetation and soil carbon storage in China. Sci. China 2004, 47, 49–57. [Google Scholar] [CrossRef]
  103. Li, D. Soil organic carbon and influencing factors in different landscapes in an arid region of northwestern China. Catena 2014, 116, 95–104. [Google Scholar] [CrossRef]
  104. Alam, S.A.; Starr, M.; Clark, B. Tree biomass and soil organic carbon densities across the Sudanese woodland savannah: A regional carbon sequestration study. J. Arid Environ. 2013, 89, 67–76. [Google Scholar] [CrossRef]
  105. Giardina, C.P.; Ryan, M.G. Evidence that decomposition rates of organic carbon in mineral soil do not vary with temperature. Nature 2000, 404, 858–861. [Google Scholar] [CrossRef] [PubMed]
  106. Wang, Y.; Zhang, X.; Huang, C. Spatial variability of soil total nitrogen and soil total phosphorus under different land uses in a small watershed on the Loess Plateau, China. Geoderma 2009, 150, 141–149. [Google Scholar] [CrossRef]
  107. Mattsson, T.; Kortelainen, P.; Laubel, A.; Evans, D.; Pujo-Pay, M.; Räike, A.; Conan, P. Export of dissolved organic matter in relation to land use along a European climatic gradient. Sci. Total Environ. 2009, 407, 1967–1976. [Google Scholar] [CrossRef] [PubMed]
  108. Han, Y.; Yi, D.; Ye, Y.; Guo, X.; Liu, S. Response of spatiotemporal variability in soil pH and associated influencing factors to land use change in a red soil hilly region in southern China. Catena 2022, 212, 106074. [Google Scholar] [CrossRef]
  109. Yu, H.; Xu, Z.; Zhou, G.; Shi, Y. Soil carbon release responses to long-term versus short-term climatic warming in an arid ecosystem. Biogeosciences 2020, 17, 781–79295. [Google Scholar] [CrossRef]
  110. Geng, X.; Wang, X.; Yan, H.; Zhang, Q.; Jin, G. Land use/land cover change induced impacts on water supply service in the upper reach of Heihe River Basin. Sustainability 2014, 7, 366–383. [Google Scholar] [CrossRef]
  111. Li, X.; Fu, J.; Jiang, D.; Lin, G.; Cao, C. Land use optimization in Ningbo City with a coupled GA and PLUS model. J. Clean. Prod. 2022, 375, 134004. [Google Scholar] [CrossRef]
  112. Wang, Z.; Li, X.; Mao, Y.; Li, L.; Wang, X.; Lin, Q. Dynamic simulation of land use change and assessment of carbon storage based on climate change scenarios at the city level: A case study of Bortala, China. Ecol. Indic. 2022, 134, 108499. [Google Scholar] [CrossRef]
  113. He, C.; Zhang, D.; Huang, Q.; Zhao, Y. Assessing the potential impacts of urban expansion on regional carbon storage by linking the LUSD-urban and InVEST models. Environ. Model. Softw. 2016, 75, 44–58. [Google Scholar] [CrossRef]
Figure 1. Research framework.
Land 13 00744 g001
Figure 2. Schematic of the location of the Yanqi Basin for 2020 (elevation map on the left; land use type map on the right).
Land 13 00744 g002
Figure 3. Fifteen categories of drivers affecting land use in 2020.
Land 13 00744 g003
Figure 4. Comparison of actual and simulated land use in 2020 in the Yanqi Basin.
Land 13 00744 g004
Figure 5. Changes in the area of different land categories in the Yanqi Basin from 2000 to 2020.
Land 13 00744 g005
Figure 6. Land use transfer matrices for the Yanqi Basin during 2000–2010 (a), 2010–2020 (b), and 2000–2020 (c).
Land 13 00744 g006
Figure 7. Spatial distribution of different land types in the Yanqi Basin from 2000 to 2020.
Land 13 00744 g007
Figure 8. Spatial and temporal distribution of CS in different land types in the Yanqi Basin from 2000 to 2020.
Land 13 00744 g008
Figure 9. Development potential and contribution of driving factors of different land types in the Yanqi Basin.
Land 13 00744 g009aLand 13 00744 g009b
Figure 10. Projections of land use area under different development scenarios in the Yanqi Basin.
Land 13 00744 g010
Figure 11. Changes in the spatial distribution of land use under different development scenarios in the Yanqi Basin.
Land 13 00744 g011
Figure 12. Changes in the quantity of CS under different development scenarios in the Yanqi Basin.
Land 13 00744 g012
Figure 13. Changes in the spatial distribution of CS under different development scenarios in the Yanqi Basin.
Land 13 00744 g013
Table 1. Domain weights (parameters).
Land Use TypesCroplandWoodlandGrasslandWaterUnused LandConstruction Land
Domain weights10.3750.4400.3980.00010.560
Table 2. Carbon density data of each land use type in the study area (t/m2).
Land Use TypesAboveground
Carbon Density
Belowground
Carbon Density
Soil Organic
Carbon Density
Cropland0.57.873.6
Woodland4.111.2147
Grassland3.45380.4
Water0.350
Unused land0.192
Construction land0.2290
Table 3. Dynamics of land types in the Yanqi Basin from 2000 to 2020.
20002010
Land TypeArea/km2proportions/%Area/km2proportions/%Area changesK
Cropland2155.6925.872599.3331.20443.642.06
Woodland120.681.4563.770.77−56.91−4.72
Grassland1111.9613.351169.3714.0457.410.52
Water1147.6613.771019.8112.24−127.85−1.11
Unused3784.5345.423411.8540.95−372.68−0.98
Construction land11.080.1367.480.8156.4050.90
20102020
Land typeArea/km2proportions/%Area/km2proportions/%Area changesK
Cropland2599.3331.20 2830.7133.98 231.38 0.89
Woodland63.770.77 20.830.25 −42.94 −6.73
Grassland1169.3714.04 1092.9613.12 −76.41 −0.65
Water1019.8112.24 1075.8312.91 56.02 0.55
Unused3411.8540.95 3219.5938.64 −192.26 −0.56
Construction land67.480.81 91.691.10 24.21 3.59
20002020
Land typeArea/km2proportions/%Area/km2proportions/%Area changesK
Cropland2155.6925.87 2830.7133.98 675.02 1.57
Woodland120.681.45 20.830.25 −99.85 −4.14
Grassland1111.9613.35 1092.9613.12 −19.00 −0.09
Water1147.6613.77 1075.8312.91 −71.84 −0.31
Unused3784.5345.42 3219.5938.64 −564.94 −0.75
Construction land11.080.13 91.691.1080.6136.37
Notes: K refers to the dynamic degree of land use.
Disclaimer/Publisher’s Note: The statements, opinions and data contained in all publications are solely those of the individual author(s) and contributor(s) and not of MDPI and/or the editor(s). MDPI and/or the editor(s) disclaim responsibility for any injury to people or property resulting from any ideas, methods, instructions or products referred to in the content.

