Abstract
For the effective conservation of plant species, it is imperative to manage habitat loss and fragmentation by establishing a protected area network that comprehensively encompasses their habitat. In this study, we identified the suitable habitats for some endemic plant species in the Swat District, Pakistan, to conduct a thorough analysis of proposed protected areas (hotspot areas). Utilizing data from a recent botanical survey, environmental parameters from World-Clim, and various other sources, we determined the habitat of each species using the MaxEnt species distribution model. The modeled habitat suitability for each species were combined to generate maps illustrating endemic richness (hotspots), as well as to prioritize areas based on conservation value and habitat suitability. Future climate projections spanning from 2000 to 2050 were acquired from the WorldClim database Nineteen bioclimatic variables were assessed, incorporating data from three global climate models: CCSM4, HadGEM2-AO, and MPI-ESM-LR. We modeled seven endemic species from the Swat District and, by combining their maps, found three hotspot areas which show more environmental suitability under future climatic conditions. The future model forecasts a significant decrease in population density by the year 2050. Currently, these species exhibit their highest density along the eastern and southern borders of the valley, particularly in the Karakar, Elum border, Mankial Kalam, and Gabral Kalam areas. The anticipated alterations in density and distribution could have a considerable impact not only on the tree species but also on the associated sub flora.
1. Introduction
Plant biodiversity is vital for a healthy ecosystem that sustains life on Earth [1]. As primary producers, plants provide essential resources such as wood, fuel, food, clothing, and medicinal compounds for humans and animals. They are natural sources of chemicals used in various industries [2]. Plant diversity also safeguards soil, purifies air and water, prevents floods, and stabilizes landscapes [3]. Around 1.6 billion people heavily rely on forest resources for their livelihood, and 80% of the global population depends on indigenous plant-derived medicines for primary healthcare [4]. The connection between human welfare and plant diversity emphasizes its significance for sustainable livelihood security and regional safety [5].
Despite the pivotal role of plants in supporting life on Earth and their significance in all ecosystems, plant biodiversity is under severe global threat [6]. The number of endangered species increases notably each year [7] The destruction and modification of habitats, attributed to human overexploitation, pollution, and climate change, are key factors leading to the decline in natural populations and sometimes the complete loss of certain species. Many endangered species are typically limited to specific geographic regions, often existing in only a few remaining small wild populations [8]. A substantial proportion of these endangered species are endemic, making them unique, and often only a few small wild populations remain resilient [9].
An endemic species refers to a species naturally and exclusively found in a particular geographic area, exhibiting a high level of adaptation to that specific region [10]. Based on the size and boundaries of their habitats, these species can be categorized into different classifications: “local endemic” (confined to a small area), “provincial endemic” (restricted to the limits of a province), “national endemic” (confined to a nation’s limits), “regional endemic” (confined to a specific geographical region), and “continental endemic” (limited to a continent) [11]. Most endemic species possess a combination of characteristics that render them more susceptible to anthropogenic threats or natural changes. These characteristics include limited distribution, existence in one or few populations, small population sizes, decreasing population trends, excessive human collection, limited reproductive capacity, specific habitat requirements, and dependency on stable and consistent environments [12]. The presence of these characteristics increases the vulnerability of endemic species to extinction. Consequently, it is crucial to carefully monitor and manage endemic species while prioritizing their conservation efforts on a global and regional as well as local scale [13].
Understanding the distribution of species is crucial for effective environmental management [14]. Assessing the distribution of native plant species, especially endemic plants, stands as a pivotal initial phase in evaluating their statuses and enhancing the effectiveness of conservation endeavors [15]. The documented occurrences of a species might only represent a fraction of the actual areas inhabited by the species and may overlook crucial information that is crucial for their preservation. Species distribution models (SDMs) offer a solution to these challenges. These statistical algorithms leverage incomplete datasets, scrutinize the relationships between species and their environments across space and time, and are recognized for their robust predictive capacity to find hotspot areas where most of a species may be possibly exist in future [16,17]. Although multiple correlative models, as evaluated in Elith*, H. Graham [16] exist, MaxEnt has emerged as the most extensively utilized SDM [18,19] due to its precise predictive abilities and its capacity to handle intricate responses and relationships among predictor variables [20]. The extensive documented potential of SDMs in conservation planning is evident [21,22,23,24]. SDMs can guide surveys [25]; assist in designing reserves [24]; and pinpoint critical habitats of endangered, threatened, or native species [26]. Despite this, the practical application of SDMs to address conservation issues remains limited in real-world scenarios [14].
Drawing from the observation that certain regions exhibit significantly greater biodiversity than others, area-based strategies are commonly recommended for the planning of species conservation [27]. Regions characterized by a high abundance of unique species [28], known as endemics (species exclusive restricted to a particular location) and facing substantial habitat loss, are frequently identified as “hotspots” [29]. Conversely, an SDM provides a distinct perspective by identifying the most favorable climatic zone or region for endemic plants, referred to as a biodiversity hotspot [30]. Biodiversity hotspots represent ecosystems of utmost priority for conservation due to their notable concentration of endemic species, exposure to high-impact threats [31], and heightened susceptibility to climate change [32]. A comprehensive count of 34 proposed global biodiversity hotspots, as outlined by Mittermeier, Da Fonseca [33], designates specific regions with paramount conservation significance. These areas are distinguished by remarkable concentrations of endemic species and, concurrently, experience notably elevated rates of habitat loss [31].
The comprehensive discussion above reveals that there is no proper documented record of plant hotspots in Pakistan. However, the Flora of Pakistan [34] has documented 1389 genera and 4758 species across 215 families. Approximately 400 taxa within four genera are recognized as endemic, and ongoing assessments are currently underway for 183 genera, encompassing 763 species from five families, to determine their endemism statuses [34]. Notably, the concentration of flowering plant diversity in Pakistan is predominantly found in mountainous regions and specific localities [35], particularly in the Swat District. This district stands out as a biodiversity hotspot in Pakistan, with various plant species, particularly those that are endemic, facing the imminent threat of extinction due to the impacts of global climate change. A total of approximately 1500 species were reported from Swat [36]. Among the 1500 species examined, 60 have been identified as endemic, with seven of these species exclusively found in Swat. Swat was chosen as a case study for conservation due to the aim of identifying a hotspot with minimal financial costs, thus mitigating the risk of extinction for these species in the future.
This study aims to model the potential impact of climate change on the distribution of forest trees and subflora in Swat Valley, with a particular focus on seven rare and endemic species: Abies pindrow, Allium tripterum, Corydalis goviniana var swatensis, Elymus borianus, Geranium swatensis, Juniperus excelsa, and Nepeta griffithii Hedge. These species significantly contribute to the subflora, especially the medicinal and aromatic plants (MAPs) in the area. Hence, this study aims to (1): model the distribution and habitat suitability of seven endemic species in the Swat area by applying the Maxent model, (2): explore the most important environmental variable affecting each species’ habitat suitability, (3): combine the habitat suitability maps of the species to find conservation hotspots, and (4): investigate the impacts of climate change on species habitats and conservation hotspots.
2. Materials and Methods
2.1. Study Area
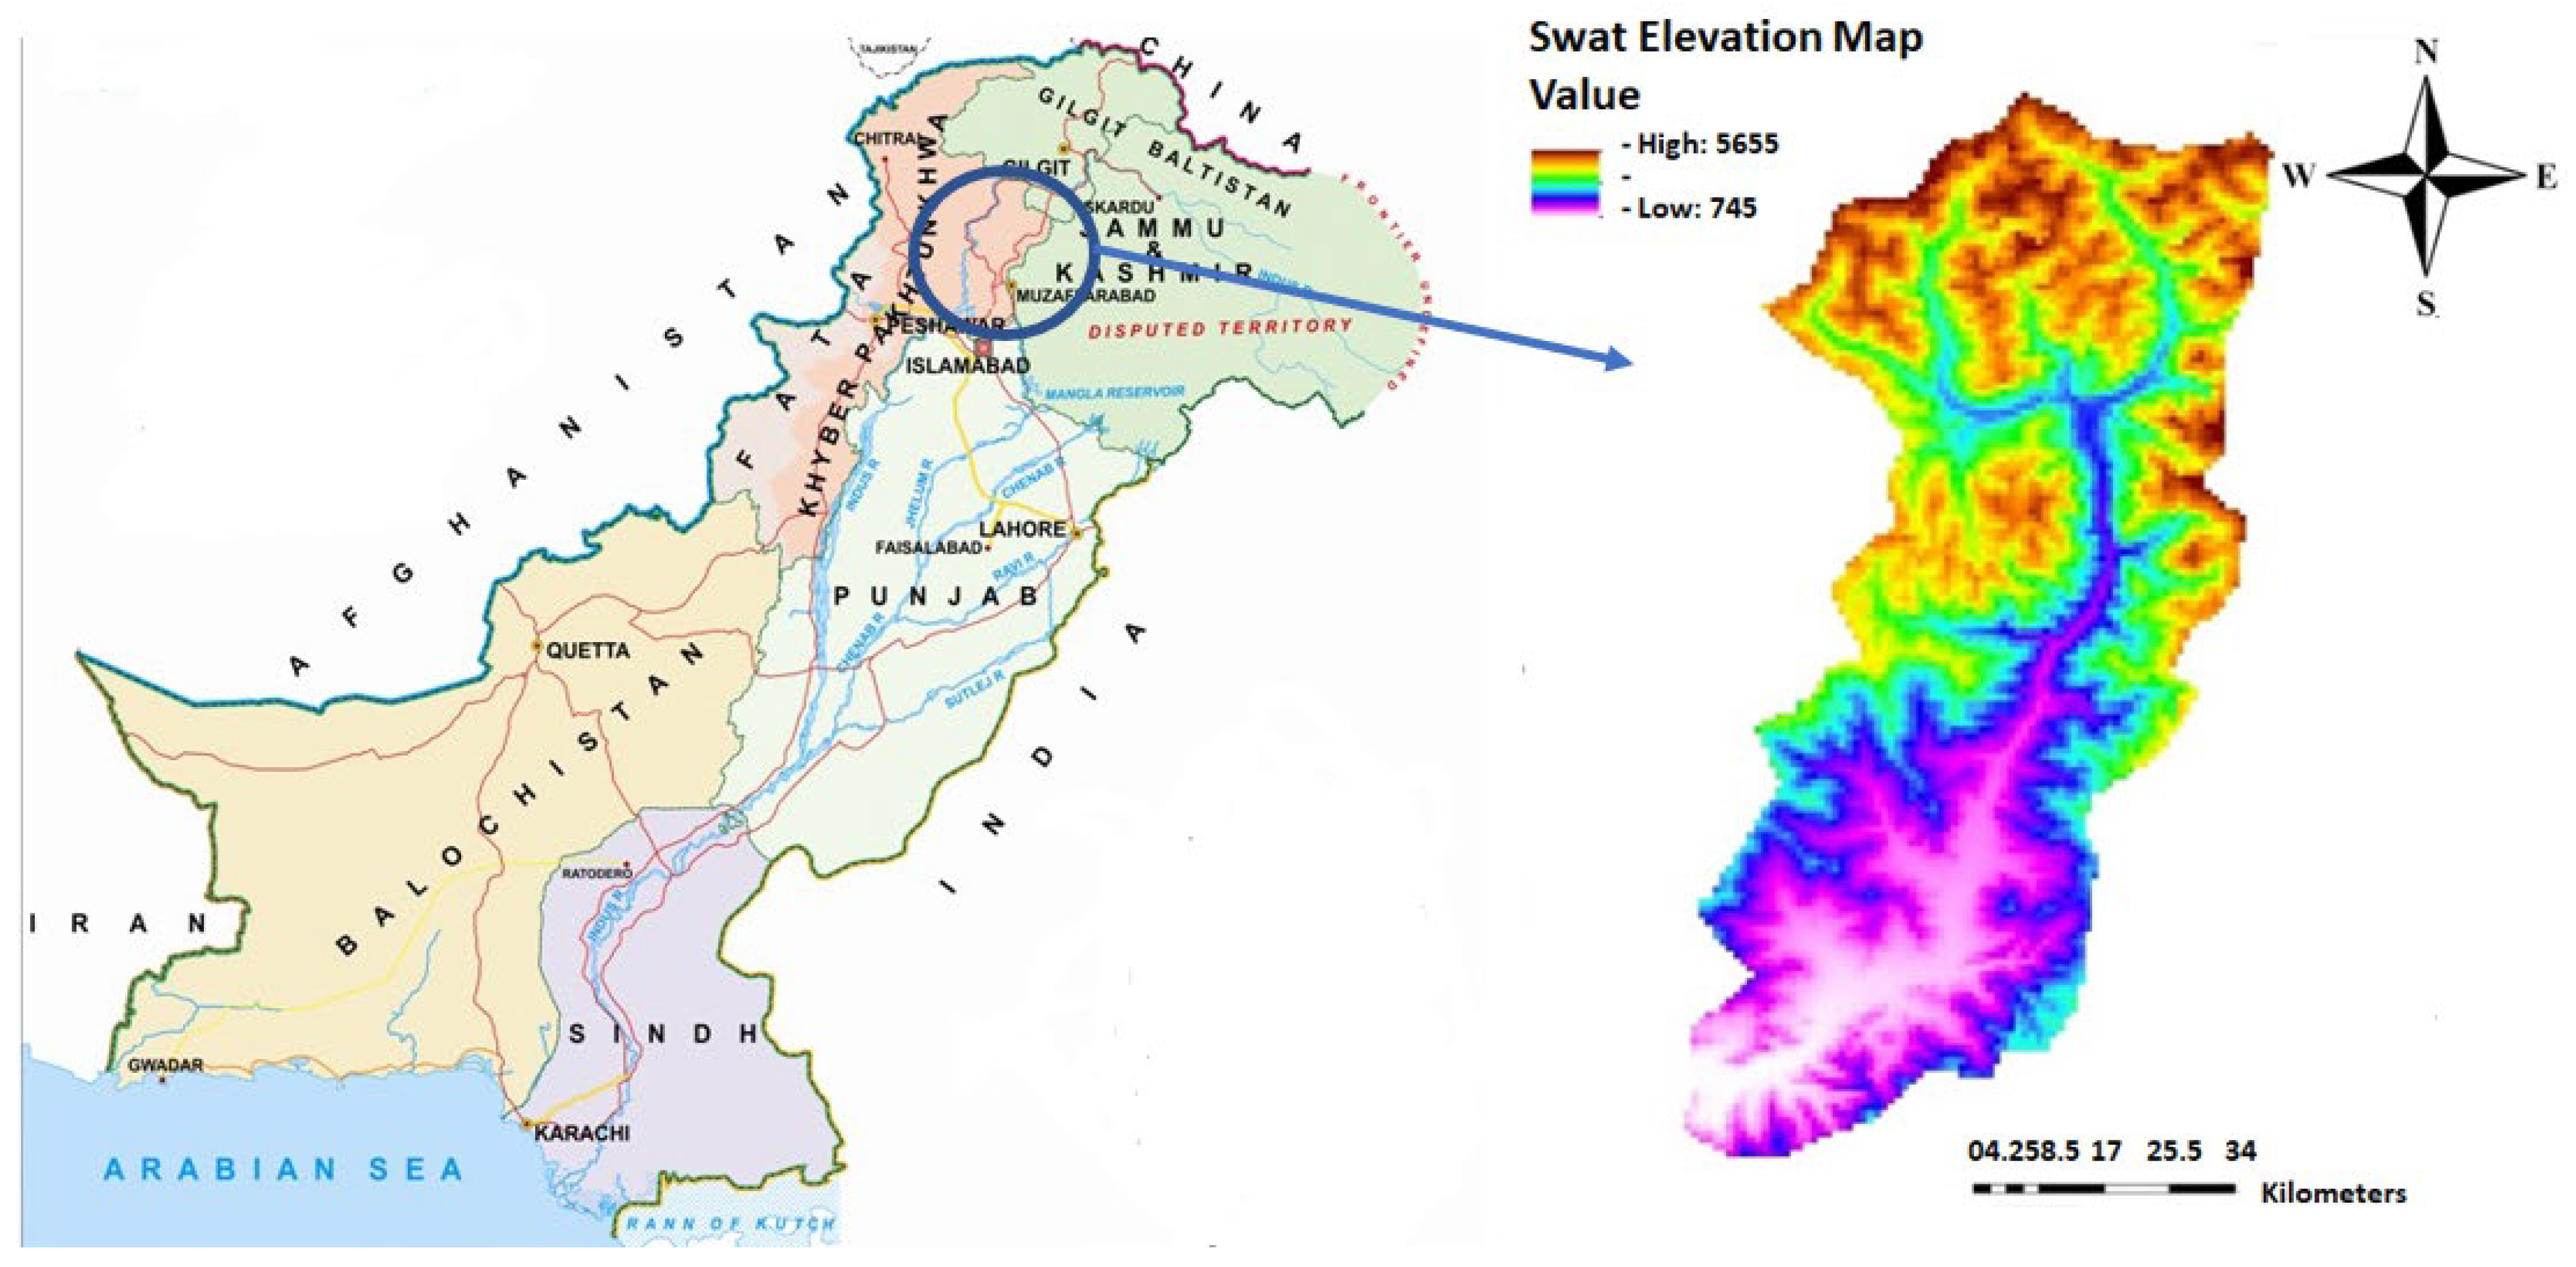
The Swat District has a unique combination of phyto-ecological and agro-climatic conditions which favors the occurrence of a variety of natural resources [37]. The total area of the Swat District is about 6226 km2. The Swat District is stretched between 34°30′–55′ N and 71°45′–72°50′ E in the Hindu Kush range (Figure 1). The valley is home to many mountain peaks ranging from 600 m up to the summit of Falaksair (with 6621 m elevation) which is covered snow throughout the year. As per phytogeographic analysis [35], the Swat District is located in Sino-Japanese (Eastern Asiatic) region. At its northern side, Swat is connected with the Chitral and Ghizar Districts; at the eastern side with two districts, i.e., Shangla and Kohistan; at the southern side with the Buner District; and at the western side with Upper and Lower Dir [38]. The Swat District is considered one of the most beautiful and attractive valleys of Khyber Pakhtunkhwa. It is home to heterogeneous vegetation, including dense coniferous and oak forests. The valley comprises high-altitude meadows; numerous vast, lush, green cultivated lands; elevated mountain peaks; snow-covered glaciers; and beautiful tributary rivers streams, lakes, and ponds. Swat has diversified flora in the different seasons of the year due to its varied topography, geological conditions, habitats, and climate. In the last couple of decades, a number of research works have been carried out from different localities of Swat. Most of these research works consist of either ethnobotanical studies [39,40,41,42] or related to quantitative analyses of vegetation [43], but either voucher specimens have not been mentioned or no proper record of herbarium specimens is provided. Most of these research works do not explain any type of protection and conservation of rare and endemic plant taxa, nor there is any description of species distribution models; therefore, the current research is located in the Swat Valley for finding out the current conservation status of these rare, endemic plant taxa and to propose proper measures for their conservation.

Figure 1.
Swat geographic location and elevation map.
The study was designed to facilitate the ex situ and in situ conservation of seven endemic species, namely, Abes pindrow, Allium tripterum, Corydalis goviniana var swatensis, Elymus borianus, Geranium swatensis, Juniperus excelsa, and Nepeta griffithii, due to their significant importance in medicinal, indigenous, and cultural contexts. The selection of these seven endemic species is underscored by several key reasons.
Abies pindrow is one of the tallest trees; it can reach up to 30–40 m in height and is pyramidal in shape, with 2–4 cm long narrow spiral leaves. It is monoecious, characterized by scale-like leaves ranging from 1.5 to 2 mm in length and broadly ovate in shape. Typically, these trees are inhabitants of high-elevation mountainous regions that are specifically found between 2000 to 4000 m above sea level. It is commonly utilized for its medicinal properties, serving as an antiperiodic, antispasmodic, carminative, astringent, and expectorant; as a fever remedy; and as treatment for asthma, bronchitis, stomachic issues, bladder catarrh, cough, and bronchitis [44]. Additionally, this species is valued for its timber.
Geranium swatensis, is a perennial herb with a slender rhizome. It is a tall plant that can reach up to 45 cm in height, has 5–7 angled cauline leaves, and bears pink-purple flowers. The species holds a storied history within traditional medicine across multiple nations and herbal practices. Its widespread acclaim stems from its application in treating diverse digestive issues and its attributed range of beneficial qualities, including anti-inflammatory, hemostatic, antidiabetic, antibacterial, antiallergic, anti-cancer, and diuretic properties [45].
Juniperus excelsa: This is a middle-sized monoecious, with scale-like leaves that are between 1.5–2 mm long and broadly ovate in shape. The tree commonly inhabits high-elevation, mountainous areas, i.e., from 2000–4000 m asl. This tree has high-quality fragrant wood, is used in construction and as firewood, and is also burned as incense. Furthermore, the tree’s bark serves as a local roofing material. In addition, J. excelsa is utilized in treating bronchitis infections, diabetes mellitus, and diarrhea [46].
Nepeta griffithii is a perennial herb with stems branching from its base. It is typically between 30–50 cm tall, with a spreading villous or shortly retrorse pilose and eglandular indumentum and is leafy with purplish-green flowers. It is found up to 1100 m a.s.l. and contains an abundance of iridoid glycosides and phenolic compounds which display a wide range of pharmacological effects including antioxidant, antimicrobial, phytotoxic, antiparasitic, and antiviral activities as demonstrated in studies by [47].
Allium tripterum is a species that grows wild and is found exclusively in Mingora City, which is located in the Swat District. This plant possesses antioxidant properties, has the ability to reduce plasma glucose concentrations and body weight, and plays a preventive role against cardiovascular diseases. Additionally, it serves as fodder for cattle [48].
Corydalis govaniana: This is a tall geophyte herb up to 25 cm, with yellow flowers between 20–25 mm long and oblanceolate, denticulate, and sessile or sub-sessile leaves. This species exhibits potential medicinal attributes, including anti-inflammatory and analgesic effects. It is cultivated for ornamental purposes. Indigenous communities may incorporate the plant into rituals, ceremonies, or traditional customs. This species engages in distinct interactions with other organisms, such as pollinators or seed dispersers. Grasping these ecological relationships is crucial for the preservation and governance of ecosystems [49].
Elymus borianus: This is a tufted perennial without rhizomes. It grows up to 35–100 cm high and is an erect, and herbaceous stout plant. It is one of the wild varieties of wheat grass and serves various purposes, including being utilized as forage for fodder, hay, and pasture. It finds application in food, serves as raw material for household items like basketry and broom handles, and has medicinal uses. Indigenous communities often incorporate E. borianus into their practices for various purposes [50].
2.2. Species Occurrence Data
This comprehensive field study covered the entire Swat District, beginning from the lowest elevation at 745 m above sea level (a.s.l) in early spring and extending along the altitudinal range to the summit of Falaksar [51,52]. This study spanned from 2019 to 2023, capturing the full bloom of most plants at an elevation of 6261 m above sea level. The entire study area underwent examination and monitoring from February to October each year, aligning with the flowering and fruiting seasons. The study area was divided into different zones, and 25 localities in Swat were selected based on previous reports indicating the presence of rare, endemic, or threatened plant species. These chosen locations served as representatives of the entire study area, encompassing various elevations, aspects, and geographic conditions.
Emphasis was placed on previously unexplored regions and sites, with the duration of field trips contingent upon accessibility and remoteness. Each habitat was documented through the collection of plant specimens and detailed field notes, including photographic documentation that focused on plant habits, habitats, ecological coordinates, flowers, and fruits. Physiographic details such as latitude, longitude, and altitude were recorded using altimeters and GPS devices, following Stephenson’s method [53]. For precise spatial positioning, the Red-Hen DX-GPS system was employed. A Nikon D7200 camera was connected to a Garmin GPS to identify and capture images of all species while simultaneously storing data for subsequent computer analysis. These specimens underwent a proper preservation process following Bridson’s method [54]. All collected specimens were pressed and dried in blotting paper. The specimens were immersed for 30–60 min in a dilute solution of copper sulfate (CuSO4), mercuric chloride (HgCl2), and a scientific-grade 40% dilute solution of ethanol to prevent pest degradation of the plant species. The specimens were dried again in blotting papers and mounted on standard herbarium sheets of 29 cm × 41.5 cm [55].
The identification of plant specimens was compiled from authoritative sources such as the Flora of Pakistan [56], Flora Iranica [57], recent taxonomic literature, and other pertinent botanical references. Each species was abbreviated with author names following Brummitt and Powell [58]. The collected specimens were submitted to the herbarium at the Centre for Plant Sciences and Biodiversity, University of Swat, for reference and future research.
Before conducting the study, a thorough review of the existing species’ occurrence data was undertaken on regional and national levels [51], especially for endemic species. Ultimately, our dataset was deemed the most suitable choice due to the lack of any prior research data on both regional and national levels according our pattern. It will be a great advantage for providing a relatively fine-grained grid structure derived from our research datasets for a substantial sample size and for extensive geographical coverage and conservation of these valuable endemic species. As the available data consisted solely of species presences and because most modeling methods require a binary data structure, the generation of absence data became necessary.
2.3. Ecological Predictors
Predictors were chosen by considering the ecological limitations present in the literature for all the previously stated endemic species (Table 1). The final selection of predictors comprised the maximum temperature during the warmest month, precipitation levels in the warmest quarter, annual precipitation, soil pH, soil bulk, soil moisture, soil organic, elevation, slope, and aspect. The choice of utilizing maximum temperatures was favored over the averages due to the expectation that temperature extremes wield a greater influence on the ecological amplitude [59]. There is evidence that extreme temperature occurrences have significantly impacted vegetation, particularly over the past two decades, and projections indicate a continuation of such impacts in the future [60,61]. The climate data from the period between 1950–2019 and future data up to 2050 were sourced from the CHELSA dataset, version 1.2 [62]. Soil information was acquired from the ISRIC project Soil Grids 1 km2 [63]. Elevation, aspect, and slope data were derived using the GTOPO30 digital elevation model [64]. The projected future climate data were averaged over 2000–2050 and were obtained from the World-Clim database [65]. In total, 19 bio-climate variables were examined [60], encompassing three global climate models: (GCM)—CCSM4, HadGEM2-AO, and MPI-ESM-LR. The generalized circulation models were taken into account, and all the bioclimatic dataset raster maps were standardized to a consistent resolution of approximately 1 km2, aligning with the resolution of the CHELSA dataset chosen for practical purposes. The soil analysis was determined from the raster maps for the soil bulk, soil pH, soil organic, and soil moisture obtained from Google engine (2023) in our comprehensive research study. All the raster maps of GCM for 2019 and 2050 of RCP 2.4, 4.5, 6.0, and 8.5 were clipped for the Swat map and checked for same pixel sizes by using ArcMap version 10.8.3 [66]. Slope and aspect were computed from the projected Digital Elevation Model (DEM) using ArcMap. As Maxent analysis provides a powerful tool for understanding the distribution of endemic plant species and informing conservation planning and management strategies, we ran the species distribution models, along with 19 bioclimatic and some physiographic factors such as slope, aspect, soil pH, soil bulk, and soil organic, on Maxent’s latest updated version (2023).

Table 1.
Predictors of habitat suitability.
Ultimately, in order to pinpoint the hotspot encompassing all seven species, we scrutinized the species distribution maps for each of the seven species. Through this analysis, we identified the hotspots, which denote areas with the highest likelihood of encountering these species, utilizing GIS ArcMap version 10.8.3.
2.4. Model Assessment and Climate Change
The evaluation of the individual models was conducted by assessing their performances using two key metrics: the area under the receiver operating characteristics curve (AUC) and model calibration. AUC measures the model’s ability to accurately distinguish between presence and absence at random test sites, which serves as an indicator of its discrimination capacity [67]. In this study, AUC was computed using dependent test data, specifically through cross-validation by subsampling.
Model calibration, on the other hand, gauges the goodness of fit between predicted and observed occurrences, providing insights into a model’s transferability across space or time [68]. The anticipation that future climate conditions in Pakistan may surpass the existing climatic range due to overpopulation and urbanization, especially in Swat, and potentially at one end of the distribution, emphasizes the need for cautious interpretation of the models [69]. To address this uncertainty, an analysis was conducted comparing current climatic parameter ranges to their projected future versions across various scenarios. The findings are showcased through categorized maps that pinpoint areas where future climate parameters are expected to exceed the current calibration range. These areas, characterized by a “novel climate”, signify regions where there is greater uncertainty in predicting future outcomes (hotspot).
3. Results
All the species’ models were separately run after resampling the maps on GIS Pro (10.8.3). The models were run on MaxEnt along with 19 bioclimatic factors and the previously stated physiographic factors. The jackknife analysis result and creative response curve (CRC) of each endemic species are as follows.
Species Distribution Mapping
Nepeta griffithii Hedge:
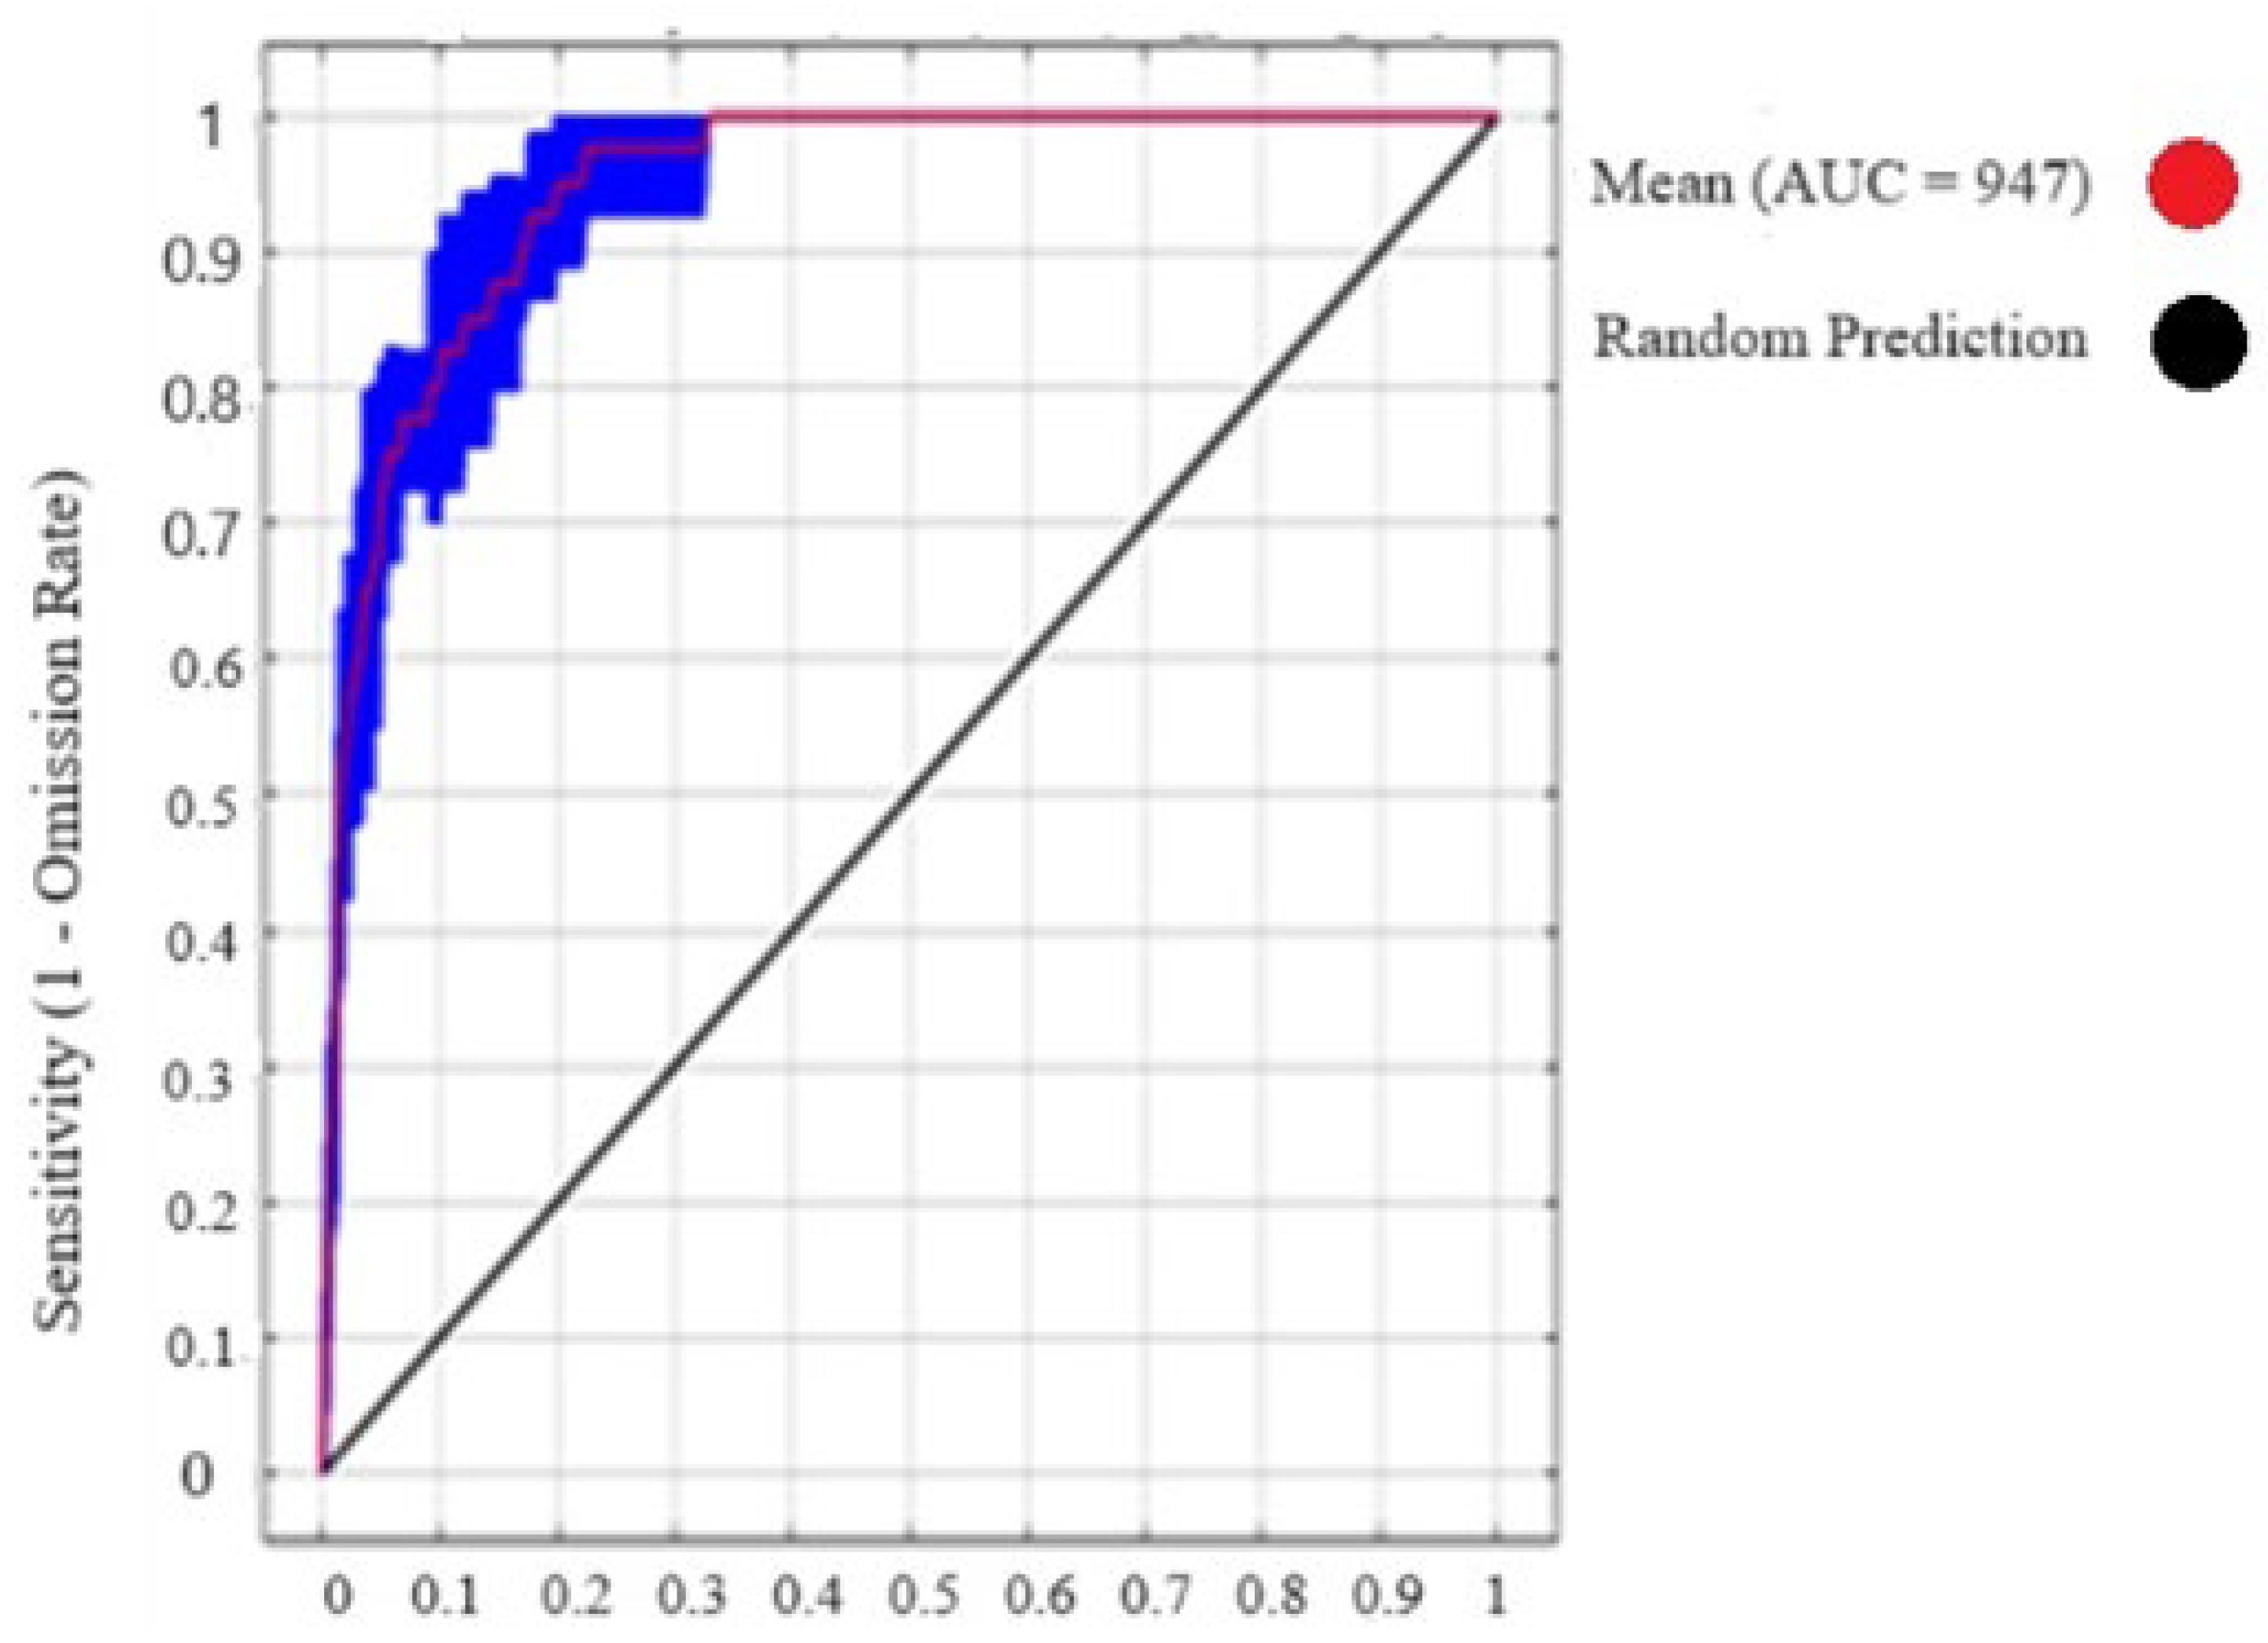
The assessment involved conducting jackknife tests with the model to produce outcomes specific to Nepeta griffithii. The accompanying figure demonstrates the AUC (Figure 2). The pivotal factors influencing the species distribution model (SDM) are ranked by their significance as follows: bio-16 (precipitation of the wettest quarter), bio-13 (precipitation of the wettest month) bio-17 (precipitation of the driest quarter), bio-12 (annual precipitation), bio-3 (isothermality (100*mean diurnal range/annual temperature range) or (bio_2/bio_7*100)), and bio-2 (mean diurnal range (mean of monthly (max temp-min temp), as well as some physiographic factors such as altitude, soil bulk, soil organic, and soil pH. These factors’ effects are shown on the model in a descending order of impact (Figure 3). Figures for other species show similar results (see in Supplementary Materials).
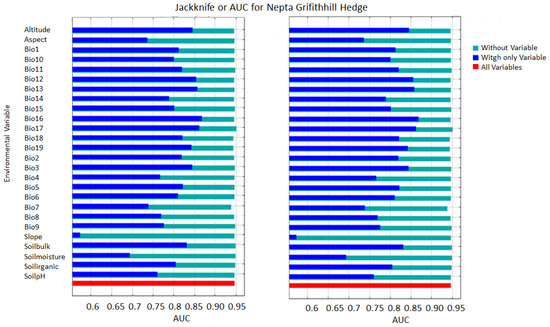
Figure 2.
Max-Ent jackknife test result for area under cover (AUC) of Nepeta griffithii of the current (2019–2023) and future climatic scenarios (2050).

Figure 3.
Max-Ent average sensitivity vs. specificity of Nepeta griffithii.
The results obtained for analysis of N. griffithii from the MaxEnt model showed an average AUC of 0.95. The regularization training gain (RTG) achieved a score of 2.2, while the test gain (TG) value, when compared with all variables, was also noted at 2.0. The receiver operating characteristic (ROC) curve reaching its maximum at 1.0 indicates an ideal test, indicating the highest achievable performance level (Figure 3).
In future scenario projections, the model predicts a change in the primary influential variables, with bio-16 becoming the most significant, followed by bio-13, bio-17, bio-3, bio-12, and bio-19, predominantly. Additionally, there’s an anticipated gradual rise in the impacts of altitude, soil bulk or texture, soil organic content, and soil pH on the distribution of the species in the forthcoming period up to 2050 (Figure 3).
A comprehensive analysis of future trends suggests that this particular species could face extinction in Swat and its adjacent areas because its habitat requirements do not match those found in any other areas within Swat. Unless conservation efforts are put in place, the species may disappear from this region.
Juniperus excelsa M. Bieb
The jackknife analysis conducted determined the present distribution probability of the area under curve (AUC) and showed that the most significant contributions of the bioclimatic variable were bio-1, bio-3, bio-6, bio-8, bio-10, bio-11, and altitude, which represent annual mean temperature, isothermally (100*mean diurnal range/annual temperature range) or (bio-2/bio-7 × 100), minimum temperature of the coldest month, mean temperature of the wettest quarter, mean temperature of the warmest quarter, mean temperature of the coldest quarter, annual precipitation, and the elevation of the area, respectively. Out of all these bioclimatic and physiographic factors, bio-3 affects the species distribution of J. excelsa the most, followed by bio-6, bio-11, bi-1, and bio-8 respectively. The average AUC recorded by MaxEnt is 0.89, while the RTG (regularization training gain) was up to 1.3; the test gain (TG) evaluation was recorded up to 1.2; and the receiver operating characteristic (ROC) curve, which was up to 1, was the perfect test with highest value.
Regarding future projections, the model presented a different scenario, i.e., bio-3 was the primary contributing variable followed by bio-6, bio-11, bio-1, bio-5 (max temperature of the warmest month) and bio-2 (mean diurnal range, mean of monthly “max temp–min temp”) with a gradual increase of effect by altitude in the future (Figure 4 and Figure 5).
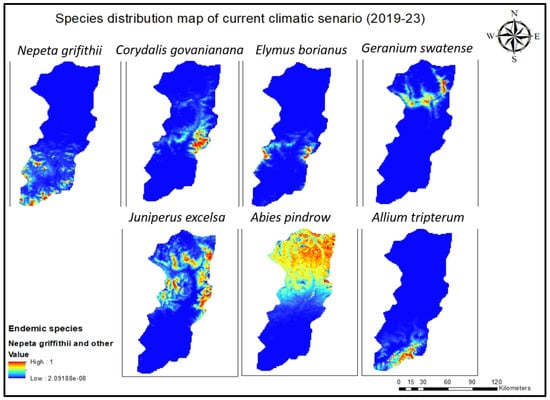
Figure 4.
Current species distribution model for all seven endemic species of Swat.
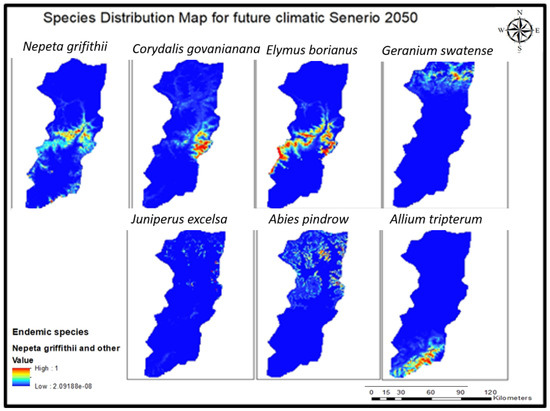
Figure 5.
Future climatic (2050) species distribution model of seven endemic species of Swat.
Abies pindrow Royle
The jackknife analysis conducted reveals the current distribution probability (as depicted in the figure) of the area under curve (AUC). It identifies the most influential bioclimatic variables as bio-13 (precipitation of the wettest month), bio-8 (mean temperature of the wettest quarter), bio-18 (precipitation of the warmest quarter), bio-16 (precipitation of the wettest quarter), bio-4 (temperature seasonality (standard deviation × 100)), bio-19 (precipitation of the coldest quarter), and altitude.
Among these bioclimatic and physiographic variable, bio-3 acts as the primary driver affecting the species distribution of A. pindrow, followed by bio-8, bio-18, bio-16, bio-4 and bio-19, in that order of importance. Max-Ent recorded an average AUC of 0.76, while the regularization training gain (RTG) reached up to 0.76, and the test gain (TG) evaluation was recorded at 1. The receiver operating characteristic (ROC) curve, reaching up to 0.75, indicates a perfect test with the highest achievable value.
Looking ahead to future projections, the model presents a different scenario where bio-12 (annual precipitation) becomes the primary contributing variable, followed by bio-13, bio-18, bio-14 (precipitation of driest month), bio-17 (precipitation of driest quarter), bio-19 and bio-4. Additionally, there is an anticipated gradual increase in the impact of altitude on the species distribution in the future. The overall summary of future analysis shows that this species will migrate to high-altitude areas with suitable bioclimatic conditions and, if not conserved, may disappear from Swat (Figure 4 and Figure 5).
Allium tripterum E. Nasir
The jackknife analysis of A. tripterum illustrates the current distribution probability of the area under curve (AUC), as depicted in the Figure. It identifies several influential bioclimatic variables, with bio-19 (precipitation of the coldest quarter), bio-8 (mean temperature of the wettest quarter), bio-18 (precipitation of the warmest quarter), bio-13 (precipitation of the wettest month), bio-12 (annual precipitation), bio-9 (mean temperature of the driest quarter), bio-15 (precipitation seasonality (coefficient of variation), bio-16 (precipitation of the wettest quarter), bio-3 (isothermality (100*mean diurnal range/annual temperature range) or (bio_2/bio_7*100)), bio-1 (annual mean temperature), bio-11 (mean temperature of the coldest quarter), bio-2 (mean diurnal range (mean of monthly (max temp–min temp)), and altitude being the most influential bioclimatic factors in descending order.
The MaxEnt analysis model shows an average AUC of 0.95, with the regularization training gain (RTG) reaching up to 2.5, and the test gain (TG) evaluation achieving a score of 2.2. The receiver operating characteristic (ROC) curve peaked at 1.0, which was considered as maximum value, indicating a perfect test with the highest achievable value.
In projecting future scenarios, the model highlights a shift during which bio-12 (annual precipitation) becomes the primary contributing variable, followed by bio-13, bio-18, bio-14 (precipitation of the driest month), bio-17 (precipitation of the driest quarter), bio-19, and bio-4. Furthermore, there is an anticipated gradual increase in the impact of altitude on the species distribution in the future.
The overall future analysis suggests that this species will likely migrate to higher altitude areas with suitable bioclimatic conditions. Failure to conserve these conditions could result in the species’ extinction from Swat (Figure 4 and Figure 5).
Corydalis govaniana var. swatensis:
The jackknife analysis conducted on A. tripterum demonstrates the current probability distribution of the area under curve (AUC) as shown in the accompanying figure. It identifies several influential bioclimatic factors, with the order of significance being bio-6 (minimum temperature of the coldest month), bio-7 (temperature annual range (bio-5–bio-6)), bio-15 (precipitation seasonality (coefficient of variation)), bio-16 (precipitation of the wettest quarter), bio-11 (mean temperature of the coldest quarter), bio-13 (precipitation of the wettest month), with altitude being the most influential factor.
The MaxEnt analysis model findings include the average AUC of 0.95, with the regularization training gain (RTG) reaching 2.2, and the test gain (TG) value compared to all variables was recorded as 2.2. The receiver operating characteristic (ROC) curve reaching a peak value of 1.0 signifies a perfect test, suggesting the highest attainable performance.
In projections for future scenarios, the model emphasizes a shift where precipitation of the warmest quarter (bio-18) becomes the primary contributing variable, followed by bio-7, bio-13, bio-12, bio-6, and bio-7, respectively. Additionally, there is an expected gradual increase in the influences of altitude, soil organic, and aspect on the species’ distributions in the future. The overall analysis of future trends suggests that this species will possibly disappear from Swat region if not conserved, as this kind’s habitat does not match any other locality in Swat.
Elymus borianus (Meld.) T. A. Cope, comb. nov.
The model was run for analysis of the jackknife tests; the results obtained for Elymus borianus are as follows: The demonstrated area under curve (AUC) was 0.97. The bioclimatic and the physiographic factors, which majorly influence the species’ distribution model (SDM), was, in order of significance, bio-15 (precipitation seasonality (coefficient of variation)), bio-19 (precipitation of the coldest quarter), bio-6 (minimum temperature of the coldest month), bio-9 (mean temperature of the driest quarter), bio-11(mean temperature of the coldest quarter), bio-1 (annual mean temperature), bio-3 (isothermality (100*mean diurnal range/annual temperature range)) or (bio-2/bio-7*100) and altitude, respectively, in descending order.
The results obtained from the MaxEnt analysis model show an average AUC of 0.97. The regularization training gain (RTG) achieved a value of 2.8, while the test gain (TG) value, compared to all variables, also registered as 2.6. The receiver operating characteristic (ROC) curve reaching its peak value of 1.0 indicates an ideal test, implying the highest achievable performance.For future scenario projections, the model highlights a transition during which the most significant contributing variable shifts, followed by bio-19, bio-15, bio-12, bio-6, bio-7, bio-11, bio-1, and bio-3, predominantly. Furthermore, there is an anticipated gradual rise in the impacts of altitude, soil organic content, soil PH, and slope on the species’ distribution in the future.
In the future, the overall distribution of the species suggests a potential advantage from positive climate changes which support its propagation in the Swat region, provided that conservation efforts prevent its extinction.
Geranium swatense Schonbeck-Temesy
This analysis involved running the model for jackknife tests, yielding the following results for Gernium swatense. The figure illustrates the demonstrated area under curve (AUC). The significant factors influencing the species distribution model (SDM), ranked in order of importance, are as follows, in descending order of impact: bio-19 (precipitation of the coldest quarter), bio-14 (precipitation of the driest month), bio-17 (precipitation of the driest quarter), bio-13 (precipitation of the wettest month), bio-1 (annual mean temperature), altitude, soil organic, and soil bulk.
The outcomes derived from the Max-Ent analysis model revealed an average AUC of 0.97. The regularization training gain (RTG) attained a value of 2.5, whereas the test gain (TG) value, in comparison with all variables, was also recorded as 2.3. The receiver operating characteristic (ROC) curve hitting its pinnacle at 1.0 signifies an optimal test, suggesting the highest attainable performance level.
For future scenario projections, the model indicates a shift in the most influential contributing variable, with bio-19 taking precedence, followed by bio-14, bio-17, bio-16, bio-13, bio-12, and bio-2, respectively. Moreover, there is an expected gradual increase in the influences of altitude, soil organic content, soil pH, soil bulk or texture, and slope on the species’ distribution in the future. An overarching analysis of future trends implies that this species may potentially vanish from the Swat region because its habitat does not align with any other location within Swat, unless conservation efforts are implemented (Figure 4 and Figure 5).
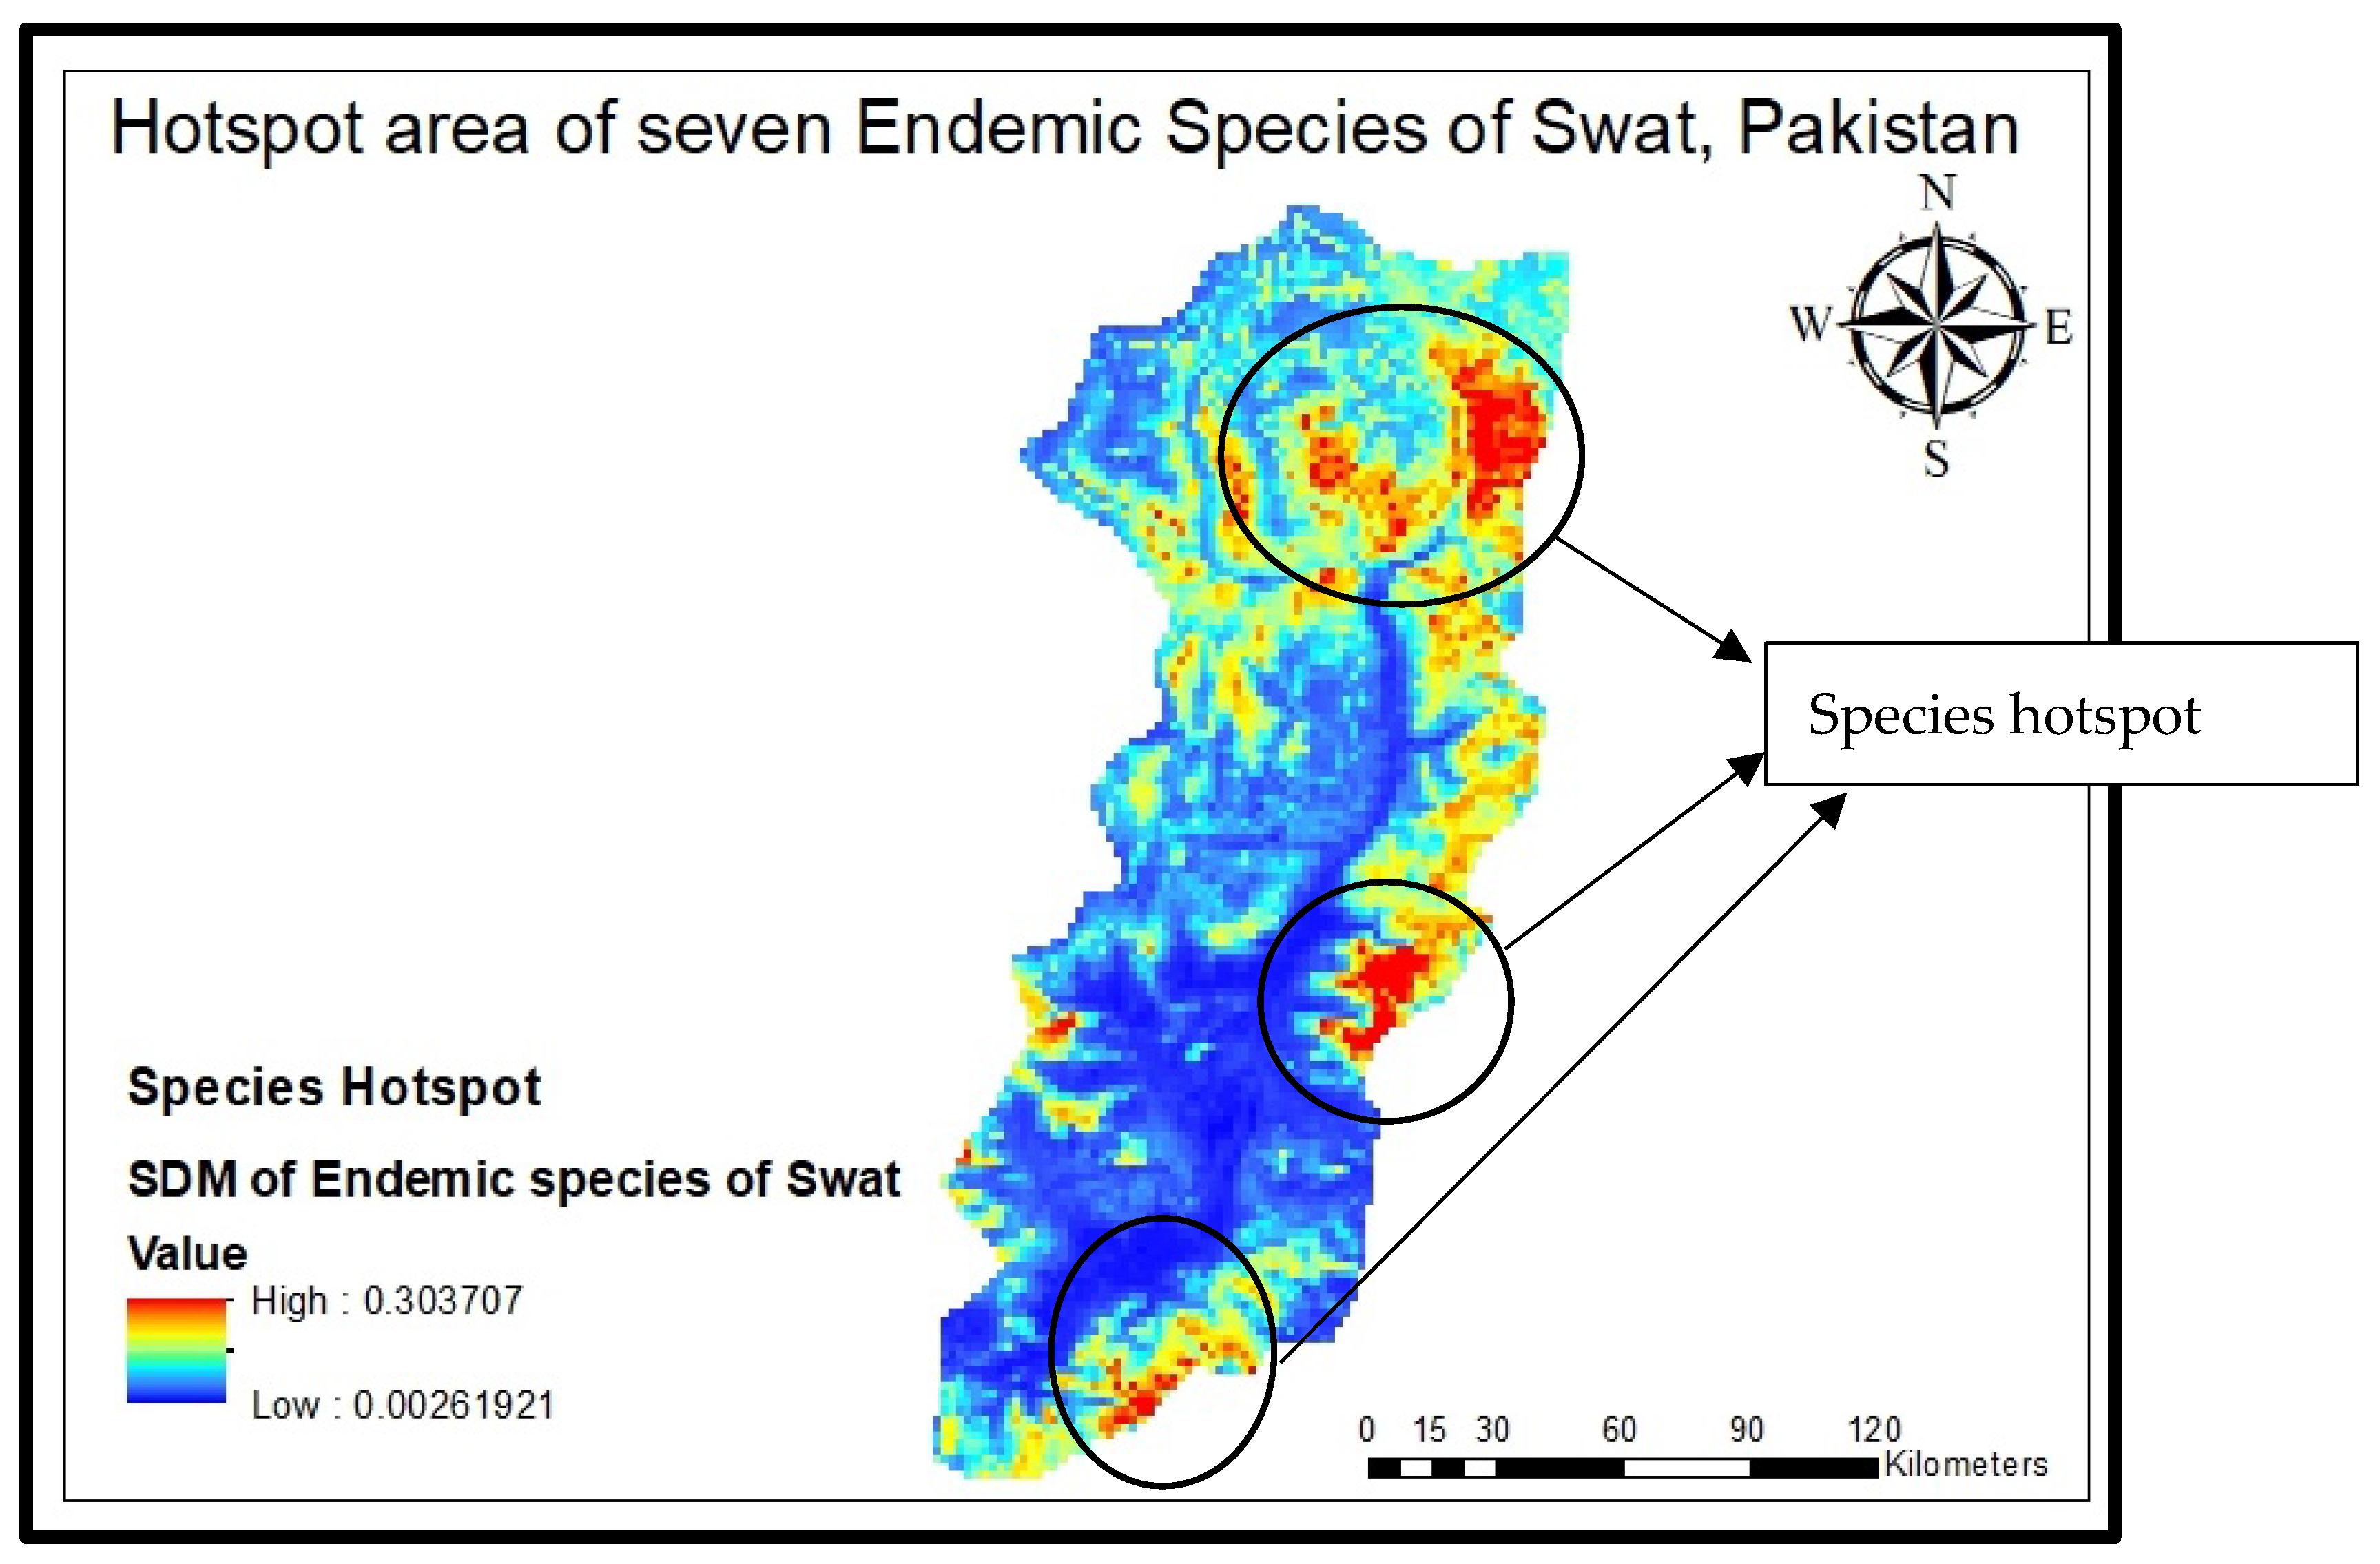
All the species distribution maps of these endemic species were subjected to Arc GIS Pro (10.8.3) to formulate one combined map and to pinpoint hotspot areas (Figure 6). The model forecasted the highest concentration of species in some hotspots along the border of the Swat Valley, specifically on the Karakar and Elum borders along with the Marghuzar area in lower altitude zones and in the upper elevated zone. Most of the seven species are found in Madyan, the linked area Mankial and Kalam (Matiltan side), and the Gabral Kalam region. To verify the model’s accuracy, a ground-truth survey was conducted, affirming the alignment of its predictions with the actual observed results.

Figure 6.
Hotspots of species distribution area.
4. Discussion
In recent years, there has been a notable increase in the publication of papers focusing on the methodology and applications of species distribution modeling [21,70]. However, the Himalayan region, including Pakistan, remains one of the least explored and reported areas for tree species distribution studies. Several factors contribute to this, including the limited availability of detailed forest inventory data, the complexity of the forest ecosystem, the challenging terrain, financial constraints, and harsh weather conditions.
In the Himalayan region, [71] conducted a study on two tree species of Rhododendrons (R. delavayi and R. arboreum), utilizing 217 herbarium collections and employing various ecological niche modeling techniques. Similarly, [72] mapped the distribution of the Betula utilis tree species across the same region using 590 occurrence points, primarily obtained from herbarium collections, and employing generalized linear models.
Additionally, [51] investigated the distribution of the Abies pindrow tree species in the Swat District of Pakistan using the HADCM3 A2a global climate change scenario. However, this study was based on a limited sample size, with 250 sample plots collected from 25 various localities within the Swat District.
In this research, we unveil the comprehensive distribution patterns of endemic plants throughout the Swat District through continuous field visits in the period from 2019 to 2023. Our approach involves extensive and precise species occurrence data and employs two distinct algorithms. This provides fresh insights into identifying hotspot areas, evaluating the effectiveness of conservation efforts, pinpointing conservation gaps for Swat endemic plants, and assessing the risk associated with the potential shifts and loss of suitable habitat areas due to climate change.
Based on our SDM analysis, we found three hotspot areas for these seven species with an extended altitude gradient from 745 m a.s.l to 6625 m, from the dry temperate to moist temperate climatic zones in Swat. Our results coincide with [73,74] and Martínez-Avalos and Jurado [75], whose results were based on finding hotspot areas for Cactaceae with some physiographic variables, as well as previously discussed research articles.
Regarding some bioclimatic and physiographic variables (elevation, soil, aspect and slope, etc.), we found most of our endemic species in high mountain ranges with relatively low temperatures and moisture, as reported by [76]. However, most of the endemic species and hotspots are confined to high elevated lands like Kalam and the summit of Falaksar; the same patterns were also found in some mountainous regions of Europe and Asia by [77,78,79].
On the other side, the hotspot somehow was also affected by soil bulk, and soil pH; the same results were reported by [29,80].
4.1. Present Day Climate Change Impact on Species Distribution
The current maps depicting the environmental suitability for all seven endemic species closely mirror their real distribution in Swat flora, as documented by Salinas-Rodríguez et al. (2018). In our contemporary simulations for all seven endemic species, our models indicate substantially larger suitable areas than those currently occupied by the species. This notable difference can be largely attributed to historical land use and forest management choices, as highlighted by Baumbach, Niamir [81] for the substitution of silver fir with beech. While we employed an extensive set of predictors to delineate the environmental niches for all endemic species, classical species distribution models (SDMs) cannot fully capture the historical human influence on their distribution ranges.
4.2. Role of Climate Change on Environmental Suitability
The modeling outcomes under the impact of climate change broadly validate the already existing projections for all the mentioned species distribution statements compared with the results of previous research [82,83,84,85]. Based on our findings regarding the current environmental conditions, a significant population decline has been observed, which is primarily attributed to shifts in environmental factors and various human-induced disturbances within the ecosystem. According to our findings, these species demonstrate a movement toward the higher elevations of the Himalayan regions in Swat.
The influence of the representative concentration pathways (RCPs) on economic valuation did not consistently exhibit a linear progression from RCP2.6 through RCP6.0 and RCP4.5 to RCP8.5. This non-linearity primarily impacted the ranking of RCP4.5 relative to the other RCPs and varied among all general circulation models (GCMs), suggesting its origin may lie in the internal variability of climate projections [86].
While our climate input dataset “Worldclim” was specifically tailored to enhance the precision of species distribution models [62], uncertainties stemming from the underlying circulation models or the downscaling process also contribute to a cascade of uncertainties within the models, as outlined by Reyer, Leuzinger [87]. By utilizing climate data from the same source and employing the same downscaling technique for both current and future climates, we aim to mitigate this effect to some extent.
5. Conclusions
This research delved into the current and potential future ranges of the species Abies pindrow, Allium tripterum, Corydalis goviniana var swatensis, Elymus borianus, Geranium swatensis, Juniperus excelsa, and Nepeta griffithii) across 19 climate scenarios along with some physiographic factors, utilizing diverse, cutting-edge modeling methods. Our aim was to discover the hotspot for all the stated species, which were found at three different areas, i.e., at the Karakar and Elum border, along with the Marghuzar area in lower altitude zones and in the upper elevated zone. Most of the seven species are found in Madyan, the linked area of Mankial and Kalam (Matiltan side), and Gabral Kalam (Figure 6); forecast alterations in distribution patterns due to climate change evaluate the land expectation value of for all these species and explore the implications for biodiversity conservation management. Across all scenarios, the models consistently predicted a decrease in the environmental suitability for all these endemic species in the Swat region. Our models’ analyses indicate that these anticipated declines could lead to a significant loss of biodiversity, which ultimately would decrease valuable sources of non-timber forest products and medicinal aromatic products. Conversely, these seven species are also anticipated to maintain a distribution closely resembling their current ones, suggesting that they could potentially be integrated into other habitats and forests to cope with the increasing frequency of droughts caused by climate change.
Our discoveries stress the importance of interdisciplinary investigations that consider both the ecological and economic impacts of climate change. In this context, species distribution models can be valuable tools, provided that they employ robust modeling methods and effectively communicate uncertainties to decision-makers. This is especially pertinent for regional models, which may not be suitable for projecting the environmental suitability of a species under climatic conditions that have no historical precedent.
Practical Outcomes for Management
The outcomes of our species distribution modeling for the targeted seven endemic species reveal three significant discoveries crucial for their conservation:
We have identified regions where the suitability of habitats for all species may decrease, highlighting areas that are particularly susceptible to the effects of climate change.
By assessing the average likelihood of these species’ presence in locations where their suitability diminishes, we have outlined hotspot areas suitable for most of these species.
We have recognized regions where the likelihood of occurrence intensifies for all these endemic species, providing valuable insights for future research endeavors aimed at conserving them in their natural habitats.
Supplementary Materials
The following supporting information can be downloaded at: https://www.mdpi.com/article/10.3390/land13060737/s1, Figure S1: Max-Ent Jackknife test result for Area under cover (AUC) OF Nepeta griffithii of current (2019–2023) and future climatic scenario (2050); Figure S2: Max-Ent Average omission and Average sensitivity vs. specificity of Nepeta griffithi; Figure S3: Max-Ent Jackknife test result for Area under cover (AUC) OF Juniperus excelsa of current (2019–2023) and future climatic scenario (2050); Figure S4: Max-Ent Average omission and Average sensitivity vs. specificity of Juniperus excelsa; Figure S5: Max-Ent Jackknife test result for Area under cover (AUC) OF Abies pindrow of current (2019–2023) and future climatic scenario (2050); Figure S6: Max-Ent Average omission and Average sensitivity vs. specificity of Abies Pindrow; Figure S7: Max-Ent Jackknife test result for Area under cover (AUC) OF Allium tripterum of current (2019–2023) and future climatic scenario (2050); Figure S8: Max-Ent Average omission and Average sensitivity vs. specificity of Allium tripterum; Figure S9: Max-Ent Jackknife test result for Area under cover (AUC) of Corydalis goviniana var. swatensis for current (2019–2023) and future climatic scenario (2050); Figure S10: Max-Ent Average sensitivity and Average omission vs. specificity of Corydalis goviniana var. swatensis; Figure S11: Max-Ent Jackknife test result for Area under cover (AUC) of Elymus borianus for current (2019–2023) and future climatic scenario (2050); Figure S12: Max-Ent Average omission and Average sensitivity vs. specificity of Elymus borianus; Figure S13: Max-Ent Jackknife test result for Area under cover (AUC) of Geranium swatense for current (2019–2023) and future climatic scenario (2050); Figure S14: Max-Ent Average omission and Average sensitivity vs. specificity of Geranium swatense.
Author Contributions
Conceptualization, S.A., H.A., H.S. and R.Y.; Methodology, S.A., O.G.B. and R.Y.; Software, S.A. and O.G.B.; Validation, S.A. and O.G.B.; Formal analysis, S.A. and O.G.B.; Investigation, S.A., Hassan Sher and R.Y.; Resources, H.A. and R.Y.; Data curation, S.A. and H.A.; Writing—original draft, S.A. and O.G.B.; Writing—review & editing, S.A. and R.Y.; Visualization, S.A.; Supervision, H.A. and R.Y.; Project administration, H.A.; Funding acquisition, H.A. All authors have read and agreed to the published version of the manuscript.
Funding
This research received no external funding.
Data Availability Statement
The data presented in this study are available on request from the corresponding author due to privacy and property right issues.
Conflicts of Interest
The authors declare no conflict of interest.
References
- Rawat, U.; Agarwal, N. Biodiversity: Concept, threats and conservation. Environ. Conserv. J. 2015, 16, 19–28. [Google Scholar] [CrossRef]
- Usman, A.B.; Abubakar, S.; Alaku, C.; Nnadi, O. Plant: A necessity of life. Int. Lett. Nat. Sci. 2014, 15, 151–159. [Google Scholar] [CrossRef]
- Sekercioglu, C.H. Ecosystem functions and services. Conserv. Biol. All 2010, 2010, 45–72. [Google Scholar]
- Gebreyohannes, D.T. Ecology of Medicinal Plants and Their Integration into Primary Healthcare in Kajiado County; University of Nairobi: Nairobi, Kenya, 2013. [Google Scholar]
- Walters, M.; Hamilton, A. The Vital Wealth of Plants: WWF and the Conservation of Plants; WWF: Gland, Switzerland, 1993. [Google Scholar]
- Mittermeier, R.A.; Turner, W.R.; Larsen, F.W.; Brooks, T.M.; Gascon, C. Global Biodiversity Conservation: The Critical Role of Hotspots. In Biodiversity Hotspots: Distribution and Protection of Conservation Priority Areas; Springer: Berlin/Heidelberg, Germany, 2011; pp. 3–22. [Google Scholar]
- Zeb, A.; Iqbal, Z.; Khan, S.M.; Rahman, I.U.; Haq, F.; Afzal, A.; Gadir, G.; Ijaz, F. Species diversity, biological spectrum and phenological behaviour of vegetation of Biha Valley (Swat), Pakistan. Acta Ecol. Sin. 2020, 40, 190–196. [Google Scholar] [CrossRef]
- Börjeson, L.; Ango, T.G. The production and destruction of forests through the lens of landesque capital accumulation. Hum. Ecol. 2021, 49, 259–269. [Google Scholar] [CrossRef]
- Coelho, N.; Gonçalves, S.; Romano, A. Endemic plant species conservation: Biotechnological approaches. Plants 2020, 9, 345. [Google Scholar] [CrossRef] [PubMed]
- Burlakova, L.E.; Karatayev, A.Y.; Karatayev, V.A.; May, M.E.; Bennett, D.L.; Cook, M.J. Endemic species: Contribution to community uniqueness, effect of habitat alteration, and conservation priorities. Biol. Conserv. 2011, 144, 155–165. [Google Scholar] [CrossRef]
- Anderson, S. Area and endemism. Q. Rev. Biol. 1994, 69, 451–471. [Google Scholar] [CrossRef]
- Foggi, B.; Viciani, D.; Baldini, R.M.; Carta, A.; Guidi, T. Conservation assessment of the endemic plants of the Tuscan Archipelago, Italy. Oryx 2015, 49, 118–126. [Google Scholar] [CrossRef]
- Işik, K. Rare and endemic species: Why are they prone to extinction? Turk. J. Bot. 2011, 35, 411–417. [Google Scholar] [CrossRef]
- Guisan, A.; Tingley, R.; Baumgartner, J.B.; Naujokaitis-Lewis, I.; Sutcliffe, P.R.; Tulloch, A.I.; Regan, T.J.; Brotons, L.; McDonald-Madden, E.; Mantyka-Pringle, C.; et al. Predicting species distributions for conservation decisions. Ecol. Lett. 2013, 16, 1424–1435. [Google Scholar] [CrossRef] [PubMed]
- Williams, J.N.; Seo, C.; Thorne, J.; Nelson, J.K.; Erwin, S.; O’Brien, J.M.; Schwartz, M.W. Using species distribution models to predict new occurrences for rare plants. Divers. Distrib. 2009, 15, 565–576. [Google Scholar] [CrossRef]
- Elith, J.H.; Graham, C.P.; Anderson, R.; Dudík, M.; Ferrier, S.; Guisan, A.J.; Hijmans, R.; Huettmann, F.R.; Leathwick, J.; Lehmann, A.; et al. Novel methods improve prediction of species’ distributions from occurrence data. Ecography 2006, 29, 129–151. [Google Scholar] [CrossRef]
- Pearson, R.G.; Raxworthy, C.J.; Nakamura, M.; Townsend Peterson, A. Predicting species distributions from small numbers of occurrence records: A test case using cryptic geckos in Madagascar. J. Biogeogr. 2007, 34, 102–117. [Google Scholar] [CrossRef]
- Fourcade, Y.; Engler, J.O.; Rödder, D.; Secondi, J. Mapping species distributions with MAXENT using a geographically biased sample of presence data: A performance assessment of methods for correcting sampling bias. PLoS ONE 2014, 9, e97122. [Google Scholar] [CrossRef]
- Yackulic, C.B.; Chandler, R.; Zipkin, E.F.; Royle, J.A.; Nichols, J.D.; Campbell Grant, E.H.; Veran, S. Presence-only modelling using MAXENT: When can we trust the inferences? Methods Ecol. Evol. 2013, 4, 236–243. [Google Scholar] [CrossRef]
- Elith, J.; Phillips, S.J.; Hastie, T.; Dudík, M.; Chee, Y.E.; Yates, C.J. A statistical explanation of MaxEnt for ecologists. Divers. Distrib. 2011, 17, 43–57. [Google Scholar] [CrossRef]
- Elith, J.; Leathwick, J.R. Species distribution models: Ecological explanation and prediction across space and time. Annu. Rev. Ecol. Evol. Syst. 2009, 40, 677–697. [Google Scholar] [CrossRef]
- Franklin, J. Mapping Species Distributions: Spatial Inference and Prediction; Cambridge University Press: Cambridge, UK, 2010. [Google Scholar]
- Guisan, A.; Thuiller, W. Predicting species distribution: Offering more than simple habitat models. Ecol. Lett. 2005, 8, 993–1009. [Google Scholar] [CrossRef]
- Taylor, C.; Cadenhead, N.; Lindenmayer, D.B.; Wintle, B.A. Improving the design of a conservation reserve for a critically endangered species. PLoS ONE 2017, 12, e0169629. [Google Scholar] [CrossRef]
- Peterman, W.E.; Crawford, J.A.; Kuhns, A.R. Using species distribution and occupancy modeling to guide survey efforts and assess species status. J. Nat. Conserv. 2013, 21, 114–121. [Google Scholar] [CrossRef]
- Deka, K.; Baruah, P.S.; Sarma, B.; Borthakur, S.K.; Tanti, B. Preventing extinction and improving conservation status of Vanilla borneensis Rolfe—A rare, endemic and threatened orchid of Assam, India. J. Nat. Conserv. 2017, 37, 39–46. [Google Scholar] [CrossRef]
- Maxwell, S.L.; Cazalis, V.; Dudley, N.; Hoffmann, M.; Rodrigues, A.S.; Stolton, S.; Visconti, P.; Woodley, S.; Kingston, N.; Lewis, E.; et al. Area-based conservation in the twenty-first century. Nature 2020, 586, 217–227. [Google Scholar] [CrossRef] [PubMed]
- Marchese, C. Biodiversity hotspots: A shortcut for a more complicated concept. Glob. Ecol. Conserv. 2015, 3, 297–309. [Google Scholar] [CrossRef]
- Major, J. Endemism: A Botanical Perspective. In Analytical Biogeography: An Integrated Approach to the Study of Animal and Plant Distributions; Springer: Berlin/Heidelberg, Germany, 1988; pp. 117–146. [Google Scholar]
- Alarcón, D.; Santos, D.; Arroyo, M.T. Population-Based Evidence of Climate Change Adaptation in an Endangered Plant Endemic to a Biodiversity Hotspot. Plants 2023, 12, 2017. [Google Scholar] [CrossRef] [PubMed]
- Myers, N.; Mittermeier, R.A.; Mittermeier, C.G.; Da Fonseca, G.A.; Kent, J. Biodiversity hotspots for conservation priorities. Nature 2000, 403, 853–858. [Google Scholar] [CrossRef] [PubMed]
- Bellard, C.; Leclerc, C.; Leroy, B.; Bakkenes, M.; Veloz, S.; Thuiller, W.; Courchamp, F. Vulnerability of biodiversity hotspots to global change. Glob. Ecol. Biogeogr. 2014, 23, 1376–1386. [Google Scholar] [CrossRef]
- Mittermeier, R.A.; Da Fonseca, G.A.; Rylands, A.B.; Brandon, K. A brief history of biodiversity conservation in Brazil. Conserv. Biol. 2005, 601–607. [Google Scholar] [CrossRef]
- Ali, S. Significance of flora with special reference to Pakistan. Pak. J. Bot 2008, 40, 967–971. [Google Scholar]
- Ali, S.I.; Qaiser, M. A phytogeographical analysis of the phanerogams of Pakistan and Kashmir. Proc. R. Soc. Edinb. Sect. B Biol. Sci. 1986, 89, 89–101. [Google Scholar] [CrossRef]
- Stewart, R.R. Check list of the plants of Swat State, Northwest Pakistan. Pak. J. For. 1967, 17, 457–528. [Google Scholar]
- Hussain, F.; Shah, S.M.; Badshah, L.; Durrani, M.J. Diversity and ecological characteristics of flora of Mastuj valley, district Chitral, Hindukush range, Pakistan. Pak. J. Bot 2015, 47, 495–510. [Google Scholar]
- Ahmad, M.; Sultana, S.; Fazl-i-Hadi, S.; Ben Hadda, T.; Rashid, S.; Zafar, M.; Khan, M.A.; Khan, M.P.; Yaseen, G. An ethnobotanical study of medicinal plants in high mountainous region of Chail valley (District Swat-Pakistan). J. Ethnobiol. Ethnomedicine 2014, 10, 1–18. [Google Scholar] [CrossRef]
- Ahmad, I.; Khan, N.; Anjum, F. Medicinal plant resources for economic development of rural community in Mankial, District Swat. World Environ. Day 2011. [Google Scholar]
- Iqbal, I.; Hamayun, M. Studies on the traditional uses of plants of Malam Jabba valley, District Swat, Pakistan. Ethnobot. Leafl. 2004, 2004, 15. [Google Scholar]
- Ali, A.; Badshah, L.; Hussain, F.; Shinwari, Z.K. Floristic composition and ecological characteristics of plants of chail valley, district Swat, Pakistan. Pak. J. Bot 2016, 48, 1013–1026. [Google Scholar]
- Sher, H.; Al_yemeni, M. Economically and ecologically important plant communities in high altitude coniferous forest of Malam Jabba, Swat, Pakistan. Saudi J. Biol. Sci. 2011, 18, 53–61. [Google Scholar] [CrossRef]
- Hassan, N.; Din, M.U.; Hassan, F.U.; Abdullah, I.; Zhu, Y.; Jinlong, W.; Nisar, M.; Iqbal, I.; Wadood, S.F.; Iqbal, S.S.; et al. Identification and quantitative analyses of medicinal plants in Shahgram valley, district swat, Pakistan. Acta Ecol. Sin. 2020, 40, 44–51. [Google Scholar] [CrossRef]
- Majeed, H.; Bokhari, T.Z.; Sherwani, S.K.; Younis, U.; Shah, M.H.R.; Khaliq, B. An overview of biological, phytochemical, and pharmacological values of Abies pindrow. J. Pharmacogn. Phytochem. 2013, 2, 182–187. [Google Scholar]
- Jan, S.; Hamayun, M.; Khan, S.A.; Ahmad, N.; Ahmad, I.; Wali, S. Plant diversity of Hindu Kush mountain region of Utror and Gabral, Northern Pakistan. Pak. J. Weed Sci. Res. 2015, 21. [Google Scholar]
- Khan, M.; Khan, A.-U.; Gilani, A.-H. Pharmacological explanation for the medicinal use of Juniperus excelsa in hyperactive gastrointestinal and respiratory disorders. J. Nat. Med. 2012, 66, 292–301. [Google Scholar] [CrossRef] [PubMed]
- Handjieva, N.; Mitova, M.; Ancev, M.; Popov, S. Iridoid glucosides from Galium album and G. lovcense. Phytochemistry 1996, 43, 625–628. [Google Scholar] [CrossRef]
- Zeng, Y.; Li, Y.; Yang, J.; Pu, X.; Du, J.; Yang, X.; Yang, T.; Yang, S. Therapeutic role of functional components in alliums for preventive chronic disease in human being. Evid. Based Complement. Altern. Med. 2017, 2017, 9402849. [Google Scholar] [CrossRef] [PubMed]
- Sivakumaran, N.; Samarakoon, S.R.; Adhikari, A.; Ediriweera, M.K.; Tennekoon, K.H.; Malavige, N.; Thabrew, I.; Shrestha, R.L. Cytotoxic and apoptotic effects of govaniadine isolated from corydalis govaniana wall. Roots on human breast cancer (mcf-7) cells. BioMed Res. Int. 2018, 2018, 3171348. [Google Scholar] [CrossRef] [PubMed]
- Frawley, E.S.; Ciotir, C.; Micke, B.; Rubin, M.J.; Miller, A.J. An ethnobotanical study of the genus Elymus. Econ. Bot. 2020, 74, 159–177. [Google Scholar] [CrossRef]
- Ali, K.; Ahmad, H.; Khan, N.; Jury, S. Future of Abies pindrow in Swat district, northern Pakistan. J. For. Res. 2014, 25, 211–214. [Google Scholar] [CrossRef]
- Khan, M.N.; Ali, S.; RAZAK, S.A.; Zaman, A.; Iqbal, M.; Shah, S.N. Assessment of floristic diversity in the mountain ecosystem of Marghazar Valley, Hindukush Range, Swat, Pakistan. Biodiversitas J. Biol. Divers. 2022, 23. [Google Scholar] [CrossRef]
- Stephenson, N.L. Climatic control of vegetation distribution: The role of the water balance. Am. Nat. 1990, 135, 649–670. [Google Scholar] [CrossRef]
- Bridson, D.; Forman, L. The Herbarium Handbook; rev. ed. Kew: Royal Botanic Gardens: Richmond, UK, 1992. [Google Scholar]
- Brenskelle, L.; Guralnick, R.P.; Denslow, M.; Stucky, B.J. Maximizing human effort for analyzing scientific images: A case study using digitized herbarium sheets. Appl. Plant Sci. 2020, 8, e11370. [Google Scholar] [CrossRef]
- Nasir, E.; Ali, S. Flora of Pakistan National Herbarium; NARC: Islamabad, Pakistan; Department of Botany University of Karachi: Karachi, Pakistan, 1972. [Google Scholar]
- Rechinger, K. Flora des Iranischen Hochlandes und der Umrahmenden Gebirge; no. 160; Akademische Druck-u. Verlagsanstalt: Graz, Austria, 1986. [Google Scholar]
- Brummitt, R.; Powell, C. Authors of Plant Names–Royal Botanic Gardens; Kew, Edinburgh, UK, 1992.
- Engler, R.; Randin, C.F.; Vittoz, P.; Czáka, T.; Beniston, M.; Zimmermann, N.E.; Guisan, A. Predicting future distributions of mountain plants under climate change: Does dispersal capacity matter? Ecography 2009, 32, 34–45. [Google Scholar] [CrossRef]
- Baumbach, L.; Siegmund, J.F.; Mittermeier, M.; Donner, R.V. Impacts of temperature extremes on European vegetation during the growing season. Biogeosciences 2017, 14, 4891–4903. [Google Scholar] [CrossRef]
- Rahmstorf, S.; Foster, G.; Cazenave, A. Comparing climate projections to observations up to 2011. Environ. Res. Lett. 2012, 7, 044035. [Google Scholar] [CrossRef]
- Karger, D.N.; Conrad, O.; Böhner, J.; Kawohl, T.; Kreft, H.; Soria-Auza, R.W.; Zimmermann, N.E.; Linder, H.P.; Kessler, M. Climatologies at high resolution for the earth’s land surface areas. Sci. Data 2017, 4, 1–20. [Google Scholar] [CrossRef] [PubMed]
- Hengl, T.; Mendes, de.; Jesus, J.; Heuvelink, G.B.; Ruiperez Gonzalez, M.; Kilibarda, M.; Blagotić, A.; Shangguan, W.; Wright, M.N.; Geng, X.; et al. SoilGrids250m: Global gridded soil information based on machine learning. PLoS ONE 2017, 12, e0169748. [Google Scholar] [CrossRef]
- Stanley, D.L.; Boozer, T.M.; Schroder, L. Summary of the US Geological Survey National Field Quality Assurance Program from 1979 through 1989; US Department of the Interior, US Geological Survey: Reston, VA, USA, 1998. [Google Scholar]
- Hijmans, R.J.; Cameron, S.E.; Parra, J.L.; Jones, P.G.; Jarvis, A. Very high resolution interpolated climate surfaces for global land areas. Int. J. Climatol. A J. R. Meteorol. Soc. 2005, 25, 1965–1978. [Google Scholar] [CrossRef]
- Greenham, S.; Jones, S.; Ferranti, E.; Zhong, J.; Acton, J.; MacKenzie, R.; Grayson, N. Mapping Climate Risk and Vulnerability with Publicly Available Data; A guidance document produced by the WM-Air project; University of Birmingham: Birmingham, UK, 2023. [Google Scholar]
- Phillips, S.J.; Dudík, M.; Elith, J.; Graham, C.H.; Lehmann, A.; Leathwick, J.; Ferrier, S. Sample selection bias and presence-only distribution models: Implications for background and pseudo-absence data. Ecol. Appl. 2009, 19, 181–197. [Google Scholar] [CrossRef] [PubMed]
- Dryflor.; Banda-R., K.; Delgado-Salinas, A.; Dexter, K.G.; Linares-Palomino, R.; Oliveira-Filho, A.; Prado, D.; Pullan, M.; Quintana, C.; Riina, R.; et al. Plant diversity patterns in neotropical dry forests and their conservation implications. Science 2016, 353, 1383–1387. [Google Scholar] [CrossRef] [PubMed]
- Schröter, D.; Zebisch, M.; Grothmann, T. Climate change in Germany-vulnerability and adaptation of climate-sensitive sectors. Klimastatusbericht Des DWD 2005, 2005, 44–56. [Google Scholar]
- Brotons, L. Species distribution models and impact factor growth in environmental journals: Methodological fashion or the attraction of global change science. PLoS ONE 2014, 9, e111996. [Google Scholar] [CrossRef]
- Hart, R.; Salick, J.; Ranjitkar, S.; Xu, J. Herbarium specimens show contrasting phenological responses to Himalayan climate. Proc. Natl. Acad. Sci. USA 2014, 111, 10615–10619. [Google Scholar] [CrossRef]
- Bobrowski, M.; Gerlitz, L.; Schickhoff, U. Modelling the potential distribution of Betula utilis in the Himalaya. Glob. Ecol. Conserv. 2017, 11, 69–83. [Google Scholar] [CrossRef]
- Gómez-Hinostrosa, C.; Hernández, H.M. Diversity, geographical distribution, and conservation of Cactaceae in the Mier y Noriega region, Mexico. Biodivers. Conserv. 2000, 9, 403–418. [Google Scholar] [CrossRef]
- Hernández, H.M.; Gómez-Hinostrosa, C.; Bárcenas, R.T. Diversity, spatial arrangement, and endemism of Cactaceae in the Huizache area, a hot-spot in the Chihuahuan Desert. Biodivers. Conserv. 2001, 10, 1097–1112. [Google Scholar] [CrossRef]
- Martínez-Avalos, J.G.; Jurado, E. Geographic distribution and conservation of Cactaceae from Tamaulipas Mexico. Biodivers. Conserv. 2005, 14, 2483–2506. [Google Scholar] [CrossRef]
- Dagher-Kharrat, M.B.; El Zein, H.; Rouhan, G. Setting conservation priorities for Lebanese flora—Identification of important plant areas. J. Nat. Conserv. 2018, 43, 85–94. [Google Scholar] [CrossRef]
- Agakhanjanz, O.; Breckle, S.-W. Origin and evolution of the mountain flora in Middle Asia and neighbouring mountain regions. In Arctic and Alpine Biodiversity: Patterns, Causes and Ecosystem Consequences; Springer: Berlin/Heidelberg, Germany, 1995; pp. 63–80. [Google Scholar]
- Agakbanjanz, O.; Breckle, S.-W. Plant diversity and endemism in high mountains of Central Asia, the Caucasus and Siberia. In Mountain Biodiversity; Routledge: London, UK, 2019; pp. 117–127. [Google Scholar]
- Noroozi, J.; Akhani, H.; Breckle, S.-W. Biodiversity and phytogeography of the alpine flora of Iran. Biodivers. Conserv. 2008, 17, 493–521. [Google Scholar] [CrossRef]
- Kruckeberg, A.R.; Rabinowitz, D. Biological aspects of endemism in higher plants. Annu. Rev. Ecol. Syst. 1985, 16, 447–479. [Google Scholar] [CrossRef]
- Baumbach, L.; Niamir, A.; Hickler, T.; Yousefpour, R. Regional adaptation of European beech (Fagus sylvatica) to drought in Central European conditions considering environmental suitability and economic implications. Reg. Environ. Change 2019, 19, 1159–1174. [Google Scholar] [CrossRef]
- Kölling, C.; Falk, W.; Walentowski, H. Standörtliche Möglichkeiten für den Anbau der Tanne (Abies alba und Abies grandis) in Bayern. LWF Wissen 2011, 66, 11–19. [Google Scholar]
- Hanewinkel, M.; Cullmann, D.A.; Schelhaas, M.J.; Nabuurs, G.J.; Zimmermann, N.E. Climate change may cause severe loss in the economic value of European forest land. Nat. Clim. Change 2013, 3, 203–207. [Google Scholar] [CrossRef]
- Yousefpour, R.; Hanewinkel, M.; Le Moguédec, G. Evaluating the suitability of management strategies of pure Norway spruce forests in the Black Forest area of Southwest Germany for adaptation to or mitigation of climate change. Environ. Manag. 2010, 45, 387–402. [Google Scholar] [CrossRef] [PubMed]
- Kramer, K.; Degen, B.; Buschbom, J.; Hickler, T.; Thuiller, W.; Sykes, M.T.; de Winter, W. Modelling exploration of the future of European beech (Fagus sylvatica L.) under climate change—Range, abundance, genetic diversity and adaptive response. For. Ecol. Manag. 2010, 259, 2213–2222. [Google Scholar] [CrossRef]
- Deser, C.; Phillips, A.; Bourdette, V.; Teng, H. Uncertainty in climate change projections: The role of internal variability. Clim. Dyn. 2012, 38, 527–546. [Google Scholar] [CrossRef]
- Reyer, C.P.; Leuzinger, S.; Rammig, A.; Wolf, A.; Bartholomeus, R.P.; Bonfante, A.; De Lorenzi, F.; Dury, M.; Gloning, P.; Abou Jaoudé, R.; et al. A plant’s perspective of extremes: Terrestrial plant responses to changing climatic variability. Glob. Change Biol. 2013, 19, 75–89. [Google Scholar] [CrossRef] [PubMed]


Disclaimer/Publisher’s Note: The statements, opinions and data contained in all publications are solely those of the individual author(s) and contributor(s) and not of MDPI and/or the editor(s). MDPI and/or the editor(s) disclaim responsibility for any injury to people or property resulting from any ideas, methods, instructions or products referred to in the content. |
© 2024 by the authors. Licensee MDPI, Basel, Switzerland. This article is an open access article distributed under the terms and conditions of the Creative Commons Attribution (CC BY) license (https://creativecommons.org/licenses/by/4.0/).