Abstract
Land-use change may significantly influence streamflow. The semi-empirical model PhosFate was used to analyze the impact of land use and climate change on streamflow by choosing the Guishui watershed as a pilot site and then expanding, applying it to all of North China. The Guishui watershed (North Beijing, China) has experienced a dramatic decline in its streamflow in recent decades. Parallel to this, significant land-use change has happened in this area; afforestation programs have increased forest cover from 41% (1980) to 59% (2013) and a similar increase in forest cover can also be observed in North China. Managing flow decline requires separating climatic and direct human-influenced effects. The results showed the following: (1) Afforestation is a major factor that decreased total flow in the Guishui watershed from 1996 to 2014; total flow increased by around 24% more than the actual dataset in the constant scenario (no afforestation) and decreased by 5% more than the actual dataset in the forest scenario (all agriculture land use transferred to forests). (2) When forest coverage increases, the Qinghai–Tibet Plateau and the Loess Plateau are the most sensitive areas regarding total flow in North China; the total flow change rate increased by up to 25% in these two areas when land use shifted from sparse vegetation to mixed forests. After analyzing the contributions of these two factors, we formulated recommendations on future afforestation practices for North China. In the central–north and northwest districts, the annual precipitation is under 520 mm and 790 mm, respectively, and the practice of afforestation should be more carefully planned to prevent severe damage to streams. This research also proved that the PhosFate model can be used in North China, which would be a practical tool for watershed management.
1. Introduction
Tree planting is probably the simplest carbon sequestration strategy and, therefore, a key measure in combatting climate change [1,2,3]. Reforesting formerly tree-covered areas and afforesting other, historically non-forested lands may have the same yields with regard to removing carbon from the atmosphere, yet their other effects are clearly different with regard to hydrology, soil, and ecosystem services [4]. Reforestation is the restoration of potential natural vegetation (PNV) and, hence, the pristine conditions of the area. However, forests are not the PNV for all climatic zones; therefore, afforestation can alter an ecosystem and its services (including hydrology) and may sacrifice some of the last remaining pristine non-tree biomes [5]. For example, only half of the existing forestland aligns with the PNV model in the Loess Plateau of China; a more appropriate vegetation type for the remaining forestland would be steppe [6].
China runs the largest forestation program in the World, the “Grain for Green” project [7]. This project was launched in 1999 and aims to encourage afforestation in agricultural lands all around the country, mainly for soil and water conservation [8], as forests reduce erosion, limit surface runoff formation, and retain water, thus reducing flood peaks [9,10]. As a consequence of various governmental afforestation programs, there has been a 415,000 km2 increase in forest coverage in China since the 1980s, 30% of which was established as plantation forests [9,11]. The China Forest Resources Report (2019) shows that China’s forest area has expanded from 130 million ha to 220 million ha, and forest coverage has thus risen from 14% to almost 23% compared with the early 1970s [12]. Meanwhile, according to MODIS data, a net 2.3% increase in leaf area per decade has been found for the entire world, which is the equivalent of adding 5.4 × 10⁶ km2 of new leaf area over 18 years during the recorded period (2000 to 2017) [10].
However, in the most affected northern regions of China, open shrubland, grassland, and desert are the PNV [5]; therefore, planting forests is not a restoration measure in a strict ecological sense. To justify such a fundamental intervention on the landscape, it has to be carefully determined whether the manifold significant changes attached to changing vegetation in an area are beneficial or not, including ecological and social aspects. Despite the clear motivations of most afforestation programs, the consequences of increased forest coverage are often ambiguous. For example, streamflow has been reported to both decrease and increase in various studies depending on many factors [13,14,15,16]. To make the issue more complex, this problem is strongly influenced by ongoing climate change, which alters climatic conditions and thereby changes both natural vegetation [17,18,19] and the human use of catchments worldwide [20,21].
The objective of this study was to carry out a hydrological assessment focusing on the effect of forestation on streamflow in North China to assess the rationality of increasing forest coverage in this area. Similar to numerous catchments around the world [22], most river basins of North China are poorly gauged despite their importance to this partly densely populated, arid region of elevated water stress [23,24].
To overcome this data limitation, our study relied on a modeling approach. A calculation algorithm was tailored to local conditions by calibrating the model in a pilot catchment. Our pilot catchment, the Guishui River catchment in North Beijing Province, is prominently important. It feeds a vitally important reservoir, serves as an important eco-corridor in the region, and hosted the 2022 Winter Olympics [25]; however, despite this significance, monitoring data from the area are still limited and of compromised quality. Under this limitation, we chose a fully distributed yet steady-state hydrological model with limited data demand and adapted it for landcover patterns typical to this region. Afterward, we analyzed the impacts of land-use change on streamflow in the entire region and formulated recommendations on afforestation practices for North China.
2. Materials and Methods
2.1. Study Scope
This study addresses the potential hydrological effect of afforestation on the 14 northern provinces of China (Heilongjiang, Jilin, Liaoning, Inner Mongolia, Beijing, Hebei, Shanxi, Shaanxi, Ningxia, Gansu, Qinghai, Xinjiang, and Xizang [Tibet]; Figure 1). Most of this area is occupied by arid plains but it also includes notable mountainous areas, such as the Greater Khingan Range and the Qinghai–Tibet Plateau. This part of China is mainly in the north temperate zone, with a temperate monsoon climate. Although most of the area lacks abundant water resources, a large number of afforestation projects have been carried out to control erosion and desertification.
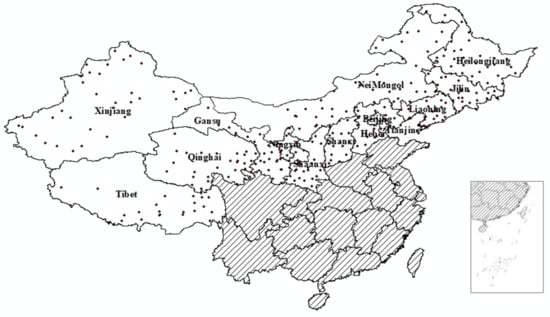
Figure 1.
Study area (white) and meteorological stations (dots) within China.
2.2. Hydrological Model
The PhosFate model [26] was selected to estimate the effects of afforestation owing to its low data demand and simplicity. PhosFate is a semi-empirical, long-term average, distributed parameter model that can be used to simulate the total flow and sources of diffuse nutrient pollution based on the few critical data that are typically available [26]. The spatial units of the model are raster cells, and the time scale is one virtual or one actual year. The model was previously validated in several catchment types and sizes (from a few to tens of thousands of square kilometers) in Central Europe and has shown good performance in both arid and wet regions [27,28]. In this study, the main model component was the water balance calculation, which is derived from the long-term hydrological model “WETSPASS” [29]. To determine the fate of precipitation, PhosFate uses built-in parameters for partition and runoff coefficients (separate sets for the winter and summer half years) based on soil type, land-use category, and slope. These built-in parameters are derived from values in the literature but assume land-use conditions typical to the temperate zones of Europe, where cold arid and semi-arid climates are completely lacking. Therefore, before using PhosFate to calculate area-specific surface runoff for forested and non-forested areas, it was necessary to adjust the model parameters to the local conditions.
2.3. Pilot Catchment
The Guishui catchment (680 km2) located in Beijing Province was selected as a pilot catchment to support model adjustments because it has a cold arid climate that is typical of North China and recently underwent significant afforestation. Guishui is one of three major rivers feeding the Guanting reservoir, which plays a great role in flood control, irrigation, and power generation for the city of Beijing. Significant land-use change has occurred in this area, including both afforestation and urbanization. Due to the arid climate, coupled with these human impacts on the catchment, the discharge of this formerly periodically intermittent river has dropped to a fraction of its former rate in the last 15 years [30]. This has caused a parallel degradation of the aquatic ecosystem and compromised water quality. In North China, many streams suffer similarly from water shortage and quality deterioration, so Guishui is a good representative of a typical northern Chinese river.
The Guishui catchment includes a mixed topography with elevation ranging from 469 m to 2184 m (Figure 2). The northern part of the catchment is mainly mountainous, while a plain spans the south. The basin has a continental monsoon climate, with a mean annual precipitation of 447 mm. The spatial and temporal distribution of precipitation is seasonally uneven, and 80% of the precipitation is concentrated in June to September. The average annual temperature is 8 °C, with minimum monthly mean temperatures below −4 °C in winter and temperatures above 25 °C in summer. The watershed has 175 windy days per year, and the prevailing wind directions are NW and N [31].
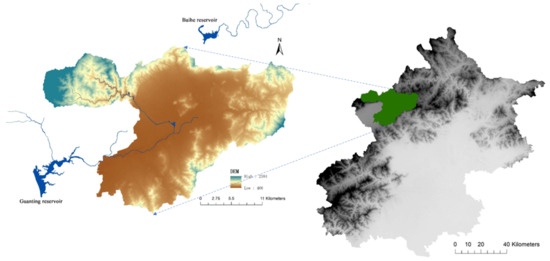
Figure 2.
The pilot catchment (left) and its location within Beijing Province (right).
Agriculture and sparse forests occupy approximately 80% of the watershed; grassland and settlements cover around 10% and 6%, respectively. The dominant forest trees are Robinia pseudoacacia, Pinus tabulaeformis, and Populus spp. Landcover is quite dynamic in the region due to the Grain for Green project and excessive urbanization (Table 1). From 2000 to 2010, forest cover increased to 44.26% and 55.63% from 40.95% in 1980. In 2013, forest cover reached 58.63%. In contrast, arable land and grassland declined from 40.45% and 14.95% in 1980 to 26.12% and 9.26% in 2013, respectively. A parallel increase can be observed in the settlement area—probably due to the vicinity of Beijing—with an overall increase of 186.48% within the same 33-year period.

Table 1.
Percentage of each land use in the Guishui watershed (A%) and the percentage of relative change (△%) compared with 1980.
The PhosFate hydrological module requires a digital elevation map, a physical soil type map, landcover, and meteorology (semi-annual mean air temperatures, precipitation sums, and mean wind speeds).
For the pilot catchment, data were obtained in the finest resolution available: a digital elevation map (30 × 30 m resolution, from Geospatial Data Cloud China, http://www.gscloud.cn/sources/,accessed on 3 April 2018) and other base maps (physical soil type and land use from the National Earth System Science Data Sharing Infrastructure, http://www.geodata.cn, accessed on 3 April 2018; winter and summer precipitation, air temperature, and wind speeds from the National Meteorological Information Center of China, http://data.cma.cn, accessed on 3 April 2018). The physical soil type was classified as sand, sandy loam, loam, clay–loam, clay, peat, or bare rock. Land-use categories were classified as city center, settlement area, industry, agriculture, meadow, orchard, deciduous forest, mixed forest, shrubs, sparse vegetation, or open water.
Monthly streamflow data from 1987 to 2017 were collected at the Dongdaqiao hydrologic station (116°00′00″ E, 40°25′30″ N) at the outlet of the catchment. To validate the model, the annual streamflow was calculated with PhosFate for each hydrological year (1st of April to the 31st of March) covered by streamflow data. However, from 1987 to 2003, water was transferred from the Baihe reservoir, located outside the catchment, to the Guishui River using an artificial channel, and this created a complication. While this could theoretically be accounted for, unfortunately, only the total amount of transferred water was recorded by calendar year; thus, the correction required us to approximate the proportion transferred in the first 3 months of each year.
As mentioned earlier, there have been significant land-use changes in the Guishui catchment in the last few decades (Table 1, Figure 3). We assumed that the land-use changes were gradual, especially in the 1980s and 1990s. Therefore, a map from 1980 was used to model the 1987–1992 period; a map from 2000 was used to model the 1996–2000 period; a map from 2008 was used to model the 2003–2007 period; and a map from 2013 was used to model the 2009–2014 period.
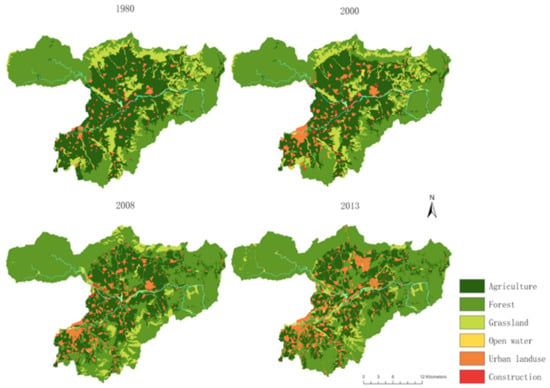
Figure 3.
Land-use changes in the Guishui catchment from 1980 to 2013. Light blue lines represent the river network.
2.4. Model Adjustment
PhosFate splits any landcover category into a mix of four elementary surface types: (1) a vegetated surface where interception and evapotranspiration occur in the growing season and runoff is limited; (2) bare soil with elevated runoff; (3) water with evaporation and immediate and full flow generation; and (4) an impervious surface with no evaporation and immediate and full runoff generation. Each surface type for different land-use types is set with different partition coefficients in the model to calculate the surface runoff, represented as a1s, a1w, a2s, a2w, a3, and a4 (s and w represent summer and winter).
Preset partition coefficients determine the proportions of elementary surface types in each landcover category based on its typical share in Central Europe (Table 2). Due to climatic and cultivation s between Europe and (North) China, these partition coefficients had to be changed through expert estimation.

Table 2.
Different partition coefficients suited for Central Europe and North China in the PhosFate model.
For example, forests in Shanxi and Hebei Provinces (including the Beijing and Tianjin Municipalities) have a mean July leaf area index (LAI) of 2.5 (LAI data for 2016 from TERRA/MODIS, https://neo.sci.gsfc.nasa.gov/, accessed on 10 October 2021; forest areas for 2010 from FAO Forest Cover Map 2000, http://www.fao.org/geonetwork/, accessed on 10 October 2021), whereas, in Central Europe (Germany, Switzerland, Austria, Czech Republic, Poland, Slovakia, and Hungary), the same parameter was 2.9. Differences also exist in other land-use categories.
Based on our field investigation of practical land use in the Guishui watershed, partition coefficients were changed for part of the land-use types that focused on the proportion of vegetated surfaces and bare soil in one category (Table 2). The main change in focus was on the meadow, orchard, forest, and shrub types, which have sparser vegetation cover in North China than in Central Europe.
2.5. Data for North China
For the entire study area, 304 meteorological stations were selected as representatives of their neighboring areas in North China. A corresponding district was delineated for each station. The district’s dominant physical topsoil type was decided according to a soil type map of China (http://www.geodata.cn, accessed on 3 April 2018). A mean terrain slope was calculated from the digital elevation map (http://www.gscloud.cn/sources/, accessed on 3 April 2018) and then divided into seven classes (0–1%, 1–2%, 2–7%, 7–12%, 12–18%, 18–24%, and above 24%) [30]. Meteorological data were based on annual data from 2003 to 2017 (National Meteorological Information Center of China, http://data.cma.cn, accessed on 3 April 2018). After adjustment to local conditions, PhosFate was used to calculate surface runoff and baseflow for forested areas and others, characterized by sparse vegetation.
3. Results
3.1. Discharge Data Selection
Figure 4 shows the monthly total flow and precipitation data from 1987 to 2015. The monthly total flow data had apparent errors. In some months, even though precipitation was high, the total flow was still in a low range; however, daily data were unavailable, and some of the water came from outside the watershed through an artificial channel from the Baihe reservoir. Thus, we could not check the total flow data day by day. Based on the assumption that there was a positive correlation between long-term flow and rainfall, 15 years were selected to perform the model calibration.
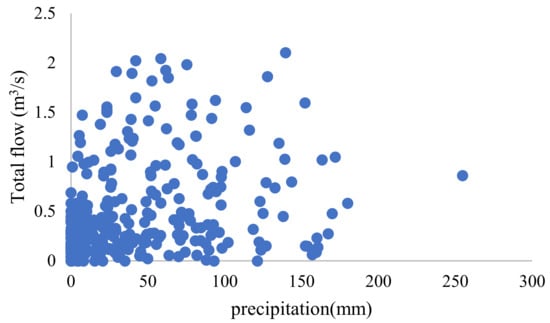
Figure 4.
Observed monthly total flow and precipitation in the watershed.
3.2. Model Calibration
Figure 5 shows the measured total flow and simulation results from PhosFate before and after the partition coefficients were changed. The Nash–Sutcliffe efficiency coefficient (NSE) and the correlation coefficient (R2) were used to assess the simulation results (Nash and Sutcliffe, 1970). In general, when NSE ≥ 0.5 and R2 ≥ 0.6, the simulation results are acceptable. In this research, before adjusting the partition coefficients for land use, the values were NSE = 0.18 and R2 = 0.79; after the adjustment, they were NSE = 0.67 and R2 = 0.78, which means that the simulation results were acceptable.

Figure 5.
Modeled and observed total flow in the watershed.
3.3. Impact of Afforestation on Guishui Watershed
Two different scenarios were developed to analyze the impact of land use on water yield: a constant scenario (I) and a forest scenario (II). The constant scenario assumed that there was no afforestation from 1996 to 2014. The forest scenario represents the assumption that all the agricultural land use was transferred to forests from 1996 to 2014. Figure 6 shows that the average total flow under the constant scenario was 0.57 m3/s, which is higher than the actual dataset at 0.52 m3/s and the forest scenario at 0.50 m3/s. From 1996 to 2007, the total flow change in the different scenarios was not significant but after 2009, total flow increased by around 24% more than the actual dataset in scenario I, and it decreased by 5% more than the actual dataset in scenario II. This is because the land-use map for 2013 was used to model the 2009–2014 period, which displayed great changes when compared with 1980. With increased afforestation in the catchment, the influence of afforestation on total flow is more notable.
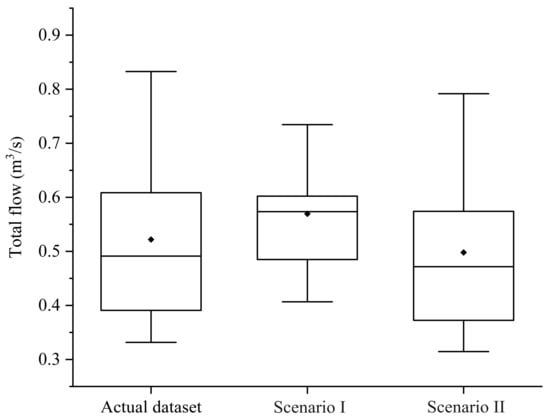
Figure 6.
Total flow under constant scenario and actual land use.
3.4. Impact of Climatic Changes on the Guishui Watershed
A mean monthly time series of temperature and precipitation from 1986 to 2017 can be found in Figure 7. In the Guishui watershed, the monthly temperature ranged from −11.2 to 25.9 °C, and the largest precipitation sum was 254.7 mm/month. The Mann–Kendall test [32] showed no trends in temperature or precipitation. The p-values of precipitation and temperature were 0.83 and 0.16, obviously exceeding 0.05. Therefore, there were no statistically significant trends in temperature or precipitation from 1986 to 2017 in the Guishui watershed.
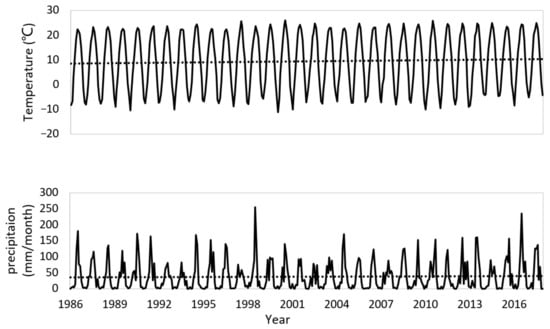
Figure 7.
Mean monthly time series of temperature and precipitation.
To determine the impact of climate change on total flow based on global warming predictions and more frequent extreme weather, a warming scenario (IV), aridity scenario (V), and humid scenario (VI) were compared with a future climate scenario (III). The future climate scenario (III) was based on land use in 2013, and the climate conditions were generated by the NCC/GU Weather Generator, issued by the National Climate Centre in China Meteorological Administration [33]. The warming scenario (IV), aridity scenario (V), and humid scenario (VI) assume a 3 °C increase in temperature based on the future climate scenario, a precipitation decline of 20% based on the future climate scenario, and a precipitation increase of 20% based on the future climate scenario, respectively.
Figure 8 shows that a 3 °C increase in temperature has little influence on total flow. Conversely, fluctuation in precipitation has a large impact on total flow. When precipitation increases by 10%, the average total flow increases by 53.49%; when precipitation decreases by 10%, the average total flow decreases by 33.55%.
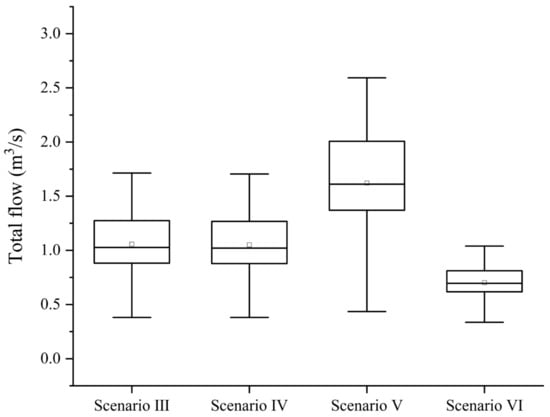
Figure 8.
Total flow under different climate scenarios.
4. Discussion
4.1. Impact of Afforestation in North China
Figure 9 shows the total flow change rate when land use shifted from sparse vegetation to mixed forests in North China, ignoring that the elevation is not suitable for forestation in many parts of the Qinghai–Tibet Plateau. The highest change rates were in the Qinghai–Tibet Plateau and the Loess Plateau. There was an up to 30% decline in total flow in the center of those two areas; in other places, such as Heilongjiang and some parts of NeiMongol, the decline trend was slight. In the Qinghai–Tibet Plateau, the main land-use type is alpine grassland, and it has a large amount of permafrost [34]. Although forest plants are limited by the poor soil and climate conditions in this area, the results still show that this area is sensitive to land-use changes. However, the Loess Plateau has undergone large-scale vegetation rehabilitation over the past 20 years, especially afforestation [35]. This revegetation has caused evapotranspiration to increase. Furthermore, this increase in evapotranspiration has induced a significant (p < 0.001) decrease in the ratio of river runoff to annual precipitation across hydrological catchments [36]. In the meantime, spatial and temporal changes in specific sediment yields presented significant decreases in the Loess Plateau within the last several decades [37]. As this is an area where soil loss has been severe, it is beneficial to implement large-scale soil and water conservation measures like afforestation; however, as this is also a semi-arid area, the reactivity of total flow to land-use changes is more sensitive than in other districts. Thus, afforestation should be limited to some extent.
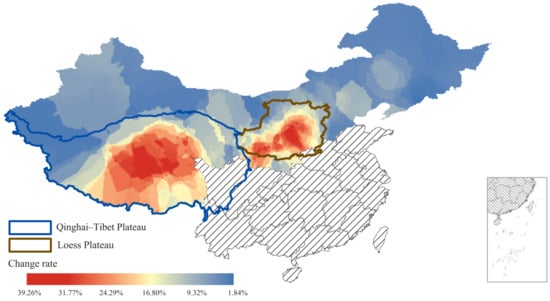
Figure 9.
Total flow change rate when land use shifts from sparse vegetation to mixed forests.
Based on geographical position, we divided North China into four districts: Tibet, the northeast district, the central–north district, and the northwest district. Figure 10 shows that the different annual precipitation distributions in North China increase with a decrease in latitude and an increase in longitude. Northwestern China has less precipitation than northeastern China.
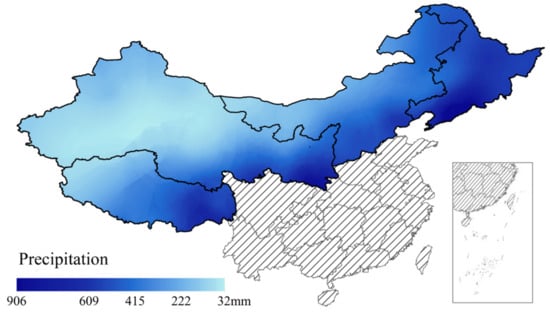
Figure 10.
Annual precipitation distribution in North China.
Figure 11 shows the trend in the total flow change rate when land use shifted from sparse vegetation to mixed forests as a function of annual precipitation for each district in North China. In the northeast district, there were hardly any limitations when afforestation was applied; the total flow change rate was less than 10% under different precipitation values in this area. Not only does the northeast district have better climate conditions but is also well known for its black soil rich in clay and loam.
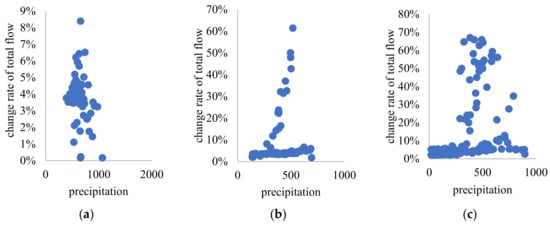
Figure 11.
Total flow change rate in districts of North China as a function of annual precipitation: (a) northeast district; (b) central–north district; (c) northwest district.
However, in the central–north district, the total flow change rate showed an increasing trend with precipitation, and after the precipitation reached 520 mm per year, the change rate remained under 10%. In the northwest district, the amount of precipitation moved to 790 mm because the soil and climate conditions in this area are worse than in the other two districts.
4.2. The Impact of Afforestation on Total Flow
China is implementing several programs to conserve and expand forests with the goal of mitigating soil erosion, air pollution, and climate change [38]. As mentioned above, land use in the Guishui watershed has also undergone a conversion from cropland to forests, and our results indicate that afforestation is the main reason for the decline in total flow in the Guishui River.
The same trend can also be found in some arid regions with large potential-to-actual evapotranspiration ratios. The influence of afforestation shows contrary trends under different soil conditions. Streamflow significantly declines for thick surface soil layers with afforestation because the evapotranspiration rates of forests exceed those of arable land; moreover, forests buffer water by reducing surface runoff, which then enables a longer period for uptake by plants [36,39]. However, thin soils lack this buffering capacity and prohibit the prolonged use of water by forest vegetation. On the other hand, artificially planted forests are often monocultures of a quickly growing species [7]. Such forests can consume more water than natural forests and frequently require one or more years of initial irrigation, which can increase water stress in an arid region [40].
In wetter areas, landcover changes do not seem to exert such an unambiguous effect on streamflow. In Brazil, the conversion of forests into arable lands and pastures has increased wet season flow and simultaneously decreased dry season flow [14], which seems to be in line with the presumably decreasing water-buffering capacity of the affected catchment; however, in a catchment in Portugal, where the annual rainfall ranges from 1000 to 2500 mm/year, there has been no significant reduction in streamflow in 75 years despite large-scale afforestation [15]. These contradictory findings indicate that the effects of afforestation on streamflow may be determined by considering this intricate network of hydro-meteorological processes through a complex analytical approach.
Although the influence of land-use changes can sometimes not be detected, the impacts of climate variability on lake and groundwater systems often overlook these changes [41]. There are numerous examples of land-use changes influencing river flows. In the Nakambe River in Burkina Faso, a semi-arid region, a marked improvement was found in flow simulations using the time-varying values of soil water-holding capacity, which is associated with land-cover degradation [42]. Forest expansion is an important driver of runoff reductions observed in the Iberian Peninsula [43,44].
Afforestation in North China has had a positive influence on preventing windy sand and soil erosion. However, most of this area is in arid or semi-arid districts; thus, afforestation in North China requires a huge amount of water for irrigation, especially in slope areas. Therefore, local conditions should be fully considered before afforestation.
4.3. Model Application
During research, data shortage is one of the most significant impediments. In important watersheds like Guishui, only monthly total flow data and one hydrological station on the river could be found, which increased errors in measurement. The streamflow data were taken only from 1987 to 2017, and other data, like water quality and sediment transportation, were also taken from only a brief period. In the future, more work is necessary to contribute to river monitoring and data collection.
Another important aspect that can be used with the PhosFate model is erosion and phosphorus emission hotspot identification; this should be the next step in research on watershed scales to provide a better foundation for watershed management in North China.
5. Conclusions
Understanding the major factors behind streamflow decline, such as those observed in the Guishui watershed, is a significant research priority that could better support watershed management. This preliminary study of North China provided valuable hints for country-wide afforestation management. Using model simulations, our research established the following:
- (1)
- Afforestation is a major factor in decreased total flow in the Guishui watershed. The total flow increased by around 24% compared with the actual dataset in the constant scenario and decreased by 5% compared with the actual dataset in the forest scenario. Meanwhile, temperature and precipitation had no significant change trend;
- (2)
- When forest coverage increases, the Qinghai–Tibet Plateau and the Loess Plateau are the most sensitive areas regarding total flow in North China. Meanwhile, in the northeast district, afforestation will not influence the total flow too much as this area benefits from a suitable climate and soil conditions. In the central–north and northwest districts, where the annual precipitation is under 520 mm and 790 mm, afforestation should be performed carefully due to detrimental effects on streamflow;
- (3)
- This research also proved that the PhosFate model is a suitable management planning tool for North China due to its low data demand.
Author Contributions
Conceptualization, M.H. and C.G.; methodology, M.H. and C.G.; resources, C.G. and T.W.; writing—original draft preparation, C.G.; writing—review and editing, M.H. and J.C. All authors have read and agreed to the published version of the manuscript.
Funding
This research was jointly funded by the Yangtze River Water Science Research Joint Fund (U2340215), the National Science and Technology Support Project (2015BAD07B040304), and the China Scholarship Council.
Data Availability Statement
Data support came from the National Earth System Science Data Sharing Infrastructure, the National Science & Technology Infrastructure of China (http://www.geodata.cn, accessed on 5 May 2024), and the National Meteorological Information Center of China (http://data.cma.cn, accessed on 5 May 2024).
Conflicts of Interest
Author Chunni Gao was employed by the company Changjiang Survey, Planning, Design and Research Co., Ltd. The remaining authors declare that the research was conducted in the absence of any commercial or financial relationships that could be construed as a potential conflict of interest.
References
- Newell, R.G.; Stavins, R.N. Climate Change and Forest Sinks: Factors Affecting the Costs of Carbon Sequestration. J. Environ. Econ. Manag. 2000, 40, 211–235. [Google Scholar] [CrossRef]
- Huang, L.; Liu, J.; Shao, Q.; Xu, X. Carbon sequestration by forestation across China: Past, present, and future. Renew. Sustain. Energy Rev. 2012, 16, 1291–1299. [Google Scholar] [CrossRef]
- Domke, G.M.; Oswalt, S.N.; Walters, B.F.; Morin, R.S. Tree planting has the potential to increase carbon sequestration capacity of forests in the United States. Proc. Natl. Acad. Sci. USA 2020, 117, 24649–24651. [Google Scholar] [CrossRef] [PubMed]
- Veldman, J.W.; Overbeck, G.E.; Negreiros, D.; Mahy, G.; Le Stradic, S.; Fernandes, G.W.; Durigan, G.; Buisson, E.; Putz, F.E.; Bond, W.J. Where Tree Planting and Forest Expansion are Bad for Biodiversity and Ecosystem Services. BioScience 2015, 65, 1011–1018. [Google Scholar] [CrossRef]
- Hengl, T.; Walsh, M.G.; Sanderman, J.; Wheeler, I.; Harrison, S.P.; Prentice, I.C. Global mapping of potential natural vegetation: An assessment of machine learning algorithms for estimating land potential. PeerJ 2018, 6, e5457. [Google Scholar] [CrossRef] [PubMed]
- Peng, S.; Li, Z. Incorporation of potential natural vegetation into revegetation programmes for sustainable land management. Land Degrad. Dev. 2018, 29, 3503–3511. [Google Scholar] [CrossRef]
- Hua, F.; Wang, X.; Zheng, X.; Fisher, B.; Wang, L.; Zhu, J.; Tang, Y.; Yu, D.W.; Wilcove, D.S. Opportunities for Biodiversity Gains under the World’s Largest Reforestation Programme. Nat. Commun. 2016, 7, 12717. [Google Scholar] [CrossRef]
- Deng, L.; Shangguan, Z.-p.; Li, R. Effects of the grain-for-green program on soil erosion in China. Int. J. Sediment Res. 2012, 27, 120–127. [Google Scholar] [CrossRef]
- Zhang, Y.; Song, C. Impacts of afforestation, deforestation, and reforestation on forest cover in China from 1949 to 2003. J. For. 2006, 104, 383–387. [Google Scholar] [CrossRef]
- Chen, C.; Park, T.; Wang, X.; Piao, S.; Xu, B.; Chaturvedi, R.K.; Fuchs, R.; Brovkin, V.; Ciais, P.; Fensholt, R.; et al. China and India lead in greening of the world through land-use management. Nat. Sustain. 2019, 2, 122–129. [Google Scholar] [CrossRef]
- Li, Y.; Piao, S.; Li, L.Z.X.; Chen, A.; Wang, X.; Ciais, P.; Huang, L.; Lian, X.; Peng, S.; Zeng, Z.; et al. Divergent hydrological response to large-scale afforestation and vegetation greening in China. Sci. Adv. 2018, 4, eaar4182. [Google Scholar] [CrossRef] [PubMed]
- Ke, S.; Qiao, D.; Yuan, W.; He, Y. Broadening the scope of forest transition inquiry: What does China’s experience suggest? For. Policy Econ. 2020, 118, 102240. [Google Scholar] [CrossRef]
- Gyawali, R.; Greb, S.; Block, P. Temporal Changes in Streamflow and Attribution of Changes to Climate and Landuse in Wisconsin Watersheds. Jawra J. Am. Water Resour. Assoc. 2015, 51, 1138–1152. [Google Scholar] [CrossRef]
- Dos Santos, J.Y.G.; Da Silva, R.M.; Carvalho Neto, J.; Montenegro, S.M.G.; Santos, C.; Silva, A. Assessment of land-use change on streamflow using GIS, remote sensing and a physically-based model, SWAT. Proc. Int. Assoc. Hydrol. Sci. 2014, 364, 38–43. [Google Scholar] [CrossRef][Green Version]
- Hawtree, D.; Nunes, J.P.; Keizer, J.J.; Jacinto, R.; Santos, J.; Rial-Rivas, M.E.; Boulet, A.K.; Tavares-Wahren, F.; Feger, K.H. Time series analysis of the long-term hydrologic impacts of afforestation in the Águeda watershed of north-central Portugal. Hydrol. Earth Syst. Sci. 2015, 19, 3033–3045. [Google Scholar] [CrossRef]
- Venkatesh, B.; Lakshman, N.; Purandara, B.K. Hydrological impacts of afforestation—A review of research in India. J. For. Res. 2014, 25, 37–42. [Google Scholar] [CrossRef]
- Chmielewski, F.M.; Müller, A.; Küchler, W. Possible impacts of climate change on natural vegetation in Saxony (Germany). Int. J. Biometeorol. 2005, 50, 96–104. [Google Scholar] [CrossRef] [PubMed]
- Witte, J.-P.M.; Bartholomeus, R.P.; van Bodegom, P.M.; Cirkel, D.G.; van Ek, R.; Fujita, Y.; Janssen, G.M.C.M.; Spek, T.J.; Runhaar, H. A probabilistic eco-hydrological model to predict the effects of climate change on natural vegetation at a regional scale. Landsc. Ecol. 2015, 30, 835–854. [Google Scholar] [CrossRef]
- Futang, W.; Zong-ci, Z. Impact of Climate Change on Natural Vegetation in China and its Implication for Agriculture. J. Biogeogr. 1995, 22, 657–664. [Google Scholar] [CrossRef]
- Liu, J.; Folberth, C.; Yang, H.; Röckström, J.; Abbaspour, K.; Zehnder, A.J. A global and spatially explicit assessment of climate change impacts on crop production and consumptive water use. PLoS ONE 2013, 8, e57750. [Google Scholar] [CrossRef]
- Fischer, G.; Tubiello, F.; Velthuizen, H.; Wiberg, D. Climate change impacts on irrigation water requirements: Effects of mitigation, 1990–2080. Technol. Forecast. Soc. Chang. 2007, 74, 1083–1107. [Google Scholar] [CrossRef]
- Sivapalan, M.; Takeuchi, K.; Franks, S.W.; Gupta, V.K.; Karambiri, H.; Lakshmi, V.; Liang, X.; Mcdonnell, J.J.; Mendiondo, E.M.; O’Connell, P.E. IAHS Decade on Predictions in Ungauged Basins (PUB), 2003–2012: Shaping an exciting future for the hydrological sciences. Int. Assoc. Sci. Hydrol. Bull. 2003, 48, 857–880. [Google Scholar] [CrossRef]
- Huang, Y.; Chen, X.; Bao, A.M.; Liu, T.; Feng, X.W. Daily flow modeling in arid ungauged basin. Adv. Water Sci. 2009, 20, 332–336. [Google Scholar]
- Xue, J.; Gui, D.; Lei, J.; Feng, X.; Zeng, F.; Zhou, J.; Mao, D. Reconstructing meteorological time series to quantify the uncertainties of runoff simulation in the ungauged Qira River Basin using data from multiple stations. Theor. Appl. Climatol. 2016, 126, 61–76. [Google Scholar] [CrossRef]
- Li, J.; Zhao, W.; Zhang, X. The change analysis of soil erosion in the upper basin of Guanting reservoir. In Proceedings of the The 18th International Conference on Geoinformatics: GIScience in Change, Geoinformatics 2010, Beijing, China, 18–20 June 2010. [Google Scholar]
- Kovacs, A.S.; Honti, M.; Clement, A. Design of best management practice applications for diffuse phosphorus pollution using interactive GIS. Water Sci. Technol. A J. Int. Assoc. Water Pollut. Res. 2008, 57, 1727–1733. [Google Scholar] [CrossRef] [PubMed]
- Kovacs, A.; Honti, M.; Zessner, M.; Eder, A.; Clement, A.; Bl?schl, G. Identification of phosphorus emission hotspots in agricultural catchments. Sci. Total Environ. 2012, 433, 74–88. [Google Scholar] [CrossRef]
- Honti, M. Controlling River Eutrophication under Conflicts of Interests—A GIS Modeling Approach. Water 2015, 7, 5078–5090. [Google Scholar] [CrossRef]
- Batelaan, O.; De Smedt, F. WetSpass: A flexible, GIS based, distributed recharge methodology for regional groundwater modelling. IAHS Publ. 2001, 269, 11–18. [Google Scholar]
- Guo, B.; Zhang, J.; Gong, H.; Cheng, X. Future climate change impacts on the ecohydrology of Guishui River Basin, China. Ecohydrol. Hydrobiol. 2014, 14, 55–67. [Google Scholar] [CrossRef]
- Xie, C.; Zhang, L.; Wang, M.; Jiang, Q.o. Scenario analysis on the management practices and optimization of rural non-point source pollution with the coupling of source-process-end: A case study of the Guishui river basin. Ecol. Indic. 2024, 159, 111677. [Google Scholar] [CrossRef]
- Kendall, M.G. Rank correlation methods. Br. J. Psychol. 1990, 25, 86–91. [Google Scholar] [CrossRef]
- Liao, Y.; Qiang, Z.; Deliang, C. Stochastic modeling of daily precipitation in China. J. Geogr. Sci. 2004, 14, 417–426. [Google Scholar]
- Ran, Y.; Li, X.; Cheng, G. Climate warming over the past half century has led to thermal degradation of permafrost on the Qinghai–Tibet Plateau. Cryosphere 2018, 12, 595–608. [Google Scholar] [CrossRef]
- Jin, Z.; Guo, L.; Yu, Y.; Luo, D.; Chu, G. Storm runoff generation in headwater catchments on the Chinese Loess Plateau after long-term vegetation rehabilitation. Sci. Total Environ. 2020, 748, 141375. [Google Scholar] [CrossRef] [PubMed]
- Feng, X.; Fu, B.; Piao, S.; Wang, S.; Ciais, P.; Zeng, Z.; Lü, Y.; Zeng, Y.; Li, Y.; Jiang, X. Revegetation in China’s Loess Plateau is approaching sustainable water resource limits. Nat. Clim. Chang 2016, 6, 1019–1022. [Google Scholar] [CrossRef]
- Zhao, G.; Mu, X.; Wen, Z.; Wang, F.; Gao, P. Soil erosion, conservation, and eco-environment changes in the Loess Plateau of China. Land Degrad. Dev. 2013, 24, 499–510. [Google Scholar] [CrossRef]
- Wang, P.; Chen, G. Environmental dispersion in a tidal wetland with sorption by vegetation. Commun. Nonlinear Sci. Numer. Simul. 2015, 22, 348–366. [Google Scholar] [CrossRef]
- Brown, A.E.; Zhang, L.; McMahon, T.A.; Western, A.W.; Vertessy, R.A. A review of paired catchment studies for determining changes in water yield resulting from alterations in vegetation. J. Hydrol. 2005, 310, 28–61. [Google Scholar] [CrossRef]
- Zheng, H.; Wang, Y.; Chen, Y.; Zhao, T. Effects of large-scale afforestation project on the ecosystem water balance in humid areas: An example for southern China. Ecol. Eng. 2016, 89, 103–108. [Google Scholar] [CrossRef]
- Yihdego, Y.; Webb, J. Modelling of seasonal and long-term trends in lake salinity in southwestern Victoria, Australia. J. Environ. Manag. 2012, 112, 149–159. [Google Scholar] [CrossRef]
- Mahe, G.; Paturel, J.-E.; Servat, E.; Conway, D.; Dezetter, A. The impact of land use change on soil water holding capacity and river flow modelling in the Nakambe River, Burkina-Faso. J. Hydrol. 2005, 300, 33–43. [Google Scholar] [CrossRef]
- López-Moreno, J.I.; Beniston, M.; García-Ruiz, J.M. Environmental change and water management in the Pyrenees: Facts and future perspectives for Mediterranean mountains. Glob. Planet. Chang. 2008, 61, 300–312. [Google Scholar] [CrossRef]
- Morán-Tejeda, E.; Ceballos-Barbancho, A.; Llorente-Pinto, J.M. Hydrological response of Mediterranean headwaters to climate oscillations and land-cover changes: The mountains of Duero River basin (Central Spain). Glob. Planet. Chang. 2010, 72, 39–49. [Google Scholar] [CrossRef]
Disclaimer/Publisher’s Note: The statements, opinions and data contained in all publications are solely those of the individual author(s) and contributor(s) and not of MDPI and/or the editor(s). MDPI and/or the editor(s) disclaim responsibility for any injury to people or property resulting from any ideas, methods, instructions or products referred to in the content. |
© 2024 by the authors. Licensee MDPI, Basel, Switzerland. This article is an open access article distributed under the terms and conditions of the Creative Commons Attribution (CC BY) license (https://creativecommons.org/licenses/by/4.0/).