Abstract
Land-use and land-cover changes constitute pivotal components in global environmental change research. Through an examination of spatiotemporal variations in land cover, we can deepen our understanding of land-cover change dynamics, shape appropriate policy frameworks, and implement targeted environmental conservation strategies. The judicious management of land is a critical determinant in fostering the sustainable growth of urban economies and enhancing quality of life for residents. This study harnessed remote sensing data to analyze land-cover patterns in Tianjin over five distinct time points: 2000, 2005, 2010, 2015, and 2020. It focused on evaluating the evolving dynamics, transition velocities, and transformation processes across various land categories within the region. Utilizing dynamic analysis and a transition matrix, the study traced shifts among different land-use classes. The center-of-gravity migration model was employed to elucidate land-cover pattern evolution. This research also integrated pertinent land-cover statistics to offer a holistic perspective on Tianjin’s land-cover transformations. Employing the CA–Markov model, we projected the prospective spatial layout of land cover for the area. Our findings revealed the following. (1) From 2000 to 2020, Tianjin experienced a significant reduction in cropland, forest, grassland, and water areas, alongside a substantial increase in impervious. (2) The impervious surface’s center of gravity, initially in Beichen District, shifted 4.20 km northwestward at an average rate of 0.84 km per year. (3) Principal component analysis indicated that the growth in the output value of the secondary and forestry industries is a key driver in expanding Tianjin’s impervious-surface area. (4) Predictions for 2025 suggest an increase in Tianjin’s impervious-surface area to 4659.78 km2, with a concurrent reduction in cropland to 5656.18 km2. The insights gleaned from this study provide a solid theoretical foundation and empirical evidence, aiding in the formulation of informed land-use strategies, the preservation of urban land resources, and guiding principles for sustainable urban development.
1. Introduction
Land use involves a process wherein humans analyze the natural characteristics of land, utilizing biological, technological, and legal policies, modify socio-economic activities [1,2]. Land-use and -cover change (LUCC) can directly affect the diversity of biological species [3], contribute to climate change and ecosystem transformations [4], and increase human–environment interactions [5]. Additionally, land use significantly shapes social, economic, and political landscapes [6]. Conducting land-use analysis is vital for understanding the intricate relationship between humans and nature, offering insights into current land-use patterns and guiding the implementation of appropriate interventions. This analysis helps to discern the interplay between human activities and the natural world and evaluate their impact on living environments. Based on current land-use scenarios, tailored measures can be devised to enhance and improve these environments [7,8]. Land-use analysis is instrumental in understanding the interconnectedness of human and natural systems, potentially influencing the quality of human habitats.
LUCC is a critical subject in the realms of global climate change and sustainable development, emerging as a key factor in human–land relationship studies [9]. In recent years, numerous scholars have applied remote sensing technology to investigate land-use changes, simulating future alterations under various scenarios based on differing land-use demands and policies [10]. This research typically encompasses the driving forces behind LUCC, spatial and temporal dynamic analysis, and regional and global land-use/-cover change models [11,12]. Furthermore, a variety of models are used, such as cellular automata (CA) [13], grey prediction models [14], system dynamics (SD) models [15], and Markov models [16]. The CA–Markov model integrates the strengths of cellular automata and Markov chain models to simultaneously predict spatial patterns and temporal trends, making it well suited for simulating complex changes in multiple land-use types. Consequently, this approach has gained widespread application in analyzing LUCC [17,18], and CA–Markov models have been developed to enhance the understanding, assessment, and prediction of land-cover changes. The diverse simulation mechanisms of these LUCC models have unique strengths and limitations, impacting the accuracy of simulations and forecasts. Notably, the CA–Markov model, which effectively merges the spatial prediction capabilities of the CA model with the long-term predictive simulation of the Markov model, significantly enhances accuracy. This model has gained widespread application in urban research [19,20].
Recently, there has been significant progress in the integration of multi-source data for land-cover research. For instance, Haghigh et al. conducted an assessment of land-use changes during three periods (1994–2002, 2002–2009, and 2009–2015) and made predictions for 2009, 2015, and 2023 by using the CA–Markov model to predict land-use change [21]. Han et al. combined CLUES and Markov models to simulate development and protection scenarios for Beijing from 2010 to 2020 and identified a major feature of conversion from arable land to built-up land [22]. Yang et al. utilized the CA–Markov model to predict land-cover changes to support development planning and formulate land-use policies in the Guangdong–Hong Kong–Macao Greater Bay Area [23]. Zhang et al. integrated the CA–Markov model into the random forest algorithm to comprehend dynamics in LUCC under specific scenarios, assessing the impacts of multiple variables on regional-scale land-use evaluation, and applied this coupled model to Southeast China’s largest watershed: Minjiang River Watershed [24].
Effective land use has recently become a focal point of research [8,25], with LUCC being a central theme in global change studies [26]. However, the current research predominantly targets ecologically sensitive areas, focusing on land-use types and change drivers [27]. Most present-day simulations and predictions of land-use changes concentrate on large-scale, two-phase predictions or examine data from a broad regional planning perspective, often resulting in less precise outcomes [28]. This paper explores the spatial and temporal LUCC and its driving forces in Tianjin from 2000 to 2020. It extracts land-cover-type information across multiple periods to uncover the characteristics of spatiotemporal dynamic changes in land use, analyzing both the trajectory of land-use shifts and urban center transformations. Influencing factors are examined using principal component and multiple linear regression analyses. Finally, the CA–Markov coupling model is employed to forecast the dynamic changes in Tianjin’s land use by 2025. This research provides a scientific and theoretical foundation for the sustainable development of land use in Tianjin.
2. Study Area and Data
2.1. Study Area
As a vital provincial administrative region and municipality, Tianjin serves as a key gateway for international openness in Northern China. It is recognized as a prominent shipping and logistics hub, as well as a center for modern manufacturing (Figure 1). Geographically situated at 38°33′ to 40°15′ N latitude and 116°42′ to 118°03′ E longitude, Tianjin is located in the northern segment of the North China Plain [29]. As of 2022, the city encompasses 16 districts, covering a total area of 11,966.45 km2. It boasts a resident population of 13.63 million, of which 11.6 million people live in urban areas, leading to an urbanization rate of 85.11%. Figure 1 illustrates the geographical location of the study area.
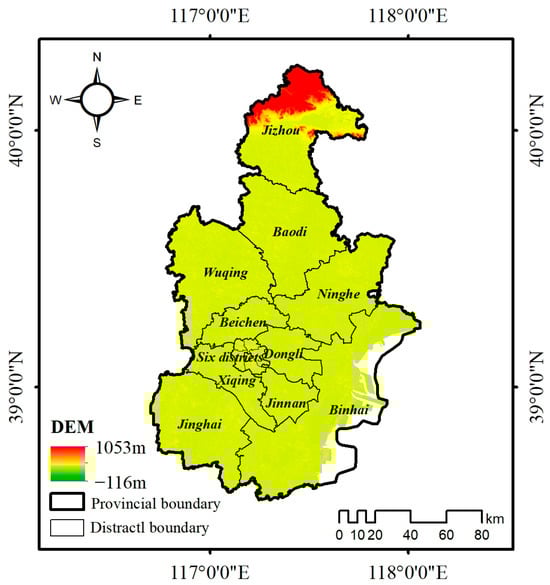
Figure 1.
Study area.
2.2. Study Data
2.2.1. Remote Sensing Data
The data employed in this study were sourced from the 2000-to-2020 land-cover dataset of Tianjin, available on the Google Earth Engine (GEE) platform. This dataset was derived from Landsat satellite imagery processed on GEE, with annual land-cover products constructed using the random forest algorithm. The classification of land cover within this dataset segregates the land in Tianjin into seven primary categories, in accordance with first-level classification standards. These categories predominantly encompass cropland, forest, shrubland, grassland, water, barren land, and impervious surfaces [30]. For the purpose of this study, 30 m resolution land-cover remote sensing imagery data for Tianjin for the years 2000, 2005, 2010, 2015, and 2020 were meticulously selected as the foundational data. The land types in this study are categorized into seven major groups without further refinement. Meanwhile, the remote sensing data used have a resolution of 30 m. For Tianjin, employing higher precision remote sensing data for analysis and research would enable better extraction of the land-cover change issues reflected in the dataset.
2.2.2. Statistical Data
The statistics used in this study were obtained from the National Statistical Yearbook, Tianjin Statistical Yearbook, and additional information from the Tianjin Municipal Bureau of Statistics, spanning from 2000 to 2020. These statistics include the resident population, urban and rural per capita disposable incomes, the city’s GDP, and the output values of the primary, secondary, and tertiary industries. Furthermore, they encompass data from agriculture, forestry, animal husbandry, fisheries, and the gross output value of the construction industry. Other key indicators are the general public budget income and expenditure, completed real estate investment, total grain production, total retail sales of consumer goods, and the urban and village populations, amounting to a total of 19 driving indicators.
3. Methods
The flowchart is shown in Figure 2, and the specific methods used are introduced below. The remote sensing data and statistical data were initially preprocessed in this study, encompassing radiometric calibration, atmospheric correction, etc. Subsequently, an analysis was conducted to examine the changes in land cover within Tianjin, including variations in area, frequency, intensity, etc. Following this analysis, 19 driving force indicators were selected for further investigation. Finally, a prediction model was employed to investigate the land-use patterns in Tianjin.
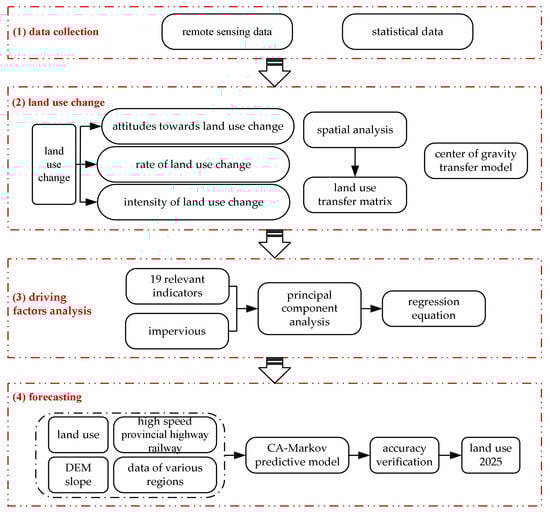
Figure 2.
The flowchart.
3.1. Land-Use Change Studies
3.1.1. Attitudes towards Land-Use Change
Land-use dynamics serve as an indicator reflecting the rate of change in land use. They are primarily utilized to compare the historical differences in the rates of various types of land changes and to forecast future trends in land-use alterations. In this study, a singular approach to land-use dynamics was employed. The calculation formula utilized is as follows:
where k represents a single land-use dynamic attitude, t2, and t1 is the time interval during the study period. u1 is the initial area of the class during the study period, and u2 is the area of the class at the end of the study period.
3.1.2. Contribution Rate of Land-Use Change
The contribution rate of land-use change is defined as the proportion of the area of a specific type of land use that has undergone change, relative to the total area of all land-use types that have changed within the same period. The formula for calculating this rate is as follows:
where Fi represents the contribution rate of changes in a certain land-use type (i) during the research period.
Fi denotes the contribution of a land-use type i to the change in the study period, and and represent the area of the land-use type i at the beginning and end of the study, respectively.
3.1.3. Intensity of Land-Use Change
The intensity index for land-use change quantifies the extent of change in a specific land-use type, expressed as the percentage of the area that has changed relative to the total area at both the beginning and end of the research period. This index is calculated to determine the magnitude or trend of land-use changes over a given time frame. The formula for this calculation is as follows:
where Si represents the intensity of changes in a certain land-use type i during the research period. and represent the area of land-use type i at the beginning and end of the study, respectively, D is the total area of the study area.
3.2. Methods of Spatial Analysis
The land-use transfer matrix is a tool that illustrates the changes, inflows, and outflows of different land types over the course of the research period. It enables the observation and analysis of changes in various land types in both a directional and quantitative manner. This matrix effectively reflects the evolving characteristics of the land-use structure. By superimposing spatial maps representing two different phases of land-use status in Tianjin, the transformation between various land types was identified and subsequently analyzed. The formulation of the land-use transfer matrix is as follows:
where Sij represents the area where the i type of land was converted into the j type of land during the studied time period, i is the land-use type at the beginning of the research period, j is the type of land used at the end of the research period, n is the number of land-use types, and n is 7 in this paper.
3.3. Center-of-Gravity Transfer Model
The concept of the center of gravity, originally derived from physics, is applied to study the shifts and transitions in variables like population and economy. In the context of land-use and -cover change (LUCC) research, the center-of-gravity transfer model is utilized to simulate temporal changes in the center of gravity for specific land-use types. This approach effectively reveals the spatial dynamics of LUCC pattern transformations. The formula for calculating the center-of-gravity coordinates in this model is as follows:
where and are the latitude and longitude coordinates of the land-use type in period t, respectively, n is the number of patches of land-use type in period t, is the area of the i patch of land-use type j, and are the latitude and longitude coordinates.
The formula for the distance and velocity between the centers of gravity of the same land type at different periods is as follows:
where is the centroid distance of land-use type i from period m to n, and are the centroid coordinates of land-use type i in periods m and n, respectively. is the migration rate of the center of gravity for land-use type i, and are the beginning and end of the study period, respectively.
3.4. Principal Component Analysis
Principal component analysis (PCA) is a widely employed method in data analysis, which focuses on reducing the dimensionality of data [31]. This approach transforms multiple indicators into a smaller number of comprehensive indicators. The main steps involved in PCA are as follows: (1) calculate the correlation coefficient matrix, (2) determine eigenvalues and eigenvectors, (3) compute the principal component contribution rate and cumulative contribution rate, and (4) calculate the principal component load. In this study, data from the period 2000 to 2020 were selected as the sample for PCA to examine the driving forces behind land-use change in Tianjin [32,33].
3.5. CA–Markov Predictive Modeling
The cellular automaton (CA) model is a spatial computational tool, notable for its discrete nature in time, space, and state [13]. It is adept at modeling spatial interactions and temporal causality. On the other hand, the Markov model is grounded in Markov process theory and is used for predicting the likelihood of events occurring [34]. The CA–Markov model synergistically combines the strengths of both the CA and Markov approaches [35]. This coupled model harnesses CA’s capability to address spatial changes in complex systems and integrates it with Markov’s proficiency in predicting quantitative aspects of land use. Consequently, the CA–Markov model effectively mines and utilizes dynamic evolution information on land use, capturing both its spatial and quantitative dimensions.
4. Results
4.1. Analysis of Changes in Land-Use Quantities
4.1.1. Analysis of Changes in Land-Use Area
Utilizing the classification outcomes of remote sensing images, this study quantified the areas of different land-cover types in Tianjin for the years 2000, 2005, 2010, 2015, and 2020, as depicted in Figure 3 and detailed in Table 1. Additionally, the percentage of each land-cover area is presented in Table 2. According to these tables, the land-cover types in Tianjin, ranked from the largest to smallest areas, are cropland, impervious surfaces, water, forest, grassland, barren land, and shrubland. These types have an average proportion of 58.45%, 28.38%, 9.79%, 2.98%, 0.2485%, 0.16%, and 0.0005%, respectively. It is evident that cropland is the predominant land-use type in Tianjin, followed by impervious surfaces, while the areas of other land types are relatively small, each constituting less than 10% of the total land use.
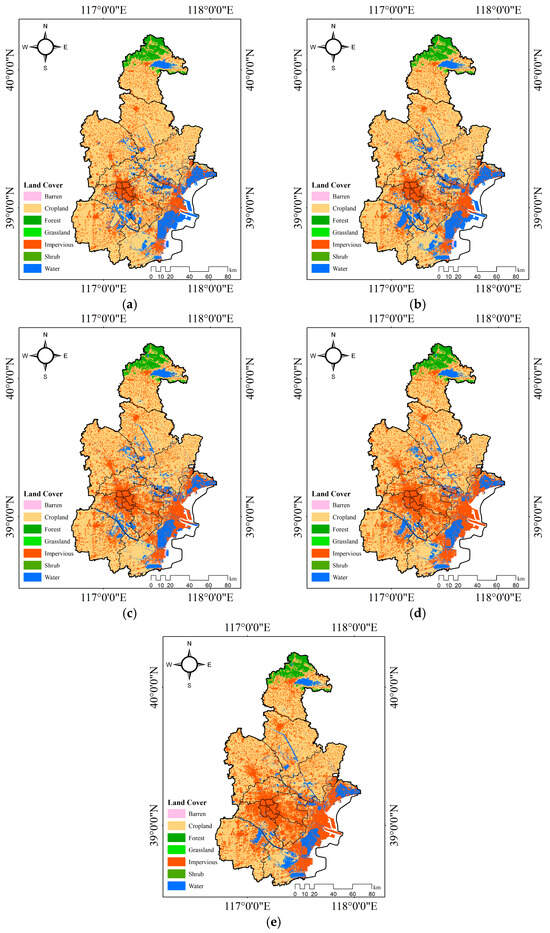
Figure 3.
Land cover in Tianjin. (a) Land cover in Tianjin, 2000. (b) Land cover in Tianjin, 2005. (c) Land cover in Tianjin, 2010. (d) Land cover in Tianjin, 2015. (e) Land cover in Tianjin, 2020.

Table 1.
Area of land-cover types in Tianjin (km2).
Table 2.
Statistics on the percentage area of land-cover types in Tianjin.
Figure 4 shows a line chart depicting the changes in land-cover area in Tianjin from 2000 to 2020. During this period, there was a marked decrease in the area of cropland, while impervious surfaces exhibited a consistent upward trend. The areas of other land types, such as water, experienced fluctuations. Notably, from 2000 to 2020, the area of impervious surfaces in Tianjin expanded significantly by 1546.74 km2, whereas the area of cropland decreased by 1209.62 km2. These changes underscore the rapid urbanization that Tianjin has undergone over the past two decades.
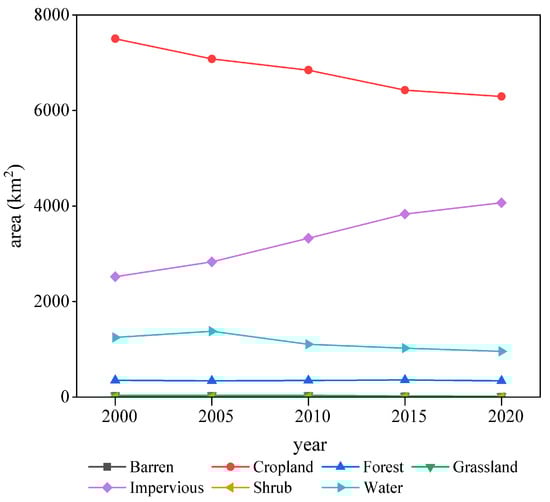
Figure 4.
Land-cover change in Tianjin (2000~2020).
4.1.2. Analysis of Changes in the Rate of Land Cover
The ‘attitude’ of a single land-cover type refers to the rate of change in a particular land-cover category over a specific time period within the study area. The larger the absolute value of the attitude, the more rapid the increase or decrease in land area, making it a useful tool for monitoring land-area changes. Table 3 illustrates the annual change rates in single land-cover types in Tianjin from 2000 to 2020.
Table 3.
Annual rate of change in single land-cover types in Tianjin.
According to Table 3, the annual change rate of the impervious-surface area in Tianjin was consistently above zero, indicating an ongoing annual increase. Notably, the fastest annual growth in the impervious-surface area occurred between 2005 and 2010, at a rate of 3.5%. The slowest growth was recorded from 2015 to 2020, at 1.24%. Conversely, the annual change rate for cropland in Tianjin was below zero, signaling a year-by-year decrease. The most rapid decline happened from 2015 to 2020, with an annual rate of −0.42%, while the slowest decrease was from 2010 to 2015, at −1.22%. Over the past two decades, the increase in impervious-surface areas and the decrease in cropland in Tianjin have been closely linked to the ongoing urbanization and construction policies in the region.
4.2. Land-Use Transfer Analysis
To more effectively examine the transformations in land-use types, this study utilized land-use data spanning from 2000 to 2020. It involved comparing different time periods to analyze the dynamic processes of inflow and outflow for each land-use category across these periods. By calculating the specific amounts of area transformation, we constructed the land-use transfer matrix and developed corresponding land-use transfer matrix diagrams (as shown in Figure 5). This approach allowed for a comprehensive and in-depth understanding of the changes in land-cover types over the two decades.
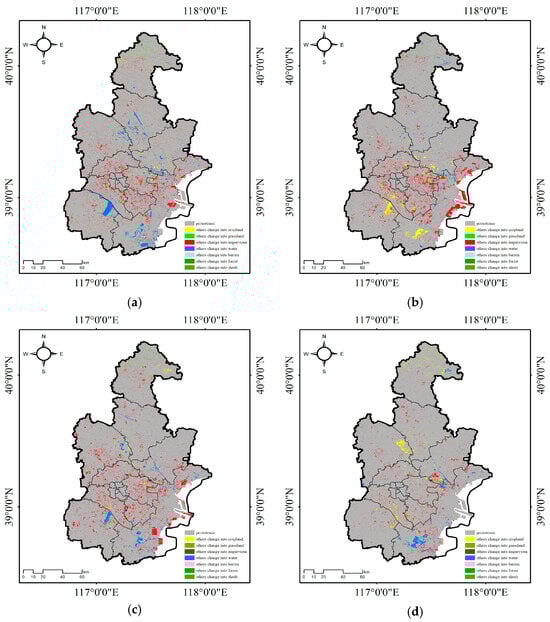
Figure 5.
Matrix of land transfer in Tianjin (2000~2020). (a) Transfer matrix for 2000–2005. (b) Transfer matrix for 2005–2010. (c) Transfer matrix for 2010 to 2015. (d) Transfer matrix for 2015–2020.
4.2.1. Analysis of the Transformation Status of Land Use from 2000 to 2005
In Figure 5a, it is illustrated that the total area of impervious surfaces in Tianjin was initially 2522.05 km2 in 2000, which increased to 2831.95 km2 by 2005. During this period, the unconverted impervious-surface area remained at 2370.37 km2. The outflow area from impervious surfaces totaled 151.68 km2, with conversions to various land types: barren land (1.04 km2), cropland (84.21 km2), forest (0.06 km2), grassland (0.10 km2), and water (66.27 km2). On the other hand, the inflow into impervious-surface areas amounted to 461.58 km2, primarily sourced from barren land (2.08 km2), cropland (361.67 km2), forest (0.78 km2), grassland (0.76 km2), and water (96.29 km2).
4.2.2. Analysis the Transformation Status of Land Use from 2005 to 2010
The total area of impervious surfaces in Tianjin was 2832.44 km2 in 2005, which had increased to 3328.21 km2 by 2010 (Figure 5b). During this interval, the area that remained unconverted constituted 2784.69 km2. The outflow from impervious surfaces accounted for 47.75 km2, with transitions to different land types: barren land (0.12 km2), cropland (0.94 km2), grassland (0.0018 km2), and water (46.69 km2). The total inflow into the impervious-surface areas was 543.52 km2, primarily coming from barren land (5.33 km2), cropland (343.90 km2), forest (0.96 km2), grassland (0.78 km2), and water (192.55 km2).
4.2.3. Analysis of the Transformation Status of Land Use from 2010 to 2015
Between 2010 and 2015, the total area of impervious surfaces in Tianjin increased from 3328.21 km2 to 3832.06 km2 (Figure 5c). The area that remained unchanged in this period constituted 3289.79 km2. The outflow from impervious surfaces during this time was 38.46 km2, which included transitions to various land types: barren land (0.19 km2), cropland (0.24 km2), forest (0.0027 km2), and water (38.02 km2). The inflow into the impervious-surface area totaled 542.30 km2, predominantly sourced from barren land (9.36 km2), cropland (390.22 km2), forest (0.45 km2), grassland (2.18 km2), and water (140.09 km2).
4.2.4. Analysis of the Transformation Status of Land Use from 2015 to 2020
From 2015 to 2020, the total area of impervious surfaces in Tianjin rose from 3832.06 km2 to 4069.16 km2. The unconverted area during this period constituted 3794.23 km2 (Figure 5d). The outflow from impervious surfaces amounted to 37.82 km2, comprising conversions to cropland (0.51 km2) and water (37.31 km2). The inflow into the impervious-surface area totaled 274.93 km2, with significant contributions from various land types: barren land (7.25 km2), cropland (204.69 km2), forest (0.42 km2), grassland (0.63 km2), and water (61.93 km2).
Synthesizing the analysis presented earlier, Figure 6 delineates the principal directions of land-cover-type transfers in Tianjin, elucidating the underlying patterns in these changes. The predominant transfer trends in Tianjin’s land-cover types are as follows: (1) water predominantly transitioned to cropland and impervious surfaces; (2) barren land mainly transformed into water and impervious surfaces; (3) cropland was primarily converted into impervious surfaces and water; (4) forest areas were largely transferred to cropland; (5) grassland mainly transitioned to cropland and forests; (6) shrubland was primarily converted into grassland; (7) impervious surfaces predominantly changed into water. These trends are closely aligned with the urban development and land-management policies implemented in Tianjin in recent years.
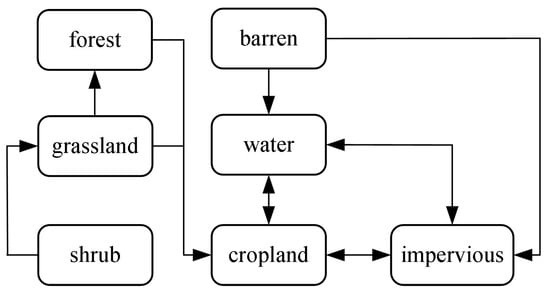
Figure 6.
Major transfers of land-cover types in Tianjin.
4.3. Analysis of the Extent of Land Use
4.3.1. Classification of Land-Use Levels
The degree of land use varies depending on the level of land use. Classifying land-use types could provide a basis for evaluating land use. In this study, land use in Tianjin was divided into four levels, namely: (1) barren land, (2) land for forests, grass, and water, (3) agricultural land, and (4) urban settlement land (Table 4).
Table 4.
Classification of land cover in Tianjin.
4.3.2. Calculation of the Land-Cover Index
The composite land-cover index is a measure of the degree of influence of human factors on land cover, and its calculation formula is as follows:
where L is the comprehensive land-use index; Ai is the grading index of land-use type i; and Ci is the area share of land-use type i.
In this study, a comprehensive index of land use in Tianjin in 2000, 2005, 2010, 2015 and 2020 was calculated (Figure 7). We found that from 2000 to 2020, the comprehensive index of land use in Tianjin showed an increasing state, indicating that land use in Tianjin still has potential in terms of utilization and development.
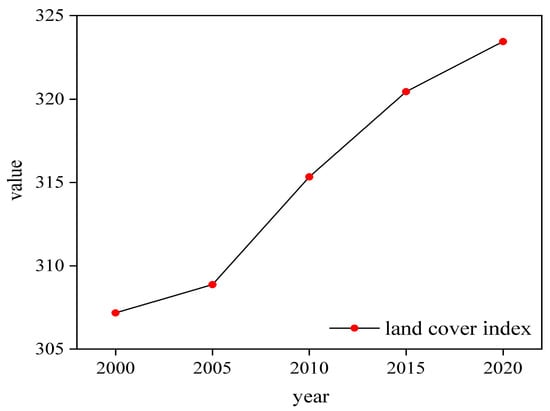
Figure 7.
Comprehensive land-cover index for Tianjin.
4.4. Analysis of Changes in Land-Cover Urban Expansion
In this study, the center-of-gravity migration model is utilized to calculate both the distance and rate of center-of-gravity migration for impervious surfaces in Tianjin. This approach reflects the changes in urban spatial patterns and the speed of these changes, thereby illustrating the pace and pattern of the urbanization construction process in Tianjin in recent years. Based on land-type maps of Tianjin for the years 2000, 2005, 2010, 2015, and 2020, this study calculates the latitude and longitude coordinates of the center of gravity for impervious surfaces over the past 20 years (Table 5), along with the distance and rate of center-of-gravity migration (Table 6), and the trajectory of this migration (Figure 8).
Table 5.
Latitude and longitude coordinates of the center of gravity of Tianjin.
Table 6.
Distance and rate of change for impervious surfaces in Tianjin.
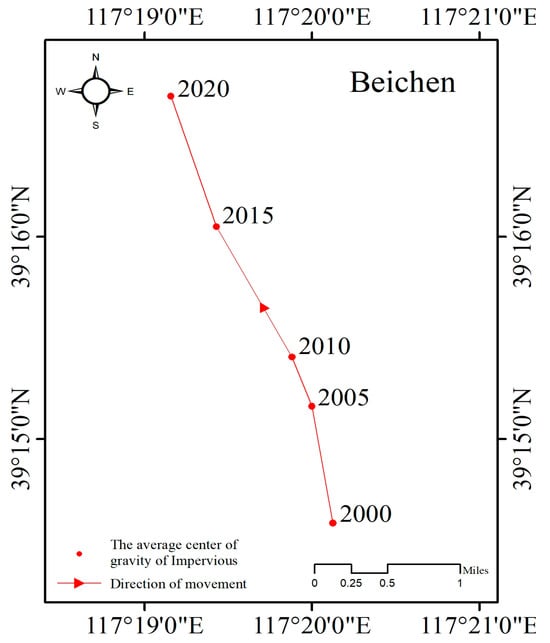
Figure 8.
Shift in center of gravity of impervious surfaces.
The results indicate that from 2000 to 2020, the center of gravity of Tianjin’s impervious surfaces, located in the Beichen District, shifted northwestward. Specifically, from 2000 to 2005, the center of gravity moved 1.0971 km northwest, at a rate of 0.2194 km/year. Between 2005 and 2010, it moved 0.4889 km northwest, at a rate of 0.0978 km/year. From 2010 to 2015, the movement was 1.3693 km northwest, at a rate of 0.2739 km/year. Finally, from 2015 to 2020, it shifted 1.2759 km northwest, at a rate of 0.2552 km/year. Overall, this indicates a consistent northwestward shift of the center of gravity of impervious surfaces in Tianjin, with a total distance of 4.1992 km and an average movement rate of 0.8398 km/year.
4.5. Analysis of Factors Influencing Land-Cover Change
In this study, 19 relevant variable indicators encompassing aspects of population, economy, and the agricultural situation from 2000 to 2020 in Tianjin were selected. Principal component analysis was employed to identify the main components, thereby eliminating secondary variables and data redundancy to enhance the scientific validity of the results. Based on this, a stepwise regression model was established to analyze the linear relationship between influencing factors and land-use changes.
For this analysis, 19 variables were chosen (Table 7), taking into account various demographic, economic, technological, and agricultural development drivers.
Table 7.
Variables driving land-use change in Tianjin.
Principal component analysis of impervious surfaces in Tianjin, along with 19 explanatory variables, revealed that the variables significantly impacting impervious surfaces were the output value of secondary industries and forestry. The regression equation representing the change in impervious-surface area in Tianjin is as follows:
where Yimpervious is the area of impervious surfaces (km2), X6 is the output values for secondary industries (CNY billion), and X9 is forestry (CNY billion).
The regression model for the change in impervious surfaces in Tianjin, with an R2 value of 0.99, demonstrated a significant positive correlation following stepwise regression, validating the effectiveness of the regression equation. The increase in the output value of secondary industries and forestry positively influences the expansion of impervious surfaces in Tianjin. This rise in output value reflects an overall improvement in Tianjin’s economic conditions, leading to a heightened demand for urban construction. This increased demand subsequently results in a rise in supply, culminating in an expansion of impervious surfaces.
Upon substituting the 2020 data (X6 = 4911.77 and X9 = 15.73) into the model, the result, Y = 4073.5085, aligns closely with the recorded impervious surfaces of 4069.1628 km2 in 2020. The deviation is merely 0.1077%, indicating a high reliability of this regression equation.
4.6. Simulation Prediction of Land-Cover Types in Tianjin City
4.6.1. Simulation of Land-Cover Change in Tianjin in 2021
In this study, utilizing the CA–Markov model, the land-use data for Tianjin from the years 2011 and 2016 were employed as baseline maps. These were combined with a suitability atlas for prediction purposes, and the number of metric iterations was set at 10 to generate the simulated land-use map for 2021. An accuracy test was then conducted to compare the predicted land-use results with the actual land-use data of 2021. The results revealed a kappa coefficient as high as 0.89, indicating a high level of consistency between the simulated land-use outcomes for Tianjin in 2021 and the actual land use. This demonstrates that the prediction results are sufficiently reliable for use in subsequent forecasts.
4.6.2. Forecast of Tianjin Land-Cover Pattern in 2025
This study employs the CA–Markov model to derive the land-cover-type map (Figure 9) and to quantify the land-use area and proportion of each category within the study area for the year 2025 (Table 8). Spatially, in Tianjin, impervious surfaces are mainly concentrated in six central districts (Heping, Hedong, Hexi, Nankai, Hebei, and Hongqiao) and the Binhai New Area. In contrast, cropland is predominantly found in the four districts surrounding the Ring Road (Dongli, Jinnan, Xiqing, and Beichen), as well as in the Jinghai, Wuqing, Baodi, Ninghe, and Jizhou districts. Grassland is primarily concentrated in Tianjin’s northern area. As indicated in Table 8, the most extensive land-use types in Tianjin are cropland and impervious surfaces, accounting for 48.4% and 39.9%, respectively.
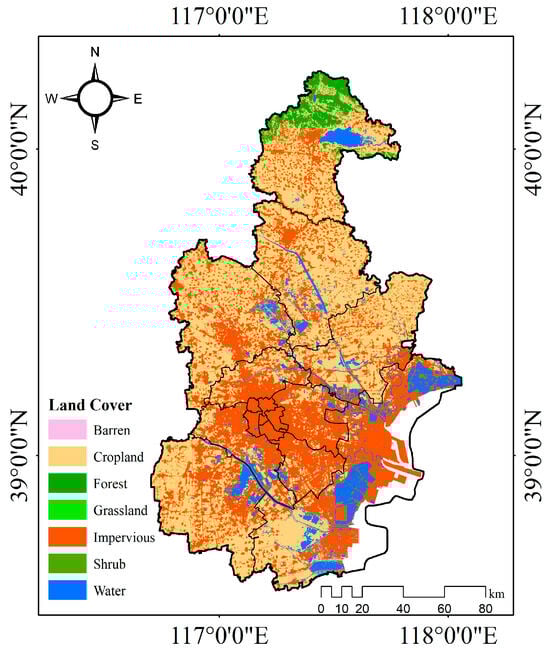
Figure 9.
Predicted Tianjin land-cover-type map (2025).
Table 8.
Land use and mobility in Tianjin, 2025.
5. Discussion
5.1. Development Trend for Impervious Surfaces in Tianjin
The LUCC maps of Tianjin for the years 2000, 2005, 2010, 2015, and 2020 demonstrate a steady increase in the impervious-surface cover of the region, growing from 2522.427 km2 to 4069.163 km2. Over the past 20 years, Tianjin’s impervious-surface cover expanded by 1546.74 km2 (Figure 4). Spatially, as depicted in the land-use distribution map for Tianjin (Figure 3), impervious surfaces in 2000 were primarily concentrated in six districts (Heping, Hexi, Nankai, Hedong, Hebei, and Hongqiao) and a portion of the Binhai New Area. By 2005, this expansion had extended into the city’s port and coastal areas. The impervious-surface cover further increased in 2010 and 2015, incorporating developments in the four surrounding districts. By 2020, the impervious-surface cover of the six central districts and the Binhai New Area had merged, with rapid growth particularly noted in the peripheral districts (Dongli, Jinnan, Xiqing, and Beichen). The development of the Binhai New Area in Tianjin from 2000 to 2020 has been aligned with the objective of establishing a model area comparable to the Pudong New Area and the Xiongan New Area. However, to meet the developmental needs of the Binhai New Area and address the increased demand for impervious surfaces in Tianjin, cropland and a portion of Bohai Bay water have been repurposed for impervious-surface development. This strategic approach is consistent with Tianjin’s economic development requirements during this period.
The analysis indicates that the Binhai New Area, a sub-center of Tianjin, has developed alongside the expansion of the port area. The Ninth Plenary Session of the 11th Municipal Party Committee emphasized the goal of creating a dual-city development pattern in ‘Jincheng’ and ‘Bincheng’, integrating this into Tianjin’s future economic and social development objectives. The Binhai New Area, covering 2270 km2, is envisioned to develop and connect with the central urban area, forming a large urban zone. This development pattern drives multiple districts, shaping Tianjin’s urban landscape. Additionally, the shallowness of Bohai Bay and the annual sediment influx from rivers result in the coastline expanding oceanward each year. The demand for deep-water ports in the Bohai Sea’s coastal areas has led to significant land reclamation in Bohai Bay. This strategy not only supports Tianjin’s construction and developmental needs but also mitigates the issue of extensive arable land being covered by impervious surfaces.
5.2. Simulation of Land-Cover Change in Tianjin
Utilizing the CA–Markov model, the projected land-use-type map for the study area in 2025 (Figure 9) and the corresponding land-use area and proportions of different categories (Table 8) indicate that the construction-land area in Tianjin is set to increase further. Conversely, the cultivated-land area is on a declining trend, gradually transforming into construction land. These changes are predominantly expected to occur in the southeast of Tianjin city. This trend aligns with Tianjin’s status as a major port city in northern China, where the expansion and strengthening of the port, along with the high-quality development of its port economy, are pivotal. Modern port construction in Tianjin necessitates enhancements in port facility platforms, industry support, spatial layout, and business environment.
While the CA–Markov model employed in this study offers unique advantages, its limitations cannot be overlooked. In simulating LUCC using the CA model, both short-term and long-term data are reliant on actual data from 2005 and 2015. The past 20 years have been a period of rapid urbanization and development in Tianjin. However, every developmental phase has its limitations, and such high-efficiency changes are unlikely to continue indefinitely. Nevertheless, the CA–Markov model remains one of the most effective methods for simulating LUCC. Its predictive results are vital for formulating land-use and urban development policies in Tianjin. The results of this study can provide valuable references for land use, policy analysis, and policy formulation in Tianjin.
5.3. Analysis of the Influencing Factors of Land Cover
The land-cover change in Tianjin can be observed through remote sensing data, which reflects our land category information. Additionally, the accuracy of the simulation model has been verified to meet the required standards. However, it is crucial to acknowledge that both natural and anthropogenic factors significantly influence land-cover dynamics. Therefore, further investigation using additional data is warranted to explore underlying causes.
In terms of its natural factors, the northern part of Tianjin is predominantly mountainous. As per national regulations, land with a slope greater than 25° cannot be converted into cropland. Moreover, due to Tianjin’s predominantly flat terrain and in consideration of practical circumstances, it is unsuitable for converting land into forests or bodies of water. The eastern region of Tianjin, which borders the Bohai Sea and encompasses the Binhai New Area—a key development zone—is more suitable for impervious surfaces and water features. These factors contribute to the spatial distribution pattern of land cover in Tianjin, characterized by a higher proportion of impervious surfaces and cropland in its central and western parts, and an increased presence of forests in the north, as well as a larger extent of impervious surfaces and bodies of water in the east.
In terms of anthropogenic factors, the land-cover changes in the region are primarily influenced by state policies and regional development plans. The 19 selected influencing factors were sourced from the Tianjin Statistical Yearbook. The results obtained from principal component analysis indicate a significant correlation between impervious surfaces and secondary industries, as well as forestry. Given Tianjin’s modern industrial background, it is reasonable to assume that industry plays a substantial role in its annual economic gain, with the Binhai New Area actively promoting industrial development alongside scientific and technological high-tech enterprises. Furthermore, considering national environmental policy objectives, it is also logical for Jinghai District in southwest Tianjin to prioritize protective forest construction.
5.4. Limitations and Expectations of This Research
This study selected 19 relevant variable indicators in Tianjin from 2000 to 2020, encompassing aspects like population, economy, and agricultural conditions. Principal component analysis was employed to extract the main components and establish the impact relationships of explanatory variables on construction land. However, the range and correlation of the chosen variables in this article are somewhat limited. In the conclusions drawn, the output values for secondary industries and forestry hold significant importance.
Furthermore, the CA–Markov method used in this study predicts Tianjin’s land cover in 2025 but does not foresee future expansion of land reclamation along the Bohai Sea coast. Additionally, in creating suitability atlases, there is room for more detailed planning in the selection of influencing factors for each land type. Factors that are difficult to quantify, such as human influences, policy factors (like the rural revitalization strategy and the three-child policy), and farmland protection policies, have not been incorporated. Therefore, future work should consider the impacts of these elements on land change and predictions in Tianjin.
The CA–Markov method was employed in this study to predict land cover in Tianjin, and the methodology utilized is applicable for land analysis and prediction at the city level. In future research we recommend expanding the scope of investigation to include the provincial and national levels. It should be noted that economic factors were not considered in predicting future land cover in Tianjin; thus, the predicted results pertain solely to natural land cover. To enhance accuracy, future research could incorporate multiple factors into the prediction process.
6. Conclusions
In this study, five-phase remote sensing images of Tianjin from 2000 to 2020 were selected and analyzed in conjunction with current land-cover data and statistical information. This approach determined the mobility rates of various land types and allowed the construction of a transfer matrix to ascertain the interrelationships among them. The center-of-gravity migration model was employed to analyze the shifts in the urban center of gravity of Tianjin. Principal component analysis identified three main types of driving factors for land-cover change: socio-economic development, population growth, and agricultural inputs. The impact of these factors on land cover was then analyzed. Finally, the CA–Markov coupling model was utilized to predict the dynamic changes in land cover that might occur in Tianjin by 2025.
The main conclusions of this study are as follows. (1) In Tianjin, the areas of different land-cover types, in descending order, are cropland, impervious surfaces, water, forest, grassland, barren land, and shrubland. From 2000 to 2020, cropland areas exhibited a decreasing trend (from 7503.31 km2 to 6293.70 km2), while impervious-surface areas showed an increasing trend (from 2522.43 km2 to 4069.16 km2). (2) The center of gravity for the city of Tianjin is in the Beichen district, and the migration of the center of gravity for impervious-surface areas indicates a northwestward shift, totaling 4.20 km at a rate of 0.84 km/year. (3) Principal component analysis of impervious surfaces in Tianjin and 19 explanatory variables indicates that the output value for secondary industries and the forestry output value significantly influence Tianjin’s impervious-surface areas. (4) Utilizing the CA–Markov model, the study obtained the land-cover-type maps and the land cover and proportions of each category in the study area for 2025. It was found that the largest proportions in Tianjin are cropland (48.4%) and impervious surfaces (39.9%). The findings of this study offer valuable insights that can assist with land-cover planning, policy analysis, and policy formulation in Tianjin.
Author Contributions
Conceptualization, Z.Z. and Y.W.; methodology, Z.Z. and Y.W.; validation, Z.Z. and Y.W.; formal analysis, X.L.; investigation, Y.W., D.W. and Z.S.; data curation, Z.Z., Y.W. and X.L.; writing—original draft preparation, Z.Z.; writing—review and editing, Z.Z.; funding acquisition, Z.S. and D.W. All authors have read and agreed to the published version of the manuscript.
Funding
This research was funded by Hebei Provincial Department of Science and Technology (23373301D) and Key R&D Program of Shandong Province (2022CXGC020416).
Data Availability Statement
The remote sensing data are available from http://doi.org/10.5281/zenodo.4417809. The statistical data can be obtained from https://data.stats.gov.cn/ (accessed on 1 January 2024).
Conflicts of Interest
The authors declare no conflicts of interest.
References
- Green, K.; Kempka, D.; Lackey, L. Using Remote Sensing to Detect and Monitor Land-Cover and Land-Use Change. Photogramm. Eng. Remote Sens. 1994, 60, 331–337. [Google Scholar]
- Rogan, J.; Chen, D. Remote sensing technology for mapping and monitoring land-cover and land-use change. Prog. Plan. 2004, 61, 301–325. [Google Scholar] [CrossRef]
- Kerr, J.T.; Ostrovsky, M. From space to species: Ecological applications for remote sensing. Trends Ecol. Evol. 2003, 18, 299–305. [Google Scholar] [CrossRef]
- Pielke, R.A., Sr. Atmospheric science. Land use and climate change. Science 2005, 310, 1625–1626. [Google Scholar] [PubMed]
- Zhang, M.; Zhang, C.; Kafy, A.-A.; Tan, S. Simulating the Relationship between Land Use/Cover Change and Urban Thermal Environment Using Machine Learning Algorithms in Wuhan City, China. Land 2021, 11, 14. [Google Scholar] [CrossRef]
- Dang, A.N.; Kawasaki, A. Integrating biophysical and socio-economic factors for land-use and land-cover change projection in agricultural economic regions. Ecol. Model. 2017, 344, 29–37. [Google Scholar] [CrossRef]
- MohanRajan, S.N.; Loganathan, A.; Manoharan, P. Survey on Land Use/Land Cover (LU/LC) change analysis in remote sensing and GIS environment: Techniques and Challenges. Environ. Sci. Pollut. Res. 2020, 27, 29900–29926. [Google Scholar] [CrossRef] [PubMed]
- Yin, J.; Dong, J.; Hamm, N.A.; Li, Z.; Wang, J.; Xing, H.; Fu, P. Integrating remote sensing and geospatial big data for urban land use mapping: A review. Int. J. Appl. Earth Obs. Geoinf. 2021, 103, 102514. [Google Scholar] [CrossRef]
- Alqurashi, A.; Kumar, L. Investigating the Use of Remote Sensing and GIS Techniques to Detect Land Use and Land Cover Change: A Review. Adv. Remote Sens. 2013, 2, 193–204. [Google Scholar] [CrossRef]
- Alem, A.; Kumar, S. Deep Learning Methods for Land Cover and Land Use Classification in Remote Sensing: A Review. In Proceedings of the 2020 8th International Conference on Reliability, Infocom Technologies and Optimization (Trends and Future Directions) (ICRITO), Noida, India, 4–5 June 2020; pp. 903–908. [Google Scholar]
- Karra, K.; Kontgis, C.; Statman-Weil, Z.; Mazzariello, J.C.; Mathis, M.; Brumby, S.P. Global land use/land cover with Sentinel 2 and deep learning. In Proceedings of the 2021 IEEE International Geoscience and Remote Sensing Symposium IGARSS, Brussels, Belgium, 11–16 July 2021; pp. 4704–4707. [Google Scholar]
- Turner, B.; Moss, R.H.; Skole, D.L. Relating Land Use and Global Land-Cover Change: A Proposal for an IGBP-HDP Core Project; International Geosphere-Biosphere Programme: Stockholm, Sweden, 1993. [Google Scholar]
- Xu, Q.; Zhu, A.X.; Liu, J. Land-use change modeling with cellular automata using land natural evolution unit. Catena 2023, 224, 106998. [Google Scholar] [CrossRef]
- Xu, H.; Liu, B.; Fang, Z. New grey prediction model and its application in forecasting land subsidence in coal mine. Nat. Hazards 2013, 71, 1181–1194. [Google Scholar] [CrossRef]
- Shen, Q.; Chen, Q.; Tang, B.-S.; Yeung, S.; Hu, Y.; Cheung, G. A system dynamics model for the sustainable land use planning and development. Habitat Int. 2009, 33, 15–25. [Google Scholar] [CrossRef]
- Huang, Y.; Nian, P.; Zhang, W. The prediction of interregional land use differences in Beijing: A Markov model. Environ. Earth Sci. 2014, 73, 4077–4090. [Google Scholar] [CrossRef]
- Xu, D.; Zhang, K.; Cao, L.; Guan, X.; Zhang, H. Driving forces and prediction of urban land use change based on the geodetector and CA-Markov model: A case study of Zhengzhou, China. Int. J. Digit. Earth 2022, 15, 2246–2267. [Google Scholar] [CrossRef]
- Rodriguez-Galiano, V.F.; Ghimire, B.; Rogan, J.; Chica-Olmo, M.; Rigol-Sanchez, J.P. An assessment of the effectiveness of a random forest classifier for land-cover classification. ISPRS J. Photogramm. Remote Sens. 2012, 67, 93–104. [Google Scholar] [CrossRef]
- Huang, Y.; Yang, B.; Wang, M.; Liu, B.; Yang, X. Analysis of the future land cover change in Beijing using CA–Markov chain model. Environ. Earth Sci. 2020, 79, 60. [Google Scholar] [CrossRef]
- Tariq, A.; Yan, J.; Mumtaz, F. Land change modeler and CA-Markov chain analysis for land use land cover change using satellite data of Peshawar, Pakistan. Phys. Chem. Earth Parts A/B/C 2022, 128, 103286. [Google Scholar] [CrossRef]
- Haghighi, N.; Azhand, D.; Ostad-Ali-Askari, K.; Eslamian, S.; Singh, V.P. Land Use Change Detection and Prediction Using Markov-CA and Publishing on the Web with Platform Map Server, Case Study: Qom Metropolis, Iran. J. Geogr. Cartogr. 2019, 4, 7–20. [Google Scholar]
- He, J.; Huang, J.; Li, C. The evaluation for the impact of land use change on habitat quality: A joint contribution of cellular automata scenario simulation and habitat quality assessment model. Ecol. Model. 2017, 366, 58–67. [Google Scholar] [CrossRef]
- Yang, C.; Zhai, H.; Fu, M.; Zheng, Q.; Fan, D. Multi-Scenario Simulation of Land System Change in the Guangdong–Hong Kong–Macao Greater Bay Area Based on a Cellular Automata–Markov Model. Remote Sens. 2024, 16, 1512. [Google Scholar] [CrossRef]
- Zhang, Z.; Hörmann, G.; Huang, J.; Fohrer, N. A Random Forest-Based CA-Markov Model to Examine the Dynamics of Land Use/Cover Change Aided with Remote Sensing and GIS. Remote Sens. 2023, 15, 2128. [Google Scholar] [CrossRef]
- Avand, M.; Moradi, H. Using machine learning models, remote sensing, and GIS to investigate the effects of changing climates and land uses on flood. J. Hydrol. 2021, 595, 125663. [Google Scholar] [CrossRef]
- Verburg, P.H.; Neumann, K.; Nol, L. Challenges in using land use and land cover data for global change studies. Glob. Chang. Biol. 2011, 17, 974–989. [Google Scholar] [CrossRef]
- Tang, Q.; Wang, J.; Jing, Z.; Yan, Y.; Niu, H. Response of ecological vulnerability to land use change in a resource-based city, China. Resour. Policy 2021, 74, 102324. [Google Scholar] [CrossRef]
- Noszczyk, T. A review of approaches to land use changes modeling. Hum. Ecol. Risk Assess. Int. J. 2019, 25, 1377–1405. [Google Scholar] [CrossRef]
- Li, X.; Liu, Z.; Li, S.; Li, Y. Multi-Scenario Simulation Analysis of Land Use Impacts on Habitat Quality in Tianjin Based on the PLUS Model Coupled with the InVEST Model. Sustainability 2022, 14, 6923. [Google Scholar] [CrossRef]
- Yang, J.; Huang, X. The 30 m annual land cover dataset and its dynamics in China from 1990 to 2019. Earth Syst. Sci. Data 2021, 13, 3907–3925. [Google Scholar] [CrossRef]
- Comber, A.J.; Harris, P.; Tsutsumida, N. Improving land cover classification using input variables derived from a geographically weighted principal components analysis. ISPRS J. Photogramm. Remote Sens. 2016, 119, 347–360. [Google Scholar] [CrossRef]
- Parmentier, B. Characterization of Land Transitions Patterns from Multivariate Time Series Using Seasonal Trend Analysis and Principal Component Analysis. Remote Sens. 2014, 6, 12639–12665. [Google Scholar] [CrossRef]
- Gyamfi, C.; Ndambuki, J.M.; Salim, R.W. Simulation of Sediment Yield in a Semi-Arid River Basin under Changing Land Use: An Integrated Approach of Hydrologic Modelling and Principal Component Analysis. Sustainability 2016, 8, 1133. [Google Scholar] [CrossRef]
- Kumar, S.; Radhakrishnan, N.; Mathew, S. Land use change modelling using a Markov model and remote sensing. Geomat. Nat. Hazards Risk 2013, 5, 145–156. [Google Scholar] [CrossRef]
- Naboureh, A.; Moghaddam, M.H.R.; Feizizadeh, B.; Blaschke, T. An integrated object-based image analysis and CA-Markov model approach for modeling land use/land cover trends in the Sarab plain. Arab. J. Geosci. 2017, 10, 259. [Google Scholar] [CrossRef]
Disclaimer/Publisher’s Note: The statements, opinions and data contained in all publications are solely those of the individual author(s) and contributor(s) and not of MDPI and/or the editor(s). MDPI and/or the editor(s) disclaim responsibility for any injury to people or property resulting from any ideas, methods, instructions or products referred to in the content. |
© 2024 by the authors. Licensee MDPI, Basel, Switzerland. This article is an open access article distributed under the terms and conditions of the Creative Commons Attribution (CC BY) license (https://creativecommons.org/licenses/by/4.0/).