Abstract
Access and exposure to urban green space—the combination of parks and vegetative cover in cities—are associated with various health benefits. As urban green space is often unequally distributed throughout cities, understanding how it is allocated across socio-demographic populations can help city planners and policy makers identify and address urban environmental justice and health equity issues. To our knowledge, no studies have yet combined assessments of park quality, park availability, and green cover to inform equitable urban green space planning. To this end, we developed a comprehensive methodology to identify urban green space inequities at the city scale and applied it in Portland, OR, USA. After auditing all public parks in Portland and gathering green cover data from publicly accessible repositories, we used a suite of statistical tests to evaluate distribution of parks and green cover across Census block groups, comprising race, ethnicity, income, and educational attainment characteristics. Right-of-way tree canopy cover was the most significant urban green space inequity identified in bivariate analysis (rs = −0.73). Spatial autoregressive models identified that right-of-way, private, and overall tree canopy cover (Nagelkerke pseudo-R2 = 0.66, 0.77, and 0.67, respectively) significantly decreased with the proportion of minoritized racial population and increased with median income. The results were then used to identify priority locations for specific urban green space investments. This research establishes a process to assess intra-urban green space inequities, as well as identify data-informed and spatially explicit planning priorities to promote health equity and environmental justice.
1. Introduction
The enjoyment of the highest attainable standard of health is one of the fundamental rights of every human being without distinction of race, religion, political belief, economic or social condition.[1]
Urban areas are now home to a majority of the world’s population and are projected to continue increasing in proportion to the global population through at least 2050 [2]. Understanding how urban landscapes affect human health is imperative to effective public policy and land use planning. Urban environments have been linked to serious public health concerns, such as increased air pollution concentrations [3], extreme heat [4,5], poor mental health outcomes [6,7,8], and physical inactivity [9,10], all of which are risk factors for premature mortality [11,12,13,14]. Yet, urban green spaces (i.e., park amenities and vegetation cover across all land uses in cities) can mitigate these issues by providing numerous ecosystem services, including temperature regulation [15,16,17], flood mitigation [18,19], air pollution reduction [20,21], mental health benefits [7,22,23], and opportunities for physical activity [24]. As such, the design, planning, and distribution of urban green spaces are important public health considerations.
Revelations regarding the health benefits of urban green space coincided with an expansion of the environmental justice discourse to include equity assessments of environmental benefits in addition to environmental burdens [25,26,27,28,29,30]. Studies investigating urban green space distributional justice (i.e., the equitable distribution of environmental benefits in cities) have focused predominantly on equity assessments of green cover (i.e., tree canopy and all other vegetation cover), park availability (i.e., number of parks and park area), and park quality.
The distribution of urban green space, as well as the localized benefits provided, varies from city to city. It is important to note that because our selected case study is the City of Portland, Oregon, USA, our literature review focuses almost exclusively on North America. Therefore, the discussion of distributional green space justice should be considered within that socioeconomic context. Recent meta-analyses of the urban forest equity literature identified significant inequities in urban tree canopy cover based on both race and income, though the association with income was nearly twice as strong as the association with race [31,32]. In urban areas across the states of Oregon and Washington, USA, tree canopy cover increased with median household income [33]. From 2014 to 2020, lower income communities, as well as communities with greater non-white population densities, experienced significant decreases in tree canopy cover compared to whiter and wealthier communities in Portland, Oregon, USA [34]. In Wisconsin, USA, individuals in the lowest income bracket—those making less than $20,000 per year—had the highest likelihood of living in neighborhoods with less than 10% tree canopy cover [35]. In Montreal, Canada, neighborhoods with greater low-income and minoritized racial populations had significantly less tree canopy cover overall, as well as along rights-of-way [36]. These findings present clear evidence of disparities in tree canopy cover across various land uses based on race and income.
Although park equity studies have yielded mixed results, there are consistent patterns of race-, ethnicity-, and income-based disparities in park availability and park quality [37,38]. An urban park equity literature review found that non-Hispanic/Latino/a/x (hereafter referred to as “Latinx”) white people had the greatest park access, determined by number of parks and park area, in eighteen of twenty papers examined [29]. Furthermore, all national-scale studies in the United States found that people of color in lower-income brackets had access to fewer parks and less total park area than white and higher income demographics [29]. Though park inequities have been identified consistently, inter-urban park access variability demonstrates the importance of considering park access equity for each city independently.
Distributional justice assessments have also considered various aspects of park quality, as they may influence park use and physical activity [39,40]. Park quality assessments have found that more affluent communities, and those with higher proportions of non-Latinx white residents, frequently have access to better quality parks than communities with higher proportions of people with low-incomes and people of color [29]. Additionally, Rigolon’s review of park quality literature identified several common inequalities, including park safety, park maintenance, and diversity of park amenities (e.g., trails and playgrounds) [29]. These factors may all influence park perception, park usage, and park-based physical activity with the potential to exacerbate existing race- and income-based health disparities [41].
Numerous studies have investigated equity concerns related to urban green cover, park availability, or park quality. Such work has led to the concept of urban green space equity and calls for the development of standards or rules, recently including the 3-30-300 rule [42,43,44]. While there is still some debate as to the exact definition of urban green space equity, for this paper we define it as a measure of the equitable distribution of urban green space among different spatial units, income levels, racial groups, and marginalized populations [43,45,46]. To our knowledge, few have sought to include park and green cover assessments into a unified methodology to assess urban green space equity; see [47]. Additionally, while numerous city- and national-scale assessments have consistently found evidence of urban green space inequities, they stop short of providing data-informed, spatially explicit recommendations for addressing existing disparities. To address these gaps, we propose a multi-step process to identify green space equity planning priorities at the city scale:
- Conduct comprehensive data collection of park quality, park availability, and green cover.
- Identify urban green space access and exposure inequities specific to marginalized communities.
- Develop data-informed recommendations for urban green space planning priorities.
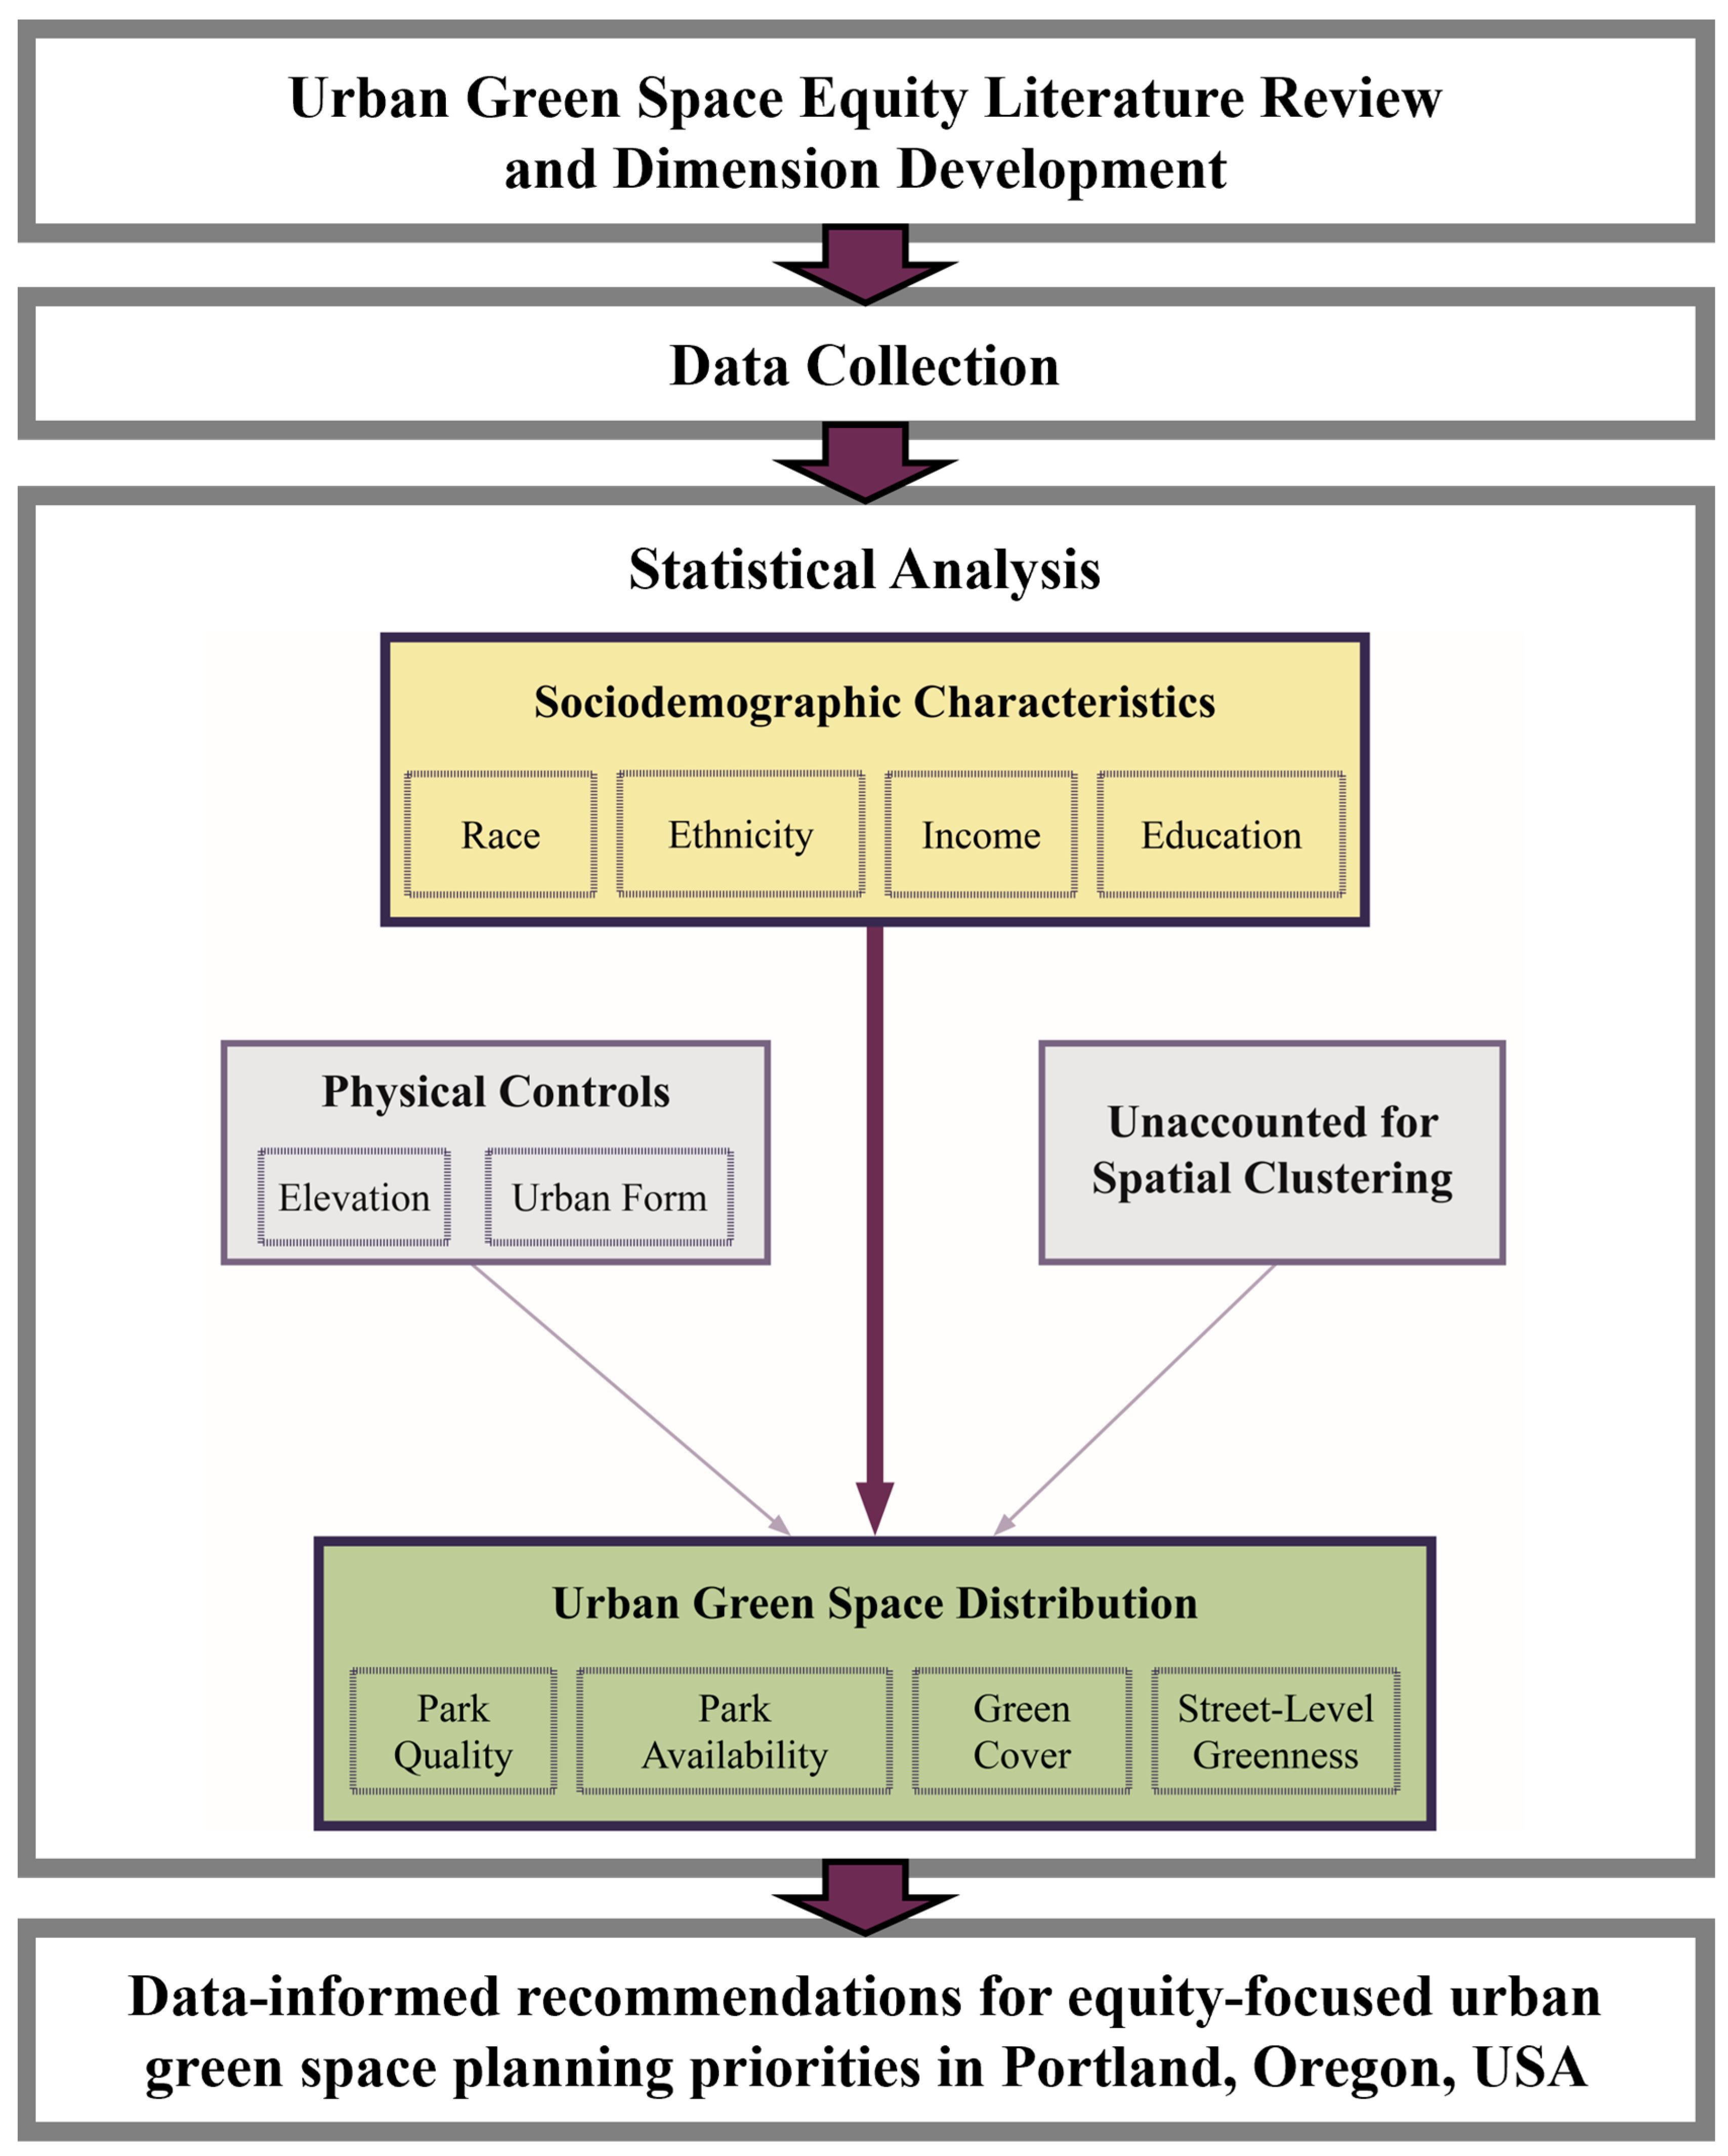
In this study, we developed a methodology for identifying specific urban green space distributional justice concerns based on socio-demographic characteristics (i.e., race, ethnicity, income, and education) while controlling for landscape variables and spatial clustering (Figure 1). We then implemented this methodology to inform equity-focused urban green space planning priorities in Portland, Oregon, USA.
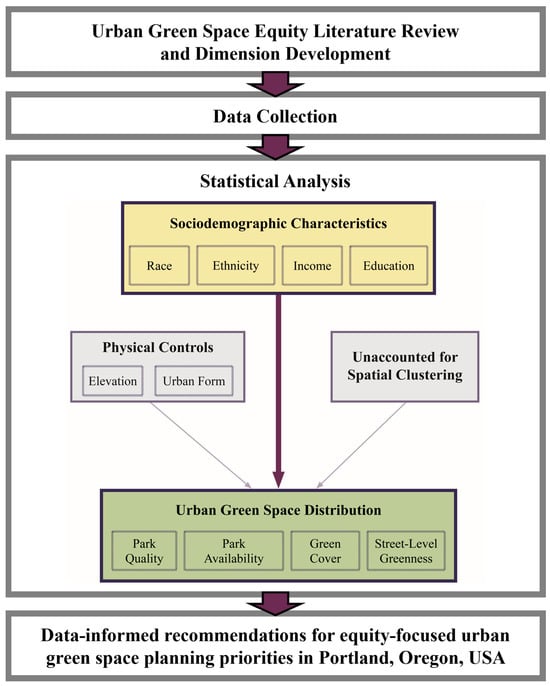
Figure 1.
Schematic diagram depicting the methodology used to identify systemic inequities in urban green space access and develop data-informed urban green space equity planning priorities.
2. Materials and Methods
2.1. Site Context
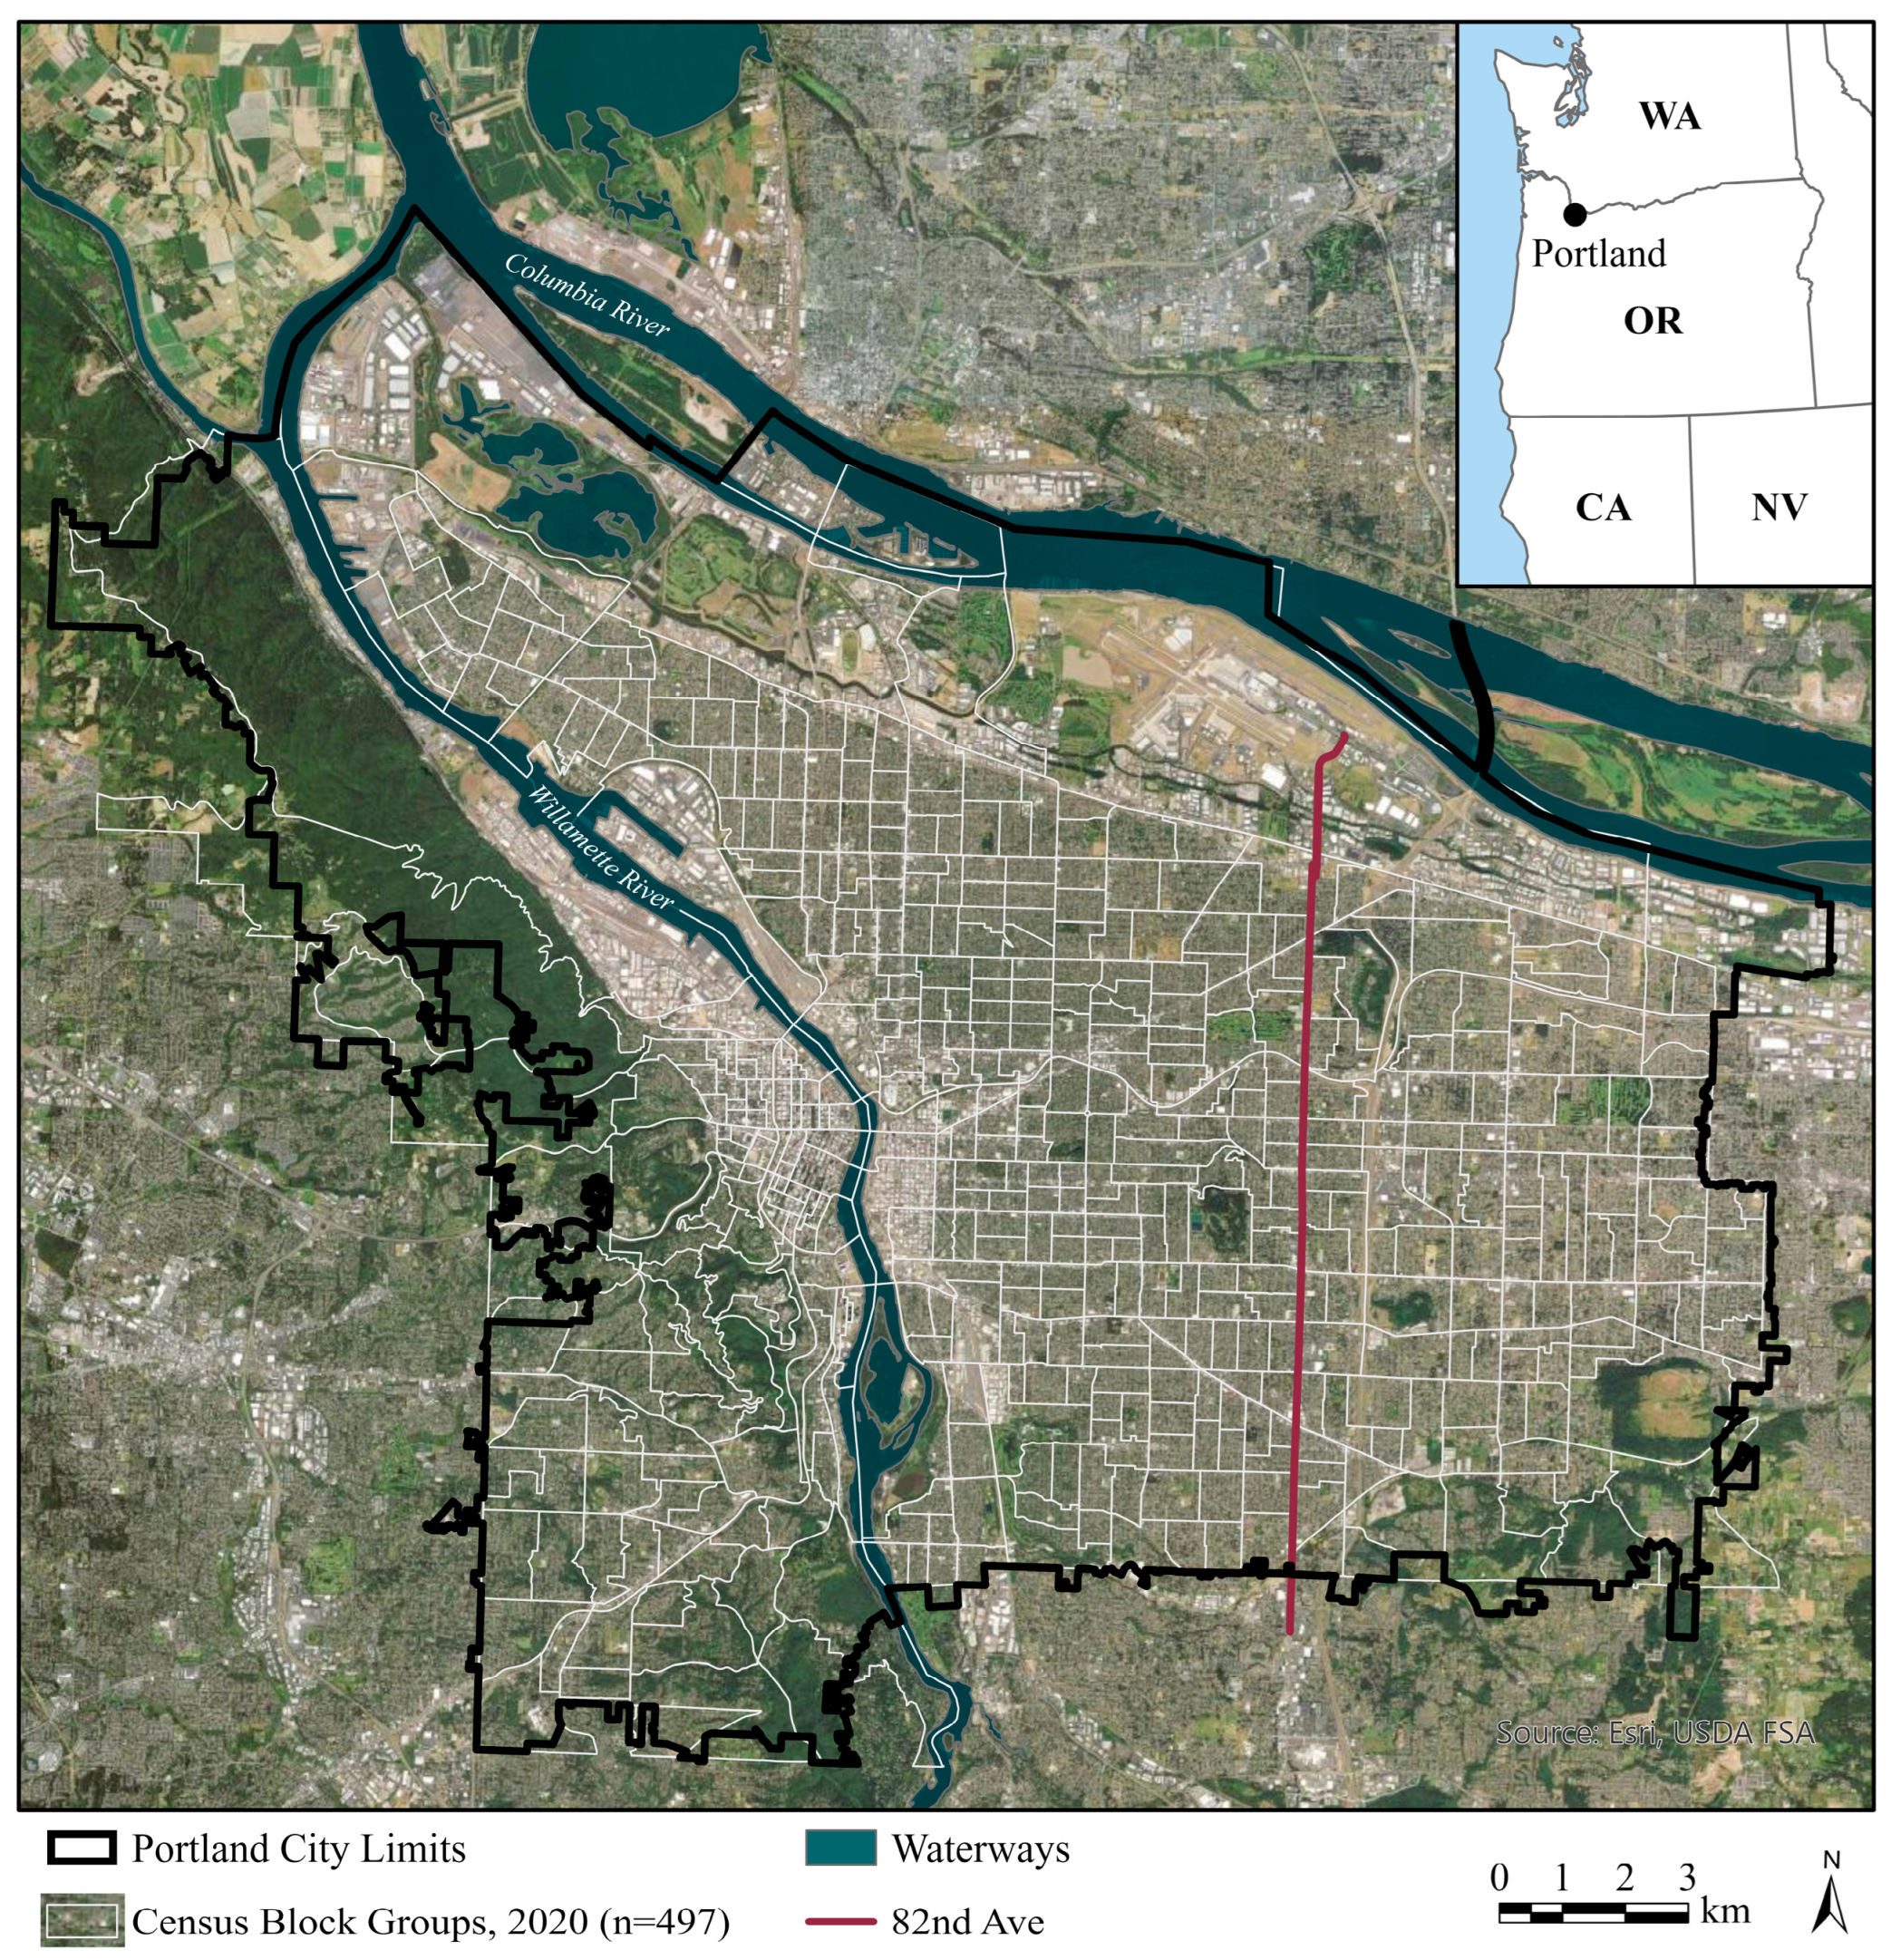
This study was conducted during 2021 in Portland (Figure 2). The City of Portland has demonstrated a dedication to equitable and inclusive urban forest planning, as illustrated by its racial equity plan for parks (2017) and its equity-focused tree planting strategy (2018) [48,49]. As of 2021, the city of Portland had a predominantly white population (75.3% identifying as “white alone”) with 9.8% Latinx, 8.7% Asian, 5.9% Black/African American, 0.8% American Indian and Alaska Native, and 0.7% Native Hawaiian and other Pacific Islander populations [50]. Between 2000 and 2015, Portland’s citywide tree canopy cover increased from 27.3% (10,258 hectares) to 30.7% (11,517 hectares) but decreased to 29.8% by 2022 [51]. Tree canopy cover has not been evenly distributed throughout Portland with over 50% of the city’s tree canopy cover concentrated west of the Willamette River, which comprises less than 30% of the city’s total land area [52]. In this study, we used the Willamette River and 82nd Avenue as useful lines of demarcation for describing demographic and green space clustering (Figure 2).
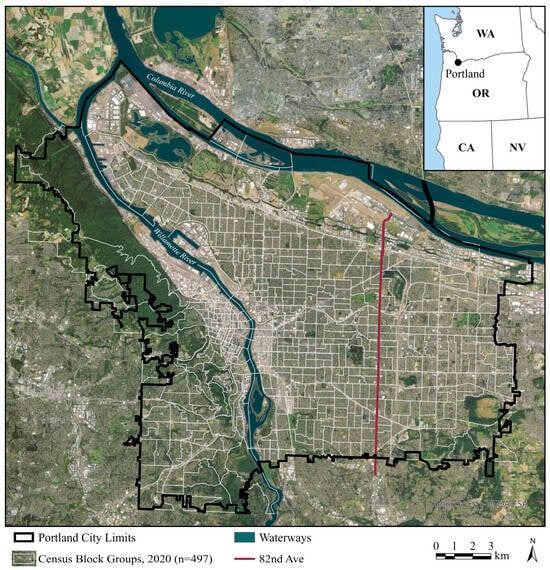
Figure 2.
Context map of Portland, Oregon, USA, depicting city limits and Census block group boundaries.
2.2. Sociodemographic Variables
We selected a suite of socio-demographic characteristics similar to those used in previous urban green space distributional justice studies, including variables that account for population-level race, ethnicity, income, and education [29,31,37,47,53,54,55]. Race data were obtained from 2020 Census redistricting data [56]. Income, ethnicity, and education data were taken from 2016–2020 American Community Survey 5-year estimates [57,58,59]. As no minoritized racial group accounted for more than 10% of Portland’s population, race data were used to identify the percent of each block group’s population that did not identify as “white alone” (i.e., Black or African American, American Indian and Alaska Native, Asian, Native Hawaiian and other Pacific Islander, some other race, or multiracial). Income was defined as block group median household income, and ethnicity was defined as the percent of block group population that identified as “Hispanic, Latinx, or Spanish origin”. Educational attainment data were used to identify the percent of block group population, ages 25 and older, with no postsecondary education.
Sociodemographic data were analyzed using 2020 Census block group redistricting geometry, the finest spatial resolution for aggregated socio-demographic Census data [60]. Block groups were selected for analysis if their centroids were located inside Portland’s city limits (n = 497; Figure 2).
2.3. Green Space Variables
We collected a broad suite of urban green space metrics to assess park quality, park availability, and green cover. No consensus has been reached among researchers regarding appropriate distance or geographic units when assessing urban green space access [61], and we chose to adopt several commonly used distances [29,62,63,64,65]. We collected green space data using block group geometry, as well as within 400 and 800 m of block group boundaries (see Figures S4–S6), because these distances account for the range of most common walking trip times and distances [66].
Park quality and park availability were measured based on data from a comprehensive park audit. The first author visited every park, natural area, cemetery, golf course, and public schoolyard (hereafter referred to collectively as “parks”) within Portland’s city limits [67,68,69] and audited all parks that were publicly accessible and did not require payment to enter (n = 406; Figures S1 and S2). The Natural Environment Scoring Tool (NEST), a 47-item questionnaire, was used to obtain an overall park quality score for each park [70]. Additionally, seven NEST domains (i.e., accessibility, amenities, incivilities/safety, natural and non-natural aesthetics, recreation facilities, and usability) were scored for each park (for more information on the specific dimensions of the NEST domains, see Gidlow et al., 2018 [70]). Park quality (i.e., average NEST overall and domain scores), park area, and the number of parks were calculated based on the parks within each block group and for all parks within a 400 and 800 m road network walking distance from each block group boundary (Table 1, Figure S3). Additionally, we measured the percentage of each block group area within a 400 and 800 m road distance of a park [71].
Green cover variables were measured within each Census block group and within a 400 and 800 m Euclidean distance of each Census block group boundary (Table 1; Figures S4 and S5). Green cover variables were calculated using one-meter resolution urban land cover data from the United States’ Environmental Protection Agency EnviroAtlas [72] and were categorized by vegetation type (i.e., tree canopy cover and all vegetation cover types) as well as land use type (i.e., right-of-way, parkland, private land, and all land uses). Additionally, the cumulative normalized difference vegetation index (NDVI), a validated measure used as a proxy for green cover, was calculated based on the ratio of red to near infrared light in high resolution multispectral imagery [73].
Finally, we sought to represent green cover similar to how it might be experienced when walking on the street (i.e., street-level greenness). To measure street-level greenness, we first created a network of points spaced 50 m apart along all roadways in Portland, excluding freeways, private roads, and unimproved roads. We generated 360° panoramas for every point by combining three Google Street View images (each with 120° horizontal and vertical fields of view), taken during leaf-on period (i.e., May-September) from 2007 to 2020 [74]. Finally, we calculated a modified Green View Index (GVI) for each panorama based on the ratio of green pixels to total pixels [75,76]. We calculated GVI at 49,362 locations along roadways within Portland’s city limits. Street-level greenness was measured as the average GVI within each Census block group boundary and for the areas extending between 400 and 800 m road walking distances surrounding each Census block group (Figure S6). GVI data were collected and processed using modified open-source Python code [77] with NumPy and PyMeanShift packages [78,79].

Table 1.
Urban green space metrics, measured for each Census block group in Portland, Oregon.
Table 1.
Urban green space metrics, measured for each Census block group in Portland, Oregon.
| Category | Variable | Data Source |
|---|---|---|
| Park Availability | Number of parks a | Oregon Recreation and Conservation Areas [67,68] |
| Park area (ha) a | Oregon Recreation and Conservation Areas [67,68] | |
| Park coverage (percent) | Oregon Recreation and Conservation Areas [67,68] | |
| Park Quality | Park quality score (Neighborhood Environment Scoring Tool domain and overall scores) a | Neighborhood Environment Scoring Tool [70]; Oregon Recreation and Conservation Areas [67,68] |
| Green Cover | Cumulative normalized difference vegetation index (NDVI) b | National Agriculture Imagery Program (NAIP) 2016 four-band aerial imagery [80] |
| Green cover—total, park, private, and right-of way (percent) b | United States’ Environmental Protection Agency EnviroAtlas [72] | |
| Tree canopy cover—total, park, private, and right-of way (percent) b | United States’ Environmental Protection Agency EnviroAtlas [72] | |
| Cumulative Green View Index (GVI) a | Google Street View Static API [74] |
a within block group, and within 400 and 800 m by rod network of block group perimeter. b within block group, and within 400 and 800 m Euclidean buffers of block group perimeter.
2.4. Confounding Environmental Variables
Because this study is inherently place-based, as opposed to a multi-city evaluation, it is important to consider local biophysical and urban form variables that may impact urban green space characteristics. As elevation has been identified as a potential confounding variable when looking at environmental justice implications of urban green space access/exposure [55,81], we calculated mean elevation for each block group from a 10 m resolution digital elevation model [82]. Other characteristics of urban form such as residential and commercial density, land use mix, and street characteristics have also been found to have significant relationships with vegetation cover [36,55,83]. As such, we developed an index to measure urban form, which we adapted from Frank et al. [9,84,85]. The urban form index was calculated for each block group by taking the sum of z-scores for residential density, street connectivity, land use mix, sidewalk-to-road-length ratio, and bike-infrastructure-to-road-length ratio (Table S1).
2.5. Statistical Analysis
Bivariate and multivariate statistical analyses were conducted to identify environmental justice concerns related to urban green space access and exposure in Portland, Oregon. Census block groups that did not contain median household income data (n = 25) or lacked complete green cover data coverage (n = 1) were removed from the dataset, leaving 471 block groups for analysis. Consistent with methods used by Schwarz et al. [86], we conducted Spearman’s rank correlation to identify nonparametric bivariate relationships between all green space and socio-demographic variables. We used Spearman’s rank correlation coefficient (rs) absolute values greater than 0.3 and 0.5 as thresholds for moderate and strong relationships, respectively [87].
Ordinary least squares (OLS) multiple regression was used to evaluate environmental justice concerns for each green space variable (i.e., response variable) in relation to race, ethnicity, income, and educational attainment (i.e., explanatory variables). Models were generated for each green space response variable with one socio-demographic variable and with every combination of two, three, and four socio-demographic variables. Mean elevation and urban form variables were included in each model as potential confounding variables. Models were excluded if (1) any socio-demographic variable was not significant (i.e., p > 0.05), (2) the model contained multicollinearity (variance inflation factor ≥ 2), or (3) any socio-demographic variable coefficient changed sign from its Spearman’s rank correlation coefficient. Response variables were transformed if OLS models did not satisfy the residual normality assumption (i.e., Kolmogorov–Smirnov p < 0.05) [88], and models were removed if the residual normality assumption could not be satisfied after transformation.
To ensure OLS estimated coefficients were not a product of systematic spatial variation, we measured spatial autocorrelation of model residuals for all models that met OLS modeling criteria, using Moran’s I for residual spatial autocorrelation [36,54,86,89]. Spatial autoregressive (SAR) models were generated for all OLS models with significant spatial autocorrelation of model residuals (i.e., Moran’s I p < 0.05). Two SAR models—the spatial error model and spatial lag model—were developed specifically to handle spatial autocorrelation of residuals in OLS models [89]. The spatial error model assumes that error terms are spatially correlated due to omitted factors, while the spatial lag model assumes that the response variable, as well as explanatory variables and error terms are all spatially correlated. Lagrange multiplier and robust Lagrange multiplier spatial dependence test statistics were calculated for OLS models that exhibited spatial autocorrelation of residuals, and the choice of model (i.e., spatial error or spatial lag) was based on which had more significant test statistics [36,54,90]. We constructed spatial weights for SAR models using queen contiguity-based weights, defining neighbors as those that share common edges and vertices [90]. Spatial autoregressive models were excluded if residuals exhibited spatial autocorrelation (i.e., Global Moran’s I p < 0.05) or if neither socio-demographic variable was significant. All statistical analyses were conducted in R [91], and spatial statistics were generated using “spdep” and “sf” packages [92,93].
2.6. Identifying Priority Block Groups for Urban Green Space Planning
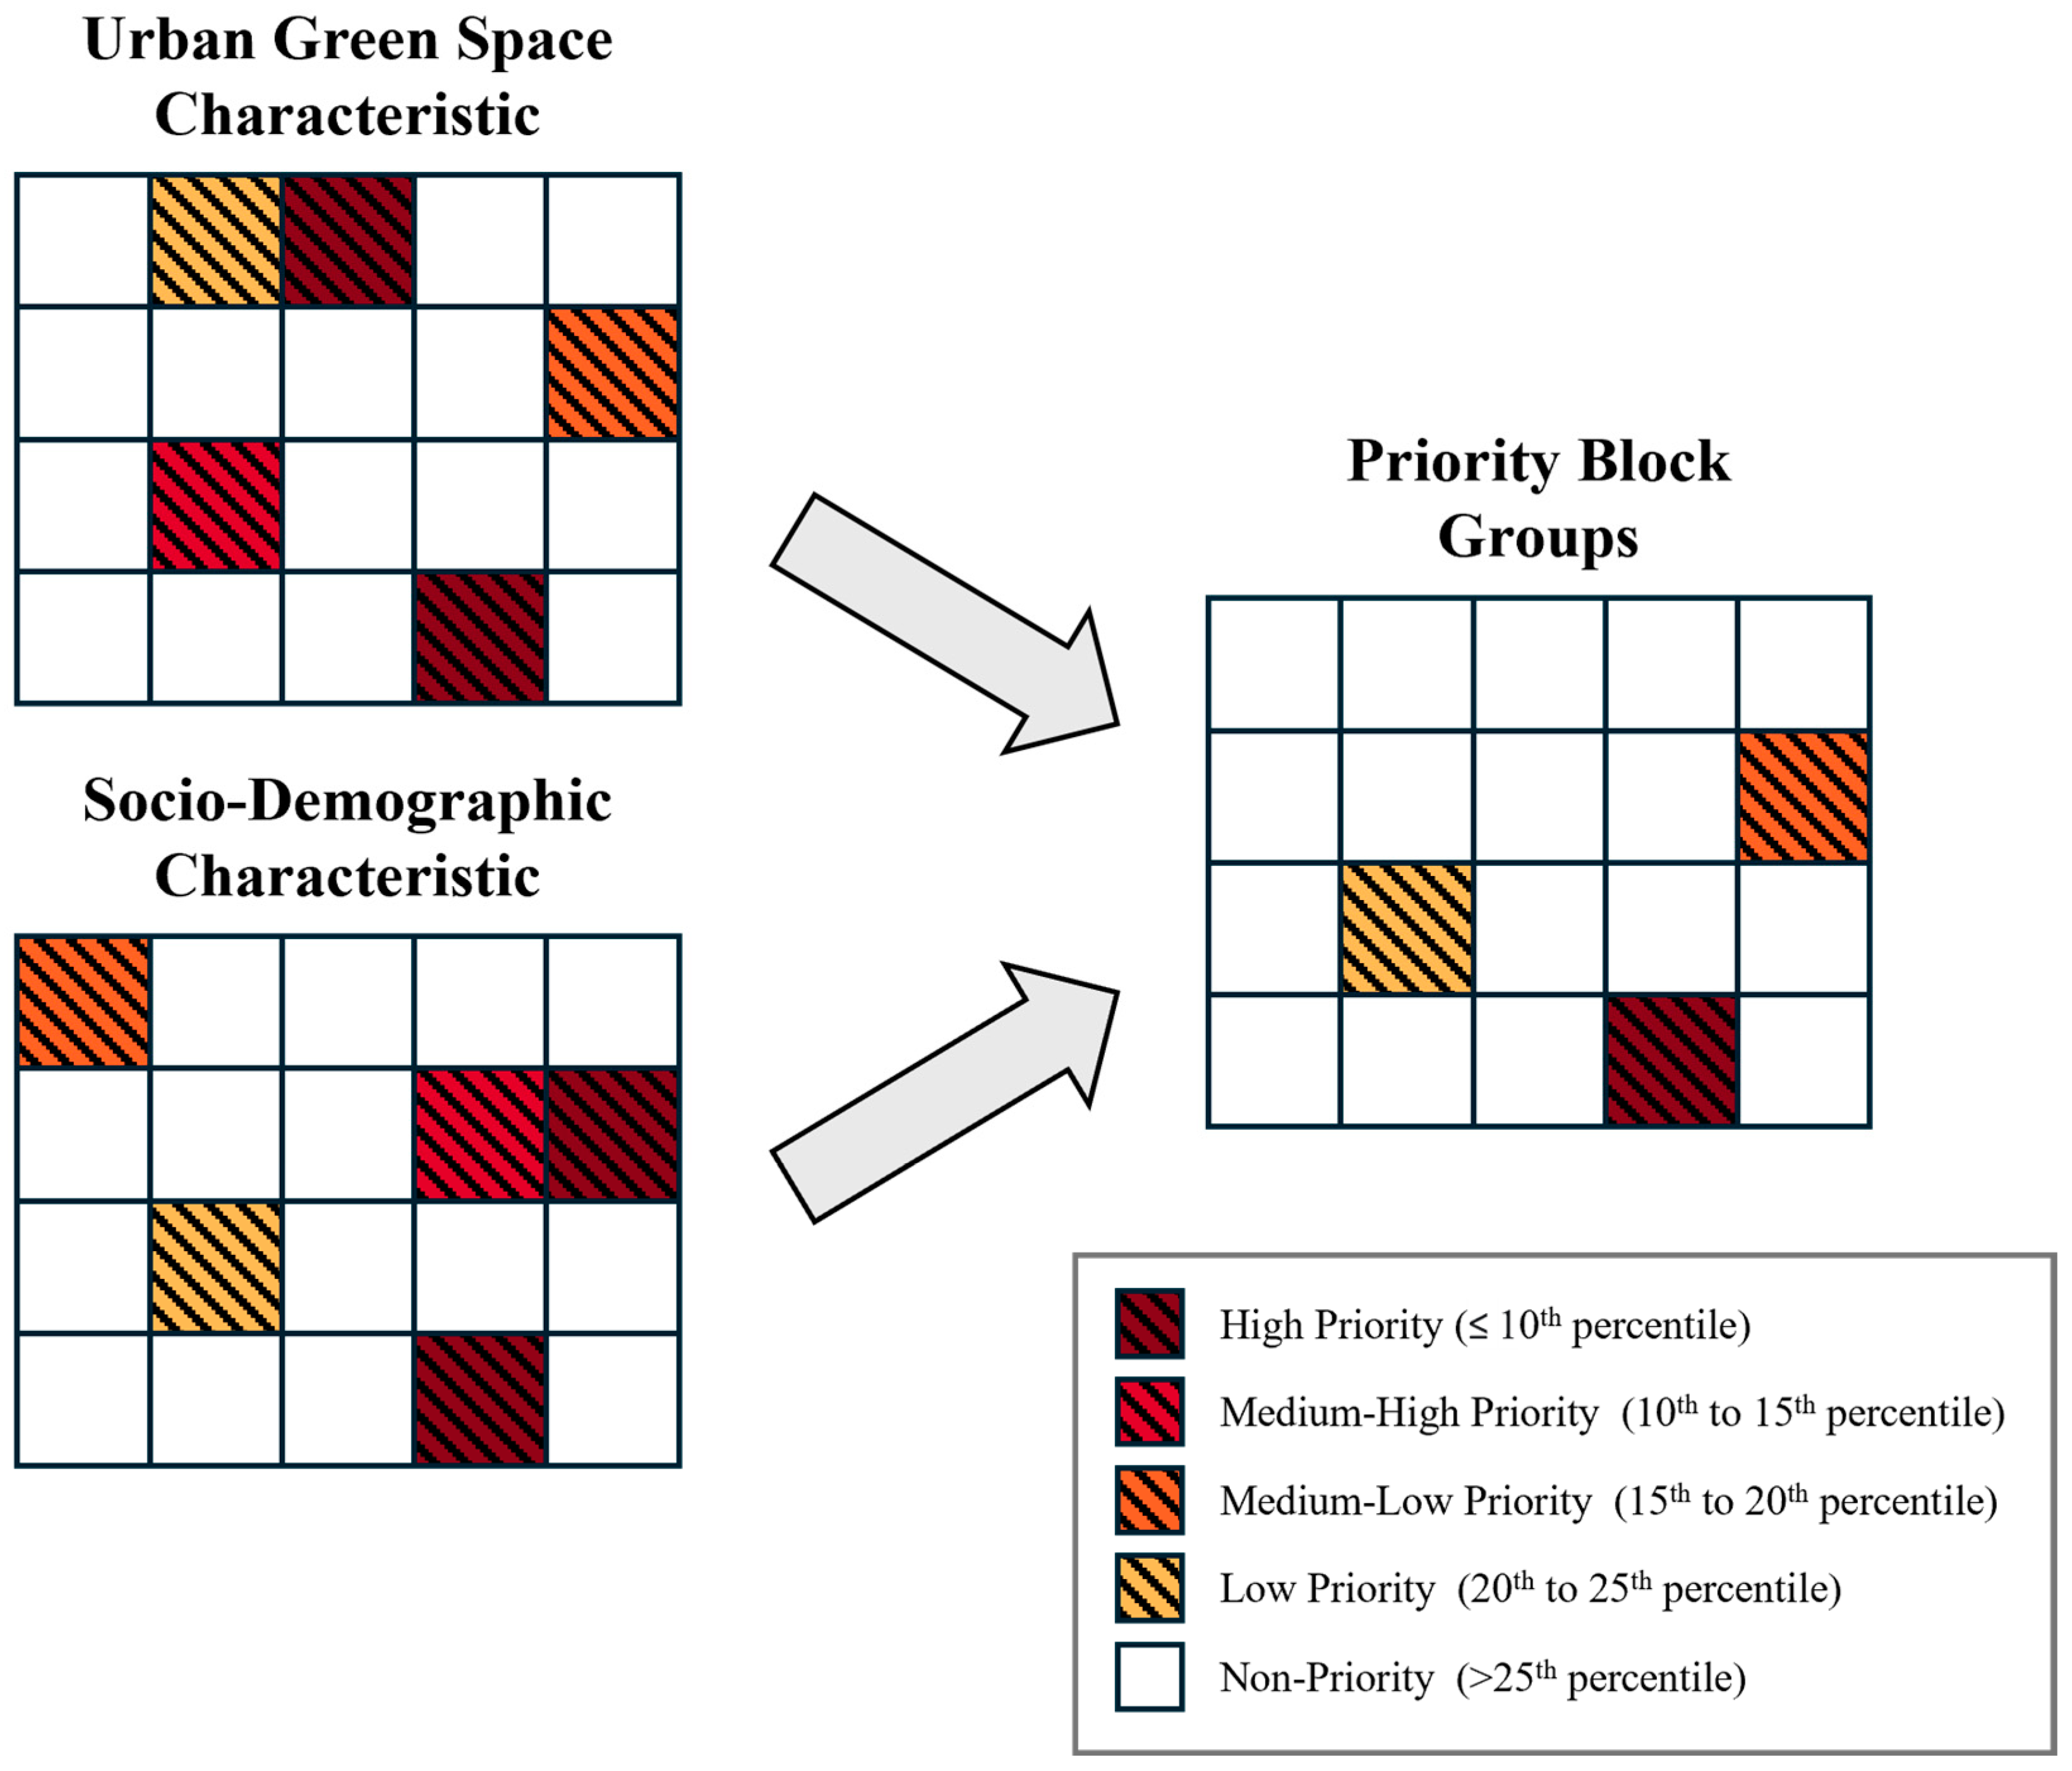
Working to address existing urban green space inequities requires a data-informed planning strategy. While there are numerous potential approaches for identifying areas most in need of urban green space investment, we developed an example methodology for identifying priority locations for specific urban green space investments in Portland. This methodology did not use any specific urban green space equity standard; however, the methodology has the potential to be used by other researchers who do want to apply such a standard.
We identified priority planning locations for each inequitably distributed urban green space variable identified in SAR models. Priority block groups were defined as those with the least access to the particular green space variable (i.e., block groups in the lower quartile) and the largest proportions of marginalized populations for the specific socio-demographic variables present in the best-fit SAR models (i.e., block groups in the upper quartile for race, ethnicity, and educational attainment and the lower quartile for median household income). We further stratified block groups into four priority tiers using the 10th, 15th, 20th, and 25th percentiles as cutoffs for priority block groups based on urban green space and income. We used the 90th, 85th, 80th, and 75th percentiles for race, ethnicity, and education variables. Block groups that had differing priority tiers for green space and socio-demographic variables were assigned to the lower priority tier (Figure 3).

Figure 3.
Representation of the example methodology for identifying priority block groups based on urban green space and socio-demographic characteristics.
3. Results
3.1. Descriptive Statistics
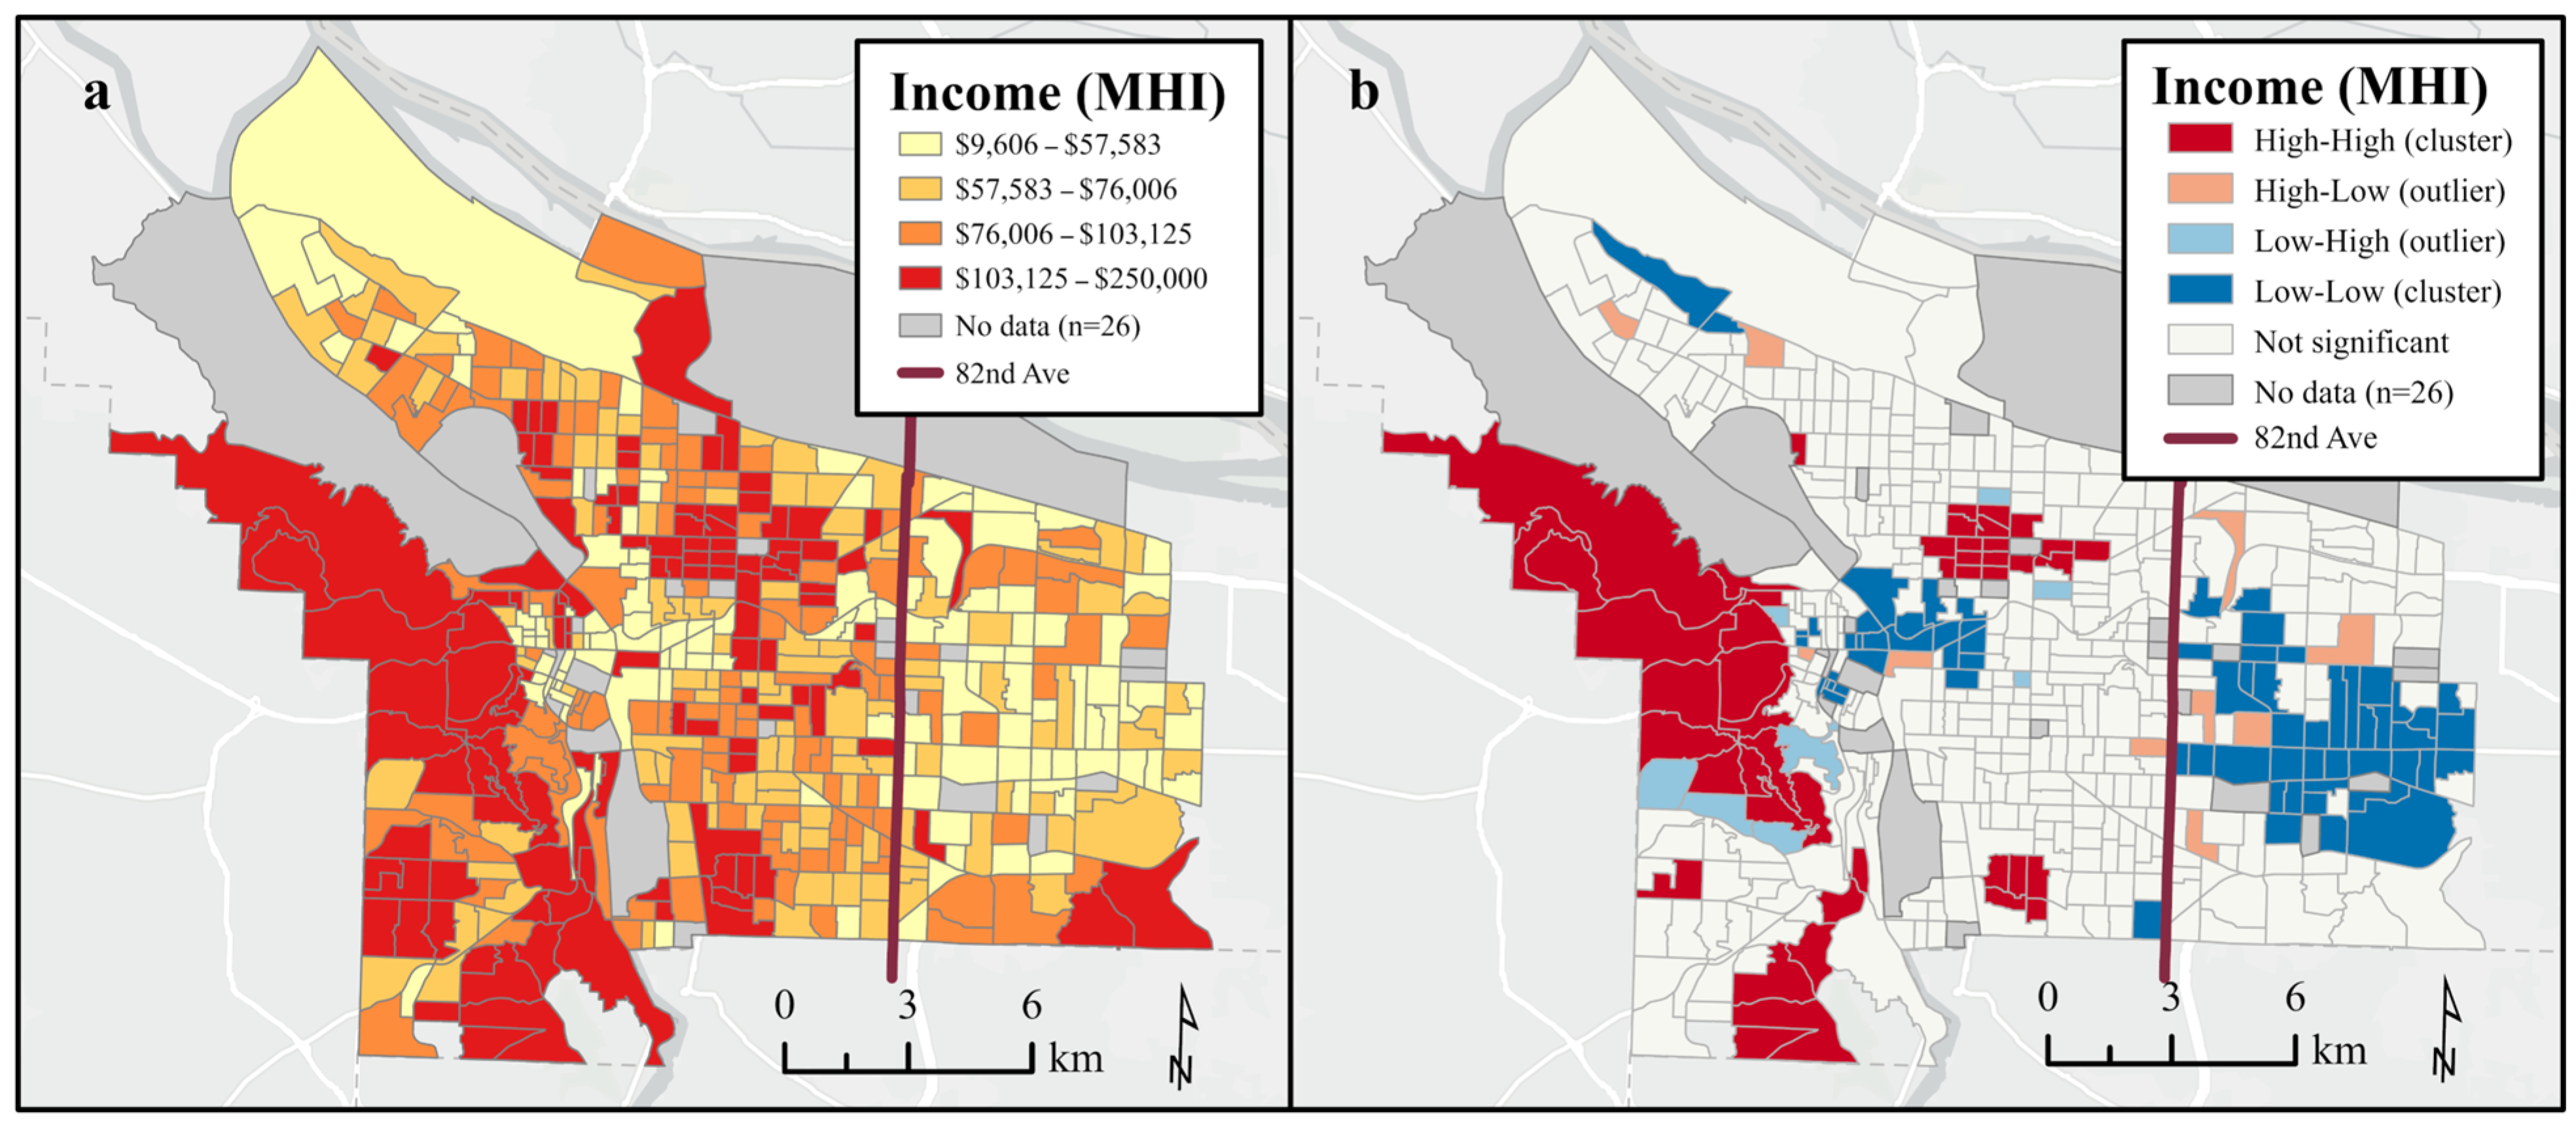
The 471 Census block groups analyzed for this study had a combined population of 621,501, or 96.9% of Portland’s estimated 2021 population [50]. Block group median household income ranged from under $10,000 to $250,000 with a median of $76,006. Clusters of low-income block groups were identified in central Portland along the Willamette River and to the east of 82nd Avenue (Figure 4). The block group percent comprising the minoritized racial population ranged from 10.9% to 76.3% (median = 27.1%), with clusters of high minoritized racial population block groups in the eastern and northern parts of the city (Figure 5). Educational attainment had a strong correlation with race (r = 0.72) and exhibited similar spatial clustering (Figure S7). The Latinx population varied between 0% and 59.5% at the block group level (median = 6.7%; Table 2), with a large cluster of high Latinx population block groups on the east side of the city (Figure S8).
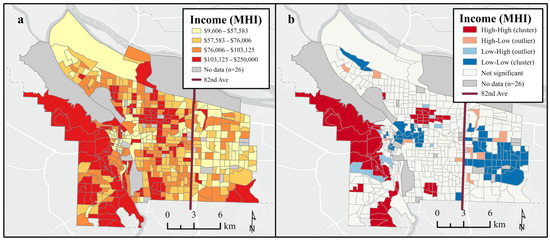
Figure 4.
(a) Block group median household income (MHI) grouped in quartiles (n = 471); (b) cluster analysis using Local Moran’s I to identify clusters of high- and low-income block groups.
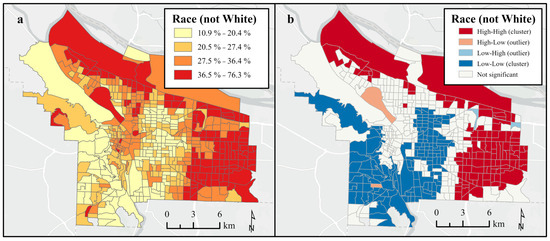
Figure 5.
(a) Block group percent minoritized racial population (i.e., non-white, or multiracial; n = 497) in quartiles; (b) cluster analysis using Local Moran’s I to identify block group clusters with high and low minoritized racial populations.
Table 2.
Census block groups socio-demographic and green space characteristics in Portland, Oregon (n = 471).
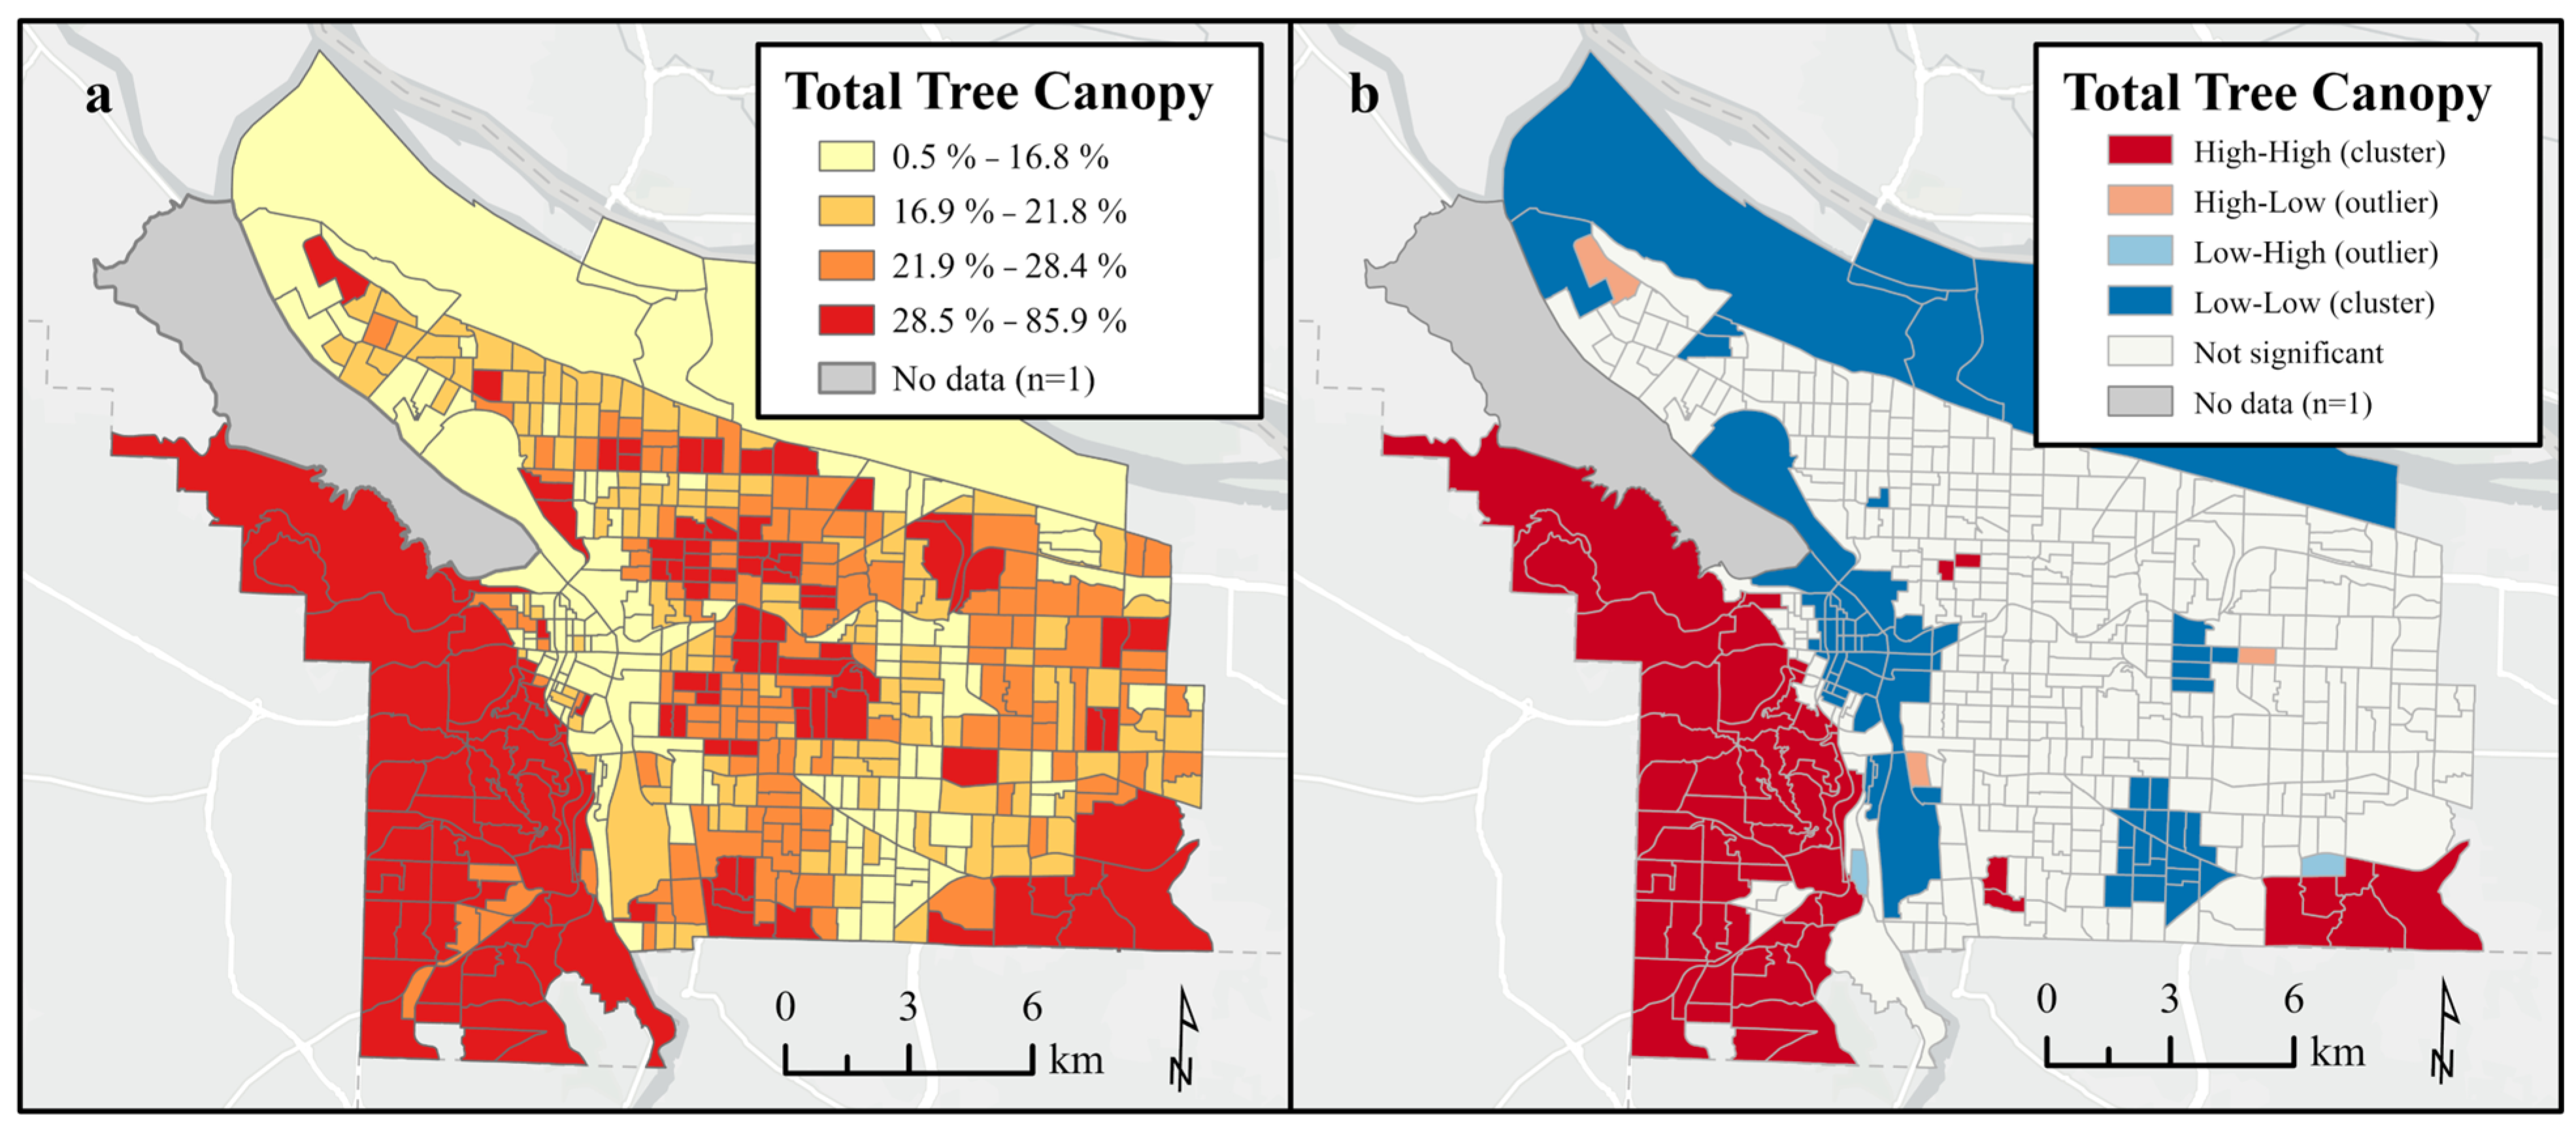
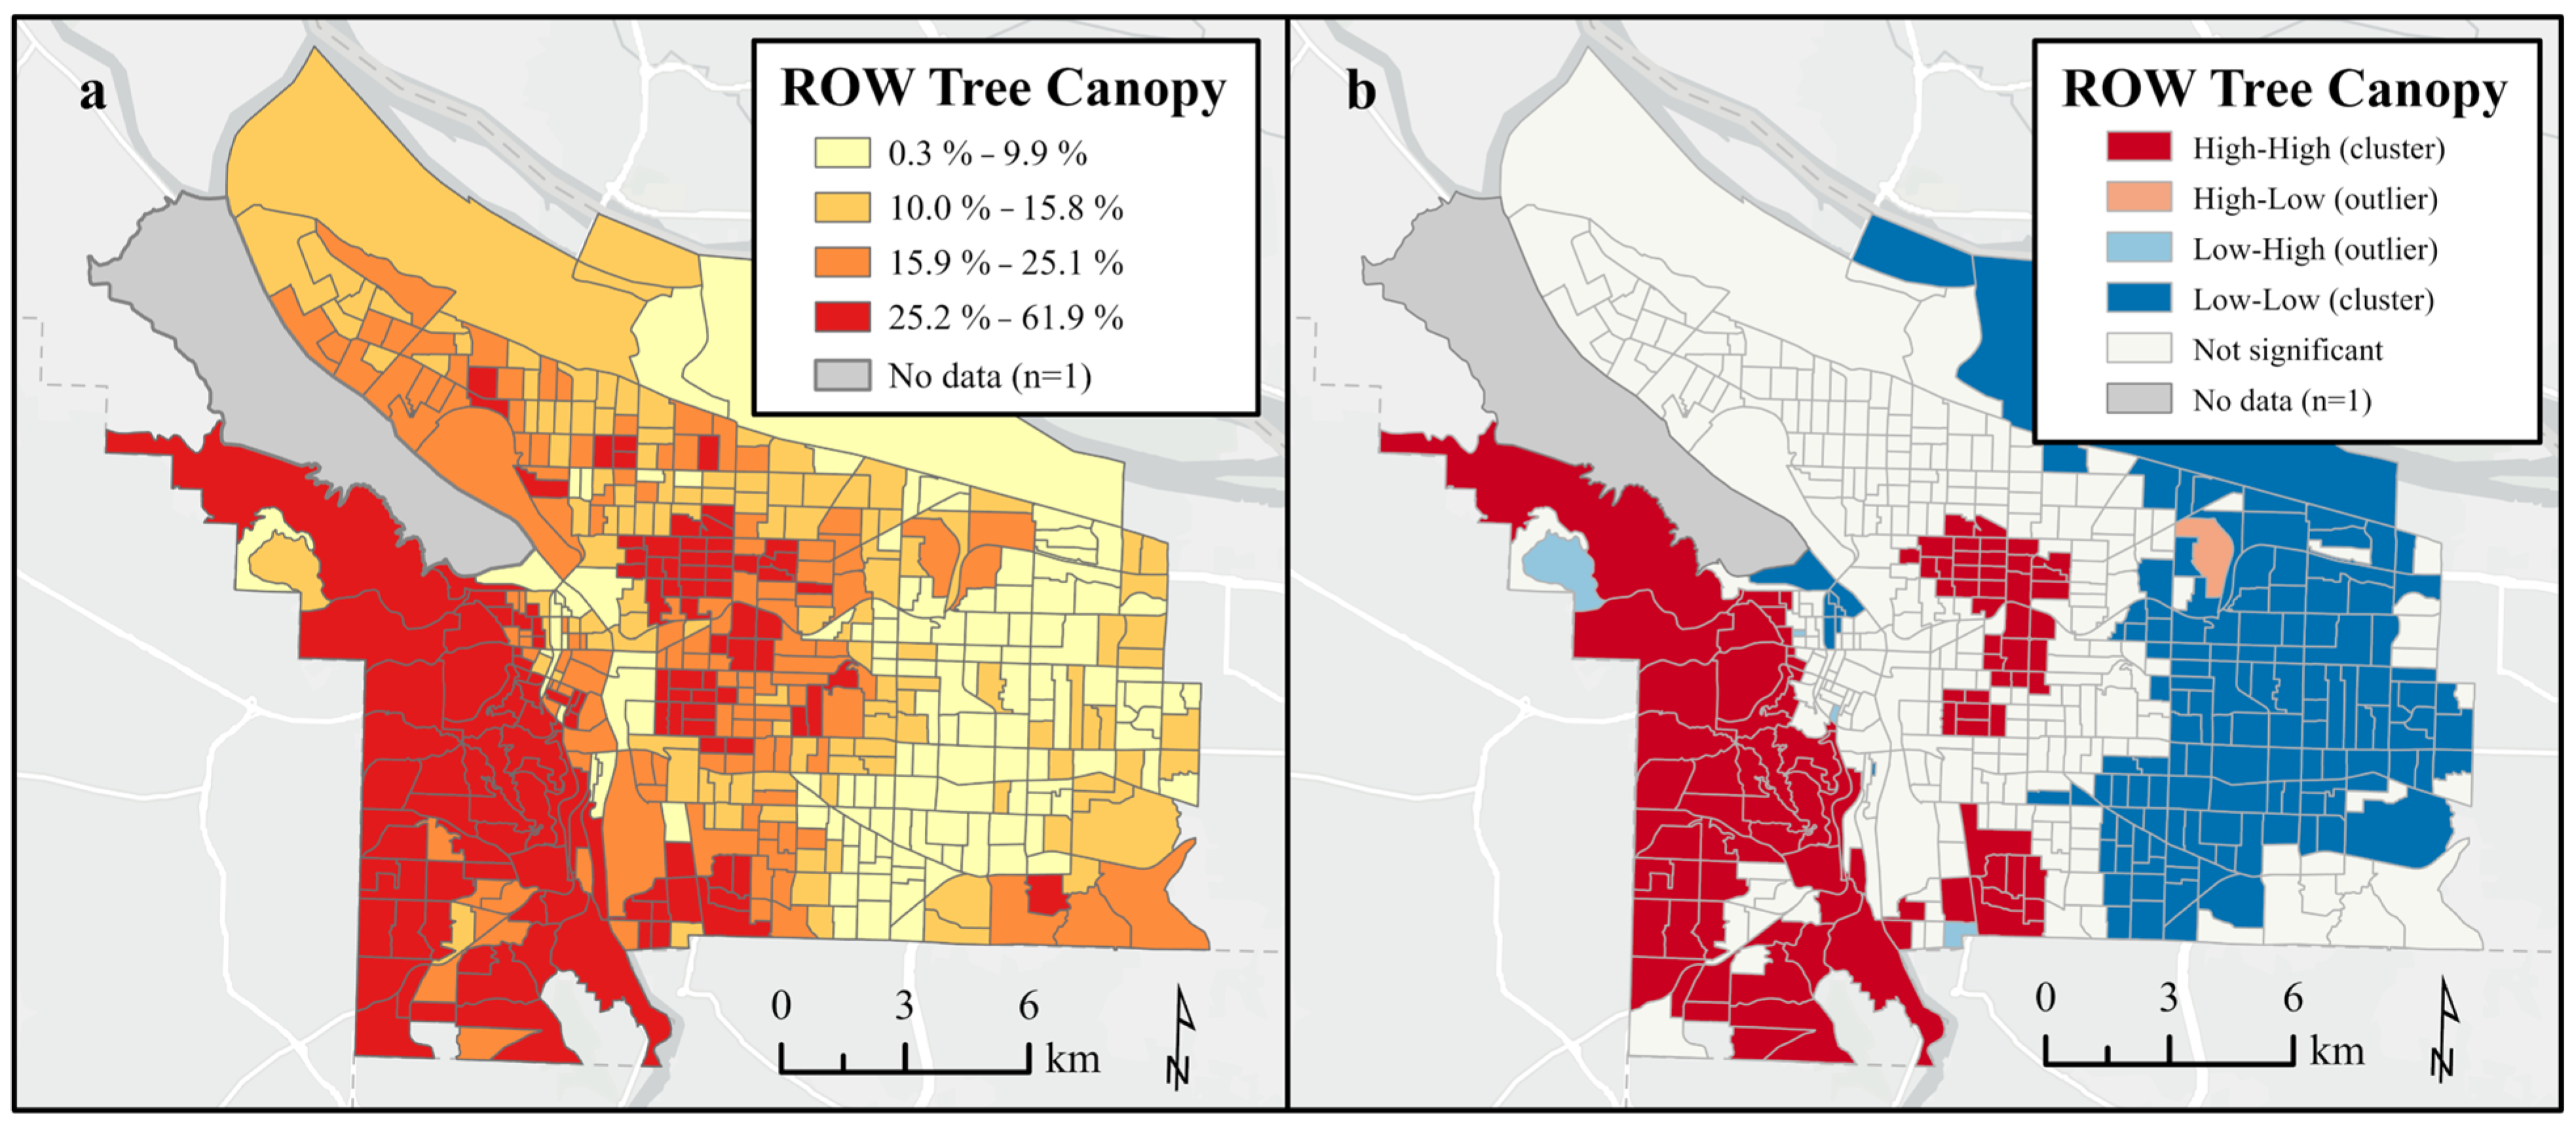
Green cover varied dramatically across block groups, with total green cover ranging from 2.2% to 94.9% (median = 47.4%) and total tree canopy cover ranging from under one percent to over 85% (median = 22.1%; Table 2). A large cluster of block groups with high tree canopy cover was identified to the west of downtown, while several low canopy cover clusters were located in the downtown area, along the Columbia River, and in Southeast Portland (Figure 6). Right-of-way tree canopy cover ranged from 0.3% to 61.9% (median = 16.0%) with a cluster of high right-of-way tree canopy cover to the west of the Willamette River and a large cluster of low right-of-way tree canopy cover across the eastern part of the city (Figure 7). The median block group had access to four parks within a 400 m road distance of the block group boundary, though six block groups had no such park availability and 32 block groups had access to only one park.
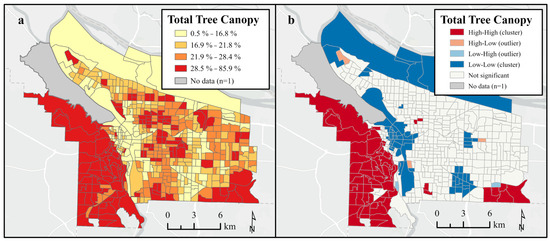
Figure 6.
(a) Block group percent total tree canopy cover grouped in quartiles (n = 496); (b) cluster analysis using Local Moran’s I to identify clusters of high and low total tree canopy cover.

Figure 7.
(a) Block group percent right-of-way (ROW) tree canopy cover grouped in quartiles (n = 496); (b) cluster analysis using Local Moran’s I to identify clusters of high and low right-of-way tree canopy cover.
3.2. Bivariate Spearman’s Rank Correlation
Numerous strong and moderate relationships were identified between block group socio-demographic characteristics and green cover variables in bivariate Spearman’s rank correlation. The strongest relationships were observed between race (i.e., percent minoritized racial population) and percent of right-of-way tree canopy cover (rs = −0.73). The percent of the minoritized racial population was also associated with decreased GVI (rs = −0.71), right-of-way green cover (rs = −0.65); cumulative NDVI (rs = −0.36); and percent of tree canopy cover across all land uses (rs = −0.48), on park land (rs = −0.39), and on private land (rs = −0.31; Table 3; Table S3). Educational attainment (i.e., percent with no postsecondary education) had strong negative correlations with right-of-way tree canopy cover and GVI (rs = −0.69 and −0.63, respectively), and moderate negative correlations with tree canopy cover in parks and across all land uses (rs = −0.33 and −0.32, respectively). Median household income was positively associated with GVI (rs = −0.50) and cumulative NDVI (rs = −0.46), as well as tree canopy cover and green cover within the right-of-way (rs= 0.48 and 0.56, respectively), on private land (rs = 0.40 and 0.36, respectively), and across all land use types (rs = 0.43 for both). Ethnicity (i.e., percent Hispanic/Latinx) had moderate negative associations with right-of-way tree canopy cover (rs = −0.34), right-of-way green cover (rs = −0.33), and GVI (rs = −0.34).
Table 3.
Summary of environmental justice concerns based on Spearman’s rank correlation coefficients (rs) between green space and Census variables with strong and moderate correlations (|rs| > 0.5 and |rs| > 0.3, respectively).
No park availability variables met the Spearman’s rank correlation coefficient threshold for inclusion. Among park quality variables, only NEST overall score and non-natural aesthetics domain score (i.e., presence of decorative water fountains, public art, and historic/attractive buildings or structures) had moderate negative associations with educational attainment (rs = −0.31 and −0.34, respectively; Table 3).
3.3. Multivariate Modeling
3.3.1. Models with One Census Variable
All 103 models that satisfied OLS modeling criteria with one Census variable had significant spatial autocorrelation of residuals (Moran’s I p < 1.0 × 10⁻²⁴. In SAR modeling with one Census variable, 28 models satisfied spatial autocorrelation assumptions (Moran’s I p > 0.05). Right-of-way tree canopy cover was significantly associated (p < 0.001) with all four socio-demographic variables (i.e., race, educational attainment, income, and ethnicity) in SAR models (Tables S6–S9). Right-of-way green cover was significantly associated with race, ethnicity, and income, while GVI was significantly associated with income, ethnicity, and education. Standardized regression coefficients, or beta coefficients (β), for socio-demographic variables were greater in magnitude than for mean elevation and urban form in all OLS models of right-of-way tree canopy, green cover, and GVI (Table S5). Additionally, elevation was not significant in any right-of-way and street-level greenness SAR model (Tables S6–S9). Significant correlations were identified between socio-demographic variables and numerous other green cover variables, including tree canopy cover on private land (race, ethnicity, and income), on parkland (race, ethnicity, income, and educational attainment), and across all land uses (race, income, and educational attainment), as well as total green cover (ethnicity), and NDVI (race and income). However, all non-right-of-way green cover variables had stronger associations (i.e., Spearman’s rank correlation and OLS beta coefficient magnitude) with mean elevation than any socio-demographic variables (Tables S4 and S5).
Only four park quality models met SAR modeling criteria. NEST natural aesthetics and usability domain scores were significantly correlated with educational attainment (Table S9). In addition, race and income were significantly associated with NEST amenities domain scores (Tables S6 and S7).
3.3.2. Models with Two Census Variables
A total of 43 models with two Census variables satisfied OLS model criteria, and the 19 distinct response variables were all related to green cover or street-level greenness (i.e., tree canopy, green cover, GVI, or NDVI). All 43 OLS model residuals had significant spatial autocorrelation (Moran’s I p < 1.0 × 10⁻²⁵), and twenty-five of the 43 SAR models contained spatial autocorrelation of model residuals, leaving 18 models that satisfied SAR model criteria. Median household income and race were significantly associated (p < 0.01) with right-of-way tree canopy, right-of-way green cover, GVI, total tree canopy, and private land tree canopy in best-fit models (i.e., highest Nagelkerke pseudo-R2 among models with the same response variable; Table 4). Median household income was the only significant Census variable in the NDVI model, while ethnicity was the only significant Census variable associated with either parkland tree canopy or total green cover (Table 4). Green cover variables had stronger associations with income for all models that included both race and income.
Table 4.
Summary of estimated coefficients for best-fit spatial autoregressive (SAR) models with two socio-demographic predictors and no spatial autocorrelation of model residuals.
Neither elevation nor urban form were significant predictors of right-of-way tree canopy cover. While urban form was significantly associated with both GVI and right-of-way green cover, combined OLS beta coefficients for race and income were more than 2.5 times larger than elevation and urban form beta coefficients in all three models (Table 4; Table S10). Best-fit total tree canopy, total green cover, NDVI, and private land tree canopy models had the highest Nagelkerke pseudo-R2 among all SAR models, although elevation and urban form were highly significant (p < 0.001). Elevation had stronger bivariate associations (i.e., Spearman’s rank correlation and OLS beta coefficient) with total tree canopy, total green cover, NDVI, and private land tree canopy than any significant socio-demographic variable, and the combined beta coefficients of elevation and urban form were between 1.8 and 6.2 times greater than the combined race and income beta coefficients (Tables S2 and S3; Table S12).
SAR model coefficients for transformed variables (i.e., right-of-way tree canopy and total tree canopy cover) and indices (i.e., GVI and NDVI) are difficult to interpret. Best-fit models with non-transformed response variables suggest a 1.9% decrease in right-of-way green cover and 1.7% decrease in private tree canopy cover for every 10% increase in minoritized racial population (B = −0.19 and −0.17, respectively; Table 4). In the same models, a 0.75% increase in right-of-way green cover and 0.31% increase in private tree canopy cover are expected for every $10,000 increase in median household income (B = 0.75 and 0.31, respectively). Additionally, total green cover and parkland tree canopy cover models revealed expected 1.3% decreases in their respective coverage for every 10% increase in Latinx population (B = −0.13).
4. Discussion
This study proposed a methodology for evaluating distributional justice concerns related to urban green space access/exposure and applied it in Portland, Oregon. Urban green space distributional justice was assessed based on three categories of access/exposure: green cover, park availability, and park quality. This case study identified distributional justice concerns at the block group scale in Portland, Oregon based on urban green space access/exposure and characterized relationships between environmental and social characteristics of the urban environment to inform urban green space planning, policy, and decision making.
4.1. Green Cover Equity Assessment
Findings from tree canopy and green cover models revealed significant disparities in tree and green cover access for marginalized communities in Portland, Oregon. Consistent with the results from other tree canopy cover assessments, we identified tree canopy cover disparities based on race and income, with a stronger association between tree canopy cover and income [31,32]. In addition to socio-demographic factors, block group elevation and urban form were highly significant predictors of total tree canopy cover, total green cover, NDVI, and private tree canopy cover (Table 4), further reinforcing that urban green cover distribution may be connected to terrain, development patterns, and community socio-demographic character [36,55,81,94]. In Portland specifically, the highest elevation areas are west of the Willamette River where tree canopy cover exceeds 54%, while areas east of the Willamette River have an estimated 20.5% tree canopy cover [52].
Distributional inequities were most pronounced for right-of-way greenness (i.e., tree canopy cover, green cover, and street-level greenness). In bivariate analyses, the strongest race-, ethnicity-, and education-based disparities were detected for right-of-way tree canopy cover, while the strongest income-based disparity was observed for right-of-way green cover (Table 3). Multivariate SAR models confirmed the significance of these relationships (Table 4; Tables S6–S9), and unlike the findings for all other green cover variables, changes in right-of-way tree canopy and green cover characteristics were more closely associated with block group socio-demographic characteristics than either elevation or urban form (Tables S3–S5; Tables S10–S12). These findings mirror outcomes from other studies, which also identified race- and income-based inequities in right-of-way tree canopy cover [36,54]. Our results suggest that while tree planting in parks and on private land would meaningfully contribute to reducing tree canopy disparities, the inequities observed between race, income, and right-of-way tree canopy cover are the most significant and pressing urban green space distributional injustices in Portland. Furthermore, these findings clarify the utility of assessing green cover across different land use types when considering planning and policy priorities.
Future studies may consider simplifying the number of green cover variables and the geographic units included in analyses. Overall tree canopy cover, NDVI, and private tree canopy cover were all strongly correlated (rs > 0.85; Table S2), and models yielded similar race- and income-based inequities. Right-of-way tree canopy cover and GVI were also strongly correlated (rs > 0.85), and their respective SAR models identified consistent inequities. These findings support the use of NDVI and GVI as proxies for overall tree canopy cover and right-of-way tree canopy cover, respectively. Additionally, all best-fit green cover models—aside from the parkland tree canopy cover model—used green cover metrics collected within block group boundaries. As such, future assessments may consider only measuring green cover within block group boundaries.
4.2. Park Equity Assessment
Reducing disparities in access to parks, natural areas, and services is one of the six objectives listed in Portland’s Parks and Recreation Five-Year Racial Equity Plan [49]. Our analyses found no race-, ethnicity-, income-, or education-based inequities in park availability and even identified weak but positive associations between accessible park area, block group percent of Latinx, and block group percent with no postsecondary education. However, we did uncover six block groups with no park access within 400 m of block group boundaries, two of which were in the lower quartile for median household income and the upper quartiles for percent population with no postsecondary education, percent population from minoritized racial groups, and percent of Latinx. In line with the Portland Parks and Recreation objective to prioritize property acquisition for the establishment of parks that serve communities of color and low-income neighborhoods [49], these block groups would be ideal locations for future park development initiatives.
Equitable park availability does not ensure that parks support user needs, and our assessment of park quality uncovered multiple inequities. Spatial autoregressive models found that block groups with higher proportions of Latinx residents had significantly less tree canopy cover on parkland within 800 m of block group boundaries (Table 4; Table S9). In separate SAR models, park amenities (i.e., seating, trash cans, toilets, shelters, picnic tables, and drinking fountains) were inequitably distributed based on block group median household income and percent of minoritized racial population (Tables S6 and S7). Additionally, block groups with higher proportions of residents with no post-secondary education had lower natural aesthetics (i.e., the combination of water features, views, tree cover, and maintained vegetation areas) and usability (i.e., the diversity of active and passive recreational opportunities) scores based on parks accessible within 400 and 800 m of block group boundaries, respectively (Table S8).
4.3. Towards Environmental Justice: Urban Green Space Planning Application
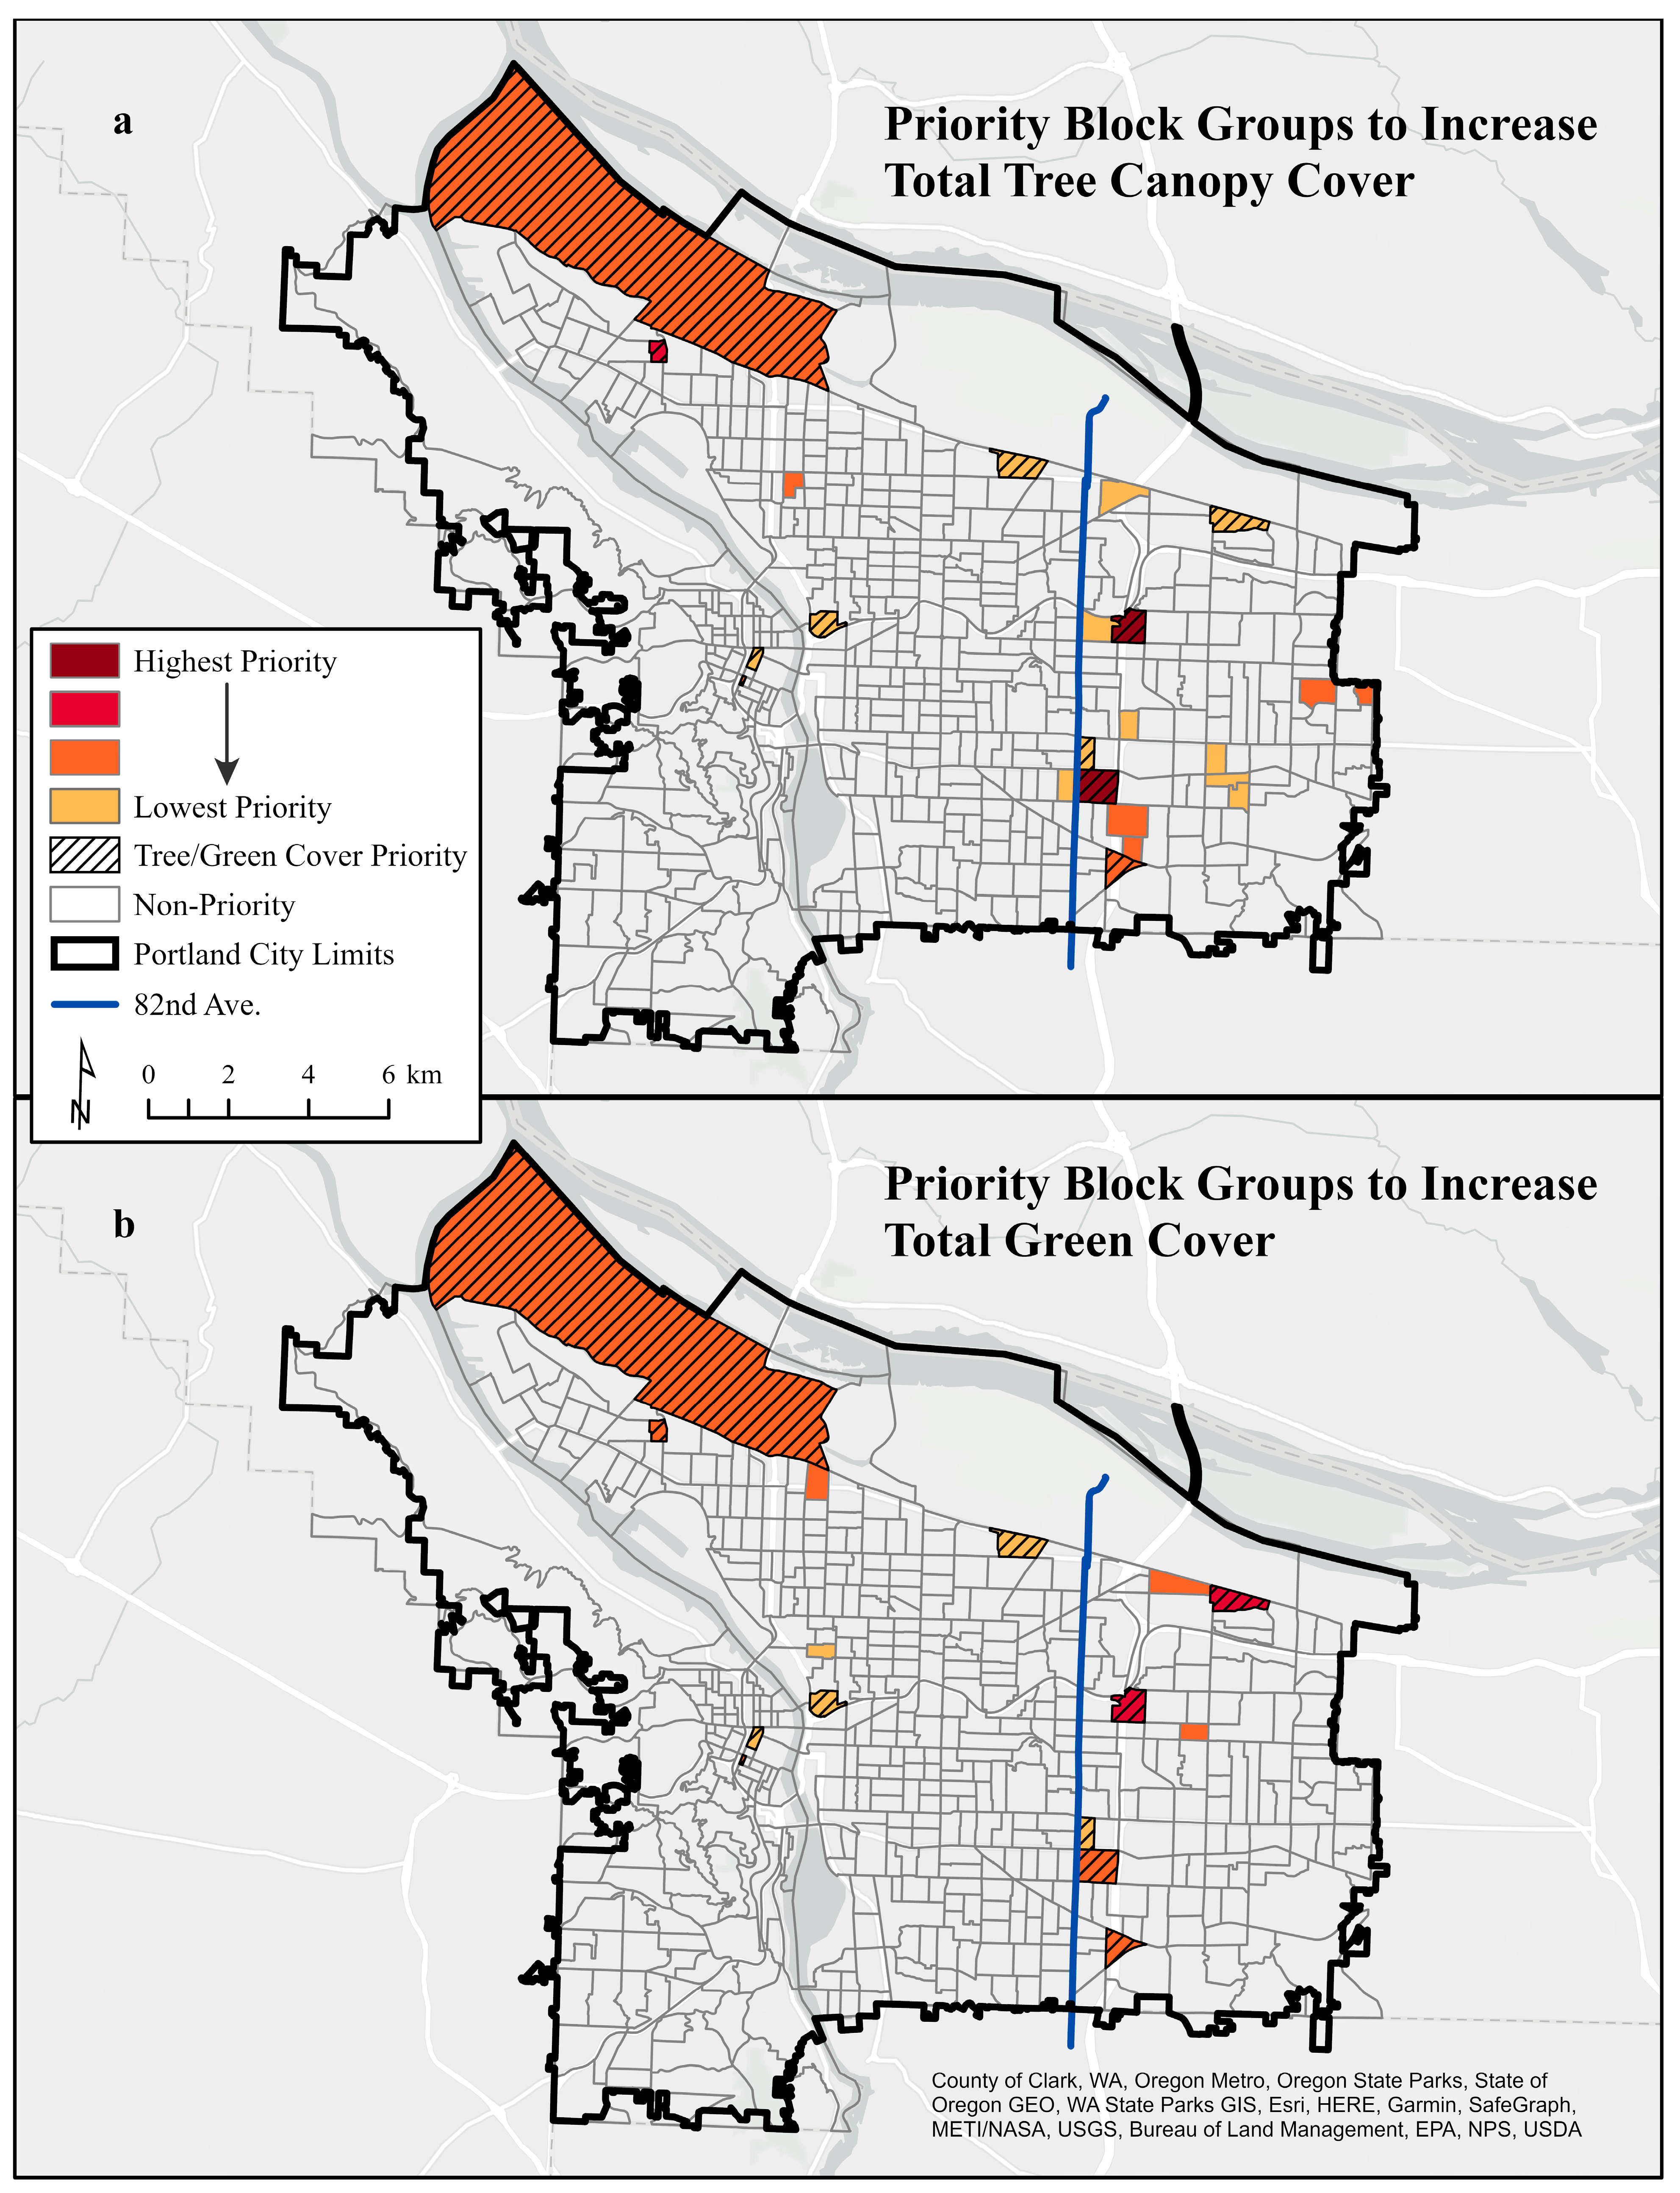
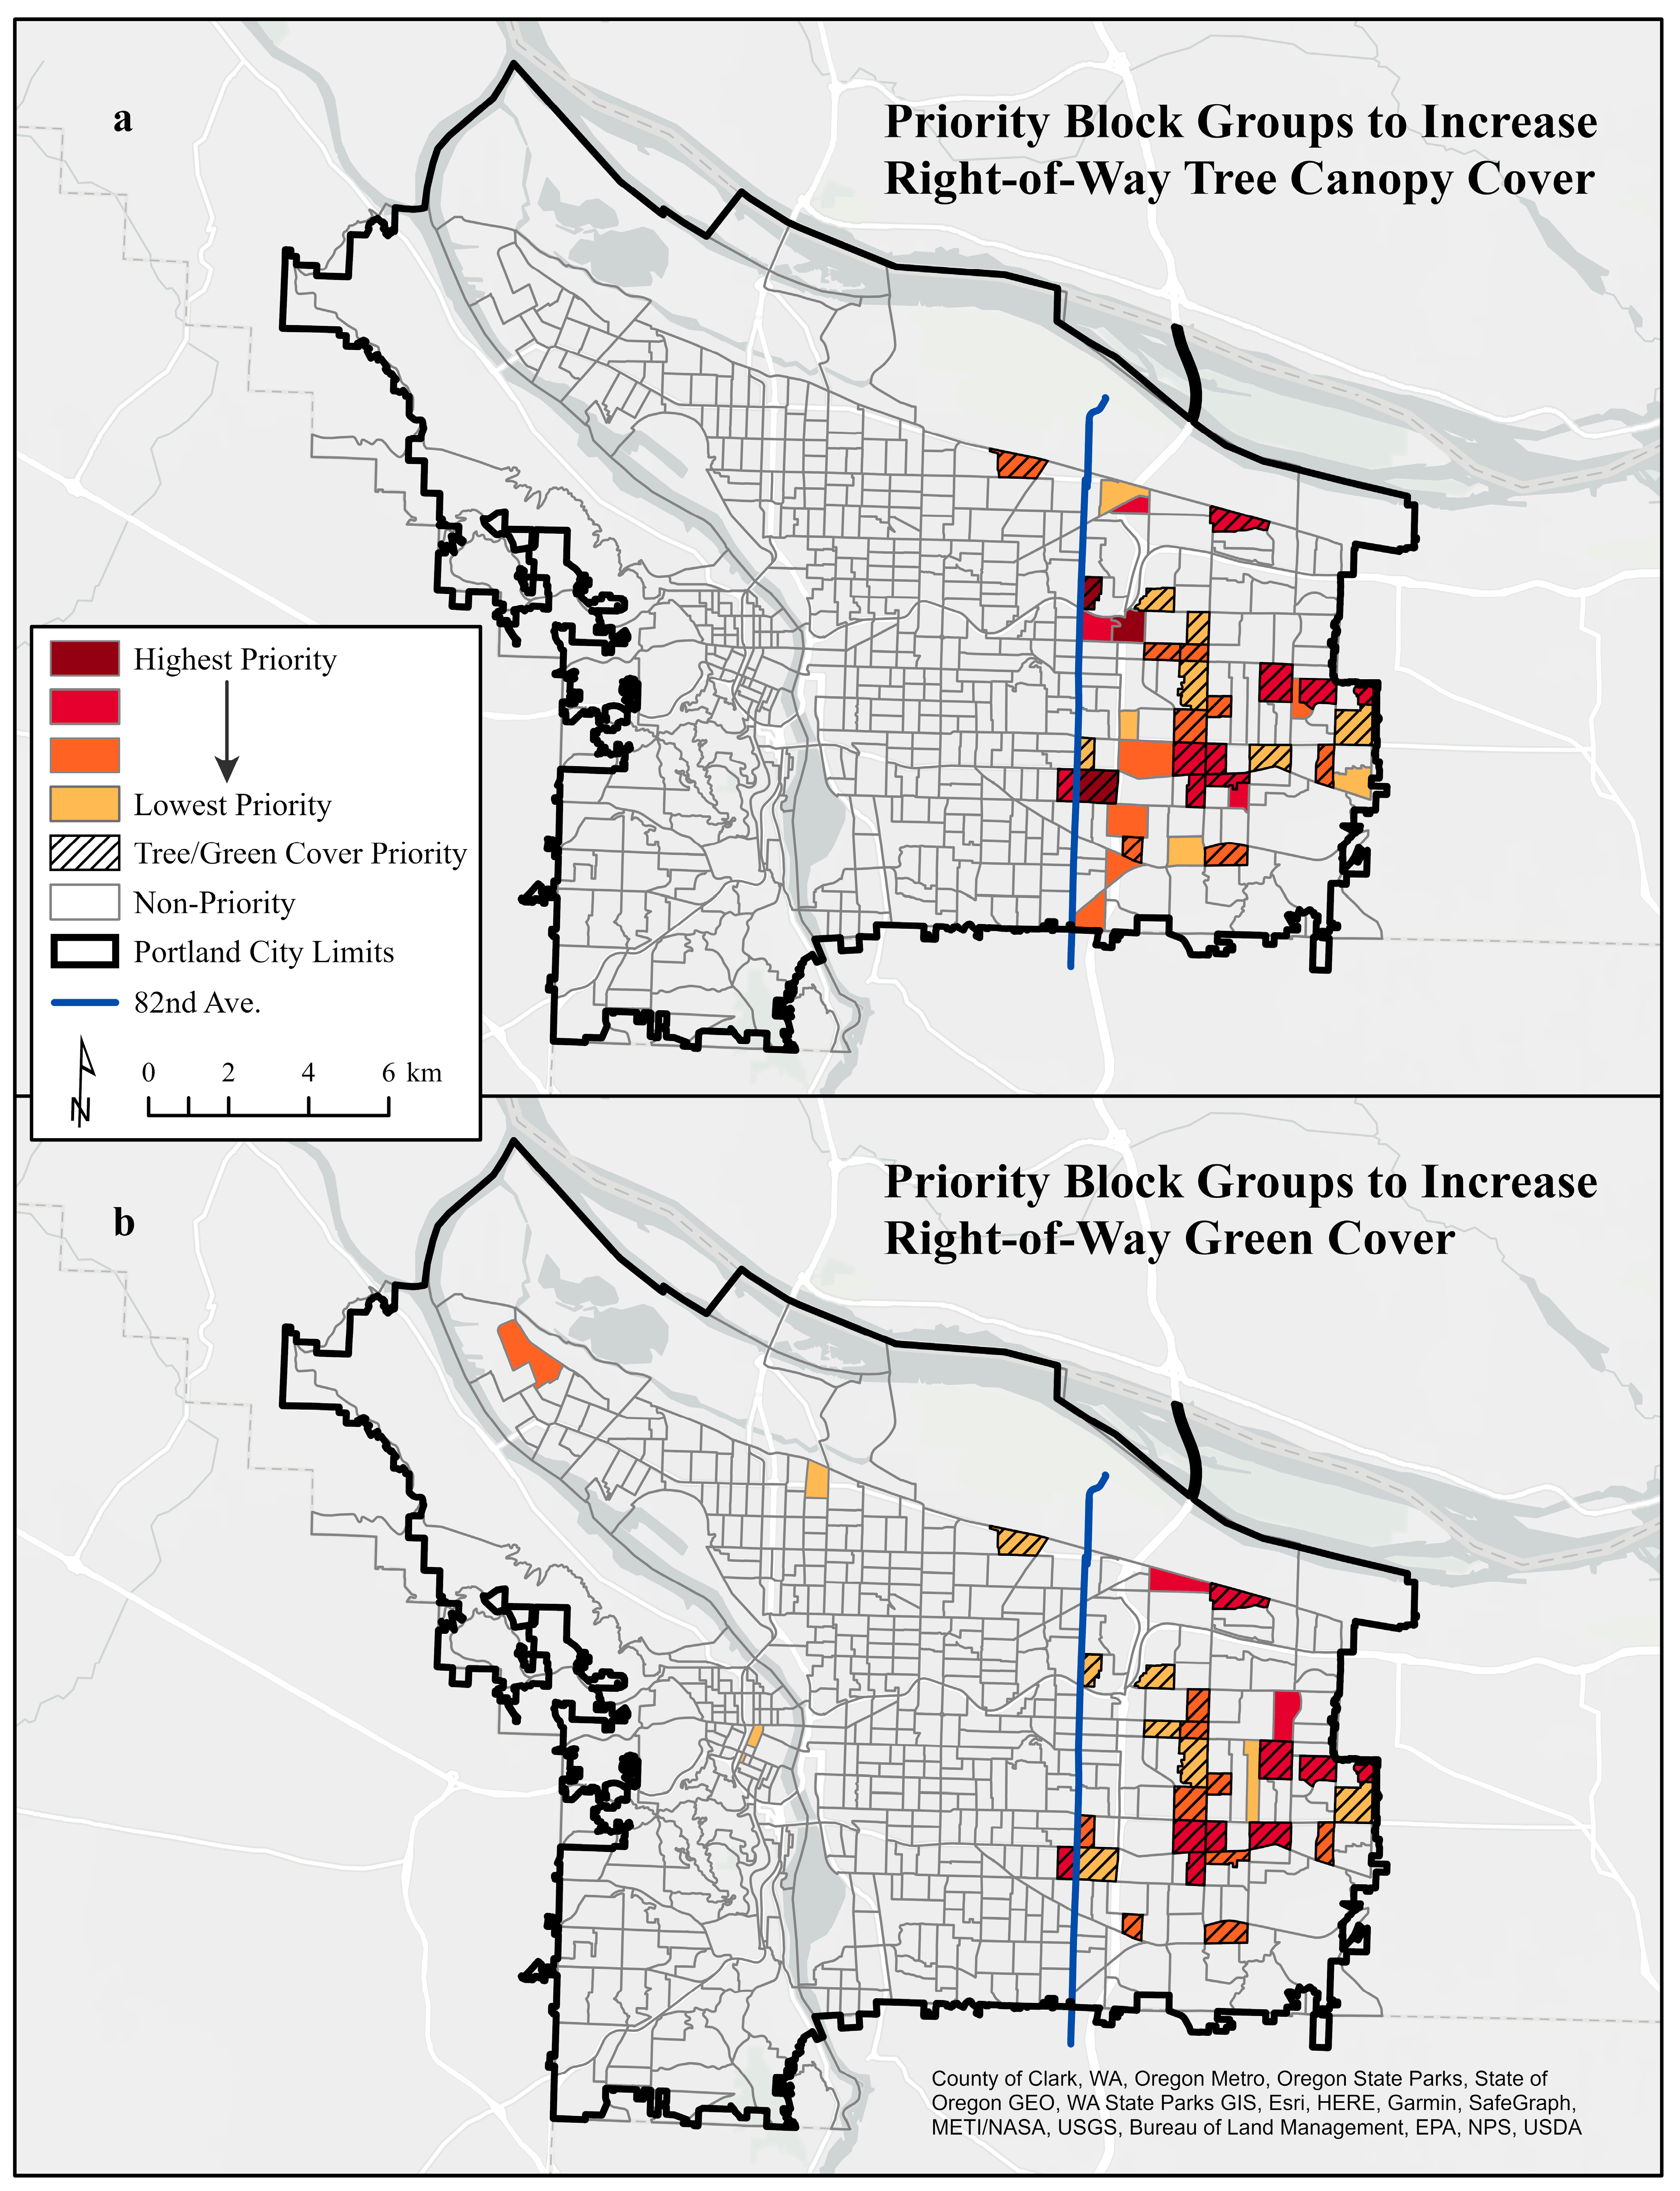
In the green cover priorities assessment, we identified 47 priority block groups for potential tree canopy expansion (i.e., across all land uses, on private land, and on right-of-way), 45 of which were located east of the Willamette River, mostly concentrated east of 82nd Avenue (Figure 8 and Figure 9). These findings were consistent with resident perceptions of tree canopy cover; a 2017 survey of approximately 3000 Portland residents found that residents living east of 82nd Avenue were less likely to believe their neighborhood had enough trees [48]. While Portland Parks and Recreation set a 35% target for right-of-way tree canopy citywide [95], the 38 block groups identified for right-of-way tree canopy expansion range between two and ten percent, indicating a significant need for right-of-way tree canopy expansion. In terms of tree planting potential, Portland Parks and Recreation estimated that over 80% of the 8452 hectares of potential tree planting space in the city was located east of the Willamette River, representing enough area to plant over one million trees [52]. The block groups identified here as in need of tree canopy expansion can provide Portland Parks and Recreation with specific locations to apply their potential tree planting data to better promote equity in urban canopy cover. Although this approach targets only a small percentage of block groups for urban forest expansion, priority areas could be expanded by including, for example, all block groups above median percent minoritized racial population and below median green cover and/or median household income.
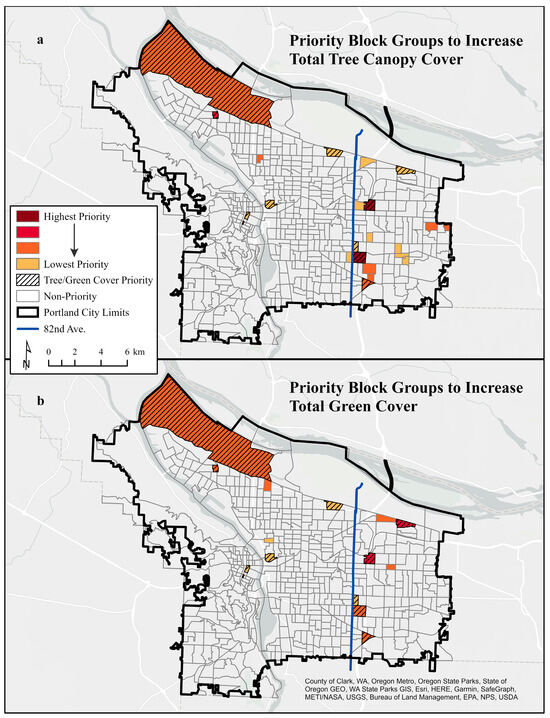
Figure 8.
Priority block groups for increased (a) total tree canopy cover, based on percent of total tree canopy cover, median household income, and percent of minoritized racial population, and (b) total green cover, based on percent of total green cover and of percent Hispanic/Latinx.
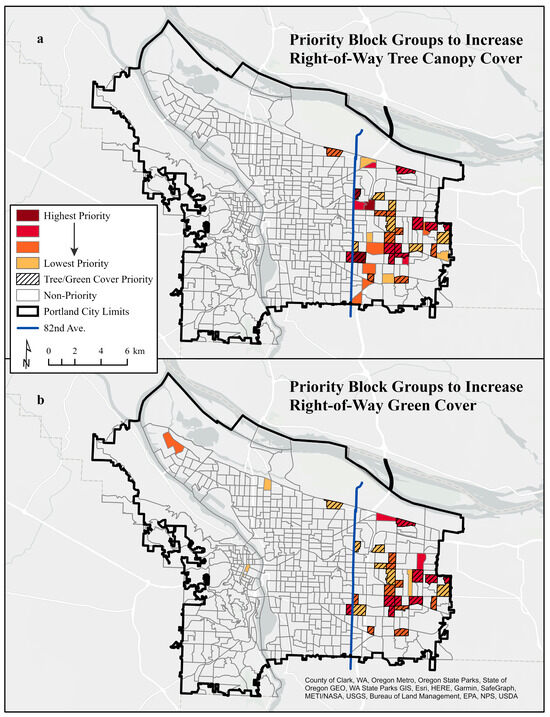
Figure 9.
Priority block groups for increased (a) right-of-way tree canopy cover based on percent right-of-way tree canopy cover, median household income, and percent minoritized racial population, and (b) right-of-way green cover based on percent right-of-way green cover, median household income, and percent minoritized racial population.
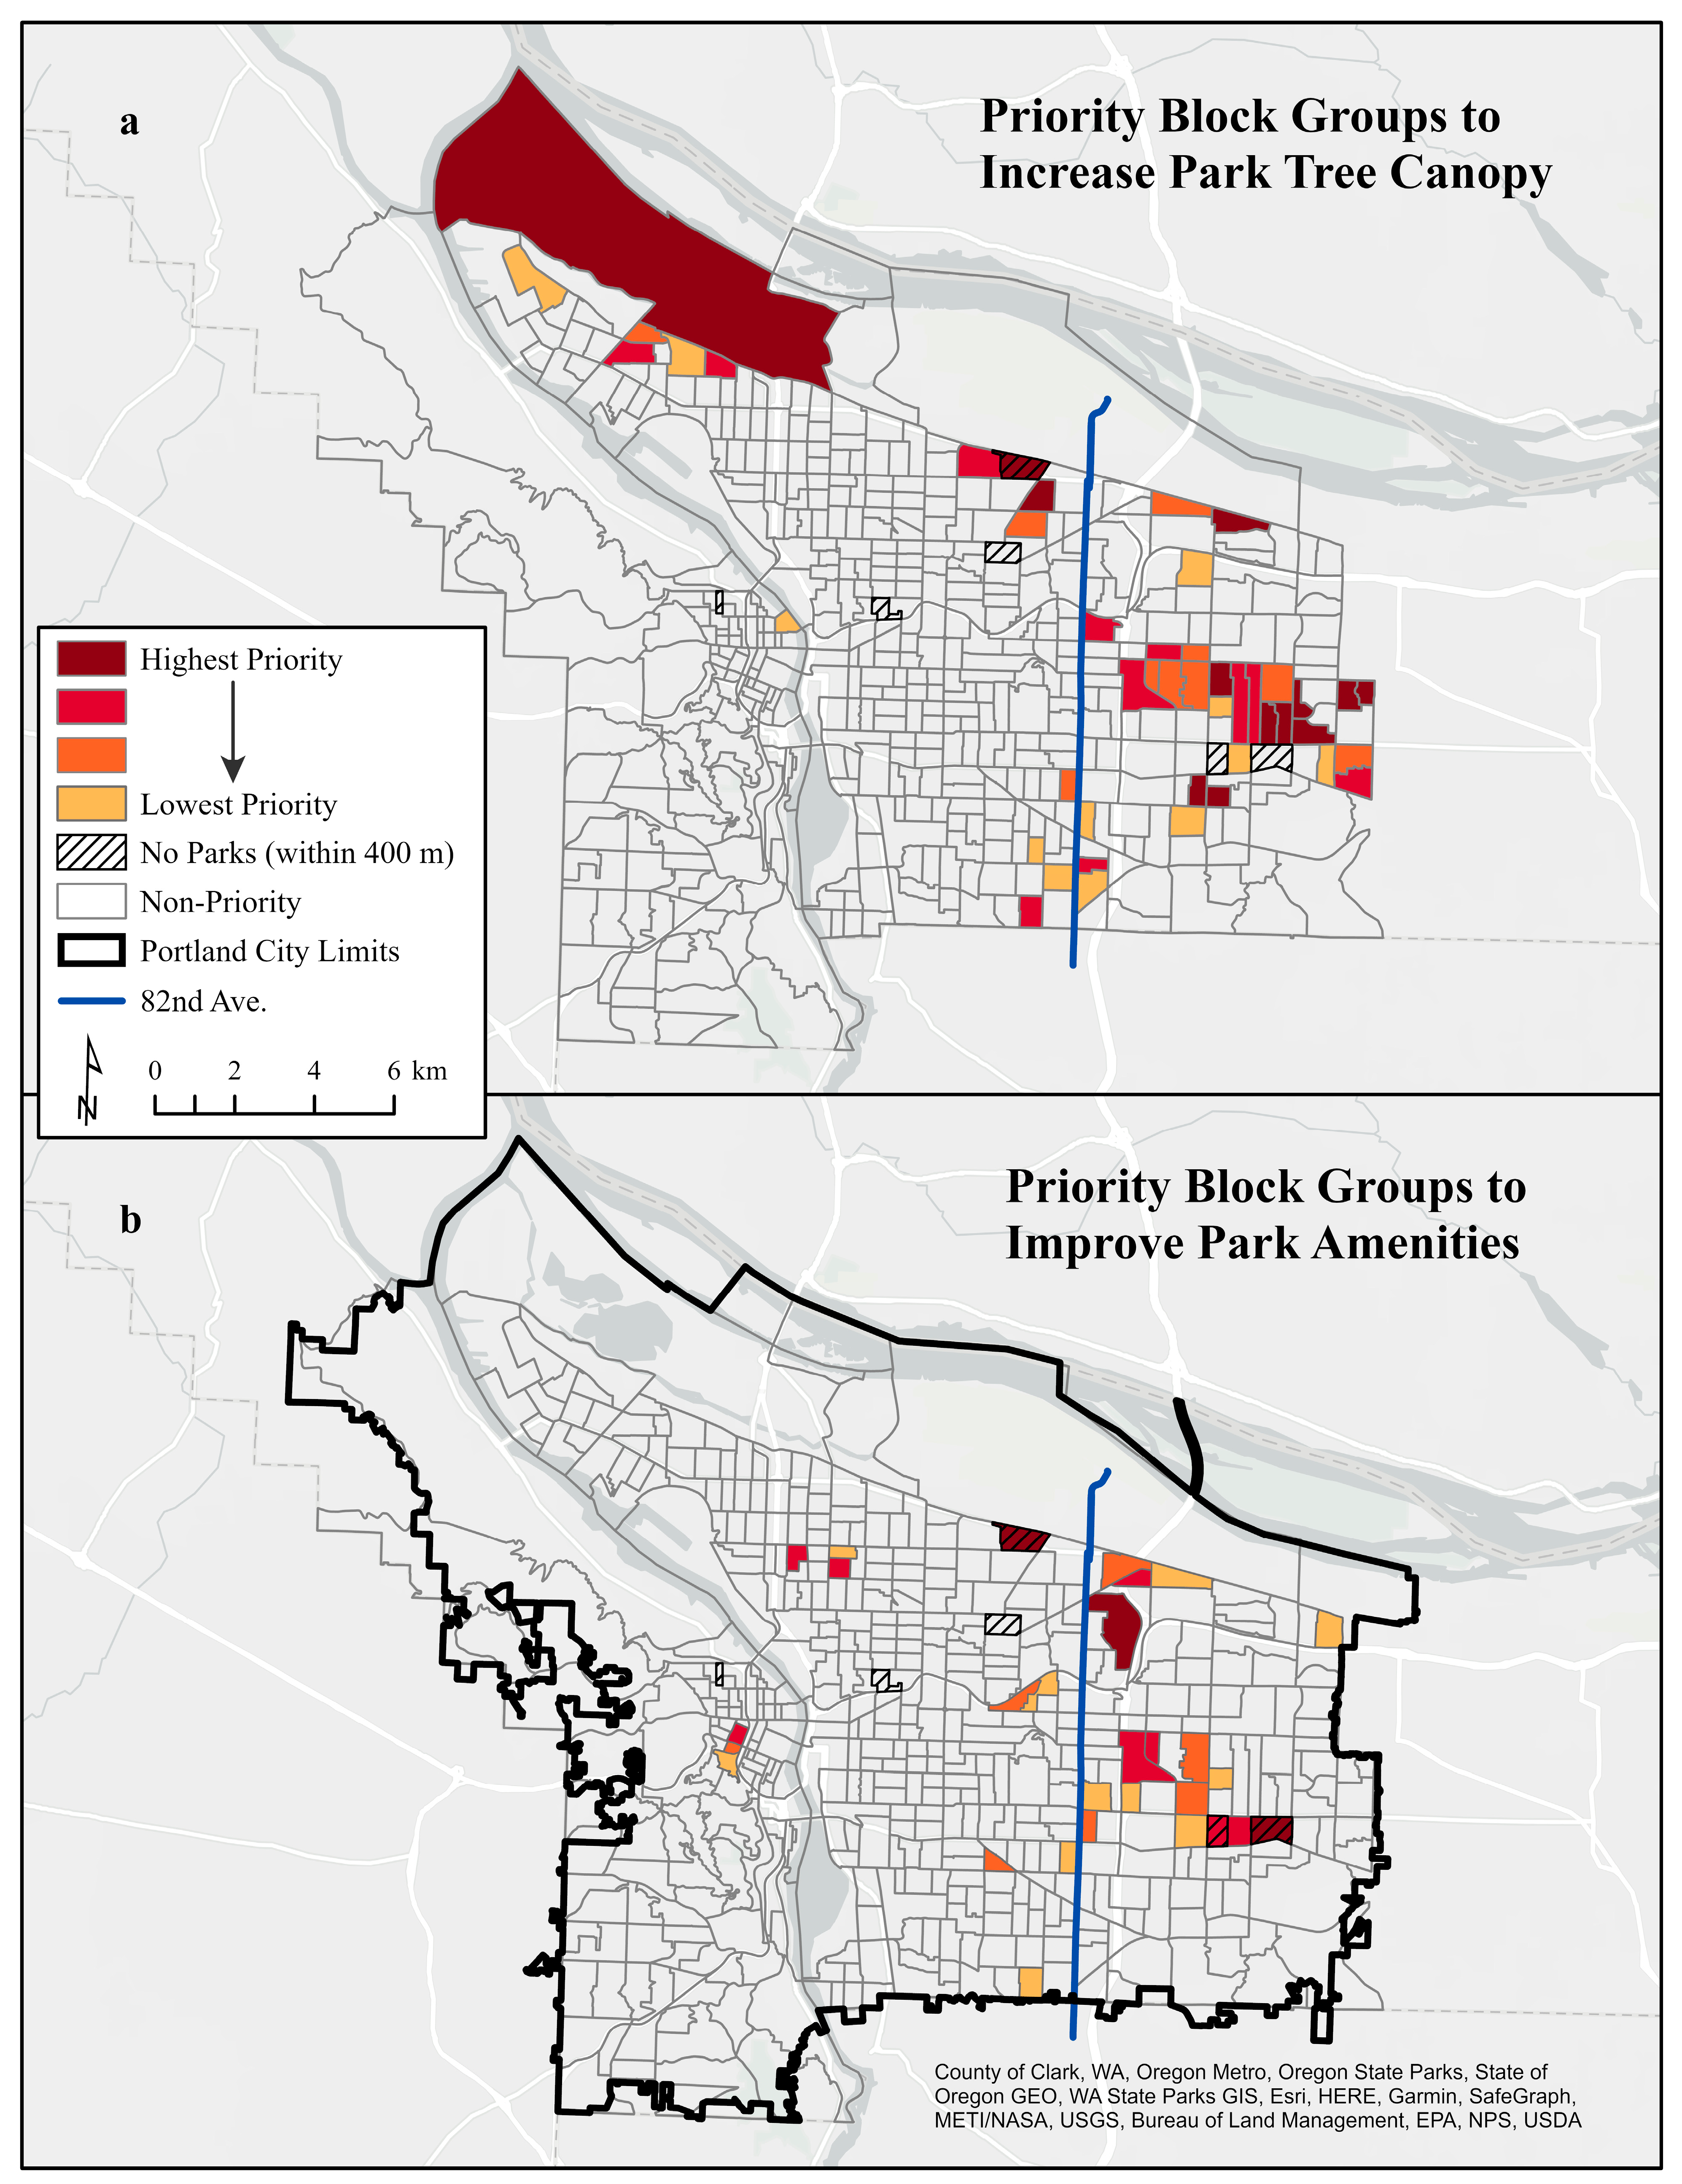
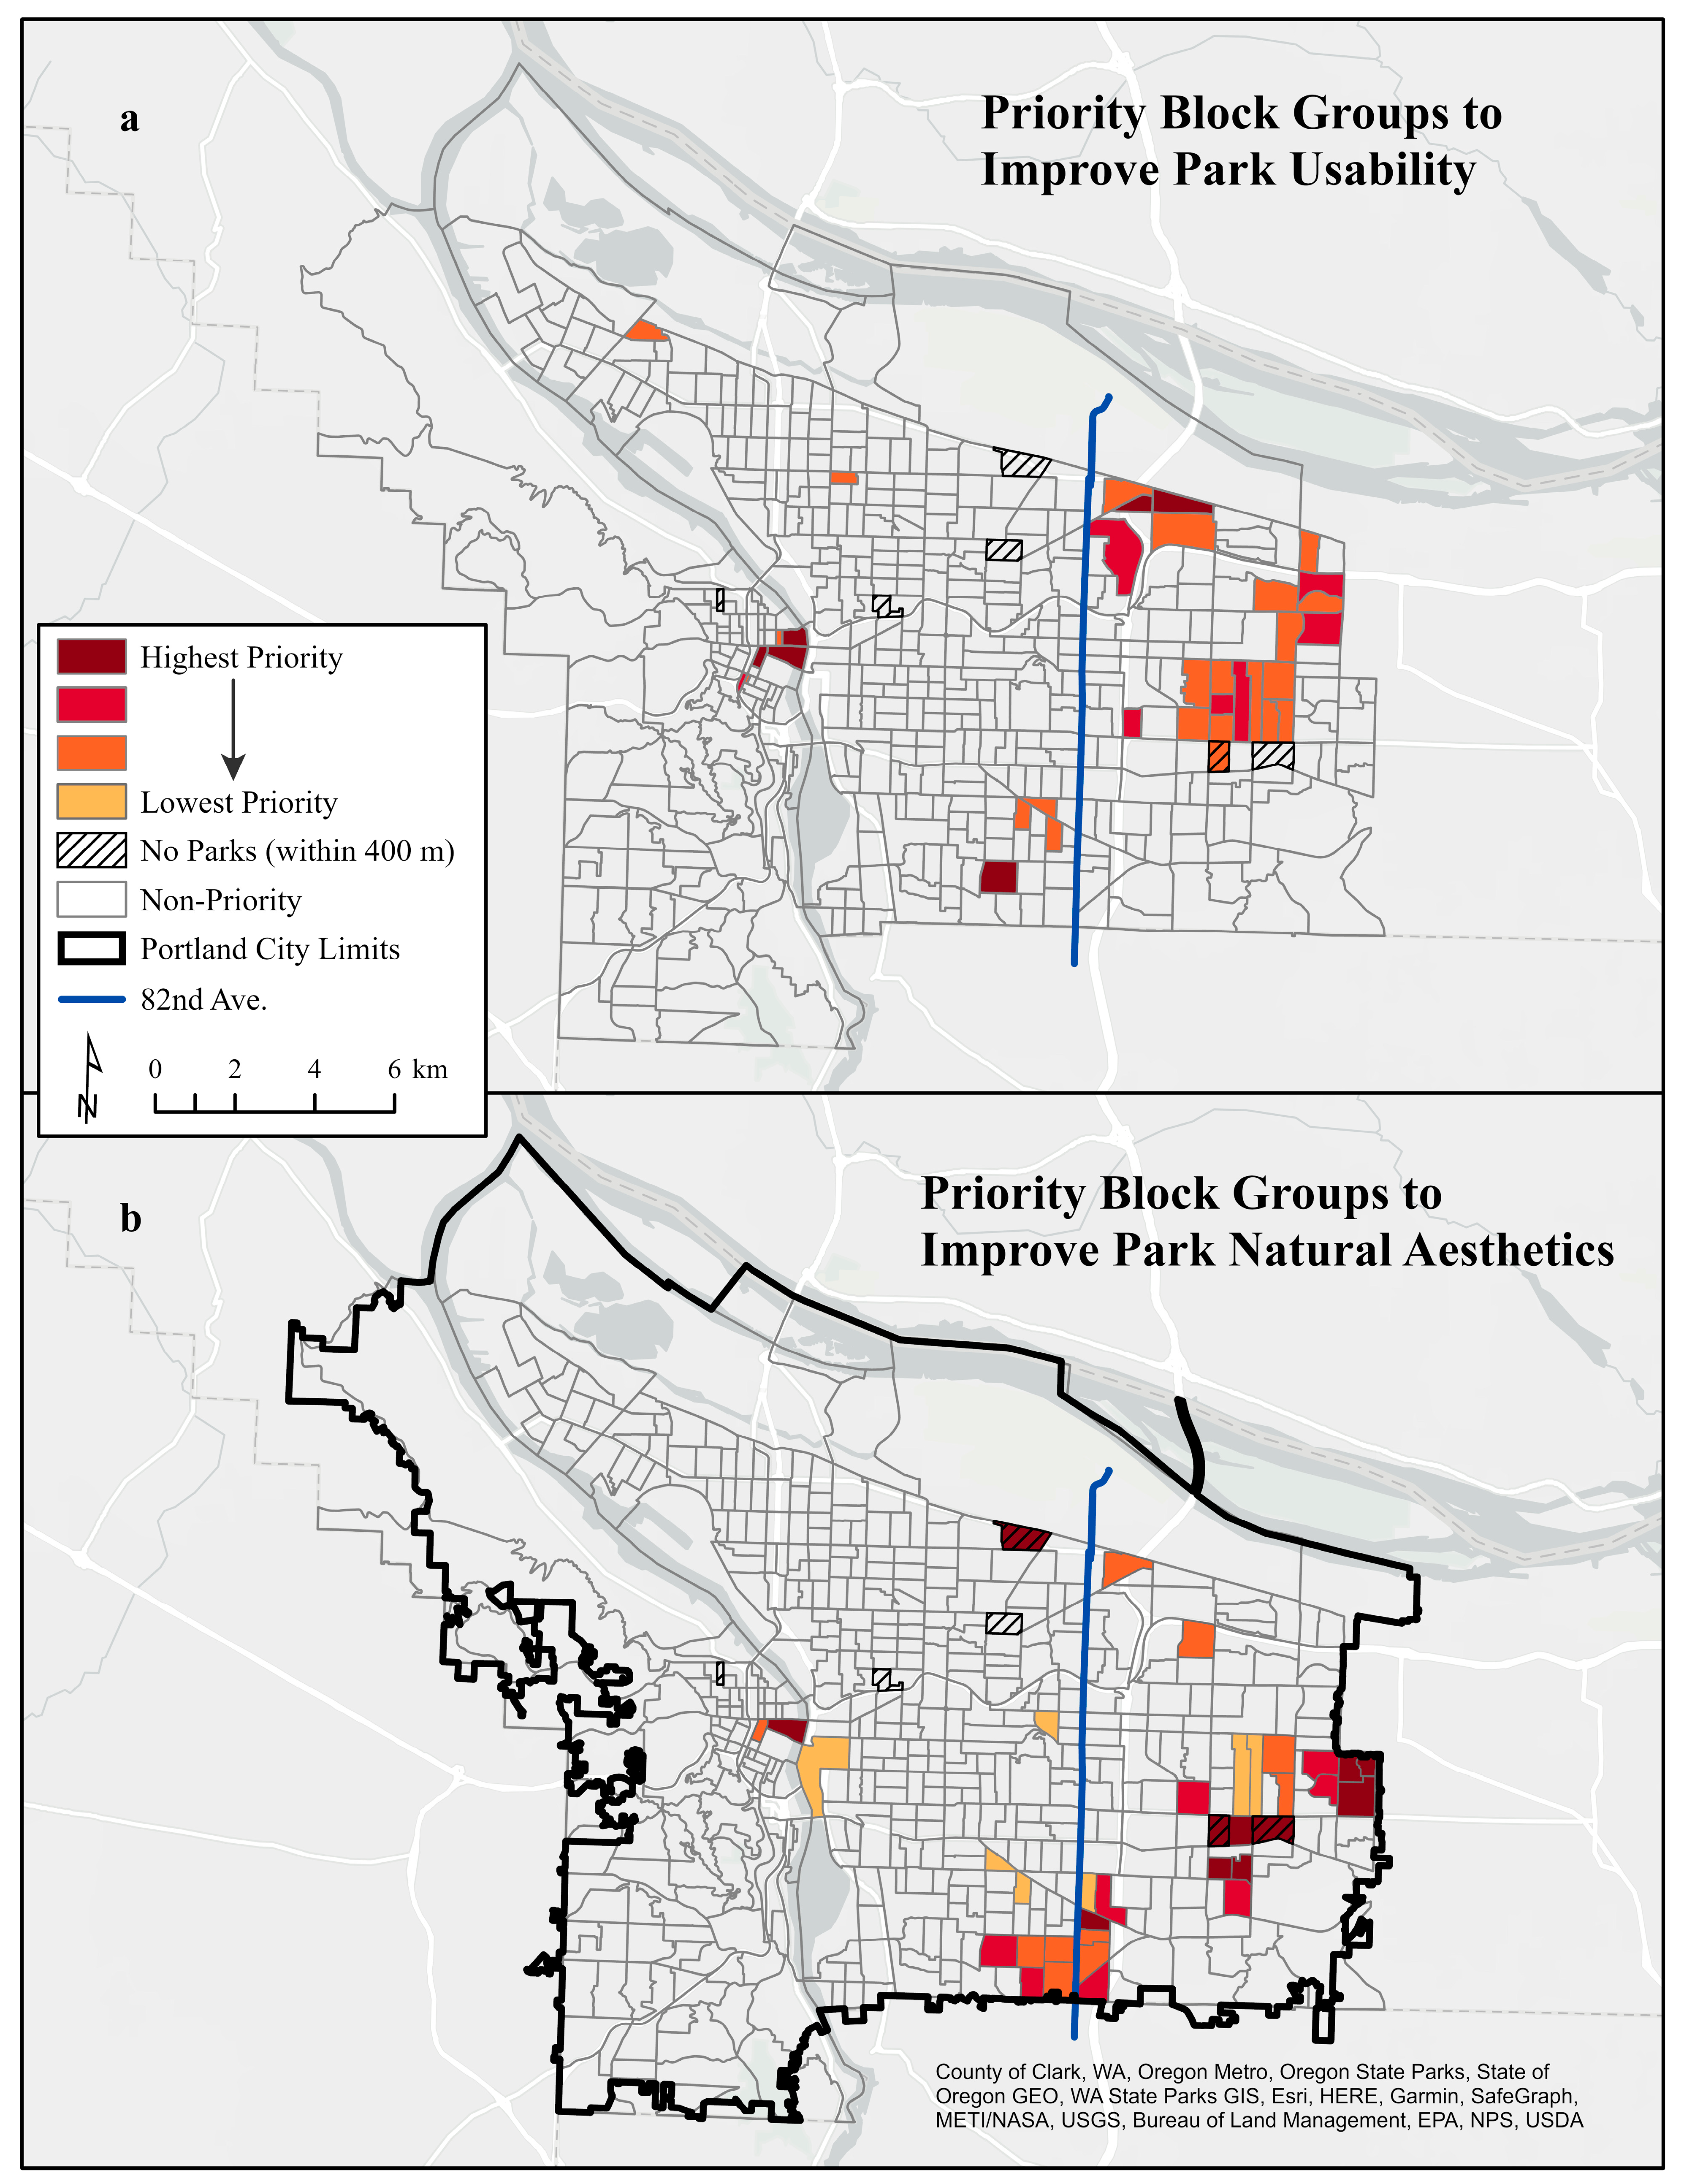
For park-based equity considerations, we generated maps locating priority block groups for improvements based on park tree canopy cover and NEST natural aesthetics, usability, and amenities domains (Figure 10 and Figure 11). We also created tables of park names that met the prioritization criteria for each park quality in question (e.g., for NEST amenities, the list includes parks within 400 m of block groups in the lower quartile for NEST amenities and the upper quartile for Hispanic/Latinx population; Tables S15–S18). In total, we identified 117 parks, 48 schoolyards, and 7 cemeteries that should be considered for park quality improvements. While this analysis provides a basis for assessing park equity and an example for how to identify priority areas for park development and improvement, greater insight into relationships between park access, park quality, neighborhood environment, and park use may arise from further analyses. This includes but is not limited to distribution of specific park programs and facilities, as well as consideration of potential barriers, such as street connectivity, traffic speed, sidewalk availability, and perceptions of safety [96,97]. In addition, park improvement planning should meaningfully involve and empower marginalized community members throughout decision-making processes and respond to their social, cultural, and recreational needs [27,98].
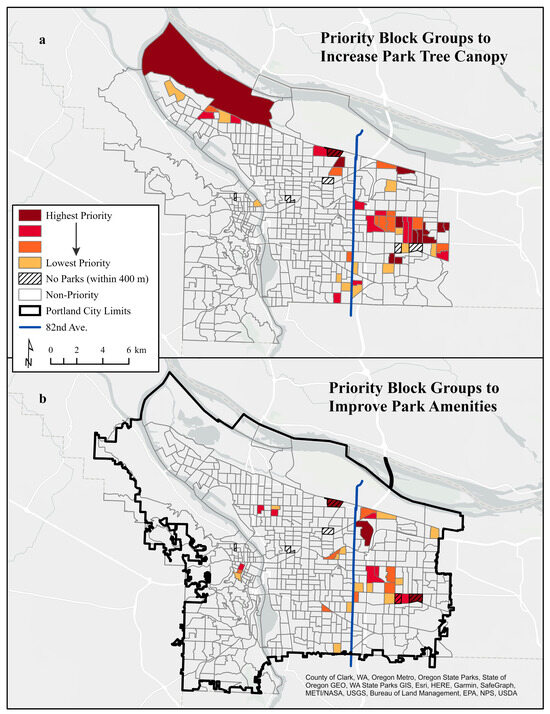
Figure 10.
Priority block groups for (a) parkland tree canopy expansion based on block group parkland tree canopy cover and percent of Hispanic/Latinx, and (b) park amenity enhancements based on block group Neighborhood Environment Scoring Tool (NEST) amenities domain scores, median household income, and percent of minoritized racial population.
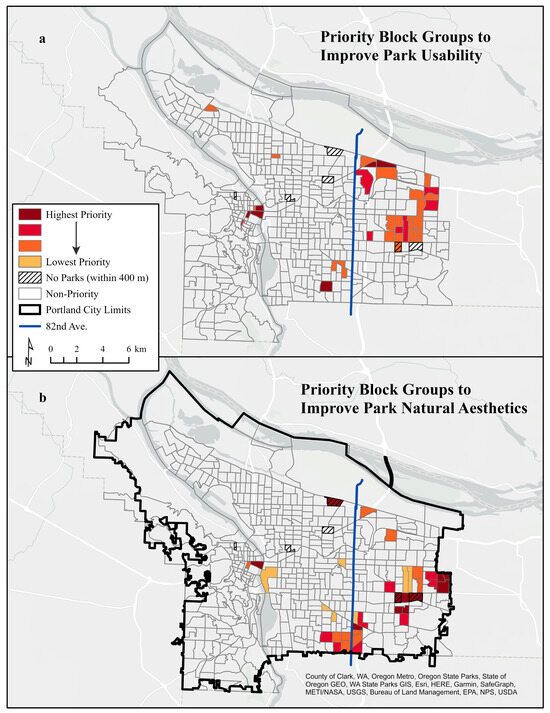
Figure 11.
Priority block groups to improve (a) park usability and (b) natural aesthetics; block group selection based on Neighborhood Environmental Scoring Tool (NEST) usability and natural aesthetics domain scores (a and b, respectively), as well as percent of block group population with no postsecondary education.
4.4. Beyond Distributional Justice: Considerations for Urban Green Space Policy and Planning
The findings and recommendations presented here are only a starting place for addressing disparities in urban green space exposure and access. We identified citywide distributional injustices related to urban green space access, as well as locations for potential urban green space investments to mitigate existing disparities. Yet, careful consideration of policy, planning, and procedural justice is necessary to identify and avoid potential unintended consequences of green space enhancement and expansion.
Increasing green space, whether parks or trees, in low-income and minoritized racial communities may contribute to neighborhood gentrification. The addition of parks and/or street trees can catalyze the restructuring of neighborhoods by increasing home values and rent costs, which may shift demographics, and force the displacement of particularly vulnerable residents [99,100,101,102,103]. Urban green space development may increase benefits for marginalized communities in the short term, but in the long term, these communities may face increased hardship associated with rent increases, displacement, relocation, or alienation. As stated by Gould and Lewis, “without clearly focused public policy intervention, in situ environmental improvements will tend to increase racial and class inequality, and decrease environmental justice” [102] (p. 114). These findings suggest the need to consider how marginalized populations are impacted by urban greening, both in the short and long term, and how housing policy might be used to protect against green gentrification.
Even urban greening initiatives intended to provide compensatory equity (e.g., providing more public tree assets or private tree care subsidies to low-income communities) have resulted in less equitable outcomes [104,105]. As cities consider implementing programs to improve tree equity, as is the case in Portland [48], these policies should include need-based criteria to effectively support low-income and low-canopy neighborhoods.
Finally, adherence to environmental justice requires urban green space planning processes to be led by and for the marginalized communities who lack equitable access to ecosystem services. Cities frequently express the importance of community participation in planning processes [48,49,106,107], and it is critical that public engagement strategies are inclusive of and responsive to perspectives from marginalized communities. Portland Parks and Recreation has made clear efforts to engage marginalized communities in the urban forest planning process through culturally specific focus groups and public surveys [48]. Results from survey responses and outreach efforts revealed barriers to tree planting in marginalized communities, which included a lack of accessible educational information, concerns over damages caused by trees, costs associated with tree planting and maintenance, and distrust of government agencies [48,108]. Participants and survey respondents highlighted the importance of culturally and linguistically specific outreach, using established and trusted community leaders or organizations, as well as financial assistance with costs of buying, planting, and maintaining trees [48,108]. The assessment provided in this study, in conjunction with the outreach conducted by Portland Parks and Recreation, provides an opportunity for more targeted urban green space improvements that address community concerns and promote urban environmental health equity.
5. Conclusions
This study established a process for assessing distributional injustices across a comprehensive suite of urban green space characteristics and tested this methodology to identify priority locations for specific urban green space investment in Portland, Oregon. Combining evaluations of green cover, park availability, and park quality into a single analytical approach allowed for a more complete understanding of urban green space inequities than if urban green space characteristics were considered independently. Additionally, generating separate green cover measures based on land-use type allowed for increasingly specific assessments of urban green space disparities. While our analyses did not reveal systematic park access inequities, and only minor park quality concerns, we found clear and compelling evidence of distributional injustices in Portland, Oregon related to tree canopy and green cover across various land uses based on race, ethnicity, income, and educational attainment. The strongest and most consistent urban green space disparities were associated with right-of-way tree canopy cover, even after accounting for elevation, urban form, and spatial clustering. These findings provide a foundation for equitable urban green space planning in Portland, Oregon, as well as an avenue for cities to identify and address distributional inequities.
Supplementary Materials
The following supporting information can be downloaded at https://www.mdpi.com/article/10.3390/land13060720/s1, Figure S1. All audited parks by park type; Figure S2. All audited parks by Neighborhood Environment Scoring Tool (NEST) overall score; Figure S3. Park availability; Figure S4. Green cover variables; Figure S5. Cumulative normalized difference vegetation index (NDVI); Figure S6. Green view index (GVI); Figure S7. Percent of block group population and cluster analysis (postsecondary education); Figure S8. Percent of block group population and cluster analysis (Hispanic/Latinx); Figure S9. Block group mean and cluster analysis (elevation); Figure S10. Block group mean and cluster analysis (neighborhood walkability index); Figure S11. Block group percent and cluster analysis (right-of-way green cover); Figure S12. Block group mean and cluster analysis (green view index); Figure S13. Block group percent and cluster analysis (total green cover); Figure S14. Block group mean and cluster analysis (normalized difference vegetation index); Figure S15. Block group percent and cluster analysis (private tree canopy canopy); Figure S16. Block group percent and cluster analysis (parkland tree canopy cover); Table S1. Urban form index factors; Table S2. Bivariate Spearman correlation matrix for green cover variables; Table S3. Summary of Spearman’s rank correlation coefficients (race, income, education, ethnicity, and green space); Table S4. Summary of Spearman’s rank correlation coefficients (elevation, neighborhood walkability index, and green space); Table S5. Ordinary least squares (OLS) models with one census variable; Table S6. Summary of spatial autoregressive (SAR) models with one Census variable (income); Table S7. Summary of spatial autoregressive (SAR) models with one Census variable (race); Table S8. Summary of spatial autoregressive (SAR) models with one Census variable (education); Table S9. Summary of spatial autoregressive (SAR) models with one Census variable (ethnicity); Table S10. Ordinary least squares (OLS) models with two census variables (both census variables with greater standardized regression coefficients than elevation and neighborhood walkability index); Table S11. Ordinary least squares (OLS) models with two census variables (one census variable with greater standardized regression coefficients than elevation and neighborhood walkability index); Table S12. Ordinary least squares (OLS) models with two census variables (elevation and/or neighborhood walkability index standardized regression coefficients greater than both census variables); Table S13. Summary of spatial autoregressive models (right-of-way green cover); Table S14. Summary of spatial autoregressive models (total tree canopy cover, green view index, and normalized difference vegetation index); Table S15. List of parks, schools, and cemeteries (located within 400 m of block group boundary) for block groups with low natural aesthetic scores and high percent population with low educational attainment; Table S16. List of parks, schools, and cemeteries (located within 800 m of block group boundary) for block groups with low parkland tree canopy within 800 m of block group boundary (i.e., lower quartile) and high Latinx population; Table S17. List of parks, schools, and cemeteries (located within 400 m of block group boundary) for block groups with low Neighborhood Environment Scoring Tool amenity domain scores and high racialized minority population or low median household income; Table S18. List of parks, schools, and cemeteries (located within 800 m of block group boundary) for block groups with low Neighborhood Environment Scoring Tool usability domain scores and high percent population without any postsecondary education.
Author Contributions
Conceptualization, E.E., K.R., Y.K., E.B. and C.E.; Data curation, E.E.; Formal analysis, E.E.; Investigation, E.E.; Methodology, E.E., K.R., Y.K., E.B. and C.E.; Project administration, E.E.; Resources, E.E.; Supervision, K.R. and C.E.; Validation, E.E. and Y.K.; Visualization, E.E.; Writing—original draft, E.E.; Writing—review and editing, E.E., K.R., Y.K., E.B., L.G. and C.E. All authors have read and agreed to the published version of the manuscript.
Funding
This research received no external funding.
Data Availability Statement
The original contributions presented in the study are included in the article, further inquiries can be directed to the corresponding author.
Acknowledgments
We thank Xiaojiang Li for helping debug Python code to calculate Green View Index (GVI). We thank the City of Portland Parks and Recreation staff for their willingness to correspond with the first author regarding their equity planning. This research was originally developed and written by Evan Elderbrock (first author) for his Ph.D. dissertation, Elderbrock, E. “No Walk in the Park: Urban Green Space Planning for Health Equity and Environmental Justice.” 2023. https://scholarsbank.uoregon.edu/xmlui/handle/1794/28491 (accessed on 12 May 2024).
Conflicts of Interest
The authors declare no conflicts of interest.
References
- World Health Organization. Constitution of the World Health Organization; WHO: Geneva, Switzerland, 2006. [Google Scholar]
- United Nations. World Urbanization Prospects 2018 Highlights; United Nations: New York, NY, USA, 2019. [Google Scholar]
- Liang, L.; Gong, P. Urban and Air Pollution: A Multi-City Study of Long-Term Effects of Urban Landscape Patterns on Air Quality Trends. Sci. Rep. 2020, 10, 18618. [Google Scholar] [CrossRef] [PubMed]
- Uejio, C.K.; Wilhelmi, O.V.; Golden, J.S.; Mills, D.M.; Gulino, S.P.; Samenow, J.P. Intra-Urban Societal Vulnerability to Extreme Heat: The Role of Heat Exposure and the Built Environment, Socioeconomics, and Neighborhood Stability. Health Place 2011, 17, 498–507. [Google Scholar] [CrossRef]
- Voelkel, J.; Shandas, V. Towards Systematic Prediction of Urban Heat Islands: Grounding Measurements, Assessing Modeling Techniques. Climate 2017, 5, 41. [Google Scholar] [CrossRef]
- Alcock, I.; White, M.P.; Wheeler, B.W.; Fleming, L.E.; Depledge, M.H. Longitudinal Effects on Mental Health of Moving to Greener and Less Green Urban Areas. Environ. Sci. Technol. 2014, 48, 1247–1255. [Google Scholar] [CrossRef] [PubMed]
- Bailey, A.W.; Allen, G.; Herndon, J.; Demastus, C. Cognitive Benefits of Walking in Natural versus Built Environments. World Leis. J. 2018, 60, 293–305. [Google Scholar] [CrossRef]
- Maas, J. Green Space, Urbanity, and Health: How Strong Is the Relation? J. Epidemiol. Community Health 2006, 60, 587–592. [Google Scholar] [CrossRef] [PubMed]
- Frank, L.D.; Schmid, T.L.; Sallis, J.F.; Chapman, J.; Saelens, B.E. Linking Objectively Measured Physical Activity with Objectively Measured Urban Form. Am. J. Prev. Med. 2005, 28, 117–125. [Google Scholar] [CrossRef] [PubMed]
- Sallis, J.F.; Cerin, E.; Conway, T.L.; Adams, M.A.; Frank, L.D.; Pratt, M.; Salvo, D.; Schipperijn, J.; Smith, G.; Cain, K.L.; et al. Physical Activity in Relation to Urban Environments in 14 Cities Worldwide: A Cross-Sectional Study. Lancet 2016, 387, 2207–2217. [Google Scholar] [CrossRef] [PubMed]
- Hockey, M.; Rocks, T.; Ruusunen, A.; Jacka, F.N.; Huang, W.; Liao, B.; Aune, D.; Wang, Y.; Nie, J.; O’Neil, A. Psychological Distress as a Risk Factor for All-Cause, Chronic Disease- and Suicide-Specific Mortality: A Prospective Analysis Using Data from the National Health Interview Survey. Soc. Psychiatry Psychiatr. Epidemiol. 2022, 57, 541–552. [Google Scholar] [CrossRef]
- Khomenko, S.; Cirach, M.; Pereira-Barboza, E.; Mueller, N.; Barrera-Gómez, J.; Rojas-Rueda, D.; De Hoogh, K.; Hoek, G.; Nieuwenhuijsen, M. Premature Mortality Due to Air Pollution in European Cities: A Health Impact Assessment. Lancet Planet. Health 2021, 5, e121–e134. [Google Scholar] [CrossRef]
- Shindell, D.; Zhang, Y.; Scott, M.; Ru, M.; Stark, K.; Ebi, K.L. The Effects of Heat Exposure on Human Mortality Throughout the United States. GeoHealth 2020, 4, e2019GH000234. [Google Scholar] [CrossRef] [PubMed]
- World Health Organization. Global Health Risks: Mortality and Burden of Disease Attributable to Selected Major Risks; WHO: Geneva, Switzerland, 2009. [Google Scholar]
- Marando, F.; Salvatori, E.; Sebastiani, A.; Fusaro, L.; Manes, F. Regulating Ecosystem Services and Green Infrastructure: Assessment of Urban Heat Island Effect Mitigation in the Municipality of Rome, Italy. Ecol. Model. 2019, 392, 92–102. [Google Scholar] [CrossRef]
- Mohajerani, A.; Bakaric, J.; Jeffrey-Bailey, T. The Urban Heat Island Effect, Its Causes, and Mitigation, with Reference to the Thermal Properties of Asphalt Concrete. J. Environ. Manag. 2017, 197, 522–538. [Google Scholar] [CrossRef] [PubMed]
- Murage, P.; Kovats, S.; Sarran, C.; Taylor, J.; McInnes, R.; Hajat, S. What Individual and Neighbourhood-Level Factors Increase the Risk of Heat-Related Mortality? A Case-Crossover Study of over 185,000 Deaths in London Using High-Resolution Climate Datasets. Environ. Int. 2020, 134, 105292. [Google Scholar] [CrossRef] [PubMed]
- Bai, T.; Mayer, A.; Shuster, W.; Tian, G. The Hydrologic Role of Urban Green Space in Mitigating Flooding (Luohe, China). Sustainability 2018, 10, 3584. [Google Scholar] [CrossRef] [PubMed]
- Kadaverugu, A.; Nageshwar Rao, C.; Viswanadh, G.K. Quantification of Flood Mitigation Services by Urban Green Spaces Using InVEST Model: A Case Study of Hyderabad City, India. Model. Earth Syst. Environ. 2021, 7, 589–602. [Google Scholar] [CrossRef]
- Nowak, D.J.; Dwyer, J.F. Understanding the Benefits and Costs of Urban Forest Ecosystems. In Urban and Community Forestry in the Northeast; Kuser, J.E., Ed.; Springer: Dordrecht, The Netherlands, 2007; pp. 25–46. ISBN 978-1-4020-4288-1. [Google Scholar]
- Nowak, D.J.; Hirabayashi, S.; Bodine, A.; Greenfield, E. Tree and Forest Effects on Air Quality and Human Health in the United States. Environ. Pollut. 2014, 193, 119–129. [Google Scholar] [CrossRef] [PubMed]
- Huang, S.; Qi, J.; Li, W.; Dong, J.; Van Den Bosch, C.K. The Contribution to Stress Recovery and Attention Restoration Potential of Exposure to Urban Green Spaces in Low-Density Residential Areas. Int. J. Environ. Res. Public Health 2021, 18, 8713. [Google Scholar] [CrossRef] [PubMed]
- Wolf, K.L.; Lam, S.T.; McKeen, J.K.; Richardson, G.R.A.; Van Den Bosch, M.; Bardekjian, A.C. Urban Trees and Human Health: A Scoping Review. Int. J. Environ. Res. Public Health 2020, 17, 4371. [Google Scholar] [CrossRef]
- Hunter, R.F.; Christian, H.; Veitch, J.; Astell-Burt, T.; Hipp, J.A.; Schipperijn, J. The Impact of Interventions to Promote Physical Activity in Urban Green Space: A Systematic Review and Recommendations for Future Research. Soc. Sci. Med. 2015, 124, 246–256. [Google Scholar] [CrossRef]
- Anguelovski, I. From Toxic Sites to Parks as (Green) LULUs? New Challenges of Inequity, Privilege, Gentrification, and Exclusion for Urban Environmental Justice. J. Plan. Lit. 2016, 31, 23–36. [Google Scholar] [CrossRef]
- Jennings, V.; Gaither, C. Approaching Environmental Health Disparities and Green Spaces: An Ecosystem Services Perspective. Int. J. Environ. Res. Public Health 2015, 12, 1952–1968. [Google Scholar] [CrossRef]
- Jennings, V.; Browning, M.H.E.M.; Rigolon, A. Urban Green Space at the Nexus of Environmental Justice and Health Equity. In Urban Green Spaces; SpringerBriefs in Geography; Springer International Publishing: Cham, Switzerland, 2019; pp. 47–69. ISBN 978-3-030-10468-9. [Google Scholar]
- Jennings, V.; Johnson Gaither, C.; Gragg, R.S. Promoting Environmental Justice Through Urban Green Space Access: A Synopsis. Environ. Justice 2012, 5, 1–7. [Google Scholar] [CrossRef]
- Rigolon, A. A Complex Landscape of Inequity in Access to Urban Parks: A Literature Review. Landsc. Urban Plan. 2016, 153, 160–169. [Google Scholar] [CrossRef]
- Walker, J.T.; Mowen, A.J.; Hendricks, W.W.; Kruger, J.; Morrow, J.R.; Bricker, K. Physical Activity in the Park Setting (PA-PS) Questionnaire: Reliability in a California Statewide Sample. J. Phys. Act. Health 2009, 6, S97–S104. [Google Scholar] [CrossRef]
- Gerrish, E.; Watkins, S.L. The Relationship between Urban Forests and Income: A Meta-Analysis. Landsc. Urban Plan. 2018, 170, 293–308. [Google Scholar] [CrossRef]
- Watkins, S.L.; Gerrish, E. The Relationship between Urban Forests and Race: A Meta-Analysis. J. Environ. Manag. 2018, 209, 152–168. [Google Scholar] [CrossRef]
- Mills, J.R.; Cunningham, P.; Donovan, G.H. Urban Forests and Social Inequality in the Pacific Northwest. Urban For. Urban Green. 2016, 16, 188–196. [Google Scholar] [CrossRef]
- Ock, Y.; Shandas, V.; Ribeiro, F.; Young, N. Drivers of Tree Canopy Loss in a Mid-Sized Growing City: Case Study in Portland, OR (USA). Sustainability 2024, 16, 1803. [Google Scholar] [CrossRef]
- Beyer, K.; Kaltenbach, A.; Szabo, A.; Bogar, S.; Nieto, F.; Malecki, K. Exposure to Neighborhood Green Space and Mental Health: Evidence from the Survey of the Health of Wisconsin. Int. J. Environ. Res. Public Health 2014, 11, 3453–3472. [Google Scholar] [CrossRef]
- Pham, T.-T.-H.; Apparicio, P.; Séguin, A.-M.; Landry, S.; Gagnon, M. Spatial Distribution of Vegetation in Montreal: An Uneven Distribution or Environmental Inequity? Landsc. Urban Plan. 2012, 107, 214–224. [Google Scholar] [CrossRef]
- Wen, M.; Zhang, X.; Harris, C.D.; Holt, J.B.; Croft, J.B. Spatial Disparities in the Distribution of Parks and Green Spaces in the USA. Ann. Behav. Med. 2013, 45, 18–27. [Google Scholar] [CrossRef] [PubMed]
- Astell-Burt, T.; Feng, X.; Mavoa, S.; Badland, H.M.; Giles-Corti, B. Do Low-Income Neighbourhoods Have the Least Green Space? A Cross-Sectional Study of Australia’s Most Populous Cities. BMC Public Health 2014, 14, 292. [Google Scholar] [CrossRef] [PubMed]
- Kaczynski, A.T.; Henderson, K.A. Environmental Correlates of Physical Activity: A Review of Evidence about Parks and Recreation. Leis. Sci. 2007, 29, 315–354. [Google Scholar] [CrossRef]
- Kaczynski, A.T.; Potwarka, L.R.; Saelens, B.E. Association of Park Size, Distance, and Features with Physical Activity in Neighborhood Parks. Am. J. Public Health 2008, 98, 1451–1456. [Google Scholar] [CrossRef] [PubMed]
- Barr, D.A. Health Disparities in the United States: Social Class, Race, Ethnicity, and the Social Determinants of Health, 3rd ed.; Johns Hopkins University Press: Baltimore, MD, USA, 2019; ISBN 978-1-4214-3258-8. [Google Scholar]
- Browning, M.H.E.M.; Locke, D.H.; Konijnendijk, C.; Labib, S.M.; Rigolon, A.; Yeager, R.; Bardhan, M.; Berland, A.; Dadvand, P.; Helbich, M.; et al. Measuring the 3-30-300 Rule to Help Cities Meet Nature Access Thresholds. Sci. Total Environ. 2024, 907, 167739. [Google Scholar] [CrossRef] [PubMed]
- Yan, L.; Jin, X.; Zhang, J. Equity in Park Green Spaces: A Bibliometric Analysis and Systematic Literature Review from 2014–2023. Front. Environ. Sci. 2024, 12, 1374973. [Google Scholar] [CrossRef]
- Konijnendijk, C.C. Evidence-Based Guidelines for Greener, Healthier, More Resilient Neighbourhoods: Introducing the 3–30–300 Rule. J. For. Res. 2023, 34, 821–830. [Google Scholar] [CrossRef] [PubMed]
- Cho, C.M. Study on Effects of Resident-Perceived Neighborhood Boundaries on Public Services Accessibility & Its Relation to Utilization: Using Geographic Information System, Focusing on the Case of Public Parks in Austin, Texas. Ph.D. Thesis, Texas A&M University, College Station, TX, USA, 2003. [Google Scholar]
- Liu, D.; Kwan, M.-P.; Kan, Z. Analysis of Urban Green Space Accessibility and Distribution Inequity in the City of Chicago. Urban For. Urban Green. 2021, 59, 127029. [Google Scholar] [CrossRef]
- Nesbitt, L.; Meitner, M.J.; Girling, C.; Sheppard, S.R.J.; Lu, Y. Who Has Access to Urban Vegetation? A Spatial Analysis of Distributional Green Equity in 10 US Cities. Landsc. Urban Plan. 2019, 181, 51–79. [Google Scholar] [CrossRef]
- Portland Parks & Recreation. Growing a More Equitable Urban Forest: Portland’s Citywide Tree Planting Strategy; Portland Parks & Recreation: Portland, OR, USA, 2018.
- Portland Parks & Recreation. Five-Year Racial Equity Plan; Portland Parks & Recreation: Portland, OR, USA, 2017.
- US Census Bureau QuickFacts: Portland City, Oregon. Available online: https://www.census.gov/quickfacts/portlandcityoregon (accessed on 13 November 2022).
- Portland Parks & Recreation. Tree Canopy Monitoring: Protocol and Monitoring from 2000–2020; Portland Parks & Recreation: Portland, OR, USA, 2022.
- Portland Parks & Recreation. Tree Canopy and Potential in Portland, Oregon; Portland Parks & Recreation: Portland, OR, USA, 2018.
- Flocks, J.; Escobedo, F.; Wade, J.; Varela, S.; Wald, C. Environmental Justice Implications of Urban Tree Cover in Miami-Dade County, Florida. Environ. Justice 2011, 4, 125–134. [Google Scholar] [CrossRef]
- Landry, S.M.; Chakraborty, J. Street Trees and Equity: Evaluating the Spatial Distribution of an Urban Amenity. Environ. Plan. Econ. Space 2009, 41, 2651–2670. [Google Scholar] [CrossRef]
- Mennis, J. Socioeconomic-Vegetation Relationships in Urban, Residential Land. Photogramm. Eng. Remote Sens. 2006, 72, 911–921. [Google Scholar] [CrossRef]
- US Census Bureau. Race, 2020 Census Redistricting Data; US Census Bureau: Suitland, MD, USA, 2022.
- US Census Bureau. Median Household Income in the Past 12 Months (in 2020 Inflation-Adjusted Dollars), 2016–2020; American Community Survey 5-Year Estimates; US Census Bureau: Suitland, MD, USA, 2022.
- US Census Bureau. Hispanic or Latino Origin by Race, 2016–2020, American Community Survey 5-Year Estimates; US Census Bureau: Suitland, MD, USA, 2022.
- US Census Bureau. Educational Attainment for the Population 25 Years and Over, 2016–2020, American Community Survey 5-Year Estimates; US Census Bureau: Suitland, MD, USA, 2022.
- US Census Bureau. TIGER/Line: Shapefiles; US Census Bureau: Suitland, MD, USA, 2021.
- Ekkel, E.D.; De Vries, S. Nearby Green Space and Human Health: Evaluating Accessibility Metrics. Landsc. Urban Plan. 2017, 157, 214–220. [Google Scholar] [CrossRef]
- Jones, A.; Hillsdon, M.; Coombes, E. Greenspace Access, Use, and Physical Activity: Understanding the Effects of Area Deprivation. Prev. Med. 2009, 49, 500–505. [Google Scholar] [CrossRef] [PubMed]
- Coombes, E.; Jones, A.P.; Hillsdon, M. The Relationship of Physical Activity and Overweight to Objectively Measured Green Space Accessibility and Use. Soc. Sci. Med. 2010, 70, 816–822. [Google Scholar] [CrossRef]
- Hoffimann, E.; Barros, H.; Ribeiro, A. Socioeconomic Inequalities in Green Space Quality and Accessibility—Evidence from a Southern European City. Int. J. Environ. Res. Public Health 2017, 14, 916. [Google Scholar] [CrossRef] [PubMed]
- Crawford, D.; Timperio, A.; Giles-Corti, B.; Ball, K.; Hume, C.; Roberts, R.; Andrianopoulos, N.; Salmon, J. Do Features of Public Open Spaces Vary According to Neighbourhood Socio-Economic Status? Health Place 2008, 14, 889–893. [Google Scholar] [CrossRef] [PubMed]
- Yang, Y.; Diez-Roux, A.V. Walking Distance by Trip Purpose and Population Subgroups. Am. J. Prev. Med. 2012, 43, 11–19. [Google Scholar] [CrossRef]
- Oregon Metro RLIS ORCA Sites. Available online: https://rlisdiscovery.oregonmetro.gov/datasets/98190a62a6b2495591965c0a0965be06/explore (accessed on 15 January 2021).
- Oregon Metro RLIS Schools. Available online: https://rlisdiscovery.oregonmetro.gov/datasets/cb227d8abb8c4f8096015dad43f28c6e/explore (accessed on 15 January 2021).
- Oregon Metro RLIS City Limits. Available online: https://rlisdiscovery.oregonmetro.gov/datasets/0e39ef7ea93f4f03a9a158c680b1bbf0/explore (accessed on 15 January 2021).
- Gidlow, C.; Van Kempen, E.; Smith, G.; Triguero-Mas, M.; Kruize, H.; Gražulevičienė, R.; Ellis, N.; Hurst, G.; Masterson, D.; Cirach, M.; et al. Development of the Natural Environment Scoring Tool (NEST). Urban For. Urban Green. 2018, 29, 322–333. [Google Scholar] [CrossRef]
- Handy, S.L.; Niemeier, D.A. Measuring Accessibility: An Exploration of Issues and Alternatives. Environ. Plan. Econ. Space 1997, 29, 1175–1194. [Google Scholar] [CrossRef]
- US EPA Data Download: Step 2. Available online: https://www.epa.gov/enviroatlas/data-download-step-2 (accessed on 24 March 2024).
- Rhew, I.C.; Vander Stoep, A.; Kearney, A.; Smith, N.L.; Dunbar, M.D. Validation of the Normalized Difference Vegetation Index as a Measure of Neighborhood Greenness. Ann. Epidemiol. 2011, 21, 946–952. [Google Scholar] [CrossRef]
- Google Street View Static API Overview. Available online: https://developers.google.com/maps/documentation/streetview/overview (accessed on 13 December 2020).
- Li, X.; Zhang, C.; Li, W.; Ricard, R.; Meng, Q.; Zhang, W. Assessing Street-Level Urban Greenery Using Google Street View and a Modified Green View Index. Urban For. Urban Green. 2015, 14, 675–685. [Google Scholar] [CrossRef]
- Li, X.; Ratti, C.; Seiferling, I. Mapping Urban Landscapes Along Streets Using Google Street View. In Advances in Cartography and GIScience; Peterson, M.P., Ed.; Lecture Notes in Geoinformation and Cartography; Springer International Publishing: Cham, Switzerland, 2017; pp. 341–356. ISBN 978-3-319-57335-9. [Google Scholar]
- Li, X.; Seiferling, I.; Cai, B.; Abdulhai, M.; So, W. Mittrees/Treepedia_Public. Available online: https://github.com/mittrees/Treepedia_Public (accessed on 11 November 2020).
- Harris, C.R.; Millman, K.J.; Van Der Walt, S.J.; Gommers, R.; Virtanen, P.; Cournapeau, D.; Wieser, E.; Taylor, J.; Berg, S.; Smith, N.J.; et al. Array Programming with NumPy. Nature 2020, 585, 357–362. [Google Scholar] [CrossRef]
- Jean, F. PyMeanShift. Available online: https://github.com/clememic/pymeanshift/blob/master/pymeanshift.py (accessed on 13 November 2020).
- USDA NAIP GeoHub. Available online: https://naip-usdaonline.hub.arcgis.com (accessed on 12 April 2021).
- Berland, A.; Schwarz, K.; Herrmann, D.; Hopton, M. How Environmental Justice Patterns Are Shaped by Place: Terrain and Tree Canopy in Cincinnati, Ohio, USA. Cities Environ. CATE 2015, 8, 1. [Google Scholar]
- USGS 1/3rd Arc-Second Digital Elevation Models (DEMs)—USGS National Map 3DEP Downloadable Data Collection. Available online: https://data.usgs.gov/datacatalog/data/USGS:3a81321b-c153-416f-98b7-cc8e5f0e17c3 (accessed on 24 March 2021).
- Pham, T.-T.-H.; Apparicio, P.; Landry, S.; Lewnard, J. Disentangling the Effects of Urban Form and Socio-Demographic Context on Street Tree Cover: A Multi-Level Analysis from Montréal. Landsc. Urban Plan. 2017, 157, 422–433. [Google Scholar] [CrossRef]
- Frank, L.D.; Sallis, J.F.; Conway, T.L.; Chapman, J.E.; Saelens, B.E.; Bachman, W. Many Pathways from Land Use to Health: Associations between Neighborhood Walkability and Active Transportation, Body Mass Index, and Air Quality. J. Am. Plann. Assoc. 2006, 72, 75–87. [Google Scholar] [CrossRef]
- Frank, L.D.; Saelens, B.E.; Powell, K.E.; Chapman, J.E. Stepping towards Causation: Do Built Environments or Neighborhood and Travel Preferences Explain Physical Activity, Driving, and Obesity? Soc. Sci. Med. 2007, 65, 1898–1914. [Google Scholar] [CrossRef]
- Schwarz, K.; Fragkias, M.; Boone, C.G.; Zhou, W.; McHale, M.; Grove, J.M.; O’Neil-Dunne, J.; McFadden, J.P.; Buckley, G.L.; Childers, D.; et al. Trees Grow on Money: Urban Tree Canopy Cover and Environmental Justice. PLoS ONE 2015, 10, e0122051. [Google Scholar] [CrossRef]
- Cohen, J. Statistical Power Analysis for the Behavioral Sciences; Lawrence Erlbaum Associates, Inc.: Hillsdale, NJ, USA, 1977; Volume 474, p. xv. ISBN 0-12-179060-6. [Google Scholar]
- Mishra, P.; Pandey, C.; Singh, U.; Gupta, A.; Sahu, C.; Keshri, A. Descriptive Statistics and Normality Tests for Statistical Data. Ann. Card. Anaesth. 2019, 22, 67. [Google Scholar] [CrossRef]
- Anselin, L. Spatial Econometrics: Methods and Models; Springer: Dordrecht, The Netherlands, 1988. [Google Scholar]
- Anselin, L. Exploring Spatial Data with GeoDa: A Workbook; Center for Spatially Integrated Social Science: Pacific Palisades, CA, USA, 2005. [Google Scholar]
- R Core Team. R: A Language and Environment for Statistical Computing. Available online: https://www.r-project.org/ (accessed on 24 March 2024).
- Bivand, R.S.; Wong, D.W.S. Comparing Implementations of Global and Local Indicators of Spatial Association. Test 2018, 27, 716–748. [Google Scholar] [CrossRef]
- Pebesma, E. Simple Features for R: Standardized Support for Spatial Vector Data. R J. 2018, 10, 439. [Google Scholar] [CrossRef]
- Pham, T.-T.-H.; Apparicio, P.; Landry, S.; Séguin, A.-M.; Gagnon, M. Predictors of the Distribution of Street and Backyard Vegetation in Montreal, Canada. Urban For. Urban Green. 2013, 12, 18–27. [Google Scholar] [CrossRef]
- Portland Parks & Recreation. Portland Urban Forestry Management Plan; Portland Parks & Recreation: Portland, OR, USA, 2004.
- Kaczynski, A.; Koohsari, M.; Stanis, S.W.; Bergstrom, R.; Sugiyama, T. Association of Street Connectivity and Traffic Speed with Park Usage and Park-Based Physical Activity. J. Sci. Med. Sport 2012, 15, S31. [Google Scholar] [CrossRef]
- Lapham, S.C.; Cohen, D.A.; Han, B.; Williamson, S.; Evenson, K.R.; McKenzie, T.L.; Hillier, A.; Ward, P. How Important Is Perception of Safety to Park Use? A Four-City Survey. Urban Stud. 2016, 53, 2624–2636. [Google Scholar] [CrossRef]
- Fors, H.; Hagemann, F.A.; Sang, Å.O.; Randrup, T.B. Striving for Inclusion—A Systematic Review of Long-Term Participation in Strategic Management of Urban Green Spaces. Front. Sustain. Cities 2021, 3, 572423. [Google Scholar] [CrossRef]
- Checker, M. Wiped Out by the “Greenwave”: Environmental Gentrification and the Paradoxical Politics of Urban Sustainability. City Soc. 2011, 23, 210–229. [Google Scholar] [CrossRef]
- Cole, H.V.S.; Lamarca, M.G.; Connolly, J.J.T.; Anguelovski, I. Are Green Cities Healthy and Equitable? Unpacking the Relationship between Health, Green Space and Gentrification. J. Epidemiol. Community Health 2017, 71, 1118–1121. [Google Scholar] [CrossRef]
- Donovan, G.H.; Prestemon, J.P.; Butry, D.T.; Kaminski, A.R.; Monleon, V.J. The Politics of Urban Trees: Tree Planting Is Associated with Gentrification in Portland, Oregon. For. Policy Econ. 2021, 124, 102387. [Google Scholar] [CrossRef]
- Gould, K.; Lewis, T. The Environmental Injustice of Green Gentrification: The Case of Brooklyn’s Prospect Park. In The World in Brooklyn: Gentrification, Immigration, and Ethnic Politics in a Global City; Lexington Books: Lanham, MD, USA, 2012; pp. 113–146. [Google Scholar]
- Wolch, J.R.; Byrne, J.; Newell, J.P. Urban Green Space, Public Health, and Environmental Justice: The Challenge of Making Cities ‘Just Green Enough’. Landsc. Urban Plan. 2014, 125, 234–244. [Google Scholar] [CrossRef]
- Locke, D.H.; Grove, J.M. Doing the Hard Work Where It’s Easiest? Examining the Relationships Between Urban Greening Programs and Social and Ecological Characteristics. Appl. Spat. Anal. Policy 2016, 9, 77–96. [Google Scholar] [CrossRef]
- Perkins, H.A.; Heynen, N.; Wilson, J. Inequitable Access to Urban Reforestation: The Impact of Urban Political Economy on Housing Tenure and Urban Forests. Cities 2004, 21, 291–299. [Google Scholar] [CrossRef]
- City of Los Angeles, Department of Recreation and Parks. 2009 Citywide Community Needs Assessment; City of Los Angeles, Department of Recreation and Parks: Los Angeles, CA, USA, 2009.
- City of New York Parks & Recreation. NYC Parks: Framework for an Equitable Future; City of New York Parks & Recreation: New York, NY, USA, 2014.
- Alves Carvalho Nascimento, L.; Shandas, V. Integrating Diverse Perspectives for Managing Neighborhood Trees and Urban Ecosystem Services in Portland, OR (US). Land 2021, 10, 48. [Google Scholar] [CrossRef]

Disclaimer/Publisher’s Note: The statements, opinions and data contained in all publications are solely those of the individual author(s) and contributor(s) and not of MDPI and/or the editor(s). MDPI and/or the editor(s) disclaim responsibility for any injury to people or property resulting from any ideas, methods, instructions or products referred to in the content. |
© 2024 by the authors. Licensee MDPI, Basel, Switzerland. This article is an open access article distributed under the terms and conditions of the Creative Commons Attribution (CC BY) license (https://creativecommons.org/licenses/by/4.0/).