Article

Evaluating Inequity in Access to Park-Based Physical Activity at the Sub-District Scale: A Case Study in Xianyang, China

College of Landscape Architecture and Arts, Northwest A&F University, Xianyang 712100, China
*
Author to whom correspondence should be addressed.
Land 2024, 13(12), 2179; https://doi.org/10.3390/land13122179
Submission received: 9 October 2024 / Revised: 16 November 2024 / Accepted: 11 December 2024 / Published: 13 December 2024

Abstract

:
Urban densification has heightened residents’ demand for equitable access to urban park services, particularly those that support physical activity (PA). This access is crucial for public health and sustainable urban development. We developed the Park-Based Physical Activity Composite Attractiveness Score (PCAS) to assess the supply and service equity of parks at the sub-district scale in the central city of Xianyang, western China. The average PCAS for all parks in the study area was 46, with 69% scoring below the benchmark of 60, indicating that the parks fail to meet residents’ PA needs. We found a significant imbalance in park distribution. The 14 sub-districts we measured had an average supply score of 42 and a demand score of 49, demonstrating a clustering of park services in areas with natural resources and higher socioeconomic status. While the overall park service level was found to be reasonably equitable (Gini coefficient of 0.38), a large gap in the sub-dimensional indicators point to inequities in park services. The following scenario optimization suggested that adding new parks could more effectively enhance equity and residents’ PA levels than simply increasing park facilities. Our results provide valuable insights for urban park planning and policy-making, and contribute to the development of more equitable and accessible park services to achieve public health objectives.

1. Introduction

As urbanization increases, urban parks not only provide ecological and economic benefits as green spaces [1], but also play a crucial role in improving residents’ physical and mental health [2,3], quality of life [4], and social equity [5], contributing to sustainability. In particular, urban parks enhance public health by increasing residents’ frequency and intensity of participating in physical activity (PA) [6]. According to The Lancet’s 2021 PA Series, millions of people worldwide develop chronic diseases each year due to insufficient PA, which accounts for over 7% of premature deaths annually [7]. In contrast, adequate PA can significantly reduce the risk of heart disease, hypertension, and certain cancers [8]. These functions make urban parks essential to achieve the United Nations Sustainable Development Goals (SDGs); for example, SDG 11.7 “Provide Access to Safe and Inclusive Green and Public Spaces” [9]. As quality green spaces enhance public health [10] and alleviate the pressure of urban life [11], studies on the social effects and equity of urban parks in PA are particularly important in urban planning [12].
Among the world’s nations, urban parks show significant differences in their social effects and equity. In developed countries such as the United States and Canada, substantial budgets are allocated for constructing advanced infrastructure and implementing rigorous environmental protection policies of urban parks. These efforts ensure that urban parks provide high-quality spaces for leisure, sports, and social activities [13]. In contrast, developing countries such as India face challenges with the distribution and accessibility of public parks, most notably in megacities like Bengaluru. These challenges arise from limited funding, inadequate policy support, and the significant impact of the caste system, especially for low-income neighborhoods and populations [14].
In an attempt to address these challenges, China has developed and implemented diverse methods to assess park equity and service capacity across many metropolitan areas. For example, Shanghai evaluated the adequacy of residents’ access to various urban public green spaces using the green accessibility index (GAI) [15]. Beijing used an improved two-step floating catchment area (2SFCA) method, combined with socio-economic data, to assess the equitable distribution of park resources [16]. The study in Nanjing analyzed changes in park accessibility through historical data to guide urban park planning and management [17]. However, studies on park equity and how park facilities promote residents’ PA in Chinese western cities are limited. Nevertheless, official statistics indicate that the per capita park green space in some western cities averages 5–8 m2, compared to 9–14 m2 in eastern cities, highlighting a significant disparity [18]. This uneven distribution shows the imbalance in the allocation of urban green space resources across various regions in China.
Socio-economic conditions and park characteristics significantly influence the social effects and equity of urban parks. Typically, parks located in urban centers with favorable socio-economic conditions are better maintained than those in suburban or low-income areas. These parks offer more leisure and recreational facilities for physical activities (PAs), resulting in greater social benefits [19]. For example, parks in high-income neighborhoods in central Beijing have significantly better accessibility, size, and quality than those in low-income areas. This disparity unfairly enables high-income residents to enjoy higher levels of park services and better public health environments [20]. In addition, studies indicated that larger and higher-quality parks provide residents with higher satisfaction in PA and more equitable services, effectively increasing the leisure activity hours [21].
To comprehensively assess urban park equity, it is instructive to have a multidimensional evaluation system that considers spatial and social factors to facilitate research progress. The United States has developed an effective system and been a global leader in assessing urban park equity. Currently, the ParkScore Index is the mainstream method in the U.S. for evaluating the comprehensive quality and equity of urban park systems. As of 2023, 12 versions of evaluation results have been released for park systems in the 100 most populous U.S. cities, based on 14 measurement criteria across five categories, i.e., area, investment, amenities, accessibility, and equity. In terms of methodology, it is important to note the data normalization process adopted for integrating data from multiple sources. The ParkScore results provide a comprehensive comparison of park service and equity across the 100 cities, and promote the positive development of park systems in the U.S. [22]. Indeed, the ParkScore Index also has certain limitations, such as the absence of indicators for directly assessing PA support. However, the evaluation of urban parks in China focuses more on one-dimensional methods that impact equity, such as Beijing’s 2SFCA for measuring accessibility, incremental scenario analysis for park size [23], and changes in park quality [24].
We developed an equity evaluation system of park services based on PA support. By analyzing the spatial distribution and differential characteristics of parks, we evaluated the supply and demand features of urban parks at the sub-district scale and assessed urban park service equity by using the Gini coefficient and location quotient. Xianyang in western China was selected as a case study to explore urban park service equity and enhance our understanding of inequities in access to park-based PA at the smallest urban management sub-district scale. Our goal was to answer the following questions: (1) how can a system for evaluating and scoring urban parks based on the promotion of park-based PA be established? (2) what is the spatial distribution of inequity in access to park-based PA at the sub-district scale? and (3) how can the results of inequity be used to optimize the urban park system of a medium-sized city such as Xianyang in western China?

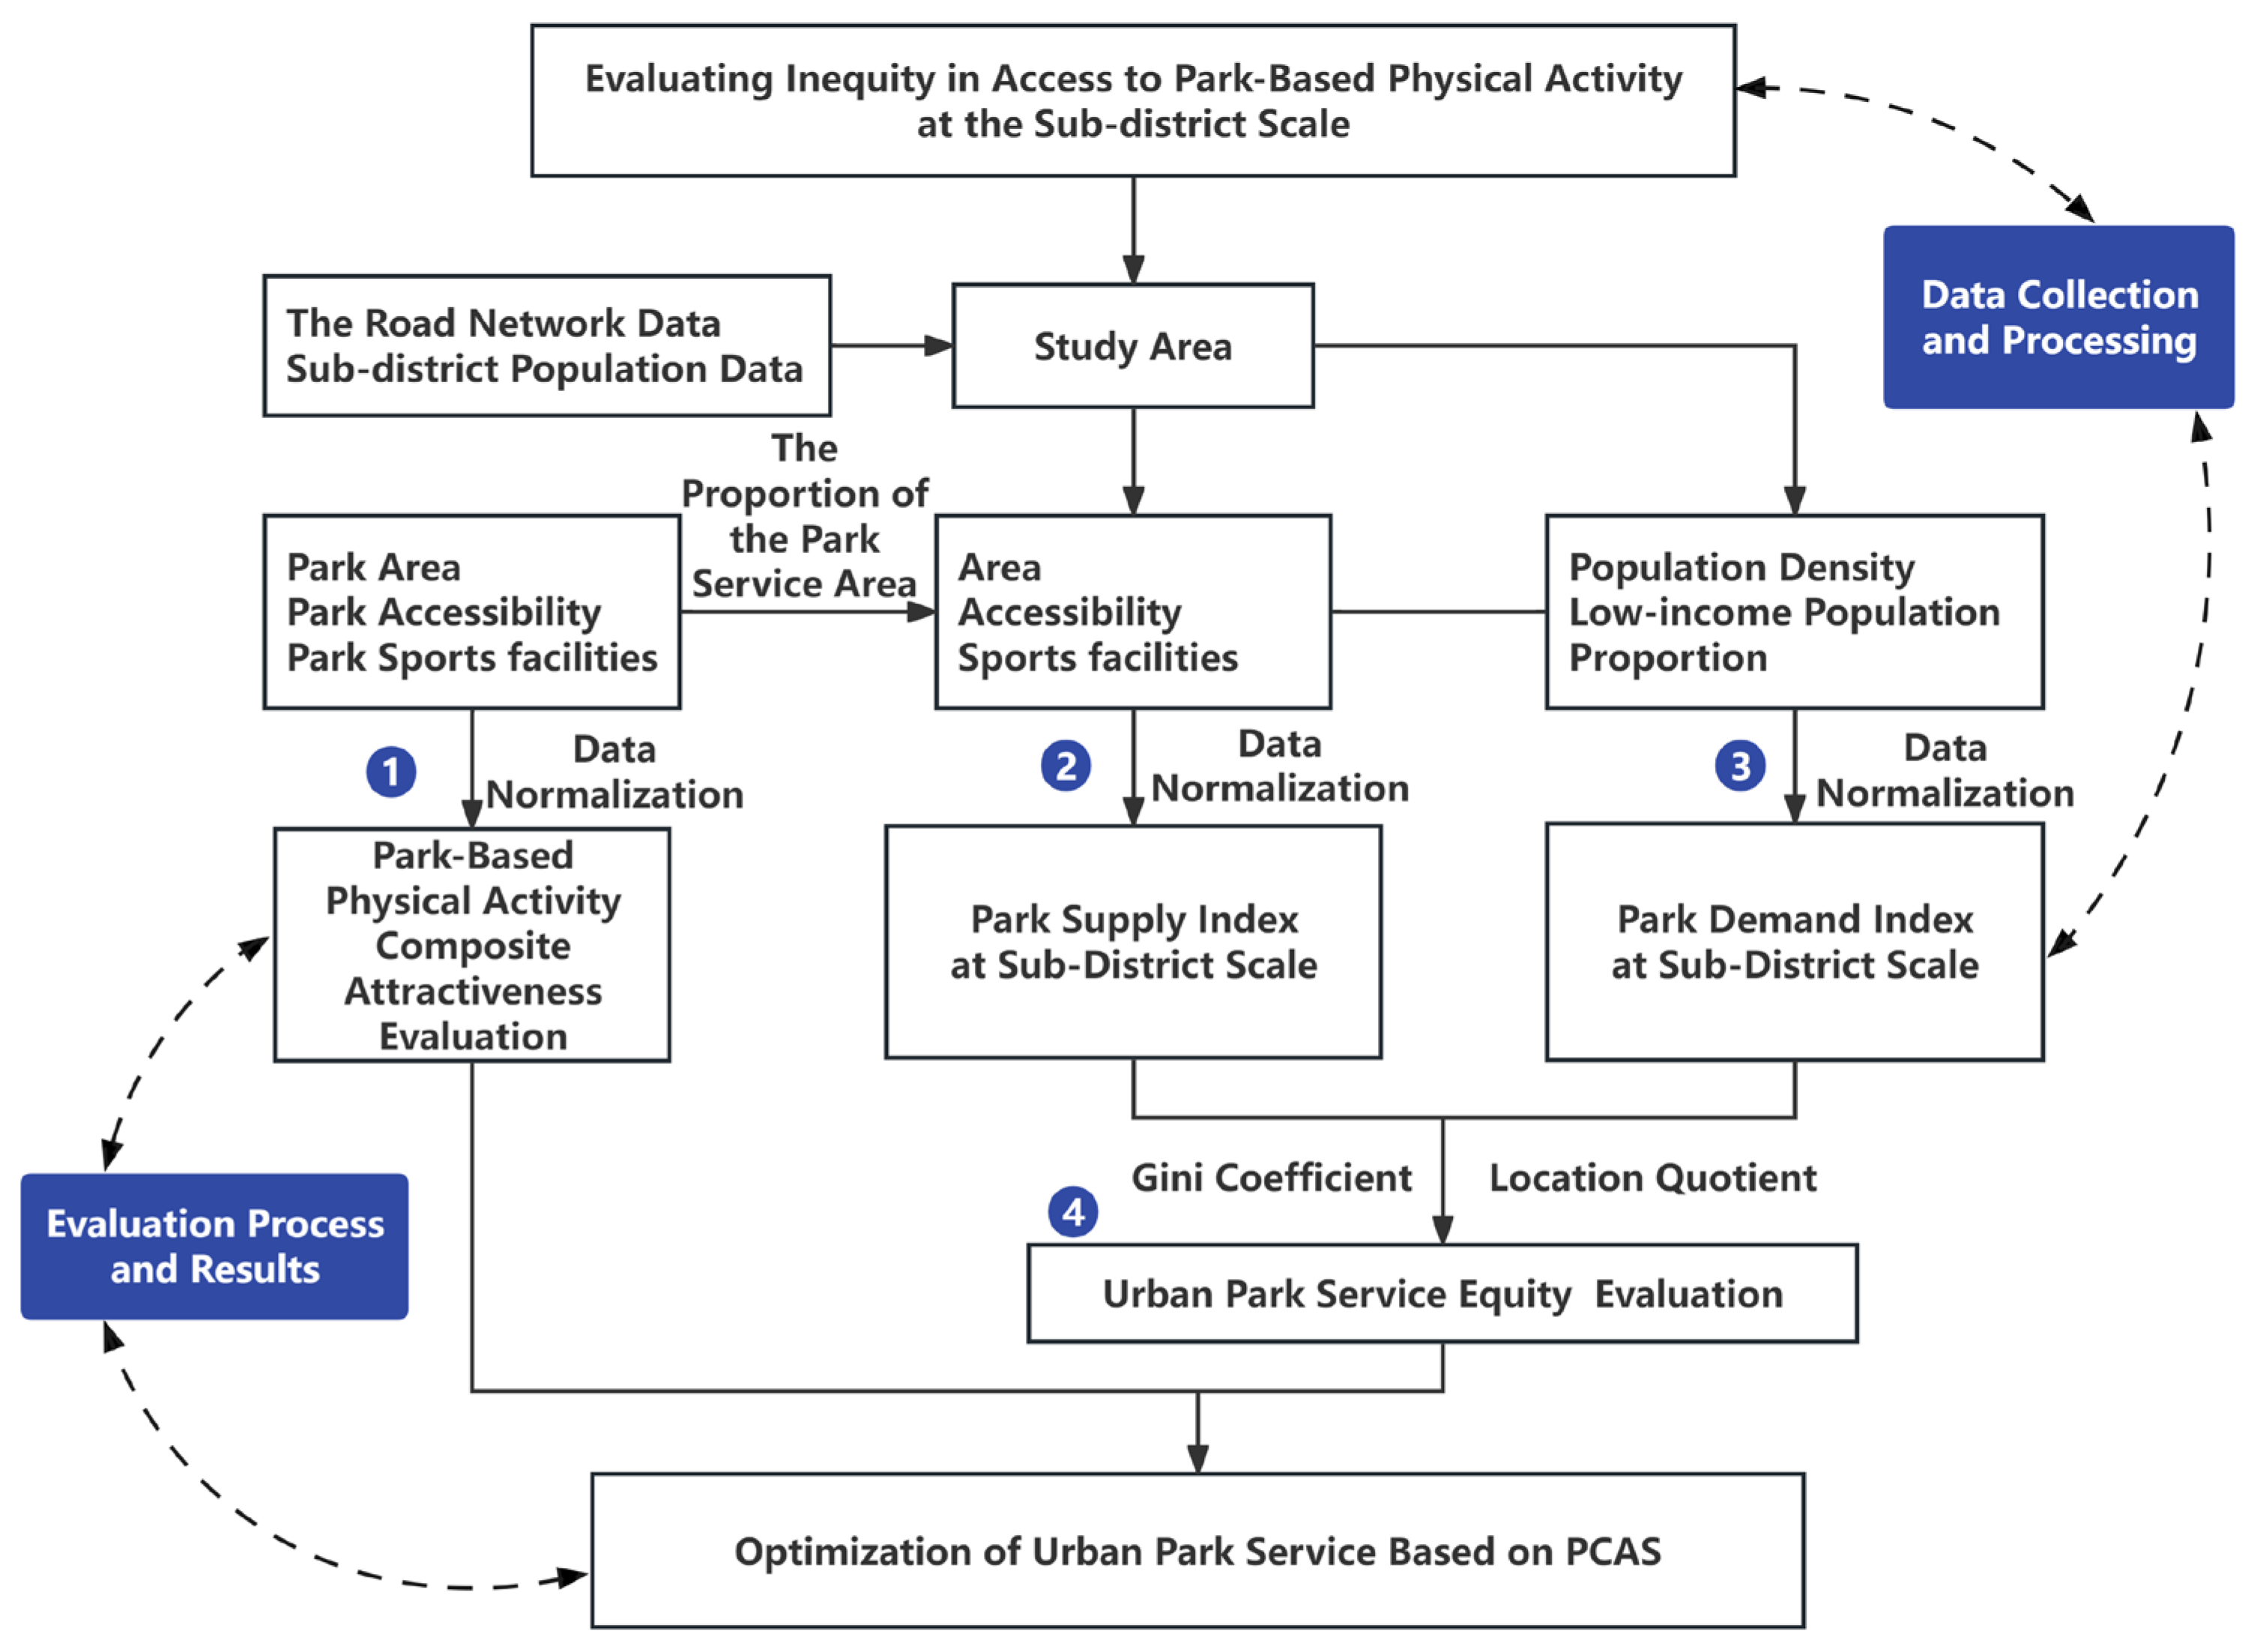
2. Materials and Methods
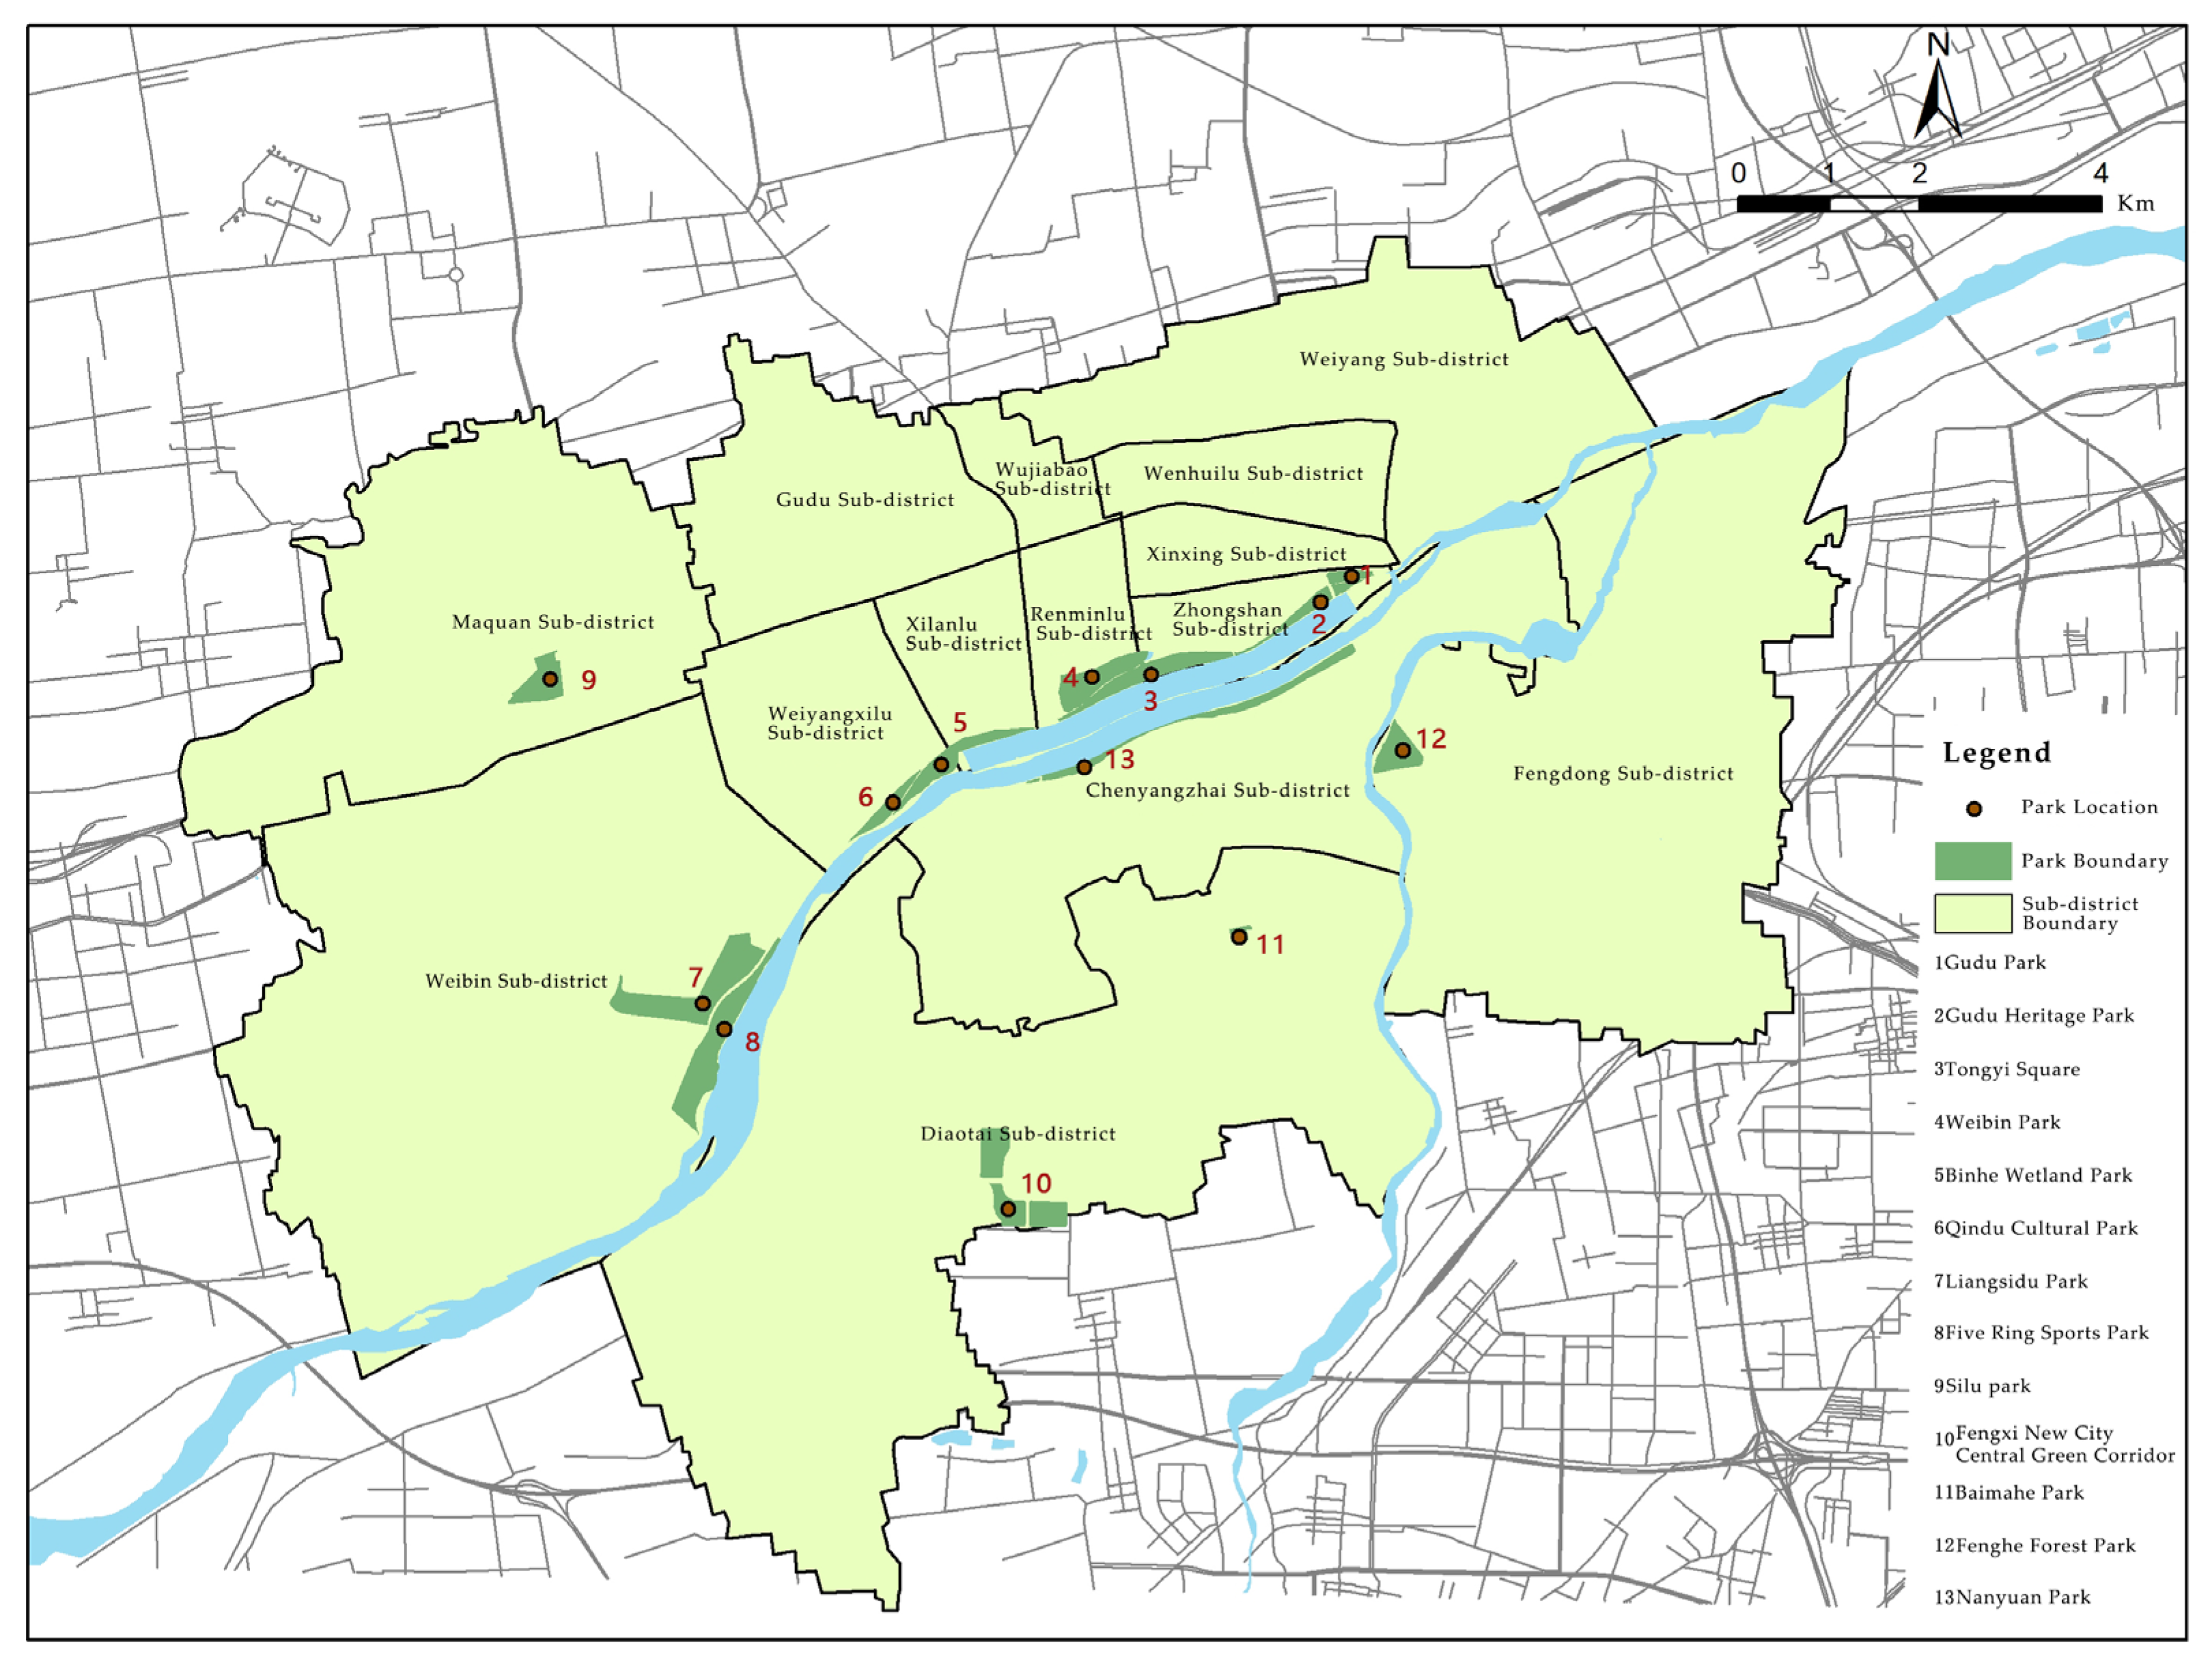
To quantitatively evaluate how the attributes of the park affect the PA behavior and environmental equity, we first determined and constructed an evaluation index including three dimensions of park area, park accessibility, and park sports facilities, i.e., the Park-Based Physical Activity Composite Attractiveness Score (PCAS) in this study. The data used to calculate the PCAS were normalized following the ParkScore normalization protocol. The second step involved linking potential users of urban parks with the PCAS to assess the supply and demand of park resources. The Park Supply Index (PSI) and Park Demand Index (PDI) were calculated to examine the equity of urban park service at the sub-district scale through the Gini coefficient and location quotient. The sub-district scale served as a practical administrative unit for analyzing the equity of urban park services in China. The final step naturally involved optimizing for identified equity issues. A scenario analysis was performed to enhance park equity in the selected study area (Figure 1).

2.1. Study Area

The study area was the central city of Xianyang, Shaanxi Province. The permanent resident population of Xianyang is the third highest in Shaanxi Province and is typical of medium-sized cities in northwest China. Northwest China, situated deep inland, has remote locations and relatively underdeveloped economic conditions compared to the eastern regions. According to the Urban Construction Statistical Yearbook published by the Ministry of Housing and Urban–Rural Development [25], the construction of green park space in northwest China and small-medium cities lags behind the national average, and the equity of park services results in prominent social contradictions. As of 2023, Xianyang has a permanent population of 4.12 million [26] and a green area of 5365 hectares [25]. According to public reports, the green area in Xianyang cannot effectively support residents’ PA and public health needs.
The central city of Xianyang city is determined in the “Xianyang City Master Plan (2011–2030)” [27] and includes 14 sub-districts under the jurisdiction of the Qindu District and Weicheng District. The Weihe River runs through the city from east to west, with 11 sub-districts to the north and 3 sub-districts to the south of the river. The study area includes 13 park types: 4 comprehensive parks, 7 special parks, and 2 community parks (Table 1). The number of parks is based on official information, adjusted after field investigation, and confirmed (Figure 2). Undeveloped or fee-based parks were excluded from our study.

2.2. Construction of Comprehensive Evaluation Scores

2.2.1. Park-Based Physical Activity Composite Attractiveness Score

The PCAS can be used to comprehensively evaluate attributes promoting PA in urban parks. Previous relevant scientific studies include park size, park accessibility, and park quality as components of evaluation indices. In comparison, the index of park quality has received more attention, specifically including activity facilities, amenities, environmental quality or aesthetics, and safety (e.g., EAPRS, POST) [29]. The PCAS is comprised of park area, park accessibility and park sports facilities indices (Table 2), and it had a positive correlation with the engagement of park-based PA.

2.2.2. Park Supply Index and Park Demand Index at Sub-District Scale

Urban park services at the sub-district scale can be measured by comparing the PSI and PDI. The PSI can usually be evaluated in three dimensions: park number and area, accessibility/proximity, and park quality [30]. In our study, the PSI was evaluated based on park area, accessibility, and sports facilities to calculate the PCAS.
Accessibility reflects the transit accessibility for residents getting into parks at the sub-district scale, and sports facilities showed the quality and attractiveness of parks at the sub-district scale. Following the methods of Chen et al. [31], we calculated the PSI of the 14 sub-districts based on the proportion of the park service area in the sub-districts (details in Table 3) and the PCAS index.
The PDI was composed of population density and low-income population proportion [32]. Population density referred to the ratio of the total sub-district population to the sub-district area, representing the residents’ need to access park services. The proportion of low-income population was the ratio of the number of residents whose housing value was lower than the study area median relative to the total sub-district population to measuring the degree of residents’ disadvantage to access park services.

2.3. Procedures for Evaluating Urban Park Service Based on PA Support

2.3.1. Data Acquisition

Park boundaries were verified on location and park area was mapped and calculated in BIGEMAP [33].
Park accessibility was measured by population within the service area using network analysis (i.e., coverage model [34]). First, we built a database of sub-district and population data in ArcMap 10.7. Second, we input the location and area of the park, with 1000 m as the service radius (10–15 min walking distance for adults), defined the area 200 m from the park boundary as the center, and used urban streets to calculate park service area. Finally, the spatial data of population were overlaid to represent park accessibility. The road network data of the 14 sub-districts in the study area were obtained and processed from the National Geographic Information Dataset [35]. Sub-district population data were estimated by the POI (Point of Interest) of residential community provided by Lianjia Net [36] and the Seventh National population Census data [37].
Indicators of park sports facilities consisted of five types of activity site area: sports fields, multi-functional squares, national fitness stations, children’s physical activity fields, and children’s amusement areas. Site diversity index was also included in this evaluation.
The site diversity index was modified from the Hill numbers index, which can objectively reflect the richness of five types of activity sites and the evenness of site distribution. The index was the most commonly used tool for measuring mixed land use. The calculation equation is as follows [38]:
D = 1 / i = 1 n P 1 i
where D is the site diversity index, n is the number of site types, and P 1 i is the relative diversity of the ith site, expressed as the site area ratio.
Field measurements of park facility types, quantities, and occupied areas were conducted by a trained research team using a UniStrong-A5 handheld GPS device (manufactured by Beijing UniStrong Science & Technology Co., Ltd., Beijing, China). The data collection took place over four days in November 2022, with a team of ten researchers divided into four groups. Each group recorded the types and quantities of activity facilities within their designated park areas. The facility areas were determined by averaging three repeated GPS measurements to ensure accuracy. Only activity sites available to park users during the field visits were included in the measurements to reflect actual usage. The records and measurement results are provided in Appendix A Table A1.

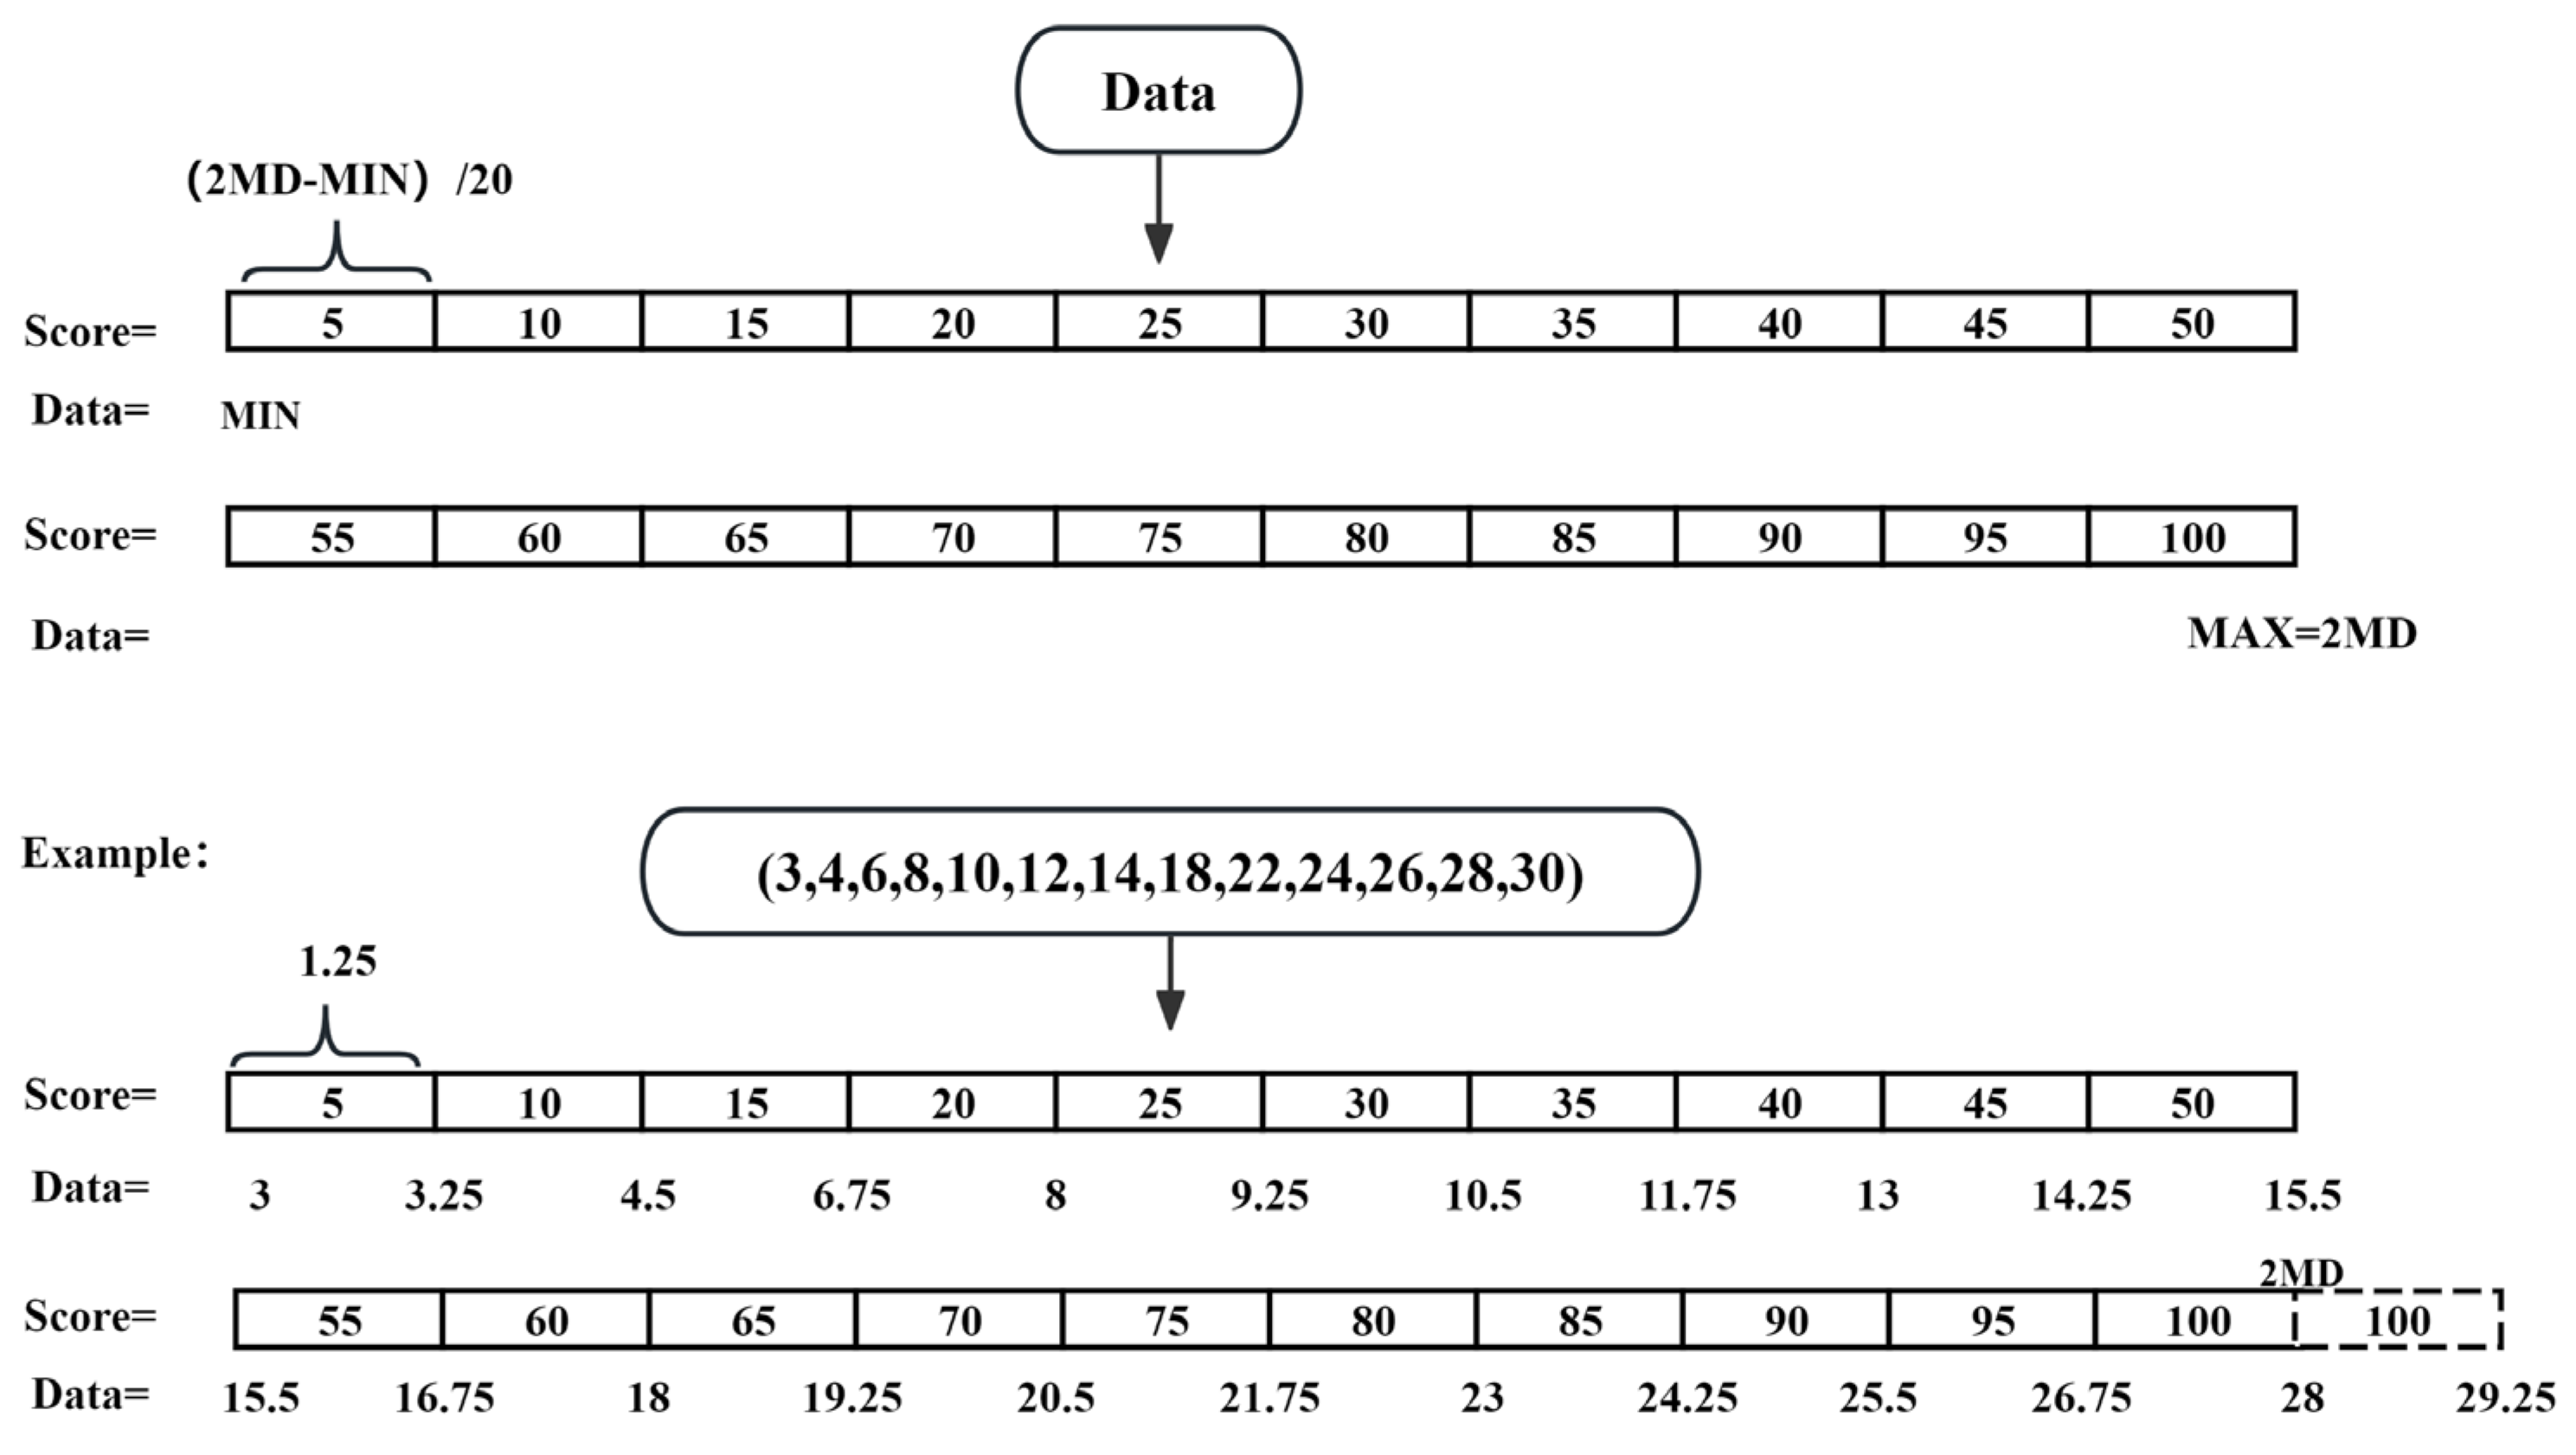
2.3.2. Data Normalization

Park area, accessibility and sports facilities were normalized based on the normalization process of the ParkScore index developed by the Trust for Public Land (TPL: U.S.A.) [22]. The ParkScore index includes five evaluation categories (area, investment, convenience, accessibility, and equity) and is a good reference to calculate PCAS.
The normalization process included three steps. First, raw data were assigned a zero score if they were a null value. Second, non-null data were sorted to calculate the median to avoid scoring distortion if the data have large variation and data exceeding twice the median were assigned a maximum score of 100. Finally, the sorted non-null data below or equal to twice the median were divided into 20 equal parts assigned 5–100 scores with an interval of five.
An example of the scoring process was shown in Figure 3, including 13 values ranging from 3 to 30 with a median of 14.

2.3.3. Gini Coefficient and Location Quotient of Urban Park Services

Several methods have been used to assess the equity of urban park services: Gini coefficient, location quotient (LQ), and spatial auto-correlation analysis, as examples. We chose the Gini coefficient (Table 4) and LQ to measure the inequity and the spatial distribution of urban park services to promote park-based PA based on population characteristics at sub-district scales.
A LQ value less than one indicates that the park service level is lower than the average at the sub-district scale (i.e., undersupply). Conversely, an LQ value higher than one indicates an oversupply. The calculation equation of LQ is as follows [39]:
L Q i = T i / P 2 i T / P 2
where L Q i is the locational quotient of sub-district i , T i is the supply score of sub-district i , P 2 i is the demand score of sub-district i , T is the median of the supply score, and P 2 is the median of the demand score.

2.3.4. Optimization of Urban Park Service Based on PCAS

The goal of optimizing urban park service equity is to mitigate the disparities in access to green spaces that meet the needs of local populations in sub-districts. We used a scenario analysis approach [40] to develop an optimization framework, sequentially addressing the expansion of park areas, enhancement of accessibility, and augmenting sports facilities (Figure 4). The study focused specifically on Xianyang City, a medium-sized city characterized by limited land in its original and growth area. In recent years, investments in new parks have primarily targeted the construction of new districts, leading to green space inequity in the old urban area. In this context, the process uses two strategies: optimizing the service capacity of existing parks and selecting locations for new green park spaces. The increase in the PSI served as both the desired outcome and evaluation criterion during optimization.
We developed a strategic framework for systematically enhancing park services, including four optimization scenarios. Scenario I prioritized the strategic selection of new park locations to increase the total park area, using the median park size as a benchmark, as informed by the PCAS. Scenario II used the buffer zone technique to refine park accessibility calculations, with the aim of mitigating the limitations imposed by urban road networks on park service areas and promote a more equitable distribution of green spaces. Scenarios III and IV expanded on improvements established in Scenarios I and II, further enhancing the park environment by adding sports facilities. These latter scenarios were informed by the median score of sports facilities within the PCAS, ensuring that the enhancements were targeted and responsive to community needs.

3. Results

The results include the PCAS of 13 urban parks within the study area (Section 3.1), the distribution characteristics of supply and demand at the sub-district scale (Section 3.2), and the equity of park services (Section 3.3). Based on these findings, recommendations for park optimization and planning were proposed (Section 3.4).

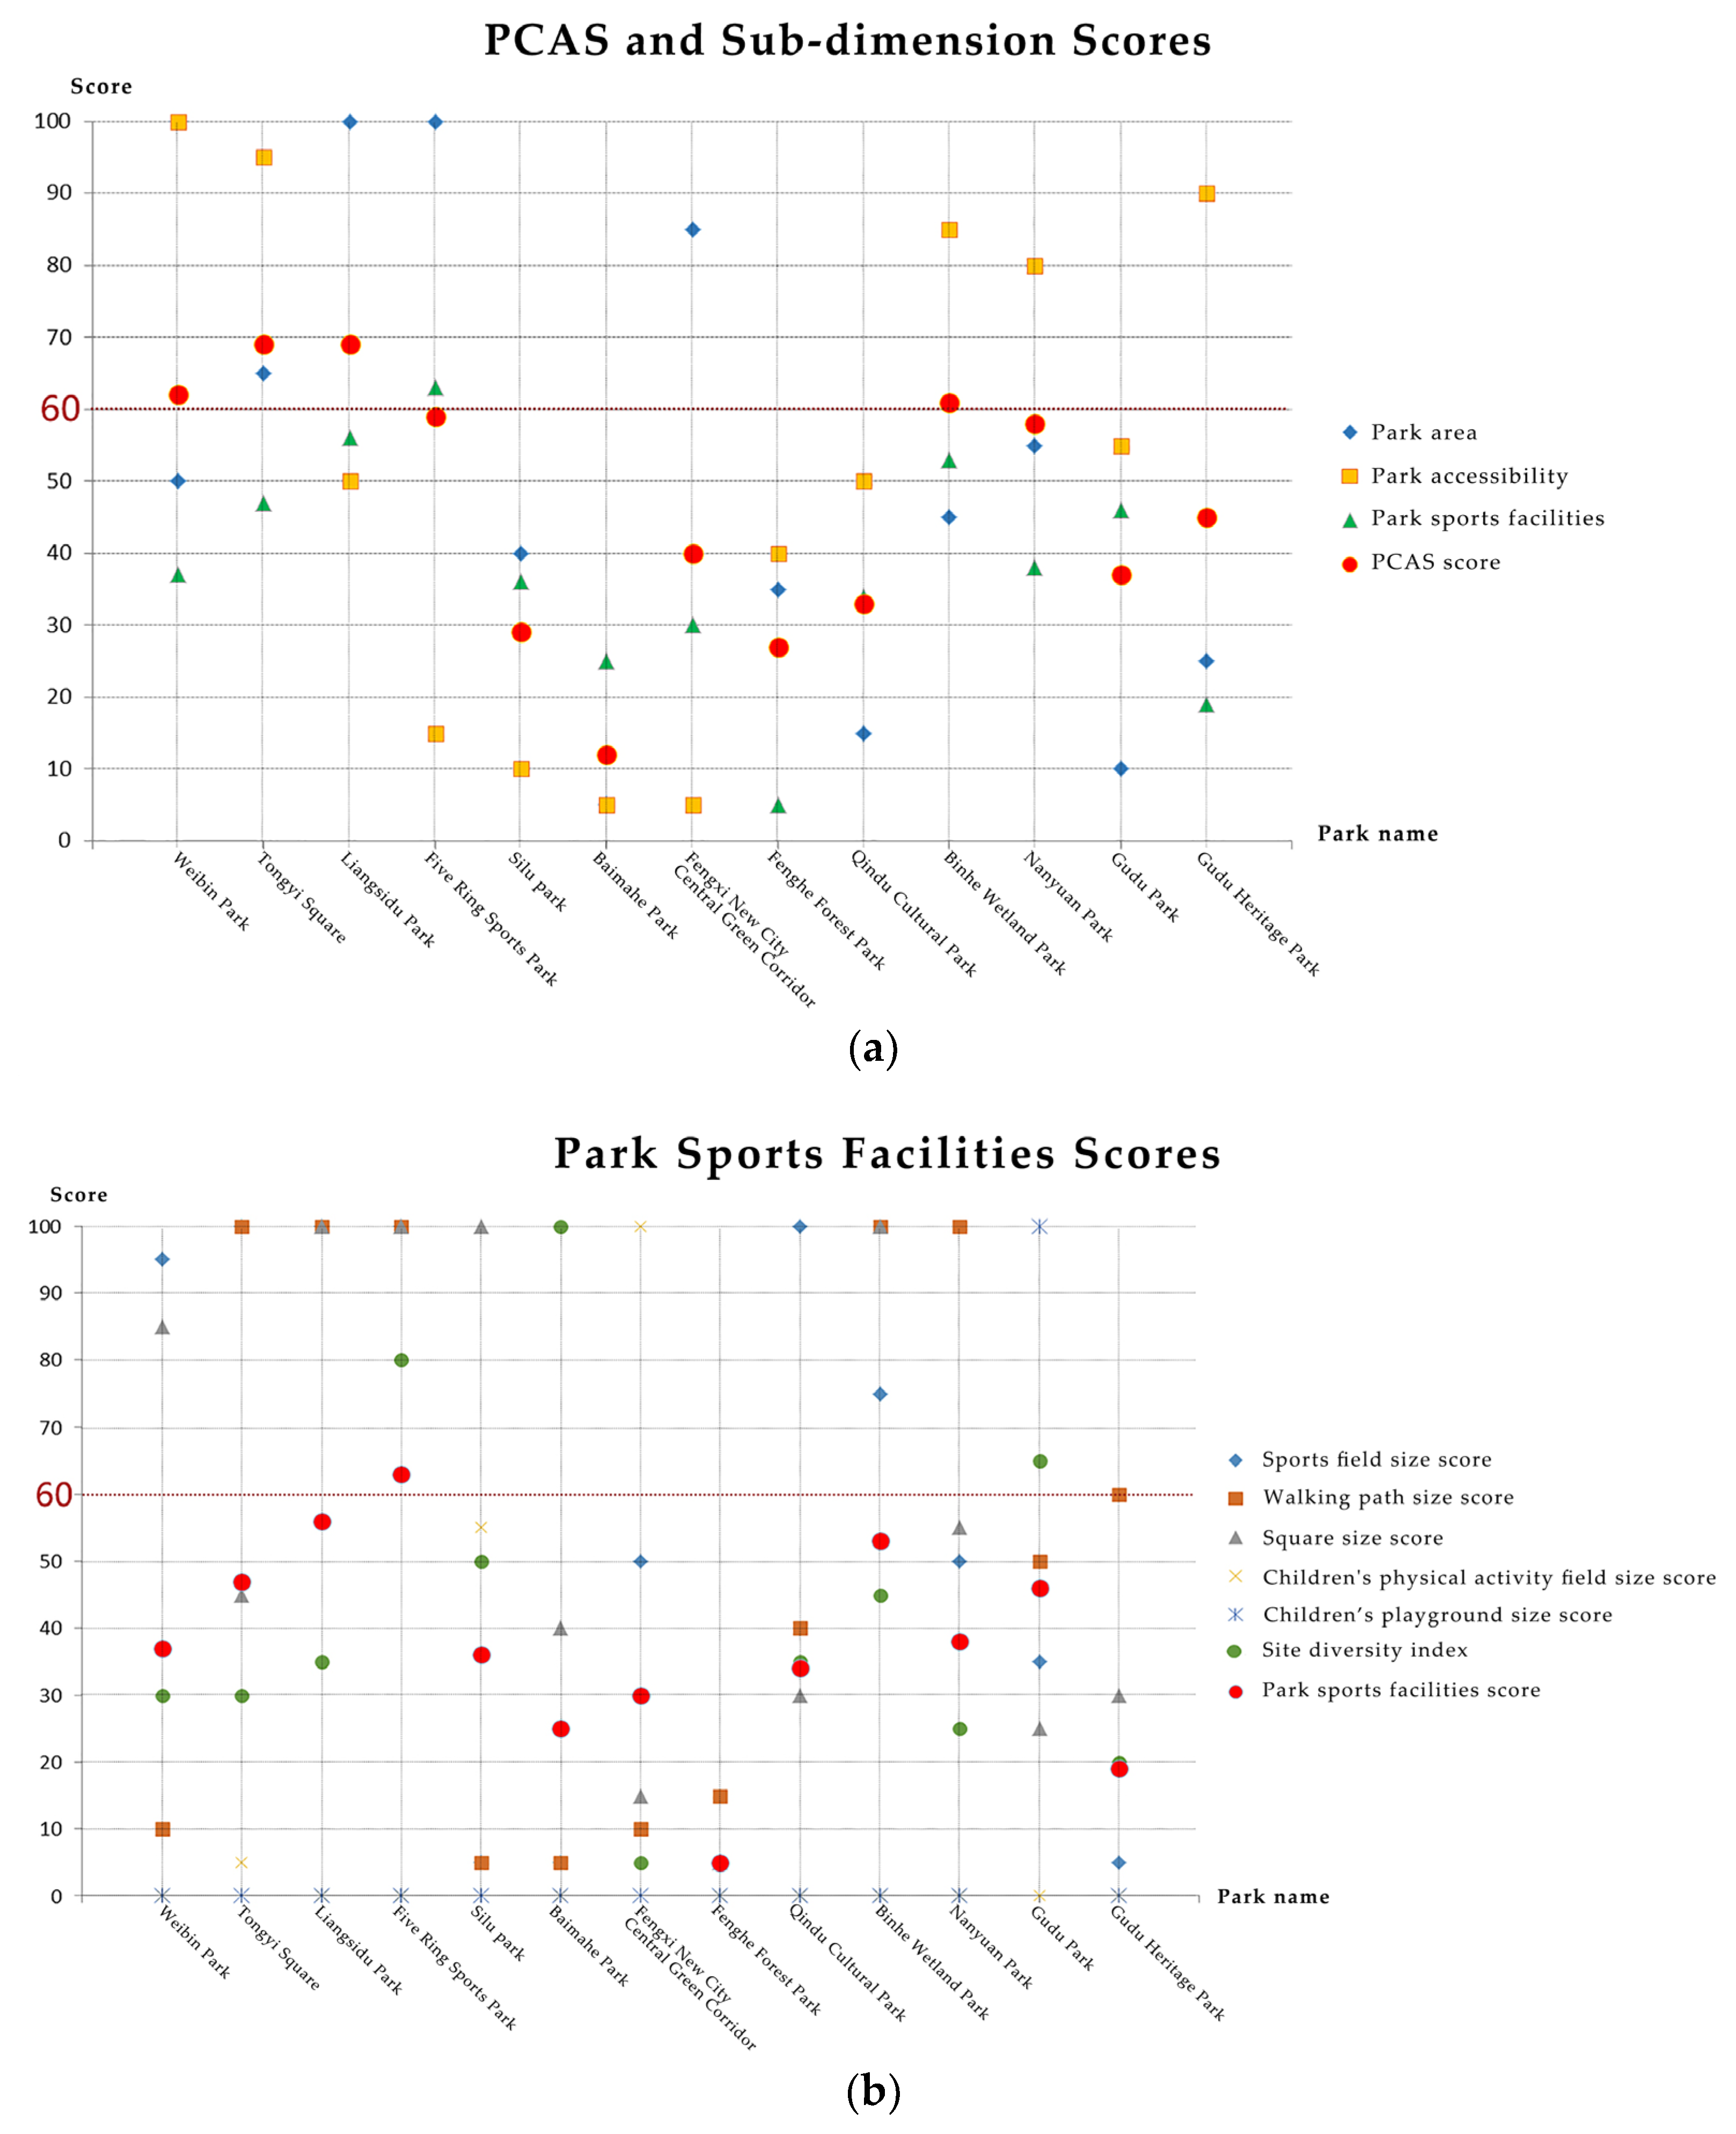
3.1. Results of PCAS

(1)
The composite attractiveness score for the 13 parks was 46 (SD = 18, range = 12–69). Except for Tongyi Square (69), Liangsidu Park (69), Weibin Park (62), and Binhe Wetland Park (61), the remaining 69% of parks scored below the qualified benchmark 60. Among the scores of each dimension, park area and park accessibility were 48 (SD = 32, range = 5–100) and 52 (SD = 36, range = 5–100) with 69% and 62% below 60. Park sports facilities’ score was 38 (SD = 16, range = 5–63) with 92% below 60 (Figure 5a).
(2)
The Five Rings Sports Park had the highest score but only 63 park facilities. The average scores for the index of park sports facilities were sports fields (56), multi-functional squares (56), national fitness stations (53), children’s physical activity fields (12), and children’s amusement areas (8). Figure 5b shows 77% and 92% of the parks lacked areas for children’s physical activity fields and amusement areas.

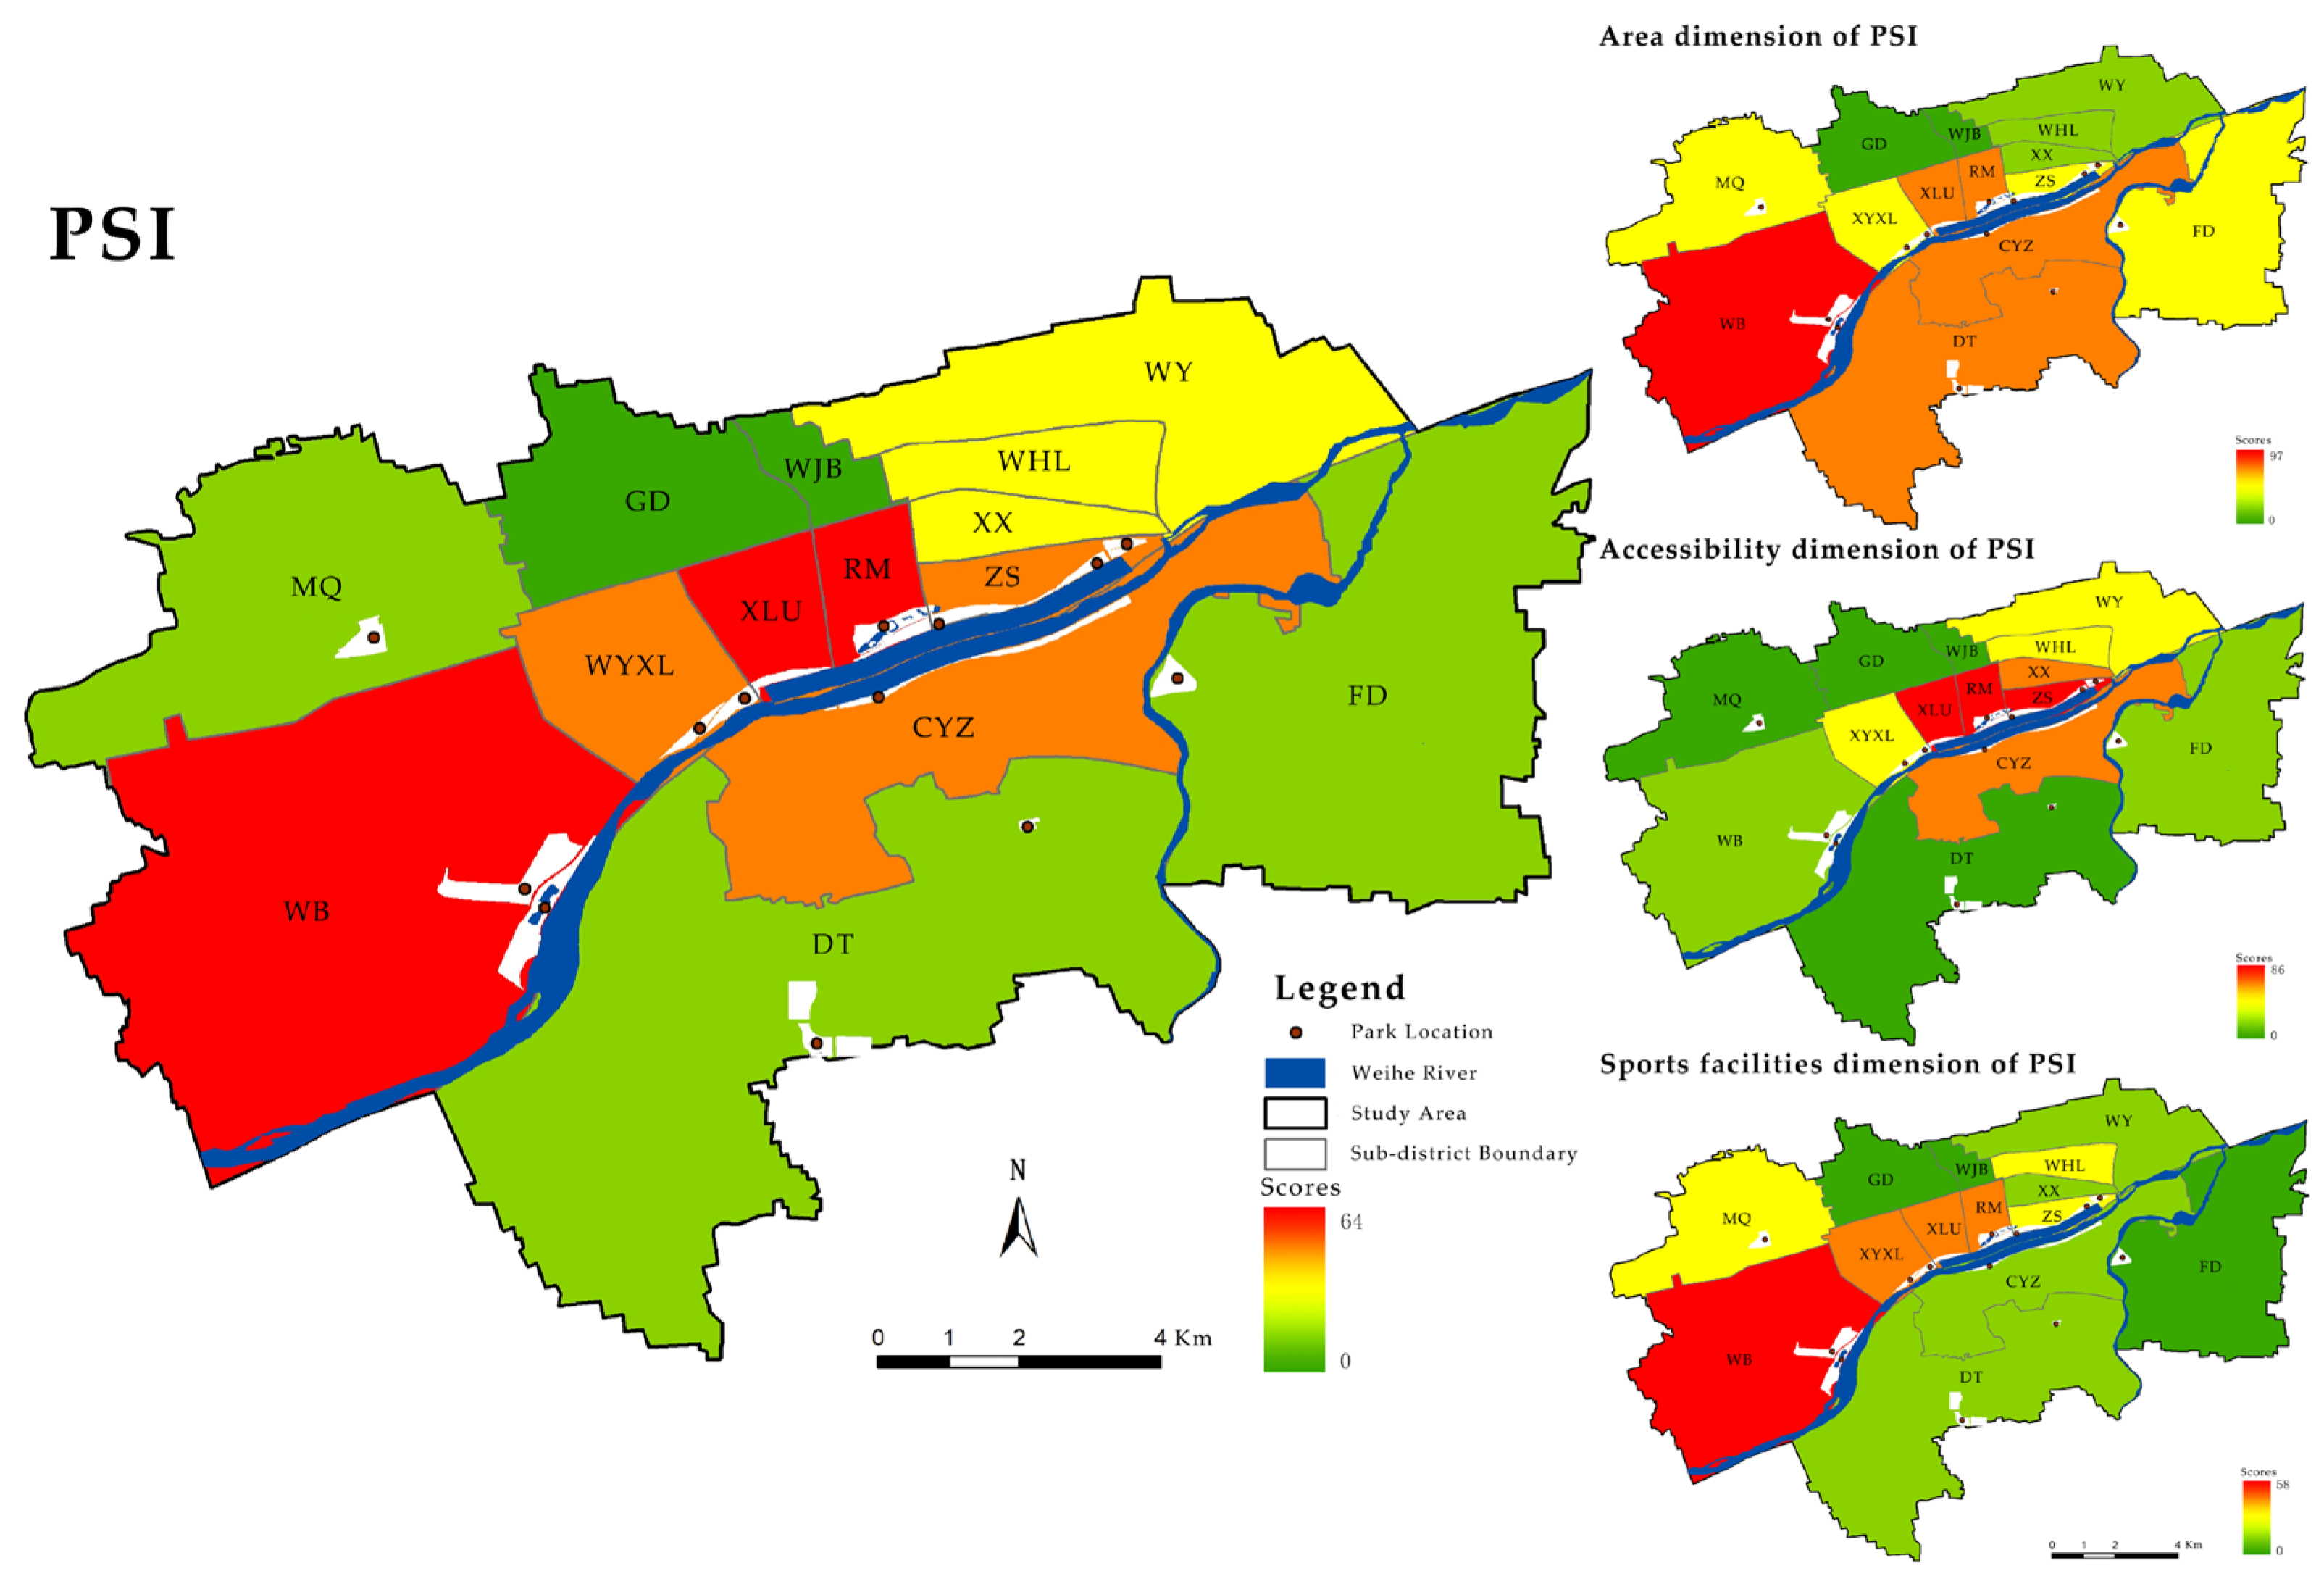
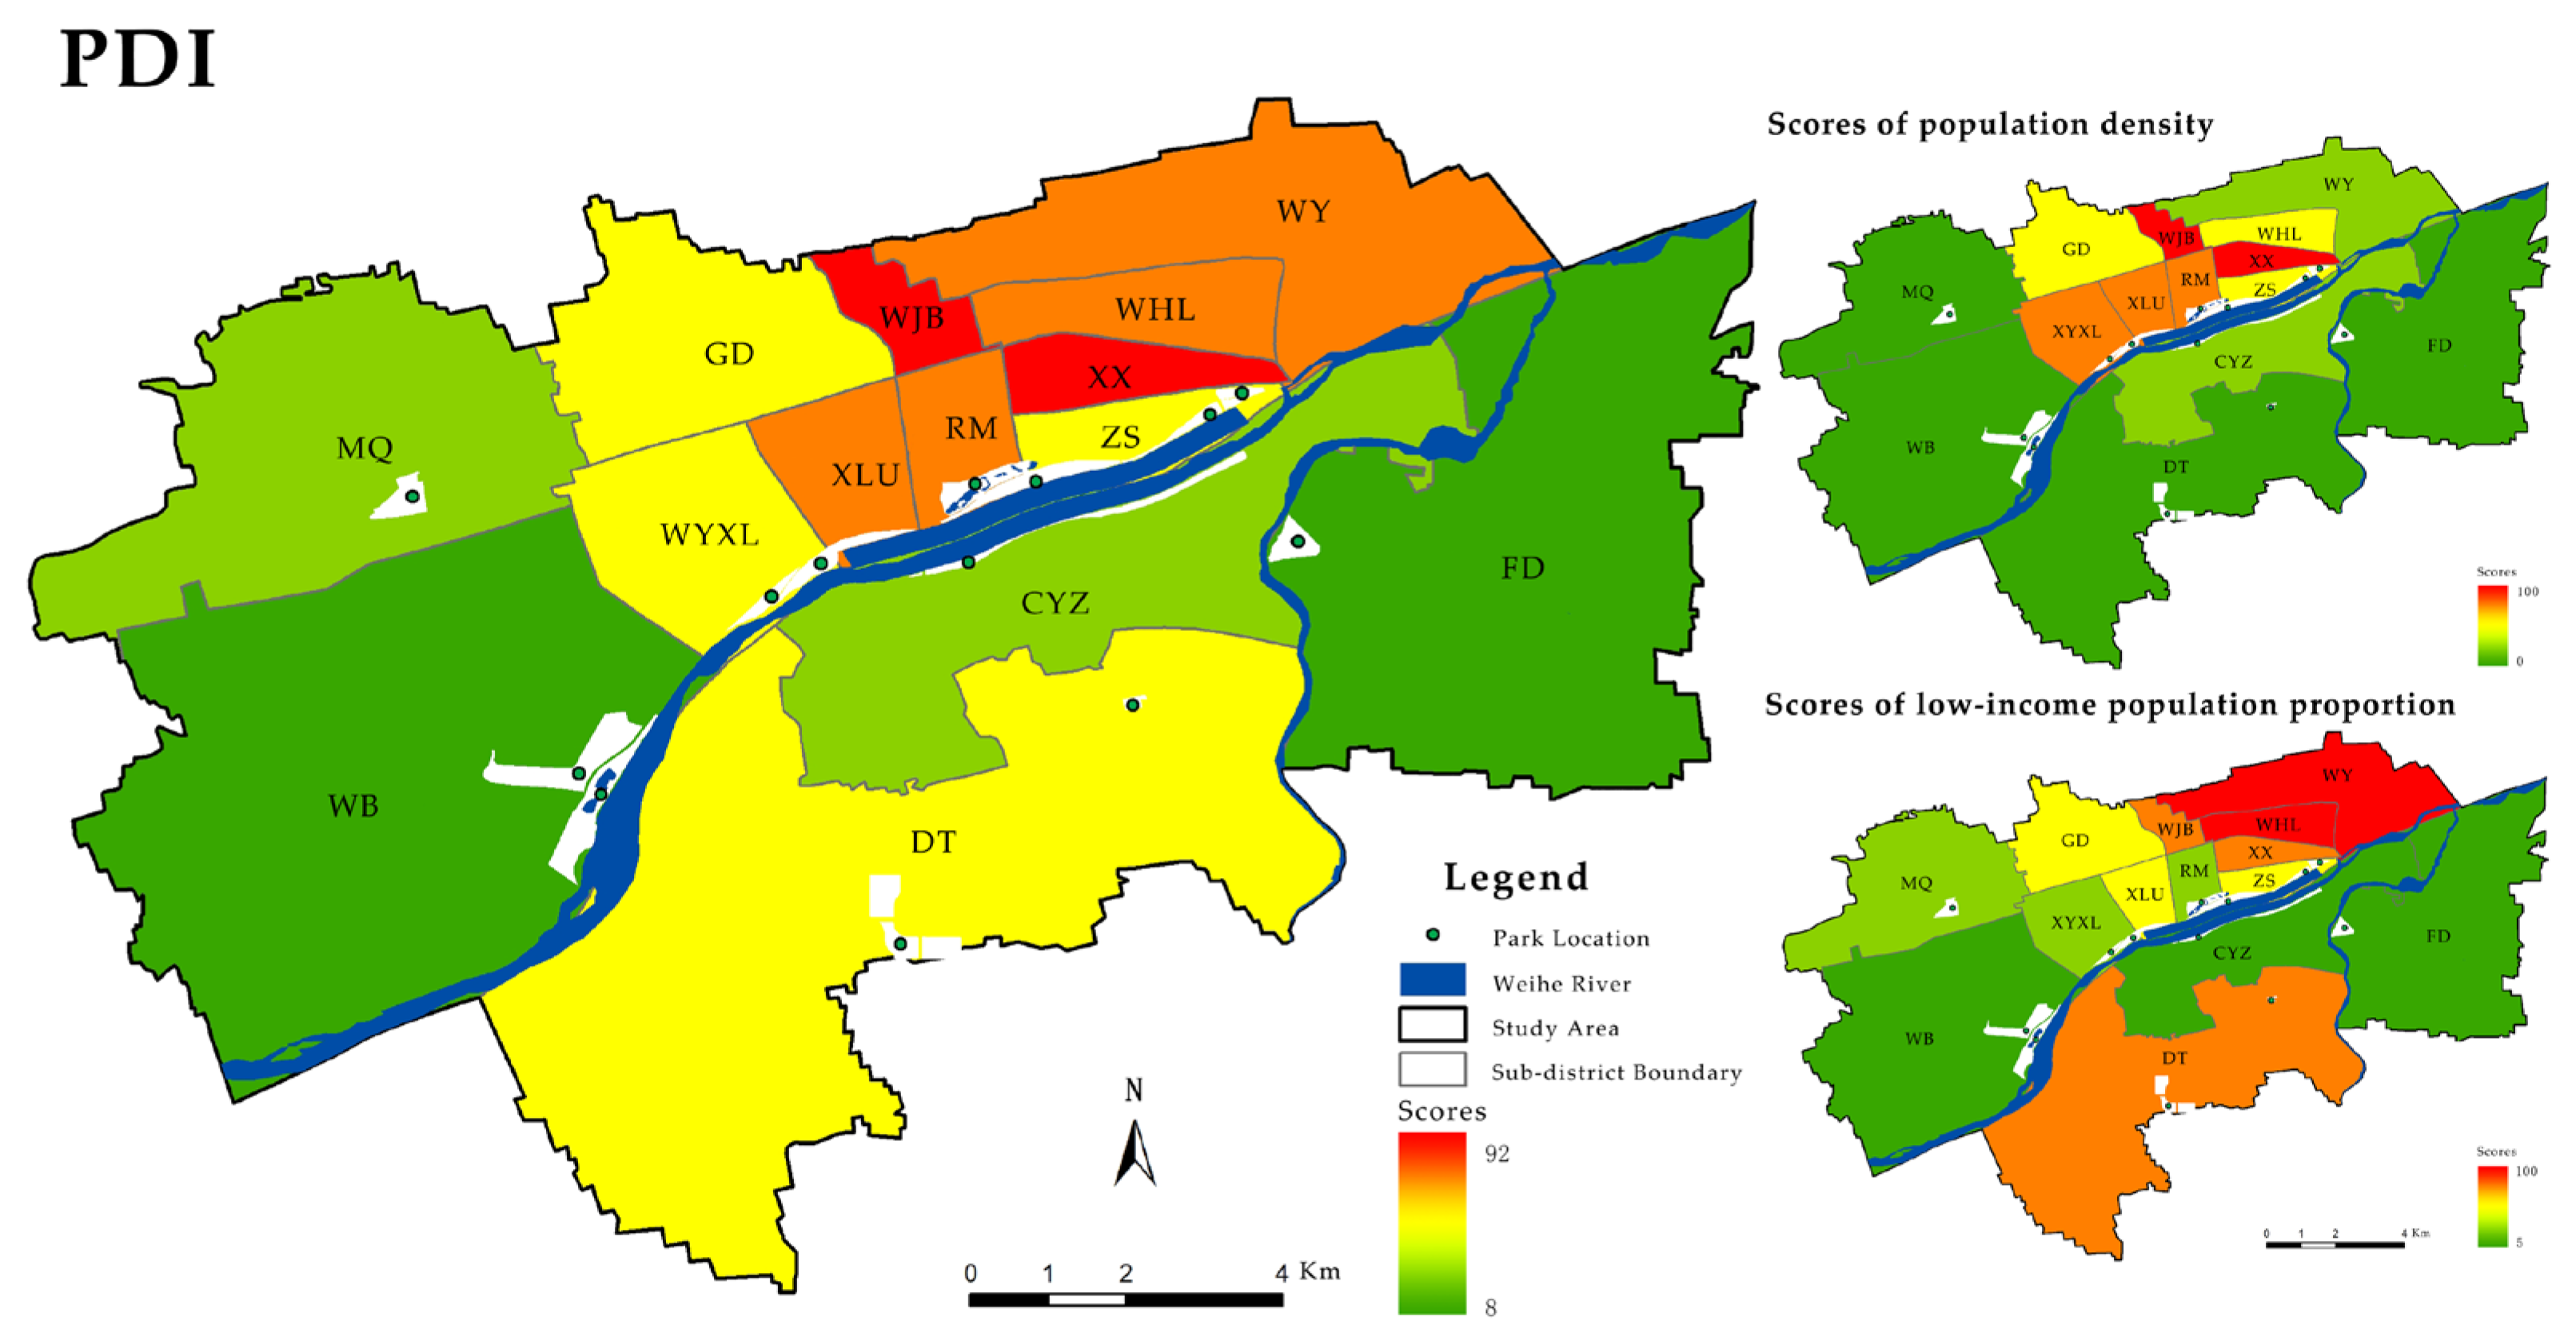
3.2. Scores of PSI and PDI at Sub-District Scales

(1)
The average PSI score of the 14 sub-districts was 42 (SD = 20, range = 0–64). The 14 sub-districts showed a spatial distribution characterized by a zonal distribution along both sides of the Weihe River, decreasing from south to north (Figure 6). Using this distribution, we formed the scores into three sub-district grades. The first included XLL (58), RML (64), and WB (63). The second was WYXL (47), CYZ (51), and ZS (54); all adjacent to the Weihe River distribution. The lowest grade was WJB and GD in the north, which were not covered by the park service area.
(2)
The average scores of the 14 sub-districts were 36, 45, and 31, respectively, for the area, accessibility, and sports facilities. The WB, XL, and RM sub-districts all received higher scores for supply area and sports facilities. The WY and WHL sub-districts received lower scores in these two dimensions but the highest score in supply accessibility (Figure 6).
(3)
The average PDI score was 49, showing a decreasing demand score due to the later sub-district establishment. For example, the PDI score of XX (founded in 1949) was 88, higher than MQ (PDI = 23, founded in 2007). The average demand score of the old urban area was 61, that of the GD sub-district was 48, and that of the CYZ sub-district was 20; lower than the other sub-districts established in the same period. The average demand score of the new urban area was 21, indicating that sub-district DT was higher than the other sub-districts established in the same period with a score of 42 (Figure 7).

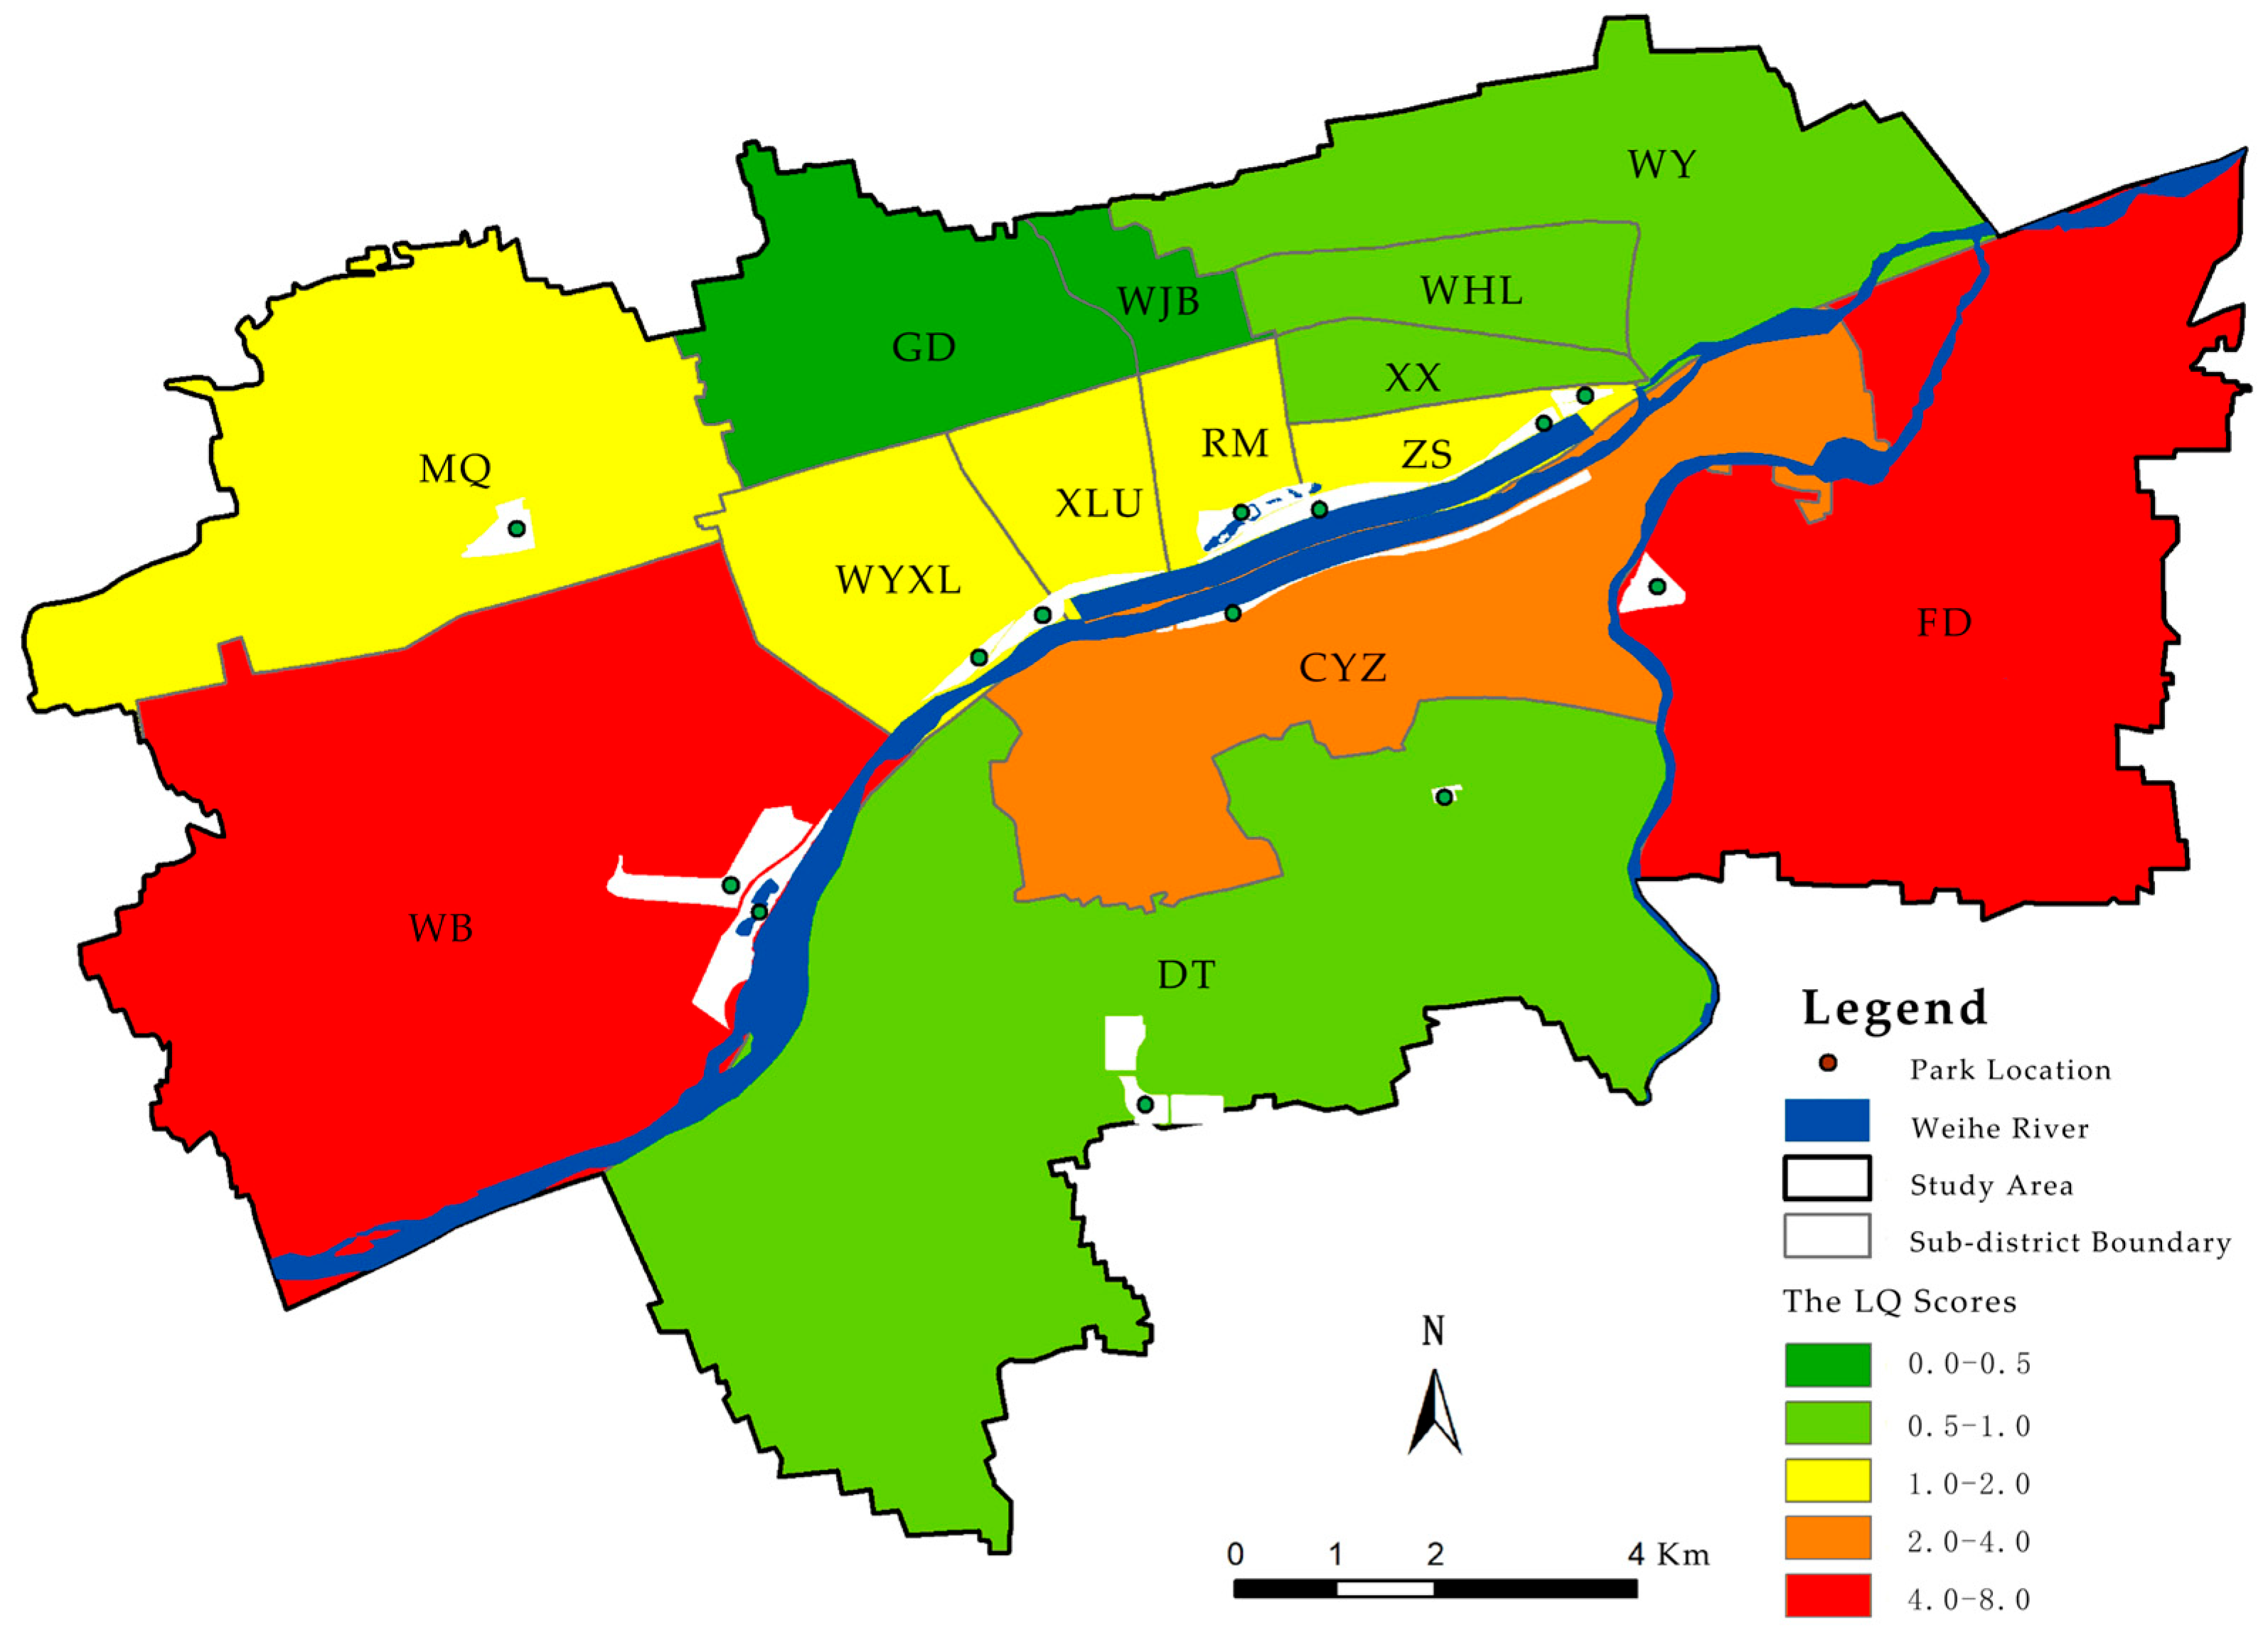
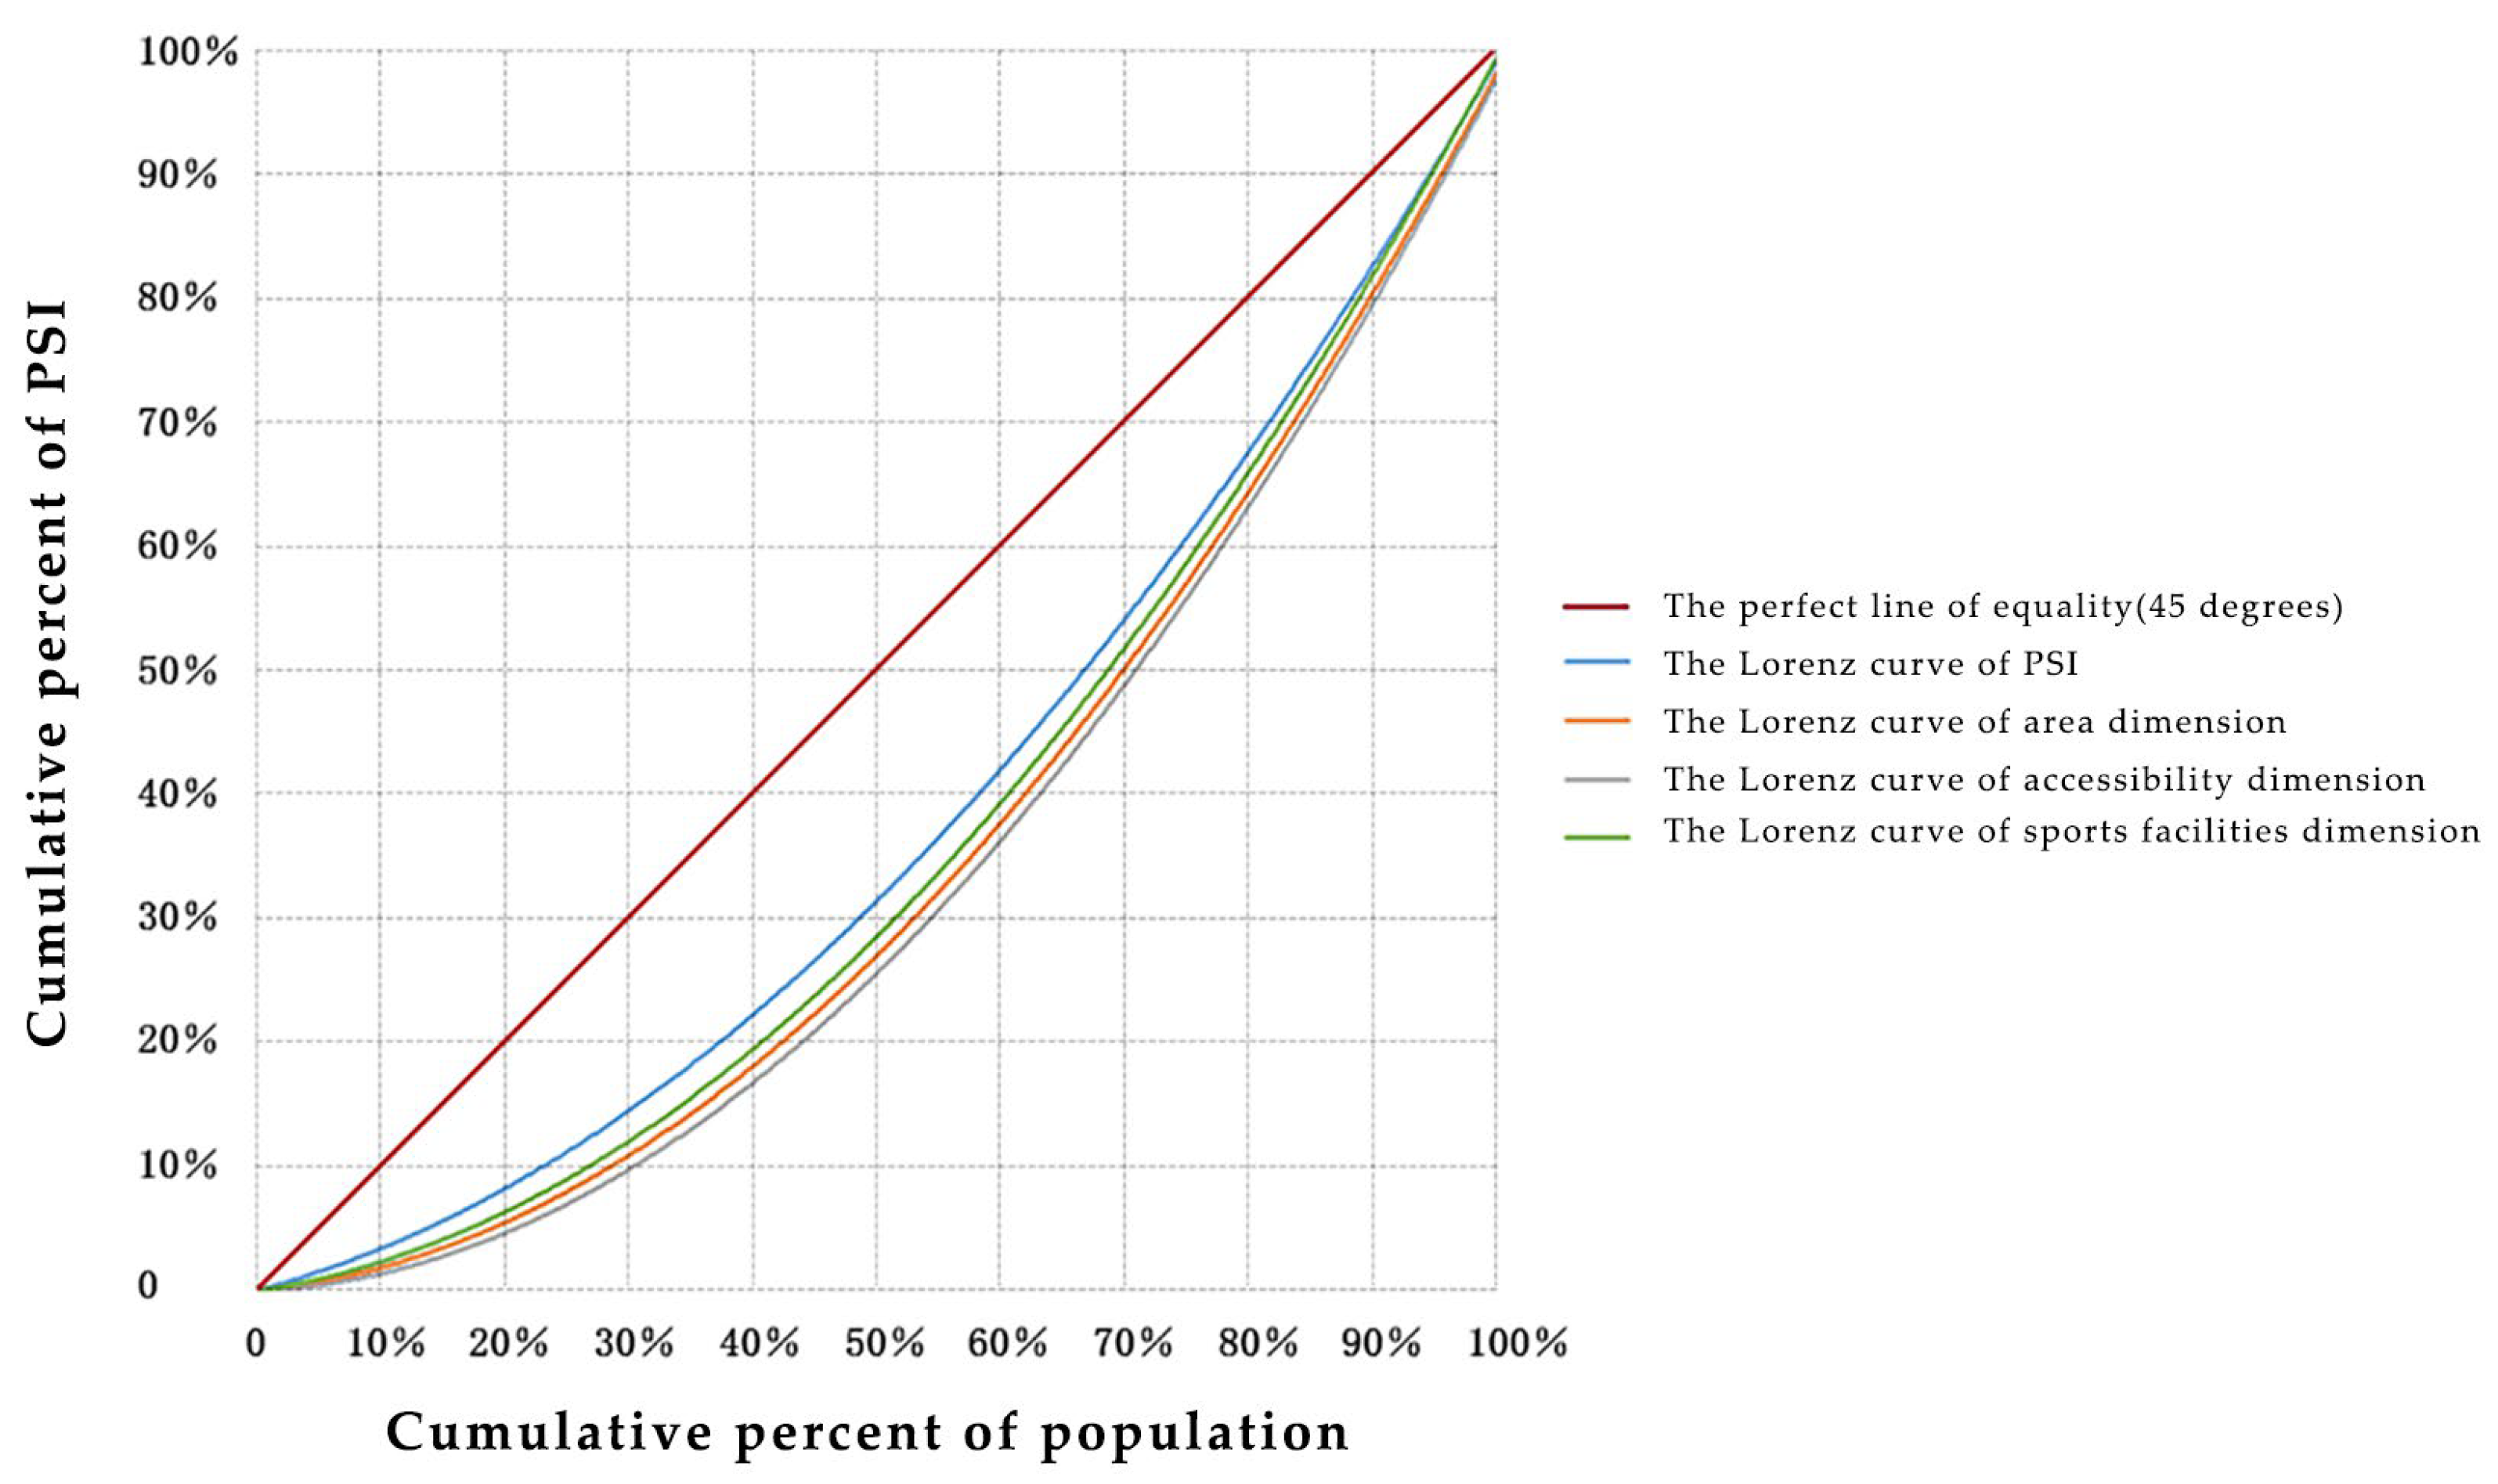
3.3. Equity of Urban Parks Service Level

The overall Gini coefficient was 0.38. However, there was a large gap in the sub-dimensional indicators. The Gini coefficients of area (0.47), accessibility (0.48), and sports facilities (0.42) were all between 0.4 and 0.5. Park accessibility had the highest Gini coefficient, i.e., 50% of the population of the study area had access to only 15% of the urban parks.
The results show that the LQ of sub-districts along the Wei River (>1) was greater than the average level of the study area, and the LQ of sub-districts at the north and south edges (<1) was less than the average level (Figure 8).

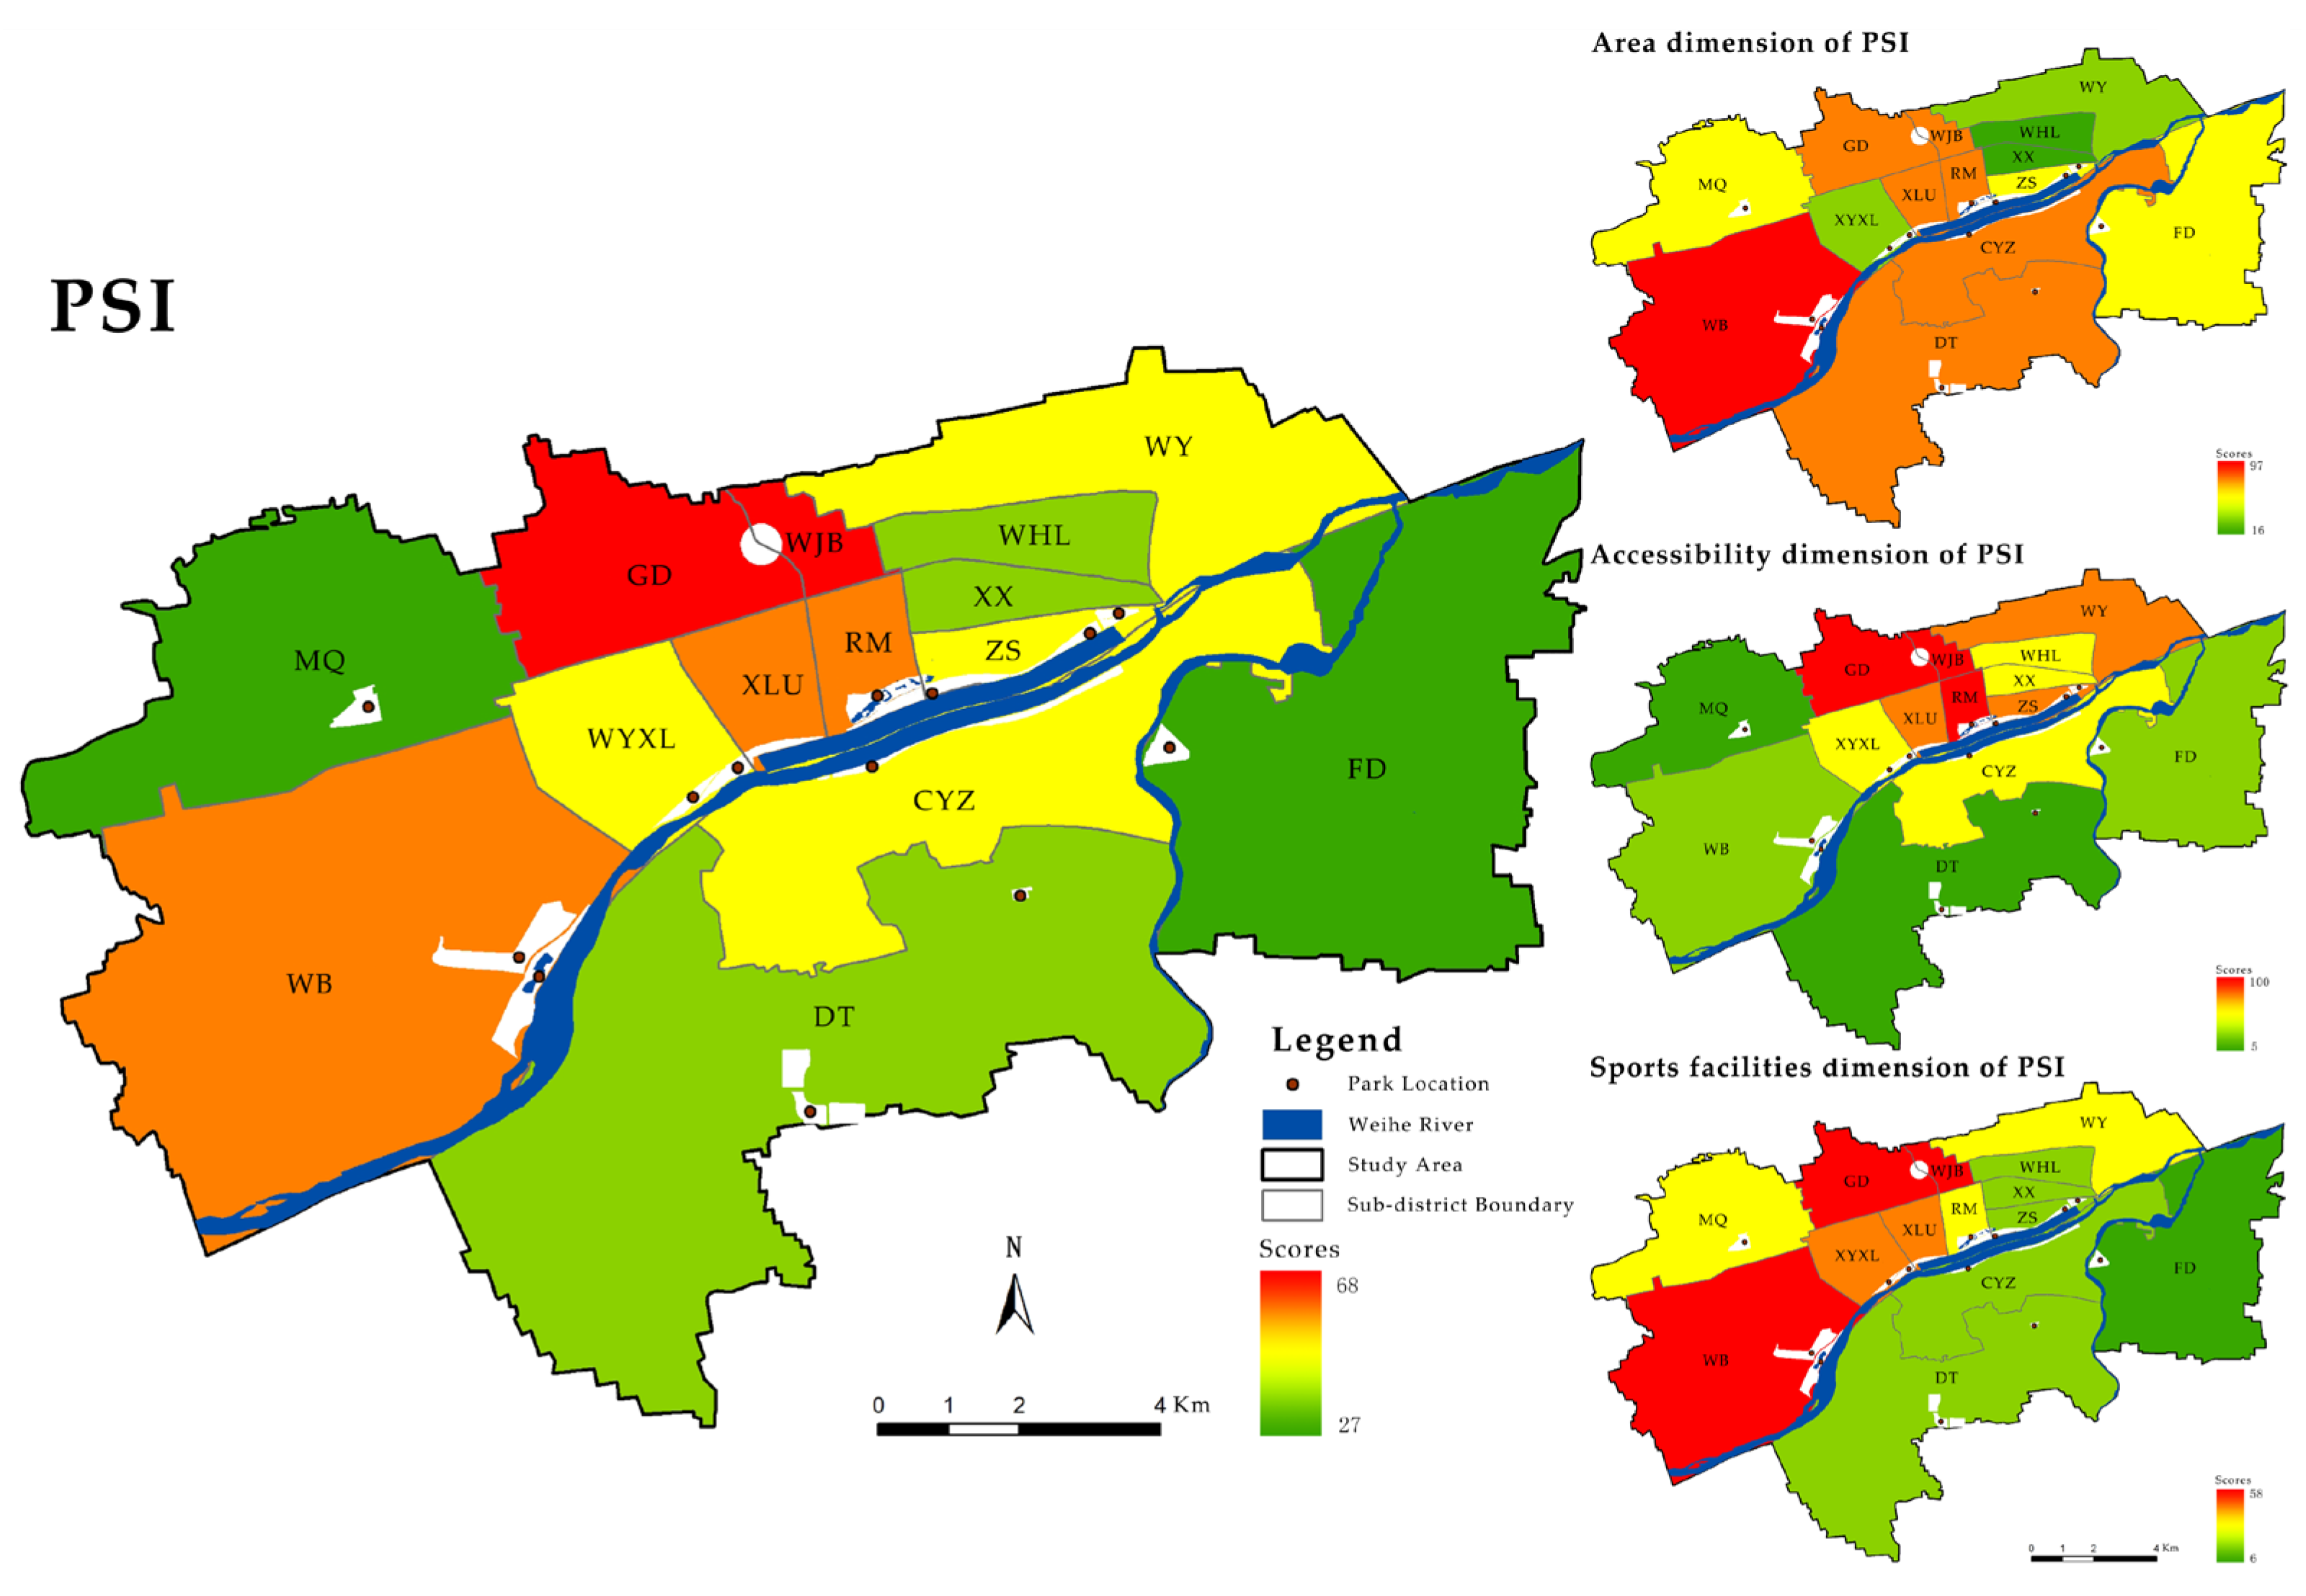
3.4. Optimization of Urban Park Services Based on PCAS

(1)
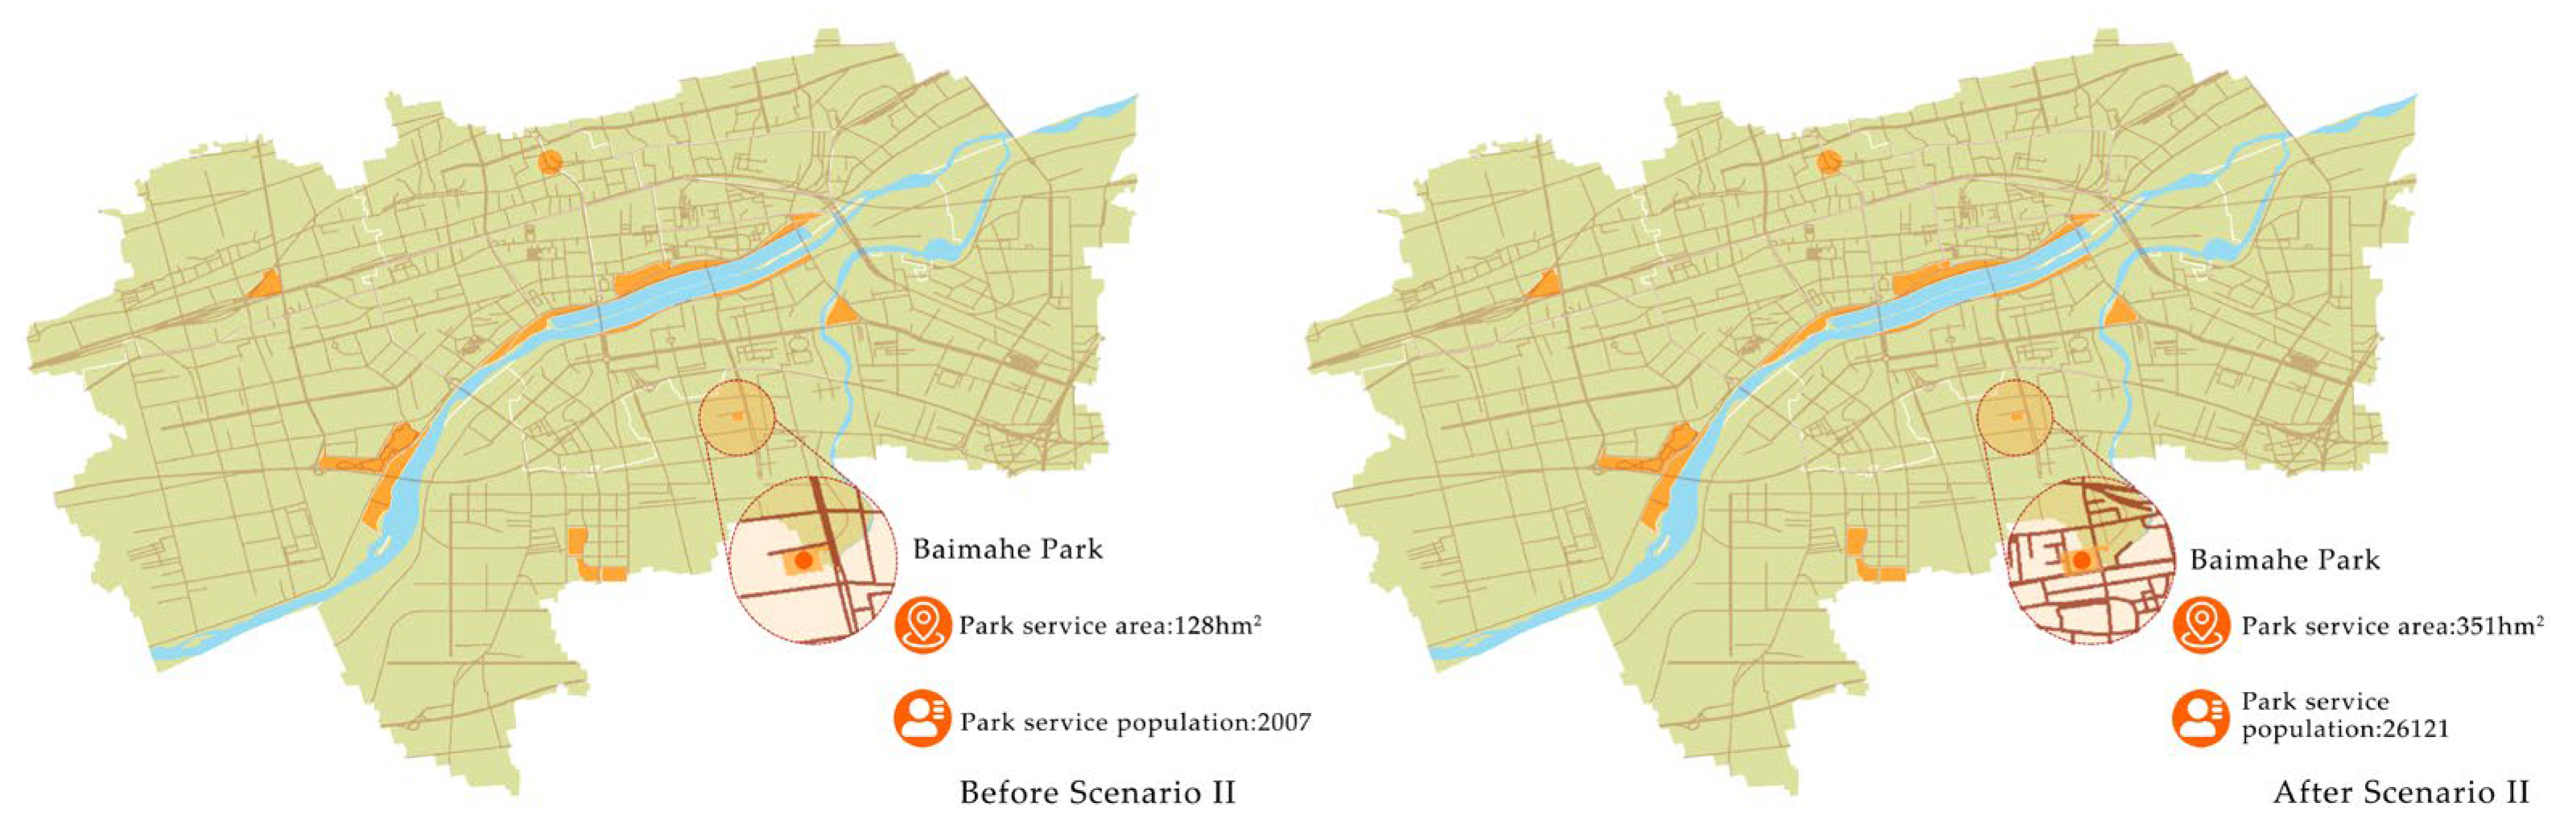
Adding New Parks to Increase Service Area
Based on the overlay analysis of park service areas and sub-districts, Scenario I proposed adding a new park at the geometric center of the boundary shared between sub-districts GD (PSI: 0, PDI: 47.5) and WJB (PSI: 0, PDI: 92.5). The area of this new park was modeled after the Binhe Wetland Park (22.07 hm2, with a park area score of 45). The sports facilities in the new park were designed to emulate those of the Binhe Wetland Park, including a 6635 m2 sports complex with a swimming pool, six basketball courts, three football fields, ten table tennis courts, and a badminton court, as well as a 1382 m2 fitness path and a 9817 m2 public square (Figure 9).
The recalculated PCAS for the newly developed park scored 68, with sports facilities and accessibility scoring 58 and 100, respectively. Consequently, the PSI scores for both GD and WJB sub-districts increased to 68, elevating them to the highest grade (Figure 10). The park area, accessibility, and sports facilities scores increased to 45, 100, and 58, respectively. The Gini coefficients for the overall index and its sub-dimensions moved from above the 0.4 inequity threshold to within the equitable range, achieving an “adequate equality” in urban park service distribution (Table 5).
Using a Lorenz curve, we find that the park sports facilities accessible to 50% of the population in the study area increased from 17% to 28% (Figure 11). The location quotient indicated that urban park service levels in the GD sub-district surpassed the study area’s average, while those in the WJB sub-district remained below average.
(2)
Improving Park Accessibility Using Scenario I
The PSI scores within the target sub-districts in Scenario I showed significant improvement, justifying the transition to Scenario II. Prior research had highlighted the issue of low park accessibility in newly developed urban areas. The PDI score for the DT sub-district surpassed those of other contemporaneously established sub-districts. Consequently, Baimahe Park, notable for its extensive service population within the DT sub-district, was chosen for an accessibility improvement initiative (Figure 12).
Subsequent recalculations revealed that the service population of Baimahe Park had grown by 24,114 individuals, and its accessibility score had risen from 5 to 35, resulting in a ranking advancement from 14th to 11th. Despite a modest improvement in accessibility, the overall effect was considered negligible. The analysis revealed a decrease in the PSI for the DT sub-district, contrary to an expected increase, and also revealed a slight negative impact on the CYZ sub-district (Table 6). Consequently, further equity assessments for urban park services were omitted in Scenario II.
(3)
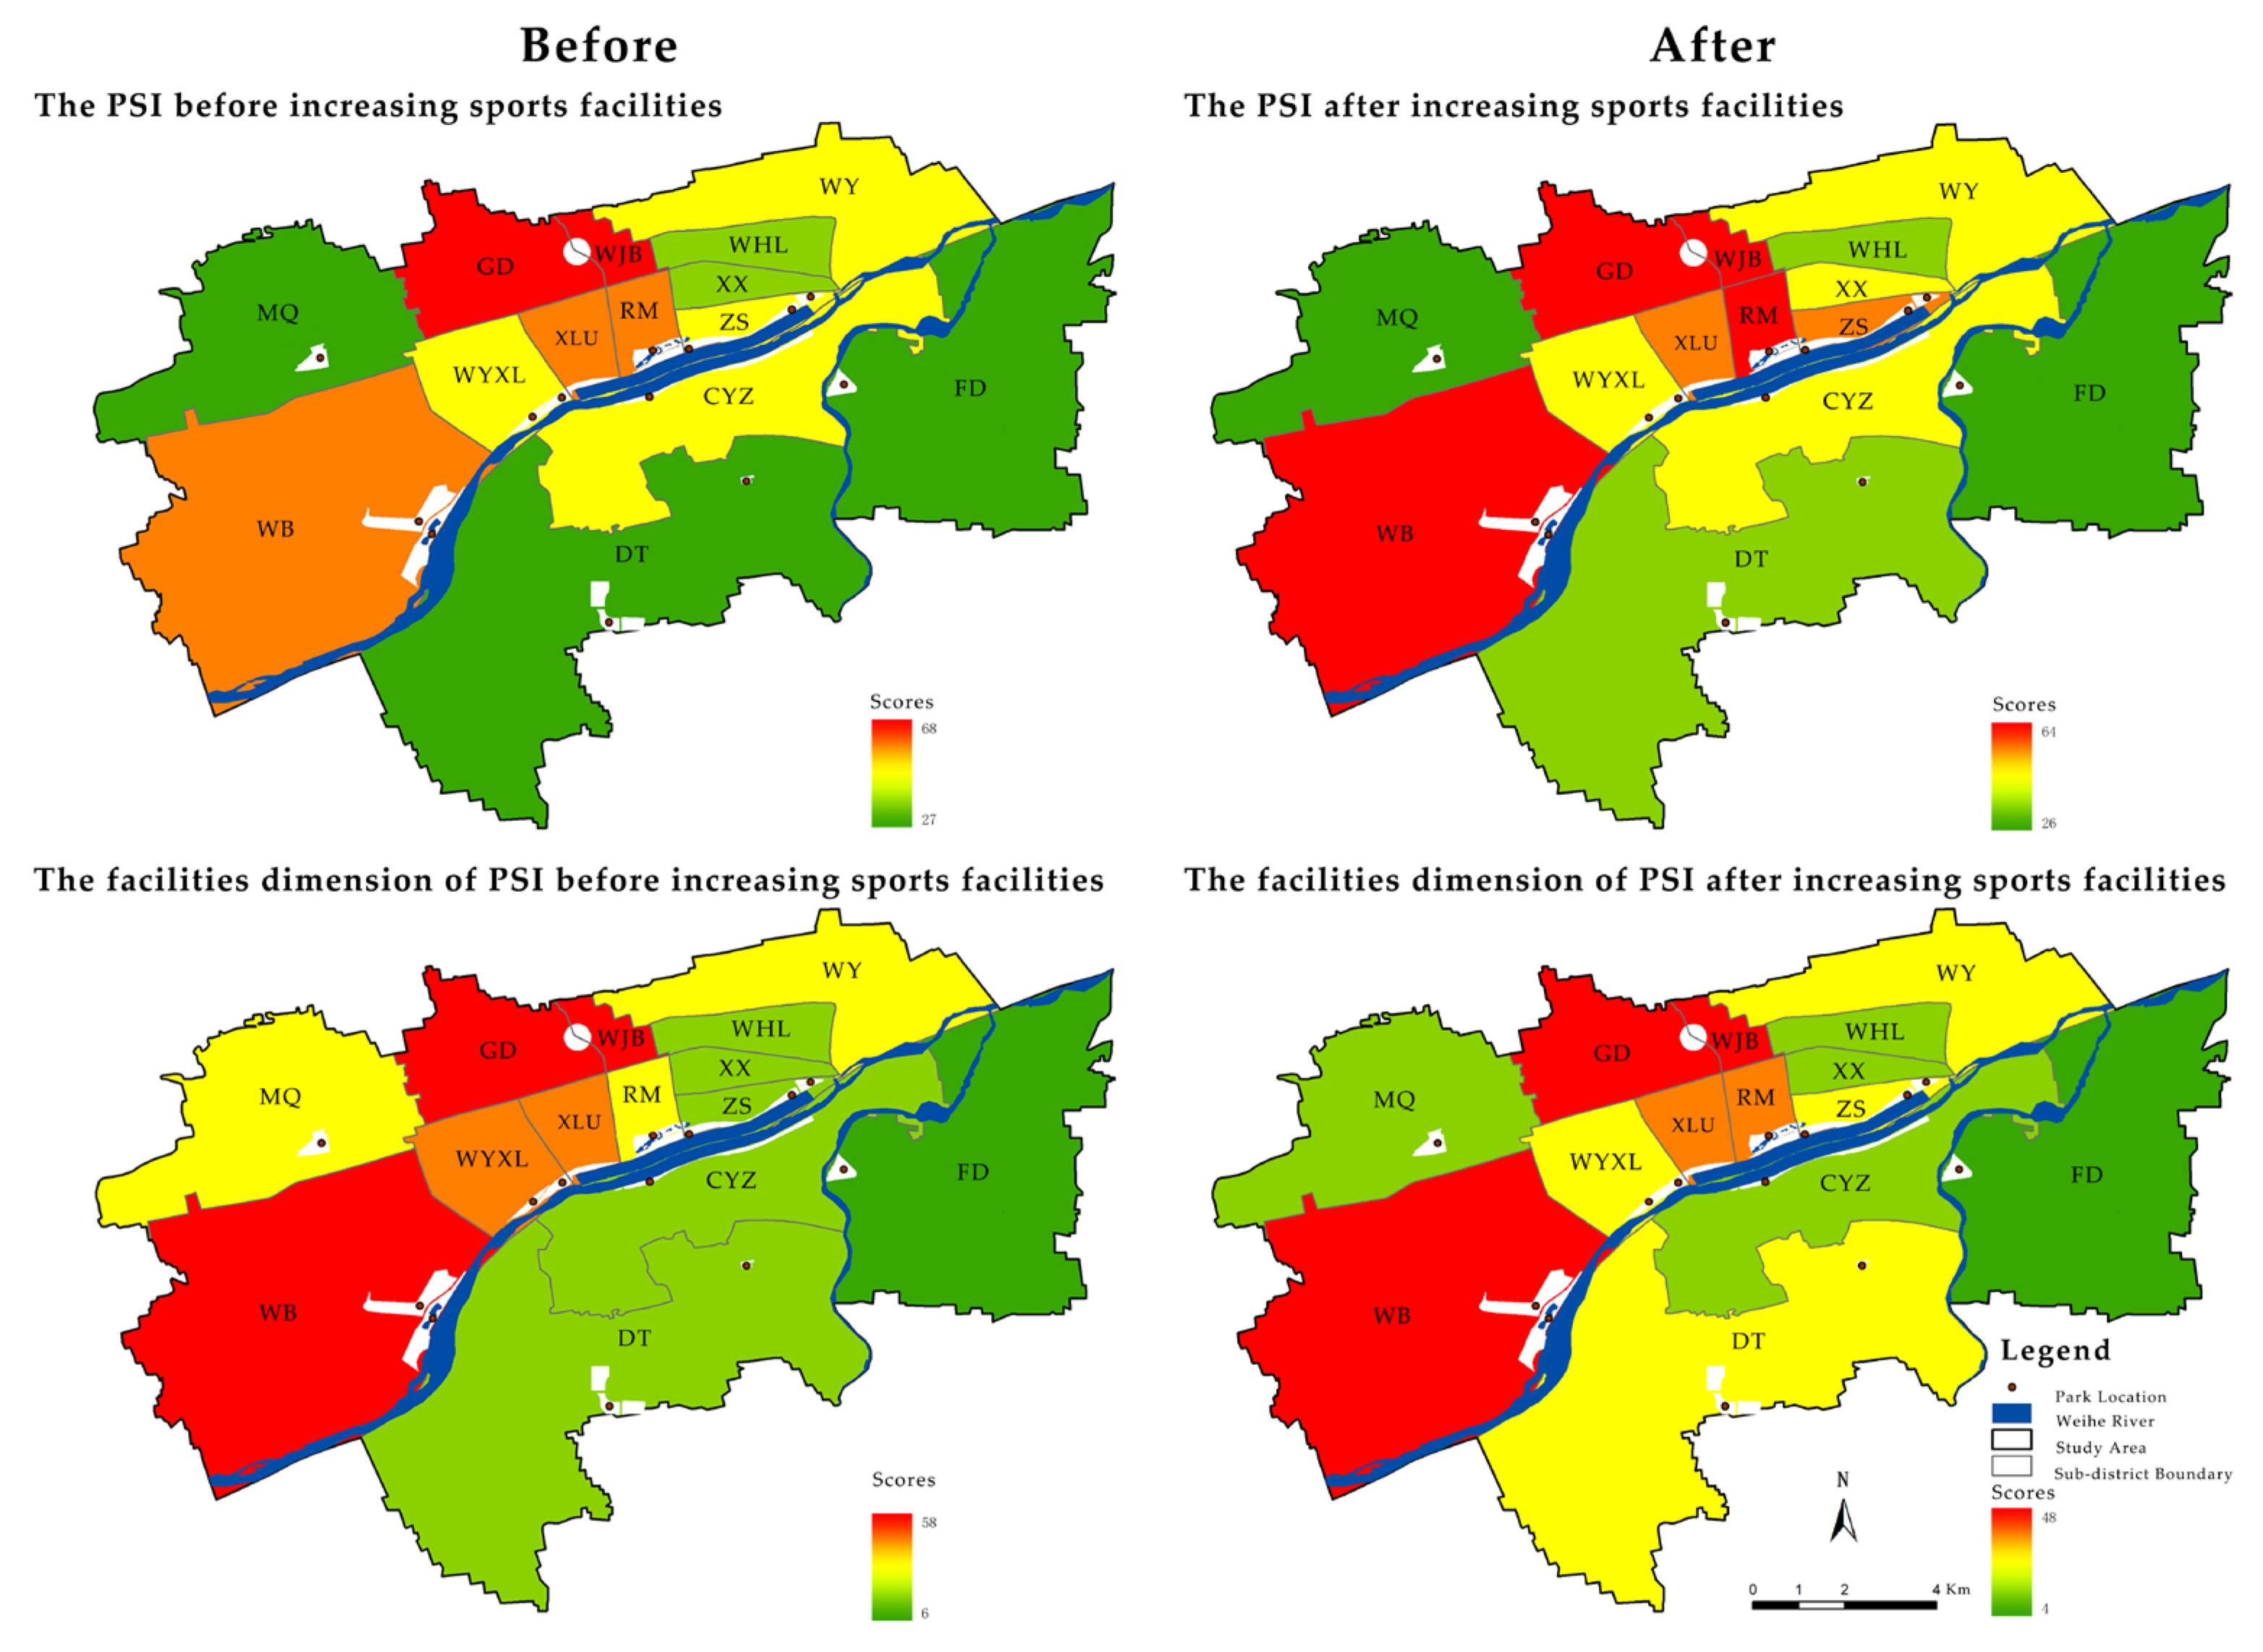
Increasing Park Sports Facilities Using Scenario I
The PSI scores in Scenario II showed no improvements in the targeted sub-districts, prompting the initiation of Scenario III instead of Scenario IV. Low PSI scores were specifically noted for park sports facilities when considering both demand and supply service levels in sub-districts WY, WHL, XX, and DT. Consequently, parks catering to these sub-districts were prioritized for the addition of new sports facilities, and parks with sports facilities scores above the median and those serving smaller populations were excluded from consideration. Hence, Gudu Heritage Park, Weibin Park, and Baimahe Park were selected for improvement. In Scenario III, Nanyuan Park served as a benchmark, featuring median scores for sports facilities, including a 404 m2 sports field equipped with 10 table tennis courts, a 2161 m2 fitness path with 142 fitness equipment units, and a 4983 m2 public square area.
The subsequent recalculations increased the PSI from 24 to 42 in the sports facilities scores for Baimahe Park. This improvement led to a rise in rank from 12th to 5th, and an increase in its PCAS from 11 to 17. Similarly, Gudu Heritage Park’s score rose from 18 to 27, moving its rank from 13th to 11th, and its PCAS from 43 to 46. Weibin Park also witnessed an increase in its sports facilities score from 30 to 40, and its rank from 10th to 7th, with its PCAS improving from 60 to 63. Consequently, the PSI scores for the WY, WHL, XX, and DT sub-districts increased to 48, 41, 44, and 33, respectively. These results highlight that increasing new park sports facilities had the potential to elevate the PSI by as much as 60% (Figure 13).
The analysis of Gini coefficients across the overall and sub-dimensions indicated that increasing new park sports facilities could potentially and only partially increase inequalities in park resource allocation (Table 7). However, it improved equity in the area dimension. In contrast to Scenario I, Scenario III failed to adequately mitigate the undersupply of urban park services in the WY, WHL, XX, and DT sub-districts. The supply–demand balance for these sub-districts remained at a moderate to lower level within the studied area.

4. Discussion

We developed the PCAS to evaluate and optimize the provision of equitable support for PA in Xianyang’s urban area at the sub-district scale from the perspective of park service. The findings indicated that the existing parks failed to meet the residents’ PA needs. Notably, areas with above-average urban park services were predominantly located along the Weihe River, including all high-supply sub-districts. This distribution unveiled a significant disparity between park supply and demand that may result in adverse effects on public health. Our results of scenario optimization indicate that adding new parks can enhance equity and residents’ PA levels more effectively than simply increasing park facilities, which differed from the findings of studies in developed countries [41].

4.1. Evaluating the Inequity of PCAS at the Sub-District Scale in Xianyang

Our PCAS evaluation of parks in the study area showed that the average score for park facilities (38) was significantly lower than for park area (48) and accessibility (52). Notably, deficiencies were observed in areas such as spaces for children’s physical activities (77%) and playgrounds (92%). These deficiencies were likely influenced by prevailing urban park policies in China that have prioritized sightseeing, viewing, and relaxation. Historically, park planning has favored greenery and aesthetics over active use, resulting in a disproportionate ratio of accessible to total area and thereby limiting parks’ support for recreational PA [42]. However, a well-designed park environment has the potential to encourage residents to engage in PA, helping to reduce the risk of chronic diseases and enhance overall quality of life [43].
The PCASs exhibit noticeable variation across park type and size. Generally, comprehensive parks have higher PCASs than the average, while specialized parks tend to have lower scores. For instance, Liangsidu Park, Weibin Park, Tongyi Square, and Binhe Wetland Park have relatively high PCASs (69, 62, 62, and 61, respectively), with two of them classified as comprehensive parks. These parks are strategically located at the heart of the study area, adjacent to the Xianyang municipal government and its affiliated institutions, identifying them as part of the urban core. This aligns with the findings of Stewart et al. [44], who observed higher levels of PA in neighborhood parks within more urbanized areas. These disparities are also related to the current park standards and regulations in China [45,46].
Previous research has shown that residential areas with lower socioeconomic status did not necessarily experience significant disadvantages in terms of park accessibility, total area, and per capita area. Nevertheless, neighborhoods in these lower-status areas generally featured smaller parks, which were frequently deficient in facilities and features that promote PA [30,47]. Based on the LQ analysis at the sub-district scale, equity had a positive correlation with park supply, and there was a tendency for public green spaces to cluster in neighborhoods with higher socioeconomic status [17,48,49]. Urban parks, as vital public resources, should provide equal access to services for residents with diverse needs [50].
Finally, we observed an imbalance between the supply and demand for parks in the old and new sub-districts. The old sub-districts had relatively more parks but also faced elevated demand due to their extensive development history, dense road network, and compact land use [17]. While these features can enhance park accessibility and provide convenient services for residents, the old sub-districts had a high population density and a significant proportion of low-income groups, which made the demand for parks that support PA more urgent. This was consistent with the research findings in the central urban area of Shaoxing [48]; old sub-districts generally failed to meet the PA needs of residents. Despite the relative lag in park development within the new sub-districts, the moderate demand for these green spaces alleviated the supply–demand imbalance, making it less apparent. Since its designation as a high-tech zone in 2005, the Weibin sub-district has a high rate of park provision due to its expansive park areas and well-equipped facilities. In contrast, the supply scores of other sub-districts were generally in the lower to middle range. Urban green space development frequently lagged behind rapid urban expansion, a phenomenon particularly evident in new sub-districts [48,51]. The overall supply of parks in Xianyang City presented a dual-center and ribbon-like pattern along the Weihe River, and the park supply was lower at the urban periphery compared to the central areas. The supply and demand imbalance between the old and new sub-districts highlighted the need for urban planning to consider a variety of factors to achieve a more rational and equitable allocation of park services: historical context, demographic composition, urban development pace, and residents’ needs.

4.2. Suggestions for Urban Park Planning and Policy

We provide several recommendations for urban park planning and policy. An evaluation system can assess the equity of PA support in parks in medium-sized cities, particularly at the sub-district scale. This approach enables urban planners and park managers to identify areas with inadequate park services and to implement targeted measures to address disparities using scenario-based optimization.
Our findings were consistent with the strategies outlined in the “Xianyang Park City Planning (2020–2035)”. Planning emphasizes the importance of enhancing the quality of life for residents by increasing functional green spaces and their supporting facilities in the context of rapid urbanization. The results of our scenario optimization show that the addition of new parks had led to a substantial decrease in the Gini coefficient (−0.12) in the dimension of activity facilities. This indicated a considerable improvement in the equity of access to these facilities for the local community, compared to simply augmenting the activity facilities within existing parks. Planning also emphasizes the revitalization of aging sub-districts by advocating for a small-scale, incremental transformation strategy that converts underutilized plots into pocket parks. This approach (“filling the gaps”) aims to create recreational spaces for urban residents in areas lacking large parks. Chen et al. emphasized the critical role of small parks in alleviating urban spatial tensions [52] and pocket parks, known for their diverse ecological services, compact scale, and flexible design [53], are increasingly favored by urban planners. This supportive policy aligns with recent practices in various Chinese cities. For instance, Xi’an, Beijing, and Shanghai have promoted the construction of pocket parks by organizing design competitions, thereby encouraging urban residents to enjoy convenient leisure spaces. Notably, the Beijing Municipal Bureau of Landscaping and Forestry has announced plans to add 50 pocket parks or small green spaces by 2024, aiming to increase the 500 m service radius coverage of green park spaces within built-up areas to 90% [54]. Based on these findings, we recommend that Xianyang City transform vacant land in its older residential areas into parks and establish pocket parks. This could improve the coverage of park services, capitalizing on the advantages of compact spaces and high accessibility in urban settings.
Improving the quality of park facilities and diversifying activity venues, particularly by incorporating outdoor play areas for children, such as ball courts, sliding and cycling zones, and temporary multifunctional spaces, will better meet residents’ leisure and fitness needs, promote children’s physical and mental health, and enhance their overall recovery from illness [55]. Contemporary urban design theories, such as Green Infrastructure for Healthy Cities [56] and Resilient City Design [57], emphasize that community green spaces should be closely integrated with activity facilities and public health services to foster a health-oriented urban structure. Simultaneously, it is crucial to exercise careful restraint on excessive construction in the urban expansion periphery. This ensures that the development of urban green spaces aligns with overall urban development goals and can even serve as a guide for urban growth [48]. Within the parks along the Weihe River, it is recommended to build standardized sports fields, football pitches, tennis courts, and other specialized large-scale facilities. This approach aims to broaden the array of sports activities available and maximize the utilization of spatial resources.
Overall, China currently lacks a park classification system that could offer practical guidance for urban park planning. A well-designed classification system can effectively guide urban park development and enhance service efficiency. For instance, the National Recreation and Park Association (NRPA) system in the U.S.A. has categorized parks into core types (mini-park, neighborhood park, community park, and regional park) and other types (special use park, school park, natural resource area, greenway, parkway, and private park). This classification is based on level of service standards, with park area and intended use as key criteria, and can be used to improve the supply–demand equilibrium [58]. Using the U.S.A. park classification system as a reference, we found that there has been an excessive reliance on the natural resource advantages of the Weihe River for developing supplementary special parks, while the construction of core urban parks has been neglected. We recommend that future development focuses on allocating core urban parks in non-Weihe River areas, increasing the number and per capita area of parks, and emphasizing the need for PA.

4.3. The Applicability of the PCAS

Our research group has validated the reliability and applicability of the PCAS approach across multiple locations in Shaanxi, including Xianyang, Xi’an, and the Yangling Demonstration Zone [59]. The analysis of Xianyang demonstrates the approach’s applicability in medium-sized cities. We found that, while some parks in medium-sized cities possess relatively large total areas, they offer limited accessible areas. For example, Fenghe Forest Park covers 17.98 hectares, yet only 0.96 hectares are accessible. Most parks are characterized by extensive greenery, with only small portions designated for activities, primarily hardscape areas such as squares and pathways. This situation reflects an imbalance in China’s urbanization process, where land urbanization has outpaced population urbanization [60].
Additionally, the research group conducted normalized PCAS assessments of 63 urban parks in Xi’an and five parks in Yangling. The overall average scores were 48.39 and 48.56, respectively (Table A2). Similar to the findings in Xianyang, comprehensive and sports parks in Xi’an scored higher. However, comprehensive parks in Xi’an recorded the lowest scores in the dimension of park sports facilities, while sports parks performed well across all three dimensions. In contrast, community parks tended to score lower in park sports facilities. Conversely, community parks in Yangling achieved higher scores, whereas specialized parks in Yangling had the lowest scores in both the park sports facilities and accessibility dimensions and lacked dedicated sports parks.
Overall, urban parks in the study areas exhibited low levels of support for PA, with average PCASs ranging between 46 and 49 across the cities. Among the three dimensions of the PCAS, the park sports facilities dimension had the lowest average score, highlighting a significant lack of basic facilities to support residents’ PA. Future urban design should prioritize meeting users’ daily activity needs and improving facility standards for PA spaces. These findings validate the applicability of the PCAS approach in both large cities and small towns.

4.4. Limitations and Prospects

This study had three main limitations that should be addressed in future research. First, we focused solely on the contribution of green park spaces to PA and did not include other types of urban public open spaces, e.g., squares and greenways. Future research should broaden its scope by including these spaces and assessing the overall support for PA provided by the entire urban public open space system. This would provide a more comprehensive understanding of urban spaces’ contributions to residents’ PA and health.
Second, due to methodological limitations, the data on PA facilities were collected entirely using manual surveys. To further validate and extend the findings of this study, future research should use more advanced methods, such as artificial intelligence (AI) and intelligent remote sensing, as well as utilize more complex spatial analysis techniques combined with specific factor analyses to enhance data collection and analysis. Integrating these technologies with traditional methods could yield a more accurate representation of PA environments [61].
Third, although the PCAS approach, an evaluation framework based on PA support, has demonstrated applicability and reliability through validations in locations such as Xianyang, Xi’an, and Yangling Demonstration Zone [59], further validation is recommended from a rigorously scientific perspective. This should be conducted across various regions, city sizes, and urban types to develop a widely applicable tool for assessing urban park equity nationwide, ultimately providing essential empirical support for urban park planning in China.
It is important to recognize additional limitations, such as the lack of consideration for demographic differences, including users’ age, income, or physical ability, despite this study’s analysis of park attributes like area, accessibility, and sports facilities. Research shows that disadvantaged groups, such as children, the elderly, and individuals with disabilities, are particularly sensitive to the availability and quality of green spaces [62]. Future research should integrate the specific needs of these users to evaluate equity from a more inclusive perspective, thereby better informing urban park design.

5. Conclusions

We introduced the PCAS and its evaluation system and verified its feasibility and practicality through the empirical study of parks in the urban center area of Xianyang City. Our findings offer valuable insights for park planning and policy-making in Xianyang and similar cities. We identified a considerable imbalance between park supply and the demand for supporting residents’ PA, particularly in children’s activity areas and play facilities. Therefore, future park development in Xianyang should focus on creating a hierarchical and comprehensive urban park network. Medium and large urban parks should provide the main framework, supplemented by smaller parks as needed. A pocket park renovation approach would maximize the use of vacant and redeveloped land for increasing community parks, ensuring equitable access for residents and enhancing their well-being. Park construction and renovation should prioritize expanding children’s activity areas and play facilities to meet developmental needs and encourage family use, thereby improving children’s physical fitness. Once these objectives are met, additional measures should be implemented to enhance park accessibility and facilities, balancing supply and demand and ensuring more equitable urban park services in the future.

Author Contributions

Conceptualization, M.H., H.R. and K.W.; methodology, M.H. and H.R.; software, M.H. and H.R.; validation, M.H., H.R. and W.W.; formal analysis, M.H., H.R. and X.F.; investigation, M.H., H.R., W.W. and X.F.; resources, M.H. and W.W.; data curation, M.H., H.R. and X.F.; writing—original draft preparation, M.H.; writing—review and editing, H.R., W.W. and K.W.; visualization, M.H., W.W. and X.F.; supervision, K.W.; funding acquisition, K.W. All authors have read and agreed to the published version of the manuscript.

Funding

This research was funded by Northwest A&F University Project of Humanities and Social Science (No. 2452021187).

Data Availability Statement

The original contributions presented in the study are included in the article, further inquiries can be directed to the corresponding author.

Conflicts of Interest

The authors declare no conflicts of interest.

Appendix A

Table A1. Statistics of park sports facilities.
Park NameSports Field/m2Walking Path/m2Square/m2Children’s Physical Activity Field/m2Children’s Playground/m2Site Diversity Index
Weibin Park772.7565.007352.260.000.001.08
Tongyi Square3339.162328.354294.16394.400.001.07
Liangsidu Park11,943.751304.0810,751.240.000.001.09
Five Ring Sports Park31,769.742681.109001.900.000.001.21
Silu Park0.000.0011,205.47861.650.001.13
Baimahe Park0.000.003717.150.000.001.25
Fengxi New City
Central Green Corridor
399.4745.001791.961228.230.001.02
Fenghe Forest Park0.0095.11704.620.000.001.01
Qindu Cultural Park1223.28296.382864.170.000.001.10
Binhe Wetland Park6634.791382.379817.130.000.001.11
Nanyuan Park404.392161.494983.170.000.001.06
Gudu Park288.94369.552560.060.00870.971.17
Gudu Heritage Park0.00432.992923.250.000.001.06
Mean (M)3905.11858.575535.89191.1067.001.10
Standard Deviation (SD)8628.05950.203489.75385.49232.090.07
Table A2. Scores of the PCAS and its sub-dimensions for Xi’an and Yangling.
City
Name
Mean ± SD
Area ScoreAccessibility ScoreSports Facilities ScorePCAS Scores
Xi’an55.40 ± 18.1533.57 ± 19.4056.19 ± 30.4048.39 ± 14.87
Yangling53.00 ± 19.5632.67 ± 16.6960.00 ± 40.6248.56 ± 14.38

References

  1. Ferreira, F.; Vasconcelos, L.; Ferreira, J.C. Socio-Ecological and Economic Evaluation of Urban Parks—A Methodology Integrating and Articulating Diverse Components. J. Outdoor Recreat. Tour. 2022, 40, 100512. [Google Scholar] [CrossRef]
  2. Ali, M.J.; Rahaman, A. Assessing the Potential of Urban Parks for Health-Promoting Physical Activity: Geospatial Tools in Planning for Healthy City Living in Kolkata. GeoJournal 2024, 89, 164. [Google Scholar] [CrossRef]
  3. Wang, P.; Han, L.; Hao, R.; Mei, R. Understanding the Relationship Between Small Urban Parks and Mental Health: A Case Study in Shanghai, China. Urban For. Urban Green. 2022, 78, 127784. [Google Scholar] [CrossRef]
  4. Blaszczy, M.; Suchocka, M.; Wojnowska-Heciak, M.; Muszynska, M. Quality of Urban Parks in the Perception of City Residents with Mobility Difficulties. PeerJ 2020, 8, e10570. [Google Scholar] [CrossRef] [PubMed]
  5. Zhang, R.; Peng, S.; Sun, F.; Deng, L.; Che, Y. Assessing the Social Equity of Urban Parks: An Improved Index Integrating Multiple Quality Dimensions and Service Accessibility. Cities 2022, 129, 103839. [Google Scholar] [CrossRef]
  6. Edwards, N.; Hooper, P. The Park Physical Activity Questionnaire (Park-PAQ): A Reliable Measurement Tool for Park-Based and Total Physical Activity. Health Place 2023, 83, 103085. [Google Scholar] [CrossRef]
  7. Jáuregui, A.; Lambert, E.V.; Panter, J.; Moore, C.; Salvo, D. Scaling up Urban Infrastructure for Physical Activity in the COVID-19 Pandemic and Beyond. Lancet 2021, 398, 370–372. [Google Scholar] [CrossRef] [PubMed]
  8. Lancet, T. A Sporting Chance: Physical Activity as Part of Everyday Life. Lancet 2021, 398, 365. [Google Scholar] [CrossRef] [PubMed]
  9. Dong, J.; Wang, Y.; Yang, Y.; Luo, X.; Wang, L. A Multi-Level Framework for Assessing the Spatial Equity of Urban Public Space towards SDG 11.7.1—A Case Study in Beijing. Appl. Geogr. 2023, 161, 103142. [Google Scholar] [CrossRef]
  10. Cheng, Y.; Zhang, J.; Wei, W.; Zhao, B. Effects of Urban Parks on Residents’ Expressed Happiness before and during the COVID-19 Pandemic. Landsc. Urban Plan. 2021, 212, 104118. [Google Scholar] [CrossRef] [PubMed]
  11. Deng, L.; Li, X.; Luo, H.; Fu, E.-K.; Ma, J.; Sun, L.-X.; Huang, Z.; Cai, S.-Z.; Jia, Y. Empirical Study of Landscape Types, Landscape Elements and Landscape Components of the Urban Park Promoting Physiological and Psychological Restoration. Urban For. Urban Green. 2020, 48, 126488. [Google Scholar] [CrossRef]
  12. Zhao, Y.; Gong, P. Optimal Site Selection Strategies for Urban Parks Green Spaces under the Joint Perspective of Spatial Equity and Social Equity. Front. Public Health 2024, 12, 1310340. [Google Scholar] [CrossRef]
  13. Wang, L.; Zhou, J.; Wang, P.; Pan, C.; Li, H. Green Gentrification and Urban Parks: Exploring the Complex Dynamics of Commercial Transformation. J. Knowl. Econ. 2024. [Google Scholar] [CrossRef]
  14. Bhor, N.; Mayavel, D. The Socio-Spatial Distribution and Equity of Access to Urban Parks: A Case Study of Bengaluru, India. Challenges 2024, 15, 20. [Google Scholar] [CrossRef]
  15. Fan, P.; Xu, L.; Yue, W.; Chen, J. Accessibility of Public Urban Green Space in an Urban Periphery: The Case of Shanghai. Landsc. Urban Plan. 2017, 165, 177–192. [Google Scholar] [CrossRef]
  16. Wang, C.; Wang, S.; Cao, Y.; Yan, H.; Li, Y. The Social Equity of Urban Parks in High-Density Urban Areas: A Case Study in the Core Area of Beijing. Sustainability 2023, 15, 13849. [Google Scholar] [CrossRef]
  17. Yu, S.Q.; Zhu, X.G.; Liu, F.B.; Sun, J.; Wu, Y. The Evaluation of Accessibilities to Urban Parks from the Perspective of Social Justice: A Case Study of Nanjing. Mod. Urban Res. 2020, 35, 18–25. (In Chinese) [Google Scholar]
  18. National Data of China. Available online: https://data.stats.gov.cn/easyquery.htm?cn=E0103 (accessed on 14 August 2024).
  19. Farkas, J.Z.; Kovacs, Z.; Csomos, G. The Availability of Green Spaces for Different Socio-Economic Groups in Cities: A Case Study of Budapest, Hungary. J. Maps 2022, 18, 97–105. [Google Scholar] [CrossRef]
  20. Wang, Y.; Chang, Q. The Role of Urban Parks in Affecting Health Outcomes and the Differences Between Vulnerable Groups: Evidence from the Central City of Beijing. Urban For. Urban Green. 2023, 89, 128110. [Google Scholar] [CrossRef]
  21. Kaczynski, A.T.; Potwarka, L.R.; Saelens, B.E. Association of Park Size, Distance, and Features With Physical Activity in Neighborhood Parks. Am. J. Public Health 2008, 98, 1451–1456. [Google Scholar] [CrossRef] [PubMed]
  22. Yu, S.Q.; Zhu, X.G.; Sun, J.; He, Q.; Zhou, J.Y. The ParkScore System in USA and Its Inspirations. Chin. Landsc. Archit. 2020, 36, 103–108. (In Chinese) [Google Scholar] [CrossRef]
  23. Diao, Y.; Hu, W.; He, B.-J. Analysis of the Impact of Park Scale on Urban Park Equity Based on 21 Incremental Scenarios in the Urban Core Area of Chongqing, China. Adv. Sustain. Syst. 2021, 5, 2100171. [Google Scholar] [CrossRef]
  24. Liu, R.; Xiao, J. Factors Affecting Users’ Satisfaction with Urban Parks Through Online Comments Data: Evidence from Shenzhen, China. Int. J. Environ. Res. Public Health 2021, 18, 253. [Google Scholar] [CrossRef] [PubMed]
  25. The 2023 Urban Construction Statistical Yearbook. Available online: https://www.mohurd.gov.cn/gongkai/fdzdgknr/sjfb/index.html (accessed on 10 November 2024).
  26. Xianyang City 2023 National Economic and Social Development Statistical Bulletin. Available online: https://tjj.xianyang.gov.cn/tjgz/tjxx/202404/t20240418_1757459.html (accessed on 10 November 2024).
  27. Xianyang City Master Plan (2011–2030). Available online: https://www.xianyang.gov.cn/zfxxgk/fdzdgknr/ghxx/201802/t20180228_516463.html (accessed on 10 November 2024).
  28. CJJ/T85-2017; People’s Republic of China Standard for Classification of Urban Green Space. Ministry of Housing and Urban-Rural Development of the People’s Republic of China: Beijing, China, 2017. Available online: https://www.mohurd.gov.cn/gongkai/zc/wjk/art/2018/art_17339_236545.html (accessed on 10 November 2024).
  29. Joseph, R.P.; Maddock, J.E. Comparative Analysis of Five Observational Audit Tools to Assess the Physical Environment of Parks for Physical Activity, 2016. Prev. Chronic Dis. 2016, 13, E166. [Google Scholar] [CrossRef] [PubMed]
  30. Yang, L. Research on the Evaluation Method and Application of Urban Park Equity Performance from the Perspective of Spatial Justice. Ph.D. Thesis, Chongqing University, Chongqing, China, 2022. (In Chinese). [Google Scholar]
  31. Chen, S.; Christensen, K.M.; Li, S. A Comparison of Park Access with Park Need for Children: A Case Study in Cache County, Utah. Landsc. Urban Plan. 2019, 187, 119–128. [Google Scholar] [CrossRef]
  32. Loukaitou-Sideris, A.; Stieglitz, O. Children in Los Angeles Parks: A Study of Equity, Quality and Children’s Satisfaction with Neighbourhood Parks. Town Plan. Rev. 2002, 73, 467–488. [Google Scholar] [CrossRef]
  33. Yuzhen, Z.; Jie, W.; Yang, C.; Jianping, Y. An Assessment of Urban Parks Distribution from Multiple Dimensions at the Community Level: A Case Study of Beijing. Environ. Impact Assess. Rev. 2021, 91, 106663. [Google Scholar] [CrossRef]
  34. Wang, S.; Wang, M.; Liu, Y. Access to Urban Parks: Comparing Spatial Accessibility Measures Using Three GIS-Based Approaches. Comput. Environ. Urban Syst. 2021, 90, 101713. [Google Scholar] [CrossRef]
  35. National Geomatics Center of China. Available online: https://www.webmap.cn/main.do?method=index (accessed on 2 September 2024).
  36. Lianjia Website Xianyang Residential Community Data. Available online: https://m.lianjia.com/xianyang/xiaoqu/ (accessed on 2 September 2024).
  37. The Seventh National Population Census Data. Available online: https://cnki.nbsti.net/CSYDMirror/trade/yearbook/Single/N2021100082?z=Z018 (accessed on 2 September 2024).
  38. Zheng, Q.Y.; Zhao, X.L.; Jin, M.X.; Liu, X.B. A Study on Diversity of Physical Activities in Urban Parks Based on POI Mixed-use: A Case Study of Futian District, Shenzhen. Planners 2020, 36, 78–86. (In Chinese) [Google Scholar]
  39. Feng, S.; Chen, L.; Sun, R.; Feng, Z.; Li, J.; Khan, M.S.; Jing, Y. The Distribution and Accessibility of Urban Parks in Beijing, China: Implications of Social Equity. Int. J. Environ. Res. Public Health 2019, 16, 4894. [Google Scholar] [CrossRef] [PubMed]
  40. Liu, W.-Y.; Huang, Y.-H.; Hsieh, C.-M. The Impacts of Different Climate Change Scenarios on Visits toward the National Forest Park in Taiwan. Forests 2020, 11, 1203. [Google Scholar] [CrossRef]
  41. Cohen, D.A.; Marsh, T.; Williamson, S.; Golinelli, D.; McKenzie, T.L. Impact and Cost-Effectiveness of Family Fitness Zones: A Natural Experiment in Urban Public Parks. Health Place 2012, 18, 39–45. [Google Scholar] [CrossRef] [PubMed]
  42. Zhang, W.; Yang, J.; Ma, L.; Huang, C. Factors Affecting the Use of Urban Green Spaces for Physical Activities: Views of Young Urban Residents in Beijing. Urban For. Urban Green. 2015, 14, 851–857. [Google Scholar] [CrossRef]
  43. Petrunoff, N.A.; Edney, S.; Yi, N.X.; Dickens, B.L.; Joel, K.R.; Xin, W.N.; Sia, A.; Leong, D.; van Dam, R.M.; Cook, A.R.; et al. Associations of Park Features with Park Use and Park-Based Physical Activity in an Urban Environment in Asia: A Cross-Sectional Study. Health Place 2022, 75, 102790. [Google Scholar] [CrossRef]
  44. Stewart, O.T.; Moudon, A.V.; Littman, A.J.; Seto, E.; Saelens, B.E. The Association Between Park Facilities and Duration of Physical Activity During Active Park Visits. J. Urban Health 2018, 95, 869–880. [Google Scholar] [CrossRef] [PubMed]
  45. Duan, Y.; Wagner, P.; Zhang, R.; Wulff, H.; Brehm, W. Physical Activity Areas in Urban Parks and Their Use by the Elderly from Two Cities in China and Germany. Landsc. Urban Plan. 2018, 178, 261–269. [Google Scholar] [CrossRef]
  46. Wang, K. The Impact of Urban Park Built Environment Characteristics on the Physical Activity of Users and Inspirations. China Sport Sci. 2018, 38, 55–62. (In Chinese) [Google Scholar] [CrossRef]
  47. Sugiyama, T.; Francis, J.; Middleton, N.J.; Owen, N.; Giles-Corti, B. Associations Between Recreational Walking and Attractiveness, Size, and Proximity of Neighborhood Open Spaces. Am. J. Public Health 2010, 100, 1752–1757. [Google Scholar] [CrossRef]
  48. Chen, Q.X.; Hou, Y.; Wu, S. Assessment of Accessibility to Urban Parks in Shaoxing City from the Perspective of Opportunity Equity. Sci. Geogr. Sin. 2016, 36, 375–383. (In Chinese) [Google Scholar] [CrossRef]
  49. Jiang, H.Y.; Zhou, C.S. Social Differentiation in Urban Park Green Space: A Study of Foreign Cities. Urban Probl. 2010, 4, 84–88+100. (In Chinese) [Google Scholar] [CrossRef]
  50. Yan, L.; Jin, X.; Zhang, J. Equity in Park Green Spaces: A Bibliometric Analysis and Systematic Literature Review from 2014–2023. Front. Environ. Sci. 2024, 12, 1374973. [Google Scholar] [CrossRef]
  51. Xu, X.Y.; Chen, Z.N. Hierarchic Structure and Spatial Distribution of Urban Parks Based on Residents’ Leisure Demand: A Case Study of Guangzhou. Trop. Geogr. 2012, 32, 293–299+320. (In Chinese) [Google Scholar] [CrossRef]
  52. Chen, F.F.; Liu, J.; Yu, K.Y.; Liu, Y.F.; Gao, Y.C.; Yang, L.Q.; Lin, L.C. Research on Fractal Features of Small Public Urban Green Space in the Main Urban Region of Fuzhou. J. Northwest For. Univ. 2022, 37, 201–206+223. (In Chinese) [Google Scholar]
  53. Dong, J.; Guo, R.; Guo, F.; Guo, X.; Zhang, Z. Pocket Parks-a Systematic Literature Review. Environ. Res. Lett. 2023, 18, 083003. [Google Scholar] [CrossRef]
  54. Beijing Municipal Bureau of Gardening and Forestry Takes Multiple Measures to Improve Urban Renewal and Landscape Greening Work in 2024. Available online: https://yllhj.beijing.gov.cn/zwgk/zwxx/202403/t20240325_3599459.shtml (accessed on 10 November 2024).
  55. Russo, A.; Andreucci, M.B. Raising Healthy Children: Promoting the Multiple Benefits of Green Open Spaces through Biophilic Design. Sustainability 2023, 15, 1982. [Google Scholar] [CrossRef]
  56. Lombardía, A.; Gómez-Villarino, M.T. Green Infrastructure in Cities for the Achievement of the Un Sustainable Development Goals: A Systematic Review. Urban Ecosyst. 2023, 26, 1693–1707. [Google Scholar] [CrossRef]
  57. Wu, C.; Cenci, J.; Wang, W.; Zhang, J. Resilient City: Characterization, Challenges and Outlooks. Buildings 2022, 12, 516. [Google Scholar] [CrossRef]
  58. Zhang, M.J.; Wang, K.; Liu, J.J. Urban Park Categorization for Physical Activity Needs in America: Insights and Applications. Planners 2018, 34, 148–154. (In Chinese) [Google Scholar]
  59. Tian, Y.X. Impacts of Urban Park Characteristics on Leisure Physical Activity and Public Health in the Guanzhong Urban Agglomeration. Ph.D. Thesis, Northwest A&F University, Xianyang, China, 2023. (In Chinese). [Google Scholar]
  60. Chen, M.; Liu, W.; Lu, D.; Chen, H.; Ye, C. Progress of China’s New-Type Urbanization Construction since 2014: A Preliminary Assessment. Cities 2018, 78, 180–193. [Google Scholar] [CrossRef]
  61. Shin, G.; Jarrahi, M.H.; Fei, Y.; Karami, A.; Gafinowitz, N.; Byun, A.; Lu, X. Wearable Activity Trackers, Accuracy, Adoption, Acceptance and Health Impact: A Systematic Literature Review. J. Biomed. Inform. 2019, 93, 103153. [Google Scholar] [CrossRef] [PubMed]
  62. Xian, Z.; Nakaya, T.; Liu, K.; Zhao, B.; Zhang, J.; Zhang, J.; Lin, Y.; Zhang, J. The Effects of Neighbourhood Green Spaces on Mental Health of Disadvantaged Groups: A Systematic Review. Humanit. Soc. Sci. Commun. 2024, 11, 488. [Google Scholar] [CrossRef]
Figure 1. Flowchart of the Section 2.
Land 13 02179 g001
Figure 2. Distribution of parks in the study area.
Land 13 02179 g002
Figure 3. An example of the scoring process based on a group of data.
Land 13 02179 g003
Figure 4. The optimization process of urban park service equity.
Land 13 02179 g004
Figure 5. The scores of PCAS and park sports facilities. (a) illustrates the PCAS and its sub-dimensions across 13 parks. (b) shows the detailed scores of park sports facilities, which contain six aspects for each park.
Land 13 02179 g005
Figure 6. Spatial distribution characteristics of the PSI and sub-dimension at the sub-district scale.
Land 13 02179 g006
Figure 7. Spatial distribution characteristics of the PDI and sub-dimension at the sub-district scale.
Land 13 02179 g007
Figure 8. The visualization result of LQ.
Land 13 02179 g008
Figure 9. Changes in park distribution before and after applying Scenario I.
Land 13 02179 g009
Figure 10. Spatial distribution characteristics of PSI in Scenario I.
Land 13 02179 g010
Figure 11. Lorentz curve in Scenario I.
Land 13 02179 g011
Figure 12. Accessibility changes before and after entering Scenario II.
Land 13 02179 g012
Figure 13. Spatial distribution characteristics and comparison of PSI in Scenario III and Scenario I.
Land 13 02179 g013
Table 1. Details of 13 urban parks in the study area.
Park NamePark Area/haPark ClassificationCompletion Year
Weibin Park22.65G111964/2015
Tongyi Square29.25G132008
Liangsidu Park55.51G112015–2019
Five Ring Sports Park47.23G132017
Silu Park20.02G112015
Baimahe Park3.26G122020
Fengxi New City
Central Green Corridor
39.22G132018
Fenghe Forest Park17.98G132014
Qindu Cultural Park9.71G122013
Binhe Wetland Park22.07G132020
Nanyuan Park25.81G112019
Gudu Park5.45G131992
Gudu Heritage Park12.16G132019
Note: According to the People’s Republic of China Standard for Classification of Urban Green Space (CJJ/T85-2017) [28], G11 is a comprehensive park designed for various outdoor activities, featuring full recreational and supporting management facilities; G12 is a community park, serving as a neighborhood green space for daily leisure with basic facilities; and G13 is a specialized park, offering themed green space with specific recreational facilities.
Table 2. Calculation methods for sub-dimension in PCAS.
PCAS Sub-DimensionItemMethod
Park areaPark size/hm2Calculated using ArcGIS 10.7
Park accessibilityPopulation in the service area/personA network analysis approach using GIS to calculate street population
Park sports facilitiesSports field/m2Field measurements
Square/m2Field measurements
Walking path/m2Field measurements
Children’s physical activity field/m2Field measurements
Children’s playground/m2Field measurements
Site diversity indexHill numbers index
Table 3. The matching relationship of park service among the 13 parks and the 14 sub-districts in the study area.
Sub-District NameCompletion TimePark NameNumber of Park Services
Xilanlu (XLU)1980Weibin Park5
Binhe Wetland Park
Nanyuan Park
Qindu Cultural Park
Tongyi Square
Renminlu (RM)1980Weibin Park4
Binhe Wetland Park
Nanyuan Park
Tongyi Square
Chenyangzhai (CYZ)2001Weibin Park7
Binhe Wetland Park
Fenghe Forest Park
Gudu Heritage Park
Gudu Park
Nanyuan Park
Tongyi Square
Xinxing (XX)1949Weibin Park5
Gudu Heritage Park
Gudu Park
Nanyuan Park
Tongyi Square
Zhongshan (ZS)1986Weibin Park5
Gudu Heritage Park
Gudu Park
Nanyuan Park
Tongyi Square
Diaotai (DT)2007Baimahe Park4
Fengxi New City
Central Green Corridor
Liangsidu Park
Five Ring Sports Park
Weiyangxilu (WYXL)2001Binhe Wetland Park2
Qindu Cultural Park
Fengdong (FD)Before 2002Fenghe Forest Park2
Nanyuan Park
Wenhuilu (WHL)1987Gudu Heritage Park2
Gudu Park
Weiyang (WY)2001Gudu Heritage Park2
Gudu Park
Weibin (WB)Designated as a High-Tech Zone in 2005; Changed from town to sub-district in 2011.Liangsidu Park3
Silu Park
Five Ring Sports Park
Maquan (MQ)2007Silu Park1
Gudu (GD)2001/0
Wujiabao (WJB)1992/0
Table 4. The interpretation of Gini coefficient indices.
IndexEvaluation
Gini Coefficient<0.2Perfect equality
0.2–0.3Relative equality
0.3–0.4Adequate equality
0.4–0.5Big equality gap
>0.5Severe equality gap
Table 5. Changes in Gini coefficient in Scenario I.
Gini CoefficientBefore OptimizationAfter OptimizationChange
Total of Park Services0.380.3−0.08
Area Dimension0.470.39−0.08
Accessibility Dimension0.480.38−0.1
Sports Facilities Dimension0.420.3−0.12
Table 6. The PSI before and after accessibility improvement in Scenario II.
Diaotai Sub-DistrictChenyangzhai Sub-District
PSIScores in Scenario IScores in Scenario IITrendScores in Scenario IScores in Scenario IITrend
Total Score31295048
Area Dimension55344643
Accessibility Dimension7267371
Sports Facilities Dimension30283130
Note: The arrows show the trend of the scores, ↑ indicates an increase and ↓ indicates a decrease from Scenario I to Scenario II.
Table 7. Changes in Gini coefficient in Scenario II.
Gini CoefficientBefore OptimizationAfter OptimizationChange
Total of Park Services0.30.30
Area Dimension0.390.37−0.02
Accessibility Dimension0.380.380
Sports Facilities Dimension0.30.320.02
Disclaimer/Publisher’s Note: The statements, opinions and data contained in all publications are solely those of the individual author(s) and contributor(s) and not of MDPI and/or the editor(s). MDPI and/or the editor(s) disclaim responsibility for any injury to people or property resulting from any ideas, methods, instructions or products referred to in the content.

