Article

Spatiotemporal Characteristics of Carbon Emissions from Construction Land and Their Decoupling Effects in the Yellow River Basin, China

1
Business School, Shandong University of Technology, Zibo 255000, China
2
School of Civil Engineering and Geomatics, Shandong University of Technology, Zibo 255000, China
*
Authors to whom correspondence should be addressed.
Land 2025, 14(2), 320; https://doi.org/10.3390/land14020320
Submission received: 3 December 2024 / Revised: 18 January 2025 / Accepted: 26 January 2025 / Published: 5 February 2025

Abstract

:
Carbon emissions (CE) from expanding construction land (CL), a vital territory for human production and habitation, have contributed to climate change worldwide. The Yellow River Basin (YRB), an essential economic region and energy supply base in China, is experiencing rapid urbanization, and the contradiction between economic development and ecological protection is increasingly acute. Consequently, a thorough examination of the spatial and temporal change features of carbon emissions from construction land (CECL) and its decoupling from economic growth (EG) is crucial for the maintaining development of the region. This study adopts the IPCC carbon emission coefficient approach for measuring the CECL in the YRB from 2010 to 2021. The temporal and spatial variation features of CECL in the YRB were revealed using ArcGIS software and the standard deviation ellipse (SDE) model. The decoupling effect between CECL and EG was analyzed using the Tapio decoupling model and innovatively combined with the Logarithmic Mean Divisia Index (LMDI) method to explore the influence of five main drivers on the decoupling effect. This study found that: (1) The CECL rose from 2.463 billion tons in 2010 to 3.329 billion tons in 2021. The spatial layout of CECL is “high in the east and low in the west”. (2) The SDE of CECL is distributed in the direction of “northeast to southwest”, and the gravity center’s moving path is “northwest to northeast to northwest”; (3) weak decoupling (WD) is the main decoupling state between CECL and EG; (4) the economic output effect and the construction land (CL) scale effect are the two main factors inhibiting the decoupling of CECL, while the energy intensity effect, the population density effect, and the energy structure effect are the main elements motivating the decoupling of CECL. This study provides specific references and bases for the YRB in China and other countries and regions with similar levels of development in promoting green and ecologically friendly initiatives and achieving low-carbon utilization of regional land and sustainable development.

1. Introduction

The global climate issue is widely viewed as one of the most severe threats to human societies in the 21st century [1], and its impacts affect various aspects of natural ecosystems and human societies. Research has shown that carbon dioxide (CO2), the most abundant greenhouse gas, contributes at least 66% to global climate change [2]. Unreasonable activities by humankind have caused the climbing intensity of CO2 in the atmosphere, further aggravating the global warming climate. Therefore, carbon emissions (CE) have become a global problem of international concern [3]. Regarding the sources of CE, emissions yielded from burning fossil fuels are considered the main reason for global warming [4]. Accordingly, reducing CE related to energy usage has become a central challenge for achieving global “dual-carbon” targets [5]. In addition, the Sixth Assessment Report of the IPCC states that the human alteration of land use and cover change have become the second primary origin of CE only after fossil fuels [6]. Consequently, it is of great significance to examine land use CE from the viewpoint of land use and its management to improve the country’s low-carbon development strategy and achieve the “dual-carbon” goal [7].
Academic research on the influences of land use and cover change on CE has been fruitful. Scholars have carried out a wide range of explorations by adopting diverse methods according to different research purposes. For instance, Zhang et al. [8] used data on land use type to explore the spatiotemporal distribution modes of CE in the Yellow River Delta. Based on the GTWR model and potential contributors, He et al. [9] examined the spatiotemporal features of land use CE in China’s Zhejiang Province. The majority of academics have achieved a great amount of valuable work on changes in industrial land use [10,11], agricultural land use [12,13], and plant cover [14,15] in relation to the impact of variations in specific land use subdivisions on CE.
Numerous studies have shown that among the many factors causing land use changes, the expansion of construction land (CL) area is the biggest contributor to increased CE [1,16]. On the one hand, the expansion of CL makes the ecological land with the function of carbon sink, such as grassland, forest, and water, decrease significantly [17]. Simultaneously, a multitude of construction-related and industrial activities [18] have also increased CE related to energy use [1,19]. Growth in accordance with construction land has a complicated effect on CE. The CL in different regions has different modes and intensities of use, and the corresponding human activities and energy demands are also different. Thus, the impact on CE has some regional heterogeneity [20]. As a result, a thorough investigation into the regional variations in CECL is required.
Regarding the measurement methods of CECL, academics mainly use the direct measurement method and indirect estimation method based on IPCC carbon emission factors. The direct estimation method based on IPCC refers to the use of the product of the CL area and the CE factor of the CL to directly represent the CECL. For example, Liu et al. [21] applied the direct estimation method to estimate the CECL in analyzing the CE from land use in the three areas of Xiamen–Zhangzhou–Quanzhou. The core idea of the indirect estimation method based on IPCC is to consider that CECL is mainly generated by energy consumption and, therefore, indirectly represents CECL by estimating CE from energy consumption [22,23]. Although the direct estimation method mainly relies on two types of data, CL area and CE factor, which are relatively easy to obtain and simple to calculate, this method is usually determined based on certain assumptions and average situations—it is considered that the CE generated by CL per unit area is equal. In reality, the actual CE of different regions and types of CL may differ greatly. For instance, the same area of CL, due to the varied energy consumption structure and energy utilization efficiency, can lead to a large difference in the CE generated on the CL. Therefore, using the same CE factors leads to inaccurate estimation results. The indirect estimation method can more comprehensively consider the contribution of various energy-consuming activities to CE on construction sites, and its accuracy advantage is more obvious; it has also become a method widely applied by many scholars to explore the CECL based on different administrative levels. For instance, Li et al. [24] employed the IPCC indirect estimation method to estimate the CECL in Shanghai, and Cai et al. [25] estimated the CECL in Jiangsu Province, China.
In recent years, with the expansion of the scale of human production and the improvement of living standards, CE has continued to grow, and academics have begun to focus on the correlation between CE and economic growth (EG); the Tapio decoupling model [26] is a widely employed research model by scholars. Scholars have used the Tapio decoupling model to launch abundant studies on the decoupling relation between CE and EG in agriculture [27], livestock [28], tourism [29], transportation [30], and other industries. With the depth of research, scholars initially concentrated on the influencing factors of CE. The Logarithmic Mean Divisia Index (LMDI) is a decomposition model of influencing factors proposed by Ang et al. [31]. Due to its full decomposition, lack of residual, and ease of use and understanding, LMDI has been widely used [32]. Many researchers started using the Tapio decoupling model with the LMDI decomposition method in their studies to better represent the role of CE drivers in the decoupling process. In selecting influencing factors, demographic factors, affluence level, industrial structure, energy consumption structure, and so on were widely included in scholars’ studies [32,33]. For example, Chen et al. [34] employed the Tapio and LMDI models to study the association between EG and CE in the tourism industry in the Yangtze River Delta region of China. They found that industry scale and output scale effect were the chief causes contributing to the rise of CE, but energy intensity and industrial structure had a negative impact. Guan et al. [35] disclosed the connection between energy-based CE and EG in Beijing-Tianjin-Hebei between 2005 and 2019 by applying the Tapio and the LMDI models. Their findings demonstrated that Beijing led the way in attaining strong decoupling and that CE has been supported by EG but restricted by energy intensity and structure.
The Yellow River Basin (YRB) is an essential energy production and supply region in China [36], with reserves of coal accounting for more than half of the country’s total reserve [37]. Coal, metallurgy, and heavy chemical industries—all of which are extremely polluted and energy-intensive—dominate its industrial structure [38]. Academic research on the YRB mainly focuses on ecological environment and restoration [39,40], water resource management [41,42], and climate and land change [43,44]. Currently, the YRB is experiencing a surge in urbanization. The demand for energy in urban infrastructure construction, industrial production, and residential life has risen dramatically, which has led to a corresponding rise in energy consumption and CE [38]. As an important economic region in China, the total economic volume of the YRB accounts for more than 25% of China’s total economic volume [45], and the economy of the YRB has achieved vigorous development in recent years [46], playing a pivotal function in China’s national economic development [47]. Nonetheless, the imbalance in economic development between the basin’s areas has long been noticeable [46]. As a result, the YRB faces serious dual challenges of CE reduction and economic development [48]. On 18 September 2019, the Chinese government proposed that the ecological preservation and high-quality development of the YRB be upgraded to a national regional strategy of development [45]. In this context, studying the decoupling relationship between EG and CE in the YRB will help to better harmonize the contradiction between economic development and ecological sustainability in the basin, prompting localities to pay more attention to energy saving, emission reduction, and ecological protection while developing the economy, so as to reduce the negative impacts of CE on the ecological environment, and better enhance the quality of the basin’s ecological condition as well as safeguard national ecological security.
In summary, previous studies related to CE from land use and decoupling of CE have achieved fruitful results and provide good references for our research. However, these studies still leave room for improvement:
(1)
At the research scale of CE, the previous studies primarily focused on countries or provinces and cities and lacked a full investigation of CE in the geographical unit of the river basin. Especially under the background that the strategy of ecological safeguarding and high-quality development of the YRB has been elevated to a national strategy, the CE within the YRB needs to be further studied.
(2)
From the point of view of the spatiotemporal characterization of CE, although many scholars have fully explored the spatiotemporal characteristics of land-use CE, research on the spatiotemporal characteristics of CECL, which is a prominent source of carbon is still relatively lacking, especially on the direction of the distribution of CECL in the region, the location of the gravity center and the trajectory of migration. This deficiency is unfavorable to a deep understanding of regional differences in CECL.
(3)
From the standpoint of decoupling analysis, scholars have adopted the Tapio decoupling model to measure the relationship between CE and EG in industry, agriculture, tourism, transportation, etc, while the degree of decoupling between CECL and EG has not been clarified.
(4)
From the perspective of the components of the LMDI decomposition model, previous studies have mainly decomposed the drives of CE into the population, economy, structure of energy, and industrial structure, and very few scholars have considered the influence of the CL area factor on CE. In our study, we take the CL area as an important factor in the impact factor decomposition model.
In addition, considering the provincial administrative divisions as geographical units with relatively independent policy-making power, they can provide an ideal analytical framework for the study, enabling the results to serve the formulation and implementation of regional policies directly. Therefore, this research takes the nine provinces in the YRB of China as the research dimension. Different from previous studies, the novelty of this study and the research questions to be examined are mainly:
(1) What are the spatiotemporal features of CECL in the YRB? What is the distribution and migration route of the gravity center of CECL? (2) What is the degree of decoupling between CECL and EG in the YRB? Has the decoupling been realized? (3) What factors have contributed to the current decoupling? What is the contribution of each factor?

2. Materials and Methods
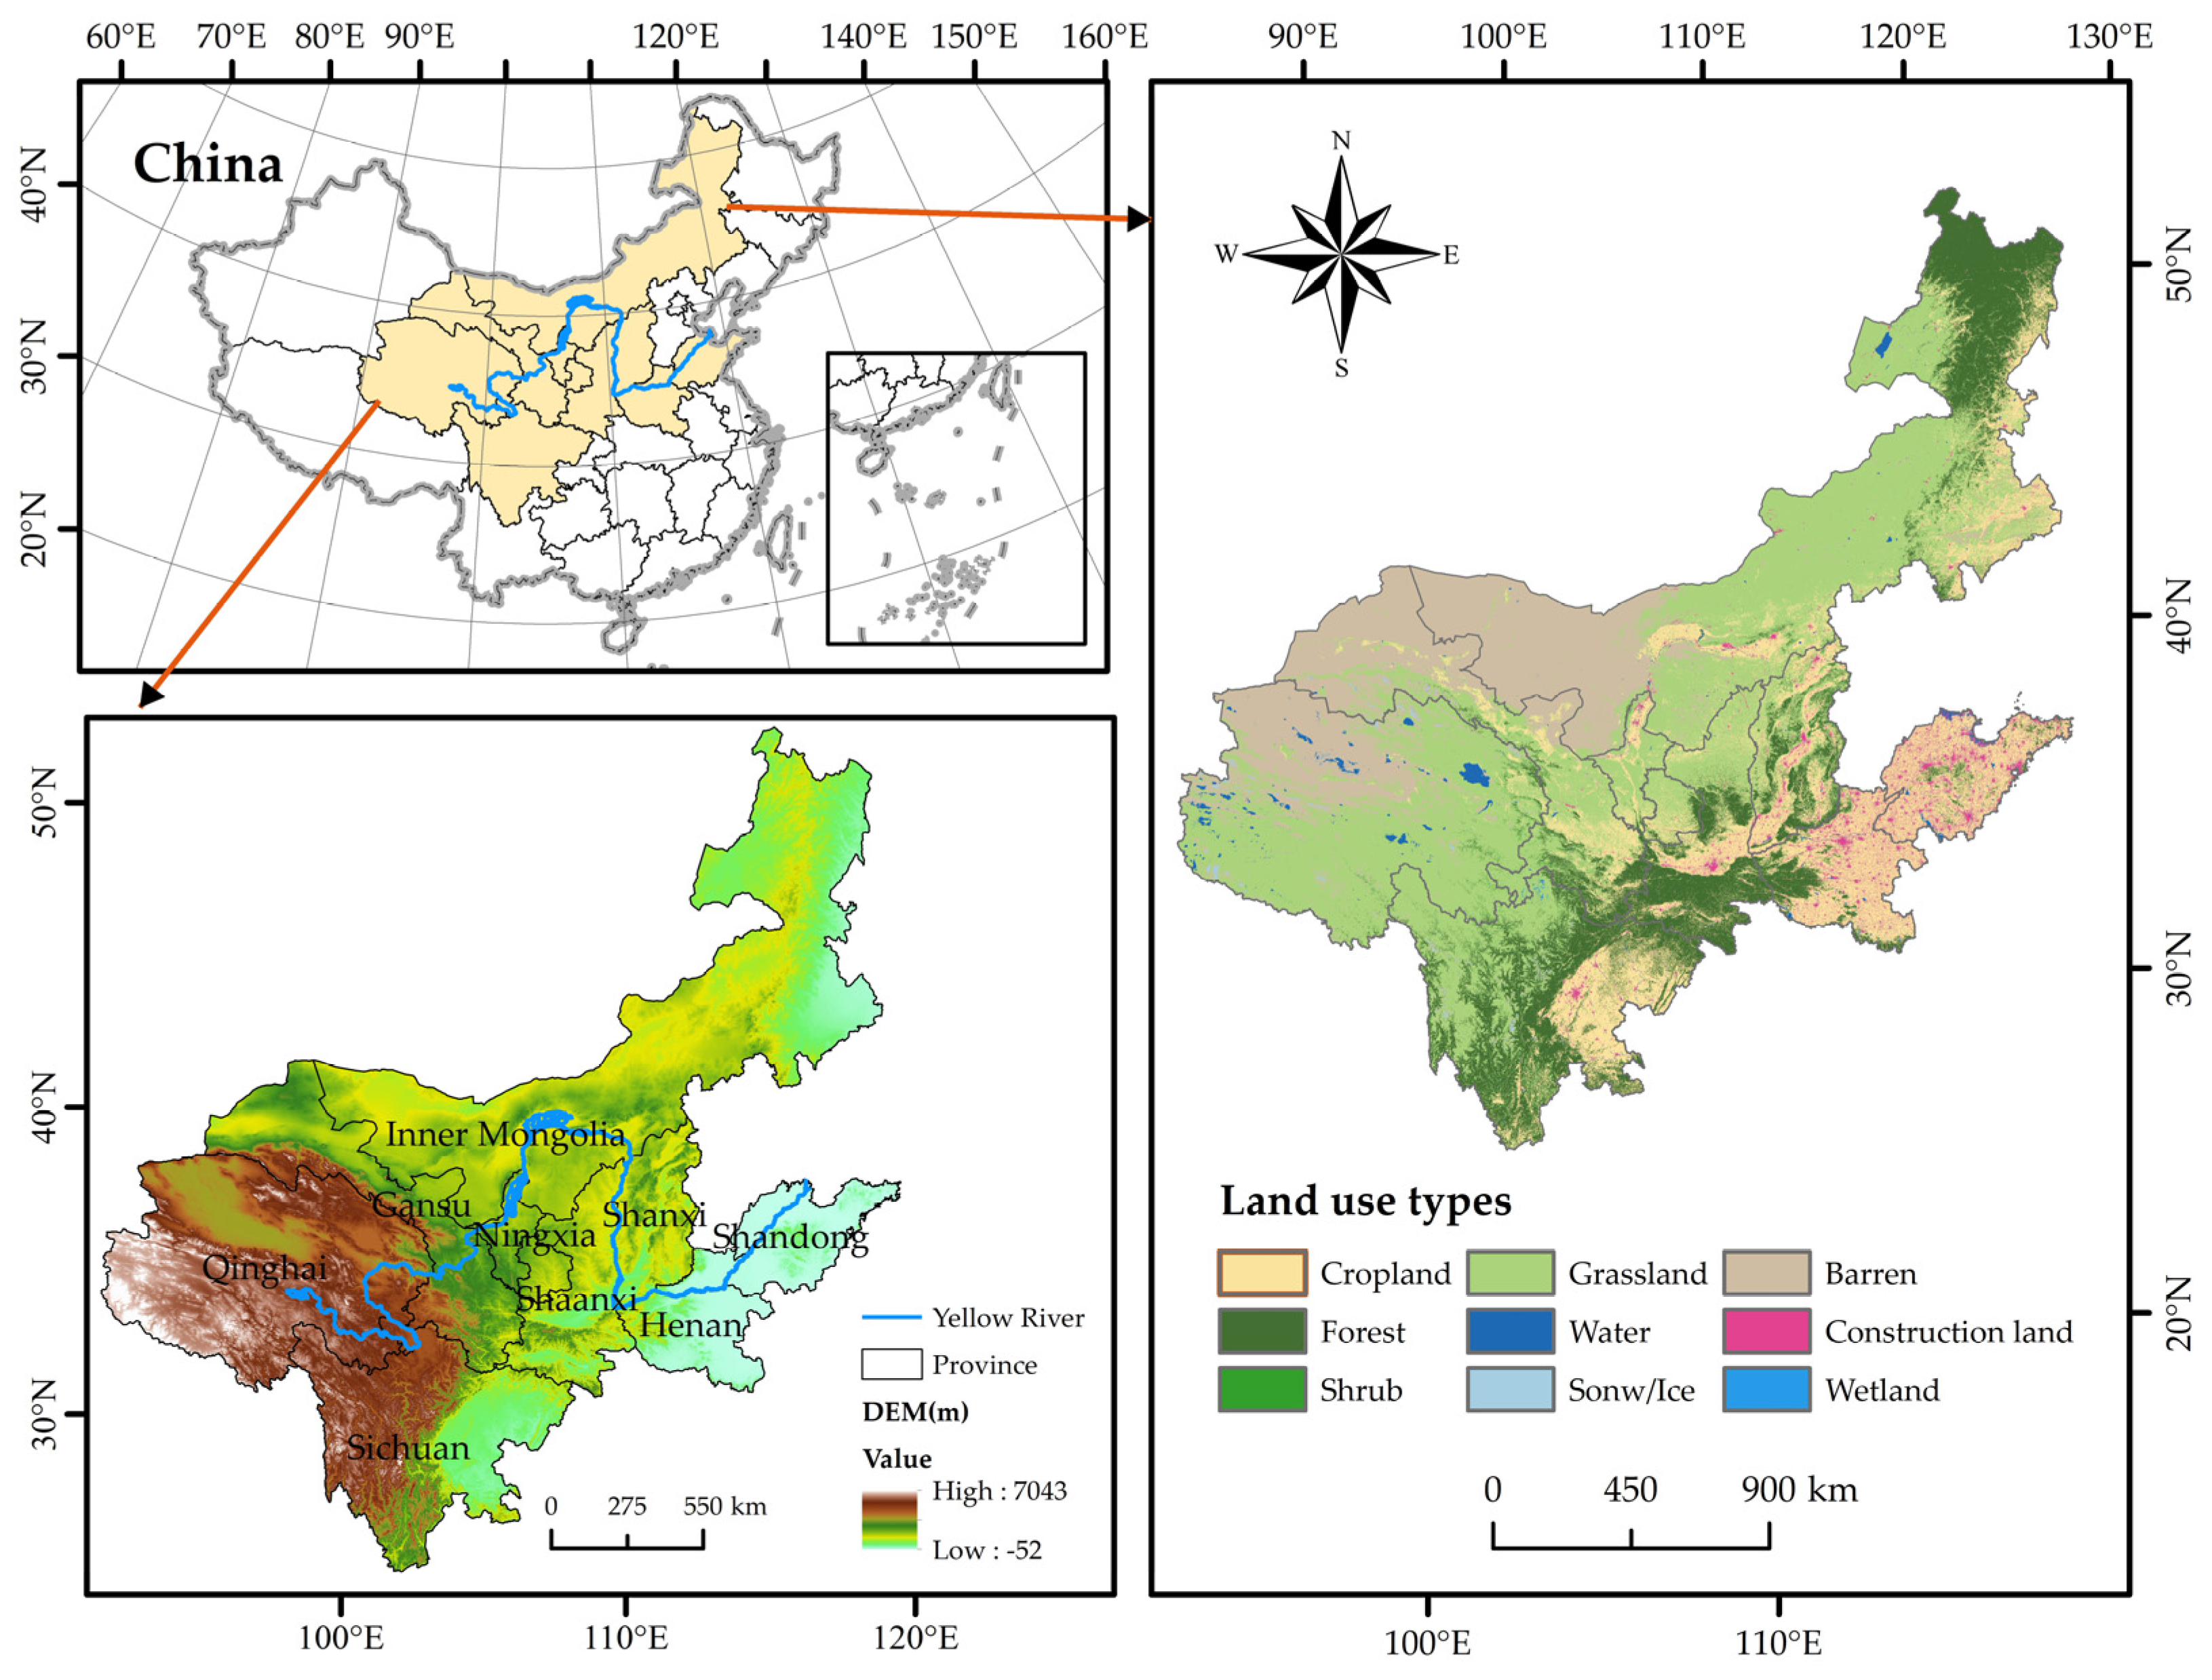
2.1. Study Area

The YRB is the geographic area affected by the Yellow River system from its origin to the sea, which extends through nine provinces: Qinghai, Sichuan, Gansu, Ningxia, Inner Mongolia, Shaanxi, Shanxi, Henan, and Shandong (Figure 1). According to the National Bureau of Statistics, by the end of 2023, the YRB’s total population was 418 million, which made up 29.7% of the population of China. The total GDP was RMB 31.66 trillion, approximately 25.2% of the national GDP. Over the past several decades, the YRB has been undergoing rapid urbanization. However, it also has to deal with issues like finite land supplies, excessive energy use, and mounting resource and environmental demands. The conflict between green development and economic prosperity in the YRB is particularly prominent [33]. In this context, balancing the relationship between EG and CECL in the YRB has become an urgent issue.

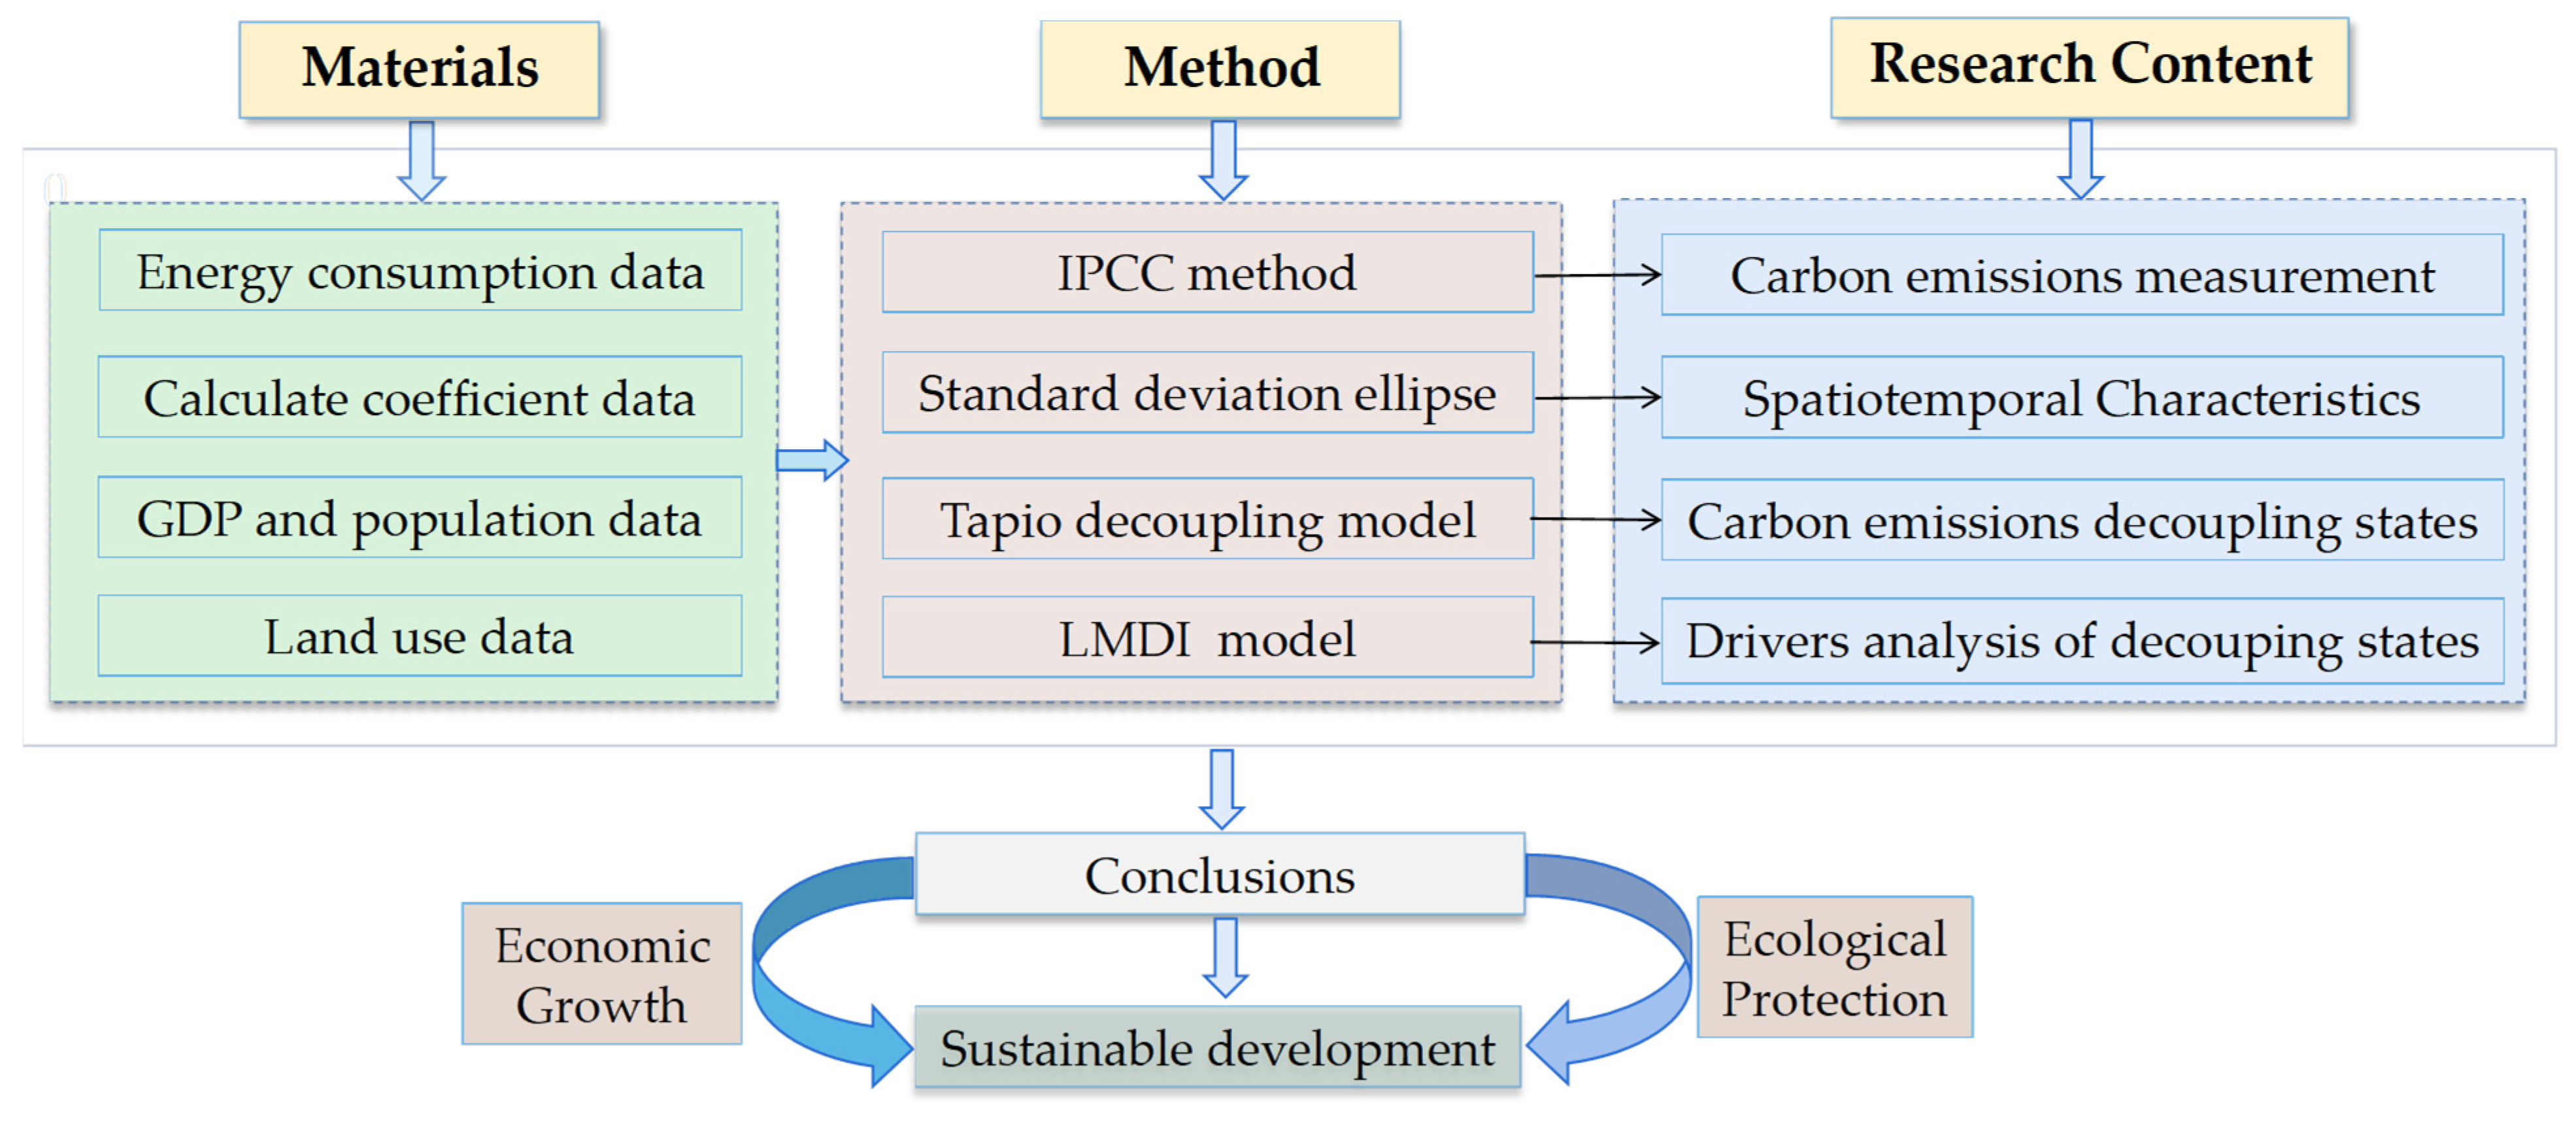
2.2. Research Framework

A scientific research framework was constructed in this study. Figure 2 shows our research framework. First, we collected the basic data needed for this study, mainly including energy consumption data, CE coefficient data, land use data, and socioeconomic data of each province. The IPCC method was used to measure the CECL of the nine provinces, and the visualization pictures were drawn to observe the temporal and spatial variations of CECL and compared with the area of CL in each province to find out whether there is a homogeneous change in the two. Next, the standard deviation ellipse (SDE) method was adopted to study the changes in gravity centers and the migration trajectory of CECL and to analyze the changes of CECL through the changes in the parameters of the SDE. Next, the Tapio decoupling model was employed to quantify the decoupling connection between CECL and EG and to clarify the influence degree of EG on the environment. Next, the decoupling index was decomposed into five elements using the LMDI model, and the driving effect and contribution of each element were explored. Finally, the findings of this paper were discussed and summarized. The research presented in this paper can serve as a reference and basis for promoting the YRB to realize the win-win scenario of EG and ecological safeguarding. It also has substantial practical significance and theoretical significance for formulating regionally differentiated ecological protection policies.

2.3. Data Sources

Land use remote sensing data were based on Landsat TM imagery supplied by the Research Center for Resources and Environmental Sciences, Chinese Academy of Sciences (http://www.resdc.cn, accessed on 25 November 2024). Energy consumption data and standard coal coefficients were obtained from the China Energy Statistical Yearbook (between 2010 and 2021). Population and GDP data were obtained from provincial statistical yearbooks (between 2010 and 2021). The standard maps of administrative divisions are from the National Geographic Information Resources Catalog Service System (https://www.webmap.cn/commres.do?method=dataDownload, accessed on 1 December 2024). The CL area data used in the analysis of drivers in this study were extracted by ArcGIS 10.8 software, which has around 94% overall interpretation accuracy [49,50] and has been widely used by scholars in different regional scopes [51,52].

2.4. Methods

2.4.1. Calculation Method of CECL

CECL mainly originates from human energy consumption activities, and this paper indirectly represents the CECL by employing the IPCC carbon emission coefficient method [53] to evaluate the CE from living production and activities carried out in CL. According to the actual situation of the nine provinces in the YRB, this study chooses eight energies. The CECL is calculated by the equation:
CO 2 = i = 1 8 E C i × η i × E F i
where CO2 denotes CECL, i symbolizes the i-th energy type, ECi denotes the i-th energy end-consumption, and EFi denotes the carbon emission coefficient of the i-th energy source. ηi is the conversion coefficient between energy i and standard coal. The coefficients involved in the equation are shown in Table 1 [54].

2.4.2. Standard Deviational Ellipse

The SDE [55] is a space statistical approach to disclose the distributional attributes and temporal and spatial changes of spatial geographic elements [56], and the main parameters include the gravity center of the distribution, the long axis, the short axis, etc [57]. The gravity center of the SDE indicates the relative position of the spatial distribution of spatial variables, and the long and short axes represent the extent of dispersion of geographic elements in the primary and secondary directions, respectively; the azimuth angle represents the direction of the primary trend of the distribution of geographic elements. Here are the equations:
X ¯ = j = 1 n w j x j j = 1 n w j , Y ¯ = j = 1 n w j y j j = 1 n w j
tan θ = ( j = 1 n w j 2 x j 2 ¯ j = 1 n w j 2 y j 2 ¯ ) + ( j = 1 n w j 2 x j 2 ¯ j = 1 n w j 2 y j 2 ¯ ) 2 + 4 j = 1 n w j 2 x j 2 ¯ y j 2 ¯ 2 j = 1 n w j 2 x j ¯ y j ¯
σ x = j = 1 n ( w j x j ¯ cos θ w j y j ¯ sin θ ) 2 j = 1 n w j 2 , σ y = j = 1 n ( w j x j ¯ sin θ w j y j ¯ cos θ ) 2 j = 1 n w j 2
where j is the province of the j-th study area, wj is the weight of the j-th study object, representing the CECL in different provinces; X ¯ , Y ¯ are the spatial coordinates of the gravity center of the SDE; xj, yj are the coordinates of the center of the study object; x j ¯ , y j ¯ are the deviations of the horizontal and vertical coordinates of the center point of the study areas from the gravity center; θ is the azimuthal angle; and δx and δy are the standard deviation on the x-axis and y-axis.

2.4.3. Tapio Decoupling Model

The Tapio decoupling model is an analytical model introduced by Tapio [26] in 2005, which is frequently utilized to study the connection between ED and CE. Here is the equation:
ε = Δ C / C 0 Δ G D P / G D P 0
where ε is the decoupling index of CECL; C0 is the CECL in the base period; ΔC is the increment in CECL; GDP is the gross domestic product in the base period; and ΔGDP is the increment in GDP.

2.4.4. Decoupling Index Decomposition Model Based on Kaya-LMDI

The Kaya identity was first introduced by Kaya et al. [58] in 1989 to solve the issue of factor disintegration of greenhouse gas emissions. Here is the equation:
C = C E × E G D P × G D P P × P
where C, E, GDP, and P represent the CE, total energy use, gross domestic product, and population size, respectively. C/E is the CE coefficient; E/GDP is the energy intensity; and GDP/P is the GDP per capita.
In this study, based on Equation (6), we add energy type Ei, CL area A, and expand the driving factors to six sub-factors, as follows:
C = i = 1 8 C i E i × E i E × E G D P × G D P P × P A × A = f i × s i × e × g × d × a
where Ei/E represents the share of total energy accounted for by the i-th energy source. fi, si, e, g, d, a denote the CE coefficient, energy structure, energy intensity, GDP per capita, population density, and CL area, respectively. The meanings of the remaining letters are the same as above.
The LMDI decomposition model is an extended model of the Kaya identity proposed by Ang et al. [31]. The model has good advantages, e.g., the residual term can be decomposed and is easy to use [59], and has been extensively employed by academics in research fields such as low carbon economy; its equation is as follows:
Δ C = C t C 0 = C t C 0 ln C t ln C 0 ln C t C 0 = Δ C f i + Δ C s i + Δ C e + Δ C g + Δ C d + Δ C a
where ΔC represents the increment CECL, ΔCfi represents the CE coefficient, ΔCsi represents the energy structure, ΔCe represents the energy intensity, ΔCg represents the economic output, ΔCd represents the population density, and ΔCa represents the construction land scale. The breakdown results of each effect are as follows:
Δ C f = i C t C 0 ln C t ln C 0 ln f t f 0
Δ C s = i C t C 0 ln C t ln C 0 ln s t s 0
Δ C e = i C t C 0 ln C t ln C 0 ln e t e 0
Δ C g = i C t C 0 ln C t ln C 0 ln g t g 0
Δ C d = i C t C 0 ln C t ln C 0 ln d t d 0
Δ C a = i C t C 0 ln C t ln C 0 ln a t a 0
Then, according to the Kaya-LMDI model, the Tapio decoupling model could be rewritten as follows:
ε ( C , G D P ) = Δ C C 0 Δ G D P G D P 0 = ( Δ C f + Δ C s + Δ C e + Δ C g + Δ C d + + Δ C a ) × G D P 0 C 0 × Δ G D P = ε f + ε s + ε e + ε g + ε d + ε a
where εf is the decoupling index of CE coefficient effect, εs is the decoupling index of energy structure effect, εe is the decoupling index of energy intensity effect, εg is the decoupling index of economic output effect, εd is the decoupling index of population density effect, and εa is the decoupling index of construction land scale effect. The rest of the letters have the same meaning as above. The carbon emission coefficient of each energy form is a fixed value, so εf = 0. Therefore, the following analysis does not take into account the effect of εf and considers the effect of the remaining five factors.

3. Results

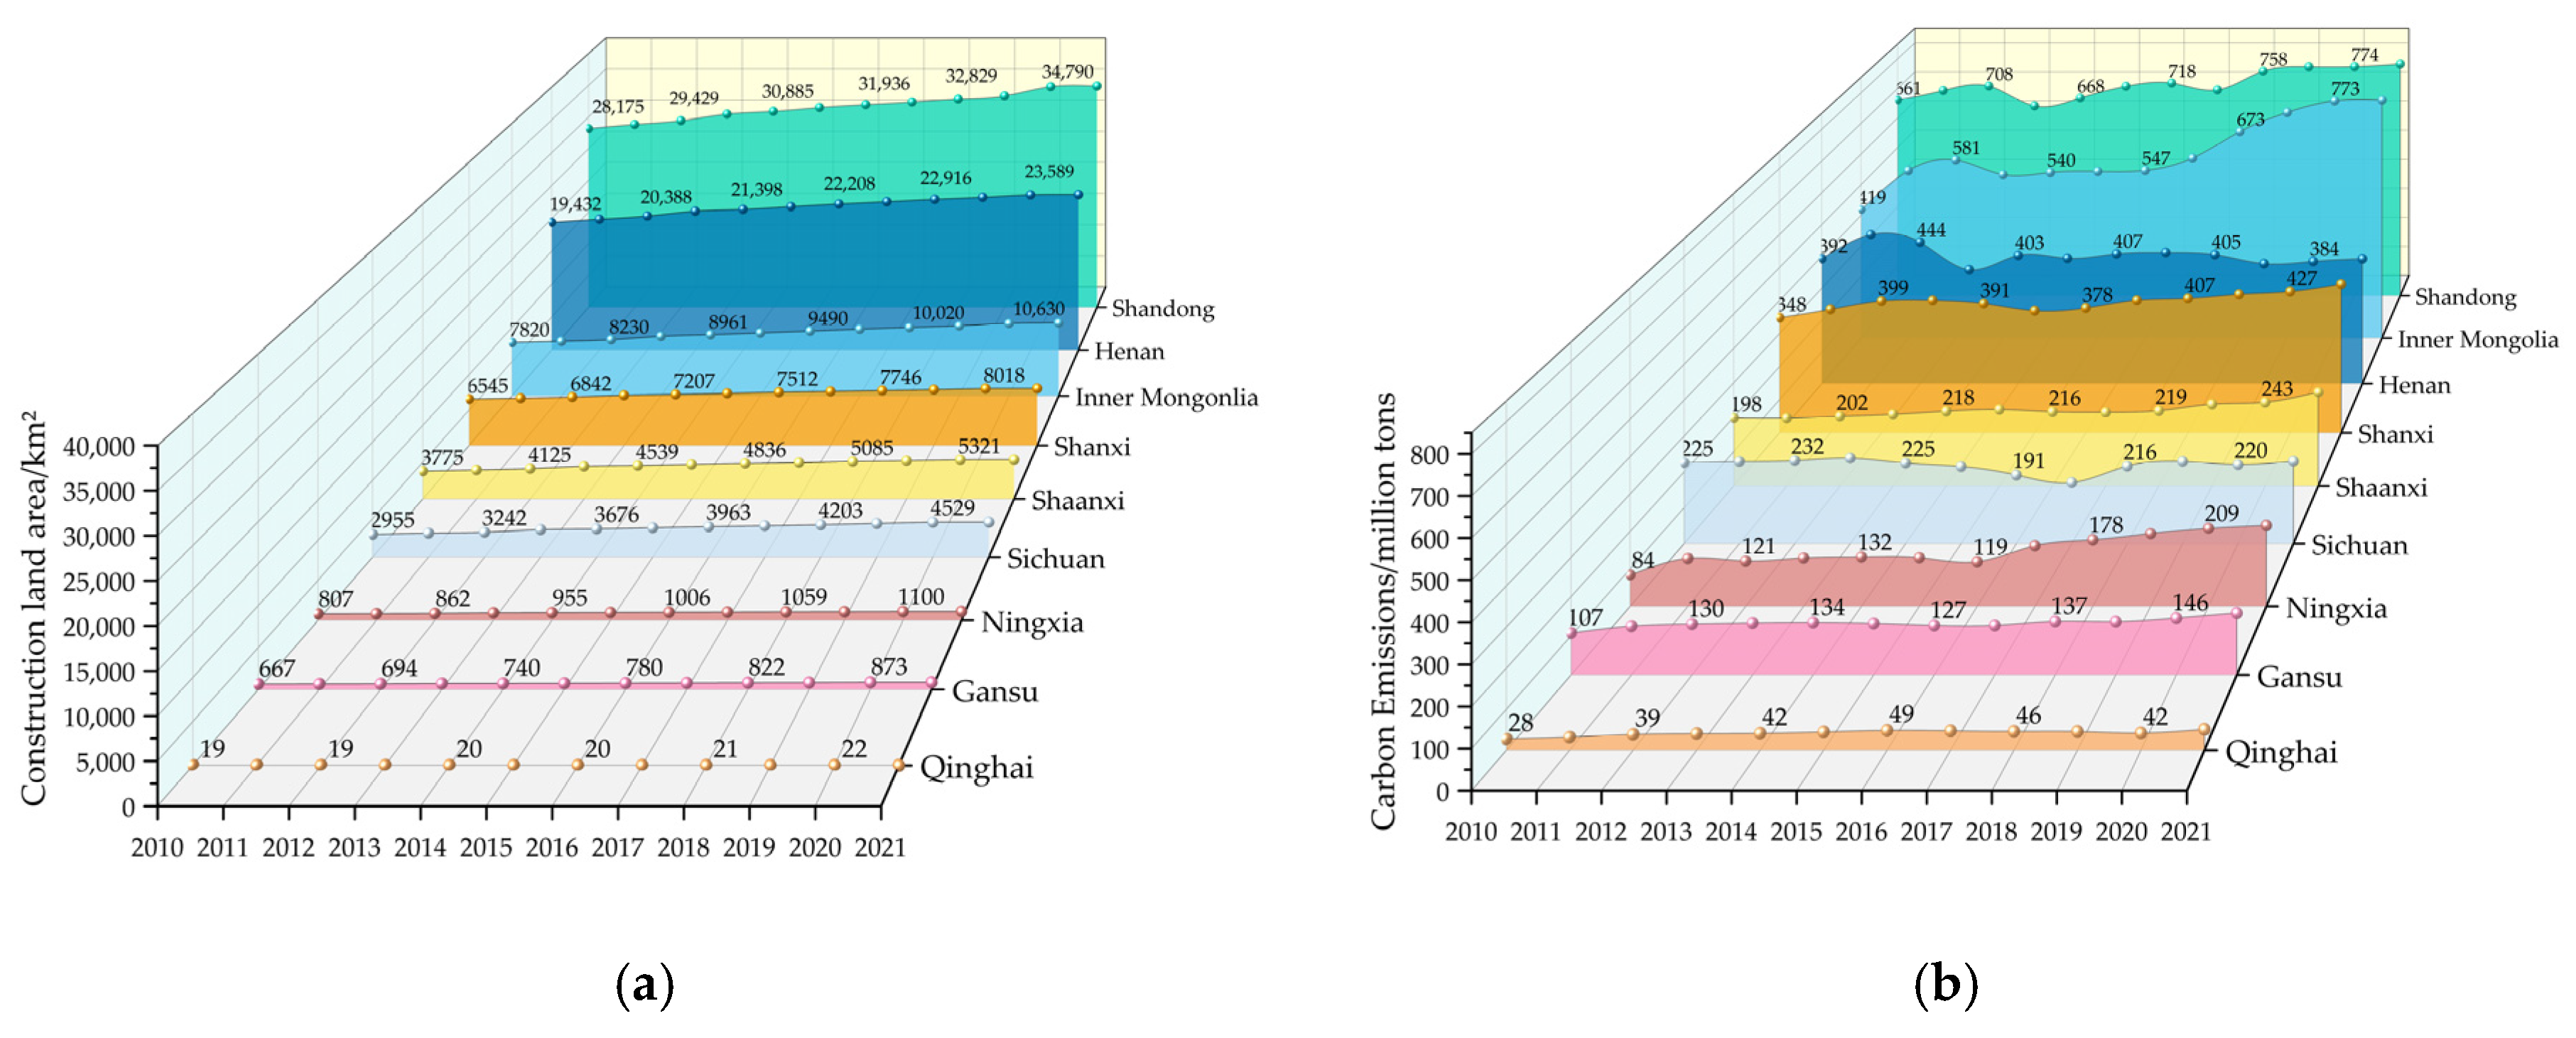
3.1. Temporal and Spatial Features of CECL

3.1.1. Time Series Characteristics Analysis of the CECL in YRB

It is evident that there is some degree of an isotropic tendency in both the CECL and CL areas. The YRB’s overall CL area increased from 71,979.83 km2 to 89,169.81 km2 between 2010 and 2021 (Figure 3a), indicating an upward trend in terms of total area. Between 2010 and 2021, the total CE from the energy use of CL increased by 866 million tons, from 2.463 billion tons to 3.329 billion tons (Figure 3b). Specifically, it is roughly divided into three stages, with a period of rapid growth from 2010 to 2012, a stable low-speed growth stage from 2013 to 2017, and a relatively slow upward trend from 2018 to 2021, which suggests that the YRB has achieved initial success in CE reduction for the past few years.
The overall CECL in the YRB is in an upward trend and has not peaked during the study period. Based on the current growth rate, it is presumed that it is difficult to reach carbon peaking in the short term.
Figure 4a,b shows the change trend of CL area and its CE in each province between 2010 and 2021. The nine provinces’ total CECL and CL areas exhibit varying trends, as may be observed. Among them, the western provinces in the YRB, such as Qinghai, Gansu, Ningxia, and Sichuan, possess smaller CL areas and CE, and the interannual rate of change is relatively smooth without significant fluctuation trends. On the other hand, the eastern provinces, such as Shandong, Inner Mongolia, and Shanxi, show a notable upward trend in the CL area and CE. There is a substantial correlation between the area of CL and CE in the nine provinces of the YRB, which reflects that there may be an immediate association between the intensity of CL development and the intensity of consumption of energy.

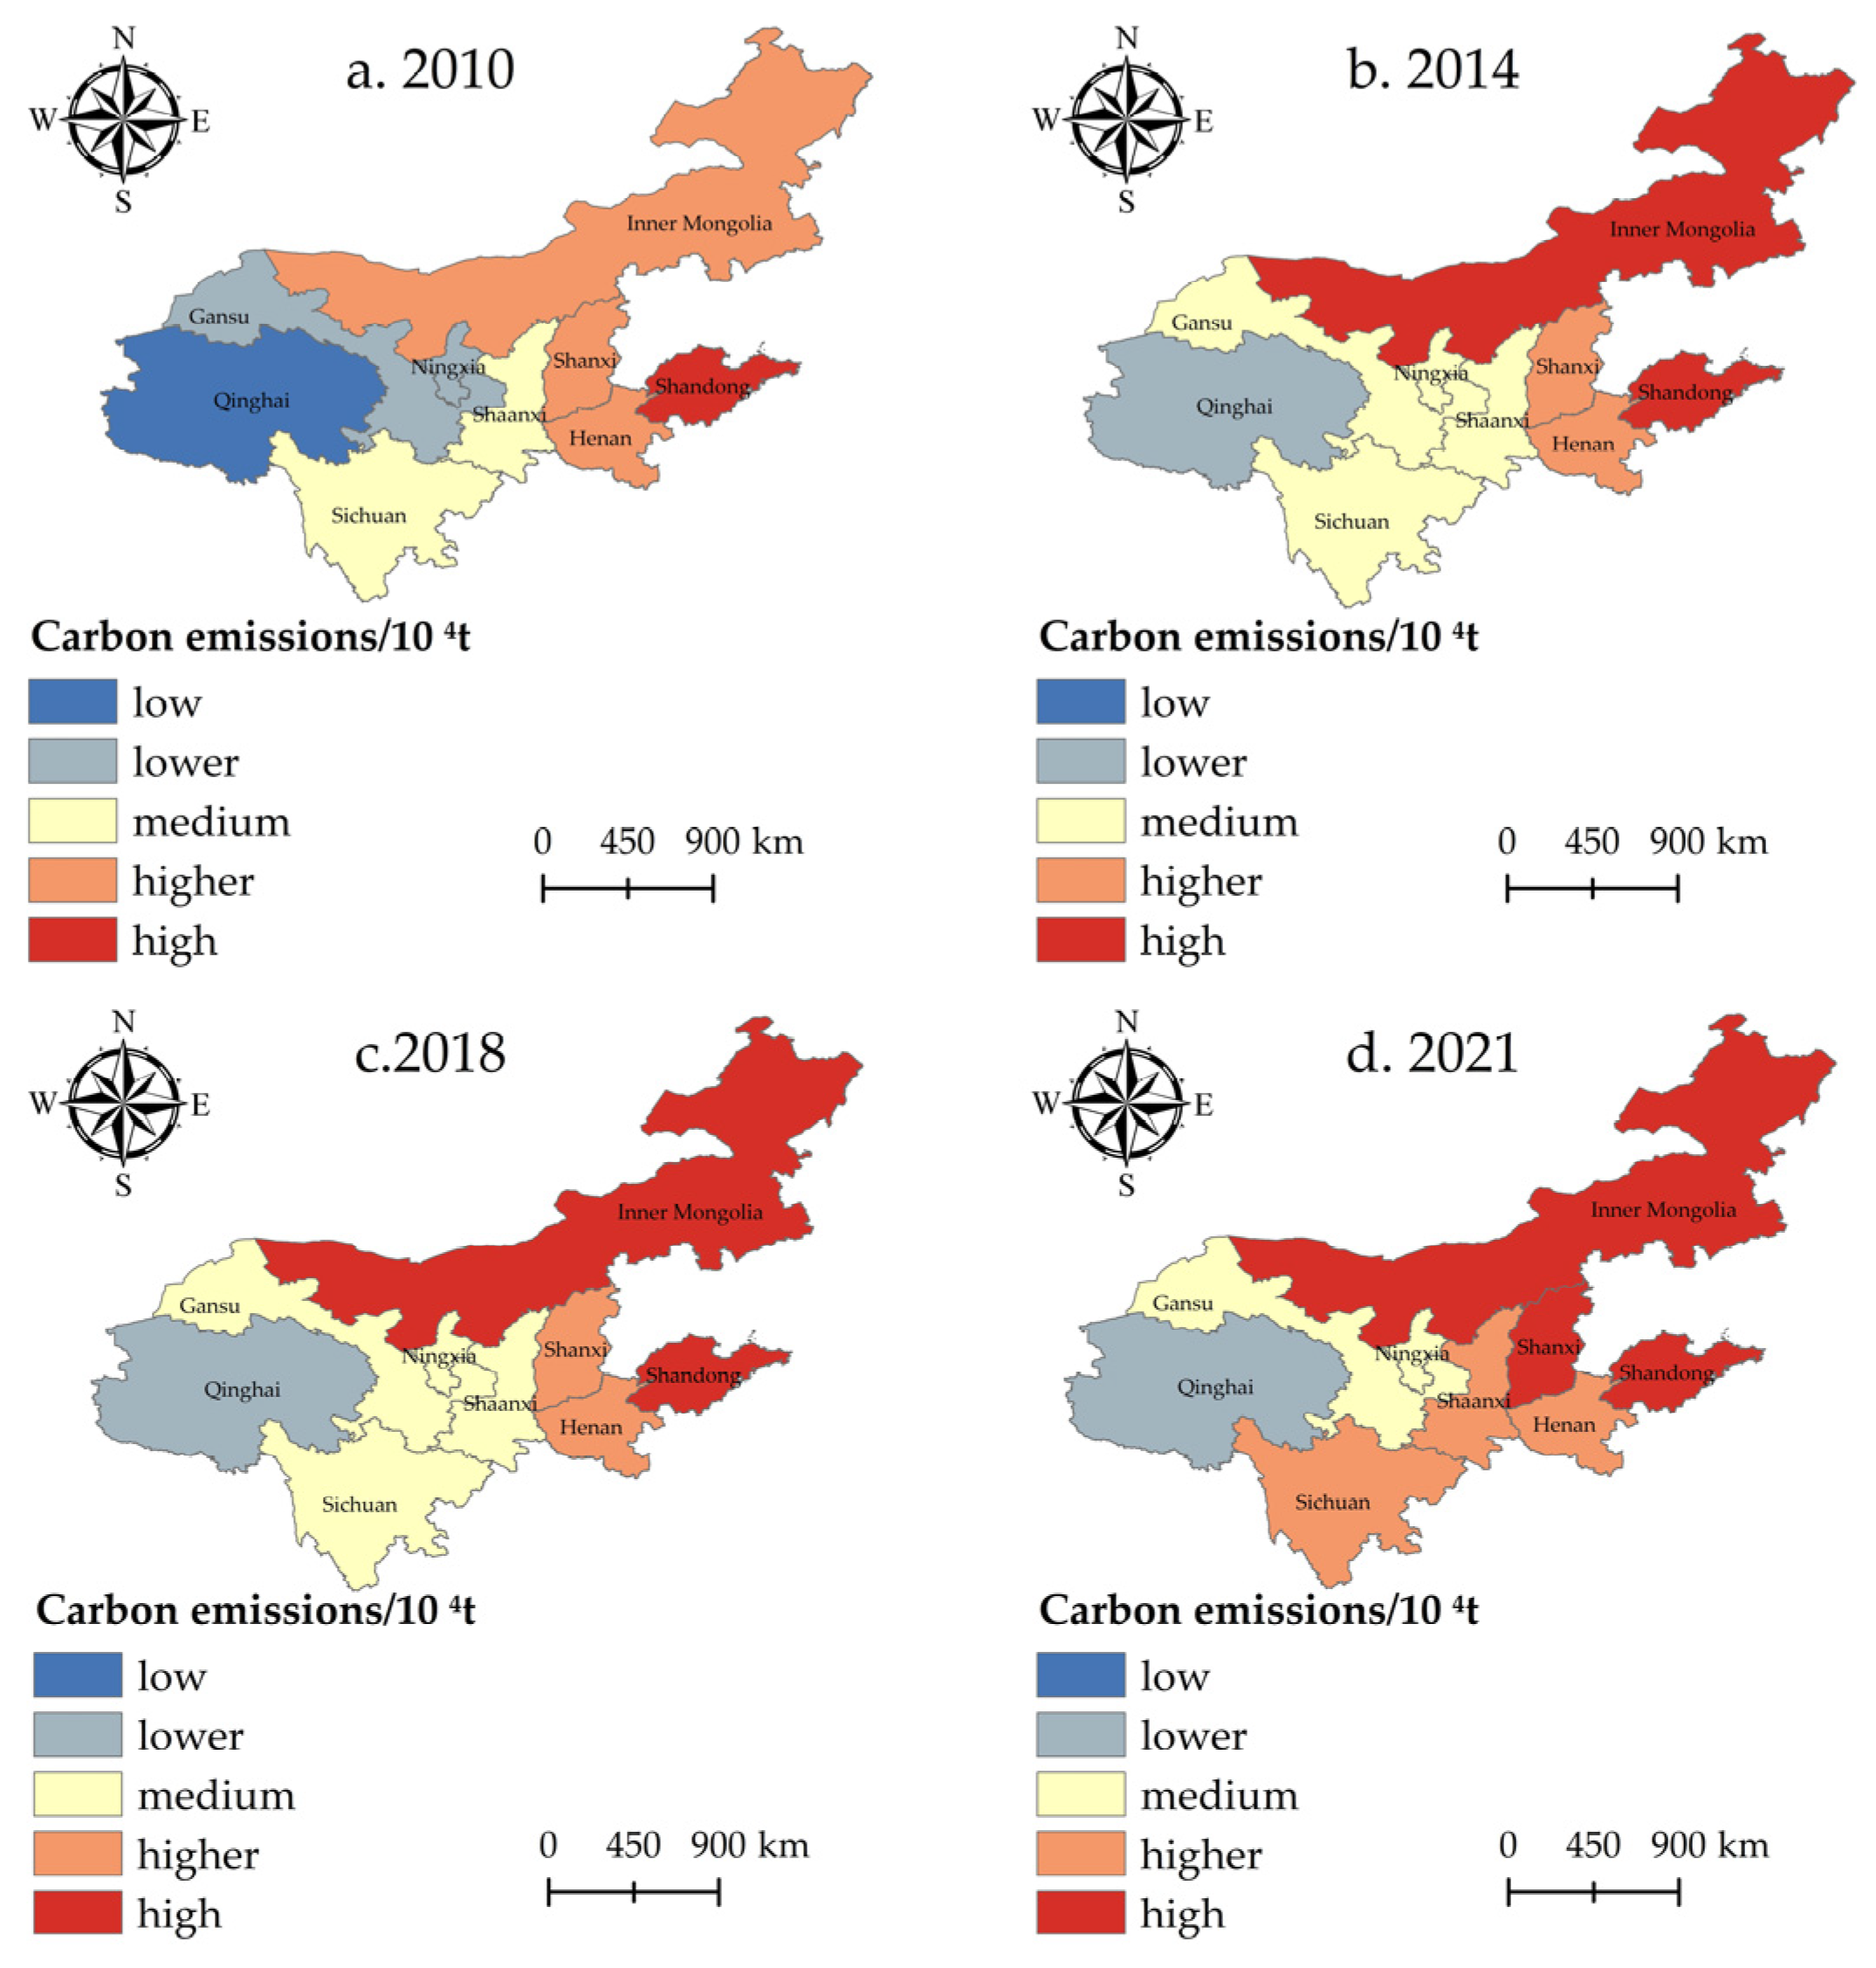
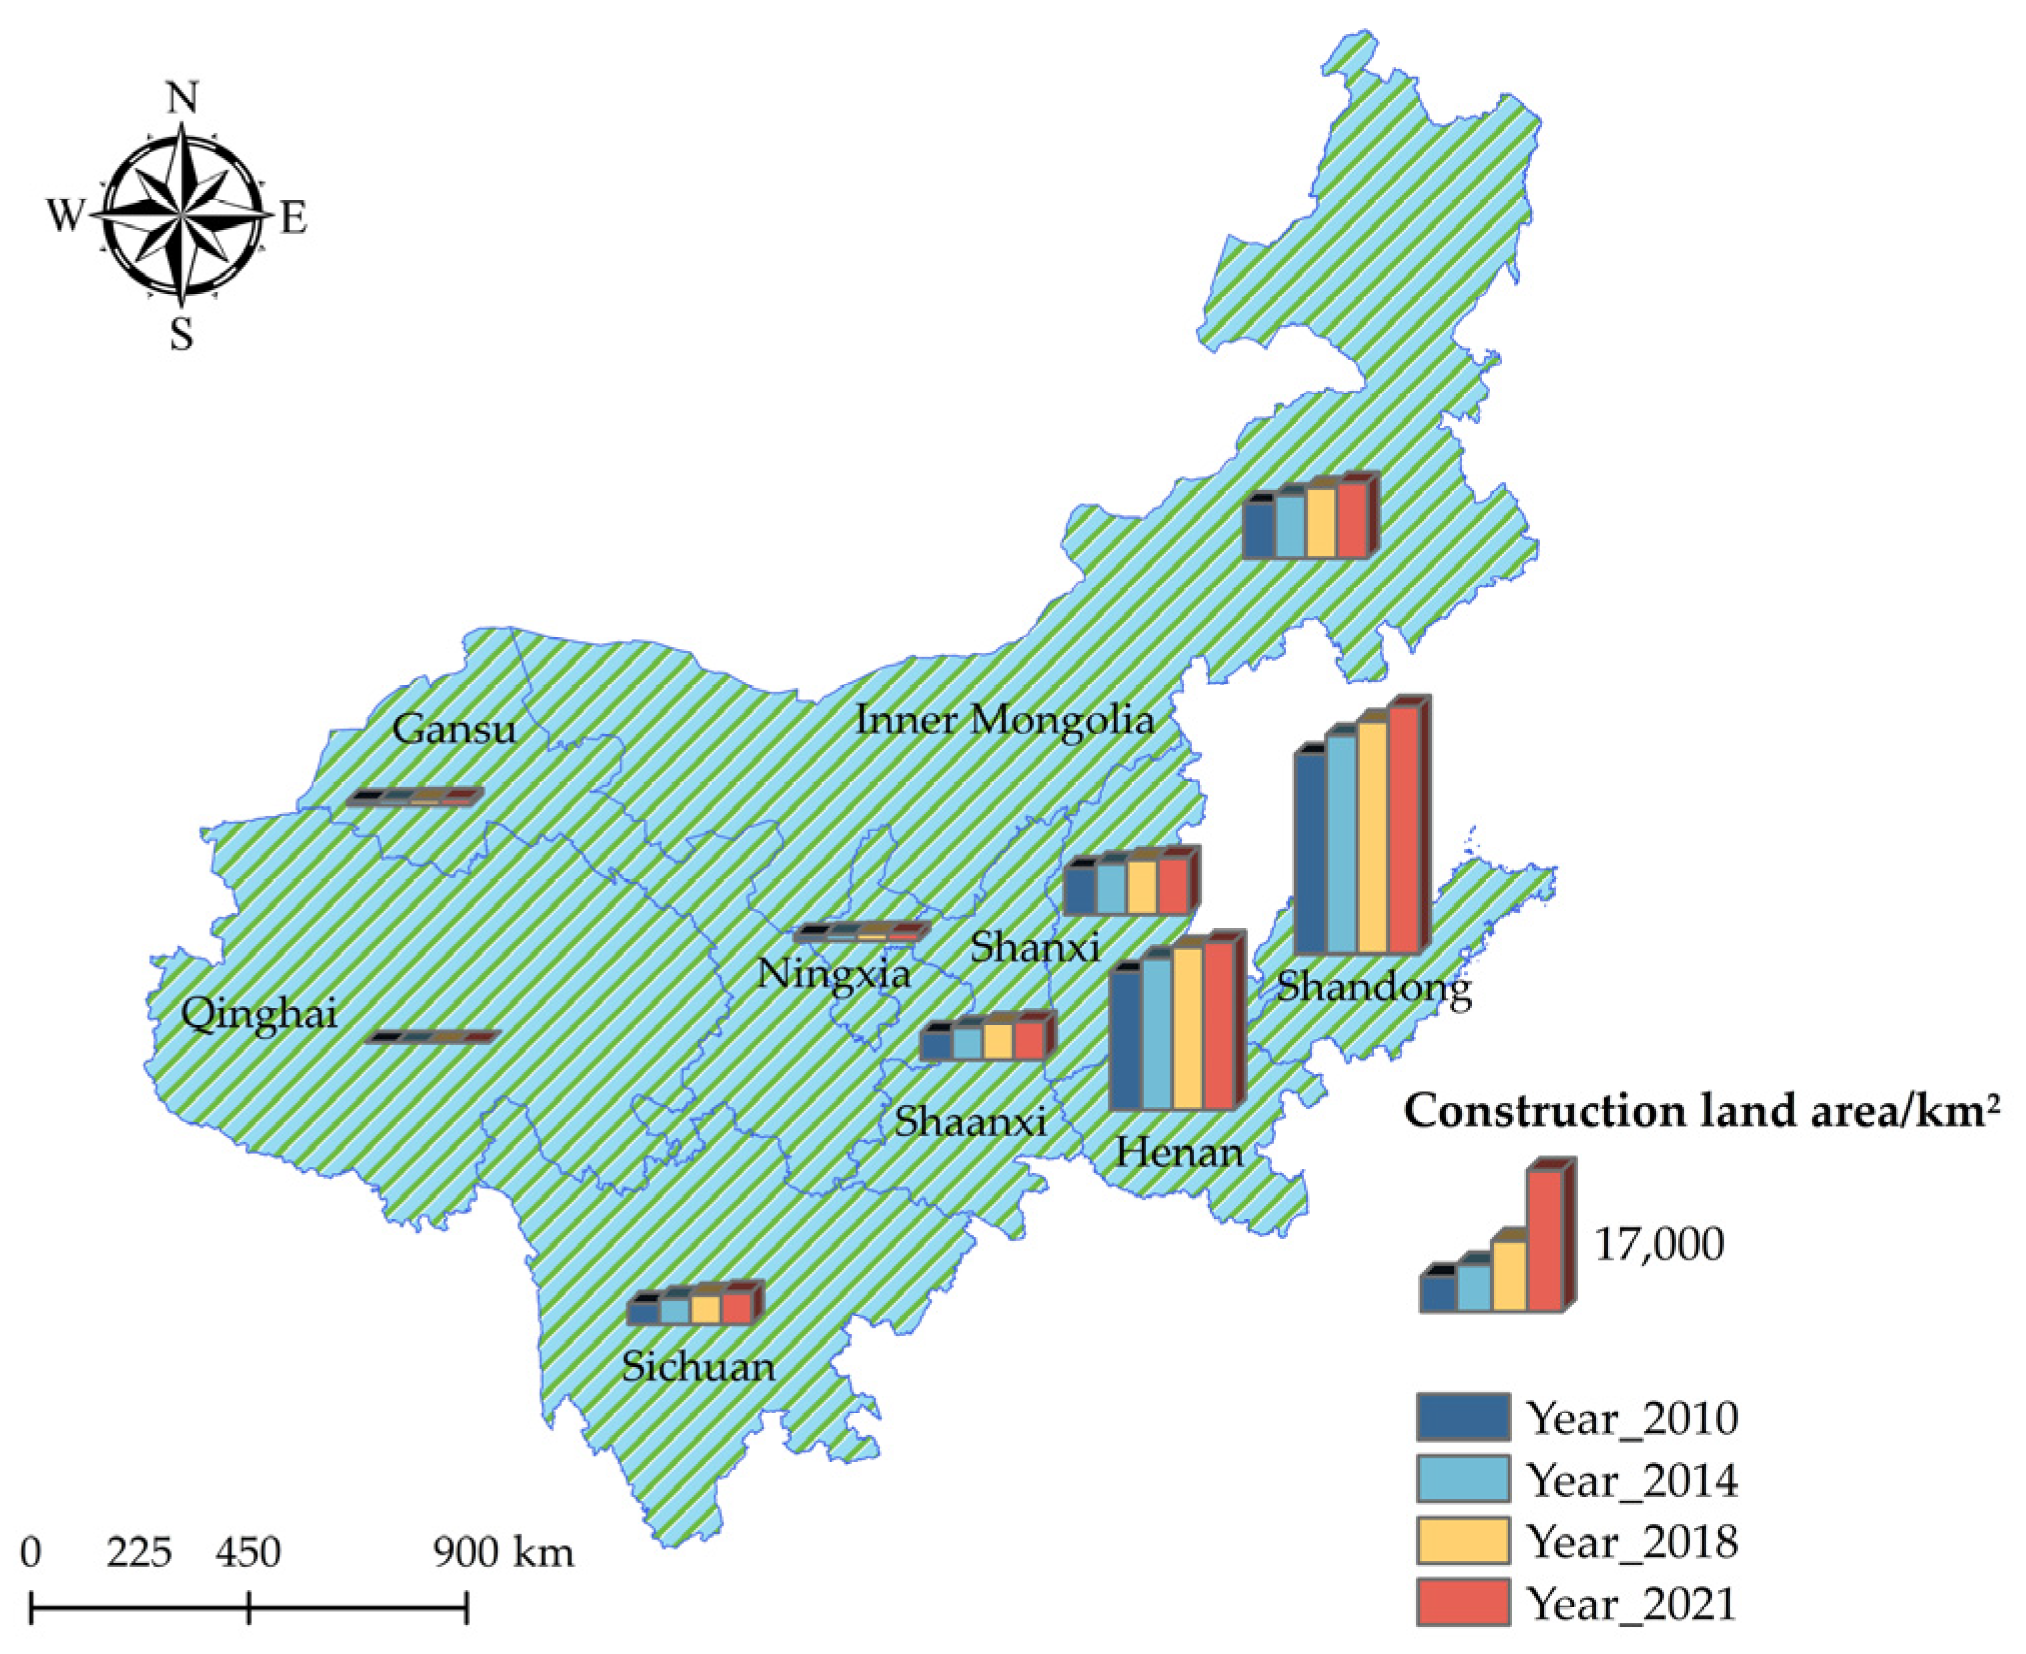
3.1.2. Spatial Characteristic Analysis of CECL in YRB

The years 2010, 2014, 2018, and 2021 for observation. We used the natural breakpoint approach with the help of ArcGIS 10.8 software to categorize the CECL into five classes, namely low, lower, medium, higher, and high and drew a map of the spatial distribution pattern of the CECL (Figure 5). In order to easily observe the link between the spatial distribution pattern of CE and the CL area, a map of the change in CL area in the YRB for the corresponding years was made (Figure 6).
The spatial distribution of CECL in the nine provinces of the YRB from 2010 to 2021 differs significantly, showcasing a picture of “high in the east and low in the west” (Figure 5), which is similar to the geographic distribution of CL in the YRB (Figure 6). From the scope of CECL changes, the scope of regions with high CE levels in CL shows an expanding trend. In 2010, only Shandong Province could reach the “high” grade of CECL. In 2021, the range of regions with a “high” grade of CECL has expanded, with the number rising to three provinces. Except for Henan, most provinces have increased their CECL in 2021, especially Shanxi and Inner Mongolia, which are already in the “high” rank. In 2010, Inner Mongolia’s total CECL was in the “higher” rank; however, in the following three points in time, its CECL climbed to the “high” rank. Between 2010 and 2014, Qinghai and Gansu provinces’ CECL increased slightly from a low level and stayed at a more stable level. Sichuan and Shaanxi Provinces’ CECL are more stable, showing an increase only in 2021. Henan Province is always at the “higher” level and shows no fluctuating trend during the study period, implying its CECL is relatively stable.

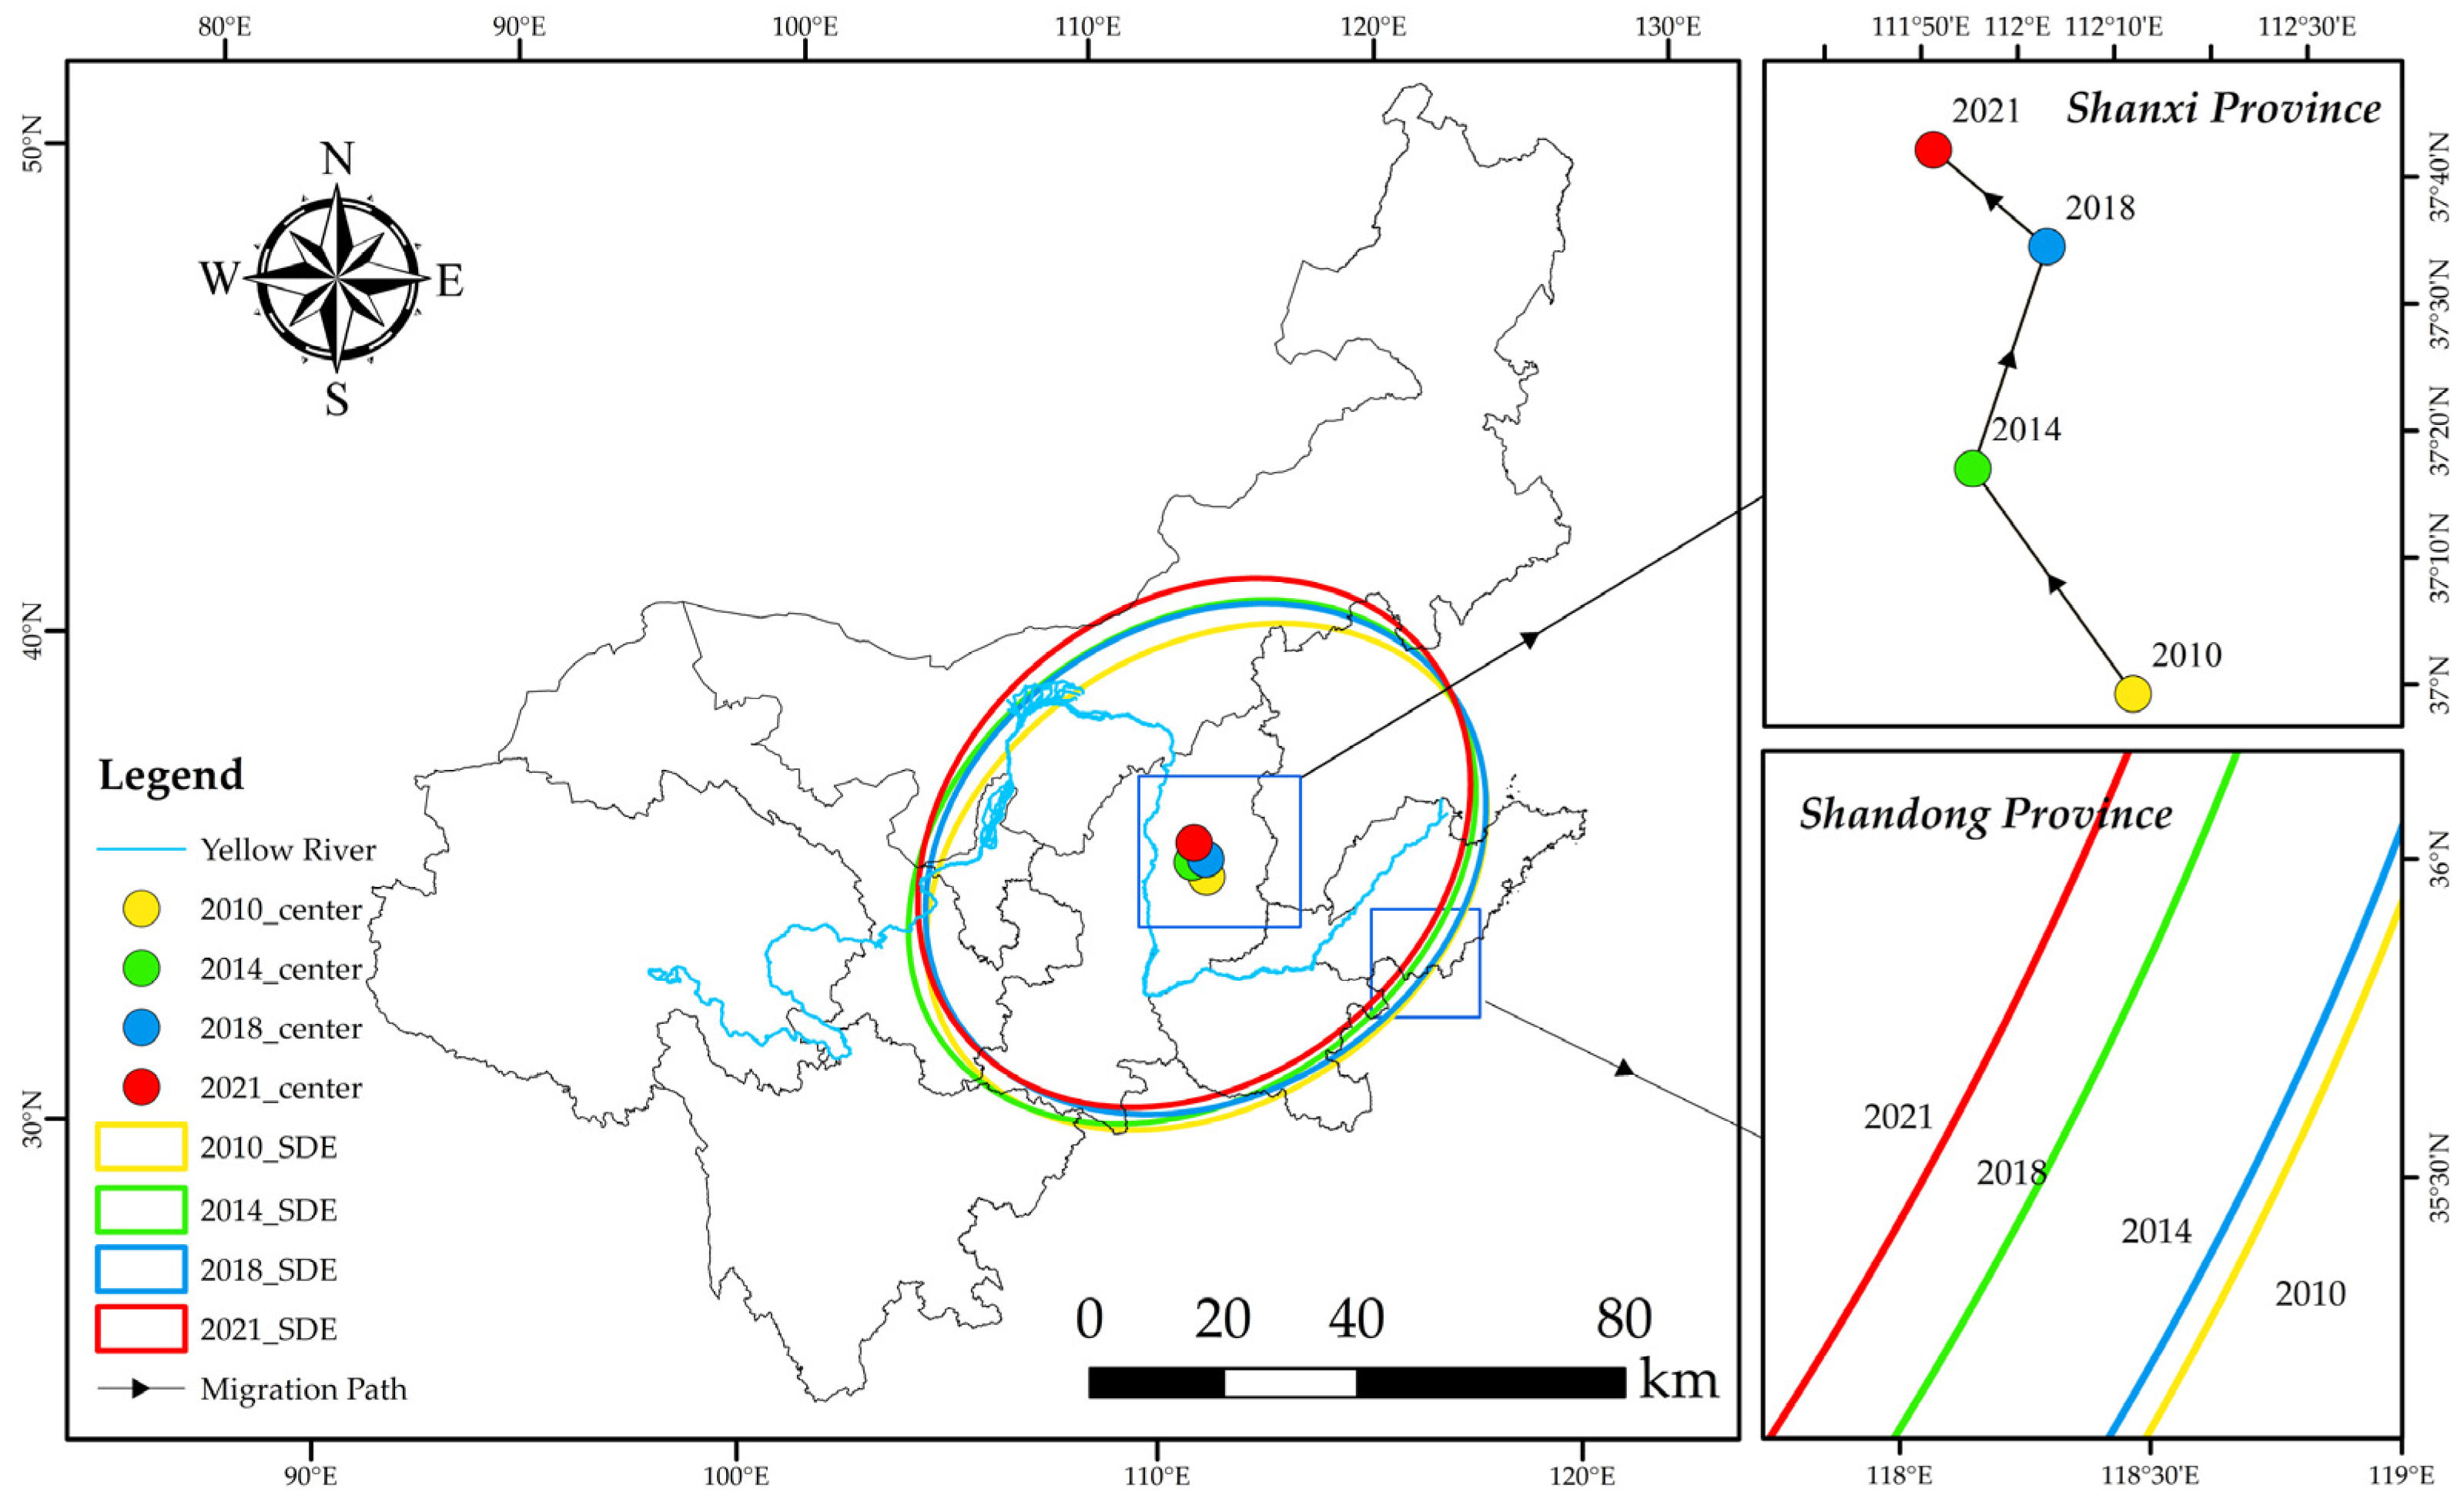
3.1.3. SDE Analysis of CECL

From the characteristics of the SDE (Figure 7, Table 2), the gravity centers of CECL in the YRB (111°50′38″ E~112°07′15″ E and 37°00′52″ N~37°44′50″ N) are located in Shanxi Province from 2010 to 2021. The regional distribution of CECL is consistently “northeast-southwest”. From the trail of gravity center migration, the migration path is “northwest (between 2010 and 2014) to northeast (between 2014 and 2018) to northwest (between 2018 and 2021)”, which confirms that the biggest driver of the growth of CECL in the YRB is Shanxi Province. The total migration distance of the gravity center from 2010 to 2021 is 86.86 km. Meanwhile, the movement speed of the gravity center appears to decrease from 10.29 km/a to 7.42 km/a. The area of the ellipse went down from 1,226,060 km2 in 2010 to 2014 to 1,282,320 km2, then declined to 1,253,010 km2 in 2018, and finally rose to 1,274,110 km2 in 2021, revealing that the overall spatial distribution range of CECL exhibits an expansion tendency. Furthermore, the long axis and short axis of the SDE have also shifted to varying degrees. Specifically, the long axis shrank from 722.47 km in 2010 to 715.52 km in 2021, and the short axis grew from 540.21 km in 2010 to 566.84 km. Indicating that CECL in the YRB displays a clear centripetal accumulation trend from “northeast to southwest” and a divergence trend from “northwest to southeast” and that the distribution density of CECL has increased.

3.2. Decoupling Analysis of EG and CECL

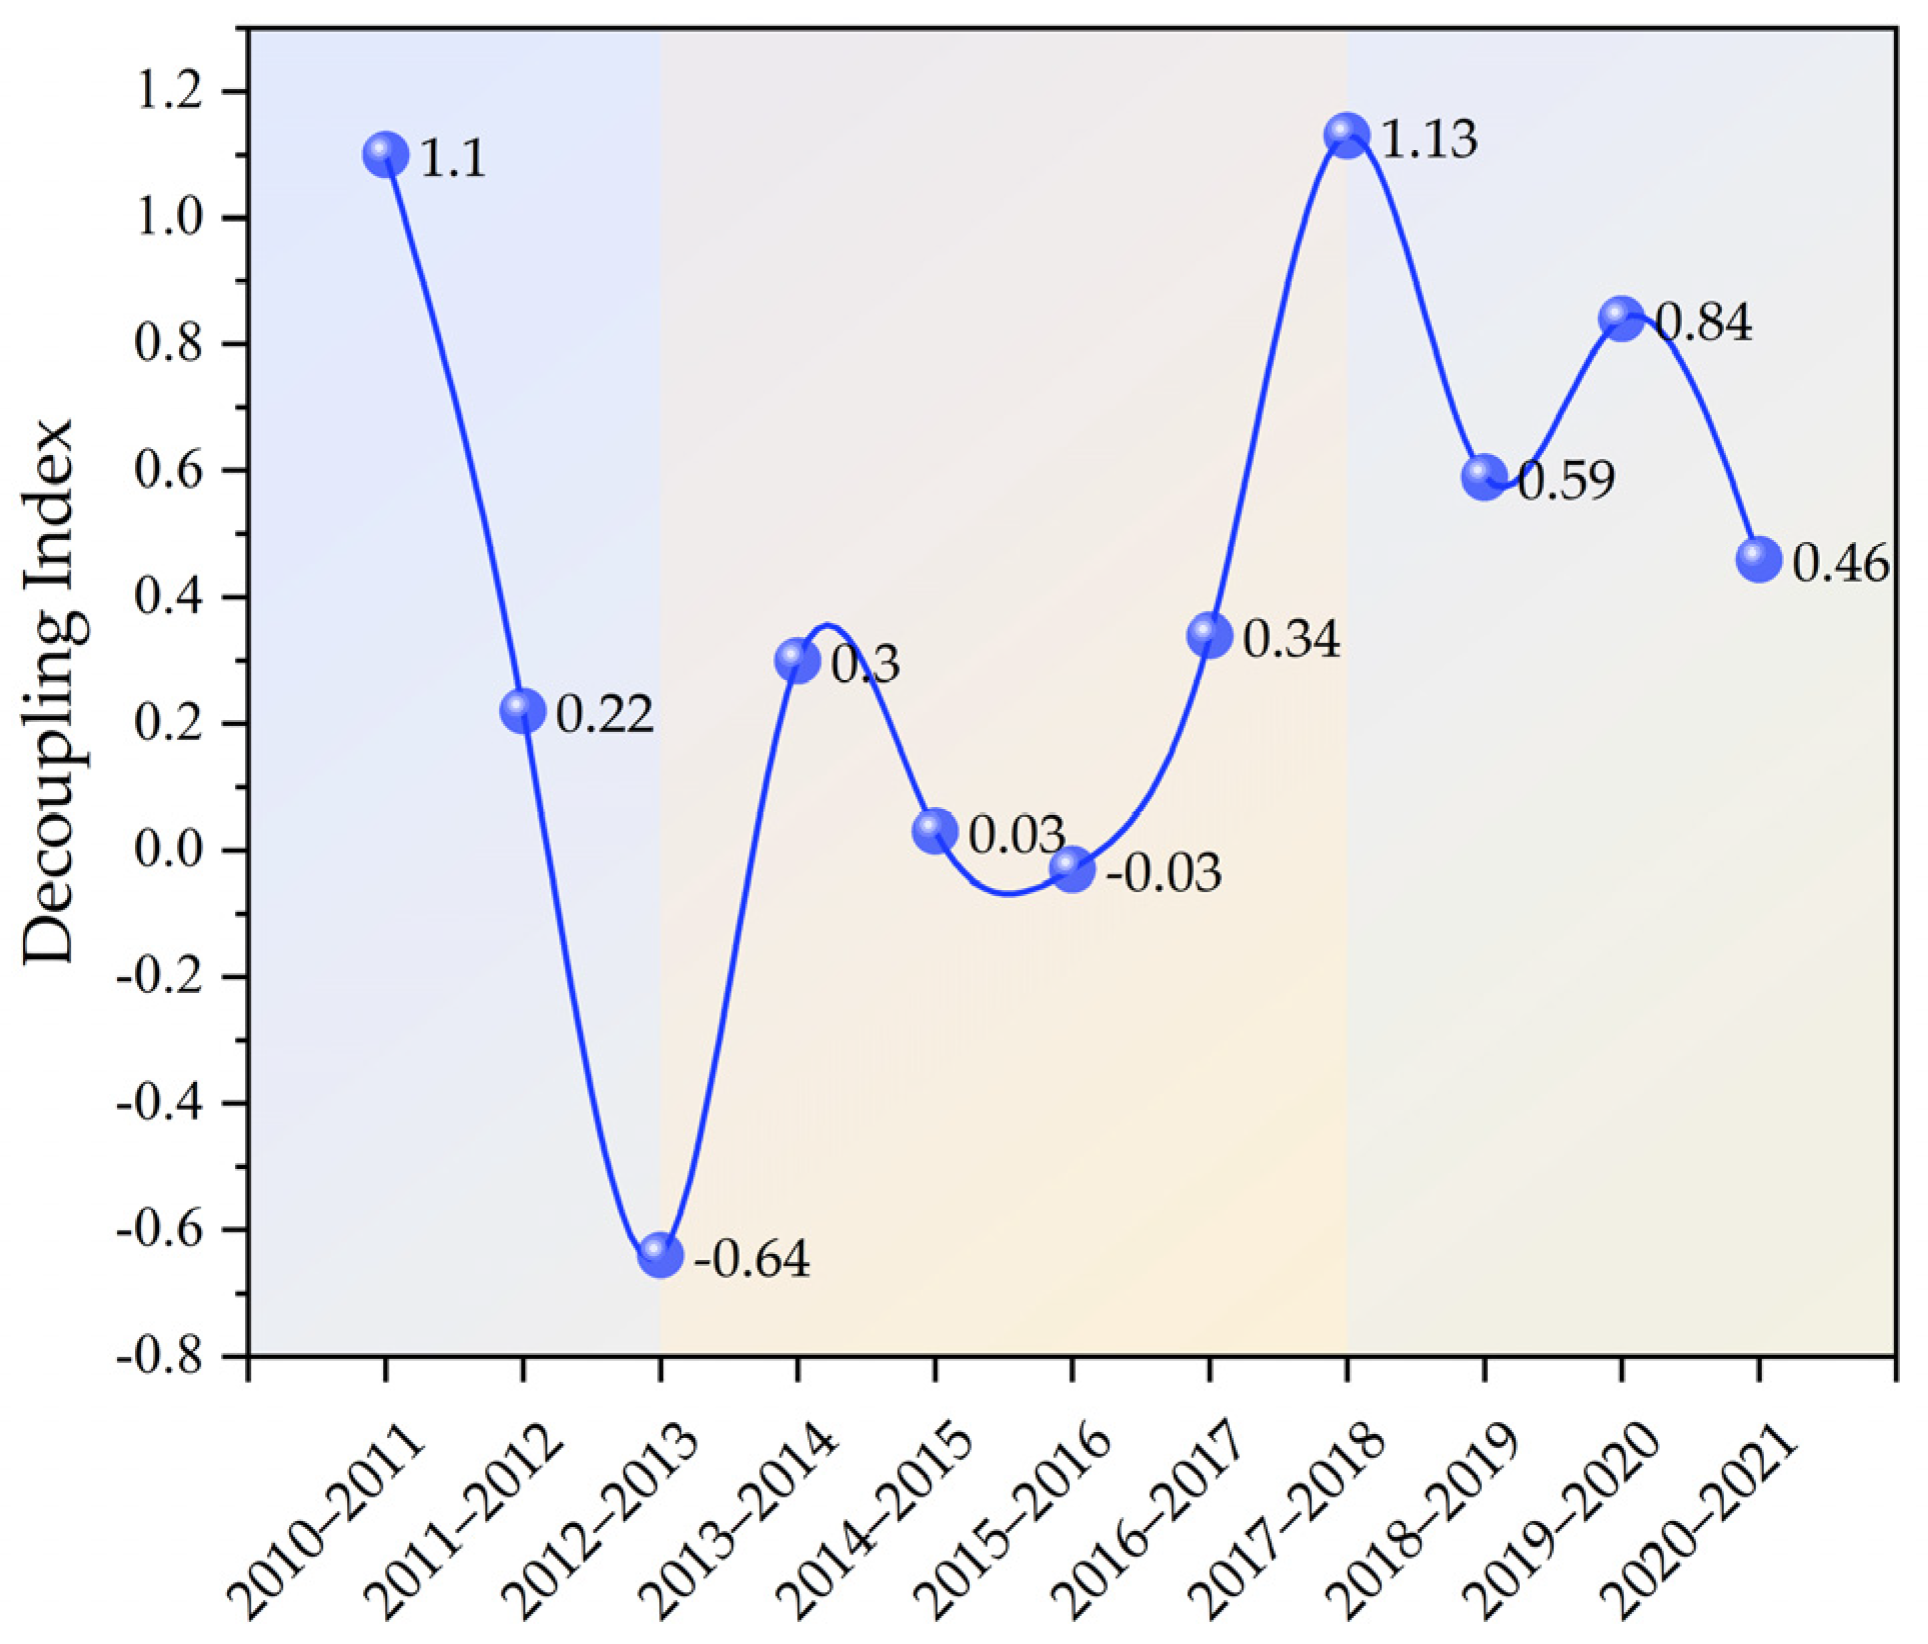
3.2.1. Time Series Characteristics of Decoupling Status

The decoupling index of CECL in the YRB showed a fluctuating and decreasing tendency change during the past 11 years (Figure 8). The decoupling index has a value range of [−0.64, 1.13]. Three phases may be taken to roughly divide the overall characteristics of change: the decoupling index declined sharply from 2010 to 2013; from 2013 to 2018, it showed an “N”-shaped fluctuation change; and from 2018 to 2021, it showed an inverted “N”-shaped. During the 11 years, the weak decoupling (WD) appeared six times (Table 3), which is the dominant decoupling type, while the strong decoupling (SD) appeared only two times, and the expansive coupling (EC) appeared three times. The dynamic alternation of the three decoupling states indicates that the carbon decoupling state is still unstable, which is unfavorable to achieving the carbon neutrality target. WD occupies the largest share of the total number of decoupling states, which also reflects that the GDP growth rate in the YRB exceeds the growth rate of CECL in most years. Figure 9 and Figure 10 show the decoupling types and weights of the nine provinces over the 11 years. For most provinces, the total proportion of “SD” and “WD” is more than 50%.

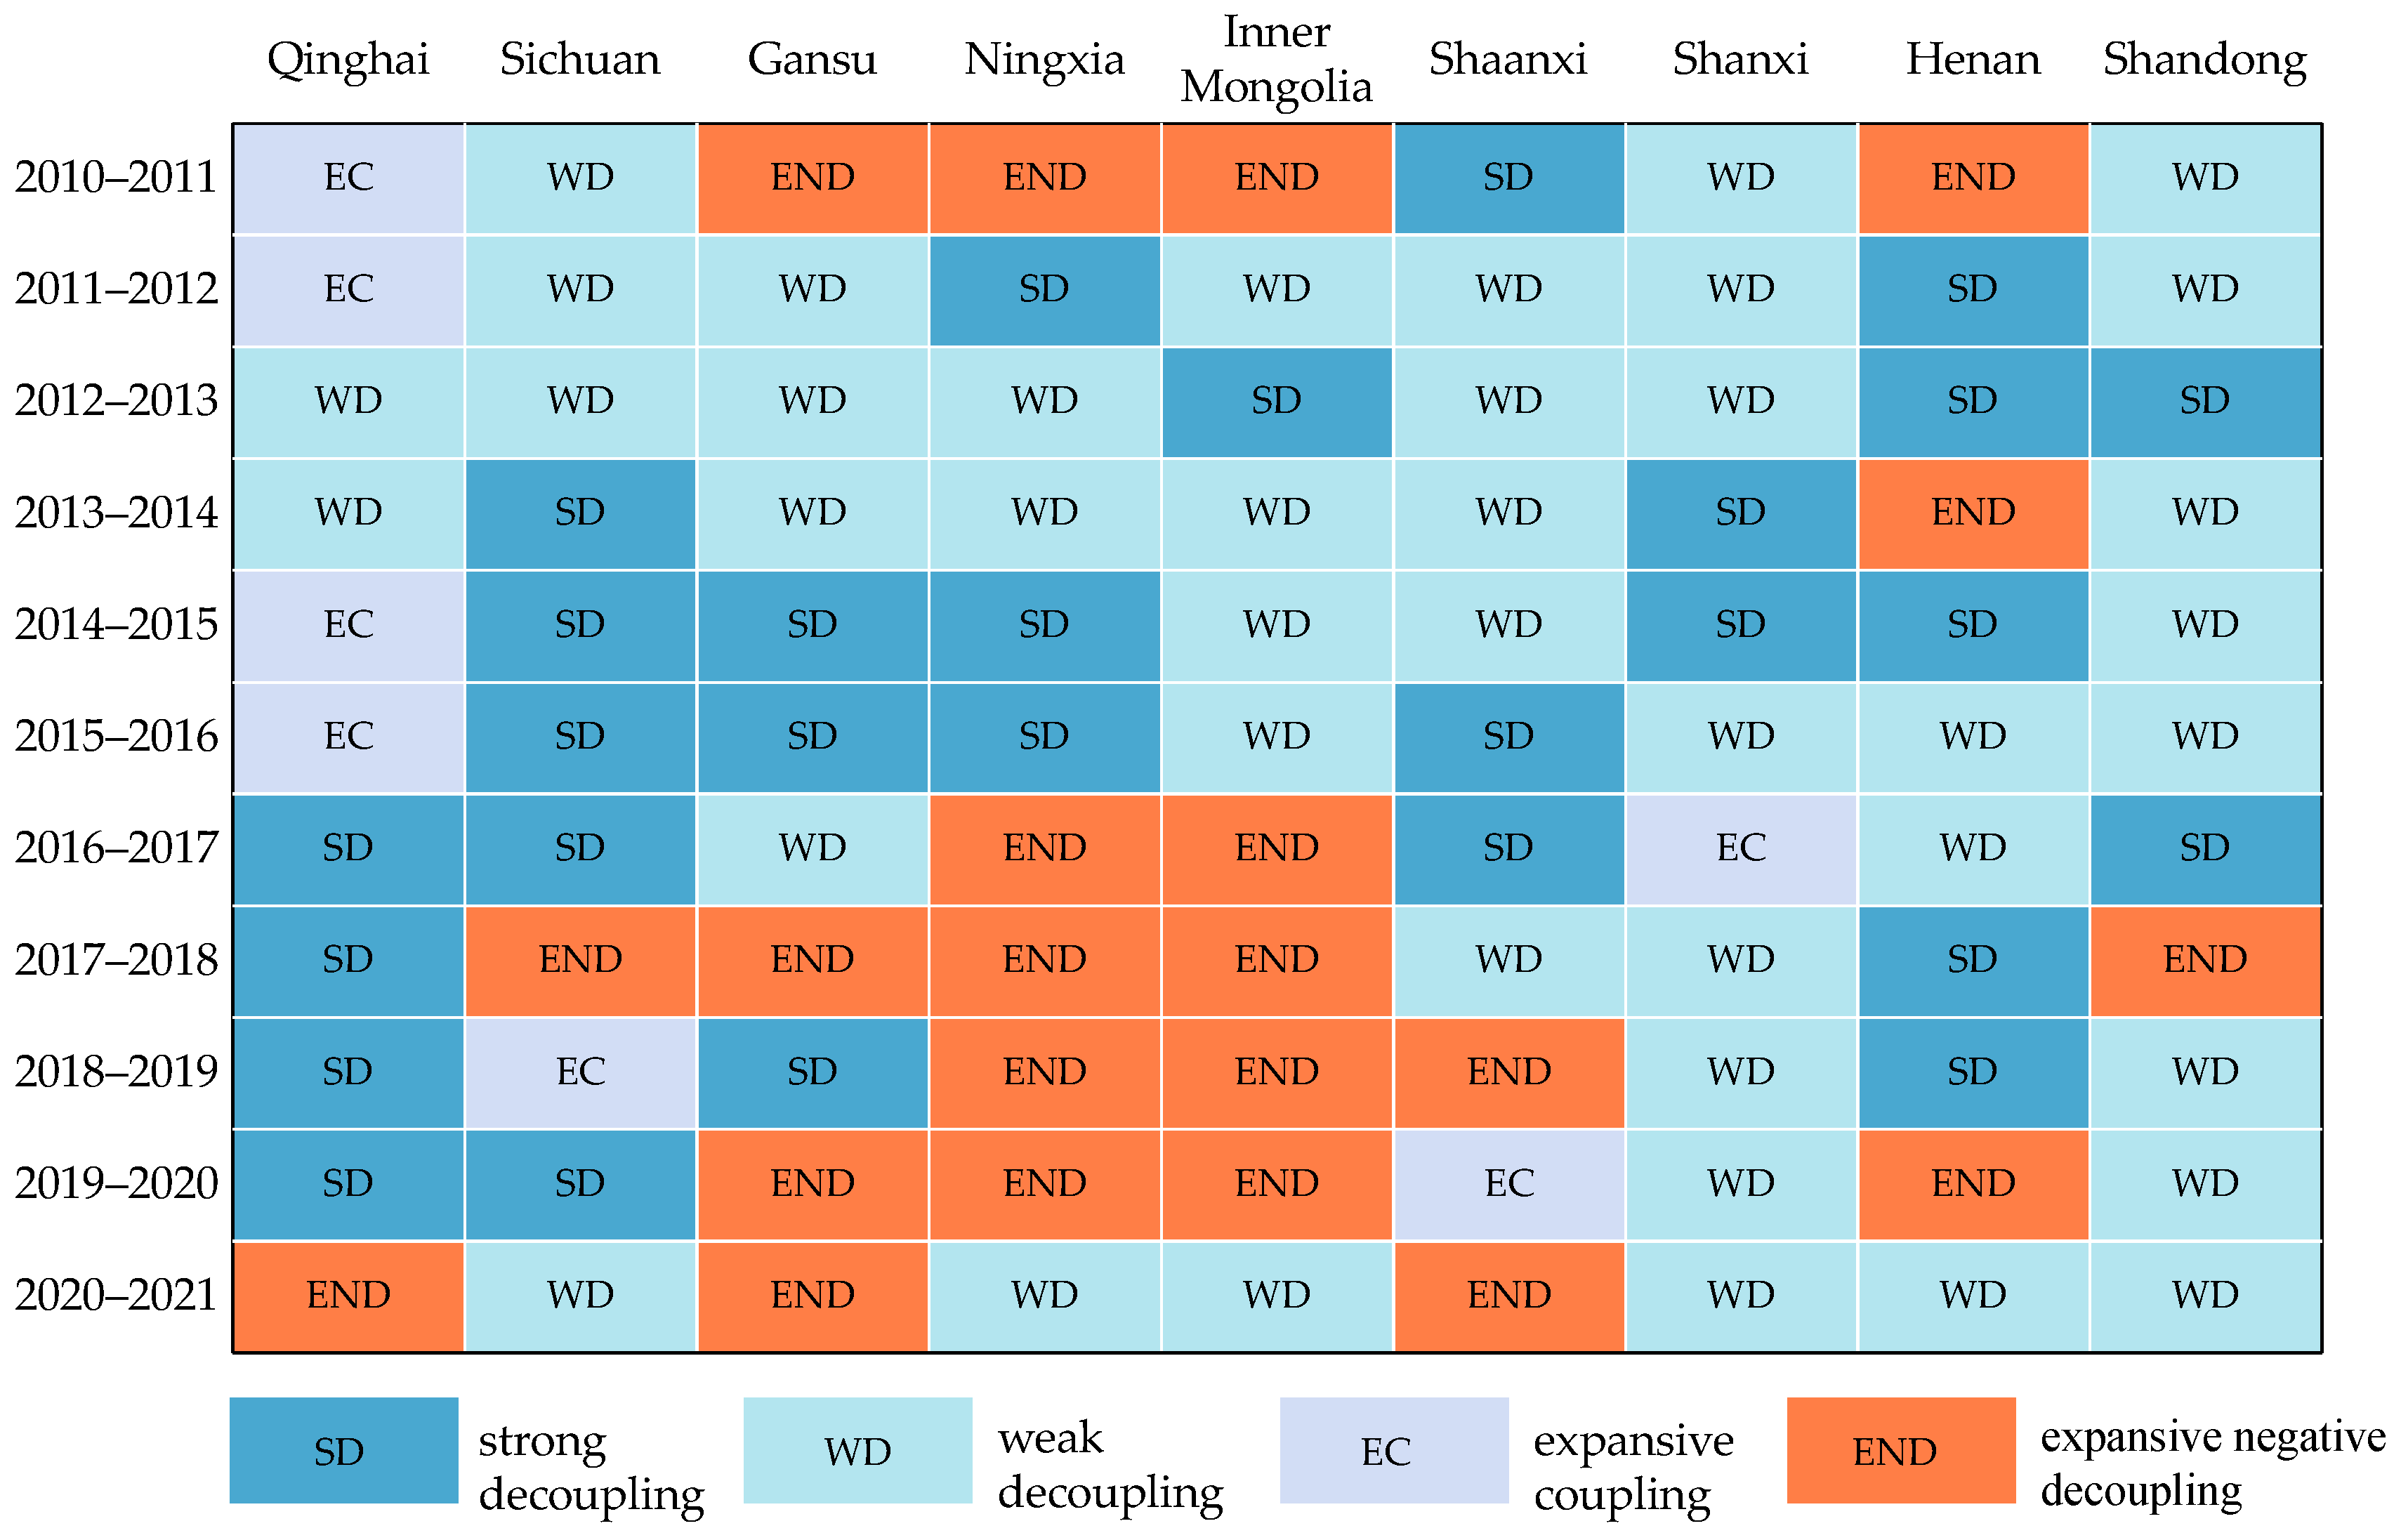
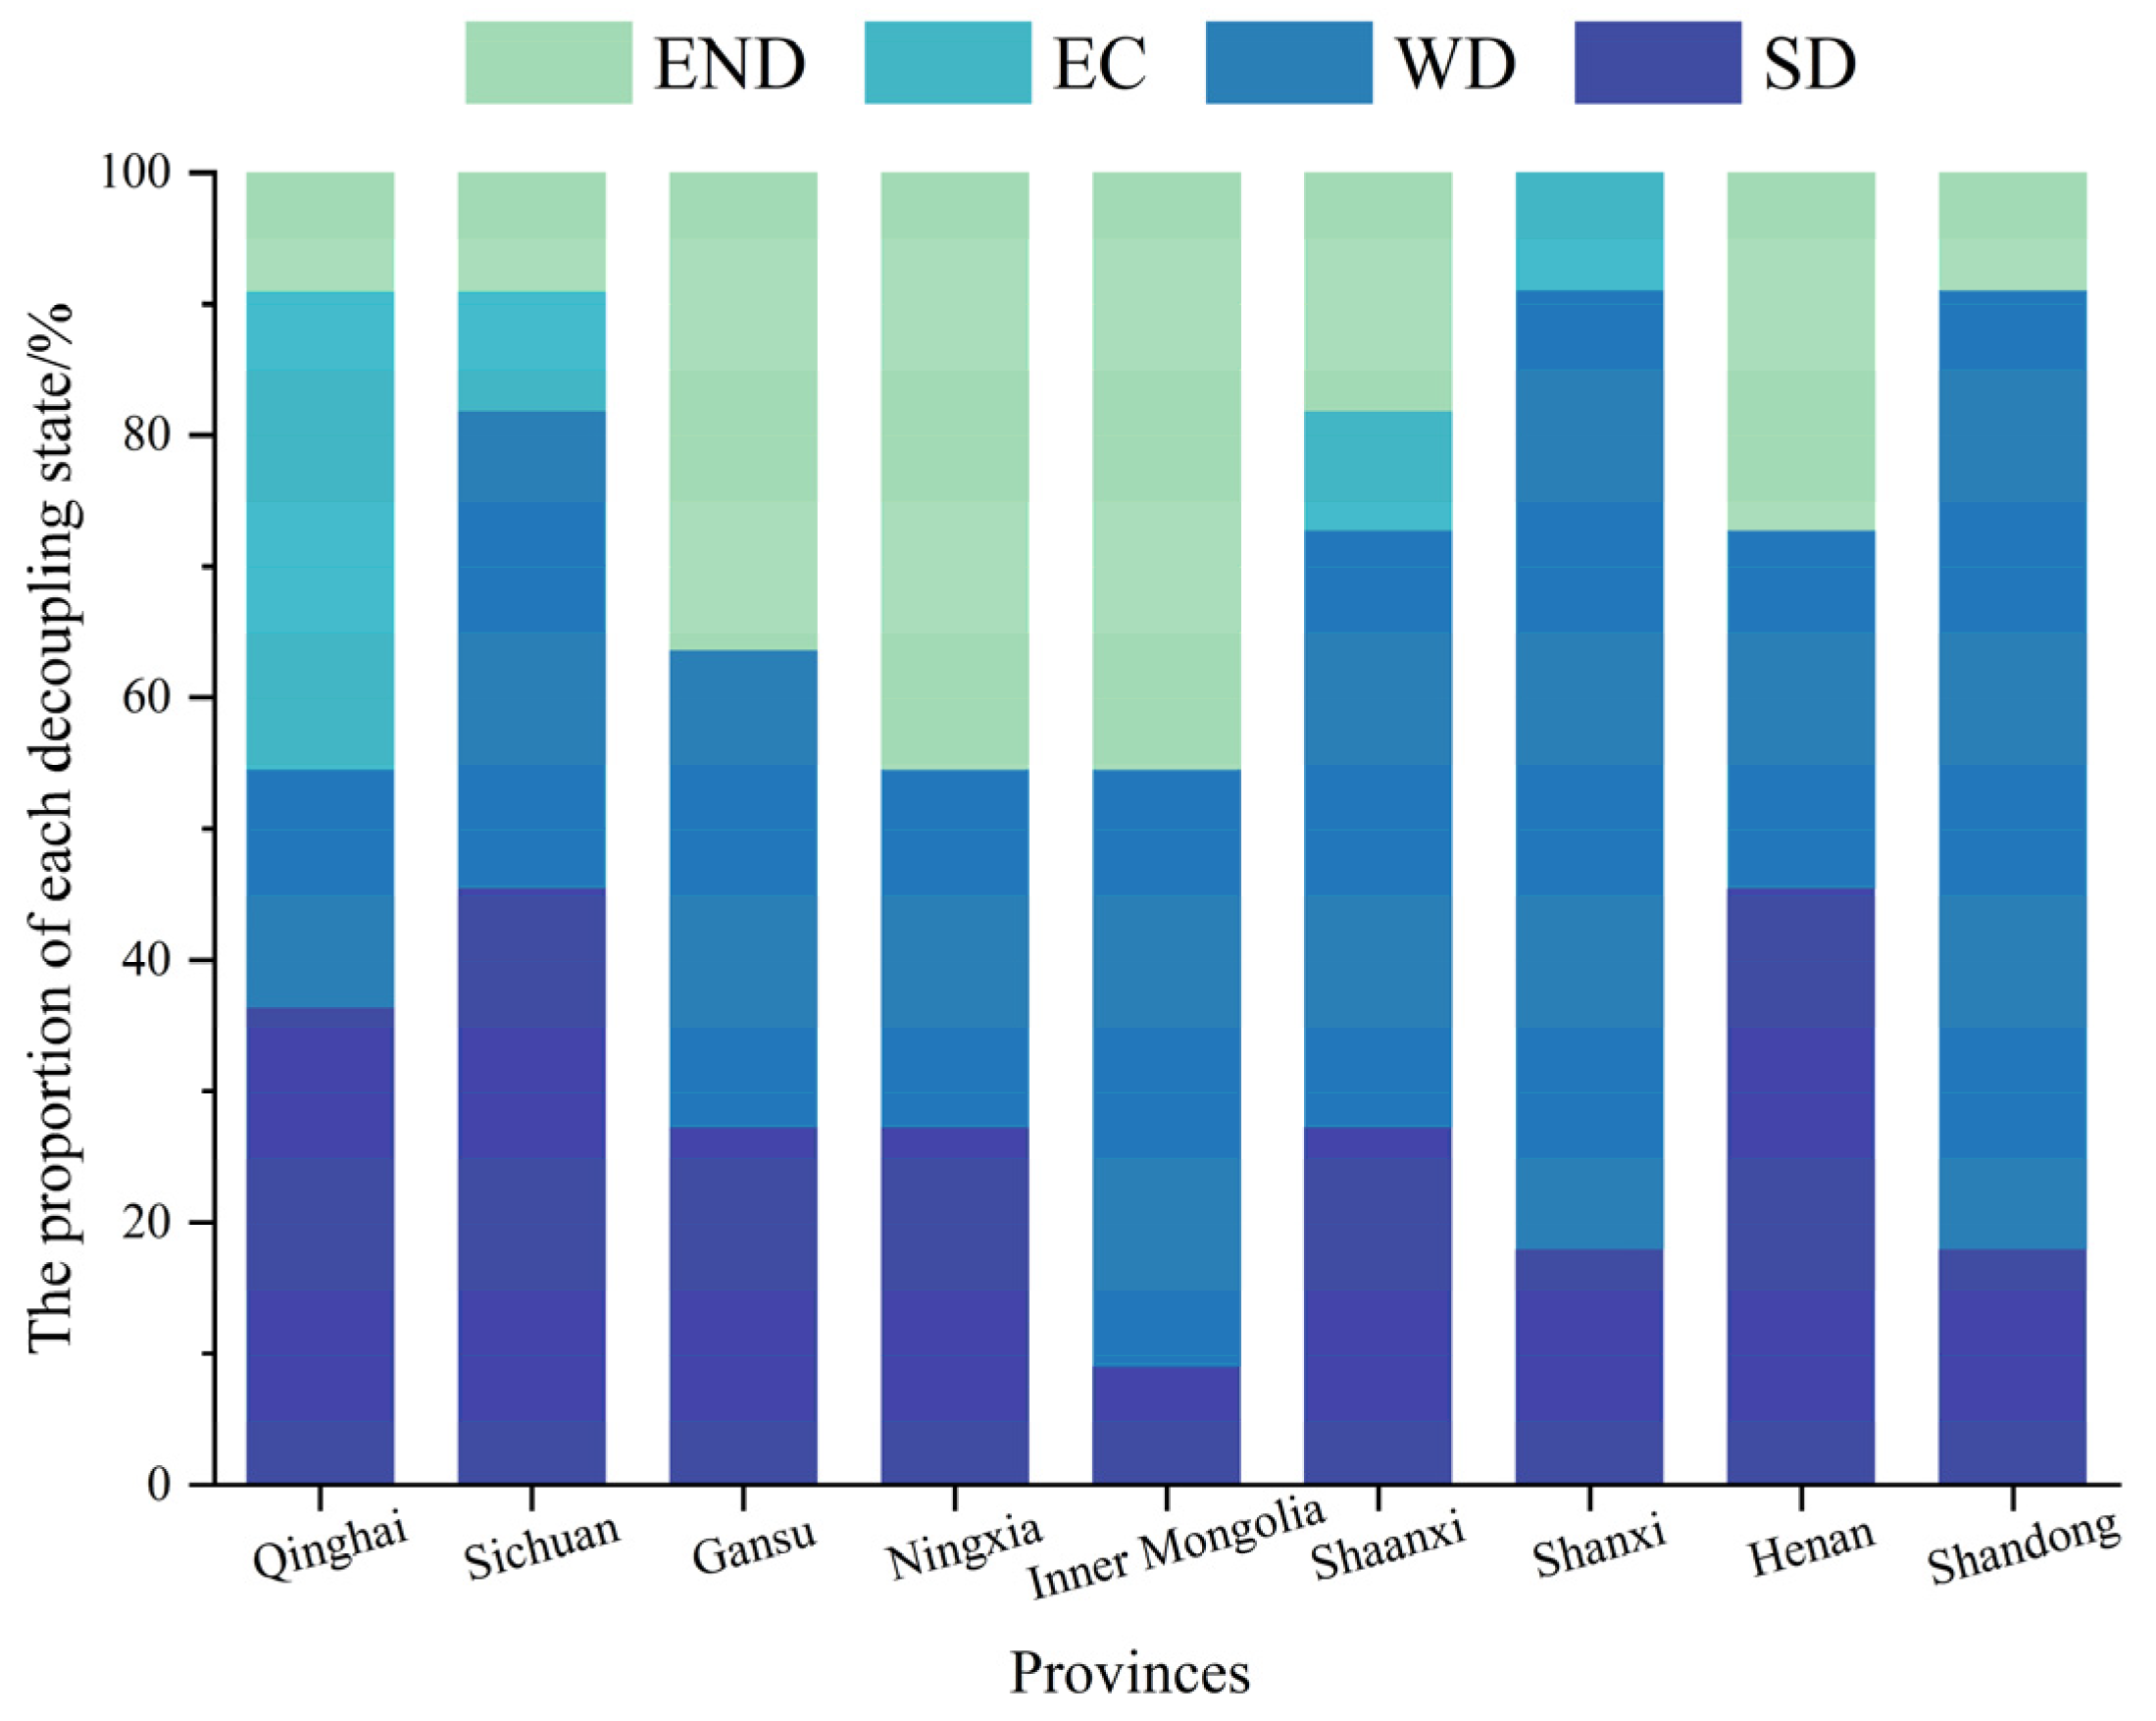
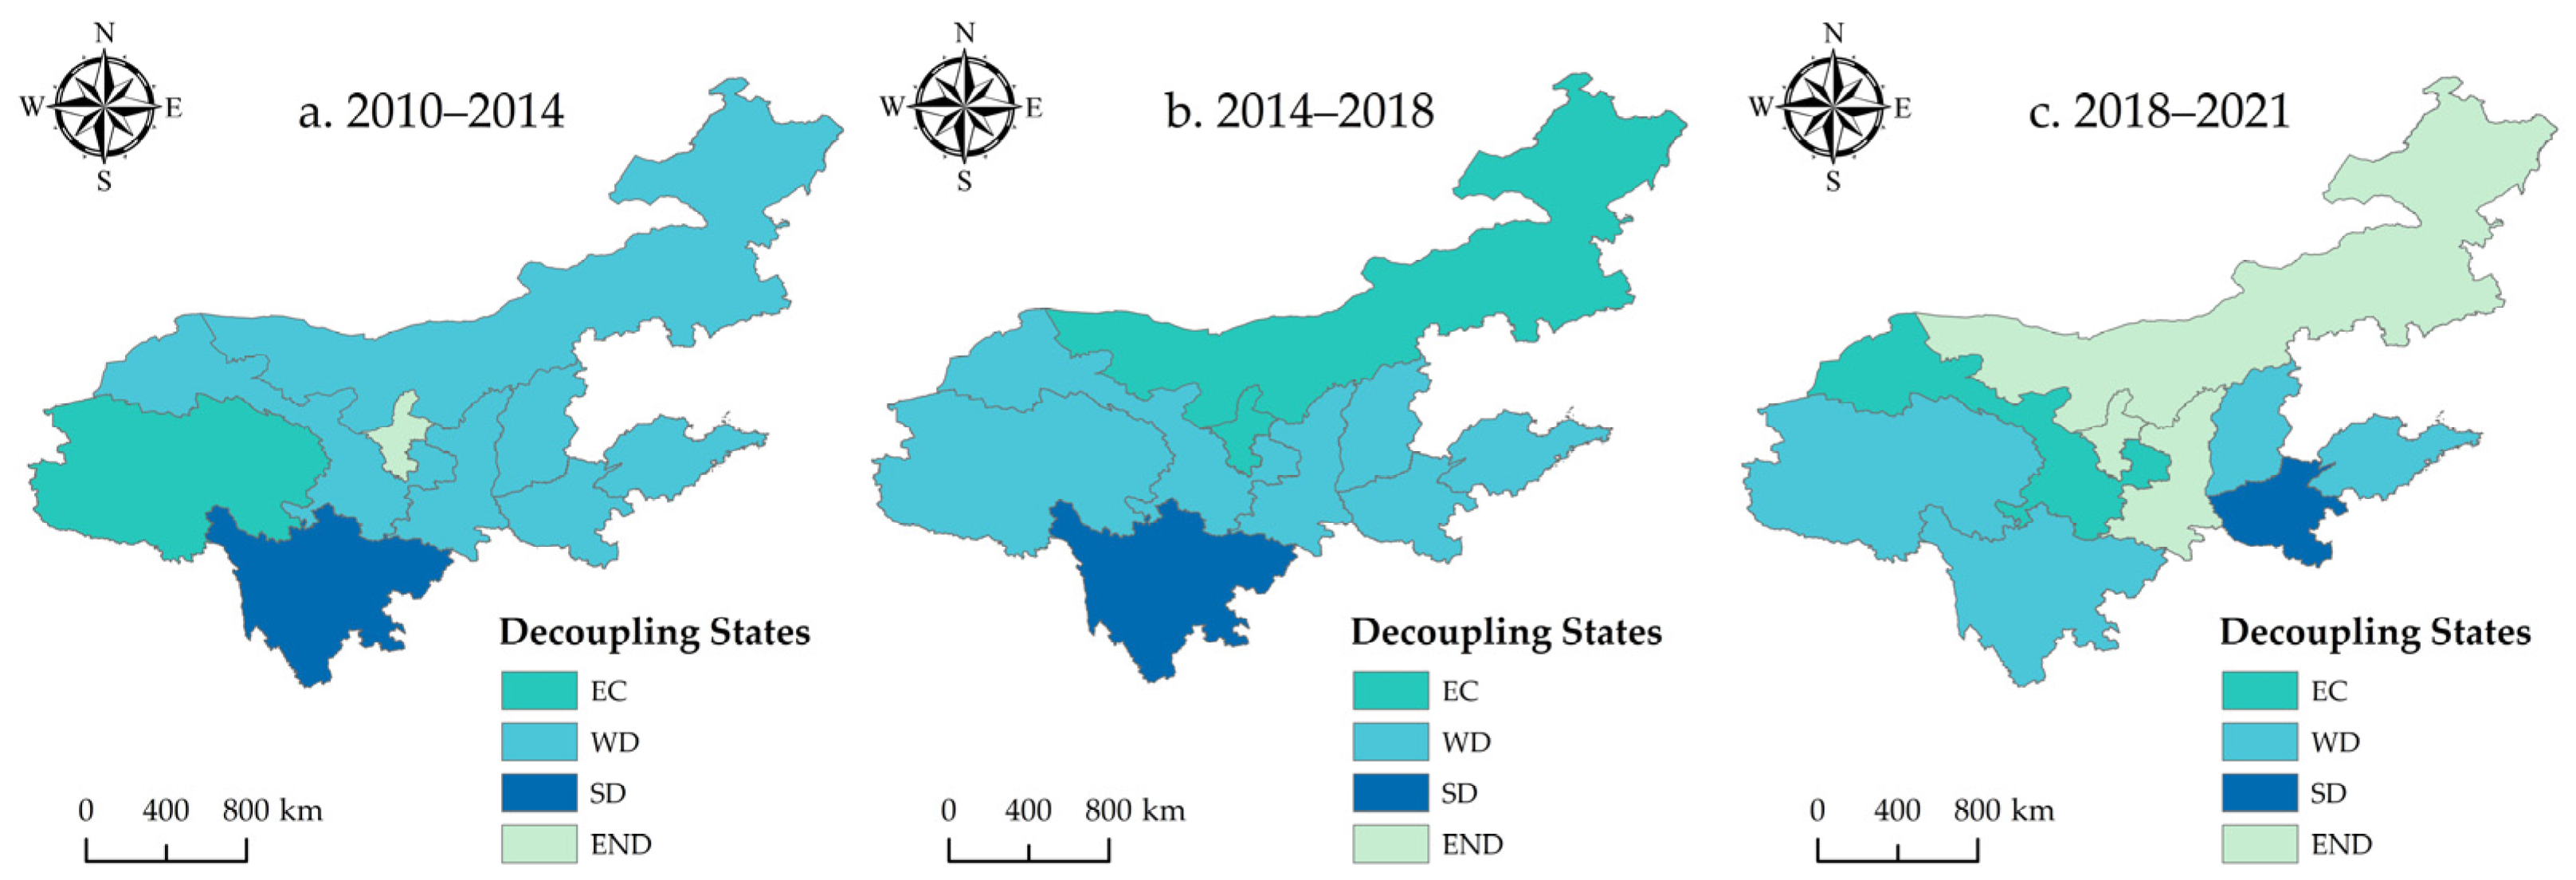
3.2.2. Spatial Evolution Features of Decoupling State

In order to demonstrate the spatial switch features of the decoupling status of EG and CECL in the YRB, this paper divides three time periods to visualize the decoupling status of the nine provinces (Figure 11). The decoupling status of the nine provinces has experienced different evolutionary changes. No province can form a stable “SD” during the study period. On the whole, the degree of decoupling in some provinces has changed favorably: Qinghai Province was EC from 2010 to 2014 and then shifted to a WD in the years after, between 2014 and 2018. On the other hand, Henan Province shifts from a WD to an SD. Between 2010 and 2021, the level of EG and CECL in both Qinghai and Henan provinces increased, and the EG rate outpaced the growth rate of CE.
Besides, there are also some provinces where the decoupling status worsened from a general perspective. Sichuan province was in an SD from 2010 to 2018, while it shifted to a WD from 2018 to 2021. Inner Mongolia shifted from a WD to an EC and evolved to an expansive negative decoupling (END) from 2010 to 2021. Shaanxi Province shifted from WD to END, while Gansu Province shifted from WD to EC. In addition, the decoupling status of some provinces remained relatively stable, such as Shandong Province and Shanxi Province, which always had a WD status. The decoupling status of Ningxia changed more significantly, showing an unstable state from END to EC and back to END.

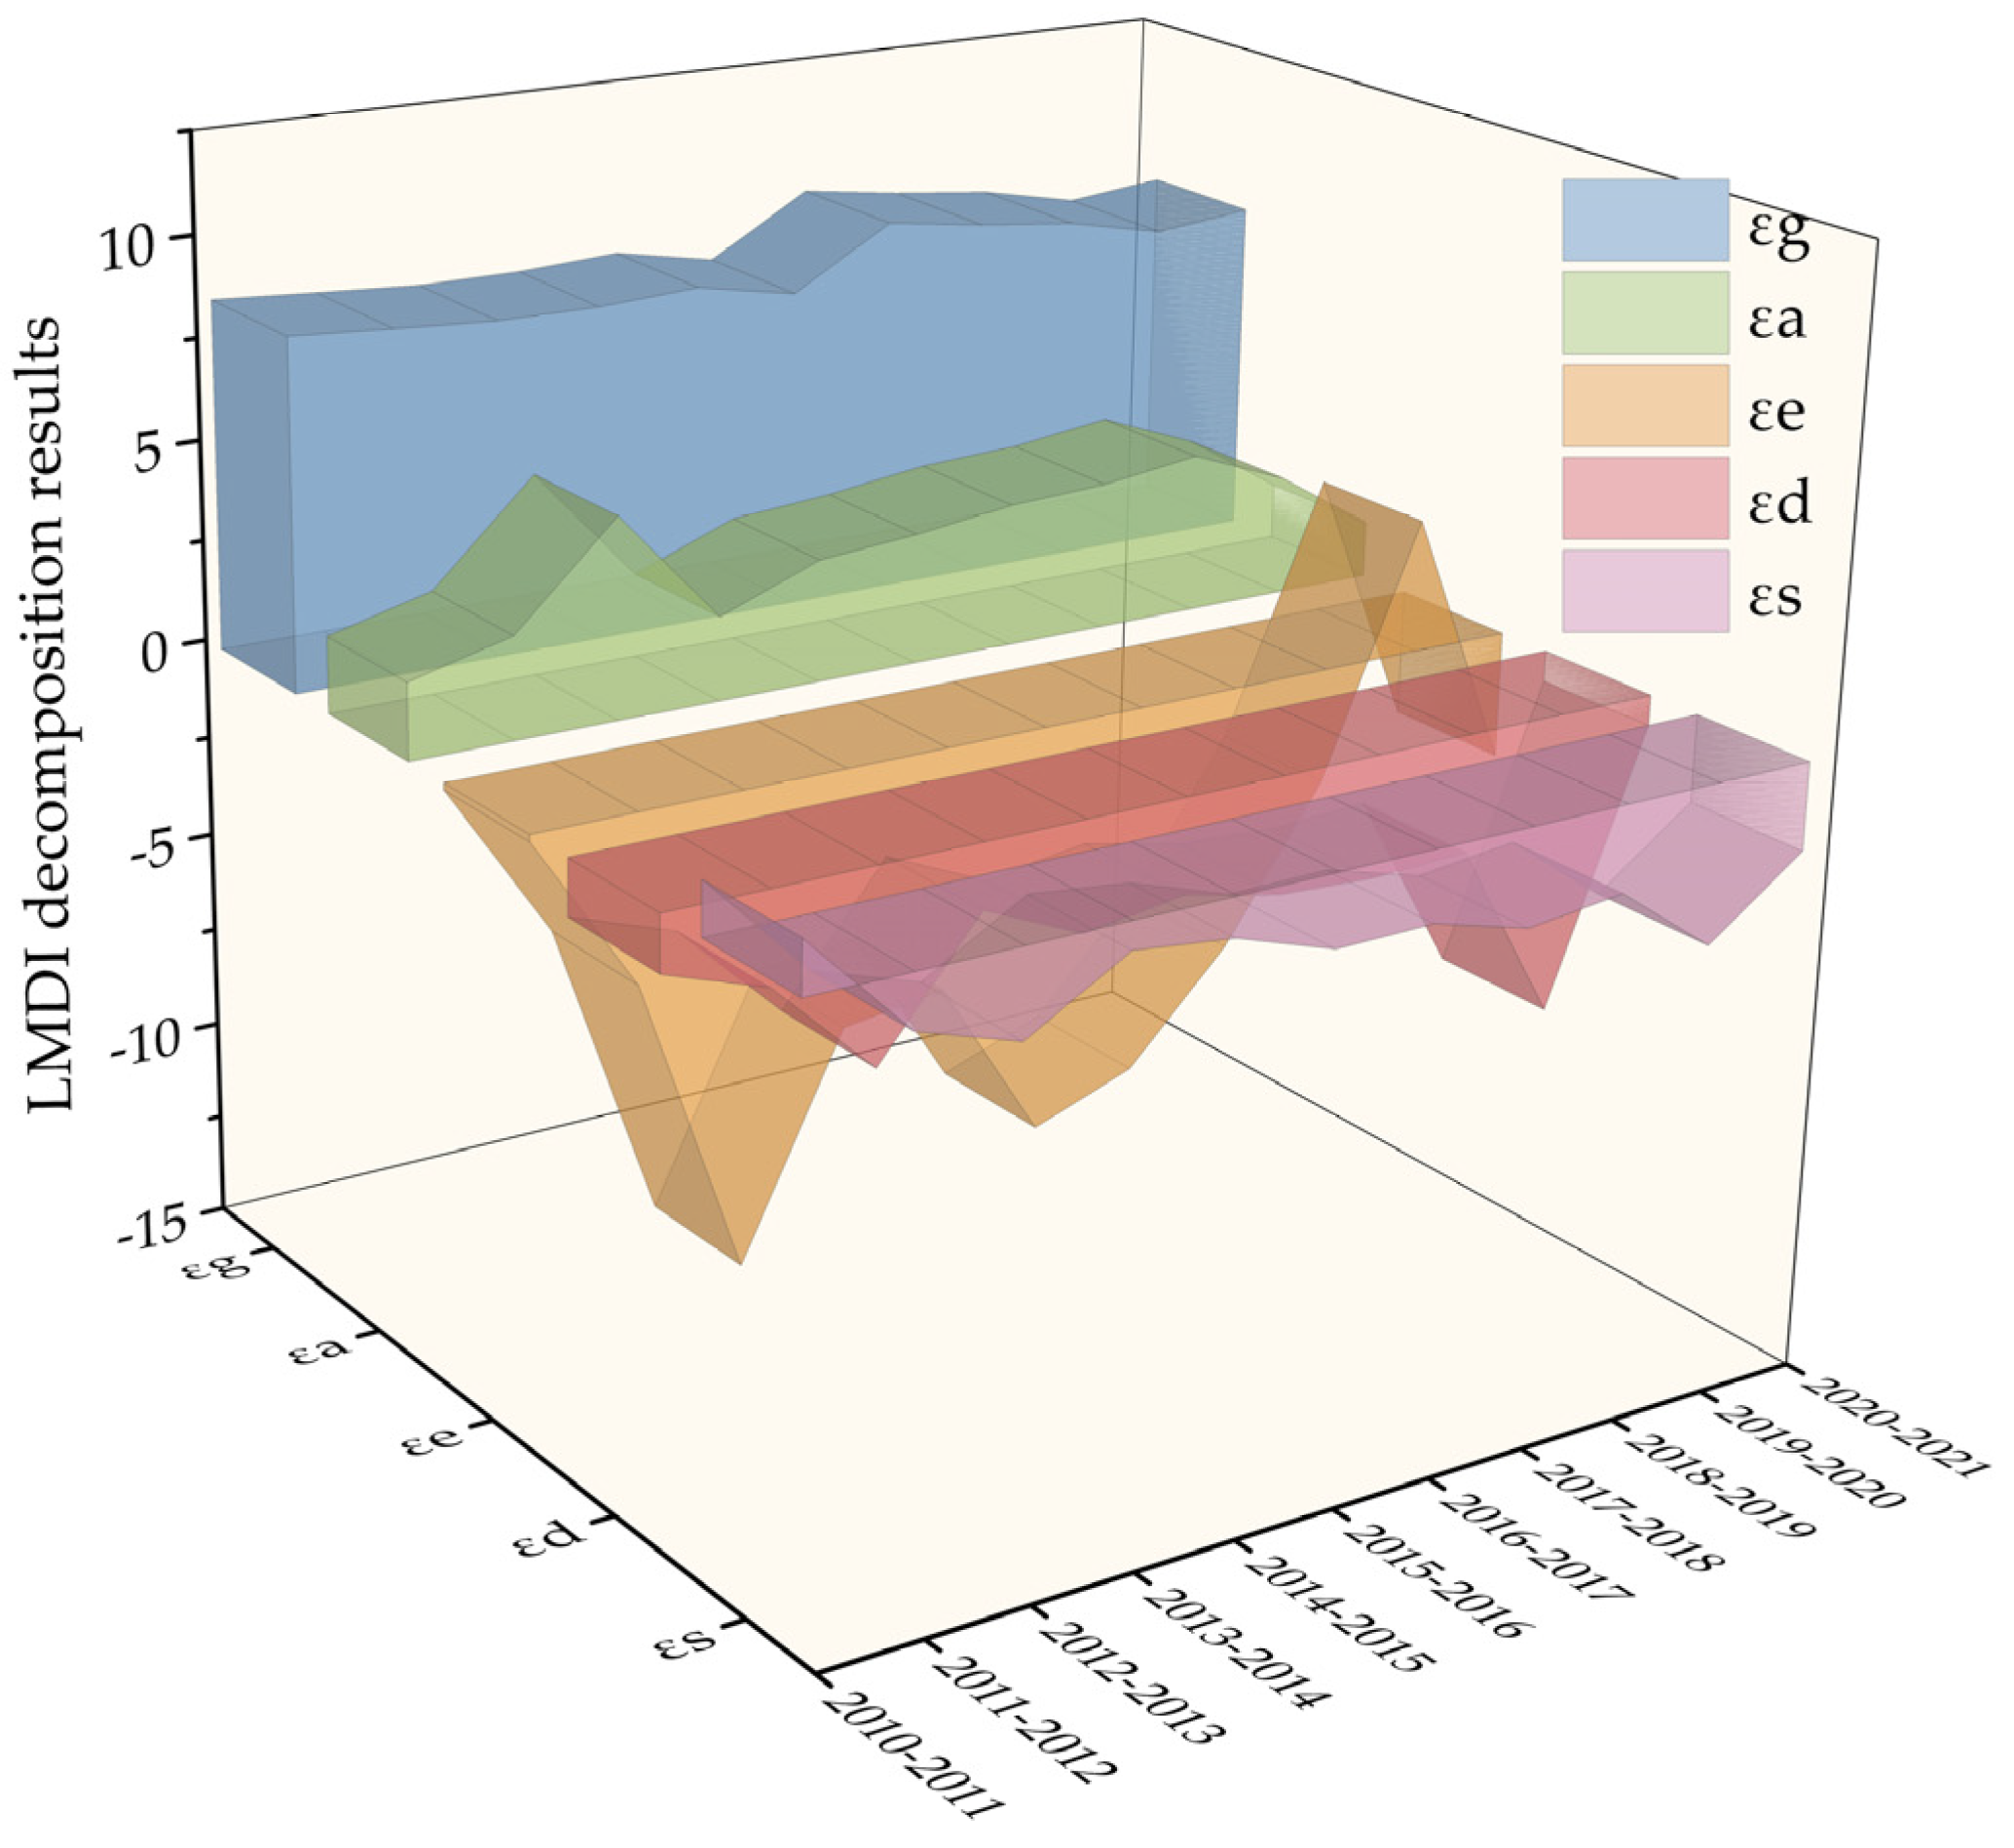
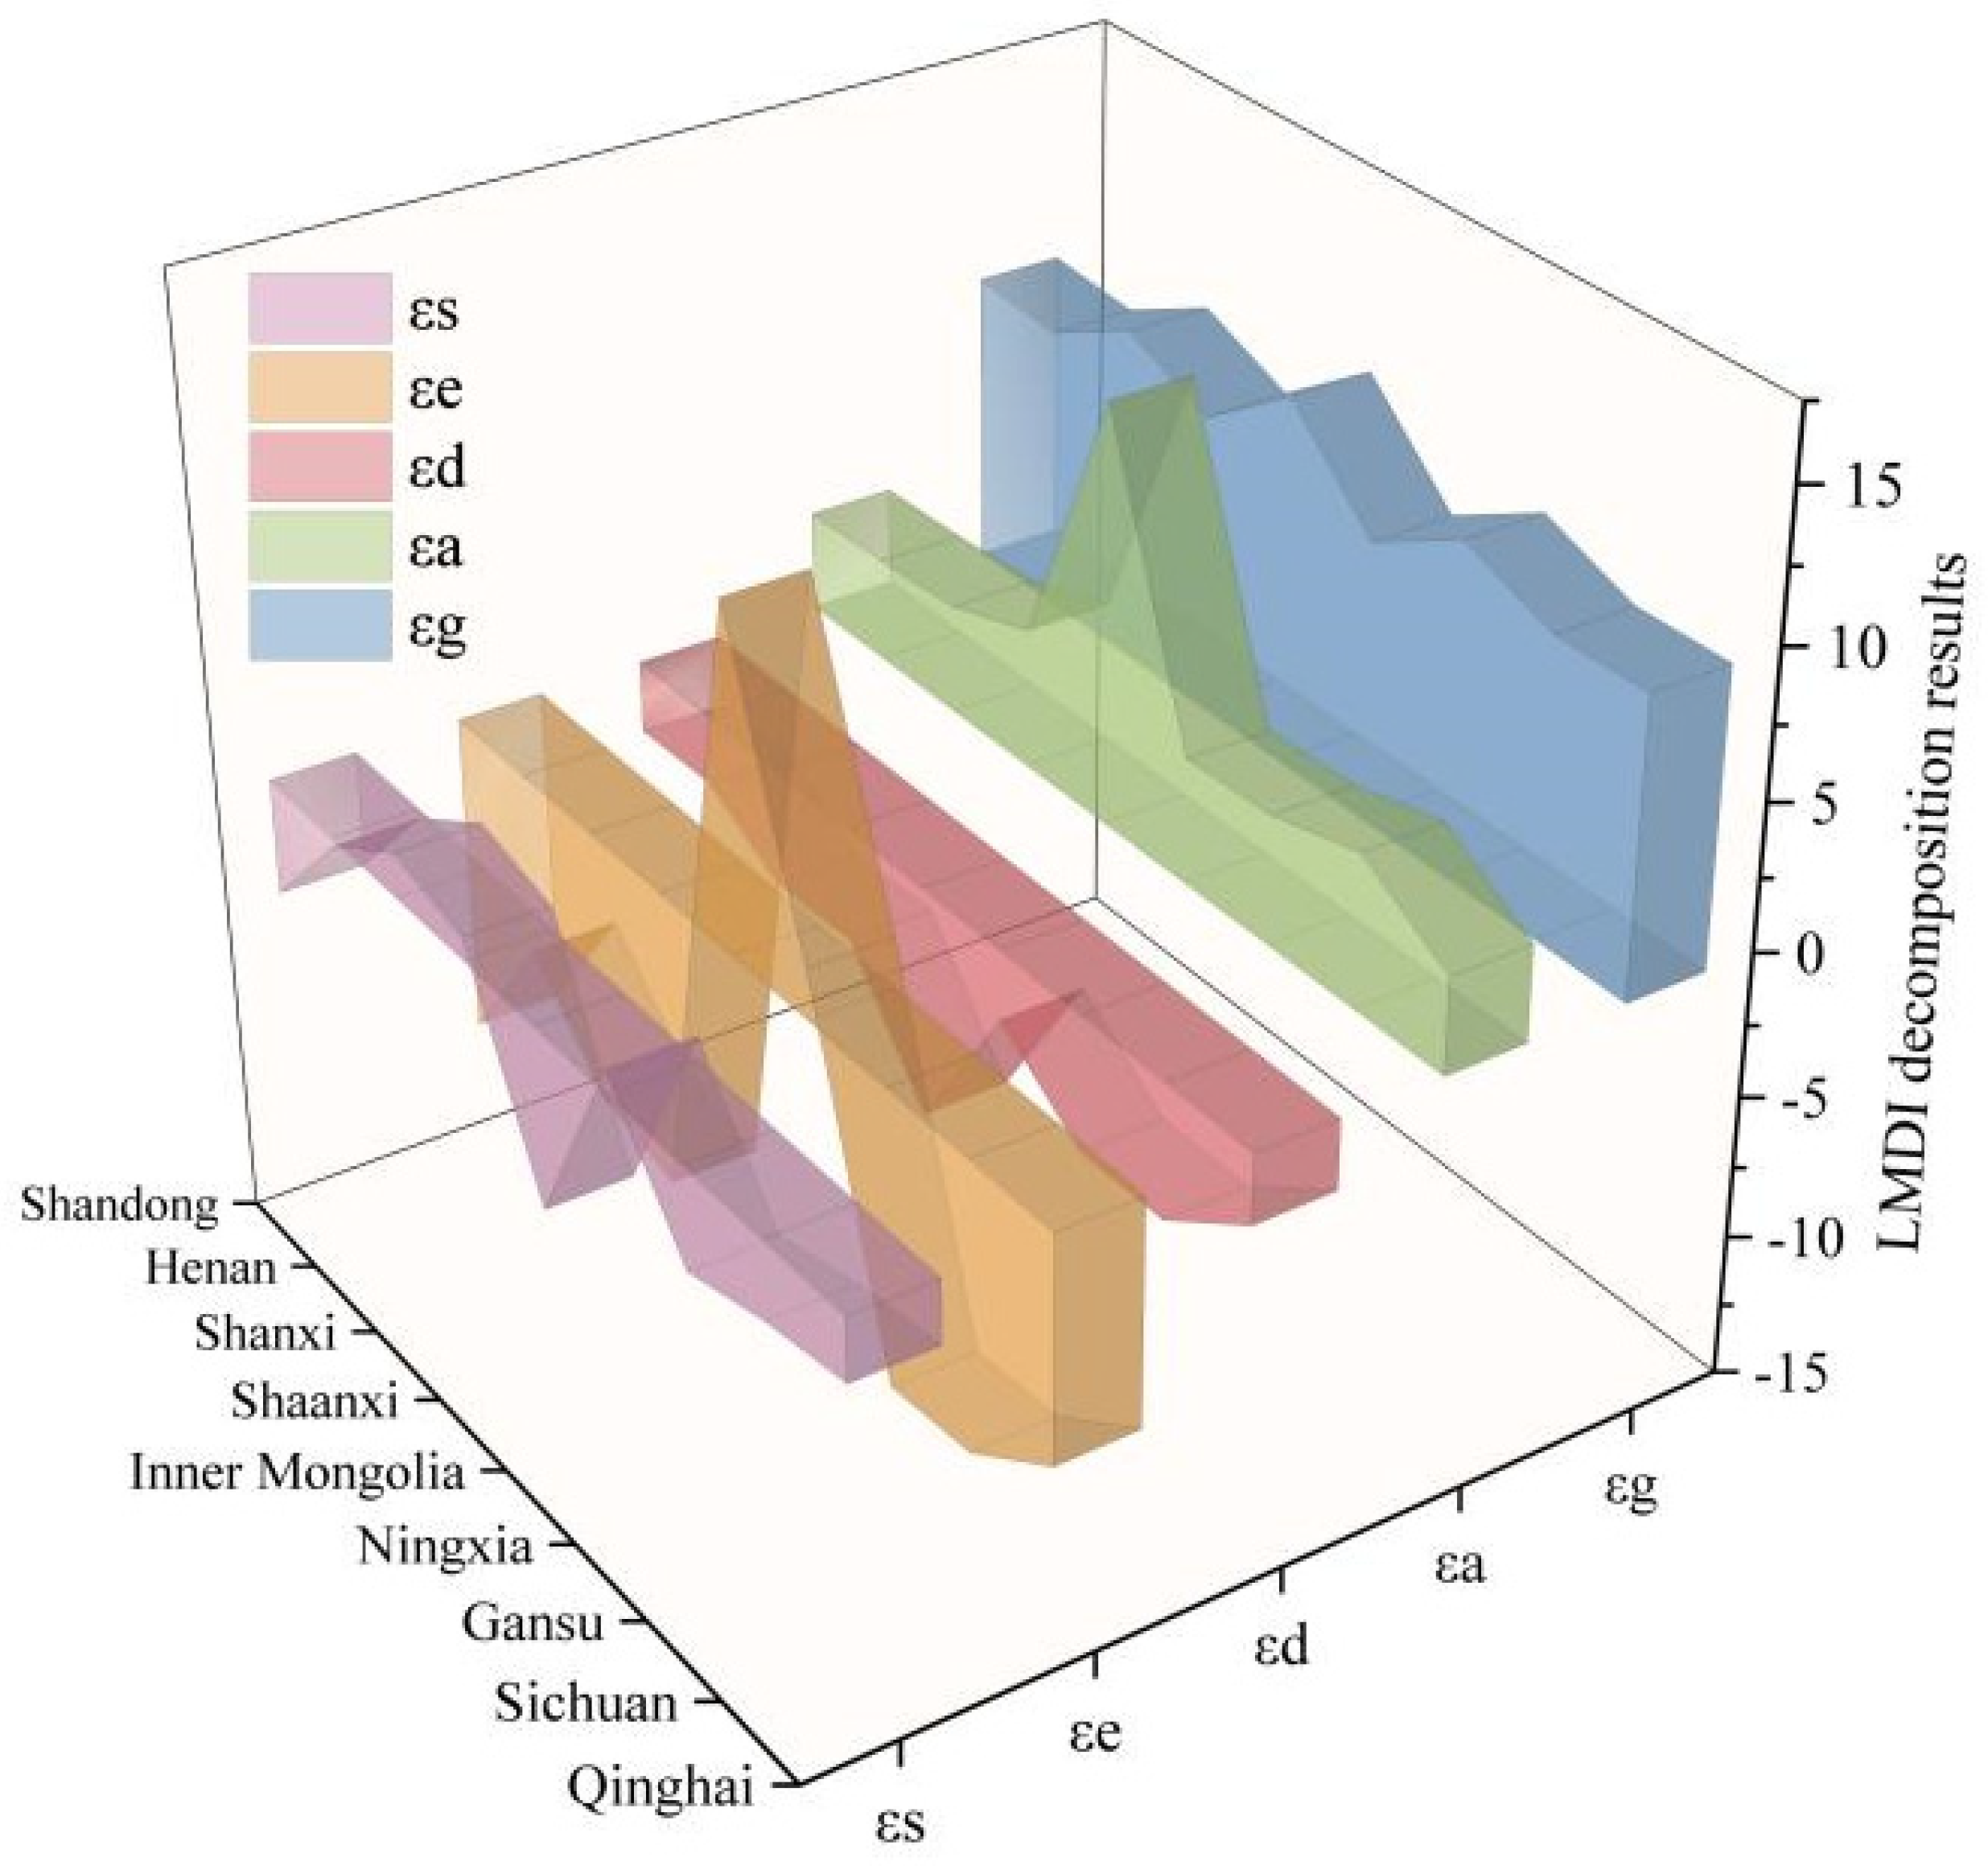
3.3. LMDI Factor Decomposition Results Analysis

In this work, the effects of five driving factors on the CECL decoupling index were investigated by employing the LMDI approach. As can be observed, there are notable variations in the driving effects of each element on the YRB’s CECL decoupling index (Figure 12, Table 4). Our results indicated that the economic output effect and the CL area effect inhibit carbon decoupling, while the energy intensity effect, the population density effect, and the energy structure effect contribute to carbon decoupling.
Keeping with the findings of Guan et al. [35] and Kong et al. [60], the economic output effect made the largest contribution to the decoupling of CECL, accounting for 788.72% of the total contribution. It indicates that the EG in the YRB has driven the expansion of CL, which in turn has increased the need for energy use, inevitably leading to a rise in CECL. Among the five factors, the reduction of energy intensity plays the most pivotal role in promoting carbon decoupling, with a contribution of −489.64%, which suggests that technological progress and the advancements of energy efficiency play a crucial role in pushing the decoupling process. However, this facilitating effect gradually diminishes over time, indicating that the marginal effect of energy efficiency improvement and carbon reduction brought about by technology may diminish as it matures. The CL scale effect is the second strongest factor leading to the rise in CECL, with a contribution of 265.35%, ascribed to the expansion of the CL area in the YRB. Population density effect is always a contributing factor to decoupling, and its total contribution is second only to energy intensity, with a contribution of −292.80%. In addition, the energy structure effect only had a weak counter effect at the beginning of the study period and promoted decoupling in all other years, suggesting that optimizing the energy structure also had a particularly positive contribution to reducing CECL. Its contribution is numerically smaller than the effects of other factors, with a total contribution of −171.63%.
Figure 13 depicts the degrees to which the five driving factors contribute to the decoupling effect of CECL in each of the nine provinces. The economic output effect and the CL scale effect have a more noticeable inhibiting effect on the decoupling of CECL in all provinces. The population density effect facilitates the decoupling of CECL in all provinces. The energy intensity effect and the energy structure effect have some regional heterogeneity in their driving effects on different provinces.

4. Discussion

Currently, China’s research on CE from land use mostly concentrates on the national or provincial scale, with relatively insufficient research on river basins and fewer relevant studies focusing on the specific type of CL. Under the background that environmental conservation and high-quality development of the YRB have been promoted to a national strategy, the emergence of a sustainable economy has become an unavoidable option for the regional policy and development planning of the YRB. CL is the carrier of new urbanization, so the level of decoupling between CECL and EG is related to whether the YRB can achieve its national strategic goals of safeguarding ecology and high-quality development. In this context, this study reveals the temporal and spatial features of CECL in the YRB, explores the decoupling link between CECL and EG, and decomposes the driving elements of the decoupling index.

4.1. Characteristics of Spatiotemporal Variations of CECL

According to the results of this study, CECL in the YRB shows an increasing trend (Figure 3b), which is in agreement with the results of earlier studies [7,38]. With the rapid economic development and urbanization, the CL area has been increasing, along with rising energy use [61]. It is worth noting that CECL decreased in 2013, which may be attributed to the “Twelfth Five-Year Plan for Prevention and Control of Air Pollution in Key Regions” (https://www.gov.cn/gongbao/content/2013/content_2344559.htm, accessed on 1 December 2024) issued by the State Council of China in 2012, which sets clear environmental regulatory objectives, stating that it is required to ensure the coordination of economic prosperity and environmental protection, adopt measures such as total pollutant control and total coal consumption control, and use strict environmental protection means to force the transmission mechanism to encourage the transformation of the economic development mode and realize environmental conservation goals. China’s “Outline of the Twelfth Five-Year Plan for National Economic and Social Development” (https://www.gov.cn/zhuanti/2011-03/16/content_2623428_4.htm, accessed on 1 December 2024) also proposes to focus on environmental conservation in the future and puts forward some energy saving, emission reduction and environmental management measures. It can be seen that under the plans’ guidance, the overall environmental protection initiatives in 2013 have produced outstanding results, and the total CECL from 2013 to 2016 is at a low and stable level. The 13th Five-Year Plan period has seen a significant rise in CECL from 2017 to 2021 as a result of the growing demand for energy to sustain EG and achieve the objective of creating a moderately prosperous society in all respects. It should be added that the stages of change in CECL do not correspond exactly to the stages of China’s five-year plan, which is, to some extent, related to the lag in policy.
The pattern of spatial distribution of CECL is “high in the east and low in the west” (Figure 5), which is mainly due to the significant disparities in economic expansion, energy structure, and industrial structure between the east and the west. For example, in Shandong Province in the east, its total CECL is always at the highest level because Shandong Province not only has a high level of economic development but also the secondary industry makes up a large proportion of the economy of Shandong Province and the secondary industry requires more CL [6]. In contrast, the CECL of western provinces such as Qinghai Province and Gansu Province is at a lower level, which may be attributed to a combination of factors such as the remote geographic location of these provinces, the lower level of urbanization and economic progress, and the low density of the population, which results in lower demand for CL.

4.2. Standard Deviation Ellipse (SDE) of CECL

From the SDE results (Figure 7), the gravity center of CECL is always located in Shanxi Province, China. The reason is that Shanxi Province is a significant coal-producing region in China, rich in coal resources, and has higher energy consumption, which makes Shanxi Province more prominent in the total amount of CECL in the YRB. Therefore, the gravity center of CECL during the study period will always be located in Shanxi Province. According to the strategy of “common but differentiated responsibilities”, Shanxi Province should assume greater responsibility for emission reduction when developing pertinent policies for environmental protection in the future. With the passage of time, the gravity center of CECL migrates to the northwest, and this tendency might have something to do with the transfer of industrial structure, where some energy-consuming industries are transferred from the southern regions to the northwest, and the CECL in the northwest region increases, which makes the gravity center of CECL of the whole basin migrate to the northwest. The SDE of CECL land in the YRB is always distributed in the direction of “northeast-southwest”, and the standard deviation of the long half axis decreases from 2010 to 2021, implying that the CECL are more evenly distributed in the direction of “northeast-southwest”, and the gap between high-emission and low-emission areas decreases. This may be related to the fact that high-carbon provinces, such as Inner Mongolia, continue to encourage industrial transformation and raise the share of clean energies [62], while low-carbon provinces, such as Sichuan, increase their carbon emissions [63]. The short half axis of the ellipse continues to increase, which can be explained by the accelerated EG in the Northwest region, such as Shaanxi and Gansu, since the implementation of the Western Development Strategy [64], which caused a rapid increase in CECL in the Northwest region. Meanwhile, the rapid economic development of the southeast regions, such as Henan and Shandong provinces, has driven a rapid growth of CE from energy consumption and thus manifests itself as an increase in the short half axis.

4.3. Decoupling Analysis of CECL

We also note that the decoupling state of EG and CECL in the YRB is unstable (Figure 8), showing dynamic decoupling, which is in agreement with the findings of Wang et al. [6]. One possible explanation for the WD status is that China’s economy has come into a new normal, and a series of environmental protection policies have been introduced [65], which have had an initial carbon reduction effect, thus promoting the relative decoupling of CE. From 2010 to 2013, the decoupling index continued to decline, and the decoupling status changed in a good direction, thanks to the enforcement of the national low-carbon pilot city policy in 2010 [66], and some provinces in the YRB, such as Shaanxi Province, actively explored low-carbon development paths [67], which led to significant results in emission reduction in the basin. From 2013 to 2018, the decoupling index fluctuated upward in an “N” shape, which implies that the growth rate of CECL in this period has been increasing, gradually exceeding the growth rate of the economy, and the decoupling index fluctuates downward in an inverted “N” trend from 2018 to 2021. As the national and local governments gradually strengthen the execution of environmental preservation and emission reduction policies [68], the low-carbon concept is gradually deepened in people’s hearts, and the efficiency of emission reduction is highlighted, so the decoupling index shows a decreasing trend change. However, the economic expansion of the YRB has yet to escape from the reliance on energy consumption and the harm to the environment, and there is still a long way to go before a stable “SD” state can be achieved.

4.4. Analysis of the Drivers

In terms of driving factors, previous academics have mostly decomposed the driving factors of CE employing the LMDI model, while this research explores the extent to which the five driving factors contribute to the decoupling index from the perspective of decomposing the decoupling index. Our study finds that the economic output effect is the primary factor suppressing carbon decoupling, and the energy intensity effect is the core element contributing to decoupling, consistent with previous findings [69]. Differently, in terms of research approach and perspectives, Wang et al. [69] examined the temporal and spatial features of land-use CE of 69 cities in the YRB at the city level with the help of explorative spatiotemporal data analysis and showed the variation of land-use CE in the YRB at the micro level. The SDE can comprehensively show the global features of the space distribution of geographic factors, including centrality, spreading, density, orientation, and shape characteristics. Therefore, this paper adopts the SDE model and takes the provincial administrative unit as the research scale to demonstrate the dynamic changes of CECL in the YRB at a macro level and capture the differences in CECL among provinces. Furthermore, this study found that the population density effect plays a certain role in carbon emission reduction, which is also proved by the analysis of Li et al. [70]. Population agglomeration encourages the spatial concentration of production factors and commercial activity, especially the pooling of social infrastructure, which could decrease management and fixed investment costs and enhance the efficiency of energy and resource use, ultimately lowering CE [71].
In terms of the influence of drivers on the nine provinces, the five elements that affect the decoupling effect of the nine provinces have both commonality and uniqueness (Figure 13). Among them, the economic output effect has homogeneity on the decoupling effect of the nine provinces and is the biggest factor inhibiting the carbon decoupling in the nine provinces, which indicates that the rise of economic output significantly contributes to the growth of CECL in the nine provinces. In the future, provinces and regions must change their economic development mode, accelerate industrial adjustment, and lessen their reliance on high-energy-consuming and high-emission industries. The CL area effect is the second largest contributor inhibiting the decoupling of the nine provinces. It is worth noting that the CL scale effect has a strong inhibiting effect on decoupling in Inner Mongolia. The reason for this is that the CL in Inner Mongolia increased from 7992.28 km2 to 10,714.23 km2 throughout the study period, a cumulative increase of 2721.95 km2. The expansion of the CL area shrinks Inner Mongolia’s original carbon sinks, such as grasslands, and promotes the increase of local CE, which in turn significantly inhibits the decoupling of CE. We also note that the population density effect has a stronger contribution to the carbon decoupling in Inner Mongolia. The reason may be that compared to other provinces, Inner Mongolia has a much smaller population per unit of CL area than other provinces, which can reduce the local pressure on resources, environment, and ecology. Furthermore, the energy intensity effect facilitates decoupling in most provinces, but it has a dampening effect in Inner Mongolia, which is primarily because energy-heavy sectors dominate Inner Mongolia’s industrial structure and economic development mode. According to the Development and Reform Commission of Inner Mongolia, it is reported that in the last few years, energy consumption in some areas of Inner Mongolia has been growing rapidly, and energy consumption per unit of GDP has risen sharply instead of decreasing (http://fgw.nmg.gov.cn/xxgk/zxzx/fgdt/202103/t20210326_1312524.html, accessed on 1 December 2024). It can be seen that the energy structure effect has promoted the carbon decoupling of a large number of provinces, which, to some extent, indicates that the YRB has achieved initial success in adjusting its energy structure from 2010 to 2021. However, this factor shows an inhibitory effect on Ningxia, Shanxi, and Shaanxi provinces due to the relatively high consumption of coal resources in these three regions [72,73], thus largely curbing carbon decoupling.

5. Conclusions

CL is the natural carrier of humankind production and life and urban construction, as well as the primary contributor of CE. Consequently, it is crucial to thoroughly grasp the temporal and spatial features of CECL. Simultaneously, the expansion of CL plays a crucial role in promoting EG to a large extent, and the study of the decoupling of EG and CECL is of great value in assessing the quality of economic development. Previous studies have seldom included the temporal and spatial characteristics of CECL and decoupling analysis in the same research framework. This paper innovatively integrates the spatial and temporal characteristics of CECL in the YRB and the decoupling effect into the same research framework to encourage the coordinated development of economic and urban construction in the YRB and develop distinctive carbon emission reduction strategies for Sustainable development. In this study, we first estimated the CECL in the YRB from 2010 to 2021 using the IPCC method and revealed the spatial and temporal dynamics features of CECL with the help of ArcGIS software and the SDE model. The Tapio and LMDI models were adopted to uncover the decoupling state of CECL from EG and its driving factors. The following are our primary findings:
The CECL in the YRB and the CL area show the same growth trend to some extent. The CL area increased from 71,979.83 km2 in 2010 to 89,169.81 km2 in 2021; the CECL grew from 2463 million tons in 2010 to 3329 million tons in 2021; and the spatial distribution mode of “high in the east and low in the west” was shown. Shandong Province in the eastern region leads in CECL, while Qinghai and Gansu Provinces in the western region have lower CECL. The SDE of CECL is distributed in the direction of “northeast-southwest”. The migration path of the gravity center is “northwest to northeast to northwest”; WD is the main decoupling state between CECL and EG in the YRB. The economic output effect is the primary inhibitor of decoupling.
The provinces in the YRB differ significantly in terms of EG and resource endowment. Low-carbon development initiatives should be developed according to local conditions, and distinctions should be completely taken into account while impeding the reduction of CE. ① For the eastern provinces with high CECL, such as Shandong and Henan, the economy is relatively developed, and the population is large. The rapid growth of CE can be cut off by population and environmental regulations, strengthening their research and development. ② For western regions with low CECL, such as Qinghai, Gansu, and Sichuan, which are rich in renewable sources, the development of wind and solar power resources on a large scale should be pursued to accelerate the construction of new energy systems. ③ Central provinces such as Shanxi and Shaanxi are crucial zones for CE reduction in the basin. Optimizing the industrial structure should be the core, actively promoting renewable energy. ④ Inner Mongolia is in the northern part of the YRB, one of China’s energy-rich areas. Its vast areas are rich in wind and solar energy resources, which provide a vast space for the large-scale construction of wind power and photovoltaic bases and the carrying out of ecological preservation projects.

Author Contributions

Conceptualization, W.Z., and Z.D.; methodology, Z.D.; software, C.Z.; validation, W.Z.; writing—original draft preparation, Z.D.; writing—reviewing and editing, X.R.; visualization, C.Z.; supervision, X.R.; funding acquisition, X.R. All authors have read and agreed to the published version of the manuscript.

Funding

This research was funded by the National Social Science Fund Project, grant number 19BGL276.

Data Availability Statement

The original contributions presented in the study are included in the article, further inquiries can be directed to the corresponding author.

Acknowledgments

The authors thank the anonymous reviewers and editors for their helpful suggestions during the revision of the paper.

Conflicts of Interest

The authors declare no conflicts of interest.

Abbreviations

CEcarbon emissions
CLconstruction land
CECLcarbon emissions from construction land
EGeconomic growth
YRBYellow River Basin
LMDILogarithmic Mean Divisia Index
SDEstandard deviation ellipse
WDweak decoupling
SDstrong decoupling

References

  1. Li, M.; Liu, H.; Yu, S.; Wang, J.; Miao, Y.; Wang, C. Estimating the Decoupling between Net Carbon Emissions and Construction Land and Its Driving Factors: Evidence from Shandong Province, China. Int. J. Environ. Res. Public Health 2022, 19, 8910. [Google Scholar] [CrossRef] [PubMed]
  2. Nepal, R.; Paija, N. A multivariate time series analysis of energy consumption, real output and pollutant emissions in a developing economy: New evidence from Nepal. Econ. Model. 2019, 77, 164–173. [Google Scholar] [CrossRef]
  3. Yang, S.; Yang, D.; Shi, W.; Deng, C.; Chen, C.; Feng, S. Global evaluation of carbon neutrality and peak carbon dioxide emissions: Current challenges and future outlook. Environ. Sci. Pollut. Res. 2023, 30, 81725–81744. [Google Scholar] [CrossRef]
  4. Bamminger, C.; Poll, C.; Marhan, S. Offsetting global warming-induced elevated greenhouse gas emissions from an arable soil by biochar application. Glob. Change Biol. 2018, 24, 318–334. [Google Scholar] [CrossRef]
  5. Meng, H.; Zhang, X.; Du, X.; Du, K. Spatiotemporal Heterogeneity of the Characteristics and Influencing Factors of Energy-Consumption-Related Carbon Emissions in Jiangsu Province Based on DMSP-OLS and NPP-VIIRS. Land 2023, 12, 1369. [Google Scholar] [CrossRef]
  6. Wang, Q.; Yang, C.; Wang, M.; Zhao, L.; Zhao, Y.; Zhang, Q.; Zhang, C. Decoupling analysis to assess the impact of land use patterns on carbon emissions: A case study in the Yellow River Delta efficient eco-economic zone, China. J. Clean. Prod. 2023, 412, 137415. [Google Scholar] [CrossRef]
  7. Meng, Q.; Zheng, Y.; Liu, Q.; Li, B.; Wei, H. Analysis of spatiotemporal variation and influencing factors of land-use carbon emissions in nine provinces of the Yellow River Basin based on the LMDI model. Land 2023, 12, 437. [Google Scholar] [CrossRef]
  8. Zhang, C.; Zhao, L.; Zhang, H.; Chen, M.; Fang, R.; Yao, Y.; Zhang, Q.; Wang, Q. Spatial-temporal characteristics of carbon emissions from land use change in Yellow River Delta region, China. Ecol. Indic. 2022, 136, 108623. [Google Scholar] [CrossRef]
  9. He, J.; Yang, J. Spatial–Temporal Characteristics and Influencing Factors of Land-Use Carbon Emissions: An Empirical Analysis Based on the GTWR Model. Land 2023, 12, 1506. [Google Scholar] [CrossRef]
  10. Wu, S.; Hu, S.; Frazier, A. Spatiotemporal variation and driving factors of carbon emissions in three industrial land spaces in China from 1997 to 2016. Technol. Forecast. Soc. Change 2021, 169, 120837. [Google Scholar] [CrossRef]
  11. Zhang, T.; Chen, L.; Yu, Z.; Zang, J.; Li, L. Spatiotemporal Evolution Characteristics of Carbon Emissions from Industrial Land in Anhui Province, China. Land 2022, 11, 2084. [Google Scholar] [CrossRef]
  12. Guo, Y.; Yin, W.; Chai, Q.; Yu, A.; Zhao, C.; Fan, Z.; Fan, H.; Coulter, J.A. No tillage and previous residual plastic mulching with reduced water and nitrogen supply reduces soil carbon emission and enhances productivity of following wheat in arid irrigation areas. Field Crop. Res. 2021, 262, 108028. [Google Scholar] [CrossRef]
  13. Wu, H.; Ding, B.; Liu, L.; Zhou, L.; Meng, Y.; Zheng, X. Have Agricultural Land-Use Carbon Emissions in China Peaked? An Analysis Based on Decoupling Theory and Spatial EKC Model. Land 2024, 13, 585. [Google Scholar] [CrossRef]
  14. Dutra, D.; Silveira, M.; Mataveli, G.; Ferro, P.; da Silva Magalhães, D.; de Medeiros, T.; Anderson, L. Challenges for reducing carbon emissions from land-use and land cover change in Brazil. Perspect. Ecol. Conserv. 2024, 22, 213–218. [Google Scholar] [CrossRef]
  15. Kafy, A.; Al Rakib, A.; Fattah, M.; Rahaman, Z.; Sattar, G. Impact of vegetation cover loss on surface temperature and carbon emission in a fastest-growing city, Cumilla, Bangladesh. Build. Environ. 2022, 208, 108573. [Google Scholar] [CrossRef]
  16. Lin, Q.; Zhang, L.; Qiu, B.; Zhao, Y.; Wei, C. Spatiotemporal analysis of land use patterns on carbon emissions in China. Land 2021, 10, 141. [Google Scholar] [CrossRef]
  17. Peng, J.; Zheng, Y.; Liu, C. The Impact of Urban Construction Land Use Change on Carbon Emissions: Evidence from the China Land Market in 2000–2019. Land 2022, 11, 1440. [Google Scholar] [CrossRef]
  18. Wang, M.; Wang, Y.; Wu, Y.; Yue, X.; Wang, M.; Hu, P. Detecting Differences in the Impact of Construction Land Types on Carbon Emissions: A Case Study of Southwest China. Land 2022, 11, 719. [Google Scholar] [CrossRef]
  19. Chuai, X.; Yuan, Y.; Zhang, X.; Guo, X.; Zhang, X.; Xie, F.; Zhao, R.; Li, J. Multiangle land use-linked carbon balance examination in Nanjing City, China. Land Use Pol. 2019, 84, 305–315. [Google Scholar] [CrossRef]
  20. Niu, X.; Liao, F.; Mi, Z.; Wu, G. The Impact of Urban Construction Land Expansion on Carbon Emissions from the Perspective of the Yangtze River Delta Integration, China. Land 2024, 13, 911. [Google Scholar] [CrossRef]
  21. Lin, G. The redevelopment of China’s construction land: Practising land property rights in cities through renewals. China Q. 2015, 224, 865–887. [Google Scholar] [CrossRef]
  22. Yan, H.; Guo, X.; Zhao, S.; Yang, H. Variation of Net Carbon Emissions from Land Use Change in the Beijing-Tianjin-Hebei Region during 1990–2020. Land 2022, 11, 997. [Google Scholar] [CrossRef]
  23. Tan, Y.; Liu, Y.; Chen, Y.; Zhang, Z.; Wu, D.; Chen, H.; Han, Y. The Impact of Urban Construction Land Change on Carbon Emissions—A Case Study of Wuhan City. Int. J. Environ. Res. Public Health 2023, 20, 922. [Google Scholar] [CrossRef] [PubMed]
  24. Li, Y.; Cai, M.; Wu, K.; Wei, J. Decoupling analysis of carbon emission from construction land in Shanghai. J. Clean. Prod. 2019, 210, 25–34. [Google Scholar] [CrossRef]
  25. Cai, Y.; Li, K. Spatiotemporal dynamic evolution and influencing factors of land use carbon emissions: Evidence from Jiangsu Province, China. Front. Environ. Sci. 2024, 12, 1368205. [Google Scholar] [CrossRef]
  26. Tapio, P. Towards a theory of decoopling: Degrees of decoupling in the EU and the case of road traffic in Finland between 1970 and 2001. Transp. Policy 2005, 12, 137–151. [Google Scholar] [CrossRef]
  27. Jia, L.; Wang, M.; Yang, S.; Zhang, F.; Wang, Y.; Li, P.; Ma, W.; Sui, S.; Liu, T.; Wang, M. Analysis of Agricultural Carbon Emissions and Carbon Sinks in the Yellow River Basin Based on LMDI and Tapio Decoupling Models. Sustainability 2024, 16, 468. [Google Scholar] [CrossRef]
  28. Yang, B.; Wang, Y.; Dunya, R.; Xiang, S. Study on the driving factors and decoupling effect of carbon emission from pig farming in China—Based on LMDI and Tapio model. Environ. Dev. Sustain. 2023, 25, 1–31. [Google Scholar] [CrossRef]
  29. Zha, J.; Dai, J.; Ma, S.; Chen, Y.; Wang, X. How to decouple tourism growth from carbon emissions? A case study of Chengdu, China. Tour. Manag. Perspect. 2021, 39, 100849. [Google Scholar] [CrossRef]
  30. Tang, Y.; Jiang, H.; Yang, X.; Zhang, D. Decoupling effect and influencing factors of transportation carbon emissions in Hainan Province. IEEE Access 2024, 12, 131750–131761. [Google Scholar] [CrossRef]
  31. Ang, B.; Liu, F. A new energy decomposition method: Perfect in decomposition and consistent in aggregation. Energy 2001, 26, 537–548. [Google Scholar] [CrossRef]
  32. Chun, T.; Wang, S.; Xue, X.; Xin, H.; Gao, G.; Wang, N.; Tian, X.; Zhang, R. Decomposition and decoupling analysis of multi-sector CO2 emissions based on LMDI and Tapio models: Case study of Henan Province, China. Environ. Sci. Pollut. Res. 2023, 30, 88508–88523. [Google Scholar] [CrossRef] [PubMed]
  33. Wang, M.; Xiang, Z.; An, Q.; Zhuo, Y.; Du, X.; Wang, P. Study on green and low-carbon development in Qinghai Province Based on decoupling index and LMDI. Adv. Clim. Change Res. 2021, 17, 598–607. [Google Scholar] [CrossRef]
  34. Chen, L.; Thapa, B.; Yan, W. The relationship between tourism, carbon dioxide emissions, and economic growth in the Yangtze River Delta, China. Sustainability 2018, 10, 2118. [Google Scholar] [CrossRef]
  35. Guan, Q. Decomposing and Decoupling the Energy-Related Carbon Emissions in the Beijing–Tianjin–Hebei Region Using the Extended LMDI and Tapio Index Model. Sustainability 2023, 15, 9681. [Google Scholar] [CrossRef]
  36. Wang, S.; Sun, P.; Sun, H.; Liu, Q.; Liu, S.; Lu, D. Spatiotemporal Variations of Carbon Emissions and Their Driving Factors in the Yellow River Basin. Int. J. Environ. Res. Public Health 2022, 19, 12884. [Google Scholar] [CrossRef]
  37. Wu, H.; Yang, Y.; Li, W. Analysis of spatiotemporal evolution characteristics and peak forecast of provincial carbon emissions under the dual carbon goal: Considering nine provinces in the Yellow River basin of China as an example. Atmos. Pollut. Res. 2023, 14, 101828. [Google Scholar] [CrossRef]
  38. Zhao, J.; Kou, L.; Wang, H.; He, X.; Xiong, Z.; Liu, C.; Cui, H. Carbon Emission Prediction Model and Analysis in the Yellow River Basin Based on a Machine Learning Method. Sustainability 2022, 14, 6153. [Google Scholar] [CrossRef]
  39. Wei, X.; Zhang, L.; He, Y.; Gao, Y.; Yao, X.; Ding, Y.; Guo, Y. Spatiotemporal characteristics and prediction of ecological safety in the Yellow River Basin of China. IEEE J. Sel. Top. Appl. Earth Obs. Remote Sens. 2024, 17, 16119–16138. [Google Scholar] [CrossRef]
  40. Yu, Y.; Hua, T.; Chen, L.; Zhang, Z.; Paulo, P. Divergent changes in vegetation greenness, productivity, and rainfall use efficiency are characteristic of ecological restoration towards high-quality development in the Yellow River Basin, China. Engineering 2024, 34, 109–119. [Google Scholar] [CrossRef]
  41. Wang, H.; Ma, T. Optimal water resource allocation considering virtual water trade in the Yellow River Basin. Sci. Rep. 2024, 14, 79. [Google Scholar] [CrossRef] [PubMed]
  42. Lai, Z.; Li, L.; Huang, M.; Tao, Z.; Shi, X.; Li, T. Spatiotemporal evolution and decoupling effects of sustainable water resources utilization in the Yellow River Basin: Based on three-dimensional water ecological footprint. J. Environ. Manag. 2024, 366, 121846. [Google Scholar] [CrossRef] [PubMed]
  43. Wang, H.; Wu, L.; Yue, Y.; Jin, Y.; Zhang, B. Impacts of climate and land use change on terrestrial carbon storage: A multi-scenario case study in the Yellow River Basin (1992–2050). Sci. Total Environ. 2024, 930, 172557. [Google Scholar] [CrossRef]
  44. Li, H.; Mu, H.; Jian, S.; Li, X. Assessment of Rainfall and Temperature Trends in the Yellow River Basin, China from 2023 to 2100. Water 2024, 16, 1441. [Google Scholar] [CrossRef]
  45. Feng, Y.; Zhu, A. Spatiotemporal differentiation and driving patterns of water utilization intensity in Yellow River Basin of China: Comprehensive perspective on the water quantity and quality. J. Clean. Prod. 2022, 369, 133395. [Google Scholar] [CrossRef]
  46. Liu, K.; Qiao, Y.; Shi, T.; Zhou, Q. Study on coupling coordination and spatiotemporal heterogeneity between economic development and ecological environment of cities along the Yellow River Basin. Environ. Sci. Pollut. Res. 2021, 28, 6898–6912. [Google Scholar] [CrossRef]
  47. Yin, Y.; Peng, W.; Xie, X. Spatial-temporal characteristics and obstacle factors analysis of urban resources and environment carrying capacity in the Yellow River Basin cities. Environ. Dev. Sustain. 2023, 25, 1–20. [Google Scholar] [CrossRef]
  48. Zhang, Z.; Hu, B.; Qiu, H. Comprehensive evaluation of resource and environmental carrying capacity based on SDGs perspective and Three-dimensional Balance Mode. Ecol. Indic. 2022, 138, 108788. [Google Scholar] [CrossRef]
  49. Fang, Z.; Ding, T.; Chen, J.; Xue, S.; Zhou, Q.; Wang, Y.; Wang, Y.; Huang, Z.; Yang, S. Impacts of land use/land cover changes on ecosystem services in ecologically fragile regions. Sci. Total Environ. 2022, 831, 154967. [Google Scholar] [CrossRef]
  50. Pan, L.; Yu, J.; Lin, L. The temporal and spatial pattern evolution of land-use carbon emissions in China coastal regions and its response to green economic development. Front. Environ. Sci. 2022, 10, 1018372. [Google Scholar] [CrossRef]
  51. Yang, B.; Chen, X.; Wang, Z.; Li, W.; Zhang, C.; Yao, X. Analyzing land use structure efficiency with carbon emissions: A case study in the Middle Reaches of the Yangtze River, China. J. Clean. Prod. 2020, 274, 123076. [Google Scholar] [CrossRef]
  52. Wei, W.; Li, Y.; Ma, L.; Xie, B.; Hao, R.; Chen, D.; Yang, S. Carbon emission change based on land use in Gansu Province. Environ. Monit. Assess. 2024, 196, 311. [Google Scholar] [CrossRef] [PubMed]
  53. Hu, Y.; Zhang, K.; Hu, N.; Wu, L. A review of agricultural carbon emission measurement in China. Chin. J. Eco Agric. 2023, 31, 163–176. [Google Scholar] [CrossRef]
  54. Gui, D.; He, H.; Liu, C.; Han, S. Spatio-temporal dynamic evolution of carbon emissions from land use change in Guangdong Province, China, 2000–2020. Ecol. Indic. 2023, 156, 111131. [Google Scholar] [CrossRef]
  55. Lefever, D.W. Measuring geographic concentration by means of the standard deviational ellipse. Am. J. Sociol. 1926, 32, 88–94. [Google Scholar] [CrossRef]
  56. Duman, Z.; Mao, X.; Cai, B.; Zhang, Q.; Chen, Y.; Gao, Y.; Guo, Z. Exploring the spatiotemporalpattern evolution of carbon emissions and air pollution in Chinesecities. J. Environ. Manag. 2023, 345, 118870. [Google Scholar] [CrossRef] [PubMed]
  57. Wang, W.; Samat, A.; Abuduwaili, J.; Ge, Y. Spatio-temporal variations of satellite-based PM2.5 concentrations and its determinants in Xinjiang, northwest of China. Int. J. Environ. Res. Public Health 2020, 17, 2157. [Google Scholar] [CrossRef]
  58. Kaya, Y. Impact of Carbon Dioxide Emission Control on GNP Growth: Interpretation of Proposed Scenarios; IPCC Energy and Industry Subgroup, Response Strategies Working Group: Paris, France, 1989. [Google Scholar]
  59. Yuan, Y.; Lu, Y.; Xie, J.; Tao, J.; Chuai, X.; Huang, S.; Pu, L. Decoupling and decomposition analysis of industrial carbon emissions and economic growth in China from a dynamic perspective. Environ. Dev. Sustain. 2024, 26, 1–23. [Google Scholar] [CrossRef]
  60. Kong, H.; Shi, L.; Da, D.; Li, Z.; Tang, D.; Xing, W. Simulation of China’s Carbon Emission Based on Influencing Factors. Energies 2022, 15, 3272. [Google Scholar] [CrossRef]
  61. Feng, Y.; Peng, D.; Li, Y.; Liu, S. Can regional integration reduce carbon intensity? Evidence from city cluster in China. Environ. Dev. Sustain. 2024, 26, 5249–5274. [Google Scholar] [CrossRef]
  62. Wang, X.; Lu, Z.; Li, T.; Zhang, P. Carbon-neutral power system transition pathways for coal-dominant and renewable Resource-abundant regions: Inner Mongolia as a case study. Energy Convers. Manag. 2023, 285, 117013. [Google Scholar] [CrossRef]
  63. Zhang, J.; Lu, H.; Peng, W.; Zhang, L. Analyzing carbon emissions and influencing factors in Chengdu-Chongqing urban agglomeration counties. J. Environ. Sci. 2025, 151, 640–651. [Google Scholar] [CrossRef]
  64. Wang, L.; Fan, J.; Wang, J.; Zhao, Y.; Li, Z.; Guo, R. Spatio-temporal characteristics of the relationship between carbon emissions and economic growth in China’s transportation industry. Environ. Sci. Pollut. Res. 2020, 27, 32962–32979. [Google Scholar] [CrossRef]
  65. Li, Q.; Wu, S.; Lei, Y.; Li, S.; Li, L. Evolutionary path and driving forces of inter-industry transfer of CO2 emissions in China: Evidence from structural path and decomposition analysis. Sci. Total Environ. 2021, 765, 142773. [Google Scholar] [CrossRef] [PubMed]
  66. Zhang, H.; Feng, C.; Zhou, X. Going carbon-neutral in China: Does the low-carbon city pilot policy improve carbon emission efficiency? Sustain. Prod. Consum. 2022, 33, 312–329. [Google Scholar] [CrossRef]
  67. Hou, X.; Hu, Q.; Liang, X.; Xu, J. How do low-carbon city pilots affect carbon emissions? Staggered difference in difference evidence from Chinese firms. Econ. Anal. Policy 2023, 79, 664–686. [Google Scholar] [CrossRef]
  68. Zhao, X.; Ma, X.; Chen, B.; Shang, Y.; Song, M. Challenges toward carbon neutrality in China: Strategies and countermeasures. Resour. Conserv. Recycl. 2022, 176, 105959. [Google Scholar] [CrossRef]
  69. Wang, X.; Zhao, X.; Zhang, S.; Shi, S.; Zhang, X. Decoupling Effect and Driving Factors of Land-Use Carbon Emissions in the Yellow River Basin Using Remote Sensing Data. Remote Sens. 2023, 15, 4446. [Google Scholar] [CrossRef]
  70. Li, R.; Li, L.; Wang, Q. The impact of energy efficiency on carbon emissions: Evidence from the transportation sector in Chinese 30 provinces. Sustain. Cities Soc. 2022, 82, 103880. [Google Scholar] [CrossRef]
  71. Lian, W.; Sun, X.; Xing, W.; Gao, T.; Duan, H. Coordinated development and driving factor heterogeneity of different types of urban agglomeration carbon emissions in China. Environ. Sci. Pollut. Res. 2023, 30, 35034–35053. [Google Scholar] [CrossRef]
  72. Wang, K.; Li, Z.; Xu, Z.; Wang, J.; Jia, M.; Wang, L.; Xin, Y.; Duo, X. Evaluating and simulating the impacts of land use patterns on carbon emissions in coal resource-based regions: A case study of shanxi province, China. J. Clean. Prod. 2024, 458, 142494. [Google Scholar] [CrossRef]
  73. Yan, X.; Wang, X. Evaluation and Analysis of Synergy between Energy and Environmental Policies in Coal Resource-Rich Areas. Sustainability 2024, 16, 2623. [Google Scholar] [CrossRef]
Figure 1. Study location overview map.
Land 14 00320 g001
Figure 2. Research framework of this paper.
Land 14 00320 g002
Figure 3. Trends in CL area (a), CECL and annual growth rate (b) (between 2010 and 2021).
Land 14 00320 g003
Figure 4. CL area (a), and CECL in the nine provinces of the YRB (b) (between 2010 and 2021).
Land 14 00320 g004
Figure 5. Spatial distribution pattern of CECL in the YRB (between 2010 and 2021).
Land 14 00320 g005
Figure 6. Changes in the CL area in the YRB (between 2010 and 2021).
Land 14 00320 g006
Figure 7. SDE and its central migration of CECL in YRB (between 2010 and 2021).
Land 14 00320 g007
Figure 8. Trend of decoupling index in the YRB.
Land 14 00320 g008
Figure 9. Decoupling status in the nine provinces of the YRB (between 2010 and 2021).
Land 14 00320 g009
Figure 10. Decoupling status percentage in nine provinces of the YRB (between 2010 and 2021).
Land 14 00320 g010
Figure 11. Spatial pattern evolution of decoupling status of CECL in the YRB (between 2010 and 2021).
Land 14 00320 g011
Figure 12. LMDI decomposition results of the decoupling index of the YRB.
Land 14 00320 g012
Figure 13. LMDI decomposition results of the decoupling index in 9 provinces of the YRB.
Land 14 00320 g013
Table 1. Conversion coefficient of standard coal and carbon emission coefficient.
EnergyConversion Coefficient of Standard Coal (kgce/kg)Carbon Emission Coefficient (kgc/kgce)
Raw coal0.71430.7559
Coke0.97140.8550
Crude oil1.42860.5857
Gasoline1.47140.5538
Kerosene1.47140.5714
Diesel fuel1.45710.5921
Fuel oil1.42860.6185
Natural gas13.3000.4483
Table 2. Parameters of SDE of CECL in YRB.
YearCenter XCenter YXStdDist/kmYStdDist/kmRotation/°Area/km²Distance/kmVelosity/km·a−1
2010112°07′15″37°00′52″722.47540.2156.011,226,060--
2014111°52′26″37°19′29″735.75554.8153.961,282,32041.1610.29
2018112°01′40″37°36′35″709.14562.4757.661,253,01034.878.72
2021111°50′38″37°44′50″715.52566.8451.131,274,11022.277.42
Table 3. Decoupling index and decoupling states of CECL in the YRB (between 2010 and 2021).
YearΔC/CΔGDP/GDPDecoupling IndexDecoupling Status
2010–20110.1340.1221.10EC
2011–20120.0230.1050.22WD
2012–2013−0.0610.095−0.64WD
2013–20140.0250.0840.30WD
2014–20150.0020.0760.03WD
2015–2016−0.0020.074−0.03WD
2016–20170.0240.0720.34WD
2017–20180.0790.0701.11EC
2018–20190.0360.0620.59WD
2019–20200.0220.0270.84EC
2020–20210.0340.0740.46WD
Table 4. LMDI decomposition results of driving factors in the YRB (between 2010 and 2021).
Year ε s ε e ε g ε d ε a
2010–20110.61−0.178.63−1.381.89
2011–2012−1.47−4.128.45−2.272.53
2012–2013−2.15−11.688.28−4.754.95
2013–2014−0.68−6.338.27−1.602.07
2014–2015−0.97−6.008.39−2.723.02
2015–2016−1.79−10.117.89−2.353.09
2016–2017−1.76−9.208.27−2.893.46
2017–2018−2.43−6.608.73−3.033.26
2018–2019−2.15−2.868.53−2.933.38
2019–2020−5.333.309.58−9.962.98
2020–2021−2.20−4.208.36−0.770.80
Total effect−20.32−57.9793.38−34.6631.41
Contribution/%−171.63%−489.64%788.72%−292.80%265.35%
Note: If the decomposition result of a factor is above zero, it indicates that the factor has an inhibition on the decoupling of CE, and vice versa, it has a facilitating effect on decoupling.
Disclaimer/Publisher’s Note: The statements, opinions and data contained in all publications are solely those of the individual author(s) and contributor(s) and not of MDPI and/or the editor(s). MDPI and/or the editor(s) disclaim responsibility for any injury to people or property resulting from any ideas, methods, instructions or products referred to in the content.

