Article

Geochemical Distribution of Ni, Cr, and Co in the Main Soil Types of the Čemernica River Basin in Serbia (In a Serpentine Environment)

by
Sonja Tošić Jojević
1,*,
Vesna Mrvić
1,
Olivera Stajković-Srbinović
1,
Marina Jovković
1,
Svetlana Antić Mladenović
2,
Matija Krpović
2 and
Snežana Belanović Simić
3
1
Institute of Soil Science, Teodora Drajzera 7, 11000 Belgrade, Serbia
2
Faculty of Agriculture, University of Belgrade, Nemanjina 6, 11080 Belgrade, Serbia
3
Faculty of Forestry, University of Belgrade, Kneza Višeslava 1, 11030 Belgrade, Serbia
*
Author to whom correspondence should be addressed.
Land 2024, 13(12), 2075; https://doi.org/10.3390/land13122075
Submission received: 4 November 2024 / Revised: 27 November 2024 / Accepted: 30 November 2024 / Published: 2 December 2024

Abstract

:
The origin and bioavailability of nickel (Ni), chromium (Cr), and cobalt (Co) have been assessed in the Čemernica River basin among the following soil types: Leptosol on serpentinite and Fluvisol, Vertisol, and Leptosol on sandstone. Alongside the impact of serpentine rocks, part of the region also displays significant anthropogenic activity. A sequential analysis following the modified BCR procedure identified four fractions of heavy metals: F1—exchangeable and acid-soluble, F2—bound to Fe and Mn oxides, F3—bound to organic matter, and F4—residual. The overall content of Ni, Cr, and Co in the soil increases in the following order: Leptosol on sandstone, and Vertisol, Fluvisol, Leptosol on serpentinite. In most samples, the values exceed the maximum allowable concentrations in legal regulations, while in some samples, particularly in serpentine soils, they also exceed the remediation thresholds. The average contribution of nickel in the overall content decreases as follows: F4 > F2 > F3 > F1, chromium as F4 > F3 > F2 > F1, and cobalt in the most samples as F2 > F4 > F1 > F3. The percentage of Ni, Cr, and Co in the fractions of different soil types is similar to that in serpentine soils, though the absolute contents vary significantly, indicating a common origin, which is mostly geochemical. According to the Risk Assessment Code, most samples exhibit a low bioavailability risk.

1. Introduction

Nickel, chromium, and cobalt are elements with a similar distribution in the parent material. In soil, their content varies depending on the geological base, pedogenesis processes, and anthropogenic factors.
The composition of the geological substrate largely determines the content of elements. Nickel, chromium, and cobalt occur particularly in large quantities in ultrabasic rocks, where they bind to ferromagnesian minerals through isomorphic substitution [1,2]. Metamorphic and sedimentary rocks formed by the disintegration, transport, deposition, and transformation of material from ultrabasic rocks have high levels of Ni, Cr, and Co, as well as Fe, Mn, and Mg [3,4,5,6,7]. With a decrease in ferromagnesian minerals and other components that carry Cr, Ni, and Co in the substrate, the natural content decrease, so acidic igneous rocks, sandstones, and limestones have the lowest element concentrations [1].
In addition to the natural content, numerous anthropogenic activities contribute to the presence of these elements. The primary anthropogenic sources of Ni, Cr, and Co in soil include industrial and energetic facilities, as well as traffic and intensive agriculture measures, irrigation with contaminated water, and the application of organic, industrial and communal waste and wastewater [8,9]. In the research area within the city of Čačak, the periodic monitoring of environmental conditions has recorded concentrations of PM10 fractions and settled particulate matter (containing the studied elements) that exceed the allowable and tolerance limits. The measured values have been linked to emissions from vehicle exhaust and heat energy production facilities.
Determining the origin of heavy metals is important because they are from geochemical sources and are mostly found in forms with low mobility in soil (such as oxides, sulfides, and silicates), while metals from anthropogenic sources are often present in forms that are more accessible (soil solution, exchangeably adsorbed, in soluble organic complexes) [10].
Using sequential chemical extraction methods of nickel, several authors note that uncontaminated soils are characterized by a high proportion of the metal in the residual fraction [3,11,12]. Around 50% of Ni in soils and sediments may be linked to the residual fraction, 20% to the Fe/Mn oxides fraction, while the remainder is associated with the carbonate, exchangeable, and organic fractions [13]. The concentrations of Cr in the residual fraction are often higher than those of Ni, as Cr is found in minerals more resistant to decomposition [14]. Additionally, due to the narrower range of pH and Eh values at which Cr is mobile in soils, its presence in the residual fraction is higher than that of Ni [10,11,12,13,14,15,16]. On the other hand, in contaminated soils, metals are more prevalent in more easily soluble fractions compared to uncontaminated soils [17]. In soils impacted by wastewater sludge, a significant increase in Cr associated with hydroxides and organic matter has been observed [1].
In addition to sequential analysis, the bioavailability and ecotoxicity of elements can also be determined by methods of the individual extraction of elements, such as methods using strong chelating extraction reagents, such as DTPA. The DTPA values of exchangeable elements vary in different soils depending on the soil pH, redox conditions, and the content and type of organic matter and clay [1,10]. With this extractant, in most of the tested soils, less Ni and Co are extracted compared to the most mobile fraction of the sequential analysis F1 [11].
In terms of the cobalt distribution across chemical fractions, it has been established that due to the strong affinity of Fe and Mn oxides for Co, the reducible fraction is dominant, as confirmed in numerous studies. Serpentine soils were examined, and it was noted that, in comparison to Cr and Ni, Co exhibited a much higher affinity for the Mn oxide fraction of soils, in addition to its abundance in the residual fraction [17,18]. Determining the origin and mobility of elements is particularly important in soils rich in heavy metals, as they have a potentially greater harmful impact on the environment.
In Western Serbia, in the Čemernica River basin and the Zapadna Morava valley, previous studies have shown elevated concentrations of Ni and Cr in soils [19,20,21]. In this area, serpentinite rocks are found in the northern and central parts of the Čemernica River basin, which influences the surrounding region. Additionally, anthropogenic pollution from major roads (intense local and transit road traffic, including the A1 highway, part of the European road network), intensive agricultural production (the use of chemicals in the cultivation of vegetable, field, and fruit crops, especially on Vertisols and Fluvisols), and urbanization (the city of Čačak with facilities for heat energy production) is present.
The aims of this study are to analyze the content of Ni, Cr, and Co in the most prevalent soil types on different geological substrates (spatial and vertical distribution) to determine their dynamics under varying environmental conditions and predict their origin. It also seeks to examine the chemical binding of these elements to the solid phase of the soil, using single (DTPA) and sequential (BCR) extraction methods to assess their bioavailability, mobility under changing environmental conditions, potential toxicity, and to identify anthropogenic pollution sources. Additionally, the study evaluates the impact of an increased element content and the environmental consequences based on the level of area contamination and the enrichment factors of the soil.
The novelty of this study can be observed through the analysis of the geochemical distribution of Ni, Cr, and Co in the studied soil types, as a consequence of the geological substrate containing high concentrations of these elements, which has not been sufficiently investigated so far. Particular significance and novelty lie in the analysis of cobalt binding forms to soil components, which exhibit specific characteristics compared to other elements. Additionally, the combination of various methods, including single and sequential extractions, the calculation of different indices, and the analysis of the data by soil depth, has enabled a more comprehensive and detailed understanding of the origin, bioavailability, and impact of these elements on the environment under the specific conditions of the Čemernica basin. This research provides the opportunity to interpret the origin of potentially toxic elements (PTEs) for the entire West Morava River basin, which is characterized by a specific geological substrate. The results also contribute to a broader understanding of the mechanisms of PTE distribution and mobility, particularly in areas with similar geological characteristics.
The underlying hypotheses propose that the concentration of different forms of Ni, Cr, and Co is influenced by the soil type and that the geochemical origin of these elements is predominant in the investigated area.

2. Materials and Methods

2.1. Study Sites

The study area is located in Western Serbia. It encompasses the Čemernica River basin and the Zapadna Morava valley up to Konjević. The map of the areas studied is show in Figure 1. The geolocation data of sampling points: P1 (437644, 4875900); P2 (452936, 4860832); P3 (444365, 4865785); P4 (450982, 4879217); P5 (444178, 4867379); P6 (444493, 4864420); P7 (445814, 4862621); P8 (438401, 4885680); P9 (439183, 4874928); P10 (438923, 4872545); P11 (444368, 4884068); and P12 (442766, 4885259). The terrain has altitudes ranging from 300 to 985 m.a.s.l. [22].
The examined Čemernica River basin spans 41 km with an asymmetric river basin and river system. The Čemernica originates between the Maljen and Suvobor mountains, which are composed of serpentinite rocks. The geological composition of these serpentinite rocks influences the composition of the surrounding soil, especially the composition of alluvial deposits transported and deposited in the Zapadna Morava valley. The selected locations were based on previous research regarding PTEs’ content, land use, and prevalent soil types in the basin [19].

2.2. Sampling, Pre-Treatment, and Analysis of Soil

Field research was carried out from July to August 2020. Samples were taken at depths of 0–10 cm, 10–30 cm, and 30–60 cm at twelve locations from different soil types, which were classified according to the World Reference Base (WRB—World Reference Base, IUSS Working Group, 2015): Fluvisol (P1, P2, and P3), Vertisol (P4, P5, P6, and P7), Leptosol on serpentinite (P8, P9, and P10), and Leptosol on sandstone (P11 and P12) [23]. Composite samples were collected from all locations. Each composite sample (P1 to P12) was analyzed in the laboratory with three replicates.
After sampling, the samples were air-dried, ground, and sieved through a 2 mm mesh, and all the specified analyses were performed on these prepared samples. Soil texture was determined by pipette method with 0.4 mol L−1 tetrasodium diphosphate (Na4P2O7) (International B (documented)). Particle size was determined by Atterberg and texture classes were classified according to the International Soil Texture Triangle (USA, 1993). Soil pH was measured with a glass electrode pH meter (in H2O 1:5 v/v, in 1 mol L−1 KCl 1:5 v/v) [24] Cation exchange capacity (CEC) was measured by saturating the soil with 1 mol L−1 ammonium acetate at pH 7 [25]. SOM content was determined by dry combustion SRPS ISO 10694:2005 [26].

2.3. Fractionation of the Studied Metals

The content of Ni, Cr, and Co in soil samples was determined using inductively coupled plasma-atomic emission spectrometry (ICP-AES) [27] after extraction with DTPA (diethylenetriaminepentaacetic acid) buffer solution [28], and for pseudototal (total) form, with digestion of samples with nitric acid and hydrogen peroxide [29]. The total form of Fe and Mn was determined using the same method as for the previously mentioned elements.
The extraction of metals was performed using the DTPA-TEA method. For each sample, 10.0 g of soil was weighed into extraction vessels, followed by the addition of 20.0 mL of DTPA extraction solution. The extraction solution was prepared by combining 0.005 M DTPA, 0.01 M CaCl2, and 0.1 M TEA (triethanolamine—(HOCH2CH2)3N), adjusted to pH 7.3 using diluted HCl. The mixture was shaken at 25 °C for exactly 2 h to ensure thorough extraction. After shaking, the solution was filtered through fine-porosity filter paper into clean vessels, discarding the initial portion of the filtrate. If necessary, the filtrate or unfiltered extract was transferred to centrifuge tubes and centrifuged at 3000 rpm for approximately 10 min to obtain a clear solution.
To ensure quality control, blank samples and the reference soil sample ERM–CC141 LOAM SOIL were used. The ICP Calibration Standard (IV) with 23 components (CPA Chem) was used for calibration on the Thermo Scientific iCAP 6300–ICP-OES. The measurement range for Ni was 0.4–10,000 mg kg−1, for Cr was 0.3–10,000 mg kg−1, and for Co was 0.1–10,000 mg kg−1. The obtained concentrations of Ni, Cr, and Co were compared with threshold values [30] and remediation values [31].
Using sequential analysis based on the modified BCR procedure, four fractions of heavy metals were determined, in which metals are bound to specific soil components with varying strengths [32]: Step 1 (fraction soluble in acid—metals exchangeable or associated with carbonates)—each 1 g of sample was added 40 mL of 0.11 mol L−1 acetic acid solution, with agitation for 16 h at 22 °C; the extract was separated from the solid phase by centrifugation at 3000 rpm for 20 min, and the supernatant stored for later analysis. Step 2 (reducible fraction—metals associated with oxides of Fe and Mn)—residue from stage 1 was added to 40 mL of 0.5 mol L−1 acid hydroxyl ammonium chloride solution (pH 1.5); the suspension was then agitated for 16 h at 22 °C, and the extract was separated from the solid phase by centrifugation, as described for stage 1. Step 3 (oxidizable fraction—metals associated with organic matter and sulfides)—residue from stage 2 was added to 10 mL of 8.8 mol L−1 H2O2 solution (pH 2–3), and the mixture was left at room temperature for 1 h, then heated to 85 °C for 1 h in a water bath, and then the volume was reduced to 2–3 mL by the further heating in a water bath. Another 10 mL portion of 8.8 mol L−1 H2O2 solution was added, and the mixture was heated to dryness at 85 °C for 1 h. After cooling, 50 mL of 1.0 mol L−1 solution of ammonium acetate (pH 2) was added to the residue, followed by agitation for 16 h at 22 °C. The extract was separated from the solid phase by centrifugation, as above. After the first three extraction steps, extract was separated from solid residue by centrifugation at 3000 rpm for 10 min, supernatant was decanted, diluted to 50 mL with 1 mol L−1 HNO3, and stored in a polyethylene bottle at 4 °C until metal analysis. The residue was washed with 20 mL deionized water and shaken for 15 min, followed by centrifugation for 10 min at 3000 rpm. The supernatant was decanted and discarded, acting cautiously not to discard any solid residues. In this way, the residue was prepared for the next BCR. Step 4 (residual fraction—metals strongly associated with the crystalline structure of minerals)—the stage 3 residue was digested using 20 mL of concentrated HNO3 at approximately 100 °C on a hot plate, and after cooling for 15 min, 3 mL of H2O2 was added, allowing it to react with the mixture. Heating continued for another hour with gentle stirring using a magnetic stirrer with a glass rod. The procedure was repeated by heating to 100 °C and adding another 3 mL of H2O2 after cooling. The final residue was filtered to 50 mL and stored in a polyethylene bottle at 4 °C until metal analysis. The digestion of the residual material was not specified in the BCR protocol. By summing all four fractions of each element, the term “sum of fractions (∑F1–F4)” was obtained and is used in this paper.

2.4. Indices for Soil Contamination Assessment

2.4.1. Risk Assessment Code (RAC)

The Risk Assessment Code (RAC) is applied to assess the mobility and bioavailability of potentially toxic elements. It reflects the proportion of metals present in the most mobile fraction of sediment compared to their total concentration. The RAC values were analyzed and interpreted based on the approach outlined by Perin et al. and are classified into five categories based on risk levels [33,34].
RAC = (C F1/C tot) × 100%
where C F1 is the measured content of elements in the first phase of sequential extraction and C tot is the content of potentially toxic elements across all phases.

2.4.2. Soil Contamination Factor (CF)

The contamination factor (CF) is the ratio obtained by dividing the concentration of potentially toxic elements (PTEs) in soil by their reference values [35,36].
(CF = CS/CRefS)
where CS is the total concentration of elements in the soil and CRefS is the reference concentration of elements in uncontaminated soils.
Reference concentrations are taken from the regulations of the Republic of Serbia (Ni (50), Cr (100), and Co (50) [30] in units of mg kg−1.

2.4.3. Enrichment Factor (EF)

To assess the anthropogenic impact on the geochemical characteristics of soil, the enrichment factor (EF) was calculated.
EF = (Ci/Cr)/(Bi/Br),
where Ci represents the measured concentration of an element in the soil sample, Cr is the background value for that element, Bi is the measured concentration of the reference metal in the soil sample (Fe), and Br is the background value for the reference metal (Fe).
Background values were obtained using the Mean + 2 MAD (Median Absolute Deviation) method for the study area (Ni = 284.47; Cr = 150.32; Co = 33.82; Fe = 32,698.32 mg kg−1). The contamination level based on EF is categorized as follows: A value of approximately 1 indicates PTEs originating from earth materials or natural weathering processes. Further, EF is categorized into classes: Class I: EF < 1.5 (no enrichment), Class II: EF = 1.5–3 (minor enrichment), Class III: EF = 3–10 (moderate enrichment), Class IV: EF = 5–10 (severe enrichment), and Class V: EF > 10 (very severe enrichment) [11,37,38,39].

2.5. Statistical Analysis

Statistical analyses were performed using basic descriptive statistics, correlations, and the analysis of variance (ANOVA) using the IBM SPSS software package, version 22. Duncan’s multiple range tests were used to compare the means of the values in each soil type.

3. Results

3.1. Quality Control of Analysis

The reference soil (ERM-CC141 loam soil, Belgium) was analyzed to verify the results of the total content of the analyzed elements; the PTEs’ recovery ranged at 92% for Cr, 98% for Ni, and 109% for Co. The accuracy of the sequential extraction procedure was assessed by the recovery of the total metal content as the sum of a particular element from the three fractions. The average recovery was: 89% for Cr, 97% for Ni, and 117% for Co. Quantification limits were calculated based on the absorbance for the lowest standards—1 µg/mL. The quantification limits for Ni, Cr, and Co were 0.052 mg/kg, 0.048 mg/kg, and 0.054 mg/kg, respectively.

3.2. Basic Characteristics of Soil in the Study Area

Table 1 presents the Basic Fertility Parameters of the Studied Soil Types.

3.2.1. Fluvisol

In the riparian areas of the Čemernica River, its tributaries, and the Zapadna Morava, Fluvisol has developed. The parent material consists of young alluvial deposits. Fluvisol has an uneven distribution of a granulometric composition across different depths. All samples fall into the texture class of light-to-heavy clay, with the clay content increasing in deeper layers. The analyzed samples range from strongly acidic to slightly acidic in the reaction. The humus content varies, but in the surface layer, all tested soils show a high humus content. Additionally, the high CEC values suggest that this soil has a good cation retention capacity. Iron and manganese are present in large amounts, with higher concentrations in deeper layers, except in P2 (Table 1).

3.2.2. Vertisol

In the studied area, the analyzed P4, P5, P6, and P7 of Vertisol are formed on clays, marls, claystones with coal layers, sandstones, marl limestones, and tuffaceous sandstones. According to their mechanical composition, the samples are classified as light and heavy clays, with a substantial portion of colloidal clay, generally between 30 and 50%. These soils exhibit a strongly acidic to slightly alkaline reaction. The organic matter content is low-to-moderate, and Fe and Mn are present in significant amounts, especially in the deeper layers.

3.2.3. Leptosol on Serpentinite

The examined samples consist of light clay and clay loam based on their granulometric composition. The total clay particle content varies widely and generally decreases with the increasing depth, except in P10. These soils are classified as slightly acidic. They are characterized by a high-to-moderately high humus content. The organic matter content is greater in the upper layers, while the iron and manganese concentrations increase with depth. The cation exchange capacity values in the studied soil samples are high, influencing the binding and availability of accessible forms of elements.

3.2.4. Leptosol on Sandstone

The soil is formed on a flysch geological formation: mica-rich sandstones, siltstones, and conglomerates. The analyzed samples exhibit a strongly acidic reaction. The texture is clay loam with a high sand content of over 50%. Consequently, they have a lower capacity for retaining water and nutrients. The organic matter content ranges from low to medium levels. The iron concentrations are lower compared to other soil types. The CEC values are also low, indicating that this soil has a very limited cation adsorption capacity.

3.3. Sum of Fractions (∑F1–F4), Concentration of Ni, Cr, and Co, and Their Vertical Distribution in Soil

In Table 2 and Figure 2, Figure 3 and Figure 4, the concentrations of Ni, Cr, and Co are shown according to their chemical binding forms in the soil.
The sum of the values of the four Ni fractions (∑F1–F4) range from 75% to 116%, relative to the total, Ni and vary by soil type. In Leptosol on sandstone, the Ni content is the lowest, ranging from 31.83 to 47.76 mg kg−1. In Vertisol, it ranges from 67.81 to 127.82 mg kg−1, and in Fluvisol, from 139.89 to 350.53 mg kg−1. The highest values, which are statistically significant compared to other soils, are found in Leptosol on serpentinite, averaging from 421.89 to 1066.64 mg kg−1 (Table 2).
The sum values of the four Cr fractions relative to the total Cr range from 74% to 106%. The distribution of Cr by soil type is similar to that of Ni, but the corresponding values are lower. In Leptosol on sandstone, the Cr values are the lowest, ranging from 20.89 to 33.86 mg kg−1, while they are significantly higher in Vertisol and Fluvisol, with the highest values found in soils on serpentinite rocks, averaging from 363.88 to 470.44 mg kg−1.
The values for the sum of the four Co fractions in relation to the total range from 99 to 128%. The spatial distribution of Co by soil type is similar to that of Ni and Cr. In Leptosol on sandstone, Co ranges from 13.12 to 19.23 mg kg−1, significantly increasing in Vertisol and Fluvisol, with the highest, statistically significant concentrations found in Leptosol on serpentinite, averaging between 62.67 and 75.41 mg kg−1 (Table 2).
In samples of Leptosol on serpentinite, the concentrations of Ni, Cr, and Co vary, with higher values observed in P9 and P10 in the central part of the Čemernica River basin compared to P8, located in the upper basin area. The distribution of elements is mostly uniform or increases with depth. The depth soil distribution of Ni is typical for serpentine soils. In Leptosol on serpentinite, the concentrations of Ni, Cr, and Co in P8, P9, and P10 exceed the maximum allowable concentrations (MAC) (50, 100, and 50 mg kg−1) [1,30]. In a large number of samples, the values of Ni and Cr also exceed the remediation thresholds (210 and 380 mg kg−1), but not Co (240 mg kg−1) [31].
The content of the examined elements is also significant in alluvial soils. Values above the MAC for Ni and Cr were recorded in Fluvisol P2 and P3, while Co values remained below the MAC. Along the course of the Čemernica River, the values increase: they are lowest in P1 in the upper reaches and rise in P3 after the river passes through the serpentine area. The highest values were obtained in P2, just before the Čemernica flows into the Zapadna Morava River, and after the inflow of the Dičina tributary, which originates from the Rudnik mountain area rich in Pb and Zn ores. In addition to the geological composition of alluvial sediments, the clay content also influences the concentration of elements. In the upper reaches, the clay content averages 32%, while in the lower reaches, where the finest particles accumulate, it exceeds 40%.
In vertisols, the concentrations of Ni exceed the maximum allowable concentrations (MAC) in all location, but not Cr and Co. Higher values are observed in P4 and P5, where Ni and Cr are also more concentrated in the surface layer compared to the subsurface layer. In the other two, located in the lower part of the basin, the content by depth is similar, with the highest levels in the deepest layer. Vertisols are formed on Neogene lake sediments, which, in some areas closer to serpentine rocks, contain magnesite deposits, so the variable geological composition influences other soil properties.
In soil formed on sandstones, element concentrations are below the MAC, with the Ni content in P12 being around the MAC of 50 mg kg−1. The distribution within the soil depends on the soil characteristics and their position.

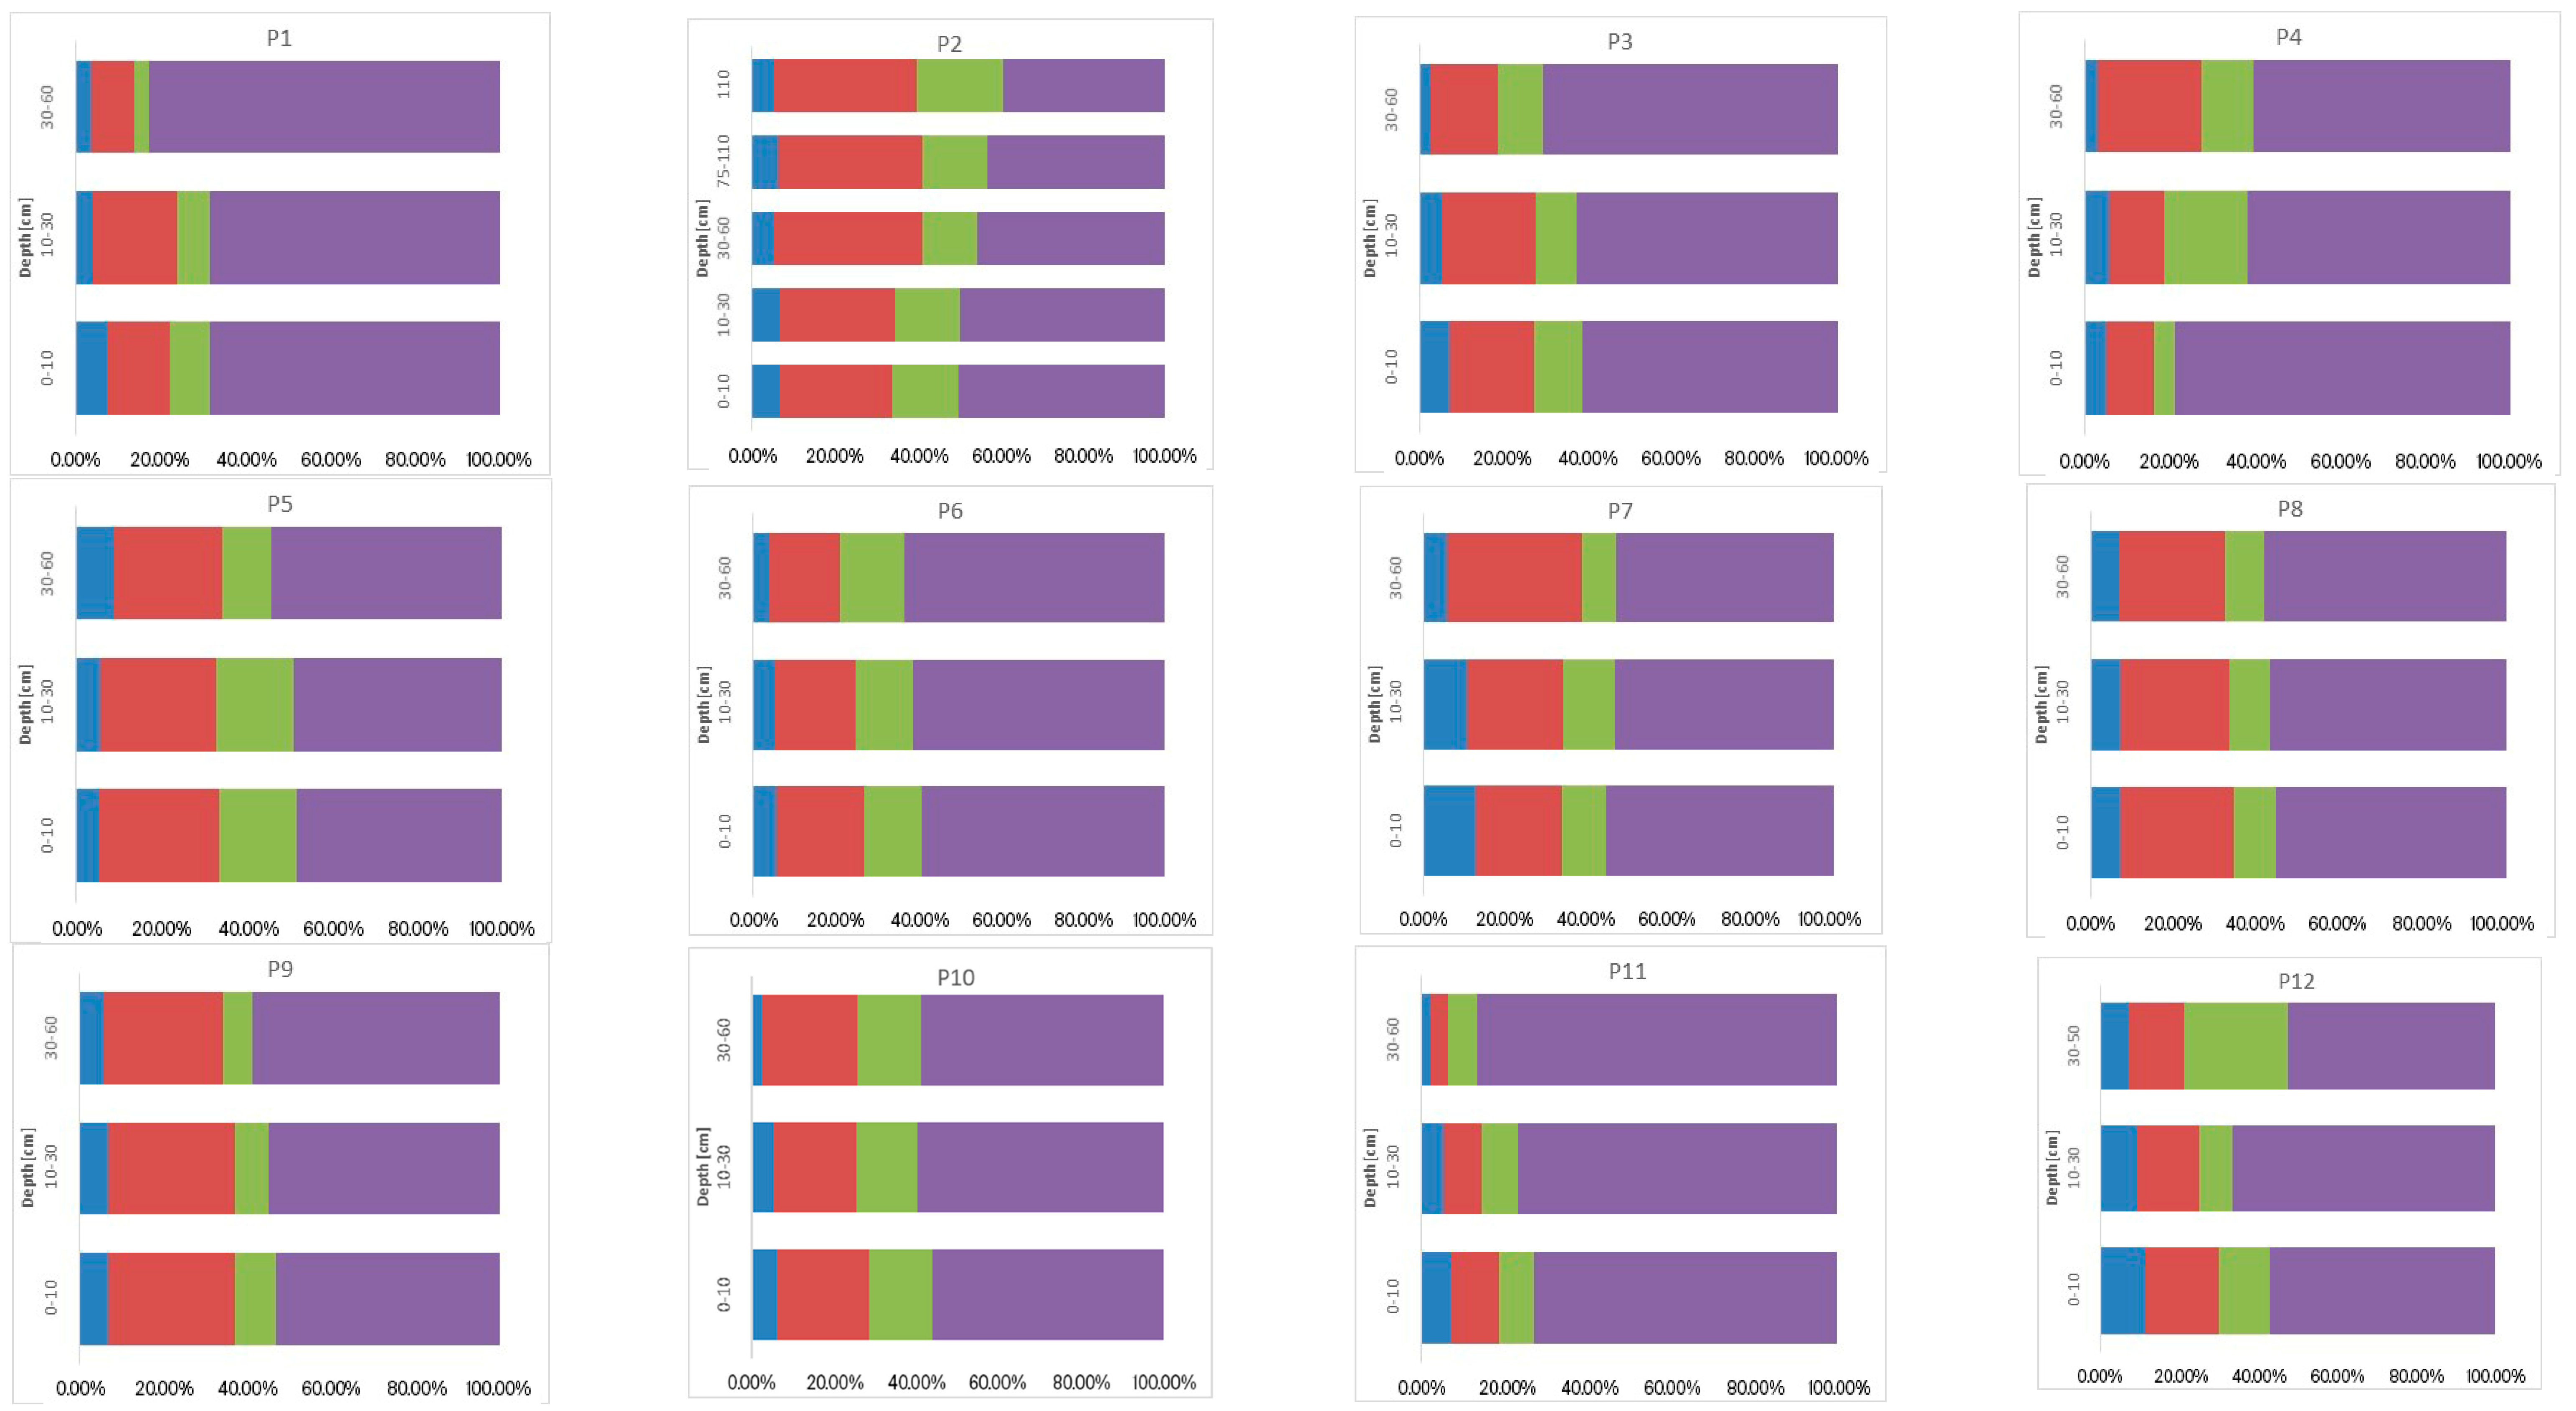
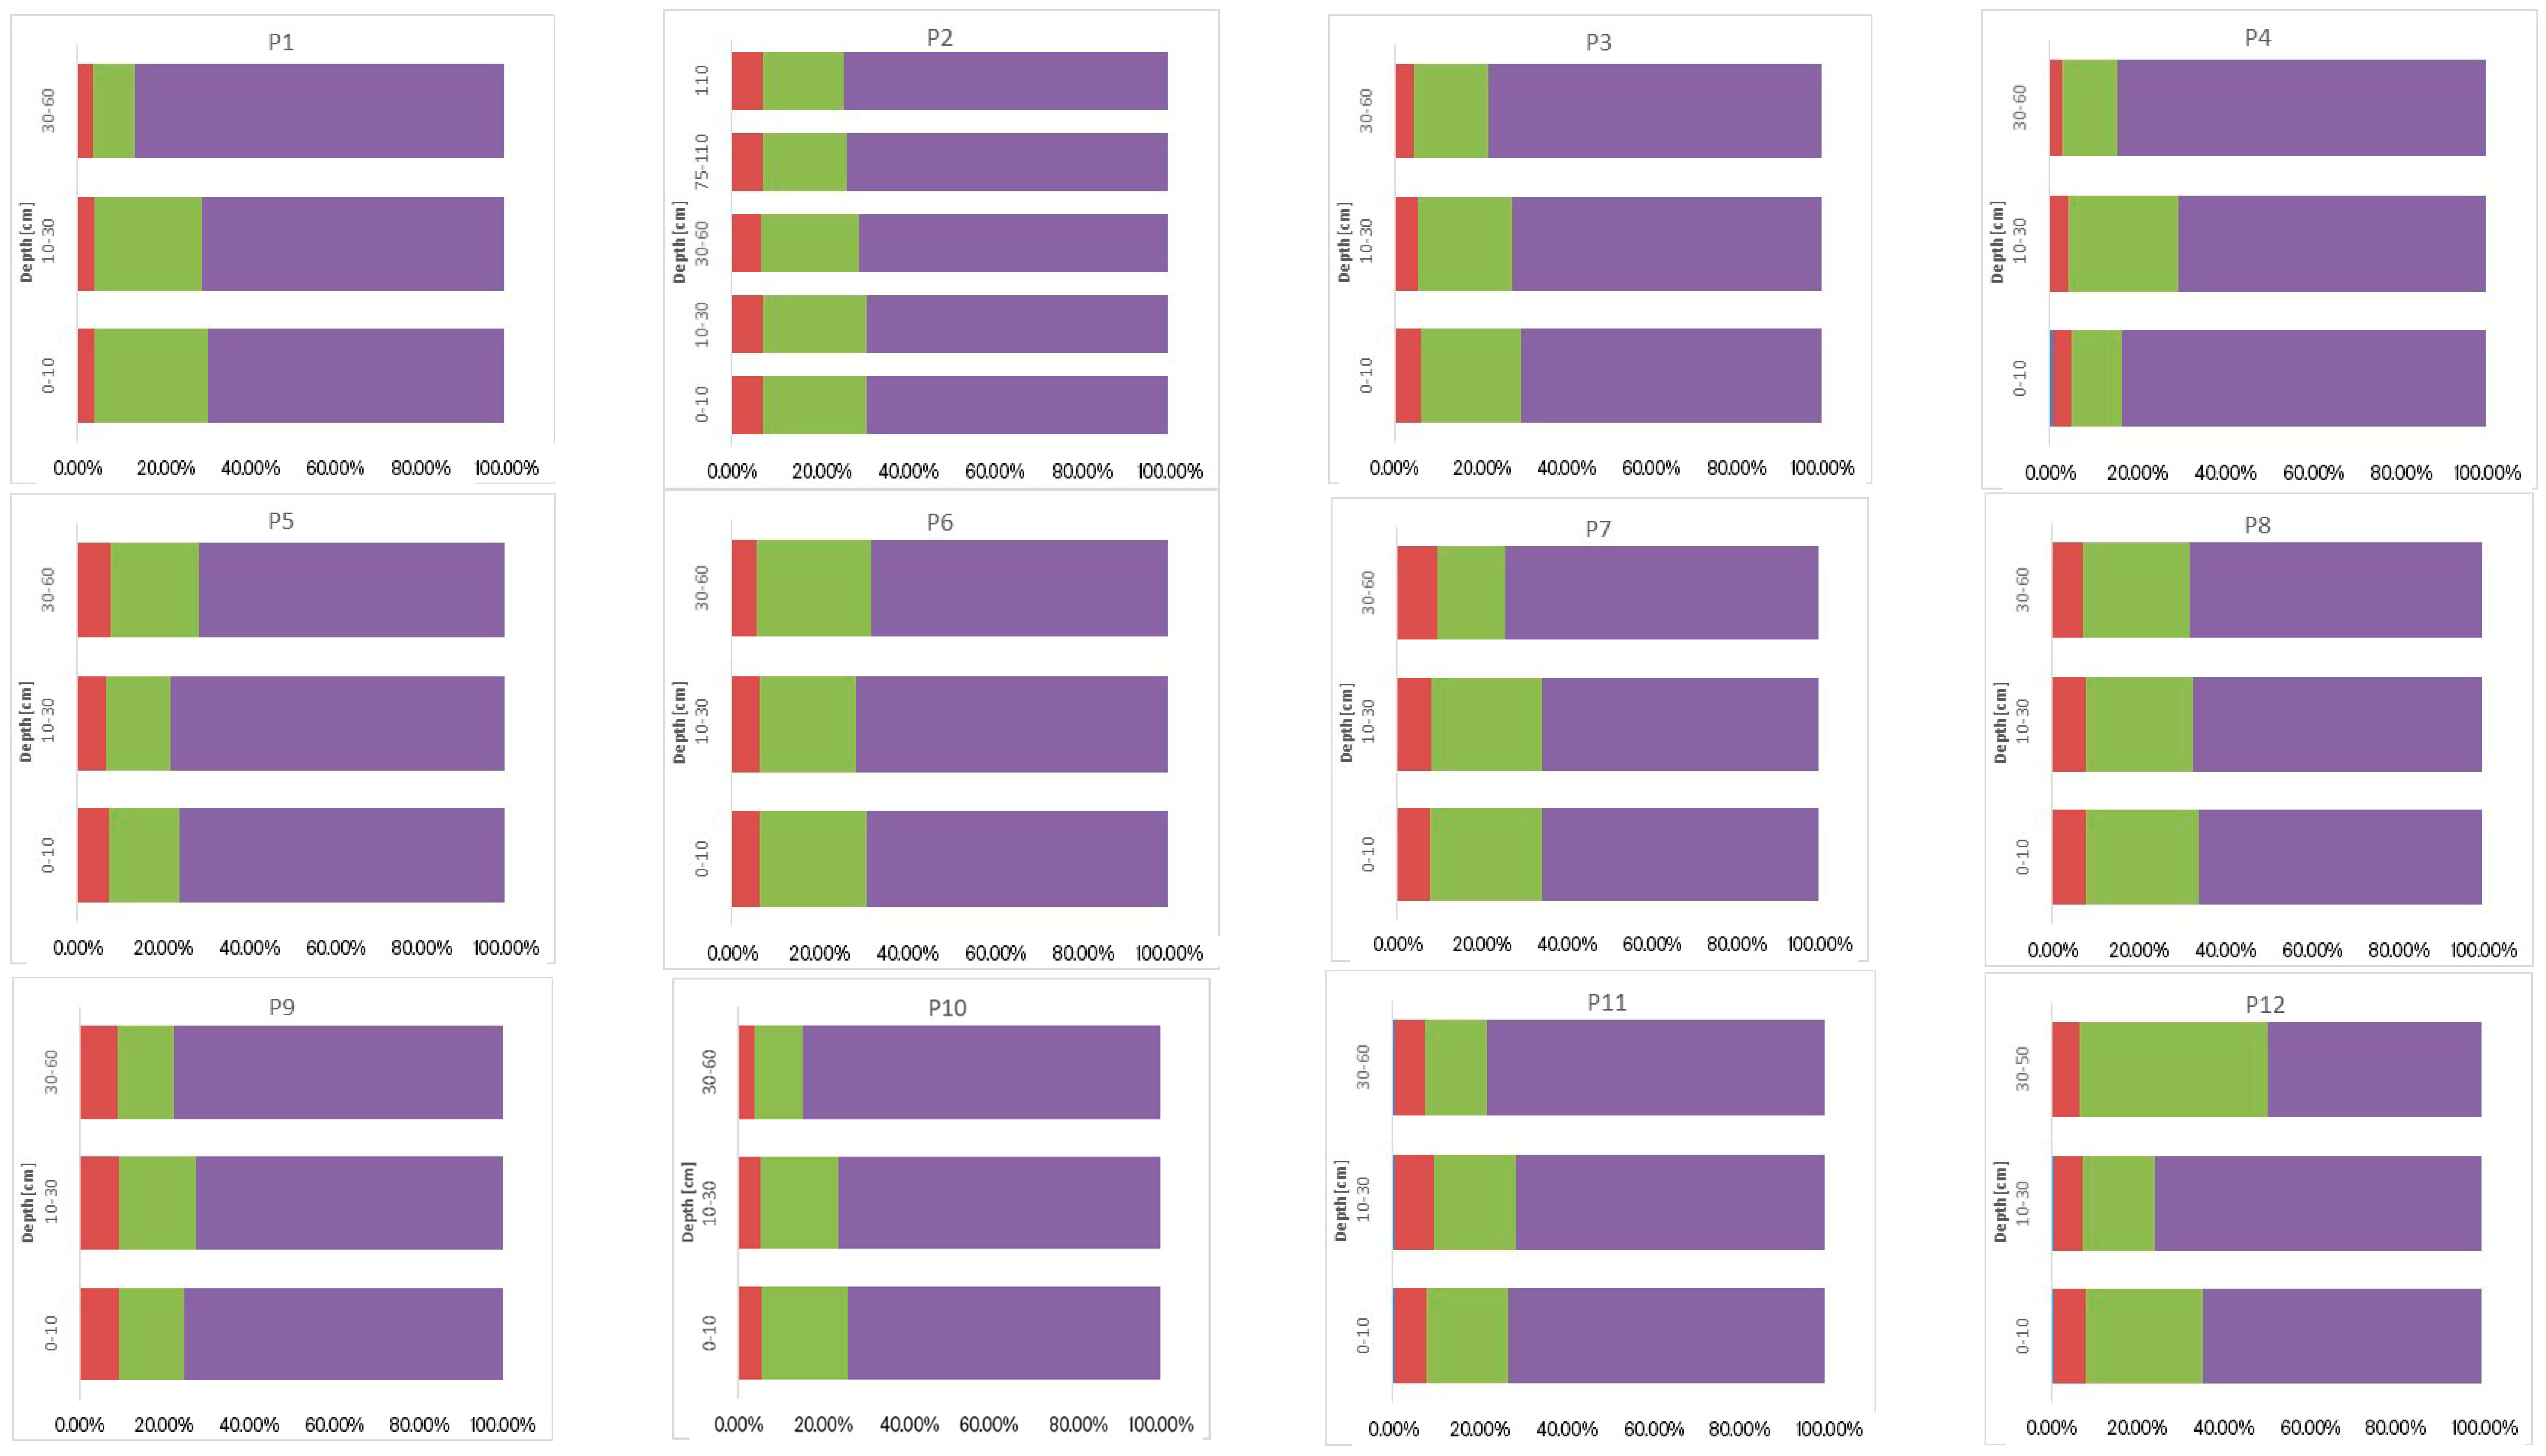
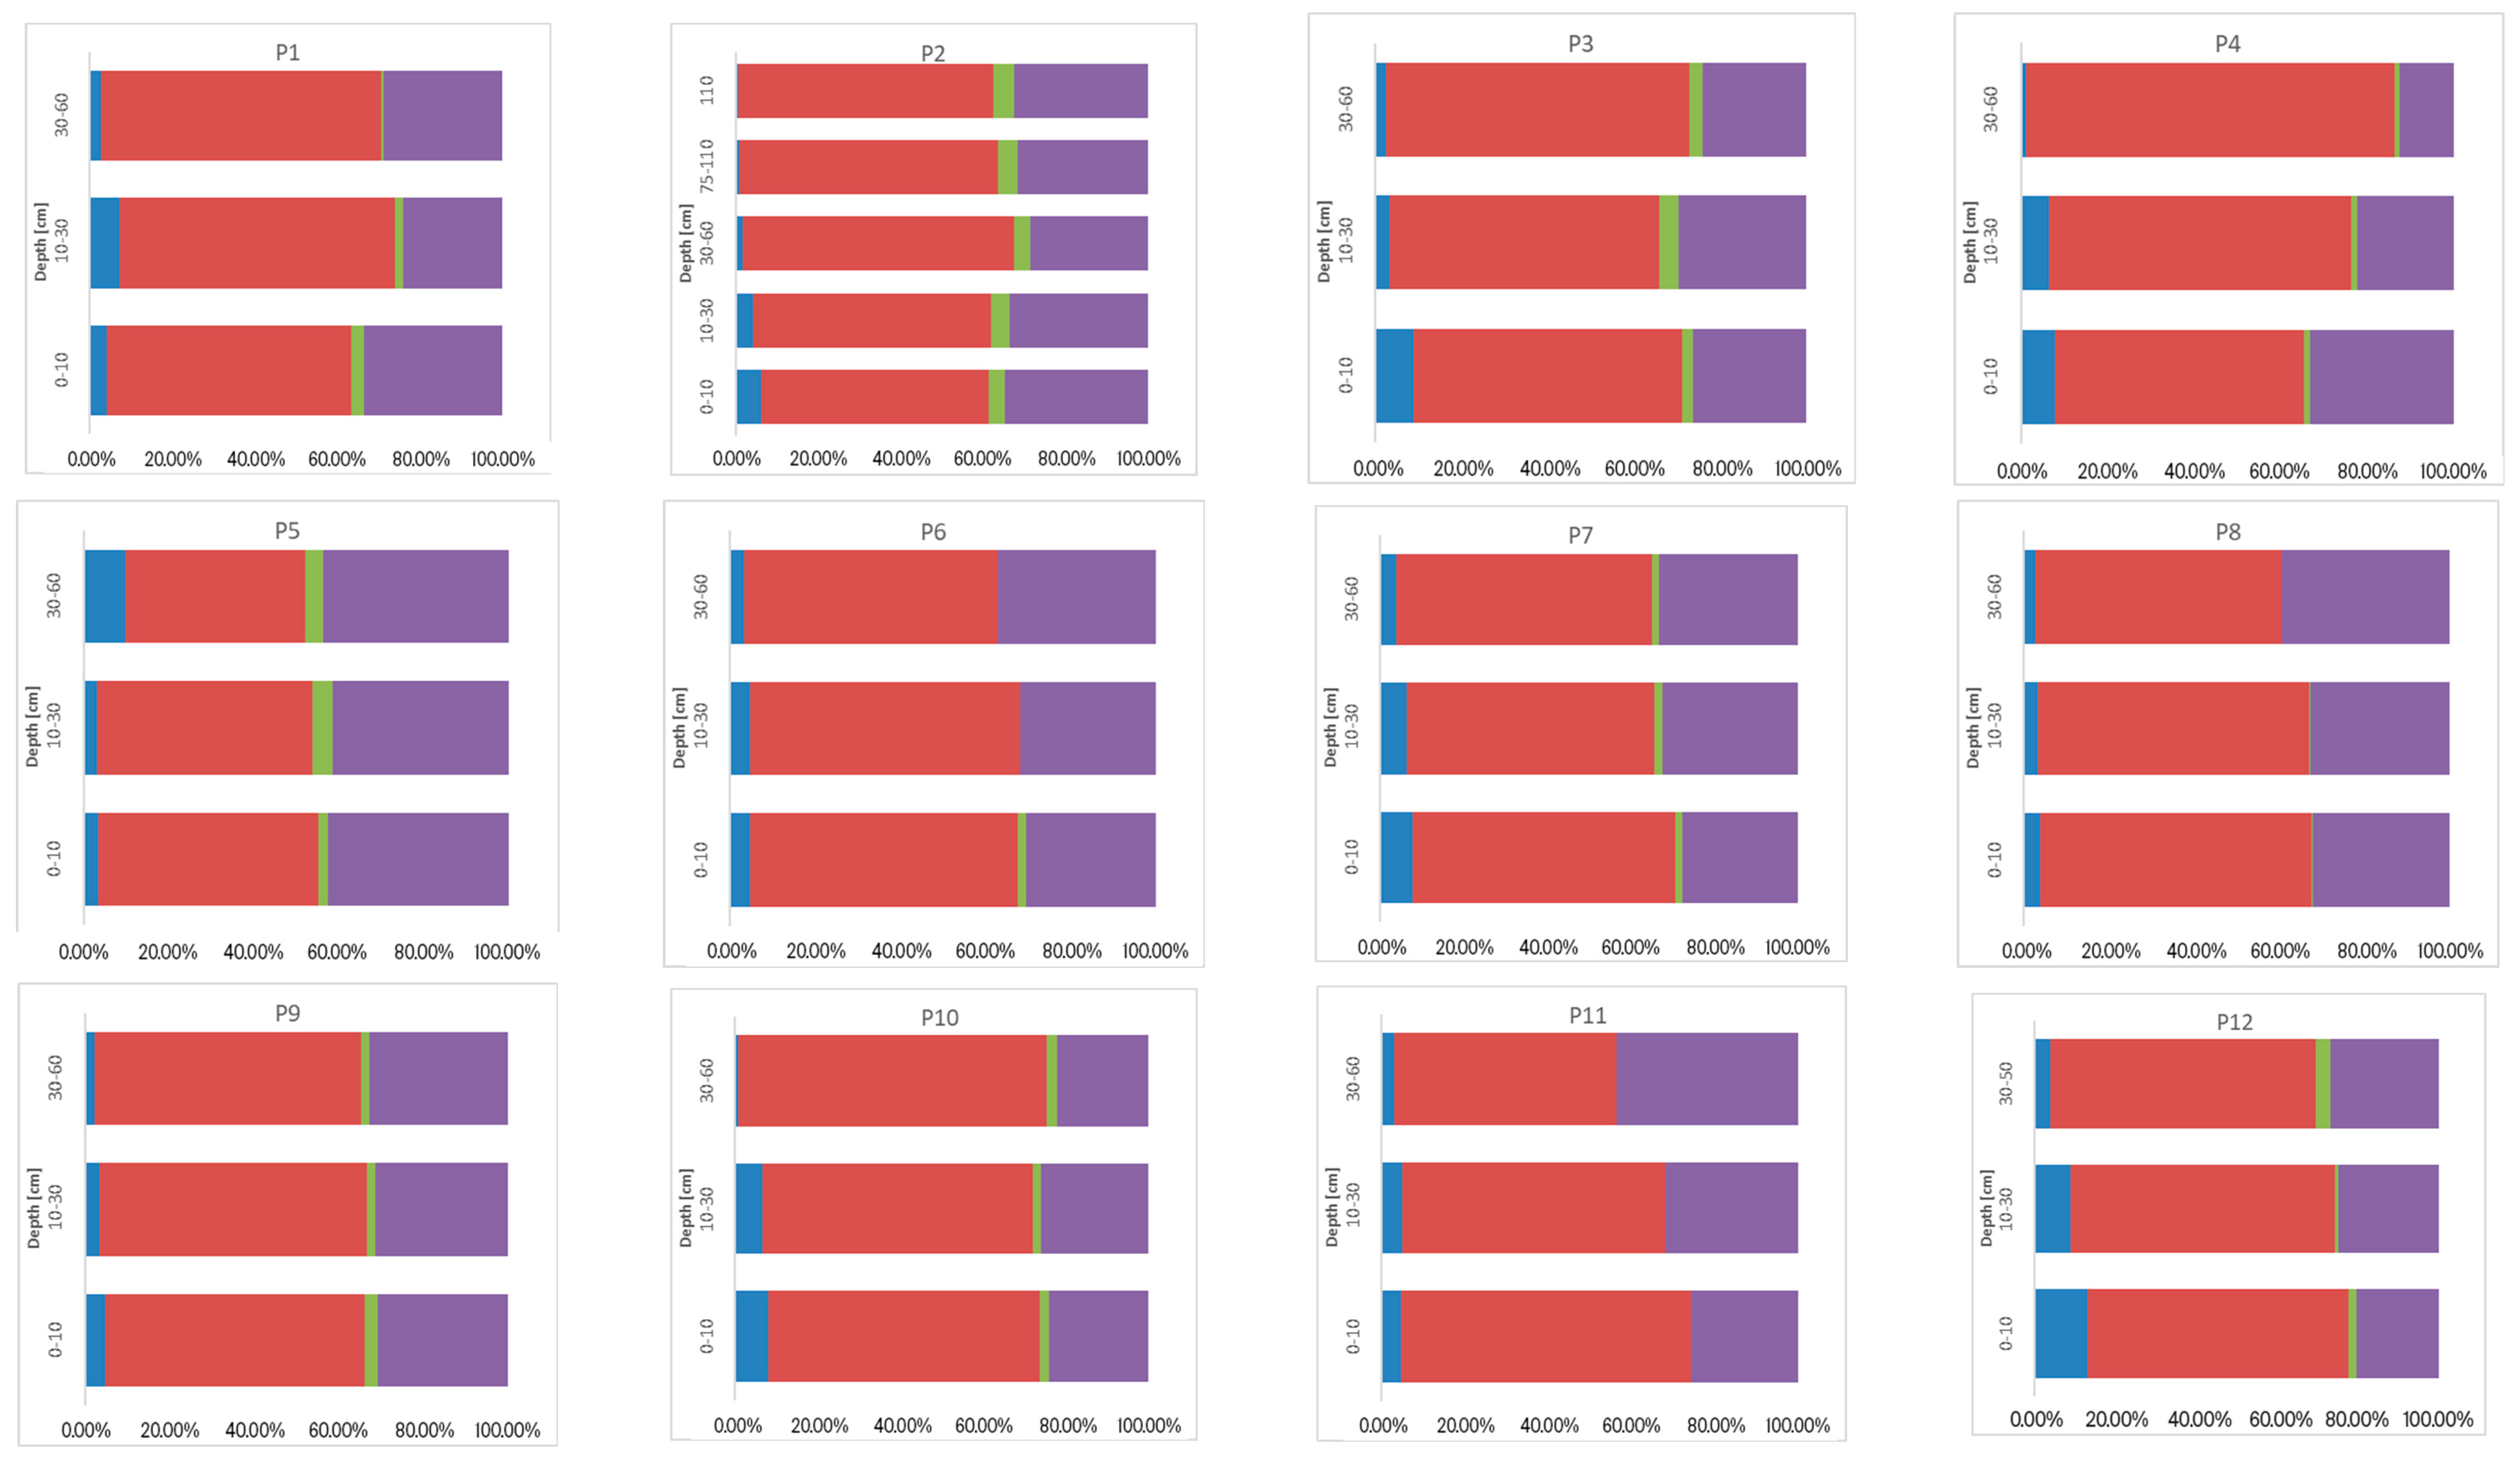
3.4. Geochemical Fractions and Vertical Distribution of Ni, Cr, and Co

3.4.1. Available DTPA-Extracted Ni, Cr, and Co

The concentrations of DTPA-extractable Ni range from 0.63 to 63.74 mg kg−1, with an average of 14.98 mg kg−1 (Table 2). This average is about 85% of the average Ni content in the first fraction (F1) of sequential analysis. Exceptions include samples P1 and P3 (Fluvisol), P4 (Vertisol), and P8 (Leptosol on serpentinite), where DTPA was more effective than the acetic acid solution, extracting additional amounts of Ni from other fractions besides F1. The concentrations of DTPA-extractable Cr range from below the detection limit to 0.05 mg kg−1, and these values are significantly lower than the Cr levels in F1. The concentrations of DTPA-extractable Co average 0.51 mg kg−1, with a range of 0.04 to 4.79 mg kg−1. These values are significantly lower than the Co levels in F1, where the average concentration is 1.61 mg kg−1.

3.4.2. Chemical Binding Forms of Ni, Cr, and Co in the Soils Studied

In the first fraction (F1), Ni is in a water-soluble and exchangeable form, making it the most accessible and mobile. The average F1 content by soil type is similar, at 5.42% in Fluvisol, 6.43% in Vertisol, 5.98% in Leptosol on serpentinite, and 7.18% in Leptosol on sandstone. There are no significant statistical differences. Across all soils, the F1 fraction is observed to remain similar with depth or decrease slightly, except in P5 Vertisol, where it increases with depth. In the surface layer of P7 Vertisol and P12 Leptosol on sandstone, the F1 fraction is highest, at 12.7% and 11.5%, respectively. These layers have slightly lower pH values and clay contents, and an anthropogenic influence cannot be ruled out, especially in P7, which is closer to the city of Čačak, located in the lower part of the studied basin. In Fraction 2, Ni is bound to Fe and Mn oxides and is released under reducing conditions. Fraction 2 is the most prevalent among potentially accessible forms. The average Ni content in Leptosol on serpentinite is around 26%, in Fluvisol and Vertisol about 22–24%, and significantly lower, at approximately 12%, in soil on sandstone. Sandstones consist of silicates, with a low Fe and Mn oxide content, resulting in a limited adsorption capacity for heavy metals [1]. In P11, the Fraction 2 values are lower, but the residual fraction values are higher. The distribution by depth varies, and even within the same soil type, there is no distinct pattern, except in soil on sandstone, where the Ni content decreases across both profiles.
In Fraction 3, nickel is bound to organic matter and is released under oxidizing conditions. The average share in various soils is similar, ranging from 11.03% in Leptosol on serpentinite to 13.31% in Vertisols, there are no statistically significant differences. The share by depth generally tends to decrease or remains uniform.
In the fourth, residual fraction, the metal is structurally bound in silicates and other sparingly soluble compounds that are resistant to environmental conditions. The data analysis (Figure 2, Table 2) shows that the highest concentration of Ni in all soil types and depths is associated with the residual fraction. In Leptosol on serpentinite, Vertisol, and Fluvisol, an average of approximately 57–58% of Ni is bound to this fraction, while in soils on sandstone, about 69% of Ni is bound to the residual fraction—which is statistically significant compared to the previous soils. By depth, Ni’s share in the residual fraction is mostly uniform or increases, except in the surface layer of P4 Vertisol and P2 Fluvisol. In P2 Fluvisol, Ni’s share in F4 is lower than 50% in the deeper horizons (39–45%) and in the surface layer of P5 Vertisol (48%). However, these soil type simultaneously have a higher share of Ni bound to oxides (F2) and organic matter (F3), while the mobile F1 content is similar to that in other soils.
In the most mobile first fraction, the relative values of Cr are significantly lower than those of Ni. The average chromium content in Leptosol on serpentinite and Fluvisol is the lowest at 0.15–0.17%, while statistically significant values are observed in Vertisol at 0.29%, with the highest values found in Leptosol on sandstone at 0.46%. The chromium content in the surface layer is often higher compared to deeper layers, or it is evenly distributed.
The average chromium content in F2, bound to Fe and Mn oxides, ranges from 5.64% in Fluvisol to 7.36% in Leptosol on sandstone, with no statistically significant differences between soil types. The proportion of Cr bound to F3, organic matter, averages 19.21% in Leptosol on serpentinite and 23.24% in soil on sandstone, with no statistically significant differences observed. Throughout much of the samples, the concentration of organic Cr is higher in the surface layer compared to deeper layers, particularly in Fluvisol and most of all, Leptosol on serpentinite.
The highest chromium values were measured in the residual fraction. The average chromium content values are similar across soil types, around 69% in Leptosol on sandstone and about 73% in other soils. By depth, the proportion of Cr in the residual fraction generally shows an increasing trend, though it varies significantly across different depths in Vertisol.
In the most mobile F1 fraction, Co, the average share is similar across the soil types, showing no statistically significant differences, with values ranging from 3.86% in Fluvisol to 6.46% in Leptosol on sandstone. Differences across samples are more pronounced. In the first depth of P12, Leptosol on sandstone, the share is around 13%, while in the deeper layer of P5, Vertisol, it is around 10%.
The share of cobalt bound to Fe and Mn hydroxides is high; the average values range from 60.52% in Vertisol to 64.37% in Leptosol on serpentinite. The values increase or remain similar with the depth for most soils, except in P5 Vertisol, P8 Leptosol on serpentinite, and P11 Leptosol on sandstone, where they decrease with depth. In the carbonate Vertisol P5, the F2 fraction is the lowest at 45–50%, while the residual fraction is the highest content.
The cobalt content in F3, bound to organic matter, is significantly lower compared to Ni and Cr. Its content falls below the detection limit in certain samples (P6 Vertisol, P11 Leptosol on sandstone, and P8 Leptosol on serpentinite) up to 4.98% in P2 Fluvisol. The average values are notably higher in Fluvisol, at 3.49%, compared to other types, which range from 1.06% to 1.90%.
In the residual fraction, cobalt is bound on average between 28.84% in Leptosol on sandstone and 32.32% in Vertisol, lower than the proportion of Ni and Cr in the same fraction. Its distribution varies with depth, showing an increase with depth in a significant number of the soils. Changes in this fraction’s content are associated with variations in the soil pH.
The absolute values of elements in all fractions increase in this order: Leptosol on sandstone, Vertisol, Fluvisol, and Leptosol on serpentinite, and the differences are always statistically significantly higher in serpentine soils.

3.4.3. Influence of the Properties of Studied Soil Types on the Chemical Binding Forms of Ni, Cr, and Co

Table 3 presents the inter-relationships between the basic soil properties (pH in KCl, SOM, total sand, silt, clay, CEC, total Fe, and total Mn), the sum of fractions (∑F1–F4), the concentrations of Ni, Cr, and Co (mg kg−1), and the chemical fractions of the elements (%).
The sum of the fractions of nickel and chromium shows a positive correlation with the pH, CEC, Fe total, and Cr, and with SOM and Mn. The concentration of cobalt has a significant correlation with CEC, Fe, and Mn.
The concentrations of DTPA-extracted Ni show a significant positive correlation with F1 Ni r = 0.884, while DTPA-extracted Co has a correlation with F1 Co r = 0.79 (N = 38). No correlation was recorded for DTPA-extracted Cr with F1 Cr.
The proportion of the most mobile F1 Ni and Cr fraction shows a positive correlation with the total sand and a negative correlation with clay, CEC, and Fe. The cobalt F1 has a significant negative correlation with Fe. The fraction F2 Ni and Cr has a significant positive correlation with pH, but F2 Co correlates negatively with pH. The soil texture and CEC have a different influence. F3 Ni and Co are positively correlated with pH and clay, and F3 Co also is positively correlated with CEC. The proportion of Cr associated with F3 shows no statistically significant differences. Fraction 4 Ni has a significant negative correlation with pH and CEC. The chromium in the residual fraction increases significantly with a higher clay content, and Co increases with the pH.

3.5. Risk Assessment Code, Soil Contamination Index, and Risk Assessment Indices

Table 4 presents the percentage representation of samples according to the index values.
The RAC calculated for Ni, Cr, and Co in most samples is below 1%, indicating a low risk of mobility and bioavailability. An exception is the content of Ni in certain samples of Vertisol (P7) and Leptosol on sandstone (P12), as well as Co in Leptosol on sandstone (P12), where the content exceeds 10%, which falls into the medium-risk level for bioavailability and mobility (Table 4).
Contamination indices are tools used to assess the extent of soil contamination by element concentrations relative to background levels or regulatory standards. According to the calculated values, Co is categorized as having a low level of contamination in most samples, followed by Cr, while Ni shows high and very high levels of contamination in 46.2% of the samples.
The CF values indicate that Leptosols on serpentinite exhibit a very high level of Ni contamination (CF = 8.04–28.86), as well as a high level of Cr (CF = 3.83–5.10), while Co shows a moderate contamination level (CF = 1–1.62). In Fluvisols, Ni contamination ranges from moderate to very high (CF = 2.51–7.44), and in Vertisols, from moderate to high (CF = 1.09 to 3.91). The CF values for Cr and Co are approximately 1 or slightly above 1 in Fluvisols (0.89–2.18 for Cr and 0.48–0.65 for Co) and Vertisols (0.46–1.27 for Cr and 0.23–1.21 for Co), indicating a low-to-moderate degree of Cr and Co contamination in these soils. Leptosols on sandstone exhibit a low degree of Ni, Cr, and Co contamination with average values of Ni (0.92), Cr (0.34), and Co (0.28).
According to the EF values, it can be observed that the majority of samples show no enrichment or a low level of enrichment, while a medium level was recorded for Ni in 5.1% of the samples and for Cr in 2.6%.
The EF values for Ni, Cr, and Co in Vertisols and Leptosols on sandstone are <1.5, suggesting that these soil types are not enriched with these elements at all depths. Leptosols on serpentinite stand out with a moderate degree of Ni enrichment (EF = 1.01–4.26), moderate Cr enrichment (EF = 1.99–4.10), and moderate Co enrichment (EF = 0.98–2.42). The EF values for Ni, Cr, and Co are slightly above 1.5 in Fluvisols (0.56–1.70 for Ni, 0.76–1.69 for Cr, and 0.71–1.22 for Co), indicating a low level of enrichment in this soil type.

4. Discussion

The high concentrations of Ni, Cr, and Co in serpentine soils are related to the high content of ferromagnesian minerals in the rocks, in which Ni, Cr, and Co substitute for Mg2 and Fe3 (Al3) [40].
Soils in alluvial deposits often exhibit high heavy metal values, which may be attributed to the composition of materials deposited in the alluvium [41]. A connection was established between the high levels of Ni and Cr in the alluvium of the Velika Morava River (Ni and Cr, 172 and 169 mg kg−1) and the Jasenica tributary (324 and 221 mg kg−1), with the geological composition of the Rudnik Mountain [42]. These levels may also be of an anthropogenic origin, as Fluvisols are often under the influence of intensive agricultural production, river pollution from wastewater, flooding, and proximity to roads and settlements [20,43]. However, in the examined Fluvisol, the distribution of elements is homogeneous or increases with depth, without a notable accumulation of metals in the surface horizon, which would indicate a higher anthropogenic impact (Table 2).
The sum of the fraction (∑F1–F4) concentrations of the studied elements in the examined Fluvisol, Vertisol, and Leptosol on sandstone are higher than typical values for the same soil types, influenced by the proximity of serpentinite rocks because they are under the influence. [1,4]. For the soil of central Serbia, the average values for Ni and Cr (mg/kg) are as follows: Fluvisol 32.0 and 30.05; Vertisol 22.21 and 32.05; Leptosol on sandstone 25.80 and 29.30 mg/kg [4]. Nickel, chromium, and cobalt show a strong positive correlation with Fe (0.708–0.861 **), while Cr and Co are also correlated with Mn (0.451 **). The high mutual correlation among Ni, Cr, and Co, along with their correlation with Fe, indicates a shared origin, which, given the geochemical properties of Fe, is predominantly geochemical [20]. The analyzed Ni and Cr contents exhibit a positive, significant correlation with pH, and Cr also with humus. The positive relationship between the element content and pH is influenced by the differing properties of the examined soils, as the highest element values are found in slightly acidic-to-neutral serpentine soils, while the lowest are in highly acidic sandstone soils, which have low levels of base cations and ferromagnesian minerals. There is no correlation with clay, but a significant impact of CEC (0.460–0.508 **) is observed.
In contaminated soils, compared to uncontaminated soils, metals are more prevalent in more easily soluble fractions [40].
A sequential analysis found that the average relative share of Ni in F1 by soil type has no statistically differences despite significant differences in the absolute values. The correlation between the proportion of Ni in F1 is negative with the content in clay, CEC and Fe, which was also stated in other research [1].
The relative values of F2 Ni in the study area are similar to those obtained for Ni in the F2 fraction of Fluvisols in the Pomoravlje region and the Jasenica River valley (22.67–29.21%), whereas the soil in Rudnik averages 18.49% [3]. Additionally, many studies report a typical Ni share in this fraction of 20–30% of the Ni content [44]. Besides the adsorption and/or occlusion of metals on Fe and Mn oxides, Ni may also replace Fe or Mn within the oxide crystal structure [45], which explains the substantial values of Ni in F2, as confirmed by our analyses (Table 2).
In the Pomoravlje region, the average values range from 10.76% to 12.06%, in the Fluvisol of the Jasenica River they are at 6.35%, and on Mt. Rudnik, at 9.01% [3]. It was found that, on average, around 15% of the Ni in serpentinite soils in Serbia is present in the organic fraction [46]. Unlike soils with naturally occurring elements, in soils where nickel originates from anthropogenic sources, there is an increase in its content in the organic fraction, accompanied by a decrease in the residual fraction [47].
Since the residual fraction is composed of primary and secondary minerals, sulfides, sparingly soluble oxides, and complex organic compounds to which metals in soil are most strongly bound [48], the high Ni content in this fraction in most of the soils studied indicates that Ni is chemically stable and biologically inactive. Multiple authors indicate that uncontaminated soils are characterized by a high proportion of metals in the residual fraction, typically over 50% [3,49]. The higher residual Ni fraction in sandstones (particularly in P11) influenced the overall negative correlation of Ni in F4 with the pH and CEC.
It can be concluded that, despite the large differences in the absolute values between the soil samples and soil types (which was one of the hypotheses), the relative values and fraction ratios are fairly consistent, indicating a similar origin of Ni in the different soils of the studied area, predominantly geochemical. The high nickel content in the residual fraction indicates that the metal is primarily in forms resistant to environmental changes.
The values obtained for Cr fractions in the sequential analysis show certain specific characteristics compared to the distribution of Ni fractions across soil types. The chemical forms of Cr-binding in soil are more complex than those of Ni, as Cr can exist in multiple oxidation states, leading to different chemical properties and behaviors. The chromium can undergo oxidation or reduction, adsorb onto mineral and organic solid phases, chelate with organic ligands, or precipitate as an insoluble component.
In the most mobile first fraction, Cr relative values are significantly lower than those of Ni, with an average proportion across soil types ranging from 0.15 to 0.46%.
The spatial and vertical distribution of the Cr content is associated with soil properties and the chemical form in which Cr is present. The most common forms of chromium in soil are Cr3+ and Cr+6. Hexavalent chromium is relatively soluble, more stable under aerobic conditions, and at higher pH levels, which prevail in many soils. However, due to soil’s high capacity for reducing hexavalent chromium, it is readily reduced to Cr3+. Thus, the relatively insoluble and less mobile Cr3+ ion dominates in most soils, typically occurring as insoluble hydroxides and oxides [50].
Low levels of accessible chromium have also been found in other studies [10,46,51]. The chromium mobility decreases with the increasing adsorptive capacity of soil [16]. Accordingly, in the studied area, the share of mobile Cr fraction decreases with the increased clay (−0.334), CEC (−0.607), and Fe contents (−0.577).
The chromium share in F2 is lower than that of Ni in the same fraction, as the primary mechanism for chromium binding to Mn and Fe oxides is adsorption [6], without involvement in isomorphic substitution with Mn or Fe in oxides, unlike nickel. Based on its behavior in soil, Cr in the reducible fraction is not considered a significant source of accessible quantities [50,52]. The proportion of Cr bound to organic matter in the soils studied is higher than that bound to Fe and Mn oxides, as also confirmed by [50] research on Fluvisol.
The chromium concentrations in the residual fraction are higher than those of Ni because Cr is found in minerals more resistant to decomposition, and similar values have been observed in other studies on uncontaminated soils [15,16].
The share of cobalt in F1 generally varies with the types of soil, which is consistent with reports of a wide range of mobile Co in F1 across different soil types [11]. In soils in England and Wales, the Co content was found to be between 5 and 24 mg kg−1, while the bioavailable (acetic-acid-extractable) content ranged from 3 to 13%, and similar results were found in other studies [53]. DTPA-extracted Co shows that DTPA extraction could not extract significant portions of mobile F1 Co in most of the soils examined, and similar results were found in other studies [11].
The proportion of cobalt bound to Fe and Mn hydroxides is high and has a significant negative correlation with the pH (−0.547). The absolute F2 cobalt values show a significant positive correlation with Fe and Mn (0.833; 0.420) (Table 3). The strong association between Co and oxyhydroxide minerals is driven by the surface oxidation of Co2+ to Co3+, which is then followed by its integration into structural vacancies or by surface precipitation in the form of hydroxyl solids. [54]. An important process for reducing its mobility and bioavailability in soil is the degree of oxidation on the mineral surfaces of Mn oxides [55,56,57].
A high proportion of Co in the reducible fraction has been observed in other studies as well. It was noted that in uncontaminated soil samples, the majority of Co2+ ions (32.2–71.0%) were accumulated in the reducible phase, with significant amounts in the residual phase and the organic phase [57]. Studies have found that Co has a high affinity for the Mn oxide fraction in soils, both in contaminated and uncontaminated soils in parks and in serpentine soils, suggesting that the metal cannot be easily leached and is thus not readily transferable to the environment under ambient conditions [18,46]. In uncontaminated samples, Co2+ was primarily distributed in the moderately reducible and residual phases, while after contamination, the fraction of Co in the Fe and Mn oxide phase drastically decreased, while an increase was observed in the more labile fractions [58].
The proportion of cobalt bound to organic matter varies by depth (Figure 4). With an increase in the pH, clay, and CEC, the percentage of Co in this fraction significantly rises. Similar relationships were found by [11]. A low percentage of mobile and oxidizable fractions is characteristic of serpentine soils [18]. The analysis of the distribution of Co across fractions indicates that fractions F1 and F3 have relatively low proportions, while an increase in F2 is observed at the expense of the residual fraction.
Supporting the notion hypothesis that Ni, Cr, and Co in the studied soils of the Čemernica River basin are primarily of a natural origin are the obtained contamination assessment results. According to the Risk Assessment Code (RAC) for bioavailability, most analyzed samples indicate a low bioavailability, with values below 1% for Ni, Cr, and Co, even when environmental conditions change [34].
Based on the CF and EF index analyses, the results show high levels (values above 6 and 5) of Ni contamination in Leptosol on serpentinite, as well as moderate and mild levels (values around 3) of Cr and Co contamination. Other soil types exhibit lower contamination levels. High contamination index values for Ni, Cr, and Co in Leptosol on serpentinite have also been reported in other studies [12]. Although elevated contamination index values for Ni, Cr, and Co were observed in Leptosol on serpentinite and Fluvisol, the applied analyses of the bioavailability and chemical binding forms of the elements suggest a geochemical origin.
Considering the high concentrations of total forms of elements, as well as the most mobile fraction, especially Ni, in serpentine soil and Fluvisol, further research and monitoring should establish the potential long-term ecological implications, particularly in areas with a greater anthropogenic impact.
The results of the study indicate that the proposed hypotheses have been fully confirmed, shedding light on the key processes and factors influencing the dynamics and distribution of the examined elements in the soil.

5. Conclusions

The total contents of Ni, Cr, and Co, along with their distribution in different chemical fractions, were examined in the most prevalent soil types within the Čemernica River basin to determine the elements’ origin, mobility, and environmental impact.
The total concentrations of Ni, Cr, and Co in most samples exceed the maximum allowable levels set by legal regulations, with some samples, especially on serpentine soils, surpassing remediation values. The average total content of elements, as well as concentrations in chemical fractions across soil types, increase in the following order: Leptosol on sandstone–Vertisol–Fluvisol–Leptosol on serpentinite.
In Fraction 1, which represents the most mobile form, the Ni, Cr, and Co values are mostly below 10%, so with regards to the Based on the Risk Assessment Code, most samples have a low bioavailability risk, with only two samples of Ni and Co showing a moderate risk.
On the other hand, the residual fraction dominates for Ni and Cr, and the distribution of Co across the fractions shows that most of this metal is bound in the reducible fraction, and then in the residual fraction. This indicates that the metals are not easily leached and transferred to the environment under the given conditions.
Despite significant differences in the absolute values of Ni, Cr, and Co across soil types, their relative values in chemical fractions remain consistent, which also confirms that the predominant source of Ni, Cr, and Co in the soil in the studied area is natural.
Although high CF values were obtained for Ni, Cr, and Co on Leptosol on serpentinite and Fluvisol, the applied analyses of the bioavailability and chemical binding of the elements indicate their geochemical origin.
The conducted research has validated the hypotheses, providing a solid scientific basis for understanding the geochemical origin and behavior of Ni, Cr, and Co in different soil types.
Officials in the municipality of Čačak are advised that, in addition to establishing soil monitoring in areas with a higher impact of anthropogenic pollution, when making future management decisions, analyses should be conducted to assess the impact on soil health.

Author Contributions

Conceptualization, S.T.J., S.B.S. and V.M.; methodology, S.T.J. and S.A.M.; software, S.T.J.; validation, S.B.S. and V.M.; formal analysis, S.T.J., M.J. and M.K.; investigation, S.T.J.; resources, S.T.J. and O.S.-S.; data curation, S.T.J. and V.M.; writing—original draft preparation, S.T.J. and V.M.; writing—review and editing, S.B.S. and V.M.; visualization, S.T.J.; supervision, S.B.S. and S.A.M.; project administration, O.S.-S. All authors have read and agreed to the published version of the manuscript.

Funding

This research was funded by the Ministry of Science, Technological Development, and Innovations of the Republic of Serbia grant number 451-03-66/2024-03/200011.

Data Availability Statement

The data presented in this study are available on request from the corresponding author.

Acknowledgments

This research was supported by the Ministry of Science, Technological Development, and Innovations of the Republic of Serbia (grant no. 451-03-66/2024-03/200011; 451-03-65/2024-03/200169 and 451-03-65/2024-03/200116). This research was supported by the Science Fund of the Republic of Serbia (grant no. 7015, Utilizing rhizobia to reduce the risk of heavy metal accumulation in alfalfa: Nickel (Ni) case study—RhizoDETOX).

Conflicts of Interest

The authors declare no conflicts of interest.

References

  1. Kabata-Pendias, A. Trace Elements in Soils and Plants, 4th ed.; CRC Press: Boca Raton, FL, USA, 2011. [Google Scholar]
  2. Lago-Vila, D.M.; Arenas-Lago, A.; Rodríguez-Seijo, M.L.; Andrade, C.; Vega, V.A. Cobalt, chromium and nickel contents in soils and plants from a serpentinite quarry. Solid Earth Discuss 2015, 6, 323–335. [Google Scholar] [CrossRef]
  3. Antić-Mladenović, S. Chemistry of Nickel and Chromium in Soils with Their High Geochemical Content. Ph.D. Thesis, Faculty of Agriculture, University of Belgrade, Beograd, Serbia, 2004. (In Serbian). [Google Scholar]
  4. Mrvić, V.; Antonović, G.; Čakmak, D.; Perović, V.; Maksimović, S.; Saljnikov, E.; Nikoloski, M. Pedological and Pedogeochemical map of Serbia. In Proceedings of the 1st International Congress on Soil Science, XIII National Congress in Soil Science: “Soil-Water-Plant”, Belgrade, Serbia, 23–26 September 2013; pp. 93–105. [Google Scholar]
  5. Dozet, D.; Nešić, L.; Belić, M.; Bogdanović, D.; Ninkov, J.; Zeremski, T.; Dozet, D.; Banjac, B. Origin and Content of Nickel in Alluvial-Deluvial Soils of Srem Ratar. Povrt. Field Veg. Crop Res. 2011, 48, 369–374. [Google Scholar]
  6. Poznanović Spahić, M.; Sakan, S.; Cvetković, Ž.; Tančić, P.; Trifković, J.; Nikić, Z.; Manojlović, D. Assessment of contamination, environmental risk, and origin of heavy metals in soils surrounding industrial facilities in Vojvodina, Serbia. Environ. Monit. Assess. 2018, 190, 208. [Google Scholar] [CrossRef] [PubMed]
  7. Rinklebe, J.; Antić-Mladenović, S.; Frohne, T.; Staerk, H.-J.; Tomić, Z.; Ličina, V. Nickel in a serpentine-enriched Fluvisol: Redox affected dynamics and binding forms. Geoderma 2016, 263, 203–214. [Google Scholar] [CrossRef]
  8. Rakesh, S.; Sagar, B.; Sijan, D.; Sudip, S.; Rajendra, J.; Arjun, P.T.; Hak, Y.K.; Mahesh, K.J. Technological trends in heavy metals removal from industrial wastewater: A review. J. Environ. Chem. Eng. 2021, 9, 105688. [Google Scholar]
  9. Belanović Simić, S.; Miljković, P.; Baumgertel, A.S.; Ljubičić, J.; Cakmak, D. Environmental and health risk Assessment of potentially toxic elements in the soil near the former antimony mine in western Serbia. Soil 2023, 12, 421. [Google Scholar] [CrossRef]
  10. Hooda, P.S. Trace Elements in Soils; Wiley: London, UK, 2010; p. 618. [Google Scholar]
  11. Rinklebe, J.; Shaheen, S.M. Geohemical distribution of Co, Cu, Ni, and Zn in soil profiles of Fluvisols, Luvisols, Gleysols, and Calcisols originating from Germany and Egypt. Geoderma 2017, 307, 122–138. [Google Scholar] [CrossRef]
  12. Sasmaz, A.; Yaman, M. Distribution of Chromium, Nickel, and Cobalt in Different Parts of Plant Species and Soil in Mining Area of Keban, Turkey. Commun. Soil Sci. Plant Anal. 2006, 37, 1–13. [Google Scholar] [CrossRef]
  13. Jordán, M.M.; Montero, M.A.; Pina, S.; García-Sánchez, E. Mineralogy and Distribution of Cd, Ni, Cr, and Pb in Biosolids-Amended Soils From Castellón Province (NE, Spain). Soil Sci. 2009, 174, 14–20. [Google Scholar] [CrossRef]
  14. Shaheen, S.M.; Kwon, E.E.; Biswas, J.K.; Tack, F.M.G.; Ok, Y.S.; Rinklebe, J. Arsenic, chromium, molybdenum, and selenium: Geochemical fractions and potential mobilization in riverine soil profiles originating from Germany and Egypt. Chemosphere 2017, 180, 553–563. [Google Scholar] [CrossRef]
  15. Pushkar, B.; Sevak, P.; Parab, S.; Nilkanth, N. Chromium pollution and its bioremediation mechanisms in bacteria: A review. J. Environ. Manag. 2021, 287, 112279. [Google Scholar] [CrossRef] [PubMed]
  16. Ao, M.; Chen, X.; Deng, T.; Sun, S.; Tang, Y.; Morel, J.L. Chromium biogeochemical behaviour in soil-plant systems and remediation strategies: A critical review. J. Hazard Mat. 2020, 424, 127233. [Google Scholar] [CrossRef] [PubMed]
  17. Okoli, N.; Uzoho, B.; Ahukaemere, C.; Egboka, N.; Irokwe, I. Chemical fractionation and mobility of nickel in soils in relation to parent materials. Arch. Agron. Soil Sci. 2021, 67, 1075–1092. [Google Scholar] [CrossRef]
  18. Tashakor, M.; Hochwimmer, B.; Brearley, F.Q. Geochemical assessment of metal transfer from rock and soil to water in serpentine areas of Sabah (Malaysia). Environ. Earth Sci. 2017, 76, 281–293. [Google Scholar] [CrossRef]
  19. Mrvić, V.; Antonović, G.; Martinović, L.J. Fertility and Content of Toxic and Dangerous Materials in Soil of Central Serbia; Institute of Soil Science: Belgrade, Serbia, 2009. (In Serbian) [Google Scholar]
  20. Čakmak, D.; Perović, V.; Antić-Mladenović, S.; Kresović, M.; Saljnikov, E.; Mitrović, M.; Pavlović, P. Contamination, risk, and source apportionment of potentially toxic microelements in river sediments and soil after extreme flooding in the Kolubara River catchment in Western Serbia. J. Soils Sediments 2018, 18, 1981–1993. [Google Scholar] [CrossRef]
  21. Vasić, F.; Belanović-Simić, S.; Čavlović, D.; Miljković, P.; Caković, M.; Jovanović, N.; Marković, A.; Grujić, T.; Lukić, S. Practices for Phytoremediation of Soil in Serbia. South-East Eur. 2024, 15, 91–101. [Google Scholar] [CrossRef]
  22. Local Ecological Action Pla from City Čačak. 2003. Available online: https://www.cacak.org.rs/documents/Community_profile_242.pdf (accessed on 13 January 2023).
  23. WRB. World Reference Base for Soil Resources; World Soil Resources Reports No. 103; FAO: Rome, Italy, 2006. [Google Scholar]
  24. ISO 10390:2022; Soil, Treated Biowaste and Sludge-Determination of pH. SRPS: Belgrade, Serbia, 2021.
  25. ISO 11260:2018; Soil Quality-Determination of Effective Cation Exchange Capacity and Base Saturation Level Using Barium Chloride Solution. SRPS: Belgrade, Serbia, 2018.
  26. ISO 10694:2005; Soil Quality-Determination of Organic and Total Carbon after Dry Combustion (Elementary Analysis). SRPS: Belgrade, Serbia, 2005.
  27. ISO 22036:2008; Soil Quality-Determination of Trace Elements in Extracts of Soil by Inductively Coupled Plasma-Atomic Emission Spectrometry (ICP-AES). SRPS: Belgrade, Serbia, 2008.
  28. ISO 14870:2005; Soil Quality-Extraction of Trace Elements by Buffered DTPA Solution. SRPS: Belgrade, Serbia, 2005.
  29. U.S. EPA. Method 3050B: Acid Digestion of Sediments, Sludges, and Soils; Revision 2; U.S. EPA: Washington, DC, USA, 1996. [Google Scholar]
  30. Official Gazette of RS, no. 23/1994. Regulation on Permissible Quantities of Hazardous and Harmful Substances in Soil and Irrigation Water and Methods for Their Testing, Ministry of Agriculture, Forestry, and Water Management. Belgrade. Available online: https://pravno-informacioni-sistem.rs/eli/rep/sgrs/ministarstva/pravilnik/1994/23/1/reg (accessed on 18 March 1994).
  31. Official Gazette of RS, no. 30/2018 and 64/2019. Regulation on the Limit Values of Pollutant, Harmful and Dangerous Substances in the Soil (in Serbian: Uredba o Granicˇnim Vrednostima Zagad¯ujuc’ih, Štetnih i Opasnih Materija u Zemljištu). Available online: https://www.ekologija.gov.rs/sites/default/files/old-documents/Zemljiste/Uredbe/Uredba-o-granicnim-vrednostima.pdf (accessed on 13 January 2023).
  32. Sakan, S.; Popović, A.; Anđelković, I.; Đorđević, D. Aquatic sediments pollution estimate using the metal fractionation, secondary phase enrichment factor calculation, and used statistical methods. Environ. Geochem. Health 2016, 38, 855–867. [Google Scholar] [CrossRef]
  33. Perin, L.; Craboledda, L.; Lucchese, M.; Cirillo, R.; Dotta, L.; Zanette, M.L.; Orio, A.A. Heavy metal speciation in the sediments Northern Adriatic sea: A new approach for environ-mental toxicity determination. Heavy Met. Environ. 1985, 2, 454–456. [Google Scholar]
  34. Sakan, S.; Frančišković-Bilinski, S.; Đorđević, D.; Popović, A.; Škrivanj, S.; Bilinski, H. Geochemical Fractionation and Risk Assessment of Potentially Toxic Elements in Sediments from Kupa River, Croatia. Water 2020, 12, 2024. [Google Scholar] [CrossRef]
  35. Sharifi, Z.; Hossaini, S.M.T.; Renella, G. Risk assessment for sediment and stream water polluted by heavy metals released by a municipal solid waste composting plant. J. Geochem. Explor. 2016, 169, 202–210. [Google Scholar] [CrossRef]
  36. Islam, M.S.; Ahmed, M.K.; Al-Mamun, M.H.; Masunaga, S. Potential ecological risk of hazardous elements in different land-use urban soils of Bangladesh. Sci. Total Environ. 2015, 512–513, 94–102. [Google Scholar] [CrossRef] [PubMed]
  37. Zoller, W.H.; Gladney, E.S.; Duce, R.A. Atmospheric Concentrations and Sources of Trace Metals at the South Pole. Science 1974, 183, 198–200. [Google Scholar] [CrossRef] [PubMed]
  38. Reimann, C.; Filzmoser, P.; Garrett, R.G. Background and threshold: Critical comparison of methods of determination. Sci. Total Environ. 2005, 346, 1–16. [Google Scholar] [CrossRef] [PubMed]
  39. Hu, Y.; Liu, X.; Bai, J.; Shih, K.; Zeng, E.Y.; Cheng, H. Assessing heavy metal pollution in the surface soils of a region that had undergone three decades of intense industrialization and urbanization. Environ. Sci. Pollut. Res. 2013, 20, 6150–6159. [Google Scholar] [CrossRef] [PubMed]
  40. Rinklebe, J.; Shaheen, S.M. Assessing the mobilization of cadmium, lead, and nickel using a seven-step sequential extraction technique in contaminated floodplain soil profiles along the Central Elbe River, Germany. Water Air Soil Pollut. 2014, 225, 8. [Google Scholar] [CrossRef]
  41. Linnik, V.G.; Bauer, T.V.; Minkina, T.M. Spatial distribution of heavy metals in soils of the flood plain of the Seversky Donets River (Russia) based on geostatistical methods. Environ. Geochem. Health 2022, 44, 319–333. [Google Scholar] [CrossRef]
  42. Antić-Mladenović, S.; Rinklebe, J.; Frohne, T.; Stärk, H.J.; Wennrich, R.; Tomić, Z.; Ličina, V. Impact of controlled redox conditions on nickel in a serpentine soil. J. Soils Sediments 2011, 11, 406–415. [Google Scholar] [CrossRef]
  43. Frohne, T.; Rinklebe, J.; Diaz-Bone, R.A. Contamination of floodplain soils along the Wupper River, Germany, with As, Co, Cu, Ni, Sb, and Zn and the impact of predefinite redox variations on the mobility of these elements. Soil Sediment Contam. 2014, 23, 779–799. [Google Scholar] [CrossRef]
  44. Ryan, P.C.; Wall, A.J.; Hiller, S.; Clark, L. Insights into Sequential Chemical Extraction Procedures from Quantitative XRD: A Study of Trace Metal Partitioning in Sediments Related to Frog Malformities. Chem. Geol. 2002, 184, 337–357. [Google Scholar] [CrossRef]
  45. Sheila, A.; Maria, A.T.; Gonçalves, M.S.; Santos, M.M. A nickel availability study in serpentinised areas of Portugal. Geoderma 2011, 164, 155–163. [Google Scholar]
  46. Kostić, N.; Wilson, J.M.; Živković, M.; Bain, D. Mineralogy and Geochemical Speciation of Heavy Metals in Some Serpentine Soils of Serbia. In Proceedings of the 16th World Congress of Soil Science, Montpellier, France, 20–26 August 1998. [Google Scholar]
  47. Tsadilas, C.D.; Rinklebe, J.; Selim, H.M. Nickle in Soils and Plants; CRC Press: Boca Raton, FL, USA, 2019; p. 327. [Google Scholar]
  48. Tessier, A.; Campbell, P.G.C.; Blsson, M. Sequential extraction procedure for the speciation of particulate trace metals. Anal. Chem. 1979, 52, 45–53. [Google Scholar] [CrossRef]
  49. Zhang, S.; Wang, S.; Shan, X. Distribution and Speciation of Heavy Metals in Surface Sediments from Guanting Reservoir, Beijing. J. Environ. Sci. Health 2002, 37, 465–478. [Google Scholar] [CrossRef] [PubMed]
  50. Zulfiqar, U.; Haider, F.U.; Ahmad, M.; Hussain, S.; Maqsood, M.F.; Ishfaq, M.; Shahzad, B.; Waqas, M.M.; Ali, B.; Tayyab, M.N.; et al. Chromium toxicity, speciation, and remediation strategies in soil-plant interface: A critical review. Front. Plant Sci. 2023, 13, 1081624. [Google Scholar] [CrossRef]
  51. Avudainayagam, S.; Megharaj, M.; Owens, G.; Kookana, R.S.; Chittleborough, D.; Naidu, R. Chemistry of chromium in soils with emphasis on tannery waste sites. Rev. Environ. Contam. Toxicol. 2003, 178, 53–91. [Google Scholar]
  52. Shaheen, S.M.; Rinklebe, J. Geochemical fractions of chromium, copper, and zinc and their vertical distribution in floodplain soil profiles along the central Elbe River, Germany. Geoderma 2014, 228–229, 142–159. [Google Scholar] [CrossRef]
  53. Mitrović, M.; Blanusa, T.; Pavlović, M.; Pavlović, D.; Kostić, O.; Perović, V.; Jarić, S.; Pavlović, P. Using Fractionation Profile of Potentially Toxic Elements in Soils to Investigate Their Accumulation in Tilia sp. Leaves in Urban Areas with Different Pollution Levels. Sustainability 2021, 13, 9784. [Google Scholar] [CrossRef]
  54. Kay, J.T.; Conklin, M.H.; Fuller, C.C.; O’Day, P.A. Processes of nickel and cobalt uptake by a manganese oxide forming sediment in Pinal Creek, Globe Mining, Arizona. Environ. Sci. Technol. 2001, 35, 4719–4725. [Google Scholar] [CrossRef]
  55. Wendling, L.A.; Kirby, J.K.; McLaughlin, M.J. A novel technique to determine cobalt exchangeability in soils using isotope dilution. Environ. Sci. Technol. 2008, 42, 140–146. [Google Scholar] [CrossRef]
  56. Li, Z.; McLaren, R.G.; Metherell, A.K. Fractionation of cobalt and manganese in New Zealand soils. Aust. J. Soil Res. 2001, 39, 951–967. [Google Scholar] [CrossRef]
  57. Jović, M.; Šljivić-Ivanović, M.; Dimović, S.; Marković, J.; Smičiklas, I. Sorption and mobility of Co(II) in relation to soil properties. Geoderma 2017, 297, 38–47. [Google Scholar] [CrossRef]
  58. Smičiklas, I.; Dimović, S.; Jović, M.; Milenković, A.; Šljivić-Ivanović, M. Evaluation study of cobalt(II) and strontium(II) sorption–desorption behavior for selection of soil remediation technology. Int. J. Environ. Sci. Technol. 2015, 12, 3853–3862. [Google Scholar] [CrossRef]
Figure 1. Map of study areas (pedology map).
Land 13 02075 g001
Figure 2. Geochemical fractions of Ni in the studied soil.
Land 13 02075 g002
Figure 3. Geochemical fractions of Cr in the studied soil.
Land 13 02075 g003
Figure 4. Geochemical fractions of Co in the studied soil.
Land 13 02075 g004
Table 1. Basic Fertility Parameters of the Studied Soil Types.
SoilDepth [cm]StatisticpH in KClSOMClay *Total Sand *CECFe *Mn *
Fluvisol0–10 n = 3Mean5.485.0535.0028.3032.6125,711.40820.09
Std. Dev.0.751.049.825.477.701301.21124.94
Minimum4.783.8824.8022.0024.9024,533.85682.96
Maximum6.275.8644.4031.8040.3027,108.37927.46
10–30 n = 3Mean5.003.3837.2726.4730.5326,243.36898.66
Std. Dev.0.700.8111.126.736.612827.05204.07
Minimum4.352.4526.5018.7023.6023,296.82744.42
Maximum5.753.8848.7030.6036.7028,933.431130.06
30–60 n = 3Mean4.641.6148.4319.5335.6929,961.66606.34
Std. Dev.0.770.534.974.907.003209.20111.37
Minimum4.021.2042.7013.9027.6026,572.12529.09
Maximum5.502.2151.3022.8040.2032,953.44734.01
Mean of type soil5.18 a2.86 a,b40.08 a25.16 c32.71 a26,742.44 b757.99 b
Vertisol0–10 n = 4Mean5.362.5139.3830.9328.1020,477.53636.72
Std. Dev.1.160.3510.399.131.705612.3867.14
Minimum4.452.2126.5024.8026.9013,206.83539.53
Maximum7.062.8450.6044.5029.3026,867.86693.20
10–30 n = 4Mean5.392.4640.3830.7528.2820,671.16685.39
Std. Dev.1.250.4710.469.304.235441.04129.69
Minimum4.321.8527.4023.7025.3013,987.21517.28
Maximum7.192.9449.3044.4031.3027,251.79832.42
30–60 n = 4Mean5.261.3743.5229.3830.6922,422.16590.51
Std. Dev.1.430.436.457.203.407875.85104.35
Minimum4.100.8334.7023.8028.3017,079.24496.76
Maximum7.341.8950.2039.5033.1033,959.81711.30
Mean of type soil5.33 a2.12 b41.09 a30.35 b,c29.02 a21,190.28 c637.54 b
Leptosol on serpentinite0–10 n = 3Mean5.715.9528.4740.4730.3934,450.97908.66
Std. Dev.0.421.558.3814.525.086639.60183.43
Minimum5.404.3321.6024.1026.8027,047.90788.82
Maximum6.187.4037.8051.8034.0039,878.831119.82
10–30 n = 3Mean5.644.0529.8335.3729.8639,132.03887.76
Std. Dev.0.431.099.5810.973.171944.27220.72
Minimum5.252.8622.6023.2027.6037,695.44705.86
Maximum6.114.9940.7044.5032.1041,344.431133.31
30–60 n = 3Mean5.811.7032.7439.6332.4344,388.30893.08
Std. Dev.0.471.1816.0515.898.535847.8444.19
Minimum5.300.7221.3323.1026.4037,826.88859.56
Maximum6.223.0251.1054.8038.5049,050.33943.16
Mean of type soil5.72 a3.90 a30.35 b38.49 b30.89 a39,323.77 a896.50 a
Leptosol on sandstone0–10 n = 2Mean4.172.6121.0555.9016.2515,665.28726.19
Std. Dev.0.350.454.742.970.734243.01144.40
Minimum3.922.3017.7053.8015.7012,665.02624.08
Maximum4.412.9324.4058.0016.8018,665.54828.29
10–30 n = 2Mean4.161.7222.5550.8513.8018,201.00780.30
Std. Dev.0.340.174.450.351.603161.56220.13
Minimum3.921.6019.4050.6012.7015,965.45624.64
Maximum4.401.8525.7051.1014.9020,436.56935.95
30–60 n = 2Mean4.201.2121.1051.0515.3415,046.70704.33
Std. Dev.0.470.580.854.451.791430.9061.41
Minimum3.860.8020.5047.9014.1014,034.90660.90
Maximum4.531.6221.7054.2016.6016,058.50747.75
Mean of type soil4.17 b1.85 b21.57 c52.60 a15.13 b16,304.33 d736.94 b
SOM: Soil organic carbon; Clay * (<0.002 mm); Total sand * (2–0.02 mm); CEC: Cation Exchange Capacity; Fe * (total). Mn * (total). Different letters (a,b,c,d) denote statistically significant differences between groups at a significance level of p < 0.05.
Table 2. Concentrations of Ni, Cr, and Co fractions (mg kg−1) in the studied soil.
SoilDepth [cm]PTEConcentration (mg kg−1)
F1F2F3F4Sum of FractionsDTPATotal
Fluvisol (P1, P2, P3)0–10Ni12.88 ±
6.15
42.92 ±
34.76
25.12 ±
19.93
105.74 ±
38.44
186.66 ±
99.24
13.56 ±
3.52
191.44 ±
86.24
Cr0.26 ±
0.13
7.71 ±
5.54
30.53 ±
13.09
88.00 ±
40.49
126.50 ±
59.14
0.03 ±
0.03
132.68 ±
53.39
Co1.96 ±
0.97
17.62 ±
2.99
0.97 ±
0.21
9.28 ±
0.92
29.84 ±
3.89
1.82 ±
2.57
26.66 ±
2.78
10–30Ni11.67 ±
8.11
50.14 ±
31.45
25.36 ±
20.18
116.66 ±
32.30
203.82 ±
91.75
14.11 ±
5.95
202.65 ±
67.68
Cr0.21 ±
0.07
7.96 ±
5.48
31.87 ±
12.60
95.73 ±
36.17
135.77 ±
54.15
0.01 ±
0.01
135.44 ±
37.68
Co1.88 ±
1.04
23.21 ±
5.70
1.29 ±
0.39
10.50 ±
0.07
36.88 ±
6.26
0.30 ±
0.02
30.33 ±
2.62
30–60Ni10.44 ±
7.22
60.17 ±
58.70
25.48 ±
20.48
154.11 ±
7.03
249.79 ±
92.17
9.04 ±
4.16
251.43 ±
81.73
Cr0.08 ±
0.10
7.87 ±
4.81
26.13 ±
16.20
116.07 ±
20.07
150.26 ±
40.75
0.00 ±
0.00
176.65 ±
58.27
Co0.89 ±
0.14
25.71 ±
1.67
1.00 ±
0.70
10.22 ±
0.74
37.82 ±
1.64
0.33 ±
0.15
26.03 ±
2.45
Mean of type soilNi13.47 b67.05 b34.15 b132.09 b249.7611.27215.48
Cr0.25 b8.70 b30.27 b106.04 b145.260.01148.25
Co0.89 b19.86 b1.46 a10.44 b32.660.1927.67
Vertisol (P4, P5. P6, P7)0–10Ni5.71 ±
1.48
18.05 ±
10.16
10.67 ±
7.57
53.45 ±
22.19
87.88 ±
28.11
5.03 ±
1.82
94.19 ±
34.47
Cr0.25 ±
0.19
3.65 ±
0.86
11.10 ±
2.22
43.87 ±
12.96
58.86 ±
11.67
0.01 ±
0.01
70.07 ±
19.28
Co1.27 ±
0.63
12.26 ±
2.91
0.37 ±
0.08
6.85 ±
1.41
20.74 ±
4.25
0.39 ±
0.31
17.69 ±
5.21
10–30Ni5.10 ±
1.31
16.80 ±
8.95
12.99 ±
5.54
43.76 ±
9.41
78.65 ±
21.77
4.36 ±
1.52
86.16 ±
19.76
Cr0.14 ±
0.04
3.26 ±
0.76
11.40 ±
1.65
37.81 ±
7.88
52.60 ±
7.09
0.01 ±
0.01
65.62 ±
10.57
Co1.06 ±
0.46
12.49 ±
4.38
0.37 ±
0.31
6.17 ±
0.75
20.08 ±
4.58
0.35 ±
0.25
18.68 ±
4.65
30–60Ni5.31 ±
1.89
27.95 ±
15.27
13.36 ±
7.64
65.23 ±
37.04
111.85 ±
58.91
3.56 ±
2.97
110.46 ±
57.21
Cr0.13 ±
0.03
3.93 ±
0.80
12.40 ±
3.33
52.67 ±
24.20
69.13 ±
24.51
0.01 ±
0.01
77.96 ±
32.95
Co0.87 ±
0.32
22.26 ±
25.93
0.46 ±
0.40
6.97 ±
1.36
30.55 ±
27.46
0.37 ±
0.52
26.50 ±
22.67
Mean of type soilNi5.37 b.c20.93 b.c12.34 b54.15 b92.794.3296.96
Cr0.17 b3.59 b11.70 c45.61 c61.070.0171.21
Co1.07 b15.98 b.c0.41 b6.73 c24.190.3820.96
Leptosol on serpentinite (P8, P9, P10)0–10Ni50.99 ±
23.13
208.10 ±
108.02
93.96 ±
50,61
427.27 ±
187.55
780.32 ±
354.33
55.17 ±
7.87
745.06 ±
309.47
Cr0.66±29.45±77.33±277.97±385.41±0.03±437.87±
0.1212.0511.7161.0163.310.0265.18
Co4.31±48.31±1.45±21.75±75.83±0.89±65.07±
2.228.121.252.9612.220.439.93
10–30Ni48.64 ±
23.48
198.63 ±
111.46
81.01 ±
36.69
436.44 ±
174.90
764.73 ±
323.26
44.91 ±
6.10
734.75 ±
285.15
Cr0.58±30.20±83.33±291.92±406.02±0.02±432.24±
0.2313.1418.3847.2668.930.0282.62
Co3.14±47.19±1.12±22.04±73.50±0.58±63.65±
1.315.620.803.859.200.244.86
30–60Ni75.22 ±
43.37
325.34 ±
262.08
114.44 ±
120.92
597.91 ±
611.61
1085.31 ±
1038.08
50.82 ±
26.84
950.02 ±
506.94
Cr0.58±29.69±72.54±353.39±456.19±0.01±459.36±
0.2911.5522.0876.9953.150.0241.57
Co1.45±54.01±1.36±24.22±81.03±0.31±65.79±
0.5321.281.341.7521.340.2015.64
Mean of type soilNi47.70 a222.94 a98.63 a491.77 a861.0442.30106.3
Cr0.61 a30.82 a79.02 a307.13 a417.580.0294.22
Co2.87 a48.94 a1.25 a22.87 a75.920.57117.11
Leptosol on sandstone (P11, P12)0–10Ni4.01±6.44±4.52±25.49±40.46±3.02±46.88±
2.634.292.885.3615.172.0019.65
Cr0.14±2.06±6.60±18.88±27.67±0.03±32.17±
0.020.653.684.508.850.0114.42
Co1.72±11.79±0.20±3.98±17.70±0.54±14.37±
1.492.490.280.394.660.365.22
10–30Ni3.21±5.23±3.44±27.95±39.83±2.25±48.85±
2.343.771.368.6016.071.5115.42
Cr0.13±2.11±4.80±20.59±27.63±0.02±35.93±
0.020.541.709.9712.220.0117.51
Co1.26±10.89±0.10±4.64±16.89±0.38±15.14±
0.873.800.140.695.490.244.51
30–60Ni1.88±3.70±6.62±26.89±39.08±1.03±42.80±
1.462.895.807.622.540.566.94
Cr0.09±1.75±8.40±16.44±26.68±0.01±30.82
0.000.227.351.356.230.022.70
Co0.48±8.43±0.28±4.74±13.93±0.14±12.35±
0.172.910.400.672.810.011.44
Mean of type soilNi3.04 c5.12 c4.86 b26.77 b39.792.1046.17
Cr0.12 b1.93 c6.17 c18.19 c41.580.0232.93
Co1.07 b10.06 c0.17 b4.44 d15.740.3313.94
F1: Acid-soluble fraction; F2: Reducible fraction; F3: Oxidizable fraction; F4: Residual fraction; ∑F1–F4: Sum of fractions; DTPA: Diethylenetriaminepentaacetic acid-extractable; Total content. Different letters (a,b,c,d) denote statistically significant differences between groups at a significance level of p < 0.05.
Table 3. Correlation between Soil Properties and Ni, Cr, and Co Fractions.
PTEs FractionspHinKClSOMSand totSiltClayCECFe totMn tot
NiF10.1310.340 *0.464 **−0.171−0.43 **−0.373 *−0.343 *0.029
F20.715 **0.163−0.253−0.020.2960.613 **0.300.062
F30.328 *−0.146−0.321 *−0.0420.384 *0.259−0.159−0.232
F4−0.70 **−0.1290.2270.071−0.293−0.48 **−0.0750.051
Ni total0.427 **0.199−0.1060.0970.0680.505 **0.708 **0.293
CrF1−0.265−0.1820.379 *−0.175−0.334 *−0.607 **−0.577 **−0.146
F20.334 *0.190.544 **−0.417 **−0.391 *−0.277−0.2330.079
F3−0.1210.2870.20.117−0.287−0.152−0.2430.241
F40.033−0.317−0.339 *0.0020.381 *0.2140.304−0.246
Cr total0.431 **0.369 *−0.0130.141−0.060.508 **0.842 **0.451 **
CoF1−0.0830.2740.219−0.035−0.228−0.34−0.326 *−0.098
F2−0.547 **−0.115−0.0610.181−0.0280.0390.3120.256
F30.558 **−0.018−0.465 **0.1670.435 **0.514 **−0.112−0.248
F40.484 **0.0110.083−0.2170.023−0.02−0.168−0.172
Co total0.2430.296−0.1050.2200.460 *0.861 **0.451 **
* Correlation is significant at the 0.05 level (2-tailed). ** Correlation is significant at the 0.01 level (2-tailed).
Table 4. Percentage representation of samples according to index values.
IndexPTEsIndex Scale
No RiskLowModerateHigh (Considerable)Very High
RACNi-94.95.1--
Cr100----
Co7.887.15.1--
CFNi-12.8411828.2
Cr-46.230.723.1-
Co-76.920.52.6-
EFNi82.112.85.1--
Cr66.730.72.6--
Co82.117.9 --
Disclaimer/Publisher’s Note: The statements, opinions and data contained in all publications are solely those of the individual author(s) and contributor(s) and not of MDPI and/or the editor(s). MDPI and/or the editor(s) disclaim responsibility for any injury to people or property resulting from any ideas, methods, instructions or products referred to in the content.

