
The Use of Green Infrastructure in the Suburbs: Insights from Three European Cities

 ,
, 
 , , , ,
Abstract
1. Introduction
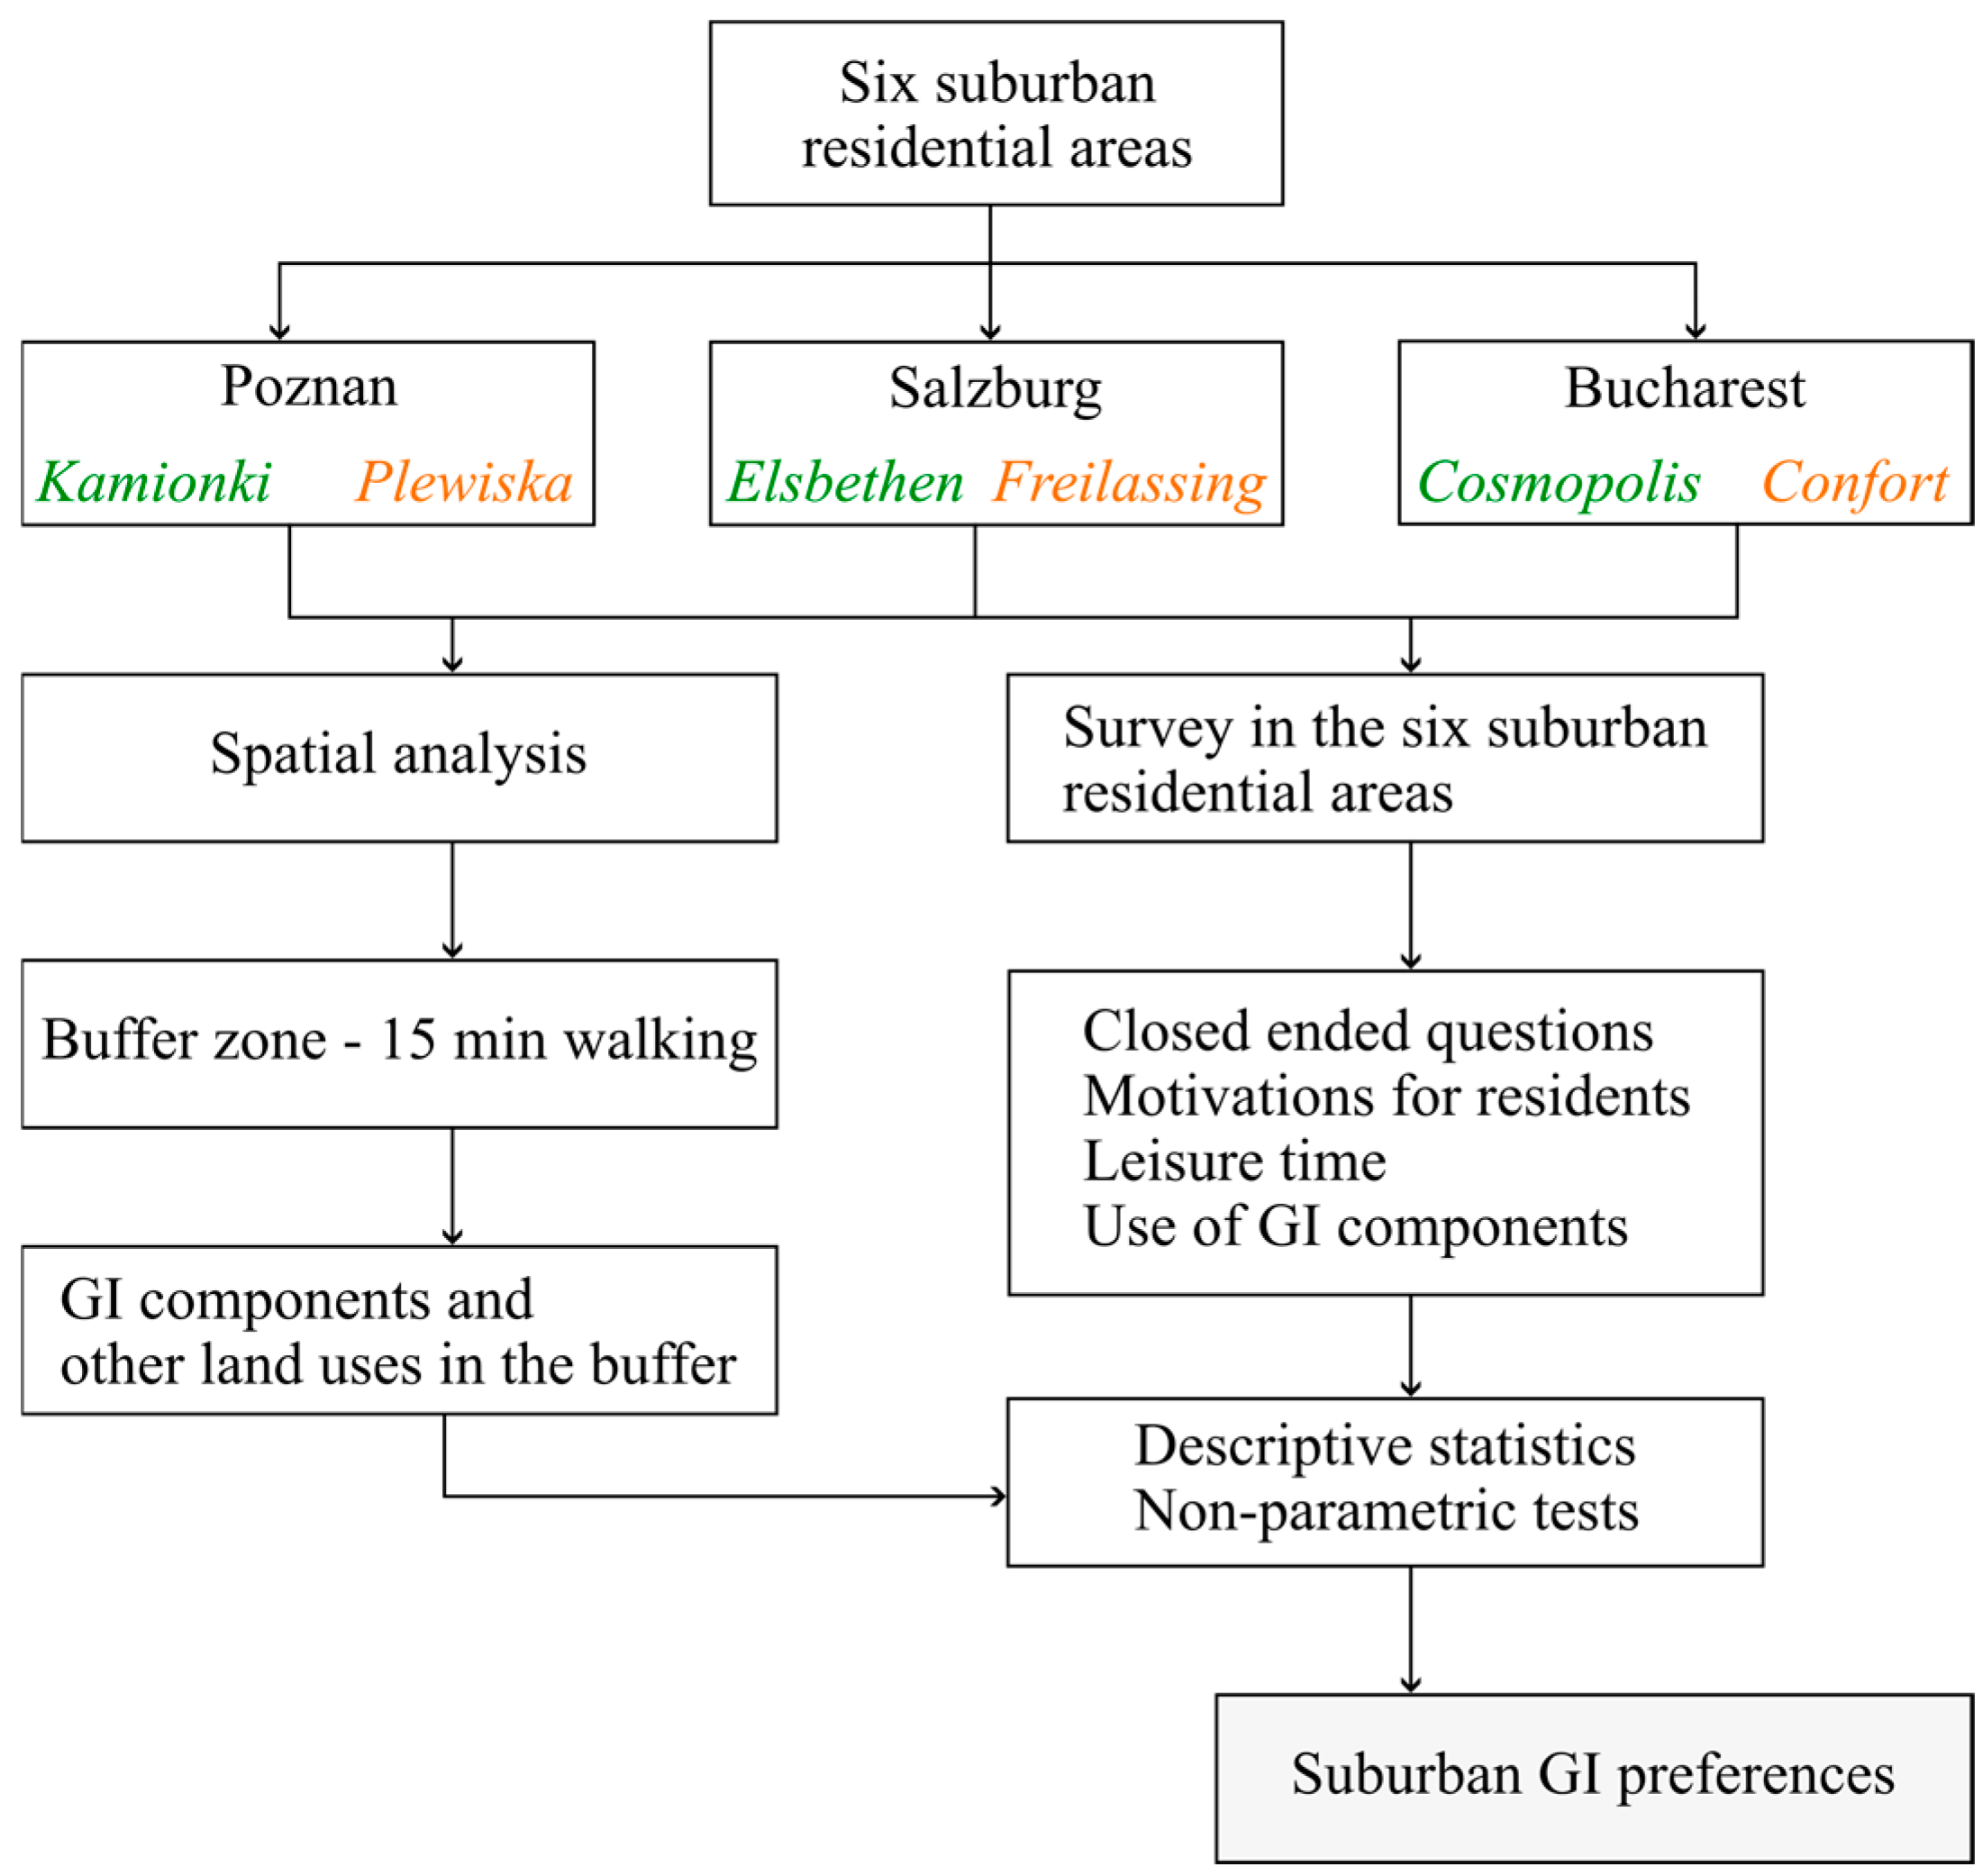
2. Materials and Methods
2.1. Study Area
2.2. Methods
3. Results
3.1. Sample Profile and Demographic Characteristics
3.2. Motivations to Leave the City
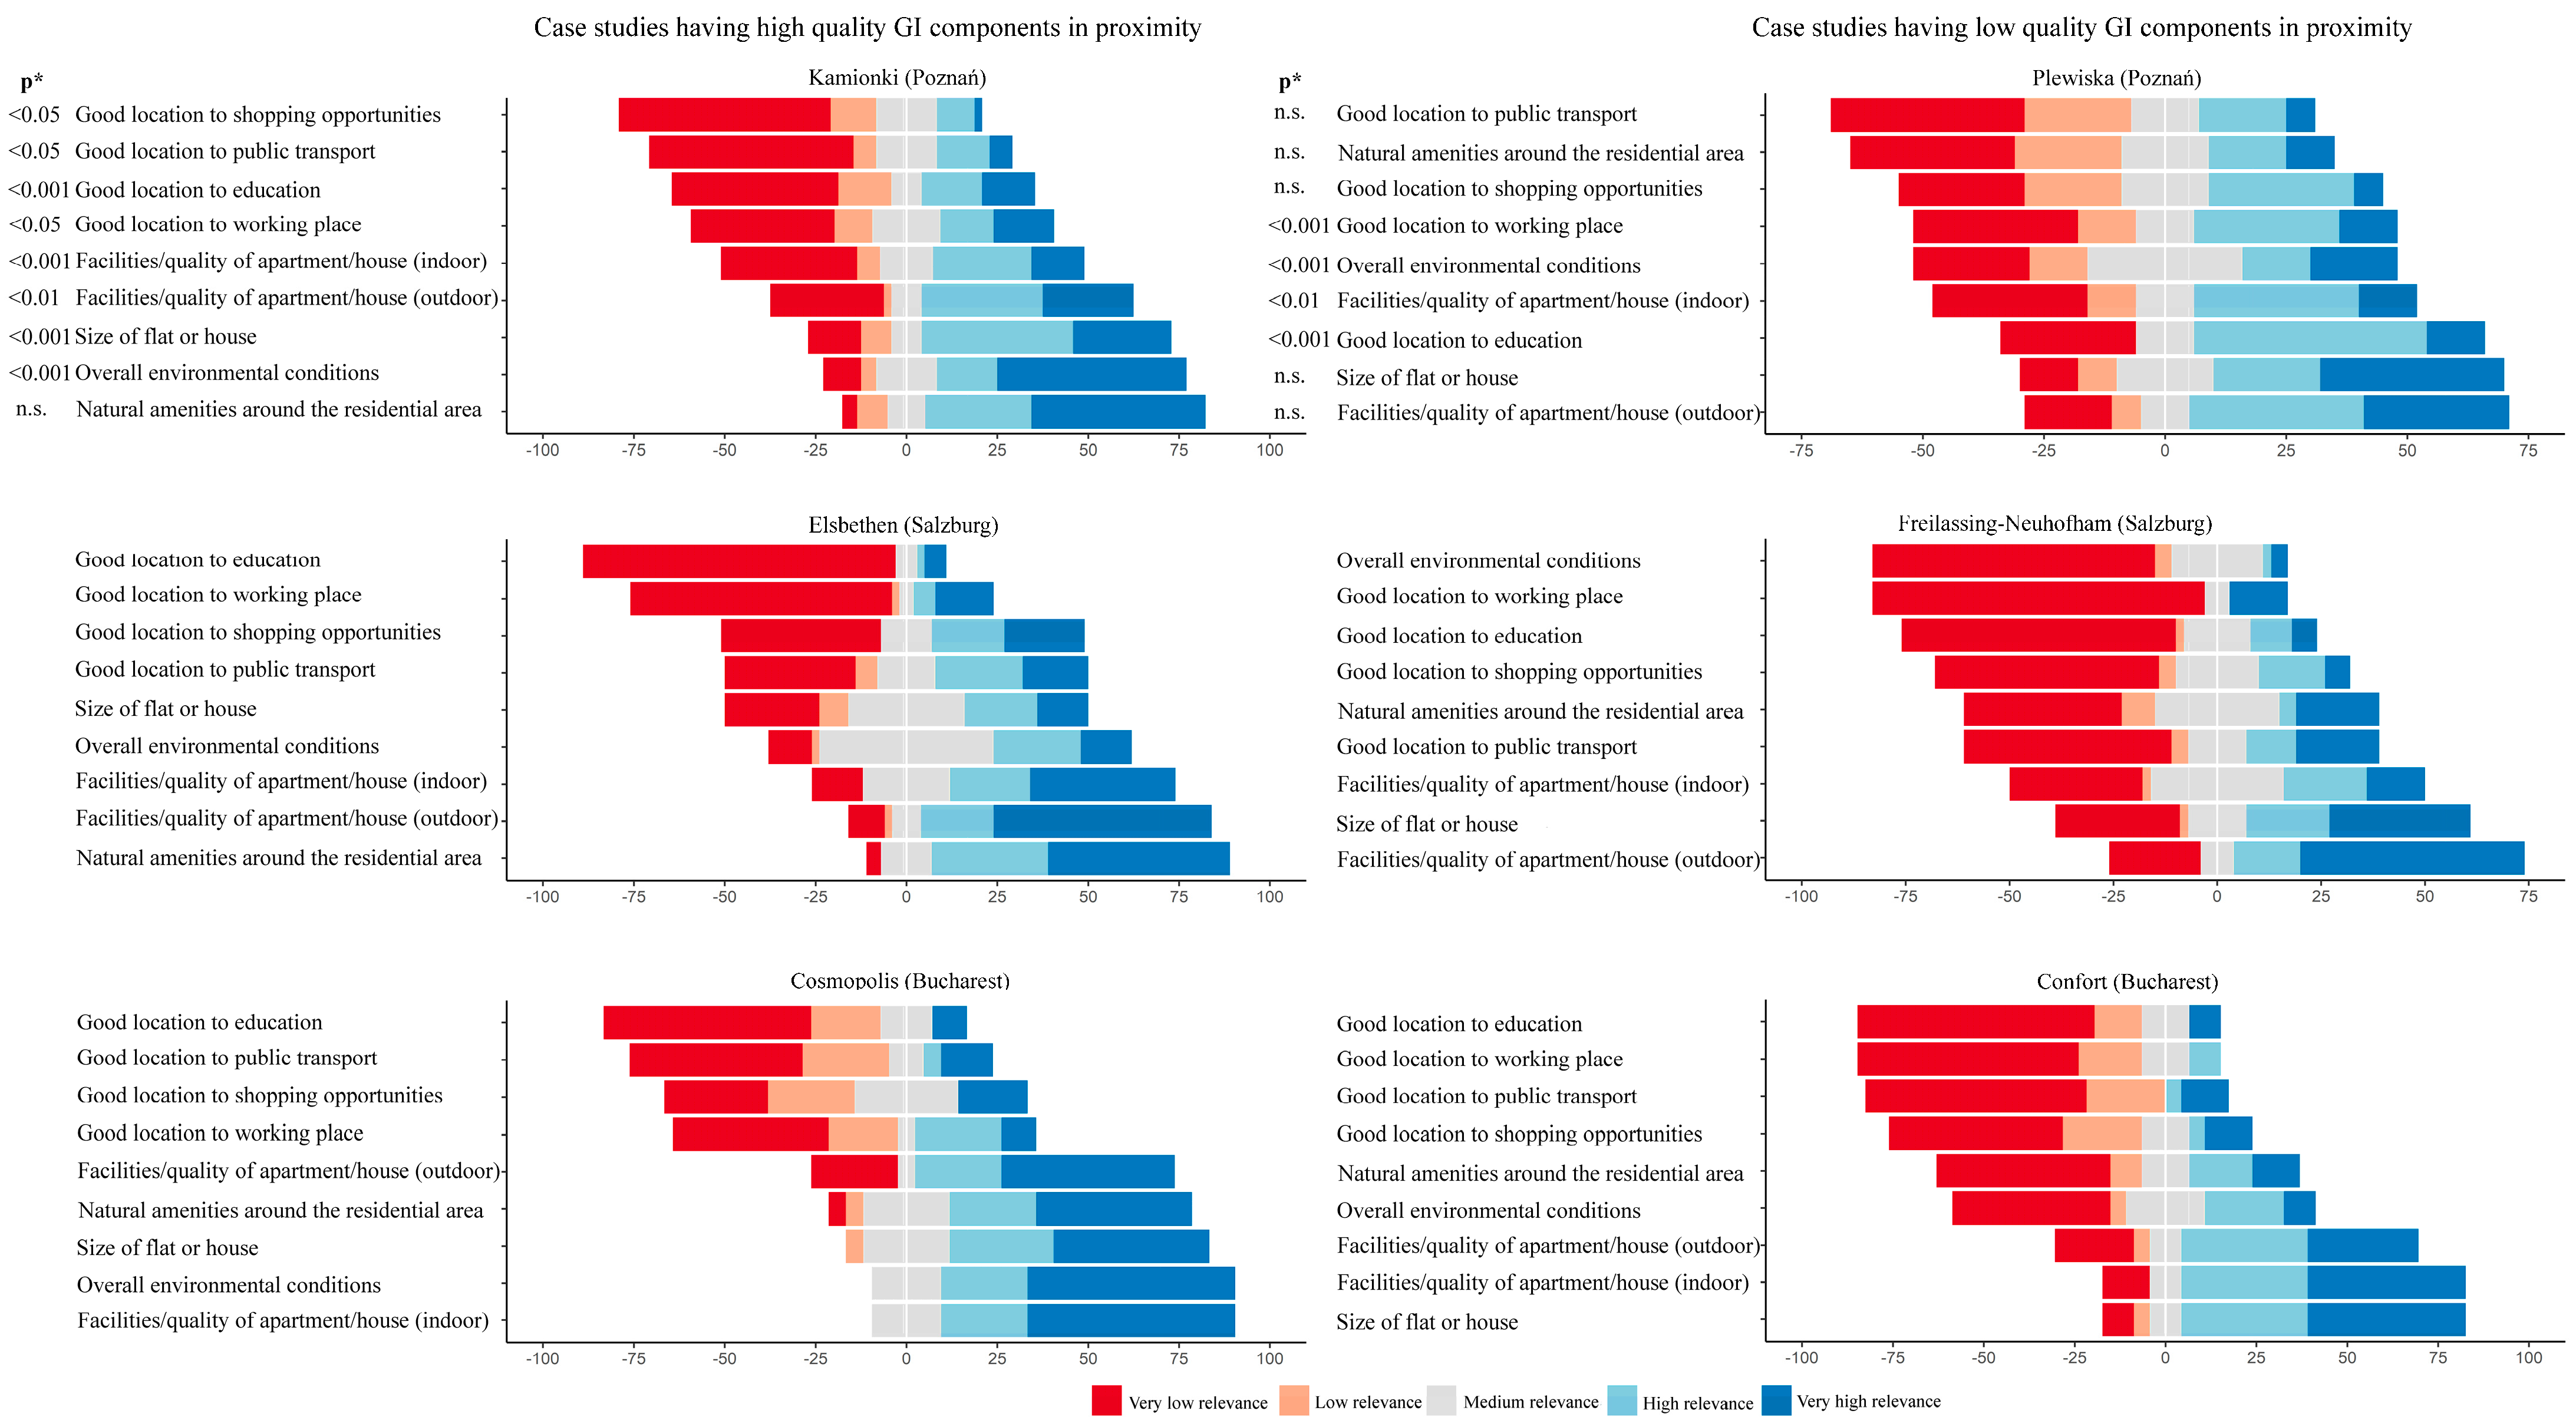
3.3. Motivations to Move to the Suburbs
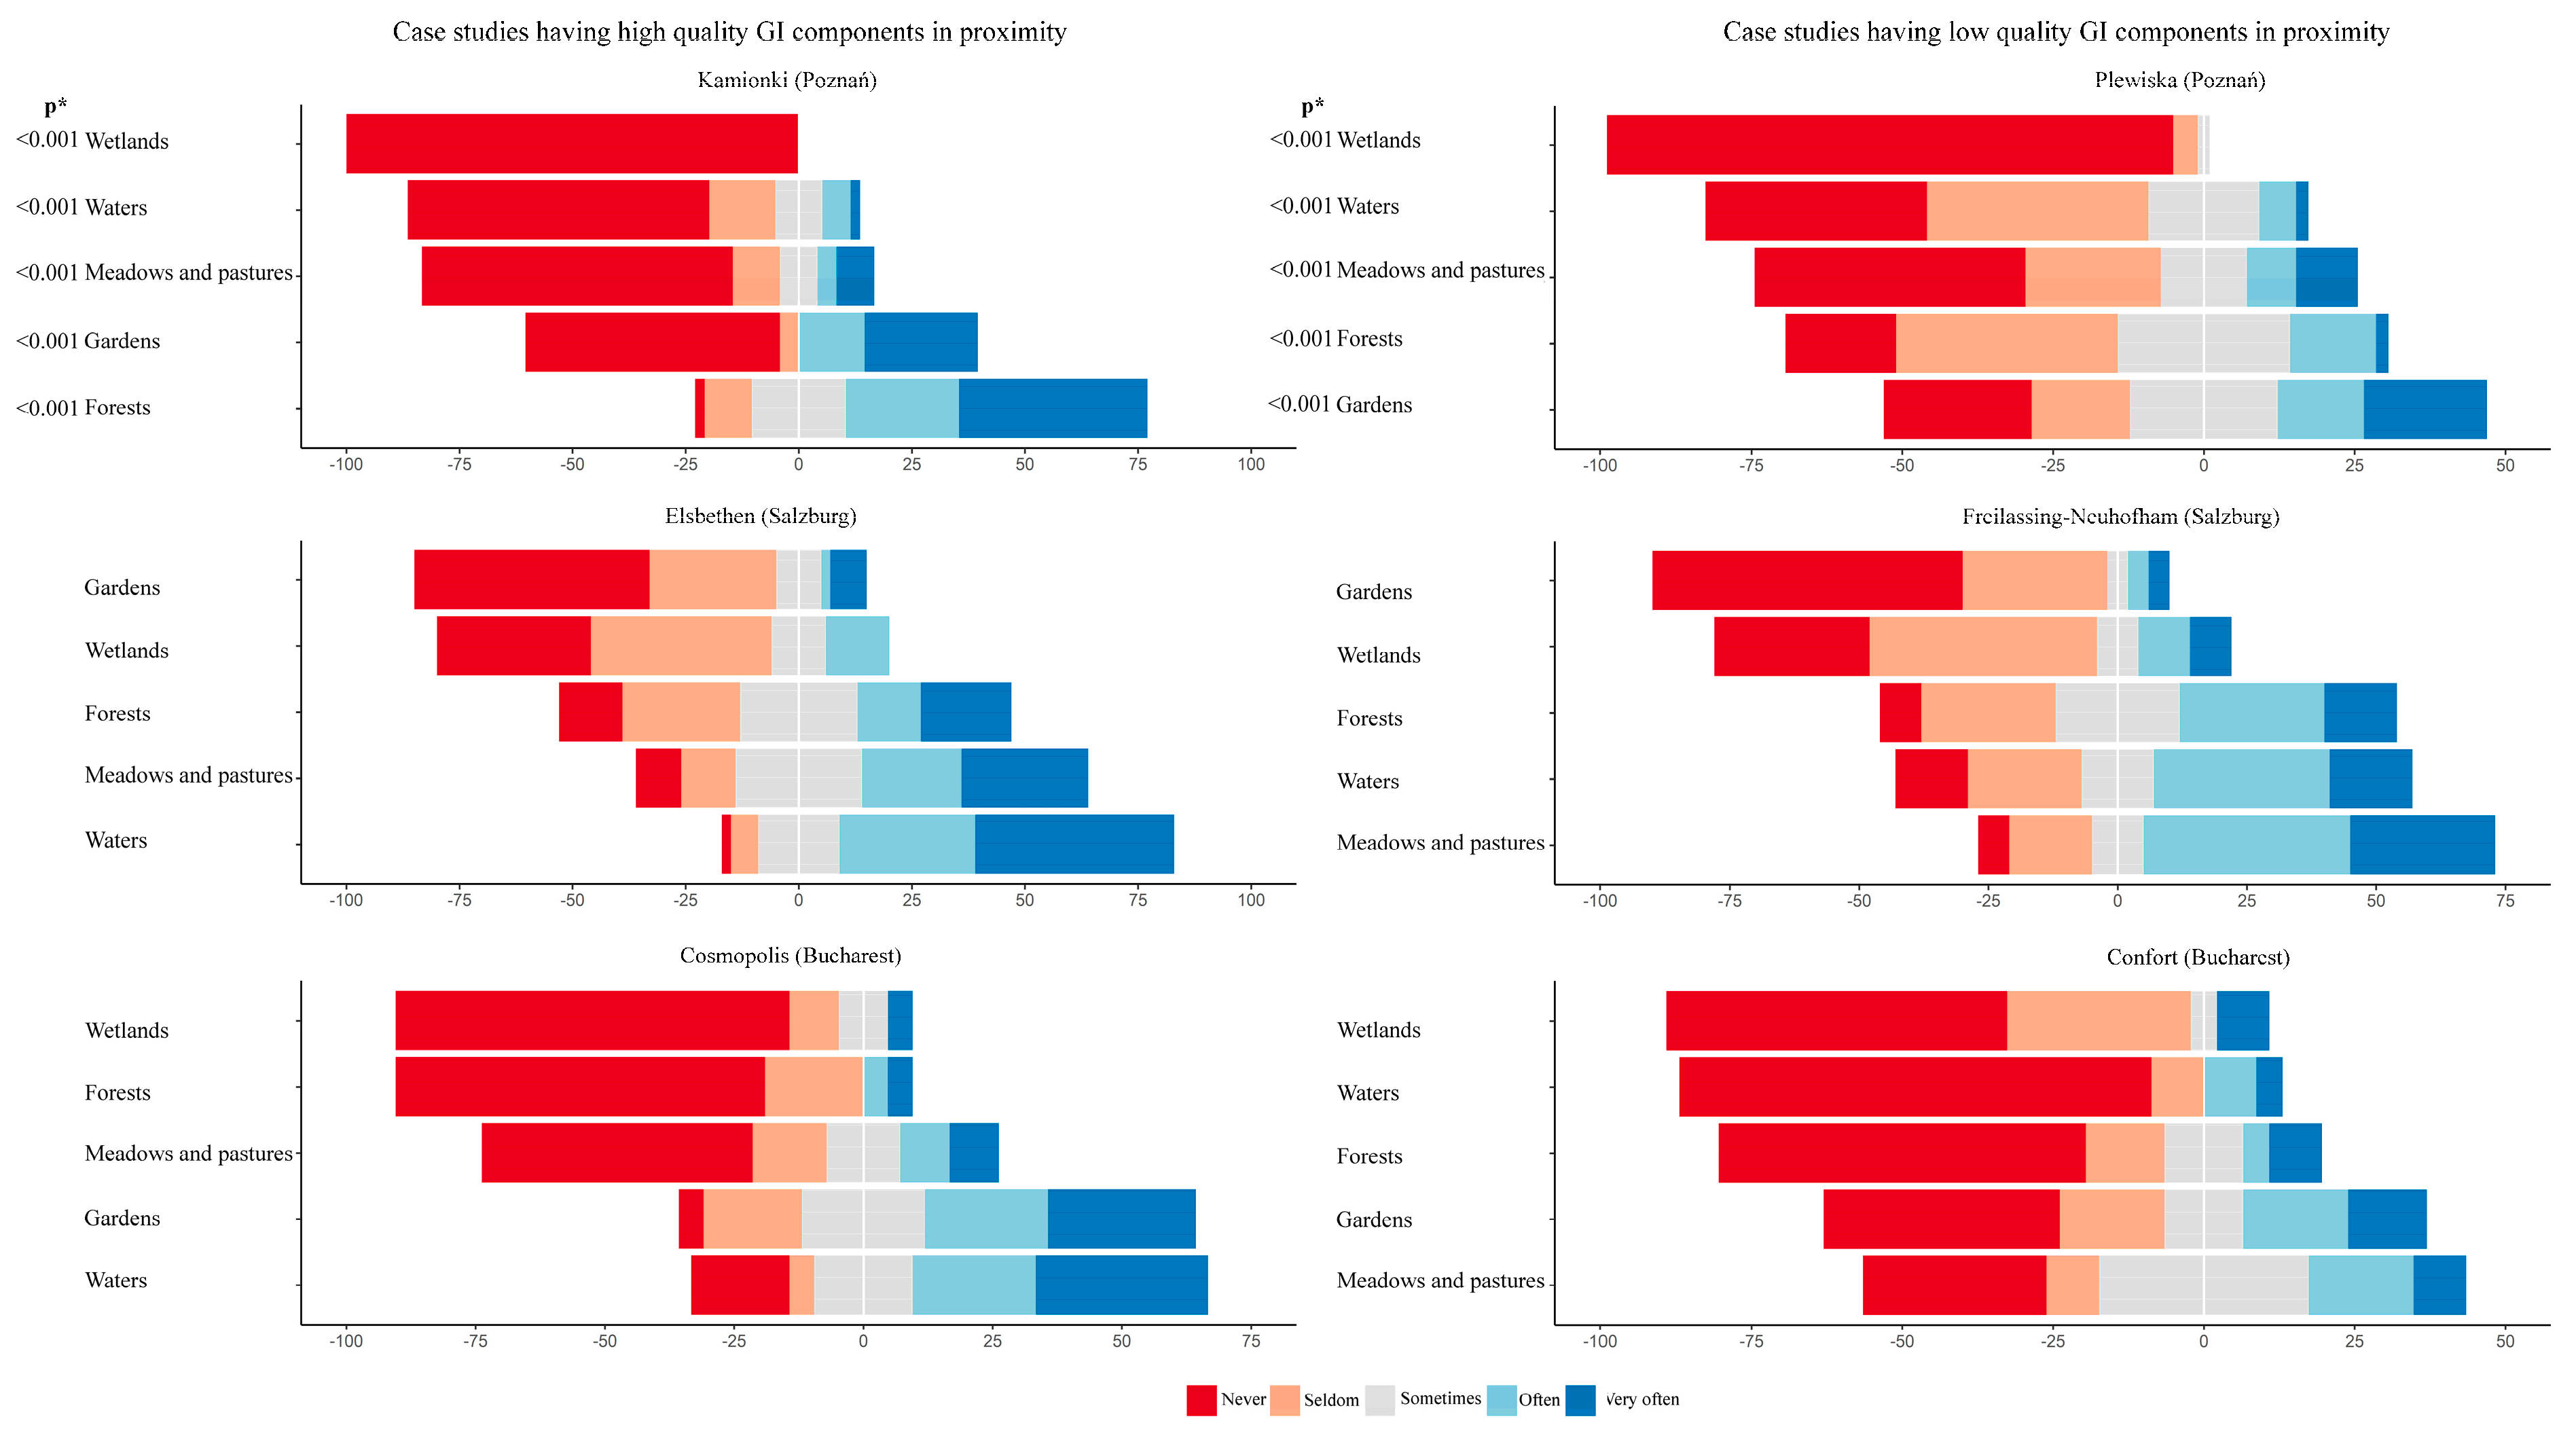
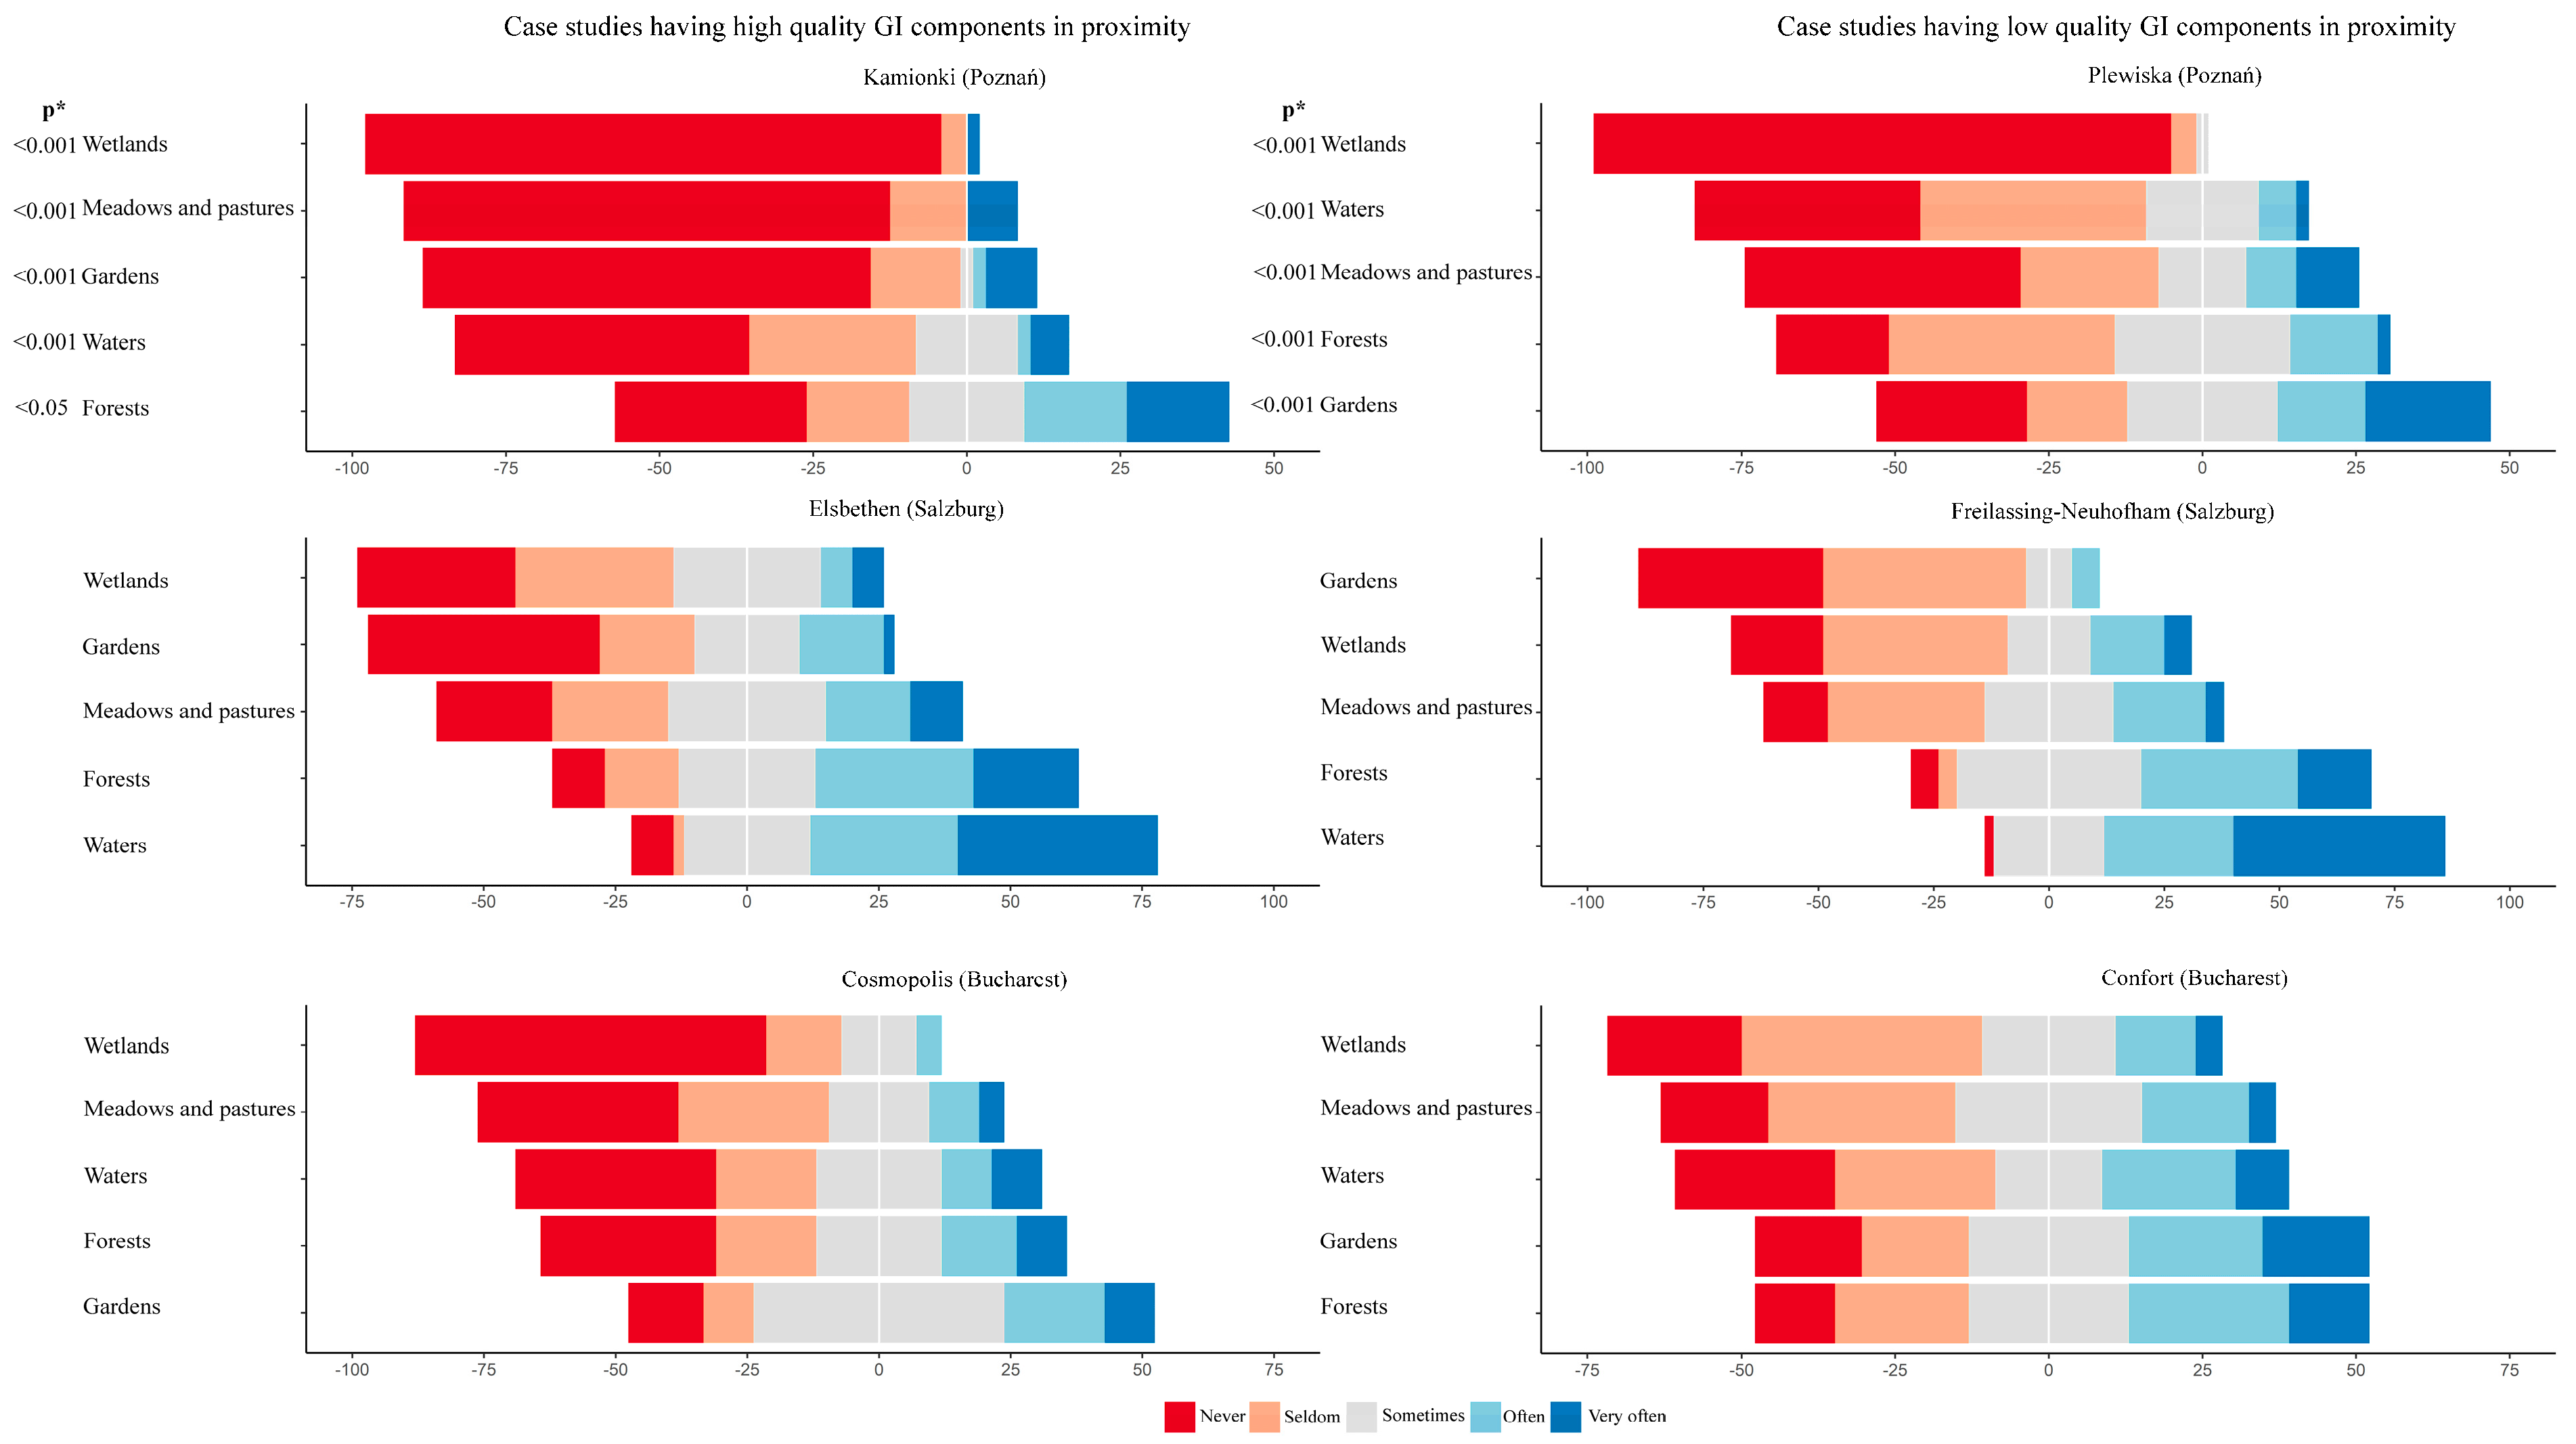
3.4. The Use of GI Components in the Suburbs
4. Discussion
4.1. Why Leave the City
4.2. Why Move to the Suburbs
4.3. Suburban GI Components
5. Conclusions
Supplementary Materials
Author Contributions
Funding
Data Availability Statement
Acknowledgments
Conflicts of Interest
References
- Booi, H.; Boterman, W.R. Changing Patterns in Residential Preferences for Urban or Suburban Living of City Dwellers. J. Hous. Built Environ. 2020, 35, 93–123. [Google Scholar] [CrossRef]
- Ettema, D. The Impact of Telecommuting on Residential Relocation and Residential Preferences: A Latent Class Modelling Approach. J. Transp. Land Use 2010, 3, 7–24. [Google Scholar] [CrossRef]
- Vogiazides, L.; Kawalerowicz, J. Internal Migration in the Time of Covid: Who Moves out of the Inner City of Stockholm and Where Do They Go? Popul. Space Place 2023, 29, e41. [Google Scholar] [CrossRef]
- Hobden, D.W.; Laughton, G.E.; Morgan, K.E. Green Space Borders—A Tangible Benefit? Evidence from Four Neighbourhoods in Surrey, British Columbia, 1980–2001. Land Use Policy 2004, 21, 129–138. [Google Scholar] [CrossRef]
- Pineda-Pinto, M.; Frantzeskaki, N.; Nygaard, C.A. The Potential of Nature-Based Solutions to Deliver Ecologically Just Cities: Lessons for Research and Urban Planning from a Systematic Literature Review. Ambio 2022, 51, 167–182. [Google Scholar] [CrossRef] [PubMed]
- Artmann, M.; Kohler, M.; Meinel, G.; Gan, J.; Ioja, I.-C. How Smart Growth and Green Infrastructure Can Mutually Support Each Other—A Conceptual Framework for Compact and Green Cities. Ecol. Indic. 2019, 96, 10–22. [Google Scholar] [CrossRef]
- Benedict, M.A.; McMahon, E.T. Green Infrastructure: Linking Landscapes and Communities; Island Press: Washington, DC, USA, 2006. [Google Scholar]
- Davies, C.; Hansen, R.; Rall, E.; Pauleit, S.; Lafortezza, R.; De Bellis, Y.; Santos, A.; Tosics, I. The Status of European Green Space Planning and Implementation Based on an Analysis of Selected European City-Regions; EU FP7 Project GREEN SURGE, Deliverable D5.1; European Comission: Brussels, Belgium, 2015. [Google Scholar]
- European Commission. Green Infrastructure—Enhancing Europe’s Natural Capital (Communication from the Commission to the European Parliament, the Council, the European Economic and Social Committee and the Committee of the Regions); European Commission: Brussels, Belgium, 2013. [Google Scholar]
- Faehnle, M. Collaborative Planning of Urban Green Infrastructure—Need, Quality, Evaluation, and Design. Ph.D. Thesis, University of Helsinki, Helsinki, Finland, 2014. [Google Scholar]
- Matsuoka, R.H.; Kaplan, R. People Needs in the Urban Landscape: Analysis of Landscape and Urban Planning Contributions. Landsc. Urban Plan. 2008, 84, 7–19. [Google Scholar] [CrossRef]
- Breuste, J.; Haase, D.; Elmqvist, T. Urban Landscapes and Ecosystem Services. In Ecosystem Services in Agricultural and Urban Landscapes; Wratten, S., Sandhu, H., Cullen, R., Costanza, R., Eds.; Wiley & Blackwell: Oxford, UK, 2013; pp. 83–104. [Google Scholar]
- Evenson, K.R.; Wen, F.; Hillier, A.; Cohen, D.A. Assessing the Contribution of Parks to Physical Activity Using Global Positioning System and Accelerometry. Med. Sci. Sports Exerc. 2013, 45, 1981–1987. [Google Scholar] [CrossRef]
- Bratman, G.N.; Hamilton, J.P.; Daily, G.C. The Impacts of Nature Experience on Human Cognitive Function and Mental Health. Ann. N. Y. Acad. Sci. 2012, 1249, 118–136. [Google Scholar] [CrossRef]
- van den Berg, A.E.; Hartig, T.; Staats, H. Preference for Nature in Urbanized Societies: Stress, Restoration, and the Pursuit of Sustainability. J. Soc. Issues 2007, 63, 79–96. [Google Scholar] [CrossRef]
- Takano, T.; Nakamura, K.; Watanabe, M. Urban Residential Environments and Senior Citizens’ Longevity in Megacity Areas: The Importance of Walkable Green Spaces. J. Epidemiol. Community Health 2002, 56, 913–918. [Google Scholar] [CrossRef]
- Priego, C.; Breuste, J.; Rojas, J. Perception and Value of Nature in Urban Landscapes: A Comparative Analysis of Cities in Germany, Chile and Spain. Landsc. Online 2008, 7, 1–22. [Google Scholar] [CrossRef]
- Kearney, A.R. Residential Development Patterns and Neighborhood Satisfaction. Environ. Behav. 2006, 38, 112–139. [Google Scholar] [CrossRef]
- Shanahan, D.F.; Bush, R.; Gaston, K.J.; Lin, B.B.; Dean, J.; Barber, E.; Fuller, R.A. Health Benefits from Nature Experiences Depend on Dose. Sci. Rep. 2016, 6, 28551. [Google Scholar] [CrossRef] [PubMed]
- Reckien, D.; Martinez-Fernandez, C. Why Do Cities Shrink? Eur. Plan. Stud. 2011, 19, 1375–1397. [Google Scholar] [CrossRef]
- Rall, E.; Bieling, C.; Zytynska, S.; Haase, D. Exploring City-Wide Patterns of Cultural Ecosystem Service Perceptions and Use. Ecol. Indic. 2017, 77, 80–95. [Google Scholar] [CrossRef]
- Samuelsson, K.; Giusti, M.; Peterson, G.D.; Legeby, A.; Brandt, S.A.; Barthel, S. Impact of Environment on People’s Everyday Experiences in Stockholm. Landsc. Urban Plan. 2018, 171, 7–17. [Google Scholar] [CrossRef]
- García-Coll, A. The Process of Residential Sprawl in Spain: Is It Really a Problem? Urban Res. Pract. 2011, 4, 250–263. [Google Scholar] [CrossRef]
- Allen, J.; Farber, S. Suburbanization of Transport Poverty. Ann. Am. Assoc. Geogr. 2020, 111, 1833–1850. [Google Scholar] [CrossRef]
- Schouten, A. Residential Relocations and Changes in Vehicle Ownership. Transportation 2022, 49, 89–113. [Google Scholar] [CrossRef]
- Hu, L. Job Accessibility of the Poor in Los Angeles. J. Am. Plan. Assoc. 2015, 81, 30–45. [Google Scholar] [CrossRef]
- Skattebol, J.; Redmond, G. Troubled Kids? Locational Disadvantage, Opportunity Structures and Social Exclusion. Child. Geogr. 2019, 17, 76–89. [Google Scholar] [CrossRef]
- Cocheci, R.-M.; Petrisor, A.-I. Assessing the Negative Effects of Suburbanization: The Urban Sprawl Restrictiveness Index in Romania’s Metropolitan Areas. Land 2023, 12, 966. [Google Scholar] [CrossRef]
- Nicoletti, L.; Sirenko, M.; Verma, T. Disadvantaged Communities Have Lower Access to Urban Infrastructure. Environ. Plan. B Urban Anal. City Sci. 2023, 50, 831–849. [Google Scholar] [CrossRef]
- Högström, E.; Berglund-Snodgrass, L.; Fjellfeldt, M. The Challenges of Social Infrastructure for Urban Planning. Urban Plan. 2022, 7, 377–380. [Google Scholar] [CrossRef]
- Andersen, H.S.; Nørgaard, H. Motives for Moving to Rural, Peripheral Areas—Work, “Rural Idyll” or “Income Transfer”. Perspecktiv 2012, 22, 22–2012. [Google Scholar]
- Karjalainen, M.; Ilgın, H.E.; Metsäranta, L.; Norvasuo, M. Suburban Residents’ Preferences for Livable Residential Area in Finland. Sustainability 2021, 13, 11841. [Google Scholar] [CrossRef]
- Shen, J.; Wu, F. Moving to the Suburbs: Demand-Side Driving Forces of Suburban Growth in China. Environ. Plan. A 2013, 45, 1823–1844. [Google Scholar] [CrossRef]
- Bruegmann, R. Sprawl: A Compact History; University of Chicago Press: Chicago, IL, USA, 2005; ISBN 978-0-226-07691-1. [Google Scholar]
- Johnson, B.E. Nature, Affordability, and Privacy as Motivations for Exurban Living. Urban Geogr. 2008, 29, 705–723. [Google Scholar] [CrossRef]
- Johnston, E.W.; Hicks, D.; Nan, N.; Auer, J.C. Managing the Inclusion Process in Collaborative Governance. J. Public Adm. Res. Theory 2011, 21, 699–721. [Google Scholar] [CrossRef]
- Haase, A.; Grossmann, K.; Steinführer, A. Transitory Urbanites: New Actors of Residential Change in Polish and Czech Inner Cities. Cities 2012, 29, 318–326. [Google Scholar] [CrossRef]
- Lilius, J. Is There Room for Families in the Inner City? Life-Stage Blenders Challenging Planning. Hous. Stud. 2014, 29, 843–861. [Google Scholar] [CrossRef]
- Aalbers, C.B.E.M.; Eckerberg, K. Governance Patterns and Performance of Regional Strategies in Peri-Urban Areas: Comparative Analysis of Seven Case Studies in Europe and China; PLUREL Report D3.3.8; European Comission: Brussels, Belgium, 2011. [Google Scholar]
- Coolen, H.; Meesters, J. Private and Public Green Spaces: Meaningful but Different Settings. J. Hous. Built Environ. 2012, 27, 49–67. [Google Scholar] [CrossRef]
- Arnberger, A.; Eder, R. The Influence of Green Space on Community Attachment of Urban and Suburban Residents. Urban For. Urban Green. 2012, 11, 41–49. [Google Scholar] [CrossRef]
- Žlender, V.; Ward Thompson, C. Accessibility and Use of Peri-Urban Green Space for Inner-City Dwellers: A Comparative Study. Landsc. Urban Plan. 2017, 165, 193–205. [Google Scholar] [CrossRef]
- Stanners, D.; Bourdeau, P. The Urban Environment. In Europe’s Environment: The Dobris Assessment; European Environment Agency: Copenhagen, Denmark, 1995; pp. 261–296. [Google Scholar]
- Parysek, J.J.; Mierzejewska, L. Poznań. Cities 2006, 23, 291–305. [Google Scholar] [CrossRef]
- Statistical Bulletin of Poznań. Statistical Office in Poznań. 2024. Available online: https://bdl.stat.gov.pl/bdl/start (accessed on 25 September 2024).
- Marcinowicz, D. Dynamika i Struktura Zmian Zaludnienia w Aglomeracji Poznańskiej w Latach 1990–2006. In Powiat poznański. Jakość Przestrzeni, Jakość Życia; Kaczmarek, T., Mizgajski, A., Eds.; Bogucki Wydawnictwo Naukowe: Poznań, Poland, 2008. [Google Scholar]
- Local Data Bank of Polish Central Statistical Office. Data for Year 2024. 2024. Available online: https://bdl.stat.gov.pl/bdl/start (accessed on 25 September 2024).
- Stadt Salzburg. Bevölkerungszahlen von 1990 Bis 2024. 2024. Available online: https://stadt-salzburg.at/statistik-bevoelkerung/bevoelkerungszahlen-von-1990-bis-2024 (accessed on 25 September 2024).
- Magistrat der Stadt Salzburg. Salzburg in Zahlen. Geographische Lage & Fläche; Magistrat der Stadt Salzburg: Salzburg, Austria, 2013. [Google Scholar]
- Lang, S.; Jekel, T.; Hölbling, D.; Schöpfer, E.; Prinz, T.; Kloyber, E.; Blaschke, T. Where the Grass Is Greener—Mapping of Urban Green Structures According to Relative Importance in the Eyes of the Citizens. In Proceedings of the 1st EARSel Workshop of the SIG uraban Remote Sensing Humboldt, Berlin, Germany, 2–3 March 2006; pp. 2–3. [Google Scholar]
- National Institute of Statistics. Population Census; Statistics National Institute Publication Office: Bucharest, Romania, 2021. [Google Scholar]
- Iojă, I.-C.; Osaci-Costache, G.; Breuste, J.; Hossu, C.A.; Grădinaru, S.R.; Onose, D.A.; Nită, M.R.; Skokanová, H. Integrating Urban Blue and Green Areas Based on Historical Evidence. Urban For. Urban Green. 2018, 34, 217–225. [Google Scholar] [CrossRef]
- Patroescu, M.; Nita, M.; Ioja, C.; Vanau, G. New Residential Areas in Bucharest Metropolitan Area—Location, Type and Characteristics. In Proceedings of the Real Corp Procedings, Sitges, Spain, 22–25 April 2009. [Google Scholar]
- Zhang, H.; Chen, B.; Sun, Z.; Bao, Z. Landscape Perception and Recreation Needs in Urban Green Space in Fuyang, Hangzhou, China. Urban For. Urban Green. 2013, 12, 44–52. [Google Scholar] [CrossRef]
- Rupprecht, C.D.D.; Byrne, J.A.; Ueda, H.; Lo, A.Y. ‘It’s Real, Not Fake like a Park’: Residents’ Perception and Use of Informal Urban Green-Space in Brisbane, Australia and Sapporo, Japan. Landsc. Urban Plan. 2015, 143, 205–218. [Google Scholar] [CrossRef]
- Carrus, G.; Scopelliti, M.; Lafortezza, R.; Colangelo, G.; Ferrini, F.; Salbitano, F.; Agrimi, M.; Portoghesi, L.; Semenzato, P.; Sanesi, G. Go Greener, Feel Better? The Positive Effects of Biodiversity on the Well-Being of Individuals Visiting Urban and Peri-Urban Green Areas. Landsc. Urban Plan. 2015, 134, 221–228. [Google Scholar] [CrossRef]
- Guimarães, M.H.; Nunes, L.C.; Barreira, A.P.; Panagopoulos, T. What Makes People Stay in or Leave Shrinking Cities? An Empirical Study from Portugal. Eur. Plan. Stud. 2016, 24, 1684–1708. [Google Scholar] [CrossRef]
- R Development Core Team. R: A Language and Environment for Statistical Computing; Foundation for Statistical Computing: Vienna, Austria, 2008. [Google Scholar]
- Heiberger, R.M.; Robbins, N.B. Design of Diverging Stacked Bar Charts for Likert Scales and Other Applications. J. Stat. Softw. 2014, 57, 1–32. [Google Scholar] [CrossRef]
- NIS. Population and Demographic Structure; National Institute of Statistics: Bucharest, Romania, 2021. [Google Scholar]
- NIS. Health, Education and Culture; National Institute of Statistics: Bucharest, Romania, 2015. [Google Scholar]
- Popa, A.-M.; Ioja, I.C.; Nita, M.R.; Onose, D.A. Urban Sustainability Assessment of Romanian Cities. Carpathian J. Earth Environ. Sci. 2022, 17, 373–386. [Google Scholar] [CrossRef]
- Lima, M.F.; Ward Thompson, C.; Aspinall, P.; Bell, S. Communities Facing Urban Depopulation: Exploring People’s Environmental Preferences. A Case Study of Lisbon, Portugal. Cities Health 2022, 6, 288–308. [Google Scholar] [CrossRef]
- Dej, M.; Janas, K.; Wolski, O. Towards Urban-Rural Partnerships in Poland Preconditions and Potential; Institute of Urban Development: Krakow, Poland, 2014. [Google Scholar]
- Breuste, J. Salzburger Stadtlandschaft—Der Lange Weg Vom Mythos Zum Konzept (Salzburg Urban Landscape—The Long Way from Myth to Concept). In Die Bedrohte Stadt. Strategien für Menschengerechtes Bauen in Salzburg (The Endangered City. Strategies for Human Building in Salzburg); Ferch, C., Luger, K., Eds.; Studienverlag: Innsbruck, Austria, 2014; pp. 250–278. [Google Scholar]
- Taczanowska, K.; Tansil, D.; Wilfer, J.; Jiricka-Pürrer, A. The Impact of Age on People’s Use and Perception of Urban Green Spaces and Their Effect on Personal Health and Wellbeing during the COVID-19 Pandemic—A Case Study of the Metropolitan Area of Vienna, Austria. Cities 2024, 147, 104798. [Google Scholar] [CrossRef]
- Ode Sang, Å.; Knez, I.; Gunnarsson, B.; Hedblom, M. The Effects of Naturalness, Gender, and Age on How Urban Green Space Is Perceived and Used. Urban For. Urban Green. 2016, 18, 268–276. [Google Scholar] [CrossRef]
- Lowe, S.; Tsenkova, S. Housing Change in East and Central Europe: Integration or Fragmentation? Ashgate: Farnham, UK, 2003; ISBN 978-0-7546-1814-0. [Google Scholar]
- Zhao, H.; Gu, B.; Zhou, L.; Li, X.; Gu, X. Evaluating the Demand for Urban Green Infrastructure: A Residential Perspective. Cities 2024, 153, 105271. [Google Scholar] [CrossRef]
- Qureshi, S.; Breuste, J.H.; Jim, C.Y. Differential Community and the Perception of Urban Green Spaces and Their Contents in the Megacity of Karachi, Pakistan. Urban Ecosyst. 2013, 16, 853–870. [Google Scholar] [CrossRef]
- Fan, W.; Yan, Z. Factors Affecting Response Rates of the Web Survey: A Systematic Review. Comput. Hum. Behav. 2010, 26, 132–139. [Google Scholar] [CrossRef]
- Soga, M.; Cox, D.T.C.; Yamaura, Y.; Gaston, K.J.; Kurisu, K.; Hanaki, K. Health Benefits of Urban Allotment Gardening: Improved Physical and Psychological Well-Being and Social Integration. Int. J. Environ. Res. Public Health 2017, 14, 71. [Google Scholar] [CrossRef]
- Joshi, N.; Wende, W. Physically Apart but Socially Connected: Lessons in Social Resilience from Community Gardening during the COVID-19 Pandemic. Landsc. Urban Plan. 2022, 223, 104418. [Google Scholar] [CrossRef] [PubMed]


| GI Components | ||||||||
|---|---|---|---|---|---|---|---|---|
| Suburban Case Study | Date of Construction | No. of Inhabitants | Surface (ha) | Distance to the City Center (Without Traffic) | Natural Green Areas with High Potential for Recreation (Within 15 min Walk) ha | Blue Areas (Within 15 min Walk) ha | Agricultural Landscapes (Within 15 min Walk) ha | |
| Poznań | Kamionki | 2006 | 700–800 | 34.64 | 35 min by car | 315.36 | 2.94 | 259.92 |
| Plewiska | 2002 | 1500–1700 | 17.82 | 25 min by car | 7.18 | 0 | 288.66 | |
| Salzburg | Elsbethen | 2009 | 350 | 1.53 | 20 min by car | 166.63 | 14.18 | 75.40 |
| Freilassing-Neuhofham | 2008 | 1000 | 55.23 | 20 min by car | 133.32 | 18.72 | 242.07 | |
| Bucharest | Cosmopolis | 2007 | >6500 | 25.41 | 30 min by car | 18.11 | 27.7 | 424.63 |
| Confort | 2007 | >4000 | 5.23 | 20 min by car | 5.9 | 7.23 | 308.26 | |
| 5 min | 15 min | |||||||||||
|---|---|---|---|---|---|---|---|---|---|---|---|---|
| Kamionki | Elsbethen | Cosmopolis | Plewiska | Freilassing | Confort City | Kamionki | Elsbethen | Cosmopolis | Plewiska | Freilassing | Confort City | |
| Built up | 1.81 | 37.31 | 0.00 | 62.23 | 30.92 | 3.12 | 0.06 | 29.50 | 5.11 | 37.79 | 34.28 | 18.30 |
| Under construction | 5.47 | 37.23 | 0.01 | 5.15 | 0.13 | 1.80 | 1.77 | |||||
| Landfill | 1.90 | |||||||||||
| Cemetery | 0.78 | |||||||||||
| Forest | 47.46 | 14.64 | 0.18 | 18.68 | 4.12 | 0.51 | 45.30 | 3.35 | 0.67 | 20.68 | 1.42 | |
| Agricultural | 45.25 | 48.48 | 47.58 | 37.79 | 44.99 | 92.76 | 0.42 | 20.50 | 78.45 | 60.57 | 37.54 | 74.10 |
| Water bodies | 15.01 | 0.00 | 3.86 | 5.12 | 2.90 | 1.74 | ||||||
| Park | 0.84 | |||||||||||
| Poznań | Salzburg | Bucharest |
|---|---|---|
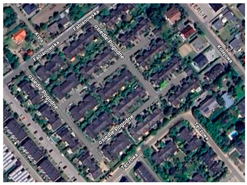
 | 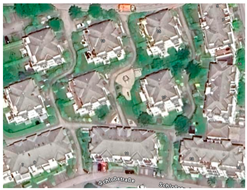 |  |
| Kamionki | Elsbethen | Cosmopolis |
 | 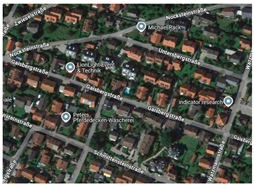 | 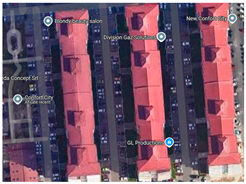 |
| Plewiska | Freilassing-Neuhofham | Confort |
| Case Studies Having High-Quality GI Components in Proximity. | Case Studies Having Low-Quality GI Components in Proximity | ||||||||
|---|---|---|---|---|---|---|---|---|---|
| Variables (%) | Kamionki (Poznań) | Elsbethen (Salzburg) | Cosmopolis (Bucharest) | p * | Plewiska (Poznań) | Freilassing-Neuhofham (Salzburg) | Confort (Bucharest) | p * | |
| Sex | Females | 60 | 54 | 62 | n.s. | 66 | 42 | 35 | <0.05 |
| Males | 40 | 46 | 38 | 34 | 58 | 65 | |||
| Age | <30 | 6 | 8 | 38 | <0.001 | 26 | 4 | 39 | <0.001 |
| 31–40 | 50 | 20 | 48 | 58 | 28 | 52 | |||
| 41–50 | 21 | 20 | 5 | 6 | 40 | 9 | |||
| >51 | 23 | 52 | 9 | 10 | 28 | 0 | |||
| Education | Professional | 6 | 28 | 5 | <0.001 | 4 | 60 | 9 | <0.001 |
| University | 75 | 40 | 95 | 82 | 30 | 74 | |||
| Employment | Full-time | 60 | 42 | 67 | n.s. | 40 | 70 | 61 | <0.001 |
| Former residence location | Center | 50 | 62 | 62 | n.s. | 36 | 70 | 43 | <0.01 |
| Outskirts | 50 | 38 | 38 | 64 | 30 | 57 | |||
| Former residence type | Collective | 89 | 62 | 81 | <0.01 | 78 | 84 | 96 | n.s. |
| Individual | 9 | 26 | 19 | 20 | 10 | 4 | |||
| Case Studies Having High-Quality GI Components in Proximity | Case Studies Having Low-Quality GI Components in Proximity | |||||||||||||||
|---|---|---|---|---|---|---|---|---|---|---|---|---|---|---|---|---|
| Variables (%) | Kamionki (Poznań) | Elsbethen (Salzburg) | Cosmopolis (Bucharest) | p * | Plewiska (Poznań) | Freilassing-Neuhofham (Salzburg) | Confort (Bucharest) | p * | ||||||||
| During the Week | At Weekends | During the Week | At Weekends | During the Week | At Weekends | During the Week | At Weekends | During the Week | At Weekends | During the Week | At Weekends | During the Week | At Weekends | During the Week | At Weekends | |
| Leisure time up to 5 h | 83 | 33 | 52 | 28 | 81 | 11 | <0.01 | n.s. | 78 | 20 | 88 | 42 | 91 | 5 | n.s. | <0.01 |
| Leisure time more than 5 h | 17 | 67 | 48 | 72 | 19 | 89 | 22 | 80 | 12 | 58 | 9 | 95 | ||||
| Private house—yes | 90 | 83 | 100 | 98 | 95 | 90 | n.s. | <0.05 | 86 | 67 | 100 | 100 | 96 | 96 | <0.05 | <0.001 |
| Private garden—yes | 88 | 92 | 36 | 38 | 76 | 48 | <0.001 | <0.001 | 53 | 45 | 98 | 98 | 35 | 39 | <0.001 | <0.001 |
| Community garden—yes | 6 | 6 | 0 | 0 | 62 | 48 | <0.001 | <0.001 | 20 | 49 | 4 | 2 | 43 | 61 | <0.001 | <0.001 |
| Secondary home—yes | 0 | 4 | 2 | 2 | 33 | 43 | <0.001 | <0.001 | 4 | 20 | 2 | 2 | 39 | 48 | <0.001 | <0.001 |
| Natural surroundings—yes | 21 | 33 | 72 | 86 | 57 | 62 | <0.001 | <0.001 | 33 | 69 | 60 | 82 | 48 | 65 | <0.05 | n0.s0. |
| Urban parks—yes | 50 | 13 | 24 | 38 | 67 | 67 | <0.01 | <0.001 | 37 | 67 | 14 | 16 | 65 | 78 | <0.001 | <0.001 |
| Variables (%) | Kamionki, Poznań | Elsbethen, Salzburg | Cosmopolis, Bucharest | p * | ||||||||
|---|---|---|---|---|---|---|---|---|---|---|---|---|
| Internal Green Amenities | In Proximity | Outside the Proximity | Internal Green Amenities | In Proximity | Outside the Proximity | Internal Green Amenities | In Proximity | Outside the Proximity | Internal Green Amenities | In Proximity | Outside the Proximity | |
| Several times per week | 62 | 32 | 15 | 58 | 62 | 10 | 75 | 42 | 5 | n.s. | n.s. | n.s. |
| Once per week | 10 | 35 | 12 | 10 | 12 | 16 | 25 | 53 | 17 | |||
| Several times per month | 5 | 19 | 27 | 8 | 8 | 36 | 0 | 5 | 39 | |||
| 1/2 times per month | 24 | 14 | 46 | 24 | 18 | 38 | 0 | 0 | 39 | |||
| Walk—Several times per week | 59 | 24 | 52 | 10 | 76 | 29 | <0.05 | <0.01 | ||||
| Walk—Once per week | 15 | 24 | 4 | 8 | 10 | 28 | ||||||
| Walk—Several times per month | 15 | 16 | 12 | 16 | 21 | 5 | ||||||
| Walk—1/2 times per month | 11 | 36 | 32 | 66 | 6 | 38 | ||||||
| Variables (%) | Plewiska, Poznań | Freilassing-Neuhofham, Salzburg | Confort, Bucharest | p * | ||||||||
|---|---|---|---|---|---|---|---|---|---|---|---|---|
| Internal Green Amenities | In Proximity | Outside the Proximity | Internal Green Amenities | In Proximity | Outside the Proximity | Internal Green Amenities | In Proximity | Outside the Proximity | Internal Green Amenities | In Proximity | Outside the Proximity | |
| Several times per week | 64 | 33 | 2 | 88 | 40 | 10 | 50 | 27 | 55 | <0.01 | n.s. | <0.001 |
| Once per week | 9 | 25 | 25 | 4 | 24 | 14 | 19 | 47 | 35 | |||
| Several times per month | 12 | 30 | 33 | 6 | 6 | 24 | 6 | 13 | 10 | |||
| 1/2 times per month | 15 | 13 | 40 | 2 | 30 | 52 | 25 | 13 | 0 | |||
| Walk—Several times per week | 63 | 13 | 34 | 8 | 61 | 35 | <0.01 | <0.01. | ||||
| Walk—Once per week | 10 | 33 | 24 | 10 | 22 | 17 | ||||||
| Walk—Several times per month | 21 | 23 | 8 | 22 | 4 | 17 | ||||||
| Walk—1/2 times per month | 6 | 31 | 34 | 60 | 13 | 31 | ||||||
| Case Studies Having High-Quality GI Components in Proximity | Case Studies Having Low-Quality GI Components in Proximity | |||||||
|---|---|---|---|---|---|---|---|---|
| Motivations () | Kamionki (Poznań) | Elsbethen (Salzburg) | Cosmopolis (Bucharest) | p * | Plewiska (Poznań) | Freilassing-Neuhofham (Salzburg) | Confort (Bucharest) | p * |
| Lack of natural areas | 1.22 | 1.18 | 1.90 | <0.01 | 3.27 | 1.34 | 3 | <0.001 |
| Low availability | 1.09 | 1.32 | 1.95 | <0.01 | 3.22 | 1.04 | 3.30 | <0.001 |
| Lack of security | 1.60 | 1.4 | 1.38 | n.s. | 1.98 | 1.16 | 2.87 | <0.001 |
| Bad quality of the area | 1.36 | 1.1 | 1.67 | <0.05 | 1.94 | 1.24 | 3.78 | <0.001 |
| Lack of recreation equipment | 1.38 | 1.72 | 1.57 | n.s. | 2.20 | 1.26 | 3.17 | <0.001 |
| Lack of organized events | 1.42 | 1.04 | 1.29 | <0.01 | 2.14 | 1.04 | 3.39 | <0.001 |
| Noise | 1.51 | 1.04 | 1.38 | <0.01 | 2.04 | 1.08 | 2.04 | <0.001 |
| No Time | 3.18 | 1.8 | 2.71 | <0.001 | 3.35 | 3.68 | 2.78 | <0.05 |
Disclaimer/Publisher’s Note: The statements, opinions and data contained in all publications are solely those of the individual author(s) and contributor(s) and not of MDPI and/or the editor(s). MDPI and/or the editor(s) disclaim responsibility for any injury to people or property resulting from any ideas, methods, instructions or products referred to in the content. |
© 2024 by the authors. Licensee MDPI, Basel, Switzerland. This article is an open access article distributed under the terms and conditions of the Creative Commons Attribution (CC BY) license (https://creativecommons.org/licenses/by/4.0/).
Share and Cite
Hossu, C.-A.; Breuste, J.; Iojă, I.-C.; Onose, D.A.; Vrînceanu, A.; Ponizy, L.; Zwierzchowska, I.; Kryger, R.; Mizgajski, A. The Use of Green Infrastructure in the Suburbs: Insights from Three European Cities. Land 2024, 13, 1862. https://doi.org/10.3390/land13111862
Hossu C-A, Breuste J, Iojă I-C, Onose DA, Vrînceanu A, Ponizy L, Zwierzchowska I, Kryger R, Mizgajski A. The Use of Green Infrastructure in the Suburbs: Insights from Three European Cities. Land. 2024; 13(11):1862. https://doi.org/10.3390/land13111862
Chicago/Turabian StyleHossu, Constantina-Alina, Jürgen Breuste, Ioan-Cristian Iojă, Diana Andreea Onose, Alexandra Vrînceanu, Lidia Ponizy, Iwona Zwierzchowska, Roksana Kryger, and Andrzej Mizgajski. 2024. "The Use of Green Infrastructure in the Suburbs: Insights from Three European Cities" Land 13, no. 11: 1862. https://doi.org/10.3390/land13111862
APA StyleHossu, C.-A., Breuste, J., Iojă, I.-C., Onose, D. A., Vrînceanu, A., Ponizy, L., Zwierzchowska, I., Kryger, R., & Mizgajski, A. (2024). The Use of Green Infrastructure in the Suburbs: Insights from Three European Cities. Land, 13(11), 1862. https://doi.org/10.3390/land13111862