Article

An Evaluation of Different Landscape Design Scenarios to Improve Outdoor Thermal Comfort in Shenzhen

1
School of Natural and Built Environment, Queen’s University Belfast, Belfast BT7 1NN, UK
2
Department of Landscape Architecture, Nanjing Agricultural University, Nanjing 210095, China
*
Author to whom correspondence should be addressed.
Land 2024, 13(1), 65; https://doi.org/10.3390/land13010065
Submission received: 29 November 2023 / Revised: 27 December 2023 / Accepted: 4 January 2024 / Published: 6 January 2024
(This article belongs to the Section Land Planning and Landscape Architecture)

Abstract

:
The pivotal role of urban greening in landscape design for mitigating climate change and enhancing the thermal environment is widely known. However, numerous evaluations of outdoor thermal comfort are seldom applied within the realm of landscape design scenarios. This study explores the relationship between street design and urban microclimate, aiming to propose a range of design strategies that can significantly improve thermal comfort within the street environment in Shenzhen, China. These design strategies hold immense potential for urban greening implementation and provide valuable insights to enhance the overall thermal quality of streetscapes in subtropical cities. The study employs landscape design and environmental simulation methods to evaluate the different design scenarios for the streetscape. The landscape design encompasses three scenarios with revised interventions: 1. the incorporation of building greening and enhanced pavement material albedo; 2. the introduction of trees and grass at the ground level; and 3. a combination of scenarios 1 and 2. Environmental simulations are utilized to assess the effectiveness of each design scenario. The findings reveal that increasing urban vegetation leads to a reduction in urban heat and significantly improves outdoor thermal comfort. Moreover, the incorporation of shade-providing trees proves to be more efficacious than employing vertical greening in alleviating outdoor thermal discomfort.

1. Introduction

The rapid development and high population density of China’s cities are changing the urban landscape. This presents both opportunities and challenges for sustainable urbanization [1,2]. While the adoption of the high-density development pattern brings numerous benefits, it also gives rise to various environmental challenges, particularly related to climate and the overall urban environment. Prominent among these challenges are the urban heat island (UHI) effect, the degradation of urban microclimates and air quality, increased building energy consumption, and an intensified greenhouse effect [3,4]. Particularly, the expansion of urban buildings and the arrangement of urban areas significantly affect the local and urban-scale surface energy balance and airflow [5]. These alterations alter the thermal environment within the city, potentially exacerbating the UHI effect, which has a great impact on thermal comfort.
‘Thermal comfort’ refers to the concept of experiencing a satisfactory and stress-free thermal environment within buildings [6]. This encompasses physical well-being, thermal well-being, and overall satisfaction with the thermal conditions [7]. The factors influencing thermal comfort can be categorized into environmental factors, such as air temperature, radiant temperature, wind speed, and relative humidity, and personal factors, including clothing and metabolism [8,9,10,11]. While thermal comfort has been the subject of research for over a century, most of the studies have predominantly focused on indoor environments [12]. Consequently, research on thermal comfort in outdoor environments remains relatively limited [13]. In the absence of empirical thermal comfort studies and models directly relevant to outdoor situations, there has been an assumption that the conventional theory of thermal comfort developed for indoor applications can be generalized to outdoor settings without modification [14]. However, this assumption has been proven to be inappropriate based on research findings [12]. Due to the great complexity of the outdoor environment, in terms of variability, temporally and spatially, as well as the great range of activities people are engaged in, there have been very few attempts to understand comfort conditions outside [14].
Outdoor comfort plays a crucial role in assessing a city’s livability and promoting the health and well-being of its residents [15]. The consideration of outdoor human comfort is vital for urban planners and building designers seeking to create sustainable urban environments, especially in regions facing extreme climates [15,16]. Over recent years, the study of outdoor thermal comfort has witnessed significant expansion, with a substantial body of literature investigating the impact of urban design scenarios on the microclimate conditions of urban spaces through both simulation and field studies [17]. Several review studies have reviewed outdoor thermal comfort in different contexts. For example, Lai et al. (2014) studied outdoor thermal comfort under different climate conditions using the methods of microclimatic monitoring and questionnaire surveys at a park in Tianjin, China [18]. The outcomes revealed a neutral physiological equivalent temperature (PET) range of 11–24 °C. Notably, this range was observed to be lower than comparable studies conducted in Europe and Taiwan. The findings suggested a greater adaptation of Tianjin residents to colder environmental conditions [18]. Acero et al. (2019) conducted a comprehensive analysis of the influence of vertical green systems (VGSs) on outdoor climate variables and thermal comfort through environment simulation [19]. The findings indicate that weather conditions exert a significant impact on the outdoor thermal performance of VGSs in the specific context of Singapore [19]. Abdollahzadeh and Biloria (2020) investigated an assessment of the thermal performance of streets in residential zones located in Liverpool, New South Wales, Australia. Their investigation revealed that outdoor thermal comfort directly influences the health and well-being of individuals occupying these outdoor spaces [20].
Moreover, in the context of recent studies on the UHI effect, an exploration of the relationship between landscape configuration and the urban thermal environment has been undertaken. Lin et al. (2024) contribute to advancing the comprehension of the spatiotemporal correlation between the morphological characteristics of built-up areas and UHI intensity [21]. Using Shenzhen as a case study, the research undertakes an analysis of UHI intensity and the morphological characteristics of built-up areas based on multi-temporal remote sensing data. The findings of this study offer valuable insights for urban planners, highlighting the significance of considering morphological characteristics in the early stages of thermal environment design [21]. In a related review, Petzold and Mose (2023) shed light on a bias toward natural science studies in the domain of urban greening, with a particular emphasis on Asian and European cities [22]. Their review additionally emphasizes a noticeable gap in the evaluation of socio-economic contexts and the accessibility of urban greening structures. This observation underscores the need for a more holistic approach to the study of urban greening, addressing not only environmental but also socio-economic dimensions [22]. While these studies contribute to the growing body of knowledge on outdoor thermal comfort and its implications for urban environments and human well-being, they have not yet been applied in the field of landscape design. To bridge this gap, further research is warranted to investigate the precise impact of design interventions on outdoor thermal comfort and to gain deeper insights into the role of landscape elements in contributing to cooling effects within urban areas.
It is crucial to recognize that the climate generated by urban landscapes exerts a substantial impact on various factors, including human comfort, air quality, and energy consumption [23,24]. Adopting appropriate landscape design strategies is pivotal for enhancing outdoor thermal comfort, mitigating heat stress, and creating more sustainable urban environments. A substantial body of studies underscores the imperative of a profound understanding that embraces a diverse range of physical and social considerations when formulating design strategies to effectively address this crucial aspect [25]. To achieve this, models and techniques utilized for thermal comfort analysis must cater to the specific requirements of urban planners and designers, while concurrently ensuring a precise representation of microclimate parameters. Scholars have advocated for the effective alleviation of this issue through two main approaches: augmenting the proportion of urban green spaces and optimizing the arrangement of landscape parameters, which has been a focal point of research in the past decade [26]. These landscape parameters encompass various elements such as vegetation, water bodies, hardened ground, buildings, and urban green infrastructure [24,26]. However, the leading implementation tool for improving the urban climate to achieve sustainability is derived from vegetation [24,27]. Vegetation actively cools the environment through the processes of evaporation and evapotranspiration, achieved by vaporizing water released from the leaves [27,28]. Additionally, it provides passive cooling by shading surfaces that would absorb short-wave radiation [28]. However, the optimal arrangement of landscapes to effectively counter UHI effects remains uncertain. This uncertainty arises due to the divergent impacts of configuration across varying locations, attributed to climatic diversity, seasonal fluctuations, specific times of day, and geographical placement [29,30,31]. For instance, Yuan et al. (2022) assessed outdoor thermal comfort under different building external wall surfaces with different reflective directional properties through simulation and model experiments in Osaka, Japan [32]. The authors conclude that the application of highly reflective surface materials in building facades and roofs can potentially improve the outdoor environment and minimize the UHI phenomenon [32]. A literature study by Irfeey et al. (2023) examines the advantages of incorporating green infrastructure and sustainable materials into urbanized areas as a means of alleviating the UHI effect [33]. The study identifies the role of sustainable materials and various forms of green infrastructure, such as green roofs, green walls, green parking, pavements, and shaded streets, in mitigating the impact of the UHI effect [33]. Hence, numerous greening initiatives and methodologies can be considered feasible for implementation. The adoption of suitable landscape design strategies is crucial for improving outdoor thermal comfort, alleviating heat stress, and fostering the development of more sustainable urban environments.
This study aims to quantitatively evaluate the cooling effect of landscape design on outdoor thermal comfort while identifying the pivotal landscape elements that significantly contribute to this cooling effect. The paper specifically focuses on two key research questions: (1) how do the surrounding landscape patterns impact the study area? (2) How can the utilization of design scenarios optimize outdoor thermal comfort within the context of environmental design? The findings from this study will offer novel insights for urban landscape design and planning, particularly in the context of utilizing landscape design to mitigate UHI effects and enhance outdoor thermal comfort.

2. Materials and Methods

2.1. Study Area

The study was conducted in Shenzhen (113°510–114°210 E, 22°270–22°390 N), China. Shenzhen is one of the world’s megacities, with a population of 17.56 million in 2020 [16]. Shenzhen has a subtropical climate, with mild winters and hot and humid summers [31]. The interest domain of the current study located on Wanxia Road in the Wanxia neighborhood, Shenzhen, China, spans an area of 289 m × 208 m. It is situated at the entrance of the Wanxia neighborhood; this area was chosen due to its representative characteristics, with it encompassing diverse street scales and orientations. Moreover, it serves as a significant transportation hub for residents year-round. The street features limited green spaces, surrounded by avenues, streets, and multi-story buildings. The study area is shown in Figure 1.

2.2. Method

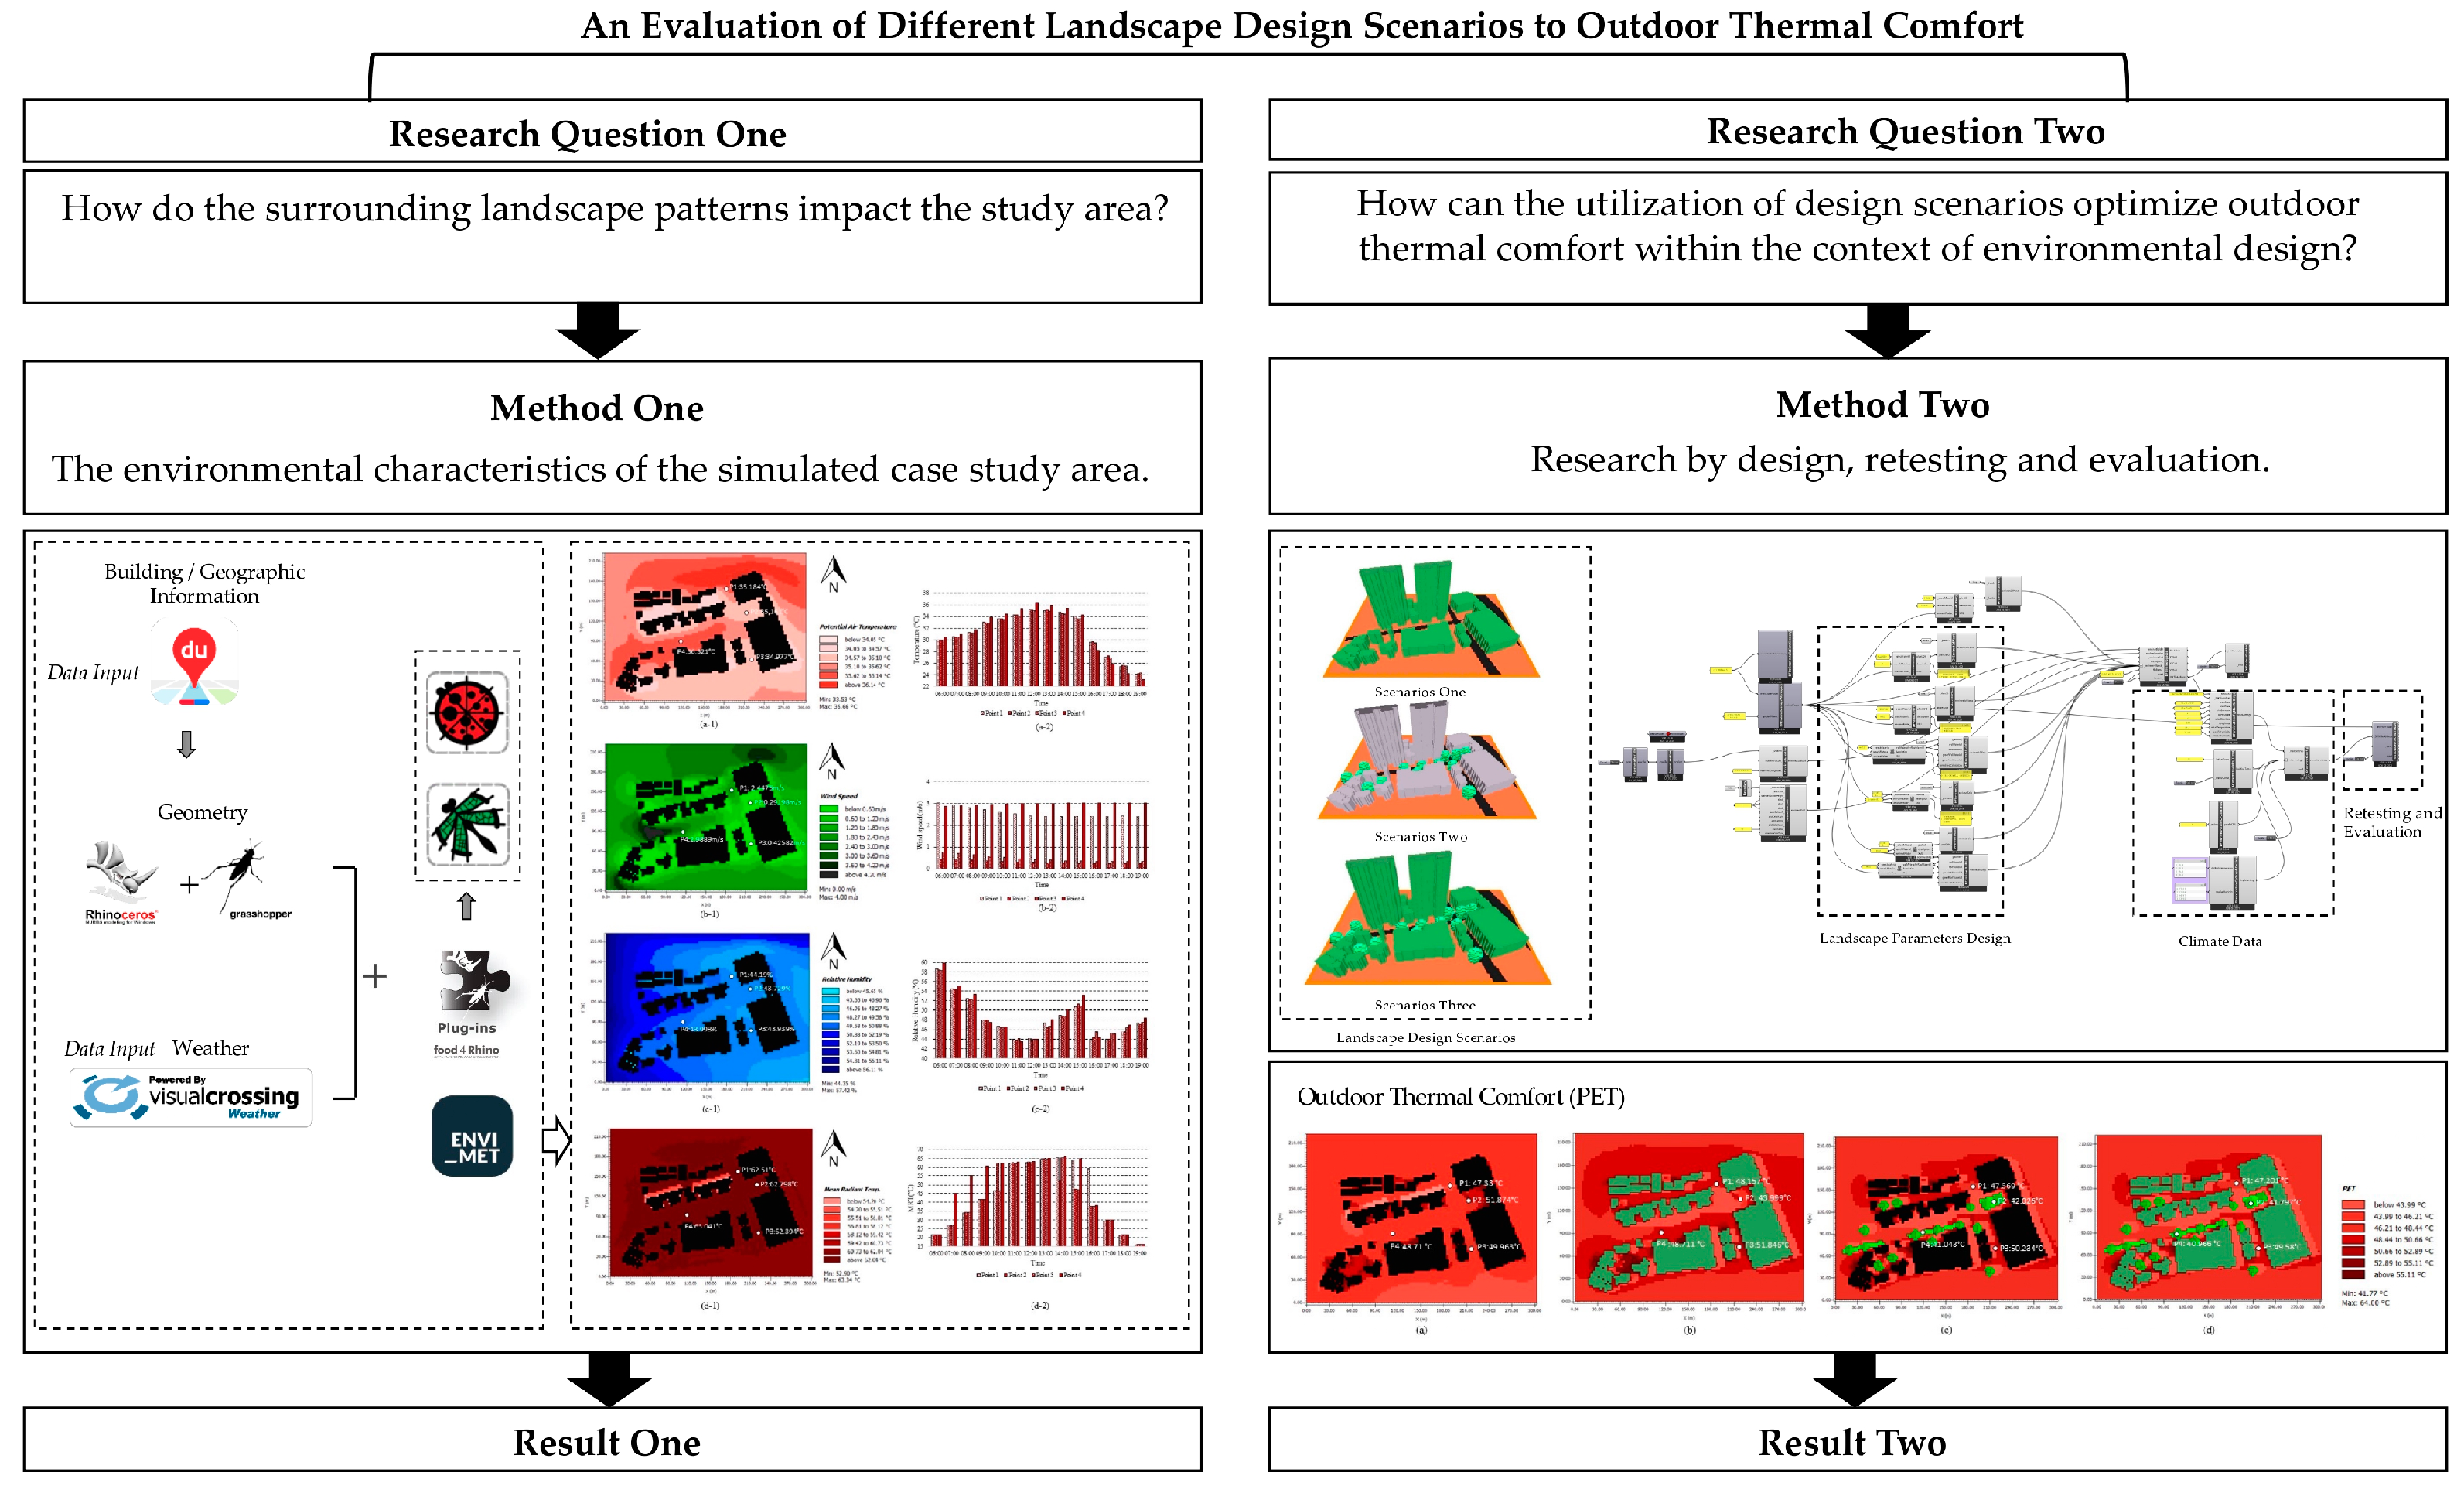
This section presents the methodological framework, which aims to investigate the current state of the research site through software simulation as the first step. Subsequently, a research-by-design approach is proposed and retested based on the findings from the first step. Finally, the results are compared with a control group, represented by a simulated model of the basic case without the landscape parameters. Figure 2 illustrates the two-step methodological framework utilized in this study. Each step is designed to address specific research questions, as detailed below.
  • Method one: the environmental characteristics of the simulated case study area
The first step involves a thorough exploration of the existing conditions of the study through advanced software simulation. This simulation aids in comprehending the current state of the landscape, serving as the foundation for subsequent investigations. This simulation process serves as a fundamental step in gaining a holistic understanding of the current state of the landscape, laying the groundwork for subsequent investigative endeavors.
  • Method two: design, retesting, and evaluation
Building upon the insights gained in the initial step, the study proposes a research-by-design approach to address the identified issues. Research by design is both the study of design and the process of knowledge production that occurs through the act of design [34]. Additionally, it involves the evaluation and analysis of completed designs, either explicitly or implicitly within a known context, often in the form of comparative studies [34]. Research by design as an iterative process of designing, testing, and refining is central to the research methodology. During this iterative cycle, the proposed design ideas are tested, and subsequent adjustments are made based on the outcomes of these tests [35]. The refined designs are then retested, and this iterative process continues until a satisfactory solution is achieved [35]. This iterative process allows for the development of innovative landscape design solutions. Three different design scenarios were proposed in this step. After implementing the proposed design interventions, retesting is conducted to evaluate their efficacy and performance.
Upon the implementation of the proposed design interventions, retesting is conducted to evaluate the efficacy and performance of each scenario [36]. It seeks to culminate in the identification of optimal design strategies that effectively enhance outdoor thermal comfort. This evaluation process ensures that the chosen design solutions align with the research objectives and contribute to sustainable and impactful landscape design outcomes. By combining design scenario testing and evaluation, the research-by-design approach allows for the generation of evidence-based, practical, and context-specific landscape design solutions. The results obtained from step two were compared with those of a control group to assess the impact of the research by the design interventions.

2.3. Software and Data Used in the Study

To assess various landscape design scenarios aimed at enhancing outdoor thermal comfort in Shenzhen, multiple environmental simulations were employed. A range of environmental simulation models, including the OTC Model, SOLWEIG model, TownScope, Rayman, Ecotect, and ENVI-met, can be utilized for evaluation purposes [37]. However, for urban design simulations, ENVI-met V5.5 software is chosen due to its capacity to offer decision support for design and planning [38]. Nevertheless, the utilization of ENVI-met software is not without limitations, particularly during the early phases of space establishment in the design process. Adjustments to the design necessitate corresponding modifications to the model, resulting in additional workload. In addressing this issue, the current study enhances the design process by establishing an optimized connection between the 3D model and the ENVI-met software through Grasshopper, a “graphical algorithm editor” plugin for Rhino 7 [39,40]. The original 3D model generated the geometry of the buildings with Grasshopper and converted them into ENVI-met buildings using Dragonfly, a plugin of Grasshopper [41]. Subsequently, the original model was subjected to environment simulation using ENVI-met V5.5. This method was selected because of its ability to facilitate model variations, enabling swift modifications to building materials or shapes with minimal effort, avoiding the need for a complete model to rebuild the model from scratch [16].

Model Description and Data Collection

The SPACES module of ENVI-met V5.5 software was used to model the case study area. The model information includes the initial environmental parameters (Table 1). Meteorological data such as hourly temperature, relative humidity, wind speed, and wind direction are required for simulations. These parameters were provided by Visualcrossing (Table 2). In addition, ENVI-met calculates incident solar radiation based on latitude, longitude, date, and time. To address the adverse effects of excessive heat during the summer, particularly in densely populated urban areas, the study day was set to 22 July 2022, a typical summer day of the year. To ensure data stability, the simulation period was set from sunset (6:00 a.m.) to sunrise (19:00 p.m.) for a duration of 13 h. Based on the actual site size, the X, Y, and Z axes of the model were set at 101, 74, and 60 grids with a three-meter resolution, respectively. A mesh size of 3 m × 3 m × 3 m was set to provide a sufficient resolution for the analysis within a reasonable timeframe, given the computing resources and the required level of detail [42,43].
The study utilized geographic information data obtained from Baidu Map, an extensively used online map and navigation system in China [44]. The weather data were obtained from Visual Crossing Weather [45]. Visual Crossing Weather is the easiest-to-use and lowest-cost source for historical and forecast weather data. The detailed simulation parameters are shown in Table 1 and Table 2.
In this study, the model data extracted within the framework were derived from disparate streets intersecting at perpendicular angles, each characterized by varying street scales. The designated elevation for data extraction was set at 1.5 m, aligning with considerations at the pedestrian level. Four specific test points were strategically chosen for the purpose of comparative analysis. Point 1 is positioned on the northern side of the entrance to the test area, while Point 2 is located on the eastern side, originally designated for car parking. Point 3 is situated on the southern side of the test area’s entrance, and Point 4 is positioned on the western side of the road. Figure 3 provides a visual representation of the designated pickup points within the 3D model.

2.4. Landscape Design and Retest

The scenario design is based on the assessment of the prevailing thermal comfort conditions on a representative sunny summer day, thereby replicating the existing urban square configuration, encompassing buildings, roads, and public spaces.
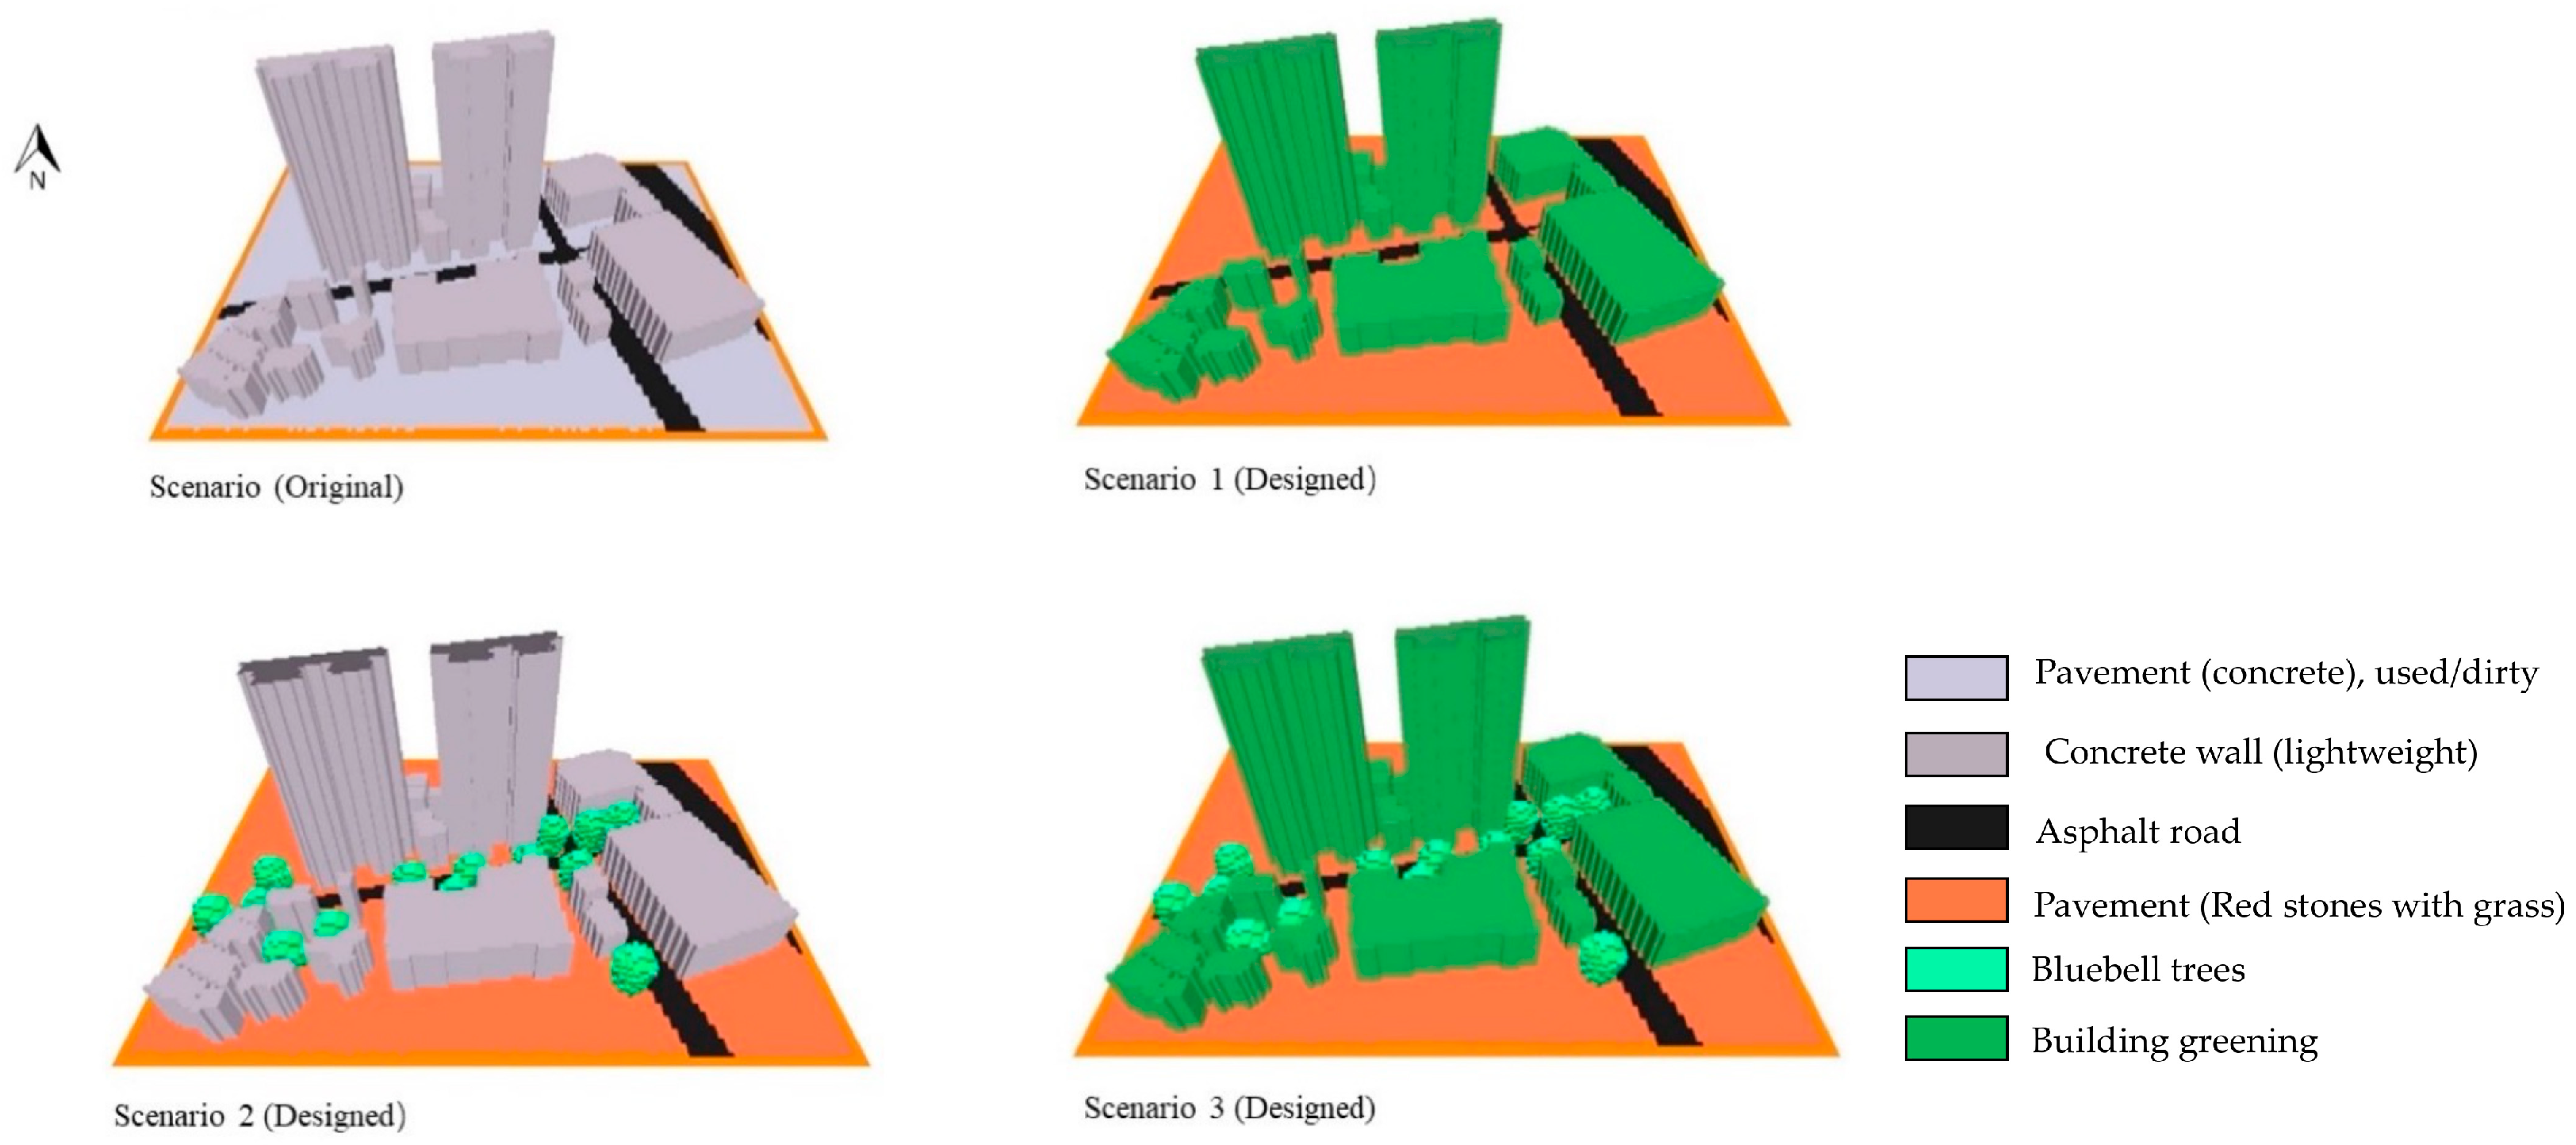
Three proposed scenarios were formulated, considering variables influencing thermal comfort in outdoor environments. These scenarios and their respective attributes are delineated in Figure 4.
Scenario 1 is devised to evaluate the cooling impact of building greening on the microenvironment. The specific design entails the augmentation of greenery on buildings and the enhancement of pavement material (red stones with grass) albedo.
Scenario 2 seeks to assess the efficacy of Bluebell trees (with a height of 1.86 m) in achieving a targeted thermal comfort level. This involves the integration of planting designs featuring indigenous tree species and grass (with a height of 0.25 m) at the pedestrian level. The pavement also enhances the material albedo by transitioning from concrete materials to red stones with grass.
Scenario 3 represents a synthesis of Scenario 1 and Scenario 2, with the objective of identifying the optimal thermal comfort conditions in the given case study.

2.5. Evaluation: Outdoor Thermal Comfort Indices

The outdoor thermal comfort calculations are based on simulation data provided by Bio-met, a plugin in ENVI-met [38]. BIO-met is a post-processing tool to calculate human Thermal Comfort and Thermal Comfort Indices based on one’s simulation data. BIO-met supports PMV/PPD (predicted mean vote), PET* (physiological equivalent temperature reviewed), PET dynamic PET, the UTCI (Universal Thermal Climate Index), and the SET* (standard effective temperature), but more are likely to be integrated [38]. The indices vary in their level of complexity and therefore calculation time. While the UTCI is regression-based and quick, the PMV requires the iterative solution of one energy balance equation and the PET requires the solution of two of them and is hence much more calculation-time-expensive [38]. BIO-met supports parallel calculation to speed up the simulations. In contrast to the calculation method mentioned, PET stands out as an apt choice for evaluating outdoor thermal comfort. This is primarily attributed to its inclusion of both short-wave and long-wave radiation fluxes within outdoor environments. However, it is imperative to acknowledge that the PET calculation procedure entails a relatively greater time investment.
PET has been developed to understand the integral impact of meteorological parameters on the perceptions of the layperson. PET can be defined as the air temperature without wind speed and solar radiation (indoor) at which the heat balance of the human body is maintained with the same core and skin temperature as under the conditions quantified in the outdoor thermal environment [46]. The calculated equation is derived from the energy balance equation between the human body and the environment, known as the Munich Energy-Balance Model for Individuals (MEMI) [46]. The PET value represents the air temperature equivalent at which a person (male, 35 years; 1.75 m, 75 kg) would feel the same as under actual circumstances (work activity 80 W, clothing heat resistance Iclo = 0.3, radiant temperature equal to air temperature (Tmrt = T), velocity 0.1 m/s, and water vapor pressure 12 hPa) if they were indoors and not active. A PET value is used as an indicator of a person’s thermal sensation [46]. Table 3 displays the PET range, which indicates a comfortable range between 18 °C and 23 °C. PET values above or below this range indicate hot or cold discomfort, respectively.

3. Results

3.1. Simulation Results of Environmental Characteristics

ENVI-met simulations were conducted to analyze various parameters, including local ambient temperature, relative humidity, wind speed, mean radiant temperature, and outdoor thermal comfort at the pedestrian level. The visualization maps were generated at 12:00 p.m., midday. The simulation results are presented below, comparing the maps of local ambient temperature, relative humidity, mean radiant temperature, wind speed, and outdoor thermal comfort for the four test points in the different test periods.

3.1.1. Local Ambient Temperature

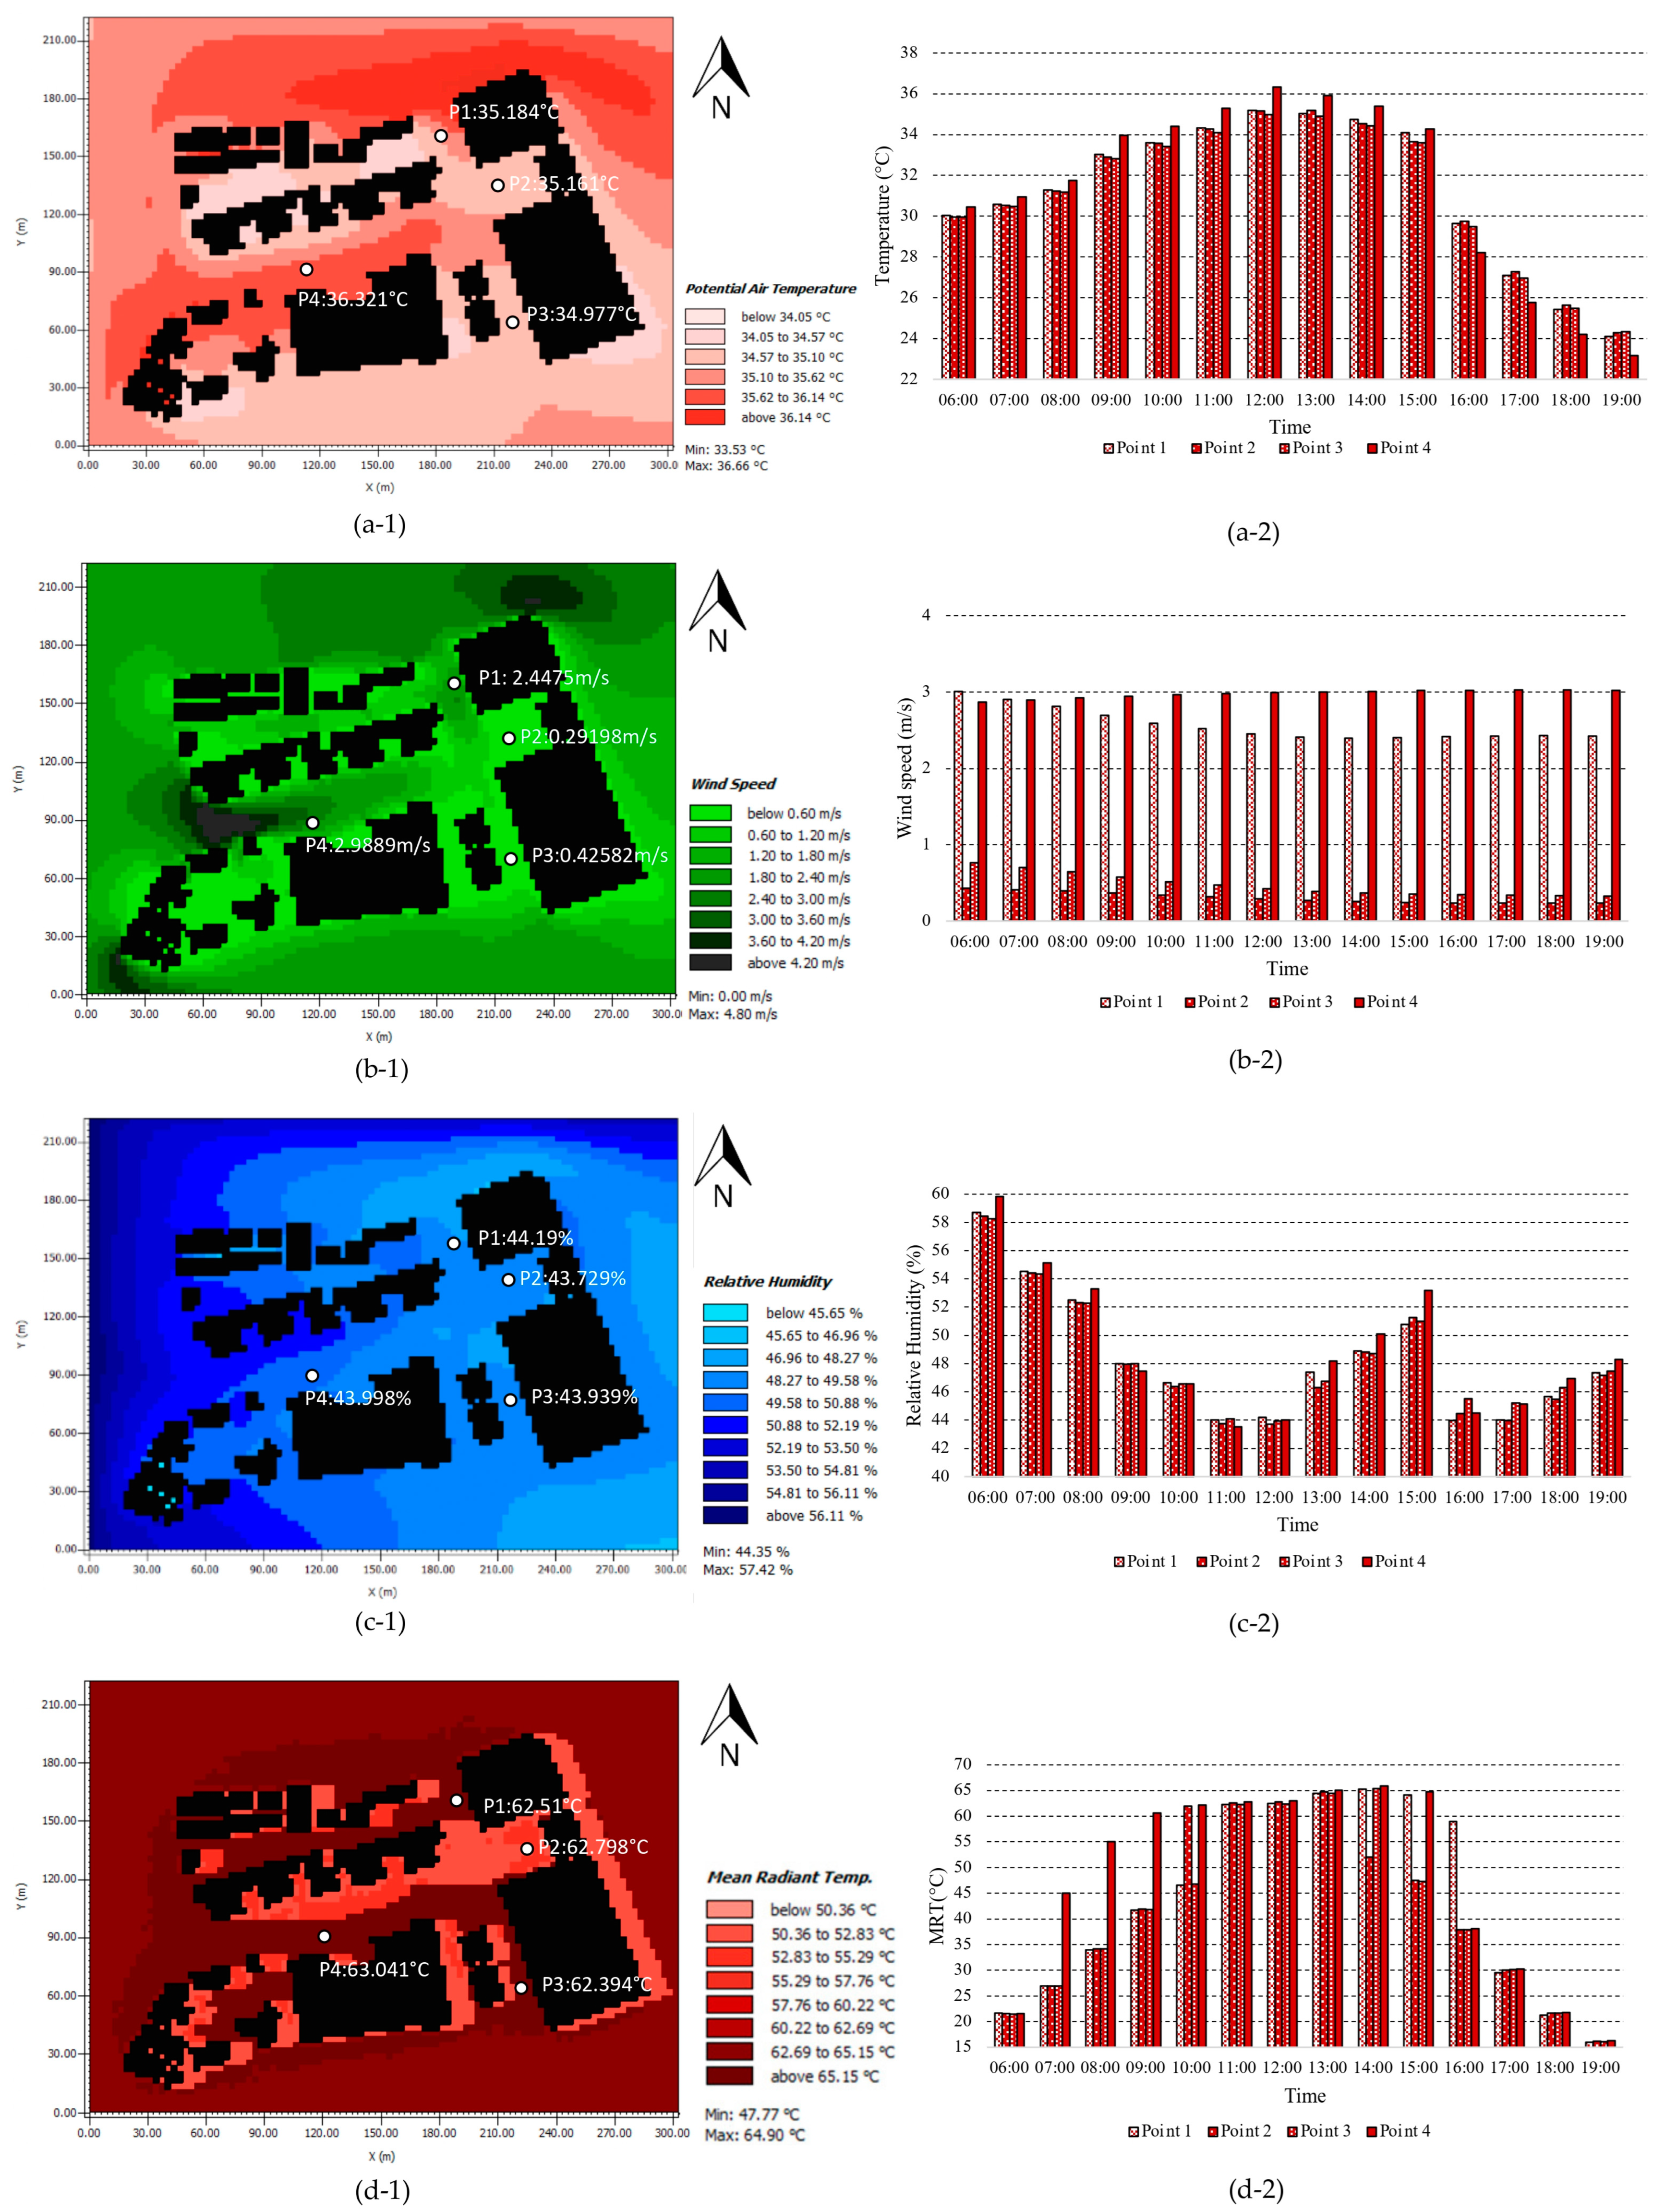
The simulation results shown in Figure 5 illustrate the variations in local ambient temperature at the four designated test points during the period spanning from 06:00 a.m. to 19:00 p.m. on 22 July 2022. Upon a thorough analysis of the data, a consistent and conspicuous upward trend in local ambient temperature becomes evident across all test areas from 06:00 a.m. to 12:00 p.m. Subsequently, this trend is followed by a uniform and discernible decrease in temperature from 12:00 p.m. to 19:00 p.m. A noteworthy observation on Point 4, where the temperature reaches 36.321 °C, is that its peak is at 12:00 p.m. Through a comparative analysis, it is discernible that the local ambient temperature at Point 4 marginally exceeds that of the other test points. This divergence is attributed to the absence of architectural shading along the expansive roadway. Thus, this finding implies that a higher presence of compact structures and buildings leads to an enlarged shading area, thereby contributing to a reduction in the local ambient temperature at the pedestrian level.

3.1.2. Relative Humidity

The simulation outcomes reveal noteworthy fluctuations in relative humidity across distinct time intervals within the designated test area. Relative humidity exhibits a tendency to culminate at 6:00 a.m., coinciding with the sun’s ascent during the test periods. Specifically, the highest relative humidity level is attained during the early morning hours, followed by a decrease to its nadir at midday and subsequent re-elevation at 13:00 p.m. A secondary peak is observed at 15:00 p.m., succeeded by a subsequent decline at 16:00 p.m., followed by yet another increase. The pinnacle of relative humidity, measuring 59.818%, is recorded at 6:00 a.m. at Point 4. Conversely, the lowest relative humidity value of 43.729% is recorded at 12:00 p.m. at Point 2.

3.1.3. Wind Speed

Throughout the duration of the designated testing period, with an initial prevailing wind direction of 300°, the meteorological conditions at points 2 and 3 under investigation prominently demonstrated subdued wind dynamics. This phenomenon can be primarily attributed to the constricted interstitial intervals prevailing amidst architectural structures. This distinctive spatial configuration significantly impeded the unimpeded mobilization of air masses, consequently culminating in wind velocities approaching a state of minimal magnitude. In contrast, points 1 and 4 revealed wind velocities surpassing the threshold of 2.4 m/s. This variation in wind behavior is elucidated by the fact that these two points are situated within wider streets and enjoy more unobstructed access within the community. It can be deduced that the wind speed is notably influenced by factors such as the spacing between buildings and the prevailing wind direction. The discernible dissimilarity in wind behaviors between these points can be attributed to the aforementioned geographical and architectural considerations.

3.1.4. Mean Radiant Temperature

The simulation outcomes unveiled noteworthy fluctuations in the mean radiant temperature (MRT) over the course of the testing phase. The spatial distribution of the MRT across the study area elucidated distinctly manifested heightened levels of solar irradiation at the four points. On the test date of 22 July 2022, the pinnacle of thermal absorption stemming from solar radiation was manifested in the form of the maximal MRT, which amounted to 65.901 °C, and was discerned at Point 4 at around 14:00 p.m. Conversely, a marked reduction in radiative warmth was observed during the sunset hours, with the nadir of MRT levels registering at 15.938 °C at the aforementioned point.

3.1.5. Outdoor Thermal Comfort (PET)

The assessment of outdoor thermal comfort, as inferred through the PET index, offers pivotal insights into the prevailing thermal conditions at the designated test locations. These findings hold significant value in shaping urban design strategies and interventions aimed at augmenting pedestrian comfort and well-being. The comfort threshold, delineated by temperatures spanning from 18 °C to 23 °C, serves as a reference point for optimal thermal perception. Nonetheless, it is noteworthy that most of the assessed areas exhibited thermal conditions falling within the ambit of heat stress, indicative of potential discomfort and heightened susceptibility to heat-related challenges.
Upon scrutinizing the four points at the pedestrian level (1.5 m), the simulation outcomes using the foundational model, as presented in Figure 6, underscore that PET values across all points witnessed an incremental ascent from 6:00 a.m. until 13:00 p.m. Subsequently, a gradual decline in overall PET values ensued. The highest PET value, measuring 53.754 °C, was notably recorded at Point 4 at 13:00 p.m. Conversely, the nadir PET value, measuring 16.8 °C, was observed at Point 1 around 6:00 a.m.

3.2. Evaluation: Original Area and Design Areas

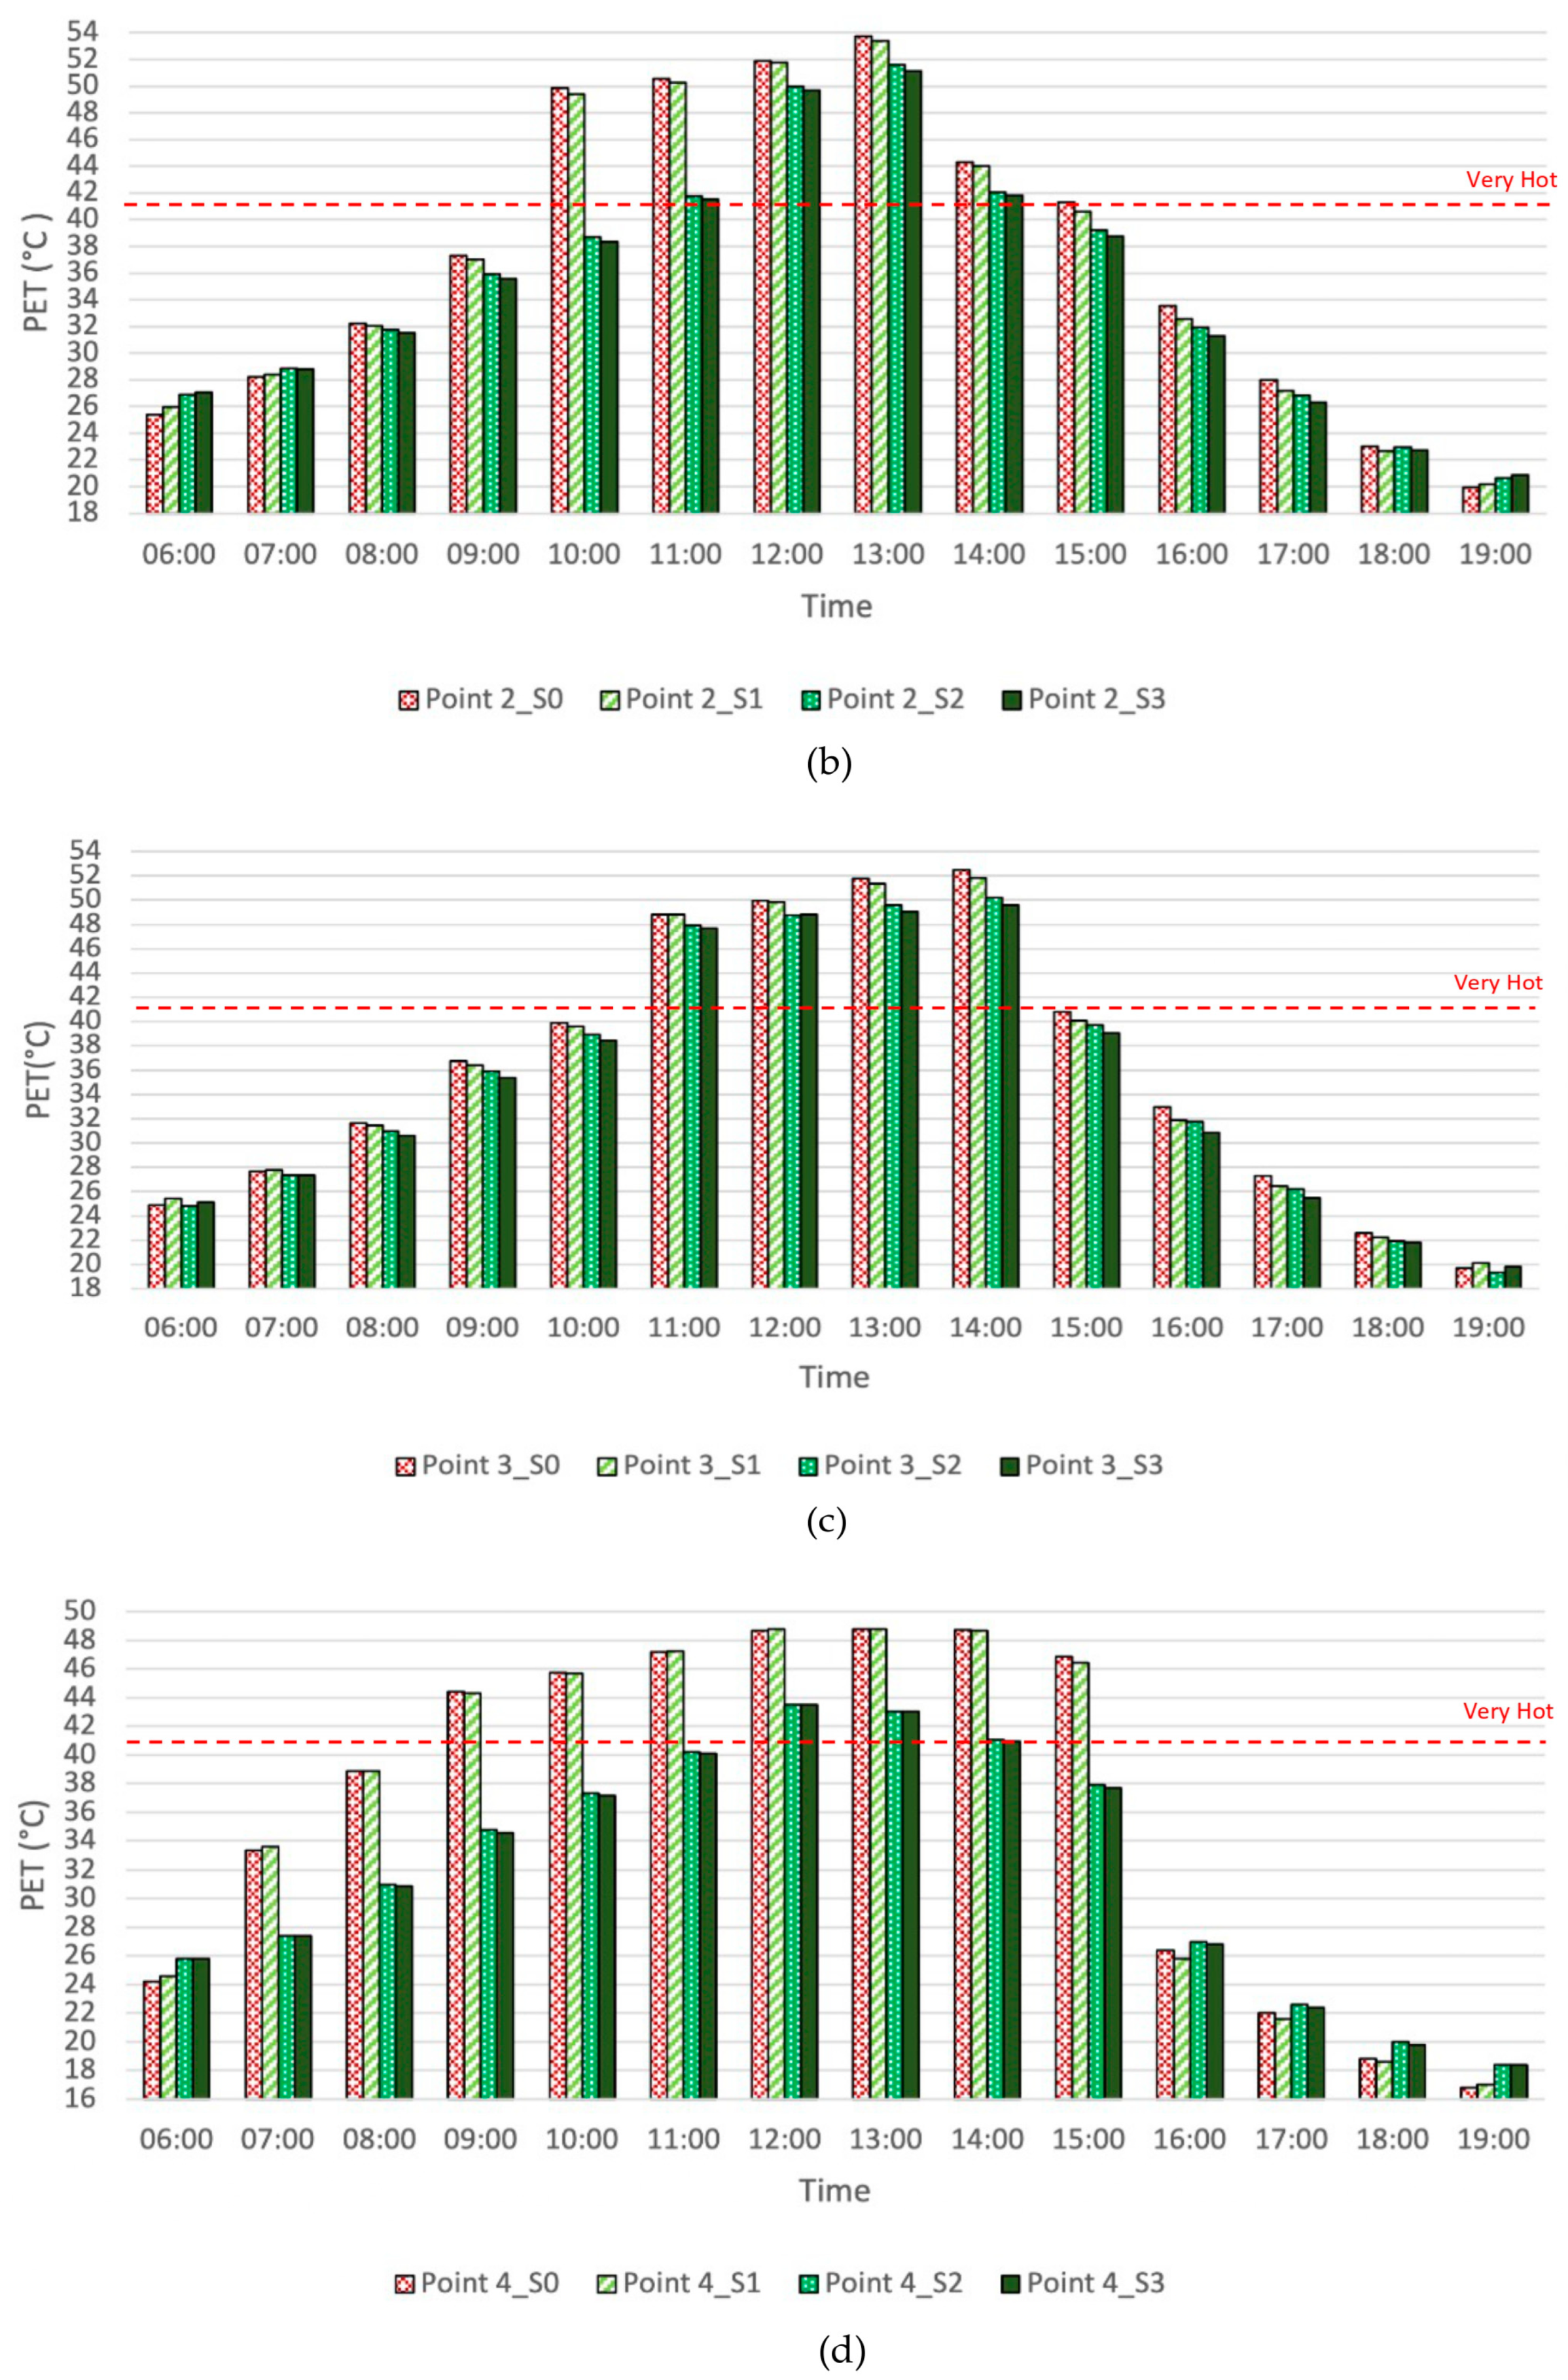
The simulation results present compelling substantiation of the ameliorative impact of landscape design on outdoor thermal comfort. The evaluation of outdoor thermal comfort encompassed four distinct pedestrian level (1.5 m) locales designated as “P1”, “P2”, “P3”, and “P4”. As shown in Figure 7, the visualization of the outdoor thermal comfort index at 12:00 p.m. underscores that the incorporation of vertical greening and green streets in the nature-based solutions (NBS) design scenarios markedly enhanced the thermal contentment of open spaces.
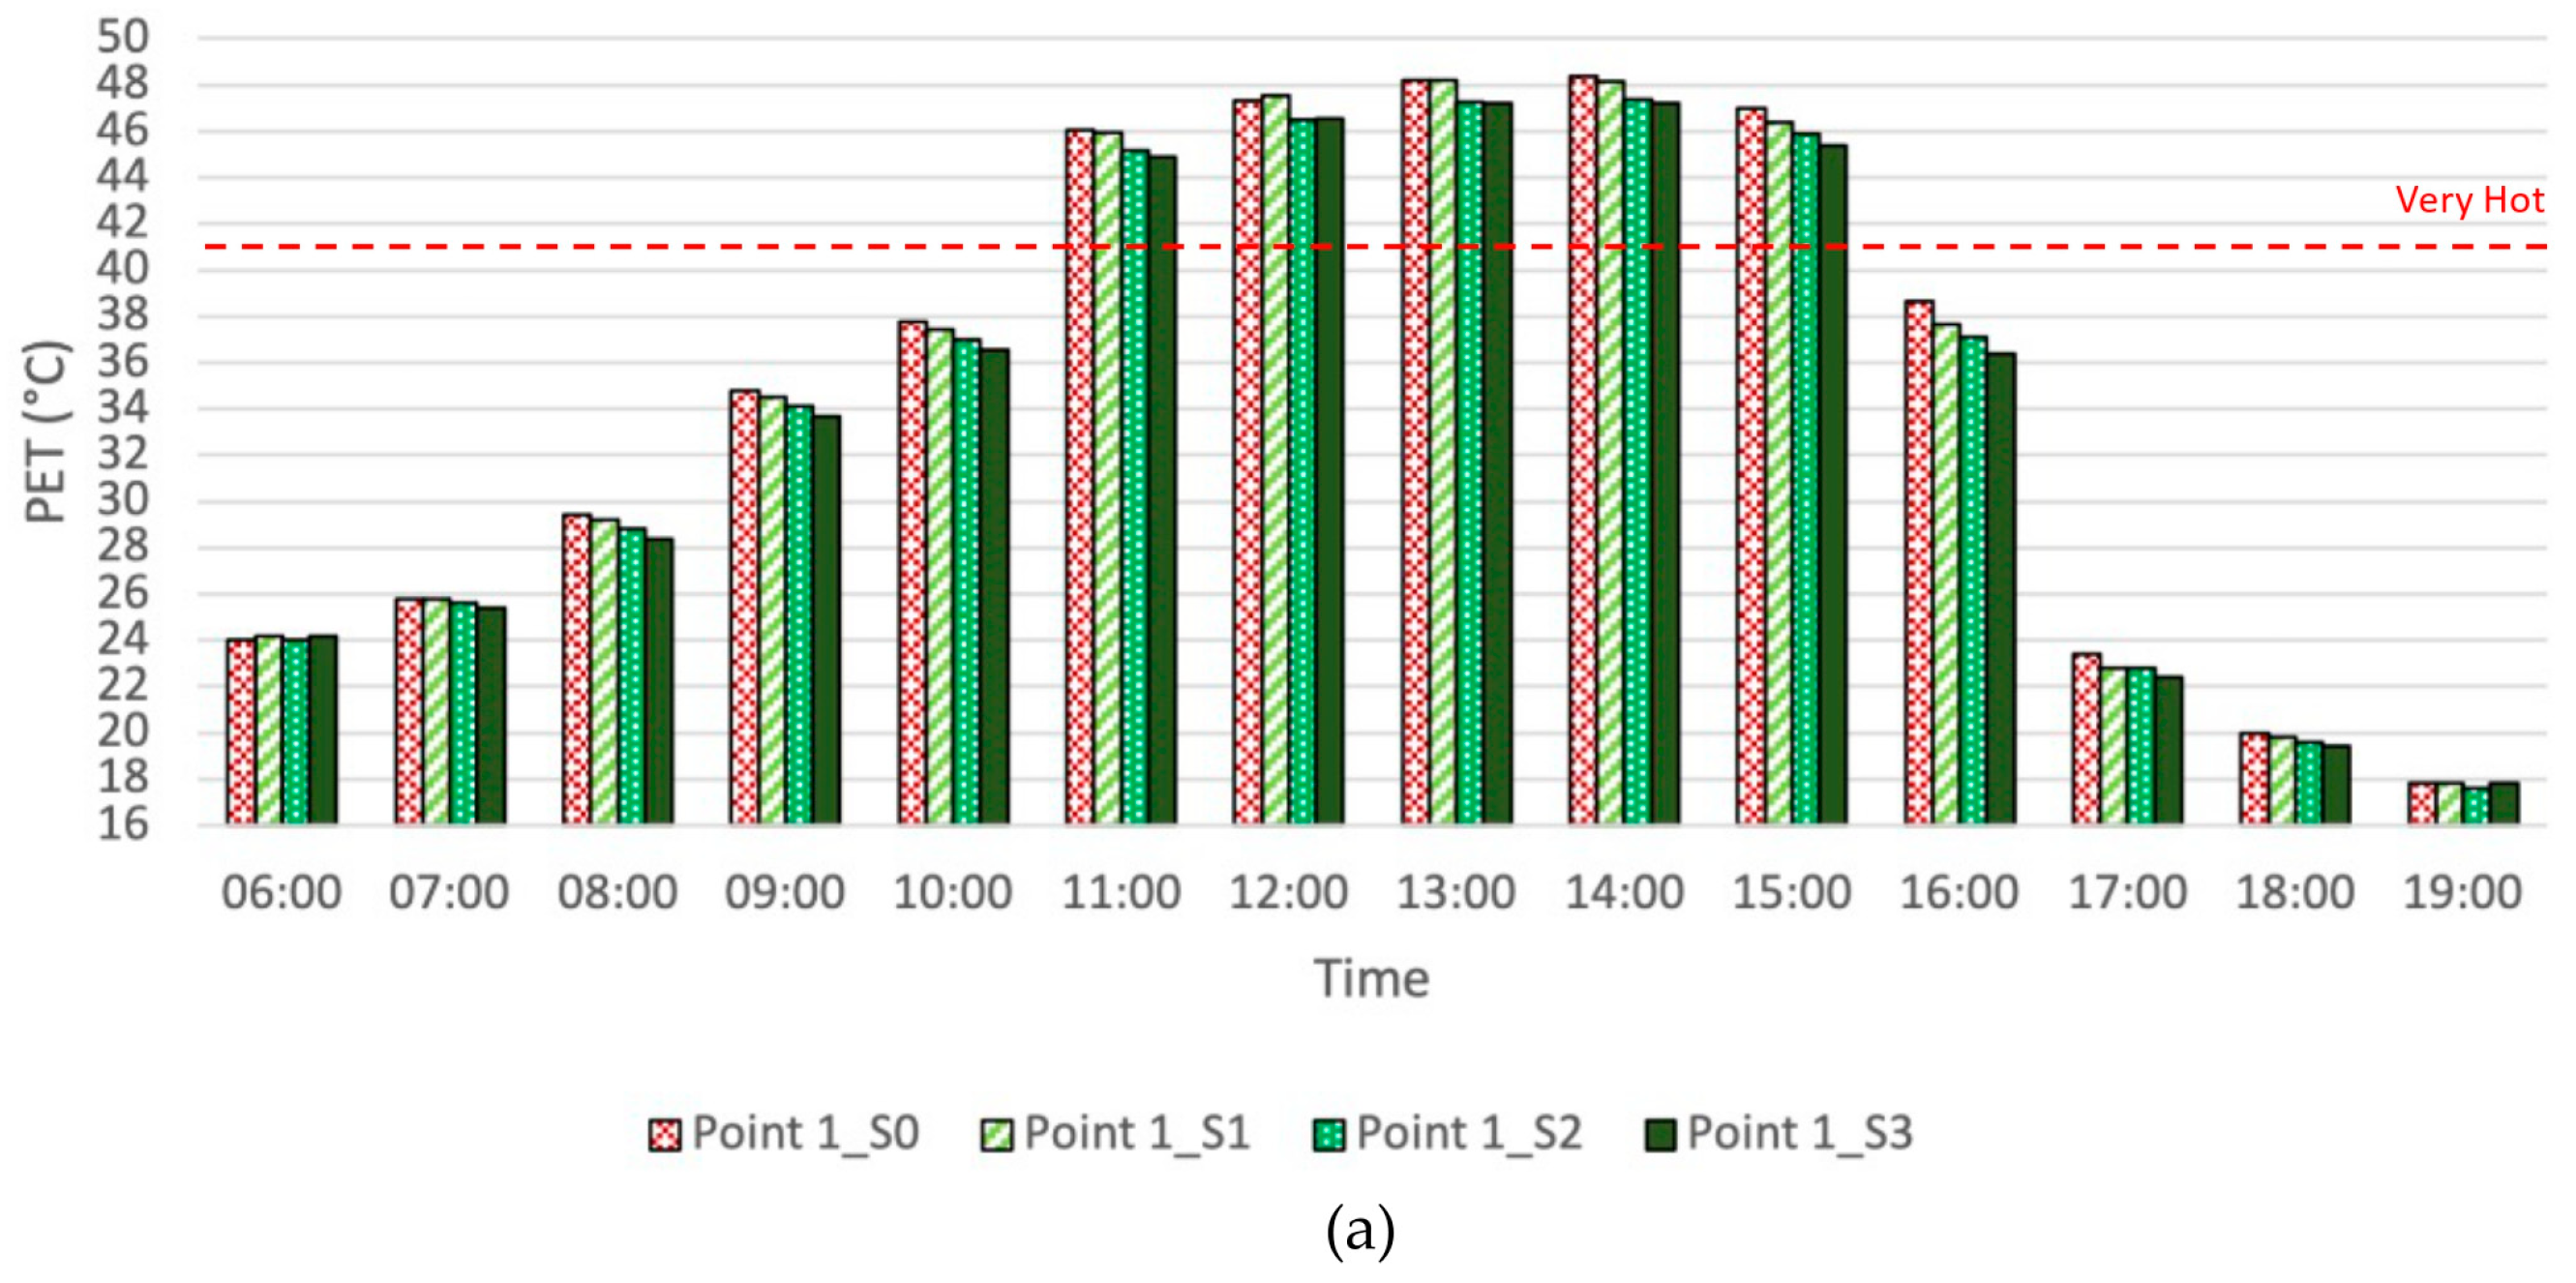
However, it is imperative to acknowledge that most of the implemented NBS did not attain the desired comfort threshold encompassing the physiologically equivalent temperature range of 18–23 °C. Elaborate details of the simulation outcomes are presented in Figure 8. Notably, at Point 1 and Point 3, the results indicate that the landscape design interventions on the assessment day did not lead to conspicuous enhancements in the outdoor thermal comfort index. This observation can be attributed to the fact that these two points are situated respectively at the northern and southern entrances of narrow streets. In contrast, at Point 3 and Point 4, the influence of landscape design interventions on augmenting thermal comfort is notably discernible. For instance, the most substantial discrepancy emerges at Point 2 at around 10:00 a.m., where Design Scenario 3 demonstrated a reduction of 11.491 °C in the PET value compared to the Original Scenario. In the same context, Design Scenario 2 exhibited a decrease of 11.151 °C, while Design Scenario 2 displayed a decrement of 0.462 °C in the PET value relative to the Original Scenario.

4. Discussion

As the most important outdoor public space in a city, the street form has an important impact on the thermal environment. Considering the outcomes delineated in this study, we have formulated a tailored strategy to enhance the configuration of streets, catering to distinct urban thoroughfare typologies. The following discussion of the results of this paper is below.
Identifying landscape design elements significantly correlated with cooling effects in urban areas under Shenzhen’s climatic conditions. The outcomes derived from this investigation underscore that the implementation of building greening exercises has a restricted influence on outdoor thermal comfort at the pedestrian level. This observation aligns coherently with prior research conducted via diverse methodologies in subtropical urban settings. A conceivable rationale behind this outcome could be attributed to the building heights encompassing the range of 20 to 120 m, as considered within this study. Meanwhile, the selection of ivy as facade greening may not have substantially augmented shading provisions for pedestrian pathways. This scenario consequently led to an absence of pronounced cooling effects resulting from the building greening initiative. However, it is worth noting that the potential cooling benefits of rooftop greenery tend to be more pronounced at the pedestrian level, especially when the building height remains below 10 m, as substantiated by previous findings. Furthermore, the significance of tree planting arrangements in fostering outdoor thermal comfort is noted, especially in design scenarios at Point 2 and Point 4. Trees function as pivotal contributors to this effect by mitigating both short-wave and long-wave radiation fluxes that impact pedestrians. This finding reinforces the pivotal role that strategically positioned trees play in enhancing outdoor thermal comfort, substantiating their capacity to significantly temper local temperature dynamics.
The research-by-design and simulation method for the case study is significate to landscape design. This study focuses on outdoor thermal comfort at the pedestrian level, using Rhino 7 and Grasshopper for modeling and ENVI-met for simulating urban environments and evaluating thermal comfort and building performance. This integrated approach enables the investigation of the outdoor microclimate of the built environment and the assessment of thermal comfort for a specific period of the test year in a relatively short simulation time. In the second research stage, the study proposes landscape design strategies to improve outdoor thermal comfort in the case study, focusing on different design scenarios and design elements. The integrated 3D visualization research method, using the software combination of Rhino 7, Grasshopper, and ENVI-met, allows designers to manipulate design modifications an infinite number of times according to the model’s environmental performance. This facilitates the urban form finding and optimization process through different design iterations.
Diverse street scales exhibit varying degrees of thermal comfort. For street scales exceeding 40 m, such as at Point 2 and Point 4, the PET values peak around midday, correlating with the intensity of solar insolation. Conversely, Point 1 and Point 3 manifest comparatively lower PET values due to the smaller street scale (below 20 m), resulting in these testing points residing in shaded zones during certain time intervals. Moreover, with increasing street scale (≥40 m), the cooling effect of landscape design strategies becomes more significant. In such instances, the magnification of street dimensions engenders an amplified capacity for these design interventions to exert a more pronounced influence on the thermal environment. Additionally, it is imperative to consider the selection of plant species in landscape design strategies based on the specific site conditions. In light of the site characteristics, the dynamic prediction of specific spatial patterns, coupled with subsequent simulations of these scenarios and meticulous planning for microclimate effects, represents a viable avenue for exploration in future studies. Achieving generalizability of the results necessitates the repetition of experiments across diverse case areas. Given the ongoing large-scale afforestation initiatives in China, particularly the widespread tree-planting activities in various cities, this research serves as a valuable tool for foreseeing and delineating the potential ecological benefits in the future. The studied area can offer insights and recommendations for the subsequent phases of these afforestation endeavors. Specifically, this study provides suggestions for the optimal selection of sites for tree-planting activities within the context of these initiatives.
Furthermore, it should be noted that this study has some limitations. Firstly, this study’s assessment of seasonal variation and sample period is limited. The study findings are based on data from specific summer daytime hours from sunrise to sunset in Shenzhen. Secondly, this study did not take note of indoor thermal comfort. While the study mainly focused on the outdoor thermal environment, it acknowledges that green roof and green wall strategies can also impact indoor thermal conditions and energy consumption. Future research could explore the synergies between outdoor and indoor benefits. Thirdly, the study focused on the overall thermal comfort of the urban environment but lacked sufficient consideration of individual variations. Lastly, this study did not take into account the variability in design. This paper considers a specific set of design parameters for green roofs and green walls. Future research could explore a wider range of design variations to determine the most effective configurations for different contexts, such as building types, orientations, and local climates.

5. Conclusions

In conclusion, this study evaluates the levels of outdoor thermal comfort prevalent in a residential street by a mix of research-by-design and environmental simulation methodology within Shenzhen, China. The case study area is situated within the city’s mixed zones. Within this context, the findings based on three design scenarios not only contribute to the practical implementation of urban greening initiatives within Shenzhen but also provide insights applicable globally.
The study systematically quantifies the cooling effects of three landscape design strategies in Shenzhen, revealing a preference for ground-level arboreal elements. While building greening contributes slightly to outdoor thermal comfort enhancement, the deployment of green walls necessitates judicious implementation within confined, elongated street canyons. Moreover, the expansion of street dimensions imparts an escalated potential for these design interventions to wield a conspicuously amplified impact on outdoor thermal comfort.
Consequently, the significance of incorporating landscape design for urban cooling is paramount in enhancing the urban environment. The feasibility of effective urban cooling through landscape design is contingent upon the consideration of microclimatic concerns during the design phase. Such considerations contribute to the holistic design of cities and urban living environments, thereby revitalizing and breathing life into urban spaces. This research study possesses the capability to furnish a solid scientific groundwork and a source of profound conceptual stimulus for the realm of landscape design endeavors in urban settings. It is recommended that urban landscape planners focus their efforts on purposeful landscape interventions to improve outdoor thermal comfort in urban environments. However, it is crucial to acknowledge and address the inherent limitations present in this study, recognizing the need for ongoing refinement and exploration in future research endeavors.

Author Contributions

Conceptualization, Y.Z. and G.K.; methodology, Y.Z. and Q.H.; software, Y.Z.; writing—original draft preparation, Y.Z. and Q.H.; writing—review and editing, G.K. and Q.H.; visualization, Y.Z.; supervision, G.K. All authors have read and agreed to the published version of the manuscript.

Funding

This research received no external funding.

Institutional Review Board Statement

Not applicable.

Informed Consent Statement

Not applicable.

Data Availability Statement

The data presented in this study are openly available online. Please refer to the following website for the weather data: https://www.visualcrossing.com/weather-data (accessed on 16 July 2023). Please refer to the following website for the geographic data: https://map.baidu.com/ (accessed on 16 July 2023).

Conflicts of Interest

The authors declare no conflicts of interest.

References

  1. Wang, Y.; Shaw, D. The Complexity of High-Density Neighbourhood Development in China: Intensification, Deregulation and Social Sustainability Challenges. Sustain. Cities Soc. 2018, 43, 578–586. [Google Scholar] [CrossRef]
  2. Wang, J.; Han, S.; Lin, H.; Wu, P.; Yuan, J. New-Type Urbanization Ecologically Reshaping China. SSRN Electron. J. 2022, 9, e12925. [Google Scholar] [CrossRef]
  3. Lyu, T.; Buccolieri, R.; Gao, Z. A Numerical Study on the Correlation between Sky View Factor and Summer Microclimate of Local Climate Zones. Atmosphere 2019, 10, 438. [Google Scholar] [CrossRef]
  4. Yin, Q.; Cao, Y.; Sun, C. Research on Outdoor Thermal Comfort of High-Density Urban Center in Severe Cold Area. Build. Environ. 2021, 200, 107938. [Google Scholar] [CrossRef]
  5. Lin, Z.; Xu, H.; Yao, X.; Yang, C.; Yang, L. Exploring the Relationship between Thermal Environmental Factors and Land Surface Temperature of a “Furnace City” Based on Local Climate Zones. Build. Environ. 2023, 243, 110732. [Google Scholar] [CrossRef]
  6. Nicol, J.F.; Roaf, S. Rethinking Thermal Comfort. Build. Res. Inf. 2017, 45, 711–716. [Google Scholar] [CrossRef]
  7. Crosby, S.; Newsham, G.; Veitch, J.; Rogak, S.; Rysanek, A. Bayesian Inference of Thermal Comfort: Evaluating the Effect of “Well-Being” on Perceived Thermal Comfort in Open Plan Offices. IOP Conf. Ser. Mater. Sci. Eng. 2019, 609, 042028. [Google Scholar] [CrossRef]
  8. Taleghani, M.; Kleerekoper, L.; Tenpierik, M.; van den Dobbelsteen, A. Outdoor Thermal Comfort within Five Different Urban Forms in the Netherlands. Build. Environ. 2015, 83, 65–78. [Google Scholar] [CrossRef]
  9. Jin, H.; Liu, S.; Kang, J. Gender Differences in Thermal Comfort on Pedestrian Streets in Cold and Transitional Seasons in Severe Cold Regions in China. Build. Environ. 2020, 168, 106488. [Google Scholar] [CrossRef]
  10. Kim, Y.; Shin, Y.; Cho, H. Influencing Factors on Thermal Comfort and Biosignals of Occupant—A Review. J. Mech. Sci. Technol. 2021, 35, 4201–4224. [Google Scholar] [CrossRef]
  11. Mamani, T.; Herrera, R.F.; Muñoz-La Rivera, F.; Atencio, E. Variables That Affect Thermal Comfort and Its Measuring Instruments: A Systematic Review. Sustainability 2022, 14, 1773. [Google Scholar] [CrossRef]
  12. Cheng, V.; Ng, E. Thermal Comfort in Urban Open Spaces for Hong Kong. Archit. Sci. Rev. 2006, 49, 236–242. [Google Scholar] [CrossRef]
  13. Spagnolo, J.; de Dear, R. A Field Study of Thermal Comfort in Outdoor and Semi-Outdoor Environments in Subtropical Sydney Australia. Build. Environ. 2003, 38, 721–738. [Google Scholar] [CrossRef]
  14. Nikolopoulou, M.; Baker, N.; Steemers, K. Thermal Comfort in Outdoor Urban Spaces: Understanding the Human Parameter. Sol. Energy 2001, 70, 227–235. [Google Scholar] [CrossRef]
  15. Coccolo, S.; Pearlmutter, D.; Kaempf, J.; Scartezzini, J.-L. Thermal Comfort Maps to Estimate the Impact of Urban Greening on the Outdoor Human Comfort. Urban For. Urban Green. 2018, 35, 91–105. [Google Scholar] [CrossRef]
  16. Zheng, Y.; Keeffe, G.; Mariotti, J. Nature-Based Solutions for Cooling in High-Density Neighbourhoods in Shenzhen: A Case Study of Baishizhou. Sustainability 2023, 15, 5509. [Google Scholar] [CrossRef]
  17. Aghamolaei, R.; Azizi, M.M.; Aminzadeh, B.; Mirzaei, P.A. A Tempo-Spatial Modelling Framework to Assess Outdoor Thermal Comfort of Complex Urban Neighbourhoods. Urban Clim. 2020, 33, 100665. [Google Scholar] [CrossRef]
  18. Lai, D.; Zhou, C.; Huang, J.; Jiang, Y.; Long, Z.; Chen, Q. Outdoor Space Quality: A Field Study in an Urban Residential Community in Central China. Energy Build. 2014, 68, 713–720. [Google Scholar] [CrossRef]
  19. Acero, J.A.; Koh, E.J.; Li, X.; Ruefenacht, L.A.; Pignatta, G.; Norford, L.K. Thermal Impact of the Orientation and Height of Vertical Greenery on Pedestrians in a Tropical Area. Build. Simul. 2019, 12, 973–984. [Google Scholar] [CrossRef]
  20. Abdollahzadeh, N.; Biloria, N. Outdoor Thermal Comfort: Analyzing the Impact of Urban Configurations on the Thermal Performance of Street Canyons in the Humid Subtropical Climate of Sydney. Front. Archit. Res. 2021, 10, 394–409. [Google Scholar] [CrossRef]
  21. Lin, J.; Wei, K.; Guan, Z. Exploring the connection between morphological characteristic of built-up areas and surface heat islands based on MSPA. Urban Clim. 2024, 53, 101764. [Google Scholar] [CrossRef]
  22. Petzold, J.; Mose, L. Urban greening as a response to climate-related heat risk: A Social–Geographical Review. Sustainability 2023, 15, 4996. [Google Scholar] [CrossRef]
  23. Eliasson, I. The Use of Climate Knowledge in Urban Planning. Landsc. Urban Plan. 2000, 48, 31–44. [Google Scholar] [CrossRef]
  24. Xiao, J.; Yuizono, T. Climate-Adaptive Landscape Design: Microclimate and Thermal Comfort Regulation of Station Square in the Hokuriku Region, Japan. Build. Environ. 2022, 212, 108813. [Google Scholar] [CrossRef]
  25. Nazarian, N.; Sin, T.; Norford, L. Numerical Modeling of Outdoor Thermal Comfort in 3D. Urban Clim. 2018, 26, 212–230. [Google Scholar] [CrossRef]
  26. Oliveira, S.; Andrade, H.; Vaz, T. The Cooling Effect of Green Spaces as a Contribution to the Mitigation of Urban Heat: A Case Study in Lisbon. Build. Environ. 2011, 46, 2186–2194. [Google Scholar] [CrossRef]
  27. Kleerekoper, L.; van Esch, M.; Salcedo, T.B. How to Make a City Climate-Proof, Addressing the Urban Heat Island Effect. Resour. Conserv. Recycl. 2012, 64, 30–38. [Google Scholar] [CrossRef]
  28. Sun, S.; Xu, X.; Lao, Z.; Liu, W.; Li, Z.; Higueras García, E.; He, L.; Zhu, J. Evaluating the Impact of Urban Green Space and Landscape Design Parameters on Thermal Comfort in Hot Summer by Numerical Simulation. Build. Environ. 2017, 123, 277–288. [Google Scholar] [CrossRef]
  29. Morabito, M.; Crisci, A.; Messeri, A.; Orlandini, S.; Raschi, A.; Maracchi, G.; Munafò, M. The Impact of Built-up Surfaces on Land Surface Temperatures in Italian Urban Areas. Sci. Total Environ. 2016, 551–552, 317–326. [Google Scholar] [CrossRef]
  30. Zhang, Y.; Murray, A.T.; Turner, B.L. Optimizing Green Space Locations to Reduce Daytime and Nighttime Urban Heat Island Effects in Phoenix, Arizona. Landsc. Urban Plan. 2017, 165, 162–171. [Google Scholar] [CrossRef]
  31. Hou, H.; Estoque, R.C. Detecting Cooling Effect of Landscape from Composition and Configuration: An Urban Heat Island Study on Hangzhou. Urban For. Urban Green. 2020, 53, 126719. [Google Scholar] [CrossRef]
  32. Yuan, J.; Masuko, S.; Shimazaki, Y.; Yamanaka, T.; Kobayashi, T. Evaluation of Outdoor Thermal Comfort under Different Building External-Wall-Surface with Different Reflective Directional Properties Using CFD Analysis and Model Experiment. Build. Environ. 2022, 207, 108478. [Google Scholar] [CrossRef]
  33. Irfeey, A.M.M.; Chau, H.-W.; Sumaiya, M.M.F.; Wai, C.Y.; Muttil, N.; Jamei, E. Sustainable mitigation strategies for urban heat island effects in urban areas. Sustainability 2023, 15, 10767. [Google Scholar] [CrossRef]
  34. Zhang, Z.; Lv, Y.; Pan, H. Cooling and Humidifying Effect of Plant Communities in Subtropical Urban Parks. Urban For. Urban Green. 2013, 12, 323–329. [Google Scholar] [CrossRef]
  35. Roggema, R. Research by Design: Proposition for a Methodological Approach. Urban Sci. 2016, 1, 2. [Google Scholar] [CrossRef]
  36. Han, Q.; Keeffe, G. Promoting Climate-Driven Forest Migration through Large-Scale Urban Afforestation. Landsc. Urban Plan. 2021, 212, 104124. [Google Scholar] [CrossRef]
  37. Faragallah, R.N.; Ragheb, R.A. Evaluation of Thermal Comfort and Urban Heat Island through Cool Paving Materials Using Envi-Met. Ain Shams Eng. J. 2022, 13, 101609. [Google Scholar] [CrossRef]
  38. ENVI-Met. Available online: https://www.envi-met.com/ (accessed on 21 May 2023).
  39. Rhinoceros. Available online: Rhino3d.com (accessed on 15 March 2023).
  40. Grasshopper 3D. Available online: grasshopper3d.com (accessed on 15 July 2023).
  41. Ladybug Tools. Available online: https://www.ladybug.tools/dragonfly.html (accessed on 15 July 2023).
  42. Bruse, M.; Fleer, H. Simulating Surface–Plant–Air Interactions inside Urban Environments with a Three Dimensional Numerical Model. Environ. Model. Softw. 1998, 13, 373–384. [Google Scholar] [CrossRef]
  43. Teshnehdel, S.; Gatto, E.; Li, D.; Brown, R.D. Improving Outdoor Thermal Comfort in a Steppe Climate: Effect of Water and Trees in an Urban Park. Land 2022, 11, 431. [Google Scholar] [CrossRef]
  44. Baidu Map. Available online: https://map.baidu.com/ (accessed on 16 July 2023).
  45. Visual Crossing Weather. Available online: https://www.visualcrossing.com/ (accessed on 16 July 2023).
  46. Kumar, P.; Sharma, A. Study on Importance, Procedure, and Scope of Outdoor Thermal Comfort—A Review. Sustain. Cities Soc. 2020, 61, 102297. [Google Scholar] [CrossRef]
  47. Höppe, P. The Physiological Equivalent Temperature—A Universal Index for the Biometeorological Assessment of The Thermal Environment. Int. J. Biometeorol. 1999, 43, 71–75. [Google Scholar] [CrossRef] [PubMed]
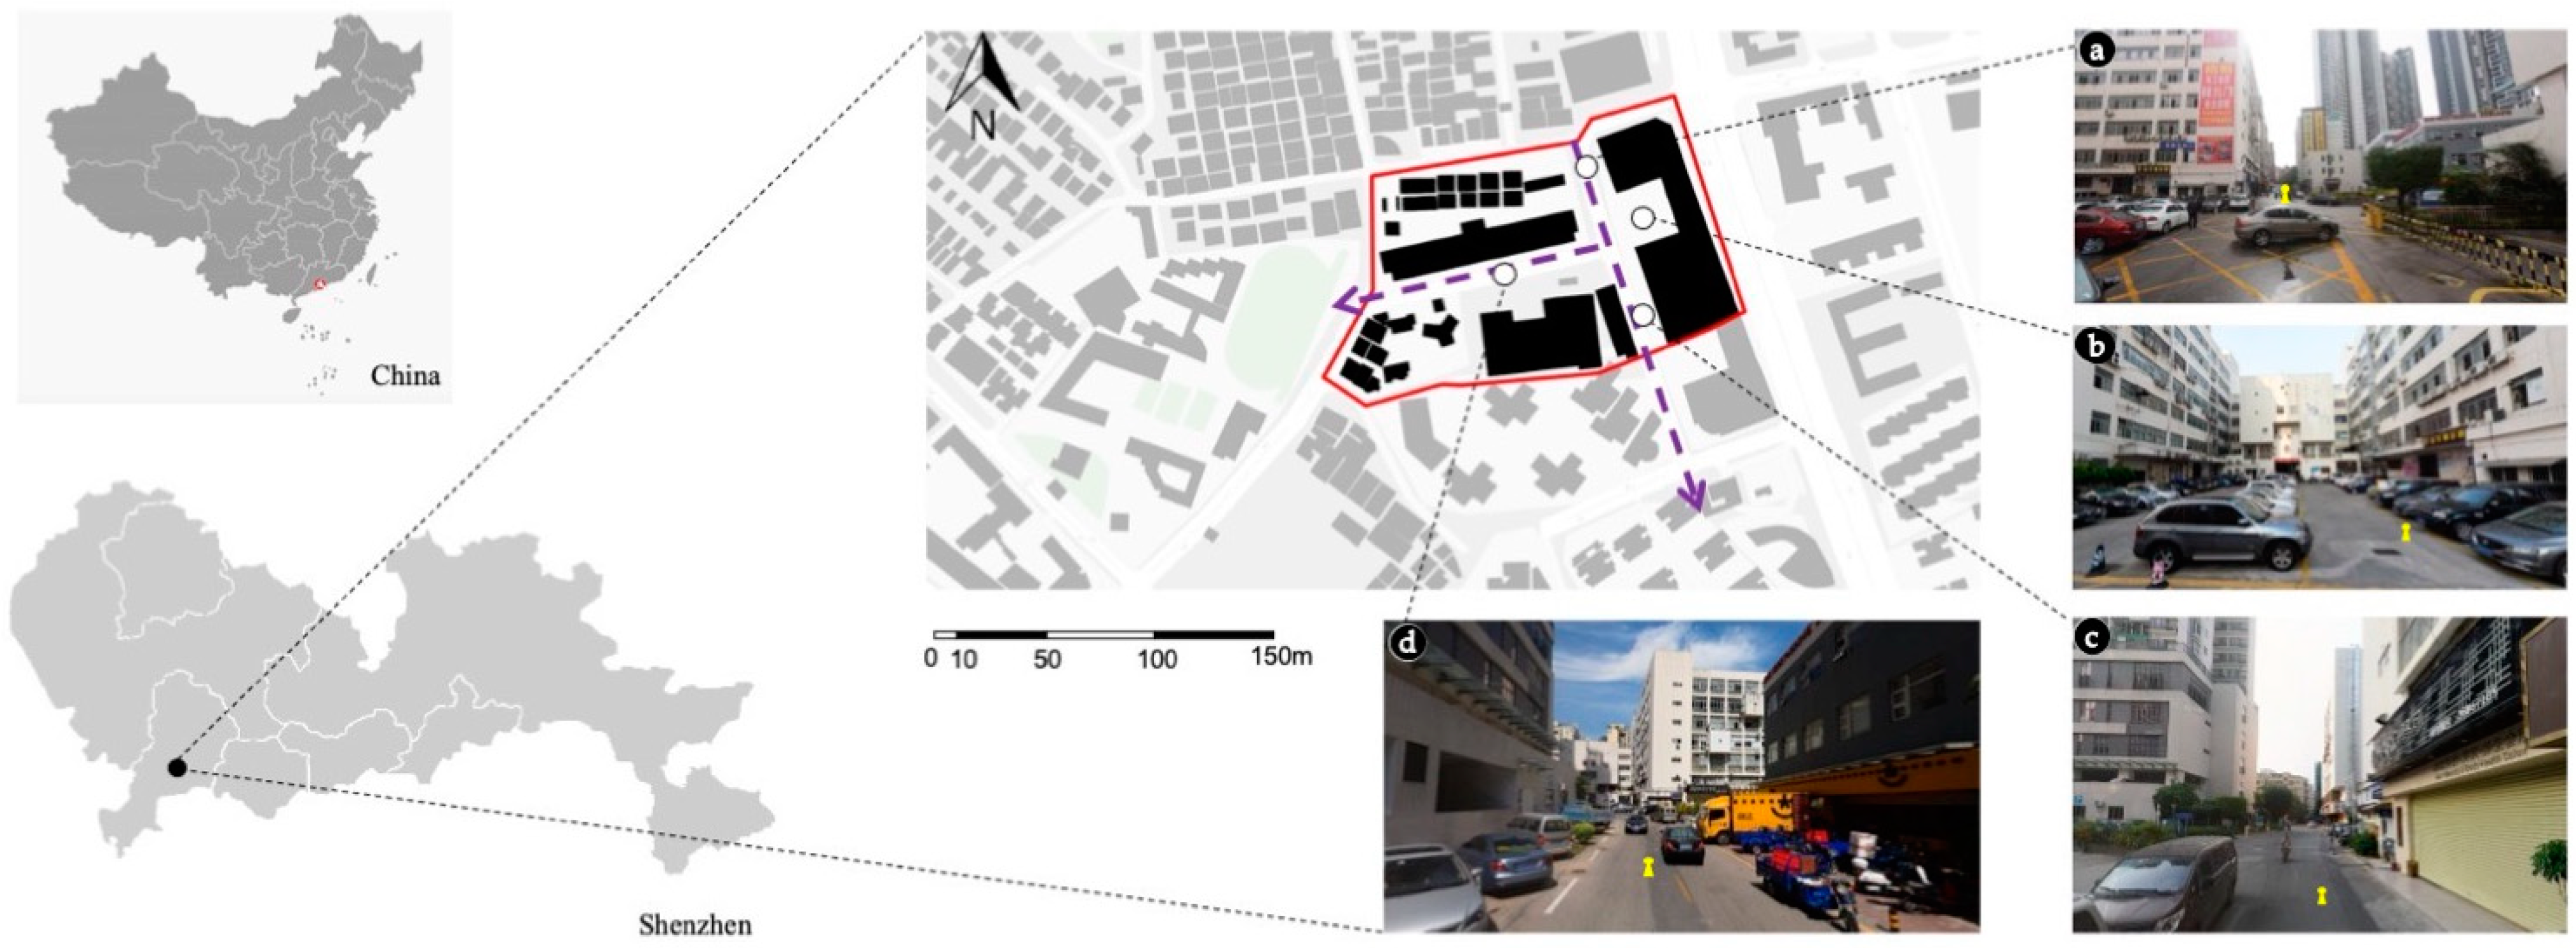
Figure 1. Map of Shenzhen city and the research area in the study. “a”, “b”, “c” and “d” indicate the respective original environmental conditions for each testing point. The red line indicates the study scope. The black spot indicates the positions of the study area. The white spots indicate the test points on the pedestrian level. The purple arrows indicate the entrance of streets. Yellow symbols indicate a person’s view at 1.5 m.
Land 13 00065 g001
Figure 2. Methodological framework.
Land 13 00065 g002
Figure 3. The test point locations. Yellow symbols indicate a person’s view at 1.5 m. Each subfigure corresponds to a distinct street scale: (a) at a street scale of 20 m, (b) at a street scale of 50 m, (c) at a street scale of 15.8 m, and (d) at a street scale of 40 m.
Land 13 00065 g003
Figure 4. Visualizations of the original scenario and the design scenarios using ENVI-met.
Land 13 00065 g004
Figure 5. Visualization of the simulated environmental feature results. (a-1) A visualization of local ambient temperature on pedestrian level at 12:00 p.m.; (a-2) Local ambient temperature during the period spanning from 06:00 a.m. to 19:00 p.m. on 22 July 2022; (b-1) A visualization of wind speed on pedestrian level at 12:00 p.m.; (b-2) Wind speed during the period spanning from 06:00 a.m. to 19:00 p.m. on 22 July 2022; (c-1) A visualization of relative humidity at 12:00 p.m.; (c-2) Relative humidity during the period spanning from 06:00 a.m. to 19:00 p.m. on 22 July 2022; (d-1) A visualization of mean radiant temperature 12:00 p.m.; (d-2) Mean radiant temperature during the period spanning from 06:00 a.m. to 19:00 p.m. on 22 July 2022.
Land 13 00065 g005
Figure 6. The analysis of outdoor thermal comfort by the PET index. (a) A visualization of PET index on pedestrian level at 12:00 p.m.; (b) PET index during the period spanning from 06:00 a.m. to 19:00 p.m. on 22 July 2022.
Land 13 00065 g006
Figure 7. A visualization of the outdoor thermal comfort index at 12:00 p.m. (a) PET index in the Original Scenario model; (b) PET index in Design Scenario 1 model; (c) PET index in Design Scenario 2 model; (d) PET index in Design Scenario 3 model.
Land 13 00065 g007aLand 13 00065 g007b
Figure 8. The simulation results of PET on the four test points. (a) The comparison of the PET index between the original model and the design scenario model at Point 1; (b) The comparison of the PET index between the original model and the design scenario model at Point 2; (c) The comparison of the PET index between the original model and the design scenario model at Point 3; (d) The comparison of the PET index between the original model and the design scenario model at Point 4.
Land 13 00065 g008aLand 13 00065 g008b
Table 1. Parameters set up for ENVI-met modeling.
Simulation Input Data
Geographic location (latitude, longitude)22.5, 114.10
Reference time zoneGMT + 8
Simulation model size (m)289 (L) × 208 (W) × 120 (H)
Simulation model area (number of grids) xyz-grids101 × 74 × 60
Size of grid cell (m) x, y, z3 × 3 × 3
Method of vertical grid generationEquidistant
Main Model Parameters
Simulation model date22 July 2022
Start time06:00
Simulation duration (h)13 h
Initial air temperature (°C)29.1
Initial relative humidity (%)77.76
Initial wind speed (m/s)3.13
Initial wind direction (°)290
Model Materials and Properties
Building materials (roofs and facades)[0100C2] Concrete wall (lightweight)
Pavements[0100PP] Pavement (concrete), used/dirty
Roads[0100ST] Asphalt Rd
Table 2. Meteorological data from 22 July 2022.
TimeAir Temperature (°C)Humidity (%)Wind Speed (m/s)Wind Direction (°)
06:0029.177.763.13290
07:0029.579.824.02300
08:003078.964.92310
09:0031.171.354.02318
10:0032.165.724.92314
11:003459.992.24282
12:0033.454.94.47290
13:0033.556.164.02260
14:0036.948.43.13354
15:0034.750.875.36241
16:0035.348.145.36238
17:0035.952.864.02141
18:0033.464.348.05208
19:0032.866.87.15201
Table 3. Physiologically equivalent temperature (PET) range [47].
PET (°C)Thermal SensationPhysiological Stress Level
<4Very coldExtreme cold stress
4–8ColdStrong cold stress
8–13CoolModerate cold stress
13–18Slightly coolSlight cold stress
18–23ComfortableNo thermal stress
23–29Slightly warmSlight heat stress
29–35WarmModerate heat stress
35–41HotStrong heat stress
>41Very hotExtreme heat stress
Disclaimer/Publisher’s Note: The statements, opinions and data contained in all publications are solely those of the individual author(s) and contributor(s) and not of MDPI and/or the editor(s). MDPI and/or the editor(s) disclaim responsibility for any injury to people or property resulting from any ideas, methods, instructions or products referred to in the content.