Article

Spatiotemporal Variations of Production–Living–Ecological Space under Various, Changing Climate and Land Use Scenarios in the Upper Reaches of Hanjiang River Basin, China

1
School of Tourism & Research Institute of Human Geography, Xi’an International Studies University, Xi’an 710128, China
2
School of Geography and Tourism, Shaanxi Normal University, Xi’an 710119, China
3
State Key Laboratory of Urban and Regional Ecology, Research Center for Eco-Environmental Sciences, Chinese Academy of Sciences, Beijing 100085, China
4
School of History and Archives, Yunnan University, Kunming 650091, China
*
Author to whom correspondence should be addressed.
Land 2023, 12(9), 1770; https://doi.org/10.3390/land12091770
Submission received: 1 August 2023 / Revised: 3 September 2023 / Accepted: 6 September 2023 / Published: 13 September 2023
(This article belongs to the Special Issue Smart Land Use Planning II)

Abstract

:
Land is an important resource that supports the production, life, and ecological development of human society. The current research on production–living–ecological space (PLES) is mainly focusing on the identification of single and dominant functions of land space, and the comprehensive spatial function measurement index of PLES (PLESI) is less known in the effective quantitative evaluation of multifunctionality of different land use categories. Integrating the CMIP6 (Coupled Model Intercomparison Project phase 6) scenario data and the future land use simulation model (FLUS), this research took the upper reaches of the Hanjiang River (URHR) as an example to explore the temporal and spatial variations in land use, PLES, and PLESIs during 2000–2020, and in the SSP2-4.5 and SSP5-8.5 scenarios from 2021 to 2100. The findings were as follows: (1) Forest land is the most widely distributed type of land; correspondingly, ecological space has the widest distribution area in PLES, followed by production space. (2) The area of dry land and building land increased between 2000 and 2010, accompanied by the increase in living space. From 2010 to 2020, the growth rate of building land tended to slow down while forest land increased, and the conflict of PLES eased. (3) The transfer between forest land and dry land is projected to intensify under the SSP2-4.5 scenario, while it is projected to occur between forest land and grassland under the SSP5-8.5 scenario. As for the changes in PLES, the SSP2-4.5 scenario has a greater impact than the SSP5-8.5 scenario. Spatially, several sub-basins in the northern URHR are the main areas of land use and PLES change. (4) PLESI presents a significant downward trend from 2000 to 2020 while trending upward under the SSP5-8.5 scenario and trending downward slightly under the SSP2-4.5 scenario between 2020 and 2100. Combining climate scenarios and the future land use simulation, this research would support the effective utilization of regional land resources and ecosystem management decision-making.

1. Introduction

Land is a key and scarce resource to support human social development in production, life, and ecology [1,2]. It is closely related to food security, ecosystem health, and social sustainable development [3,4,5]. Over the past decades, the world has experienced the rapid expansion of urbanization, human activity, and extreme climate events, which comprehensively affected the regional soil environment, hydrological cycle, biodiversity, climate, etc., with a great influence on the ecological functions of land in urbanized areas [6]. In turn, the relationship between humans and land has become increasingly tense [7,8,9], and conflict between production, life, and ecological land is growing more frequent in urbanized areas [10,11]. China has proposed comprehensive requirements for building a “production-living-ecological space, PLES” with “promoting the high efficient and compositive production space, livable and moderate living space and ecological space with picturesque scenery” [12]. PLES has become an important way to ameliorate rural–urban disparity and bolster harmonious and sustainable development.
In recent years, great efforts have been made in research on PLES: First, in terms of classification and identification of PLES, most researchers divide different lands into three types of ES, LS, and PS on the basis of the predominant function of the land categories and have made numerous investigations about the spatiotemporal patterns of PLES at the national scale [13], provincial scale [14], city and county scale [15,16], township scale [17], economic belt and urban agglomeration [18,19,20], watershed and basin scale [21]. Simultaneously, temporal and spatial changes are inevitably accompanied by the process of the mutual encroachment or tradeoff of PLES, such as the spatial coordination and conflict of PLES [22,23]. As for the temporal and spatial change, the influence mechanism of natural environment, social, and economic development are crucial factors for the assessment of PLES. Current studies on multi-year variations in PLES focus on historical periods. However, under the far-reaching impact of global changes and human activities [24,25], great uncertainties of the coordination and conflict of PLES exist regarding the changes in future land use. Based on the systematic research on the driving forces behind PLES, quantitative models and methods have been applied to deduce the processes of land use change and to generate predictions of PLES in the future [18].
Multiple models of land change evolution and prediction have been produced [26,27,28]. The future land use simulation model, FLUS, was created with consideration of the comprehensive impact of climatic variations and human activities on land utilization changes [29,30]. With support from multi-source data, this model can explicitly simulate land use at a global scale or regional scale and obtain high-precision and multi-scenario land use prediction results, laying the foundation for predictions of future PLES scenarios and clearly revealing the long-term patterns of evolution of PLES [31].
Furthermore, current research on PLES is mainly concerned with the identification of dominant functions of land utilization, ignoring that land use has compound land functions [21]. For instance, cultivated land can be used as agricultural land to fulfil food production functions, while it can also be ecological land, fulfilling diverse ecosystem functions, including climate regulation, carbon sequestration, flood mitigation, nutrient cycling, etc. [32,33,34]. Some research has been conducted with the aim of classifying and evaluating the multifunctionality of different land utilization types. Specifically, the PLES indicator system (PLESI) and the four-level scoring method were employed to achieve the multi-functional measurement of production function, living function, and ecological function for different land categories [21,35]. Existing classifications of PLES mostly consist of PS, ES, and LS based on land use types and it lacks multi-functional and comprehensive classification methods in PLESI evaluation.
The upper reaches of the Hanjiang River (URHR), the core area of the Qinling Mountains, is the key water conservation area of the South-to-North Water Diversion Project [36,37]. As an extremely crucial national ecological security barrier, its ecological function has an irreplaceable role to play in the construction of ecological civilization in China. However, little research has explored PLES in the URHR and Qinling Mountains. In this context, this study attempts to measure the evolutionary characteristics of the PLES and land multifunctionality through the PLESI model, with the integration of CMIP6 future climate and socio-economic data and the FLUS model. Specifically, the objectives of this study were to (1) analyze the patterns of temporal and spatial development of PLES between 2000 and 2100 under two climate scenarios in the URHR; (2) investigate the transfer evolution characteristics of land use and PLES under two different scenarios; and (3) discuss the implication of scenarios analysis and the PLESI model on land resources management. This is an effective exploration of comprehensive PLES research of long-term time series on the typical ecological reserve, aiming to provide scientific and sufficient support for the regional land resource management and social sustainable development.

2. Materials and Methods
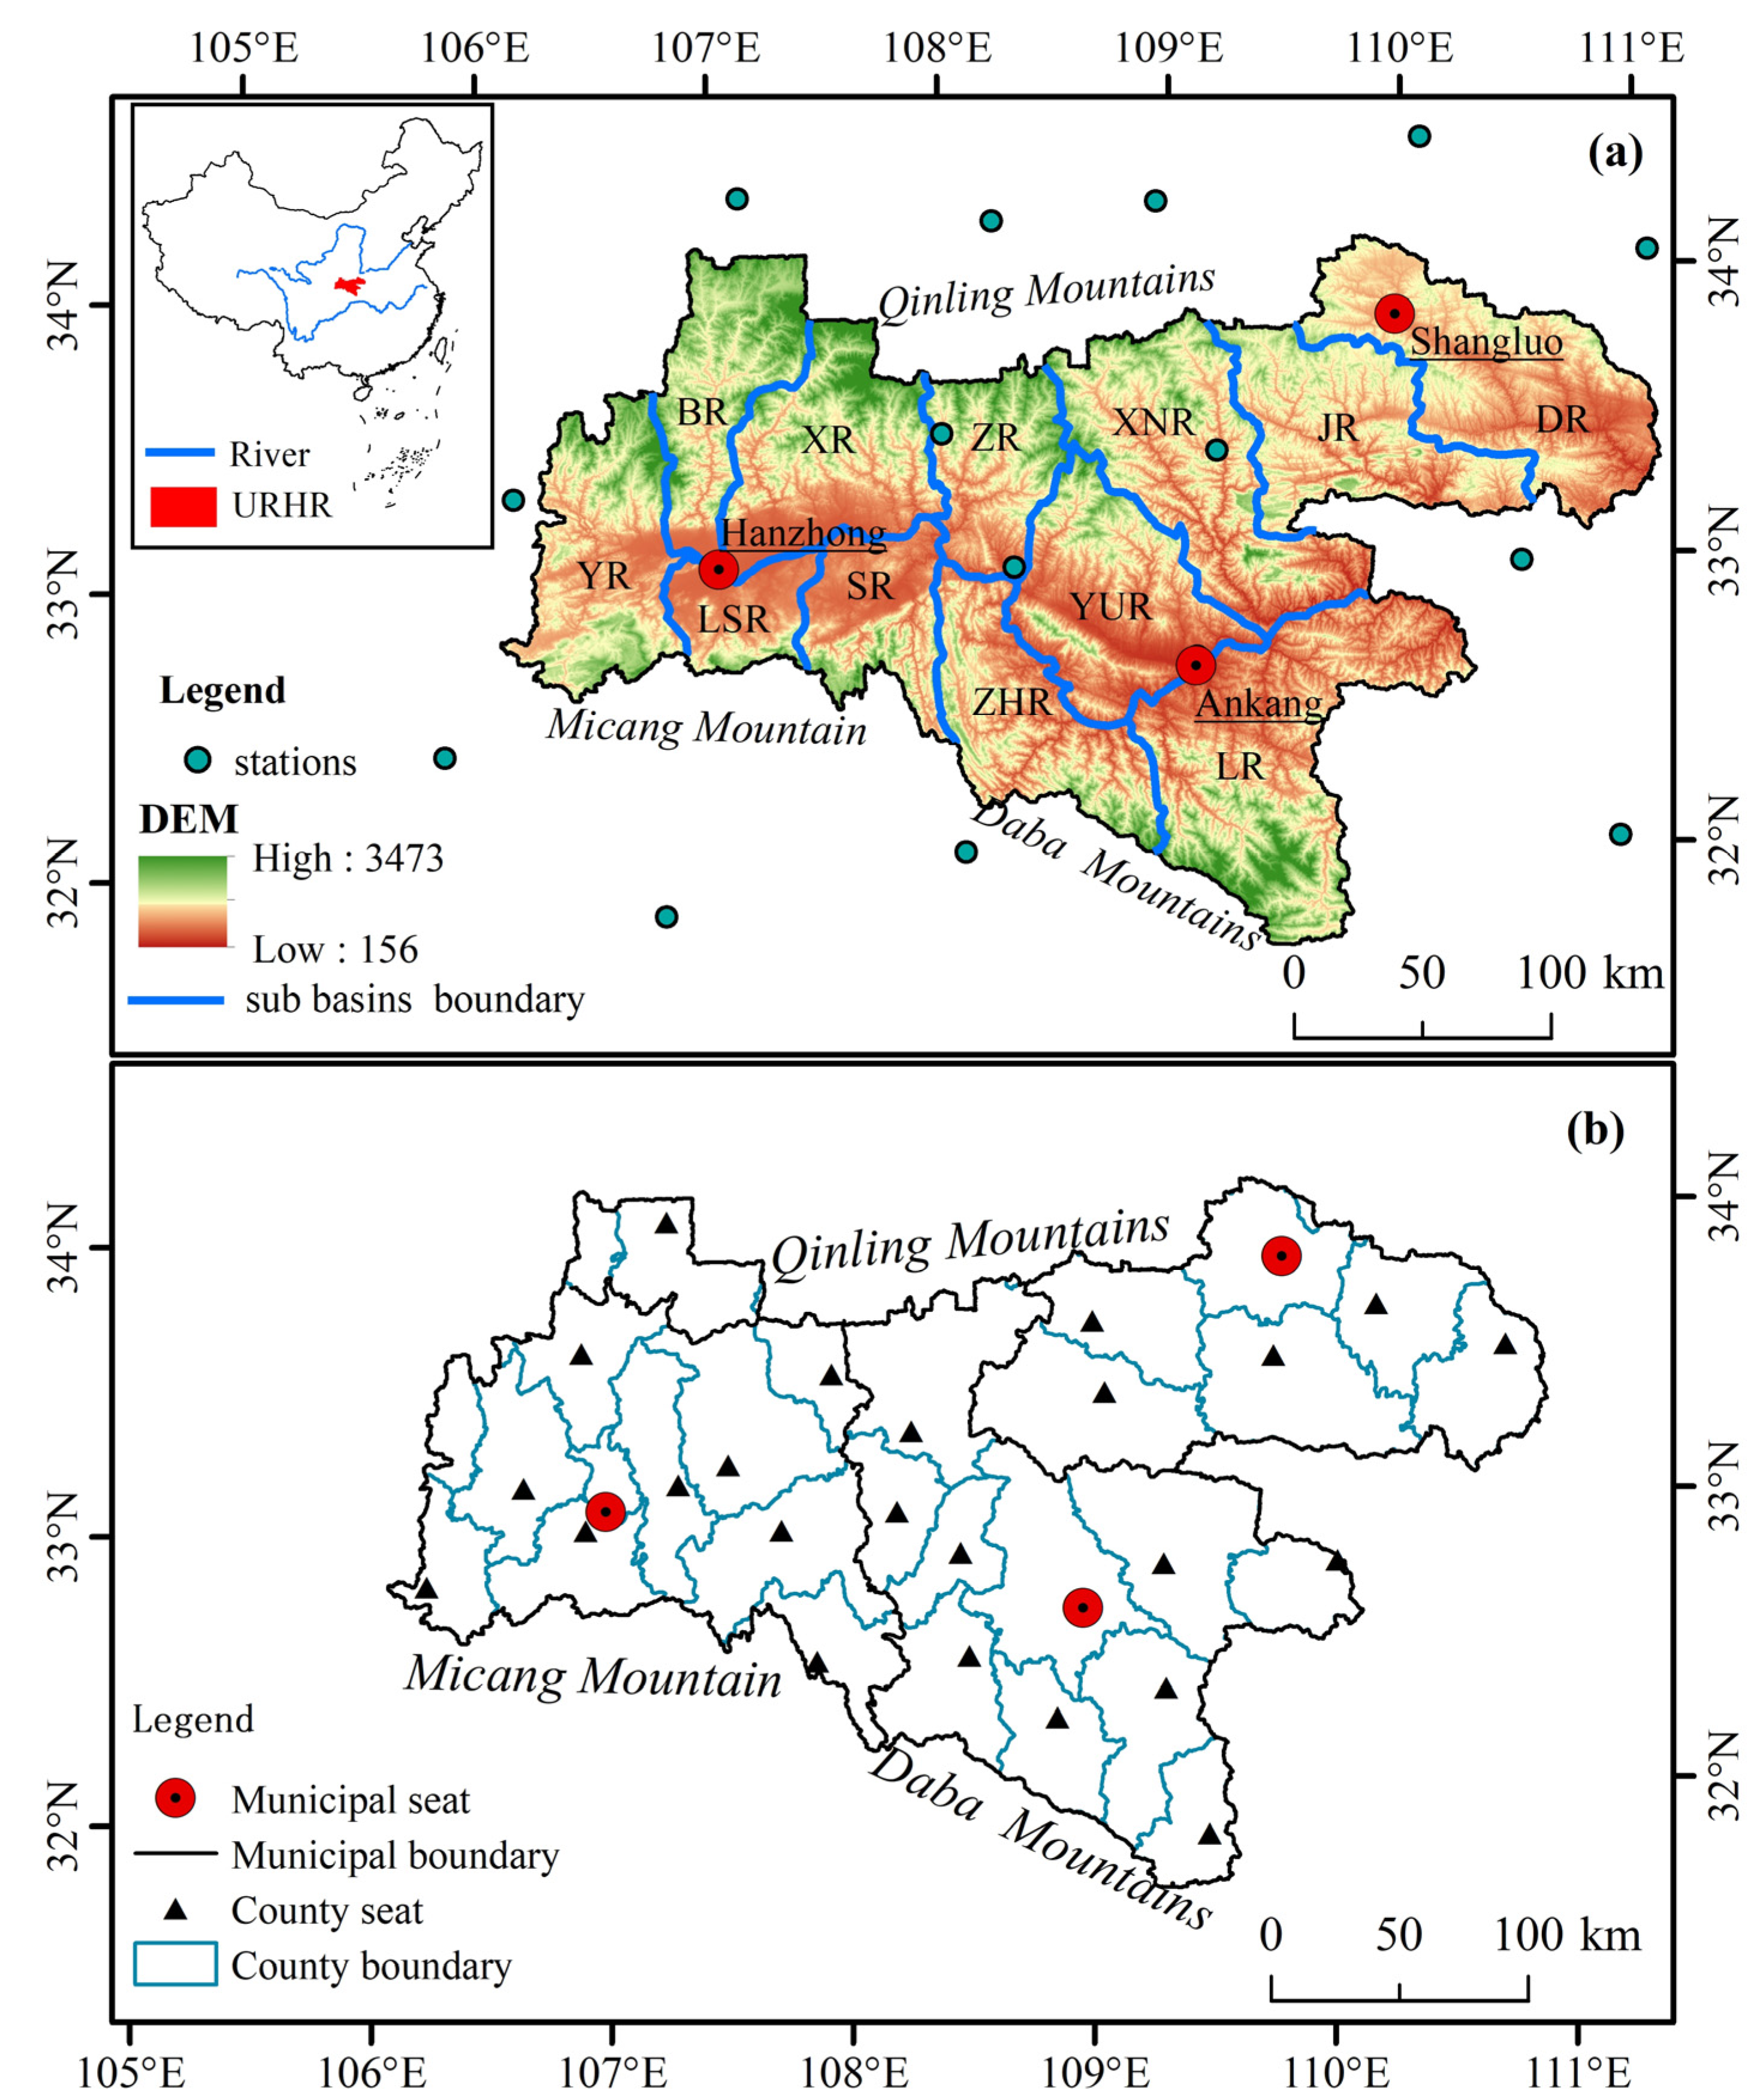
2.1. Study Area

The Hanjiang River is the largest branch of the Yangtze River, Asia’s longest river. It originates in the Ningqiang County in the southwest of Shaanxi Province, and joins the Yangtze River at Wuhan City, Hubei Province. The Upper Reaches of the Hanjiang River is located in the middle of mainland China and in the geographic demarcation line between southern and northern China [38]. In Shaanxi Province, the Hanjiang River spans 652 km, covering three main prefecture-level cities, including Hanzhong, Ankang and Shangluo, and Taibai County and Feng County of Baoji City, with a basin area of 62,384 km2 [37] (Figure 1).
Topographically, it is structured with three mountains and two basins. The Qinling Mountains constitute the northern boundary, Daba Mountain and Micang Mountain constitute the southern boundary, and Hanjiang River flows through the canyon areas from the west to the east, forming Ankang Basin and Hanzhong Basin. Based on regional river zoning characteristics and related studies, the URHR in the ownership of numerous tributaries consists of 12 sub-basins through the hydrological analysis module in GIS [39]. The mainstream area is determined by the flow route of Hanjiang River in Shaanxi Province. YR, BR, LSR, XR and SR mainly belong to Hanzhong Basin, ZR, ZHR, XNR, YUR and LR to Ankang Basin, and JR and DR in Shangluo City are tributaries of Hanjiang.
The URHR is the core area in the south of the water distribution line of the Qinling Mountains. It is in the 0 °C isotherm line, 800 mm iso-precipitation line and 2000 h sunshine hours isochron line in January in mainland China, with unique natural environmental characteristics [36,37]. The region is mainly dominated by the warm temperate continental climate, characterized with warmth, rain and moisture, which has the annual average precipitation ranging from 653 mm to 1183 mm and annual average temperature ranging from 12 °C to 18 °C [39]. Known as China’s Central Water Tower, the study area contains abundant water resources and is an important water conservation area of the Yellow River, the Yangtze River, and China’s South-to-North Water Diversion project. The ecological environment is diverse with rich biological resources and extremely important ecosystem service functions, named as “natural gene bank” of biodiversity in China. The URHR plays an irreplaceable role in the local and national ecological security and social development.
However, due to the terrain conditions and the extreme rainfall events in summer, the flood disaster in the study area is frequent, triggering significant threats to the lives and safety of local residents [37]. In terms of social and economic development, the Qinling Mountains region belongs to the largest centralized contiguously poor area in China. The large-scale social production and urban industrial development have been restricted due to its functioning as the ecological protection area. Therefore, how to weight the relationship between economic growth and environmental care effectively, on the premise of strengthening the ecological location and ecological function of the Qinling Mountains, has become an important issue for local sustainable development.

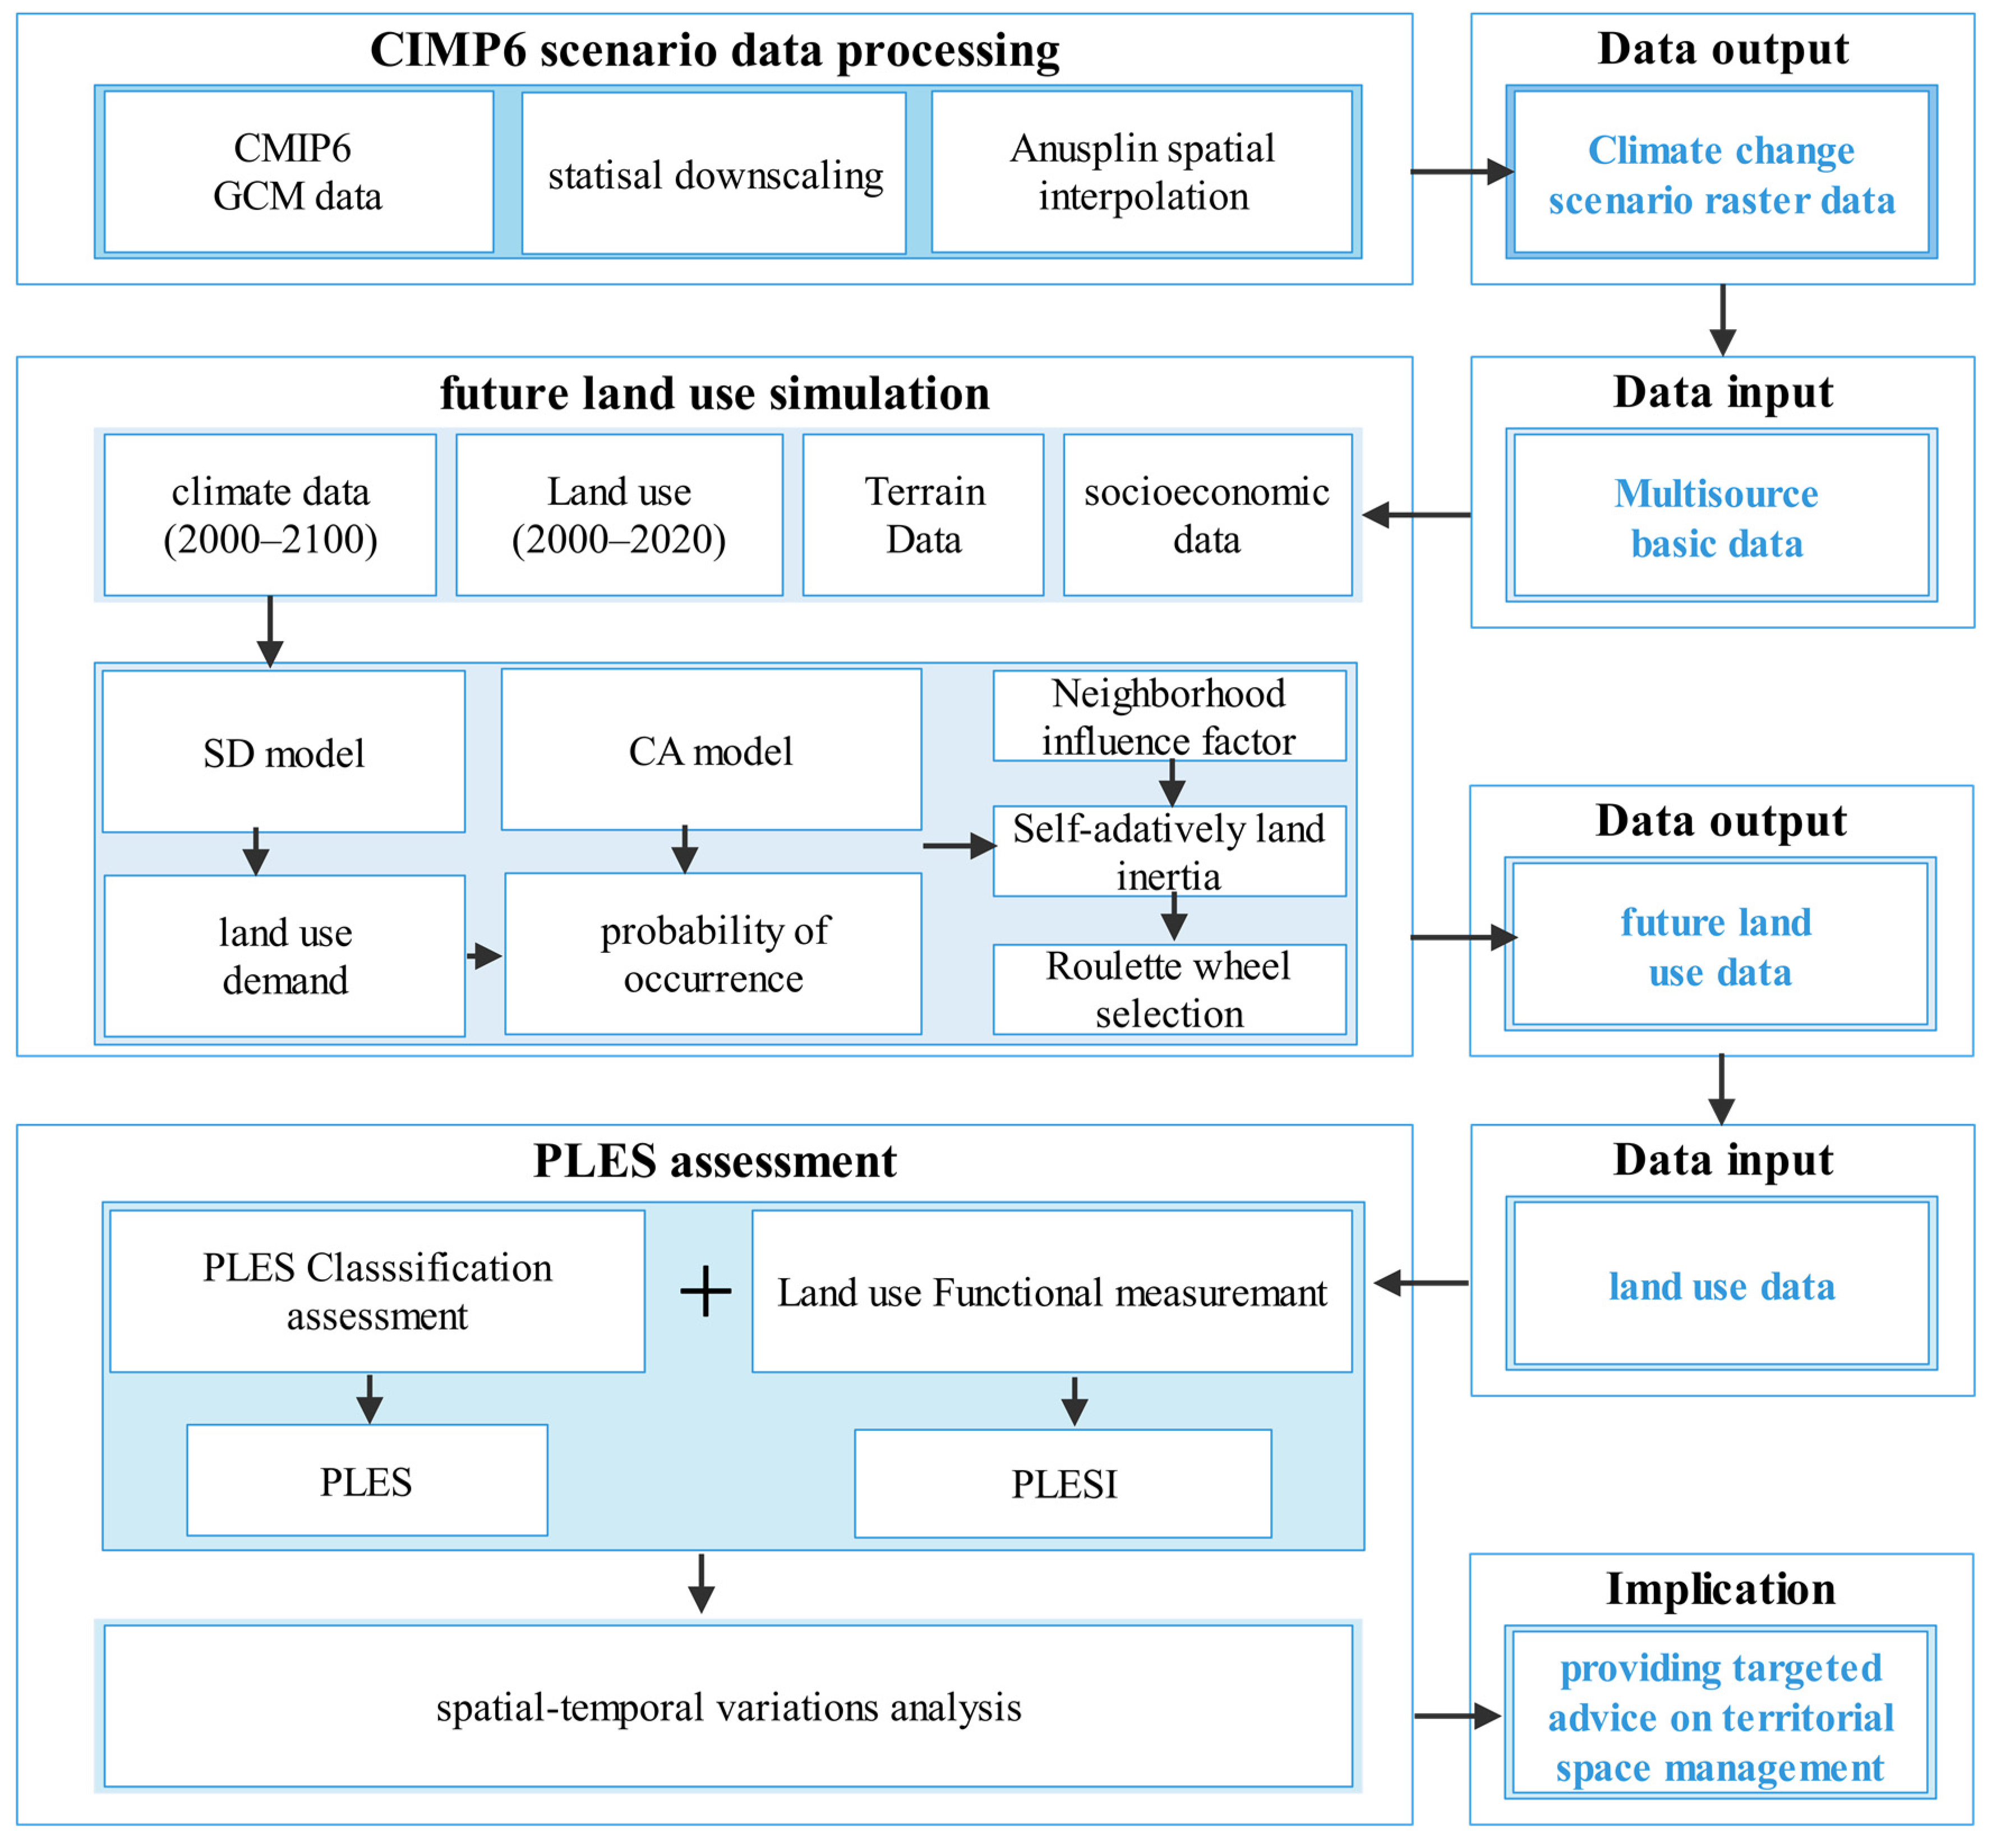
2.2. Research Framework

This study was conducted in three phases: collection and processing of basic data and climate data, simulation of future land use, and evaluation of spatio-temporal variations of PLES and PLESI (Figure 2).
First, site-scale climate scenario data of CMIP6 model were obtained with statistical downscaling method, then spatial interpolation was employed to generate future climate scenario raster data of the URHR. In the second step, with the FLUS model, the future land scenario data of URHR was produced using the historical and future data of driving factors of land use. In the third step, the temporal and spatial evolution of future PLES and PLESI scenarios in the URHR were analyzed through the classifications of land functions and the multifunctional measurement model of land types in order to provide specific advice on the regional land use management and territorial space optimization, etc.

2.3. Data Sources

In this study, multiple sources of historical data and future climate scenario data were used to process the simulation of future land use. Specific research data are in Table 1:
(1)
Meteorological observation data of the national meteorological stations in the URHR and the surroundings during the historical period (2000–2020) were derived from the Chinese surface meteorological observation dataset released by China Meteorology Administration.
(2)
CMIP 6 climate model data for the future period (2021–2100) were obtained from daily data of the global climate models of the World Climate Research Program under the SSP2-4.5 and SSP5-8.5 scenarios.
(3)
Land use data in historical period (2000–2020) were from the global ESA Land Cover dataset ESA CCI Land Cover project released by the European Space Agency (ESA).
(4)
In the simulation of land use in the future period, the main data are land use data in the base period, prediction data in the future climate scenarios, soil data, topographic data (DEM), and socio-economic data (raw data of population, GDP, city center and transportation network elements). The slope and aspect data are obtained through DEM data processing. Resulting from the traffic network data, the driving factors including the distance data to places such as the city center, town center, expressway, airport, river, railway station, railway and traffic artery in the simulation of land use are generated through GIS.
All data were processed in TIF format with 1 km spatial resolution through the processes of vector-to-raster and resampling on the ArcGIS 10.6 software platform.

2.4. Methods

2.4.1. Future Climate Scenarios

Combining CMIP5 Representative Concentration Pathways (RCPs) and Shared Socioeconomic Pathways (SSPs), the CMIP6 constructs a new scenario matrix (RCP-SSP integrated scenario) to clearly reflect the simulation of greenhouse gas emissions and improve the precision of climate simulation [40,41,42,43]. Climate scenarios data were generated with global climate model output data and statistical downscaling method [44,45,46]. Specifically, the process of climate scenario data includes the following steps:
(1)
The selection of climate scenarios:
The emission scenarios from CMIP6 include low emission scenarios (SSP1-1.9 and SSP1-2.6), a medium emission scenario (SSP2-4.5) and high emission scenarios (SSP3-7.0 and SSP5-8.5) [47,48]. The low-emission scenarios envisage a future in which greenhouse gas emissions are substantially reduced and socio-economic development is apt to be more sustainable. The medium emission scenario assumes that greenhouse emissions will maintain the current level and represent the closest to the current greenhouse emission scenarios. The high emission scenarios indicate rapid socio-economic growth and significant impacts on the global climate [49,50].
At present, the SSP2-4.5 and SSP5-8.5 scenarios have become common in the studies to simulate the response of climate change and related socio-economic scenarios, representing two scenarios of maintenance the status quo of development and maximum greenhouse gas emissions [48,49,50,51,52,53]. Therefore, these two scenarios are selected to drive the climate and land use models in this research.
(2)
Download data in two scenarios of 27 models from the Global Climate Model (GCM) output of CMIP6.
(3)
Based on the improved weather generator, GCM raster data are downscaled from spatial coarse resolution to meteorological station. For specific operating principles, please refer to the study of Liu et al. [44] and Wang et al. [45].
(4)
The correlation coefficient between projected and observed data is evaluated through the quantitative index S of the Taylor Chart [54,55,56], the spatial skill score is used to evaluate the spatial correlation coefficient between projected and observed data [57], and the temporal skill score is quantified to assess the simulation efficiency of the projected value at each point in the space to simulate the inter-annual change of the observed value [58,59,60]. The two models, UKES and MIR2, were selected based on the ranking of the total scores. Therefore, with multi-model ensemble mean approaches [61,62], the average value of the two models was obtained as the prediction data in the future climate scenarios.

2.4.2. Land Use Simulation

In FLUS model applications, most studies take historical climate data as a driver of land use change, ignoring the future climate scenario [63], while the coupling of CMIP6 data and FLUS model in this study can increase the simulation accuracy of FLUS model.
The simulation processes of land use in the URHR are as follows: Firstly, the System Dynamics model (SD) is used to obtain land use demand data in the future based on climate change scenarios, socio-economic scenarios and historical land use. Secondly, a Cellular Automata model (CA) based on an Artificial Neural Network model (ANN) is used to estimate the change probability in different land categories, and the overall land adaptability probability of the cell is calculated. Thirdly, combining self-adaptive inertia coefficient and roulette wheel selection mechanism, multiple iterations are made based on the demand and the actual situation of land use, and then the future land use data were obtained [29].
In the process of data verification, with actual land utilization data in 2020, FLUS was applied to generate land utilization simulation data in 2020. Then, actual and simulated land utilization data in 2020 were input into FLUS, random sampling was selected in the sampling mode with the sampling proportion was 20%, and the Kappa coefficient was 0.96, indicating that FLUS model was in good consistency for the future land use simulation in the URHR.

2.4.3. Classification System and Functional Measurement of PLES

In terms of production space (PS), these land types can be divided according to three main industry types. Living space (LS) refers to areas that can provide living needs for human beings such as living, rest, entertainment and consumption. Ecological space (ES) is the foundation of PLES, which can provide the guarantee for sustainable land use [17] and supply ecosystem services such as supporting services and regulating services, and maintain the ecological environment for human being [18].
The production–living–ecological space (PLES) types of different land use were determined by the differences of land functions and land utilization types. With the first-level land classification, dryland (DL) and paddy field (PF) are defined as production space (PS), forest land (FL), grassland (GL) and water land (WL) as ecological space (ES), and building land as living space (LS) [64].
Based on the actual situation of the multifunctionality of different land utilization categories [15,19], the multi-functional measurement index of PLES (PLESI) was constructed to finely evaluate the functional level of PLES on a spatial scale in the URHR. The formula for evaluating is shown as
P L E S I n = 0.25 × P F I n + 0.5 × E F I n + 0.25 × L F I n
where P L E S I n is the multi-function index of PLES in pixel n , P F I n is the land production function index in pixel n , E F I n is the land ecological function index in pixel n , and L F I n is the land living function index in pixel n .
As for the actual situation of the diversity functions of different lands and the previous research results, the production, living and ecological function of different lands were quantitatively evaluated by four grades based on the scoring system [19,35]. Among them, the number 5 refers to the high function index (production function, ecological function or living function) of a land type, 3 means the medium land function, 1 is for the weak function, and 0 indicates that the function of a land type is missing (Table 2) [16,21,35].

3. Results

3.1. Spatio-Temporal Variations in Land Use and PLES

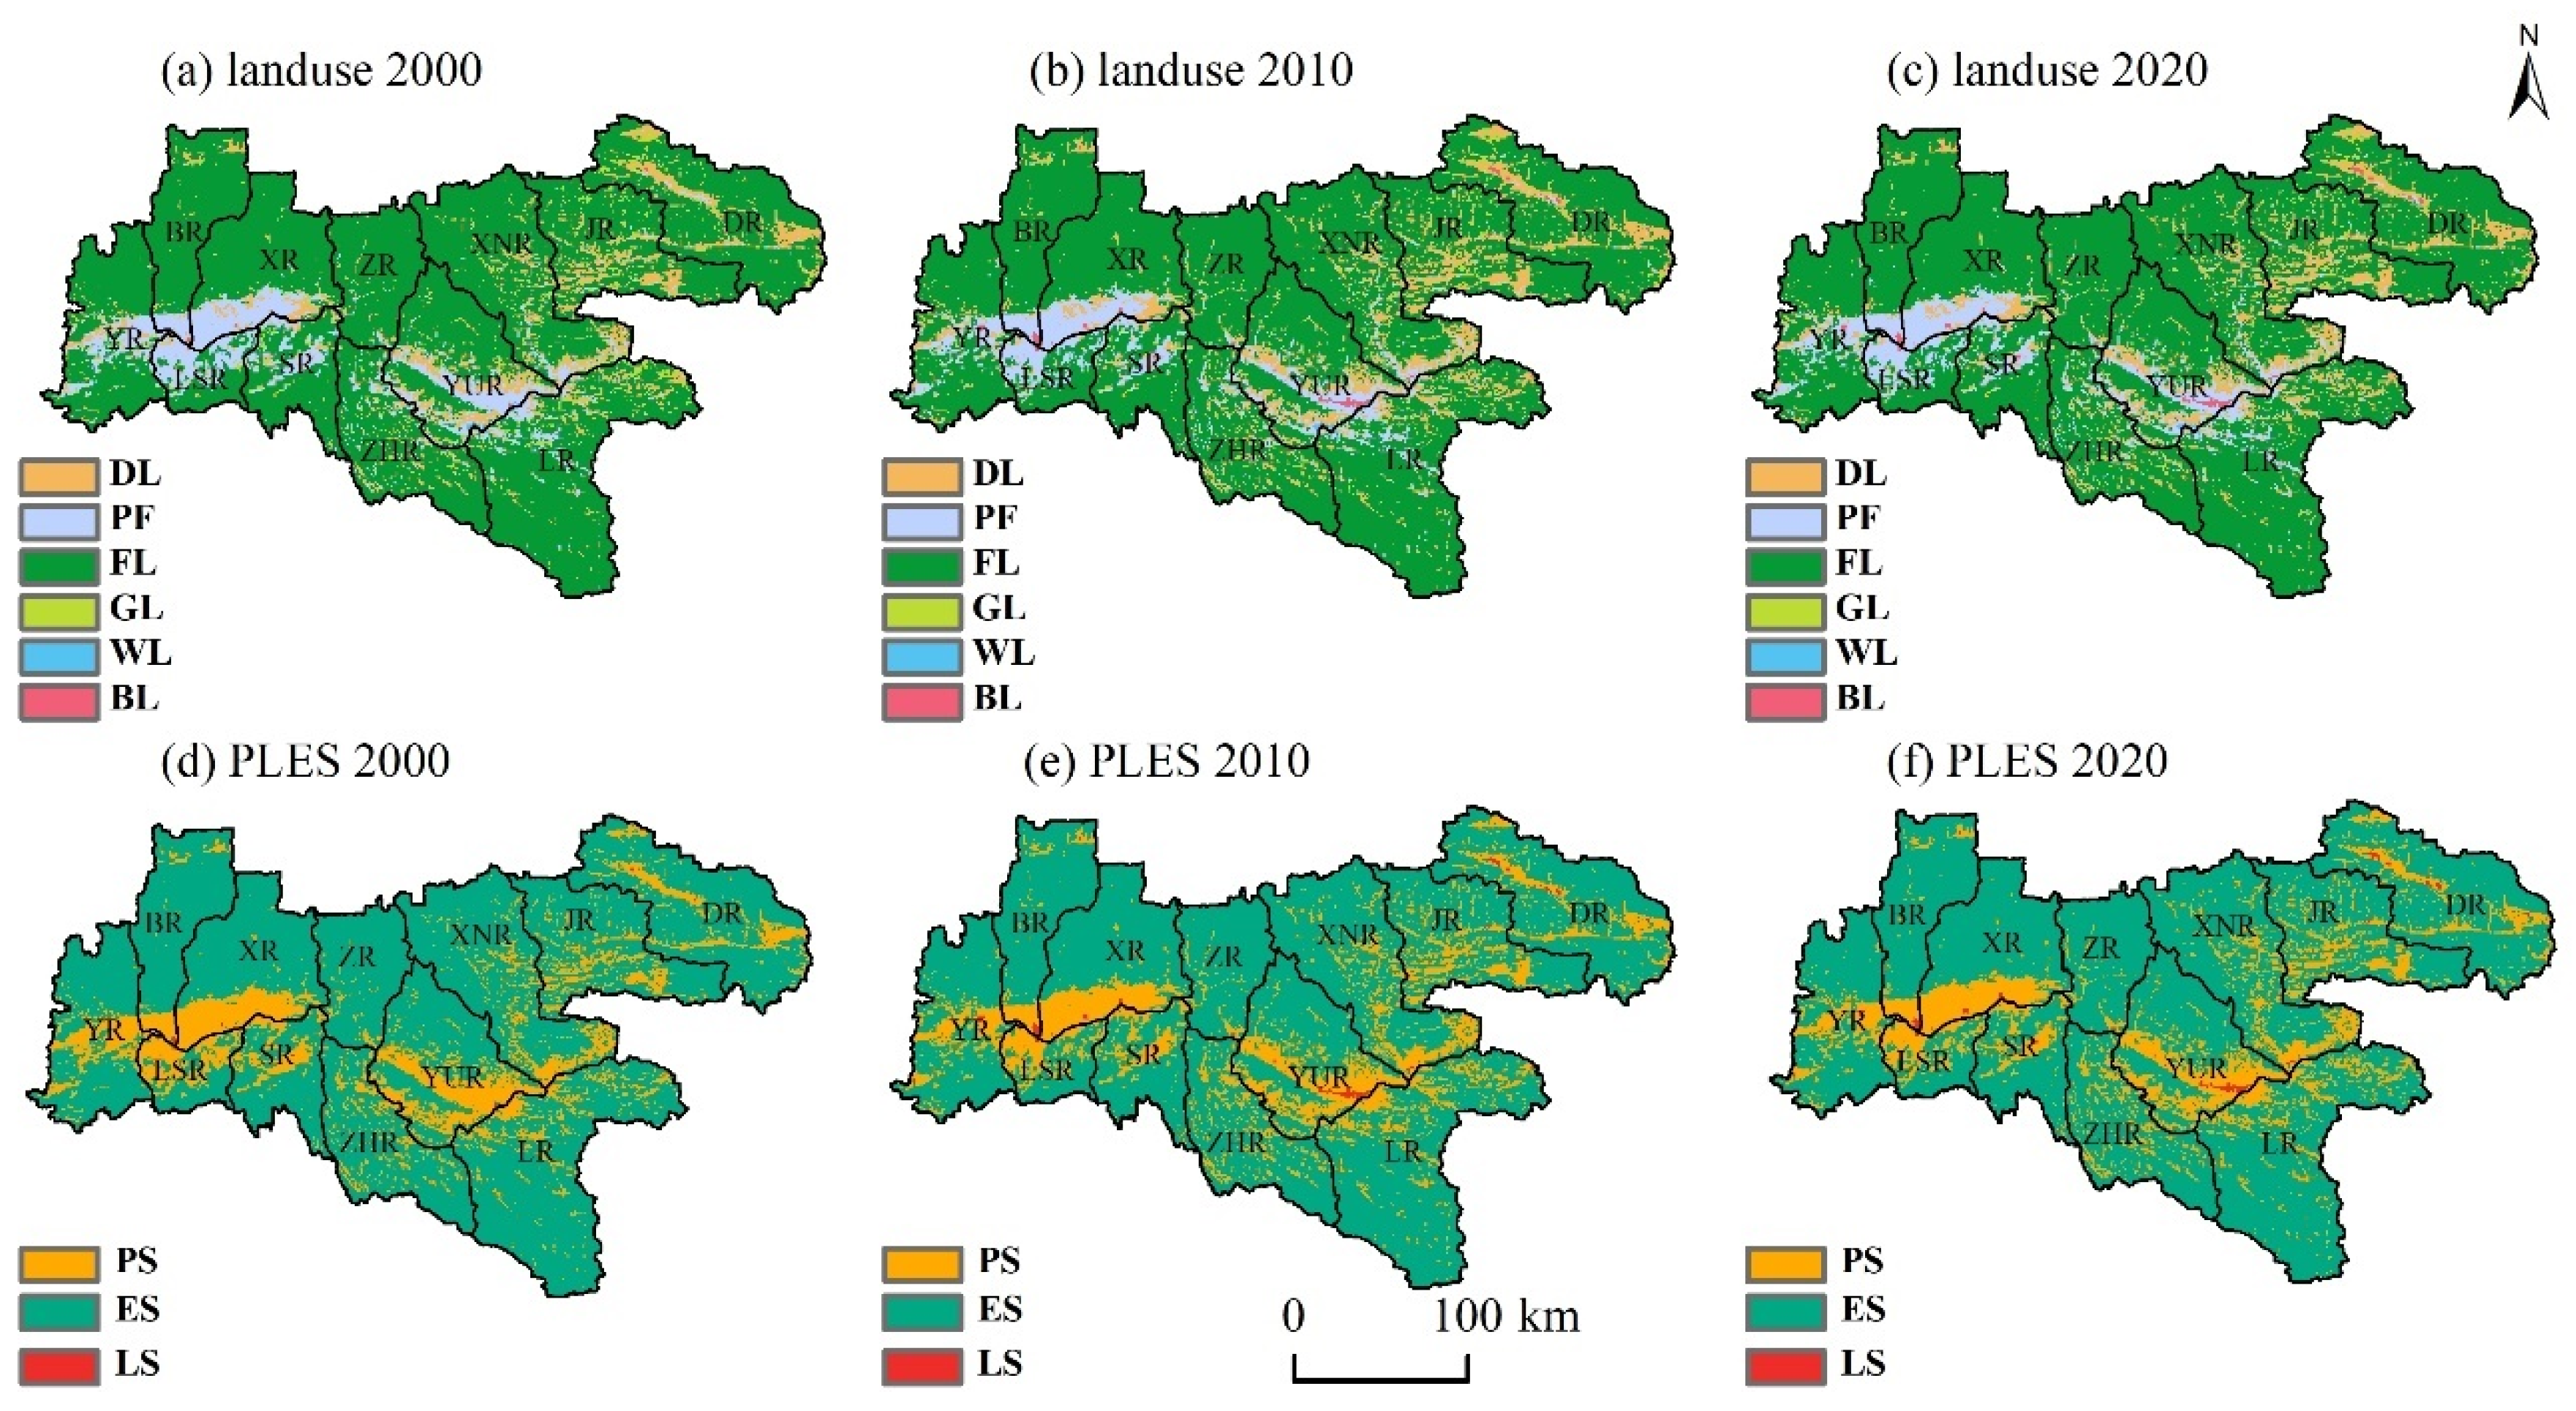
3.1.1. Variations in Land Use and PLES in Historical Period

The results showed that dryland, paddy field, forest land and grassland in the URHR are the main land use categories, among which forest land occupies the largest proportion (78.87%) (Figure 3). Dryland was mainly distributed in the northeast, with an average annual distribution area of 6660 km2. Paddy fields were gathered in the Hanjiang Valley, with an area of 5849 km2. Forest land followed this, which was widely distributed in the study area, especially in the Qinling Mountains and Daba Mountains, with an area of 48,821 km2. Grassland was concentrated in the border area between dry land and forest land, the area of which was about 1,138 km2. Building land spread along the main stream of Hanjiang, mainly around Hanzhong City, Ankang City and Shangluo City with an area of approximate 152 km2. Water land was primarily in the border area of ZR and ZHR with an area of 72 km2.
The area of dryland and building land keeps growing from 2000 to 2010, meanwhile, the other land categories fall dramatically, indicating that the local social and economic development and urbanization process were significantly accelerated. In turn, the area of PS and LS was remarkably increased in this period, with the result of encroaching ES. From 2010 to 2020, paddy field, forest land and building land showed a growing trend, while dryland, grassland and water land were in a downward trend. The growth rate of building land had fell sharply, and other land types changed mildly, which indicated that the competition between local PLES tended to ease in this period.
The spatio-temporal simulation of PLES during the historical period showed that ES had the widest distribution area in the study area, followed by PS and LS. PS was concentrated in the Hanjiang Valley, and scattered in some areas of JR and DR, with an average area of 12,509 km2, comprising 19.95% of the URHR. ES was widespread especially in the Qinling Mountains of the northern Hanjiang Valley, with an area of 50,031 km2 over the years, comprising 79.80% of the URHR. LS was located near the central city, covering 152 km2. This indicated that the land function of the URHR was dominated by ecological function, and the intensity of urban development and industrial production activities was small.
In 2000–2010, the change in LS was the most dramatic, followed by PS, which showed an increasing trend with a rate of 5.75%. In contrast, ES experienced a decreasing trend at a rate of 1.73%. In 2010–2020, PS had a reduction of 0.71%, ES showed a slight increase trend of 0.18%, and LS increased slowly at a rate of 0.18%. The results also showed that the competition for PLES in this area was more intense in the first decade, and the expansion of LS and PS had caused a greater encroachment on ES. In recent ten years, due to the effective conservation policies, the development of urban expansion and industrial activities tended to be slow, and ES showed an upward trend, which would better promote the ecological environment in the URHR.

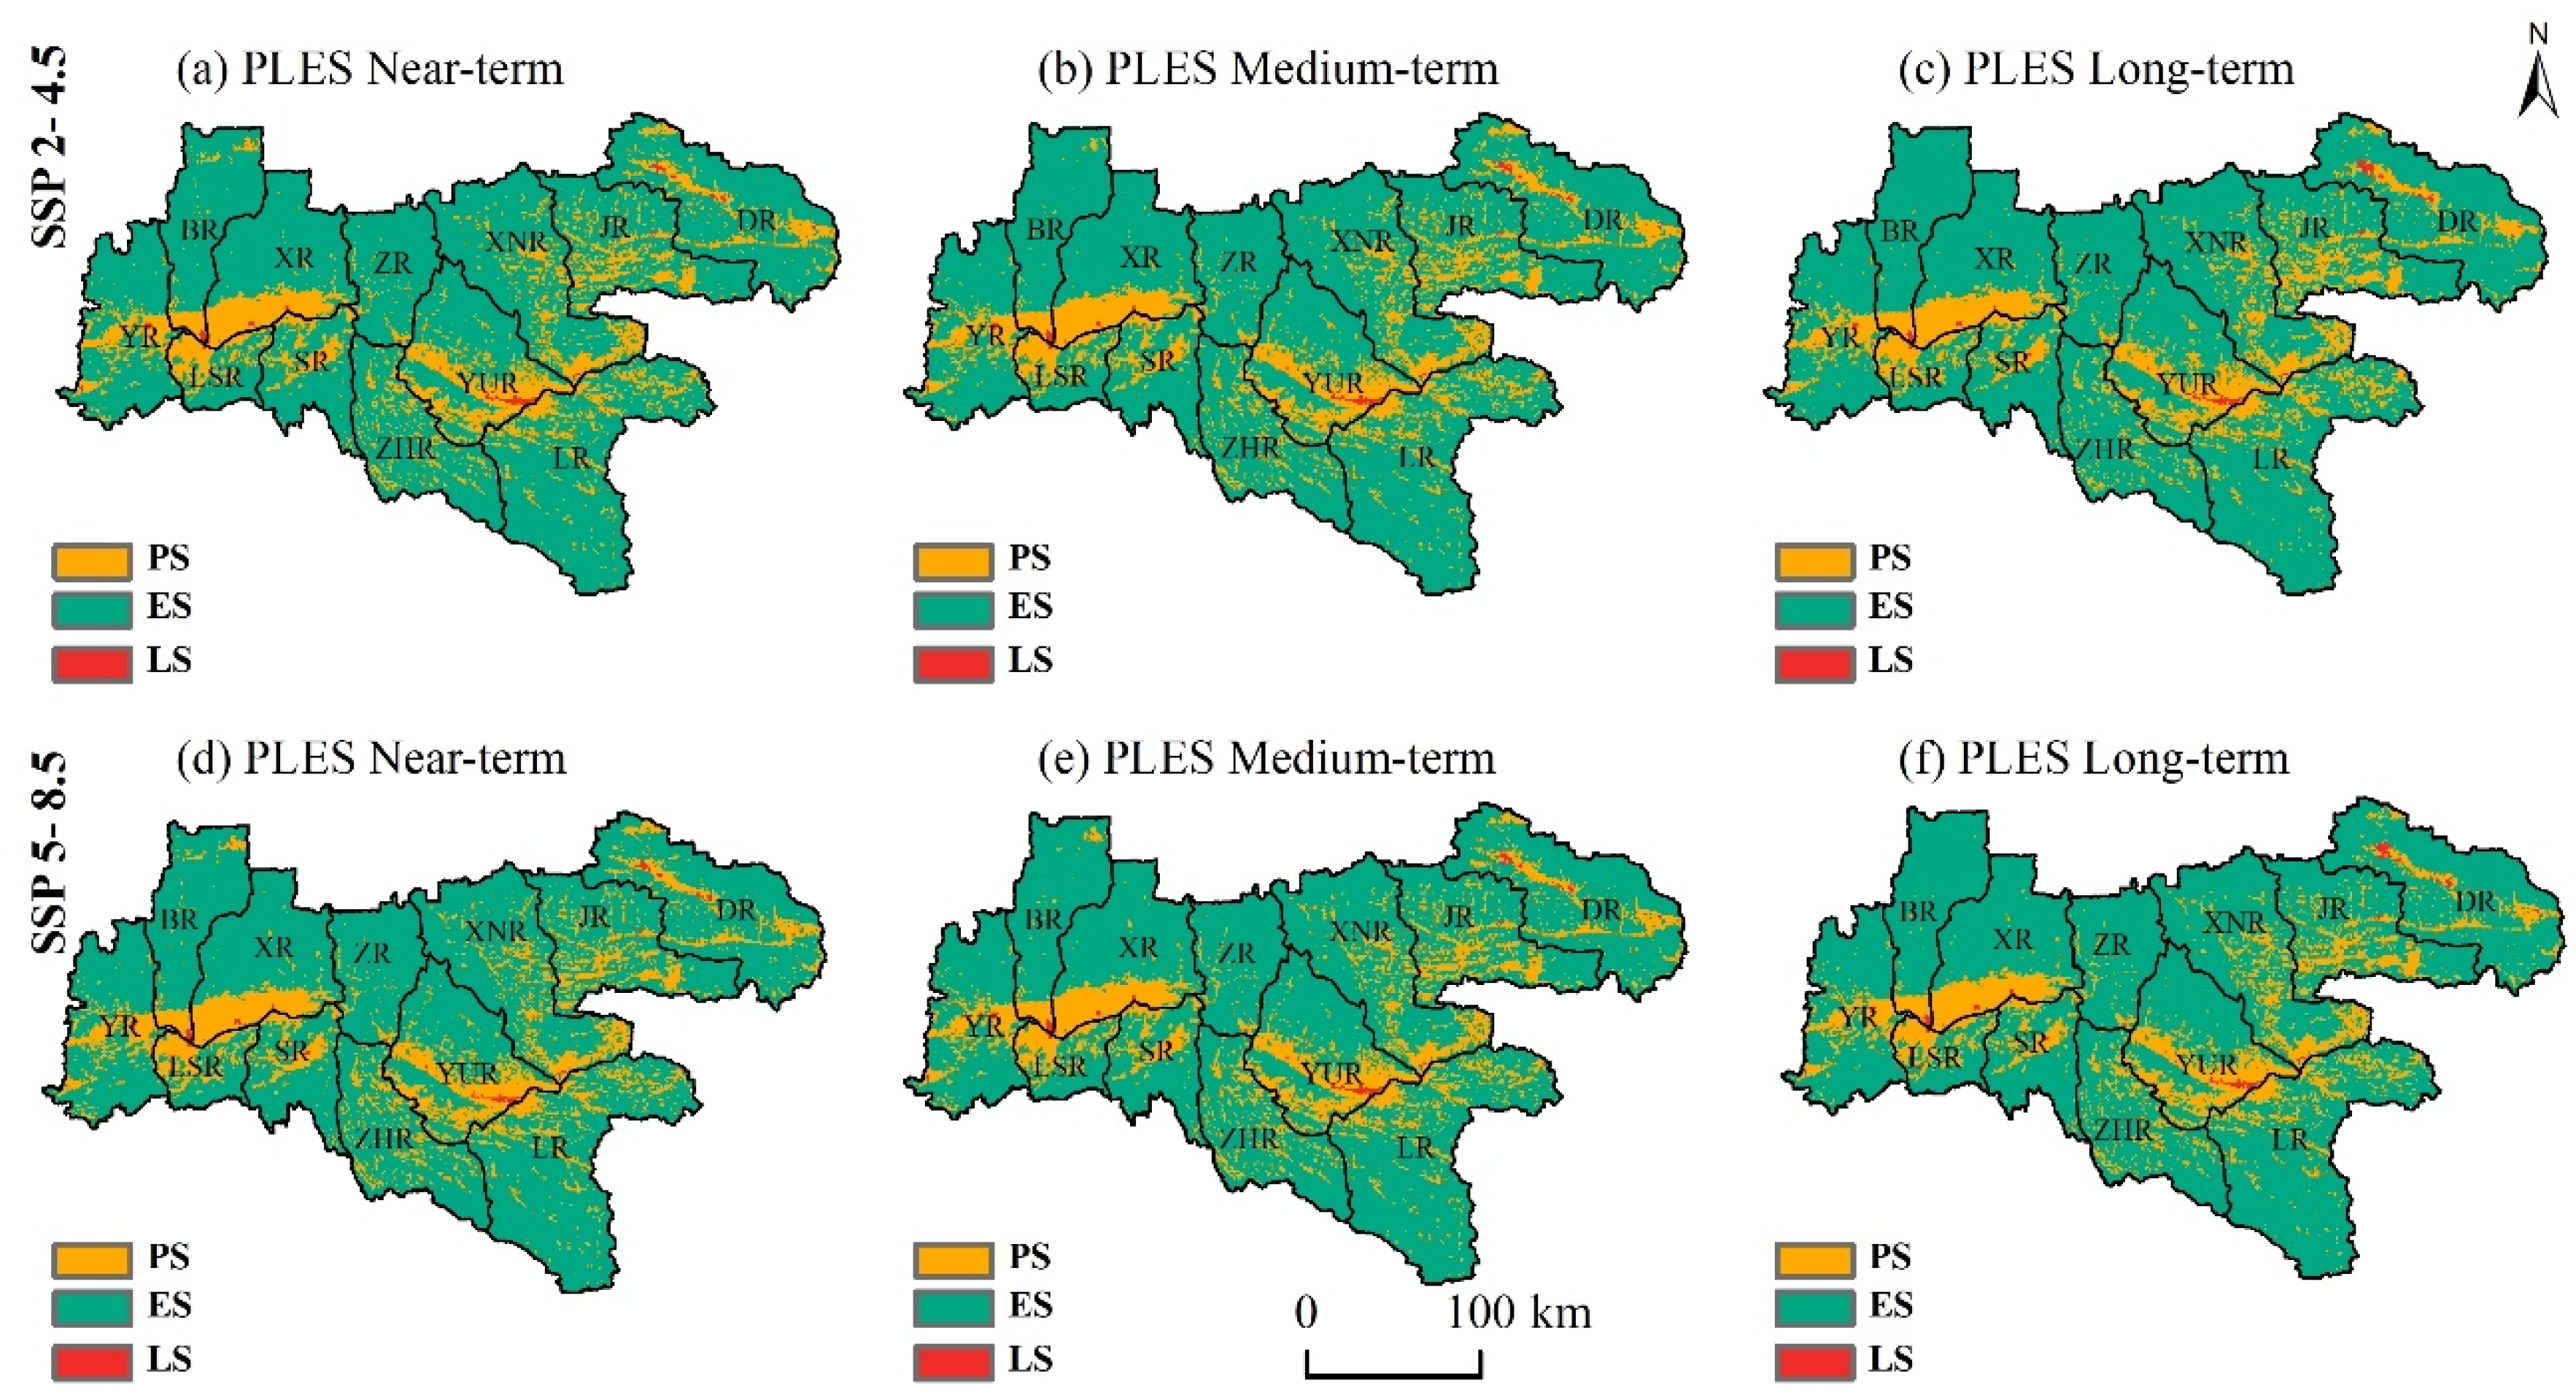
3.1.2. Variations of Future PLES under Different Scenarios

The future period in this research consists of near-term, medium-term and long-term, in which 2030 represents the near-term, 2050 represents the medium-term, and 2100 represents the long-term, respectively. The results showed that ES occupied the widest distribution area, followed by PS and LS (Figure 4).
Under the SSP2-4.5 scenario, the average projected distribution area of PS in the three periods is 12,301 km2, 19.65% of the total area of URHR. The average projected distribution area of ES in the three periods is 50,124 km2, comprising 80.07% of the URHR. The average projected distribution area of LS in the three periods is 237 km2, only comprising 0.38% of the URHR. In terms of each stage, PS is projected to decrease at a rate of 0.71% from 2020 to 2030, while ES and LS are projected to increase at a rate of 0.16% and 4.25%, respectively. During 2030–2050, PS will decrease at a rate of 1.41%, and ES and LS will increase at a rate of 0.33% and 6.33%, respectively. During 2050–2100, PS will decrease with a rate of 4.13%, and ES and LS will grow at a rate of 0.81% and 8.51%, respectively. The outcomes reveal that the change amplitude of PLES in three periods is basically the same under the SSP5-8.5 and SSP2-4.5 scenarios.
In the three periods, PS is projected to decline while ES and LS are projected to increase under the two scenarios. The result indicates that local ES development is well guaranteed, and the ecological environment quality is well protected; however, the increase in ES and LS is at the expense of the decrease in PS. It should also be noted that the development of ES is accompanied by slight urban sprawl in the future, which will bring threats to ecological environment, and the decline of PS will also trigger challenges to agricultural production and food security.

3.2. Transfer Evolution of Land Use and PLES under Different Scenarios

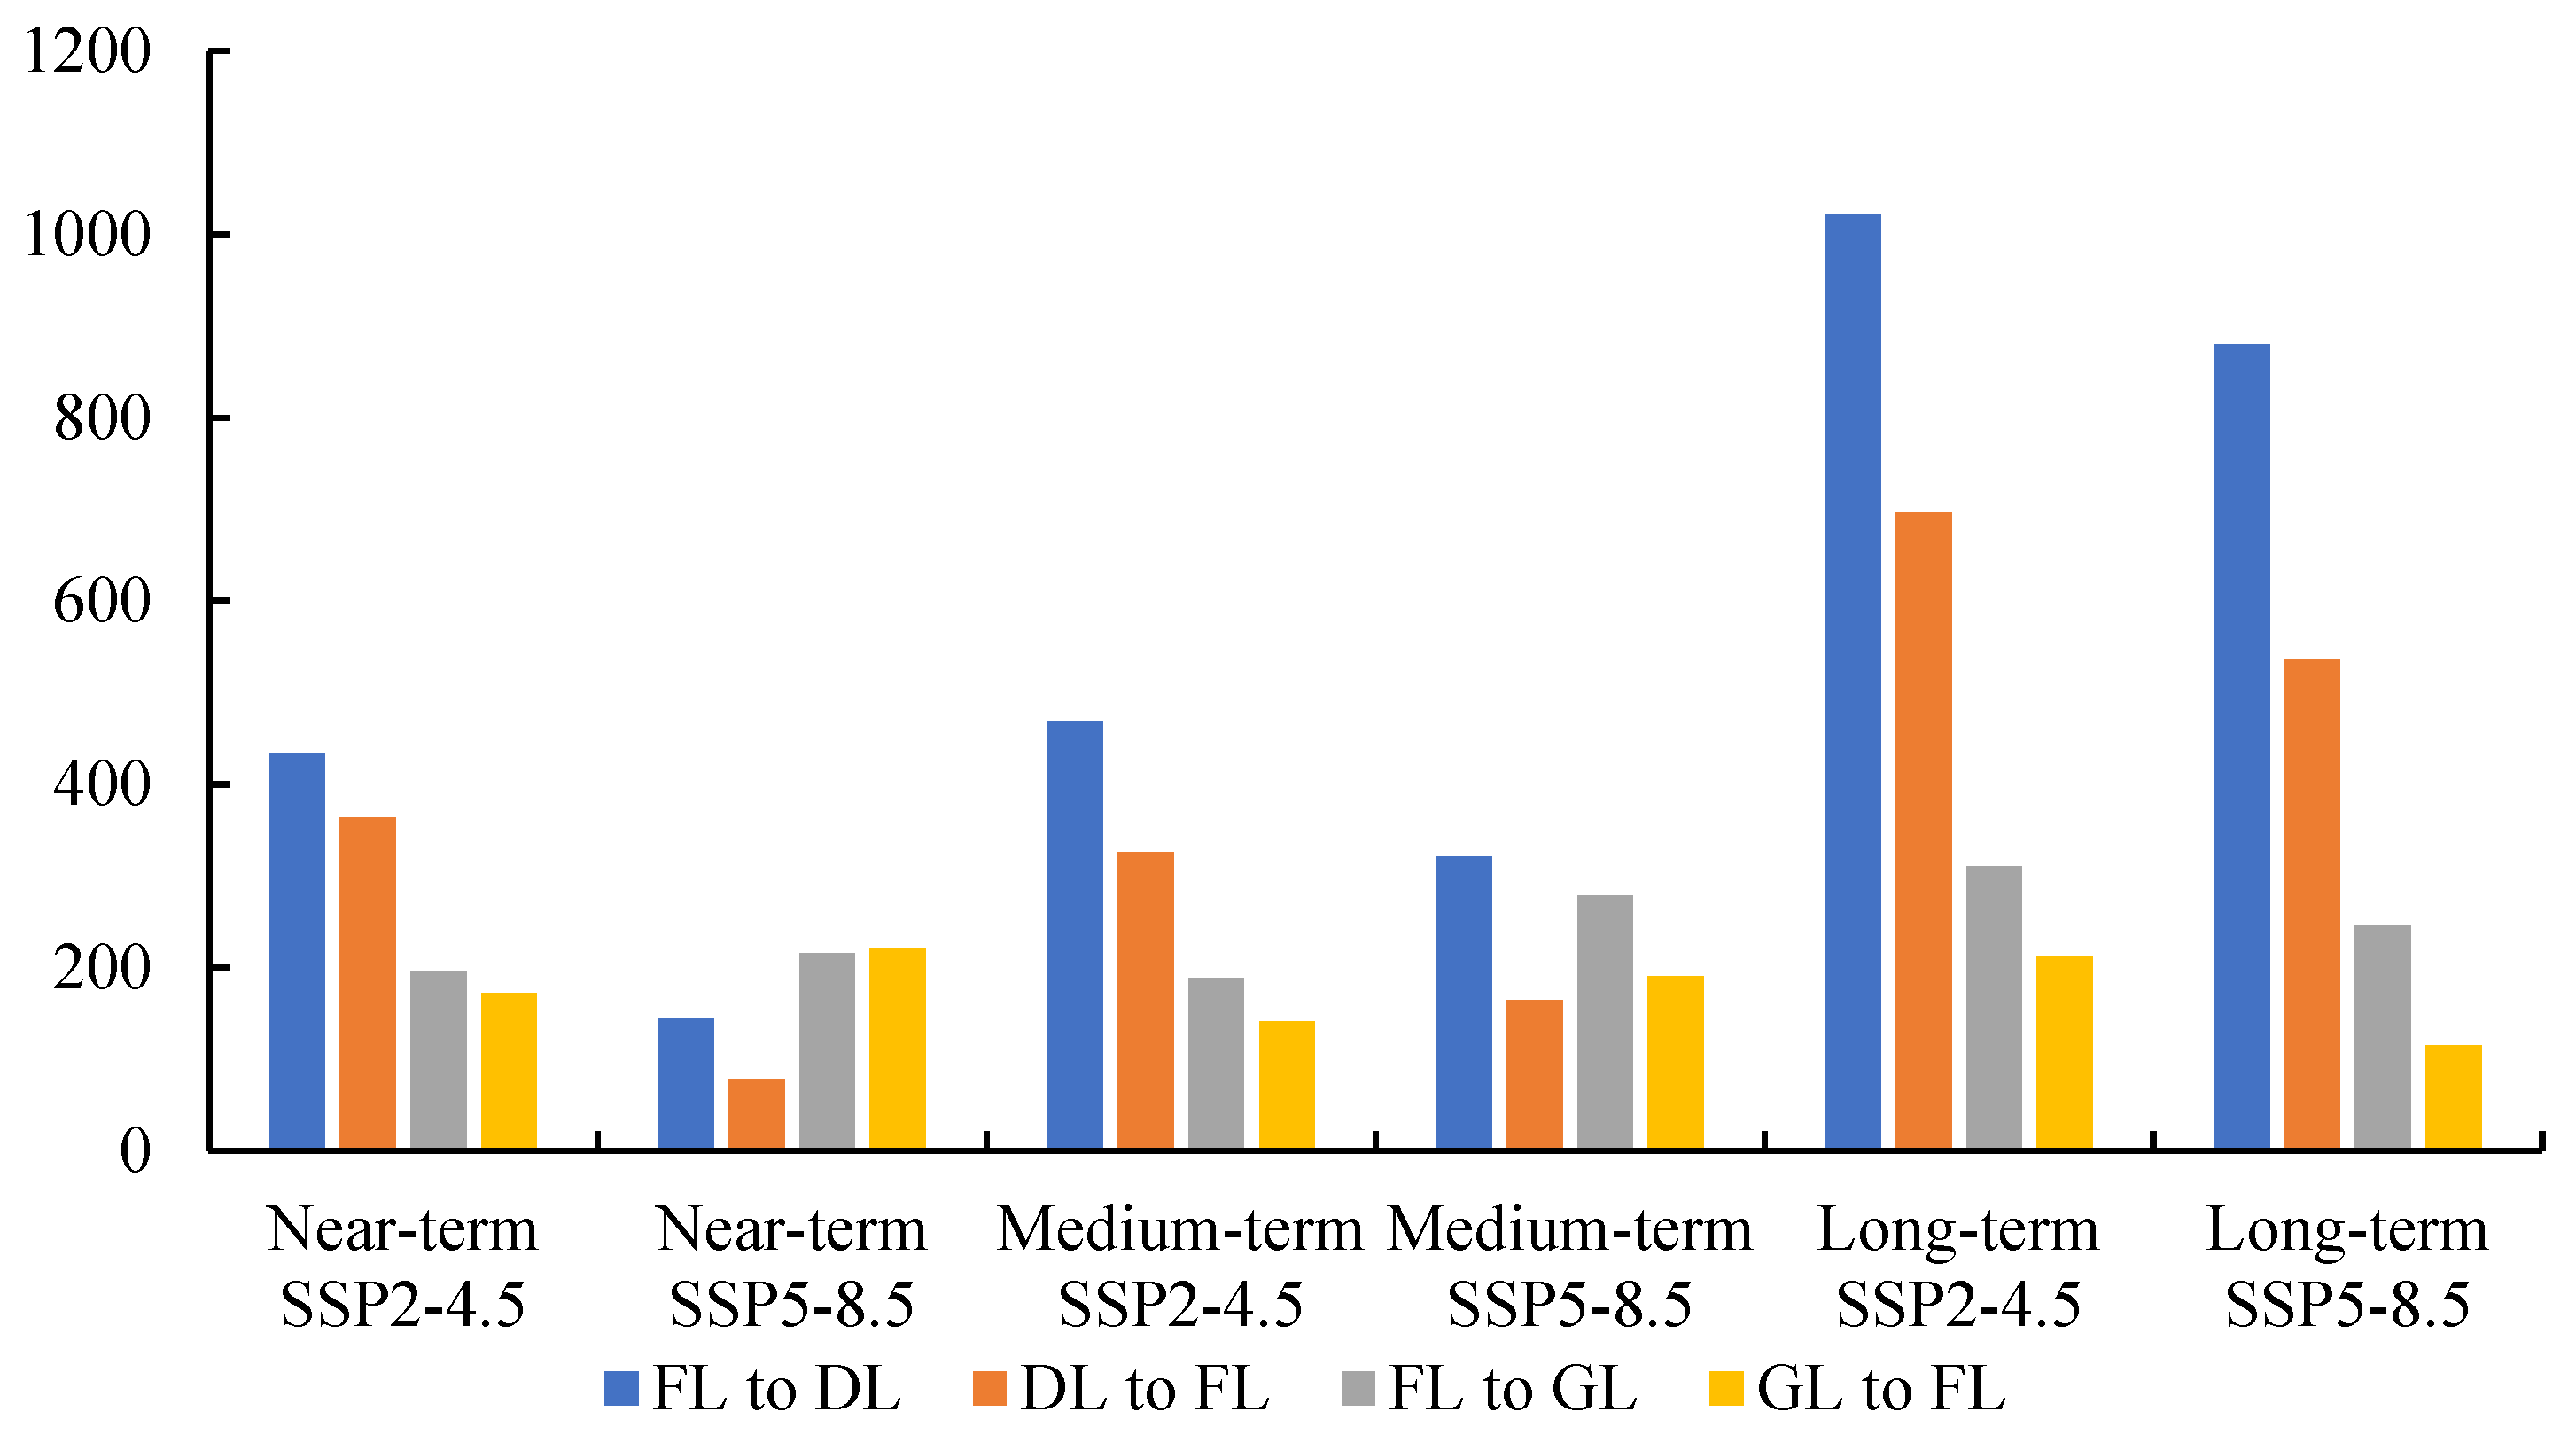
3.2.1. Evolution Characteristics of Land Use in the URHR

The evolution of spatial pattern in PLES is directly affected by the change in land use structure. Given the small area of mutual conversion between paddy field, water land and building land, this research focused on the transfer pattern of forest land, dryland and grassland in the near-term (2020–2030), the medium-term (2030–2050) and the long-term (2050–2100) (Figure 5).
In each period, the transfer of land use is mainly projected as the mutual transformation of forest land and dryland, forest land and grassland. Forest land is projected as the main type of ecological space and the main land class that provides ecological functions, so its change will inevitably have an impact on the structure and quality of PLES. Obvious differences are existing in the amplitude of land utilization transition during different periods. In 2050–2100, the range of land use transformation will be much larger than the other two stages, which would inevitably affect the mutual transformation of ES and PS. The findings showed that the mutual conversion between forest land and dryland under the SSP2-4.5 scenario is significantly larger than that under the SSP5-8.5 scenario, affecting the transformation of ES and PS, while it is the opposite in the case of forest land and grassland under two scenarios.
The transformation of forest land to dryland leads to ES transform into PS, and the function of regional ES will be weakened accordingly, which will further cause the changes in the multifunction level of land use. Both forest land and grassland belong to ES, the mutual transformation of forest land and grassland is only a type of change within ES, there are significant differences in the multifunctional characteristics between these two land use types. The results revealed that the mutual transformation of forest land and grassland will have certain impacts on the multi-functional pattern of land use, but will not change the pattern of PLES.

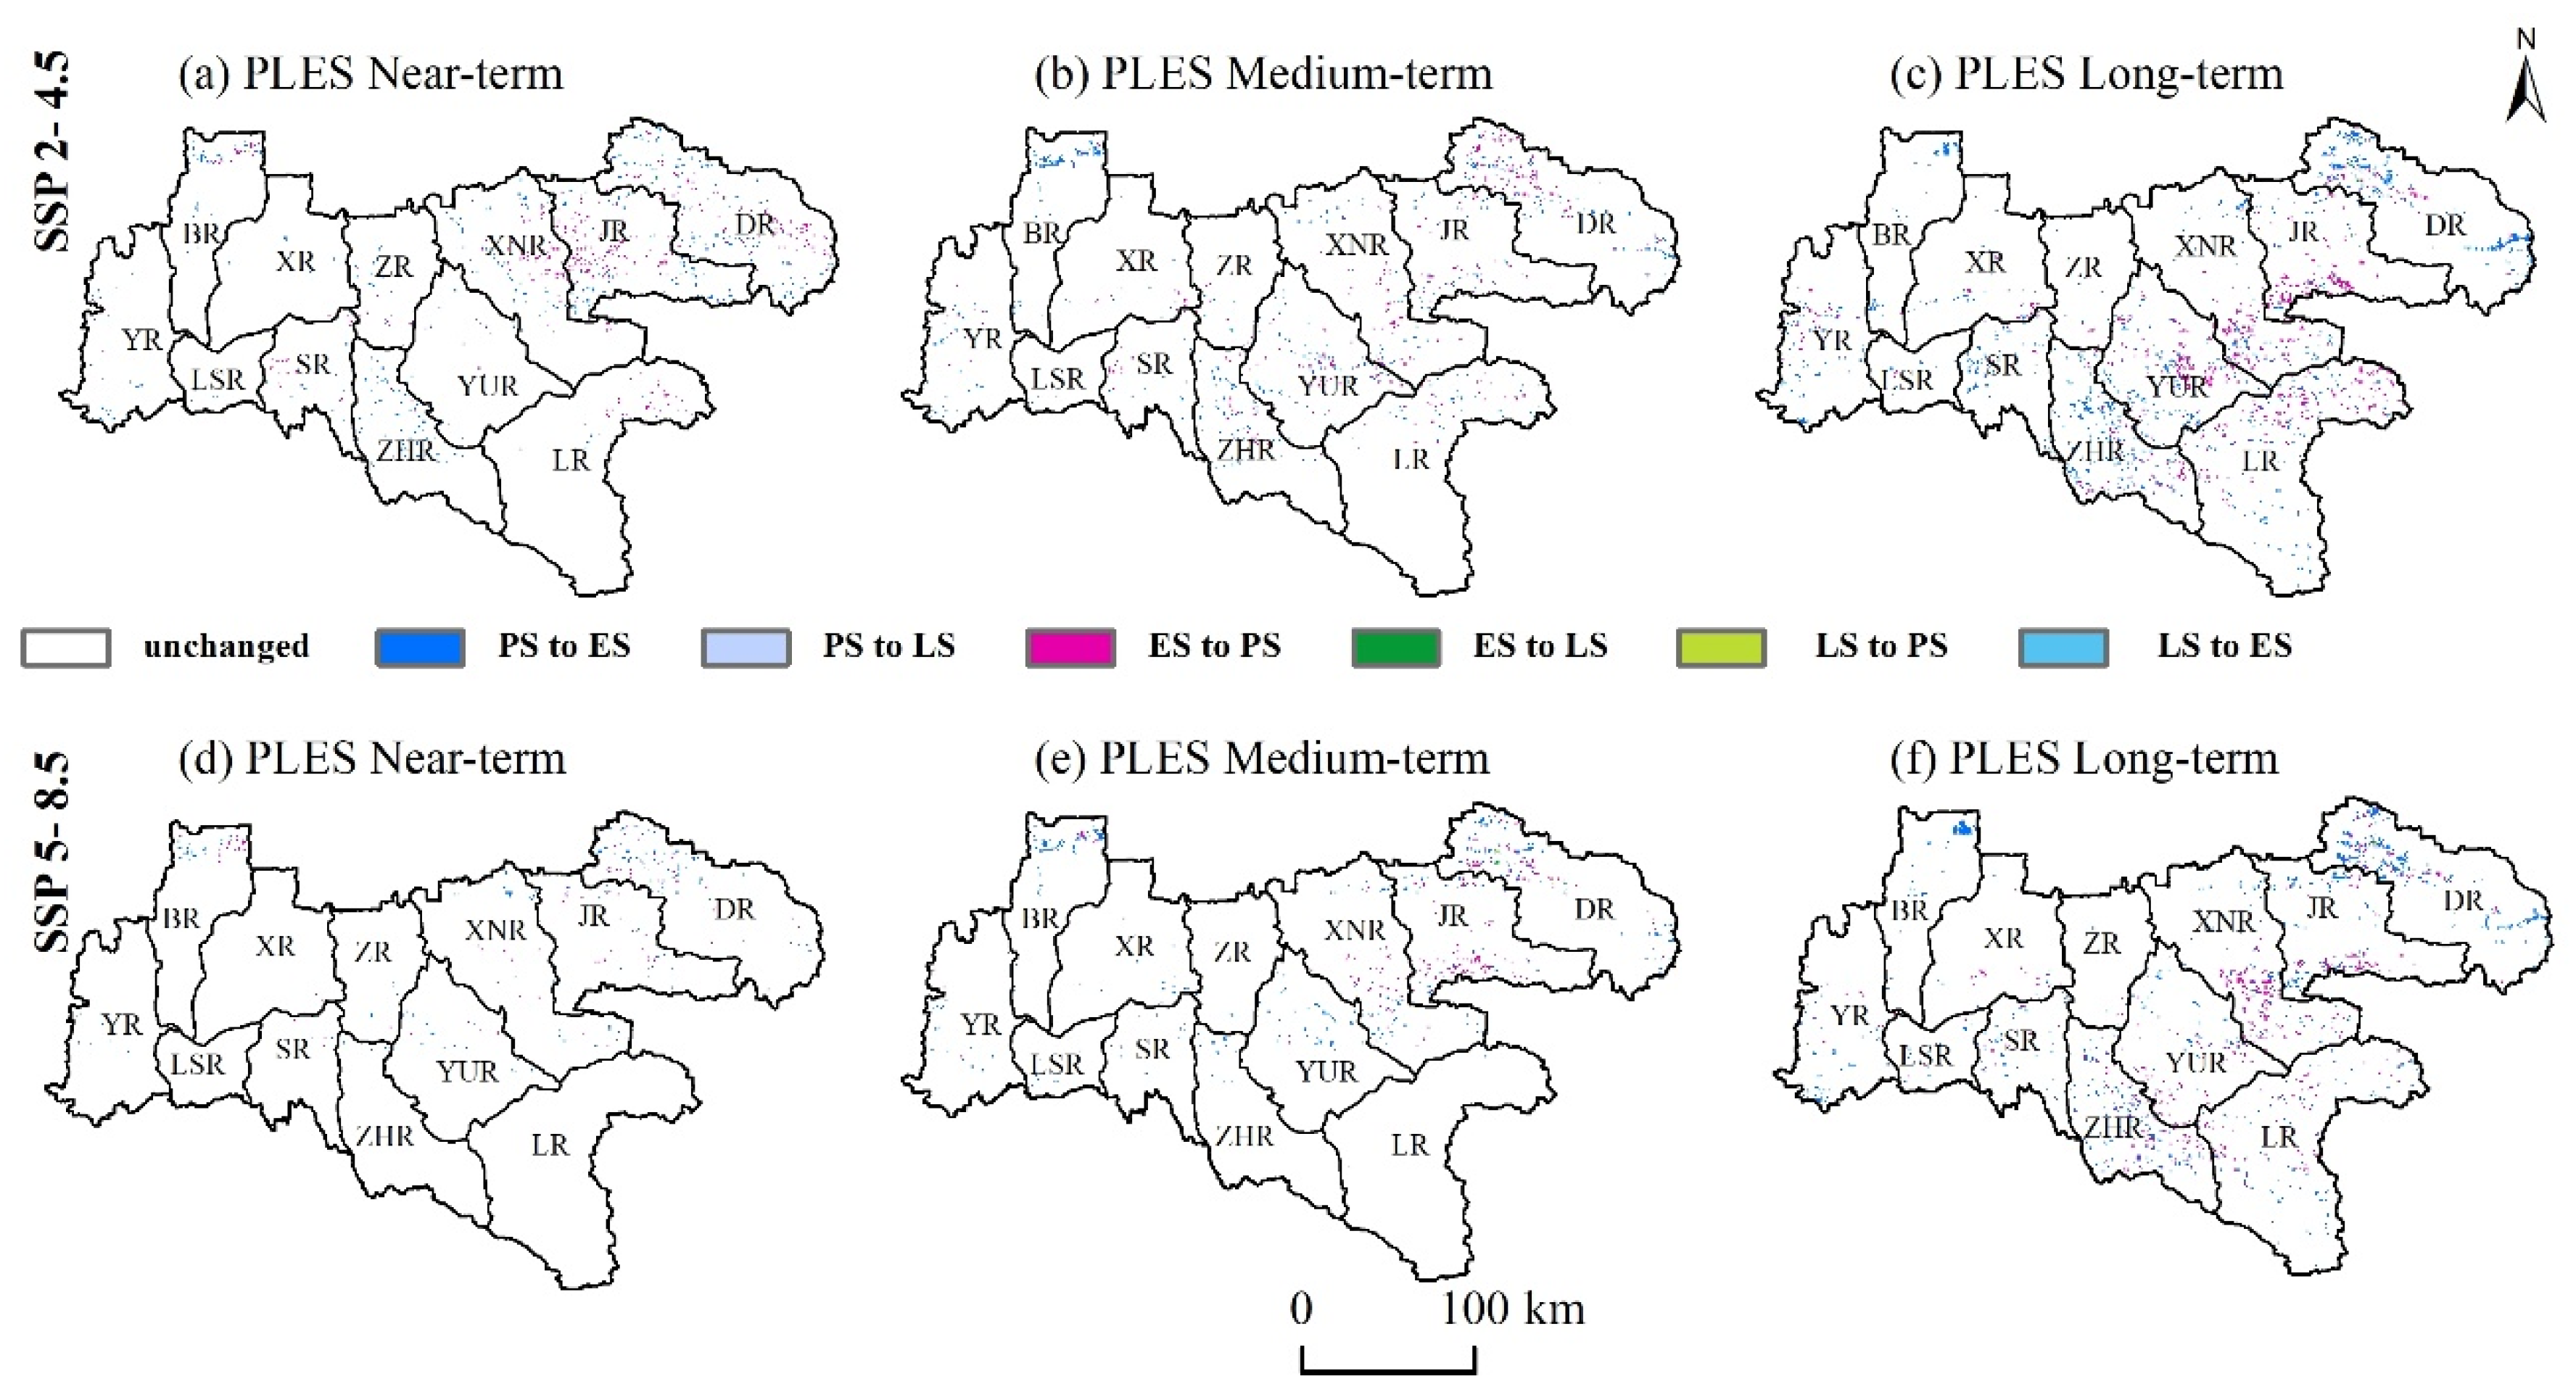
3.2.2. Evolution Characteristics of PLES in the URHR

The mutual transformation process and quantitative relationship of PS, ES and LS types of PLES were analyzed through the land transition matrix method and the spatial patterns of the three types of PLES were assessed in this research (Table 3). It is found that the mutual transformation of PLES is projected mainly in the mutual conversion of PS and ES.
In the SSP2-4.5 scenario in 2030, a total of 459 km2 of PS will be converted to ES, and 373 km2 of ES will be transferred into PS compared to 2020. In 2050, a total of 521 km2 of PS will be converted to ES, and 356 km2 of ES will be converted to PS from 2030. The change of PLES in 2100 is relatively larger than that in 2050, 1,201 km2 of PS converted to ES and 790 km2 of ES to PS. The transfer pattern of PLES under the SSP5-8.5 scenario will be consistent with that under the SSP2-4.5 scenario, except for the smaller amplitude of the PLES transfer in PLES. The results indicated that the change in the spatial pattern of PLES is mainly dominated by the mutual change of PS and ES in the future.

3.2.3. Evolution Characteristics of Land Use in Sub Basins

The spatial differences of the transition in the future land use were analyzed by further dividing the study area (Figure 6).
The results showed that the zones are projected with more frequent land use transformation including XNR, JR, BR and DR in the northwest of the URHR from 2020 to 2030. Forest land and dryland are projected to be mainly interconverted under SSP2-4.5, while under the SSP5-8.5 scenario, it will happen between forest land and grassland, which would trigger a wide range of mutual transformation between ES and PS and strong impact the spatial variations of PLES in these four regions in the SSP2-4.5 scenario.
In 2030–2050, a frequent land use transformation area appeared in XNR, JR, DR and BR. Transition occurs frequently between forest land and dryland in these regions under SSP2-4.5, while it is forest land and grassland under the SSP5-8.5 scenario. In 2050–2100, the transition between forest land and dryland is more frequent, and great changes are gathered in ZHR, DR, XNR and LR under the two scenarios.

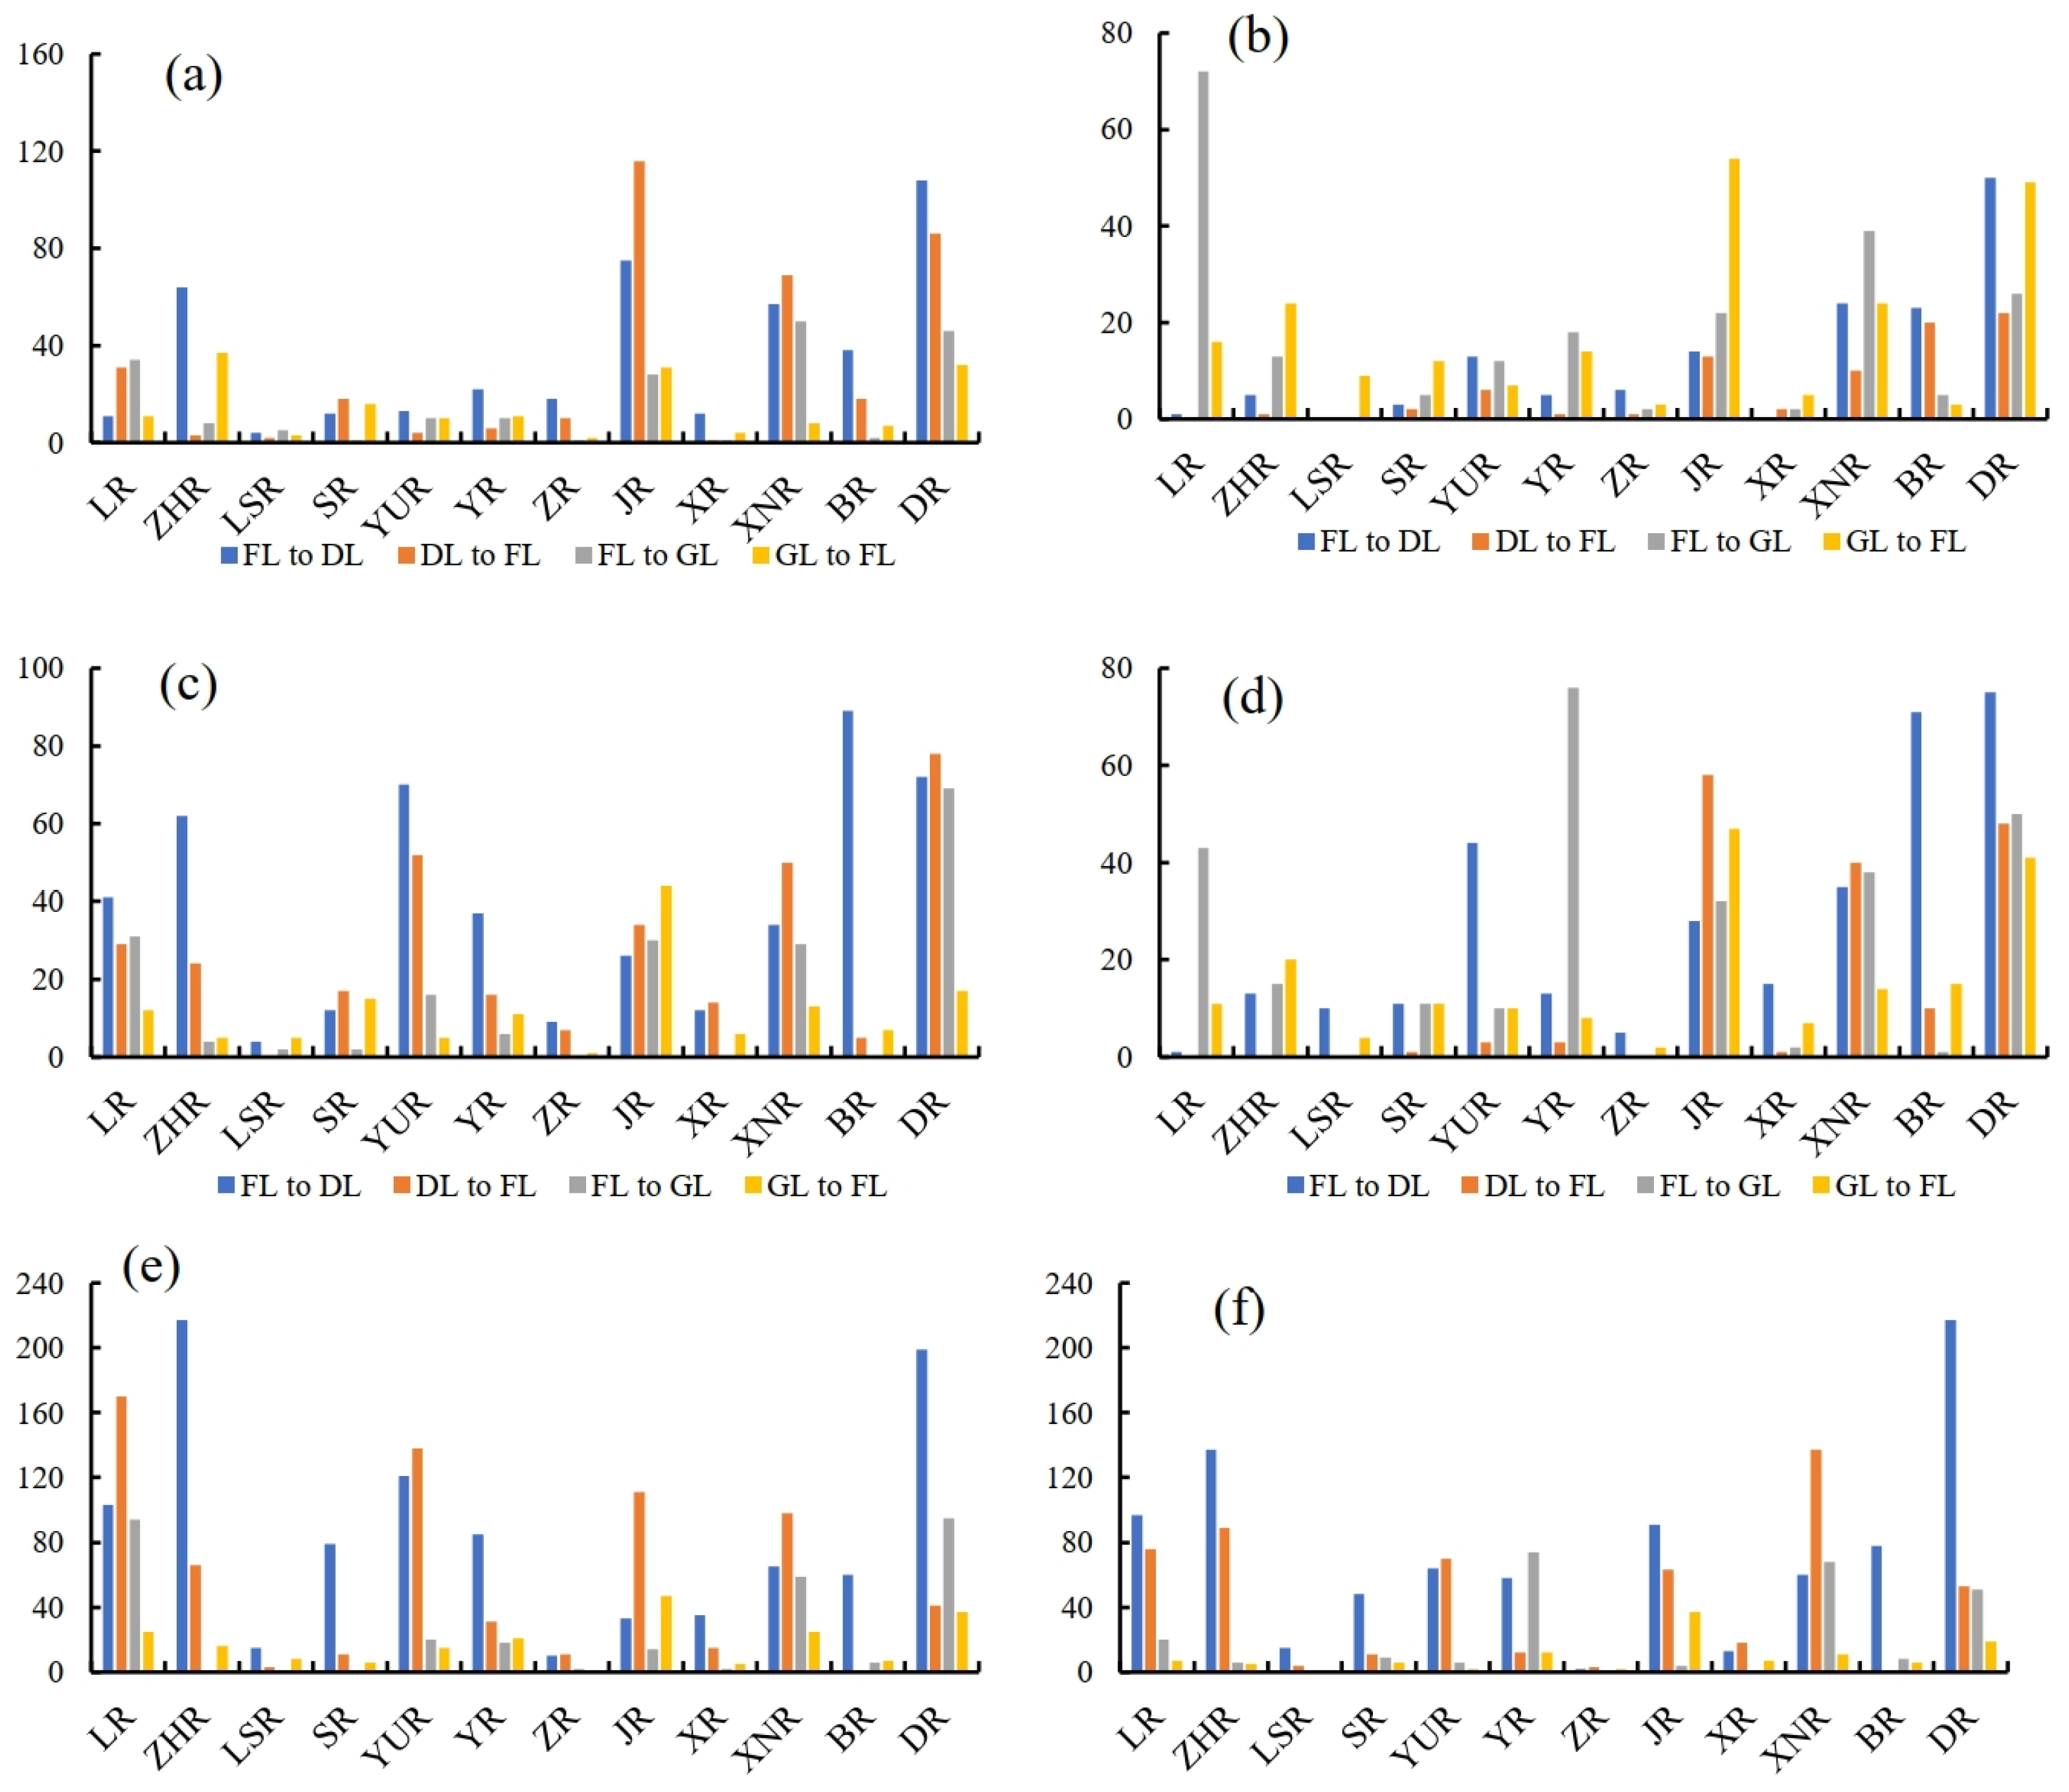
3.2.4. Evolution Characteristics of PLES in Sub Basins

From 2020 to 2030, the transfer of PS to ES are projected mainly in ZHR in the central URHR and XNR, JR and DR in the eastern URHR, while ES to PS transformation areas will be gathered in XNR, JR and DR under the SSP2-4.5 scenario (Figure 7). From 2030 to 2050, the transfer area of PS to ES will be concentrated in BR, and ES to PS transformation are projected mainly in YUR, XNR and DR. From 2050–2100, the regions of PS to ES transformation are projected mainly in ZHR, SR and DR, and the transformation of ES to PS are projected in the surrounding areas of Ankang City.
From 2020 to 2030, the regions of PS to ES are projected mainly in the north of BR and DR, which is basically the same as the region where ES is transformed into PS, indicating that ES and PS are frequently transformed into each other in these two regions during this period under the SSP5-8.5 scenario. From 2030 to 2050, the regions of PS to ES conversion are mainly in the northern part of BR, YUR and DR, while the regions of ES to PS conversion are mainly distributed in the border area of XHR and JR and the northern part of DR. From 2050 to 2100, the transformation area from PS to ES are projected mainly in the northern BR, ZHR and DR.
The findings showed that the BR, DR and XNR were the main concentration areas where the transition of PS and ES are projected frequently in the future, which would lead to great changes in spatial patterns of the PLES and PLESI in these regions in the future.

3.3. Functional Measurement of PLES in Different Land Use and Climate Scenarios

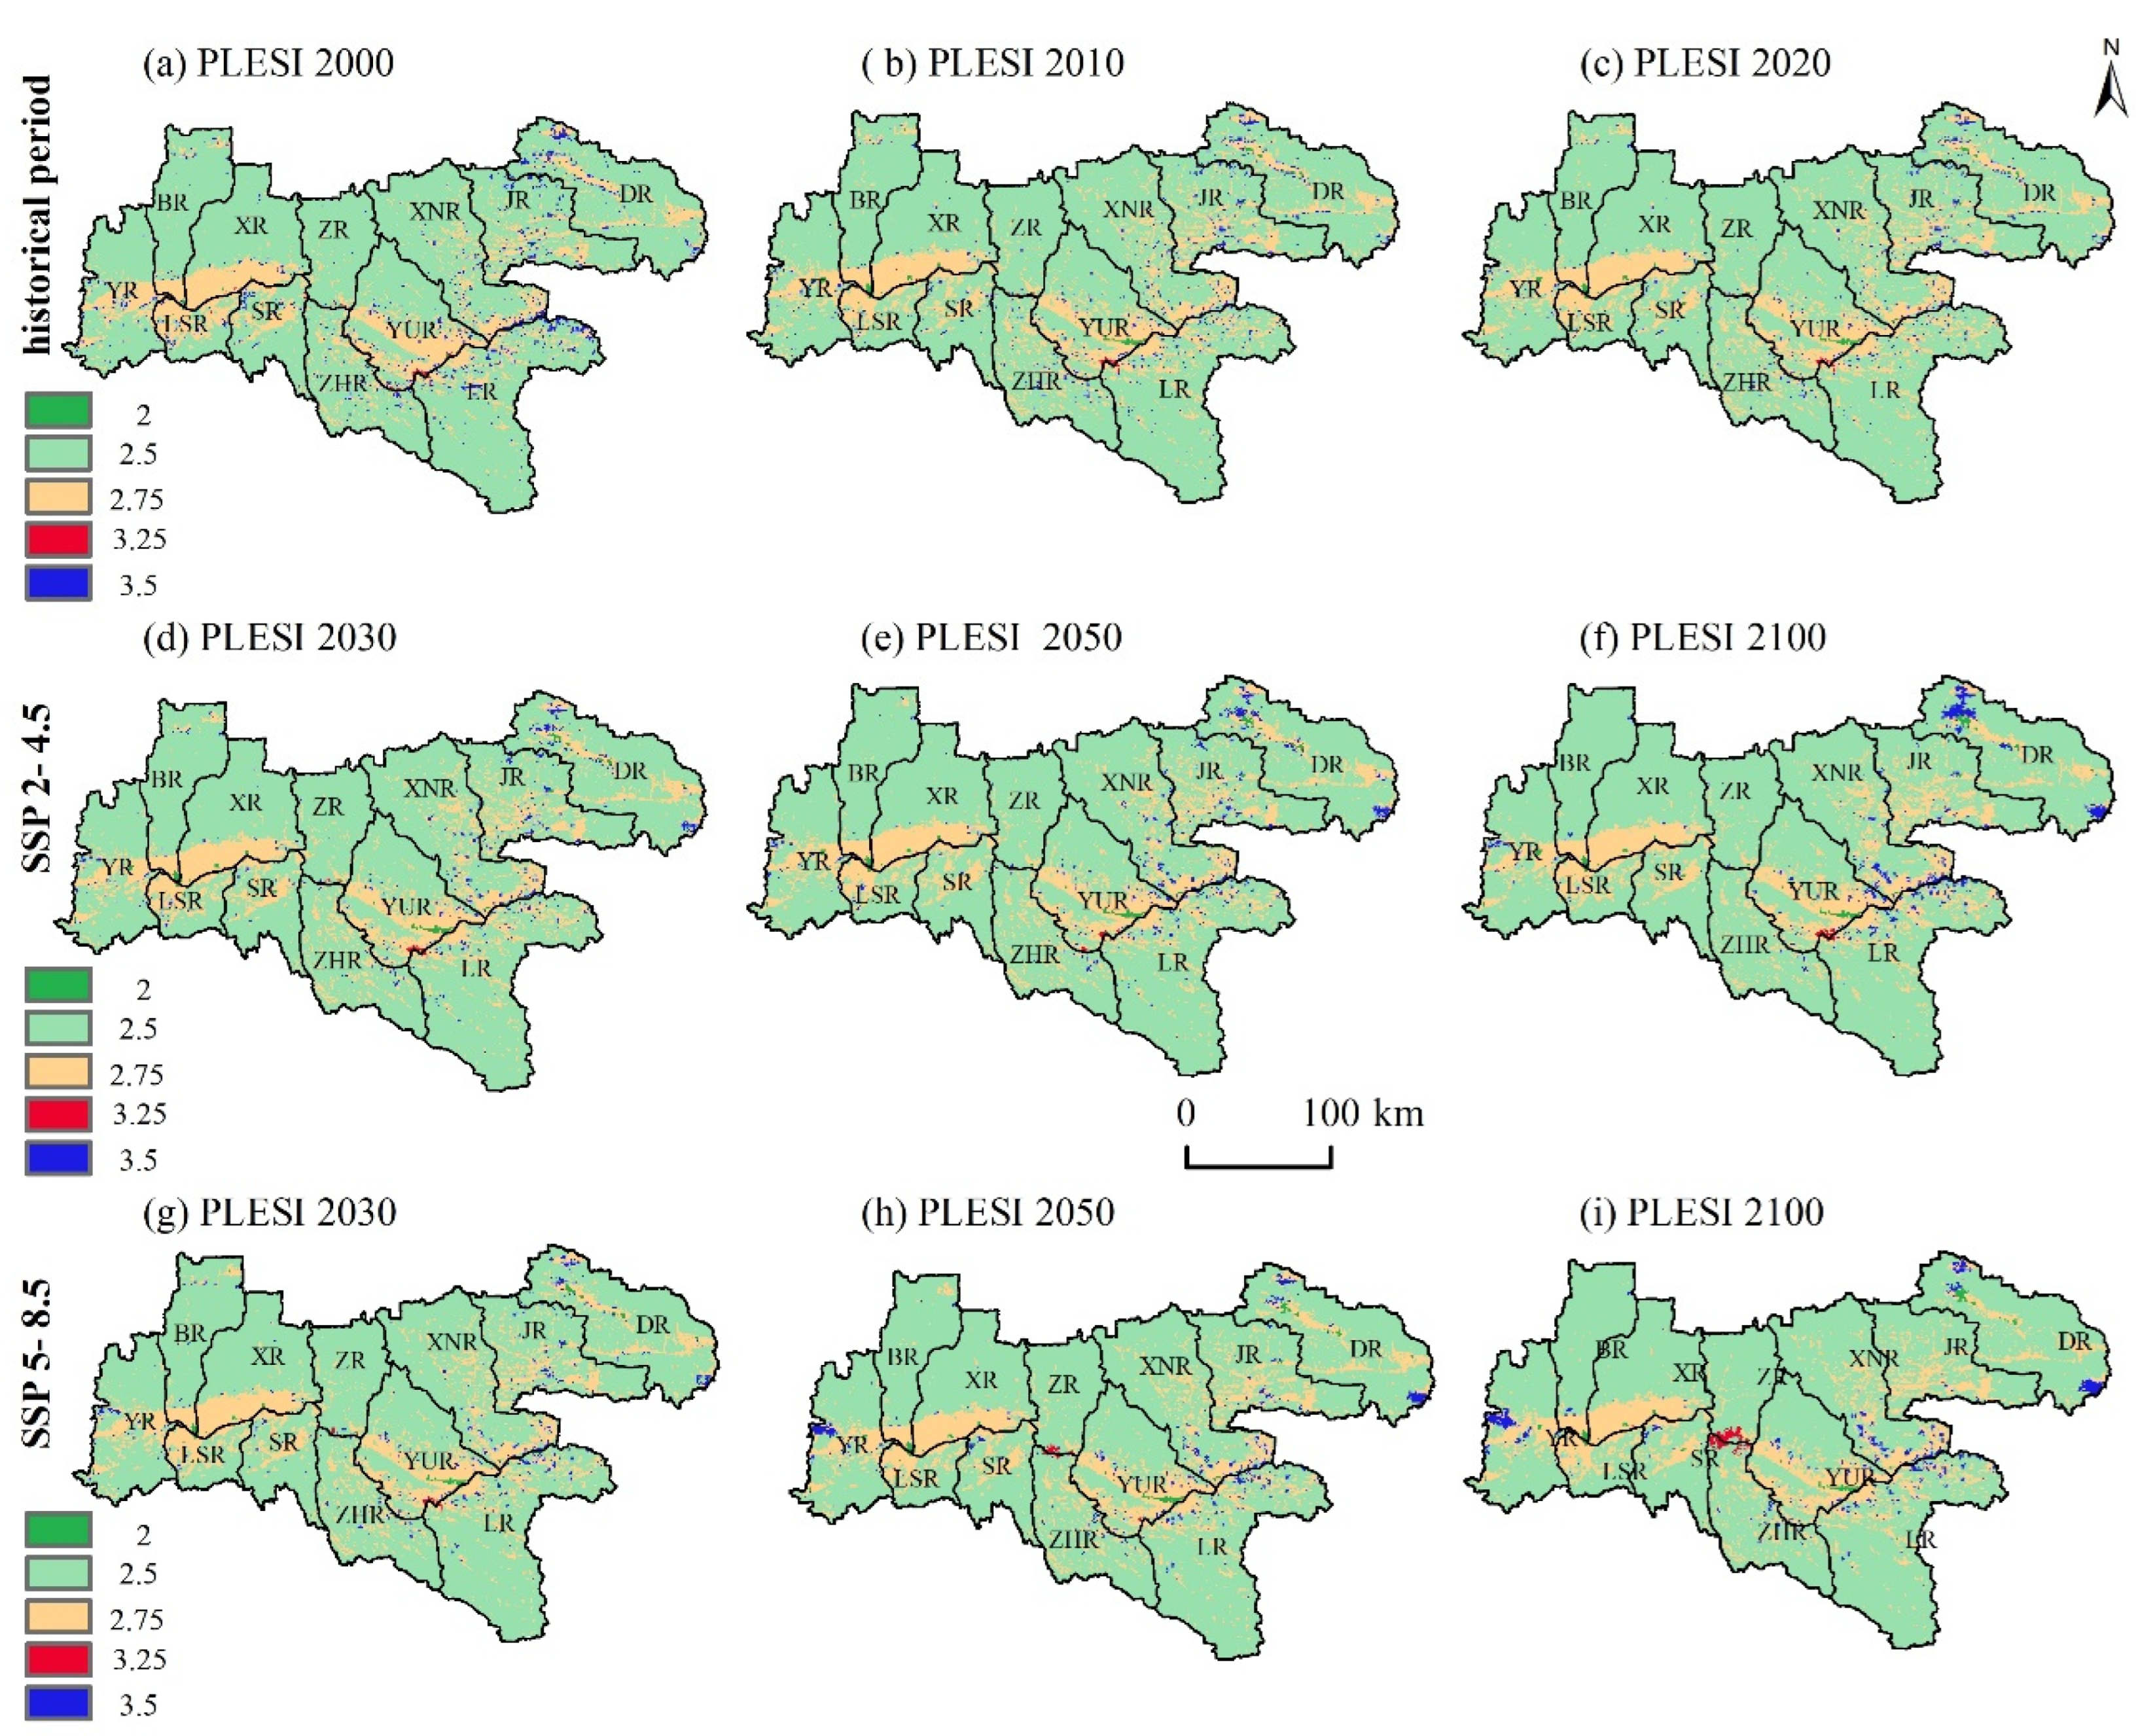
3.3.1. Spatial Variations of PLESI

The spatial evolutions of PLESI in the URHR in historical period and two future climate scenarios were evaluated through the measurement model of PLES spatial function (PLESI) (Figure 8).
From 2000 to 2020, the PLESI is projected to decrease from 2.57 in 2000 to 2.56 in 2020. Spatially, the PLESI in the Hanjiang Valley in the west and the central YUR region has a moderate level (2.75), due to the wide distribution of paddy field and dryland in these areas. PLESI in Qinling Mountains, Micang Mountains and Daba Mountains is projected generally low, of which forest land is widely distributed. The urbanization level of Hanzhong City, Ankang City, and the center of Shangluo City is relatively higher than the peripheral areas, where the PLESI will be at the lowest level. The junction of YUR, ZHR and LR will have a higher PLESI, where Yinghu Lake is located. Yinghu Lake possesses excellent water quality and is an important water conservation area in Qinling mountains. The high value areas of PLESI are projected in the peripheral areas in the main stream. Under the future scenarios, the high value region of PLESI will generally migrate to the eastern DR, the border region of YUR, XNR and LR, and the western YR. And the junction region of ZR and ZHR in the Hanjiang River mainstream enjoys the higher value of PLESI (3.25), especially in the year 2100 under the SSP5-8.5 scenario.

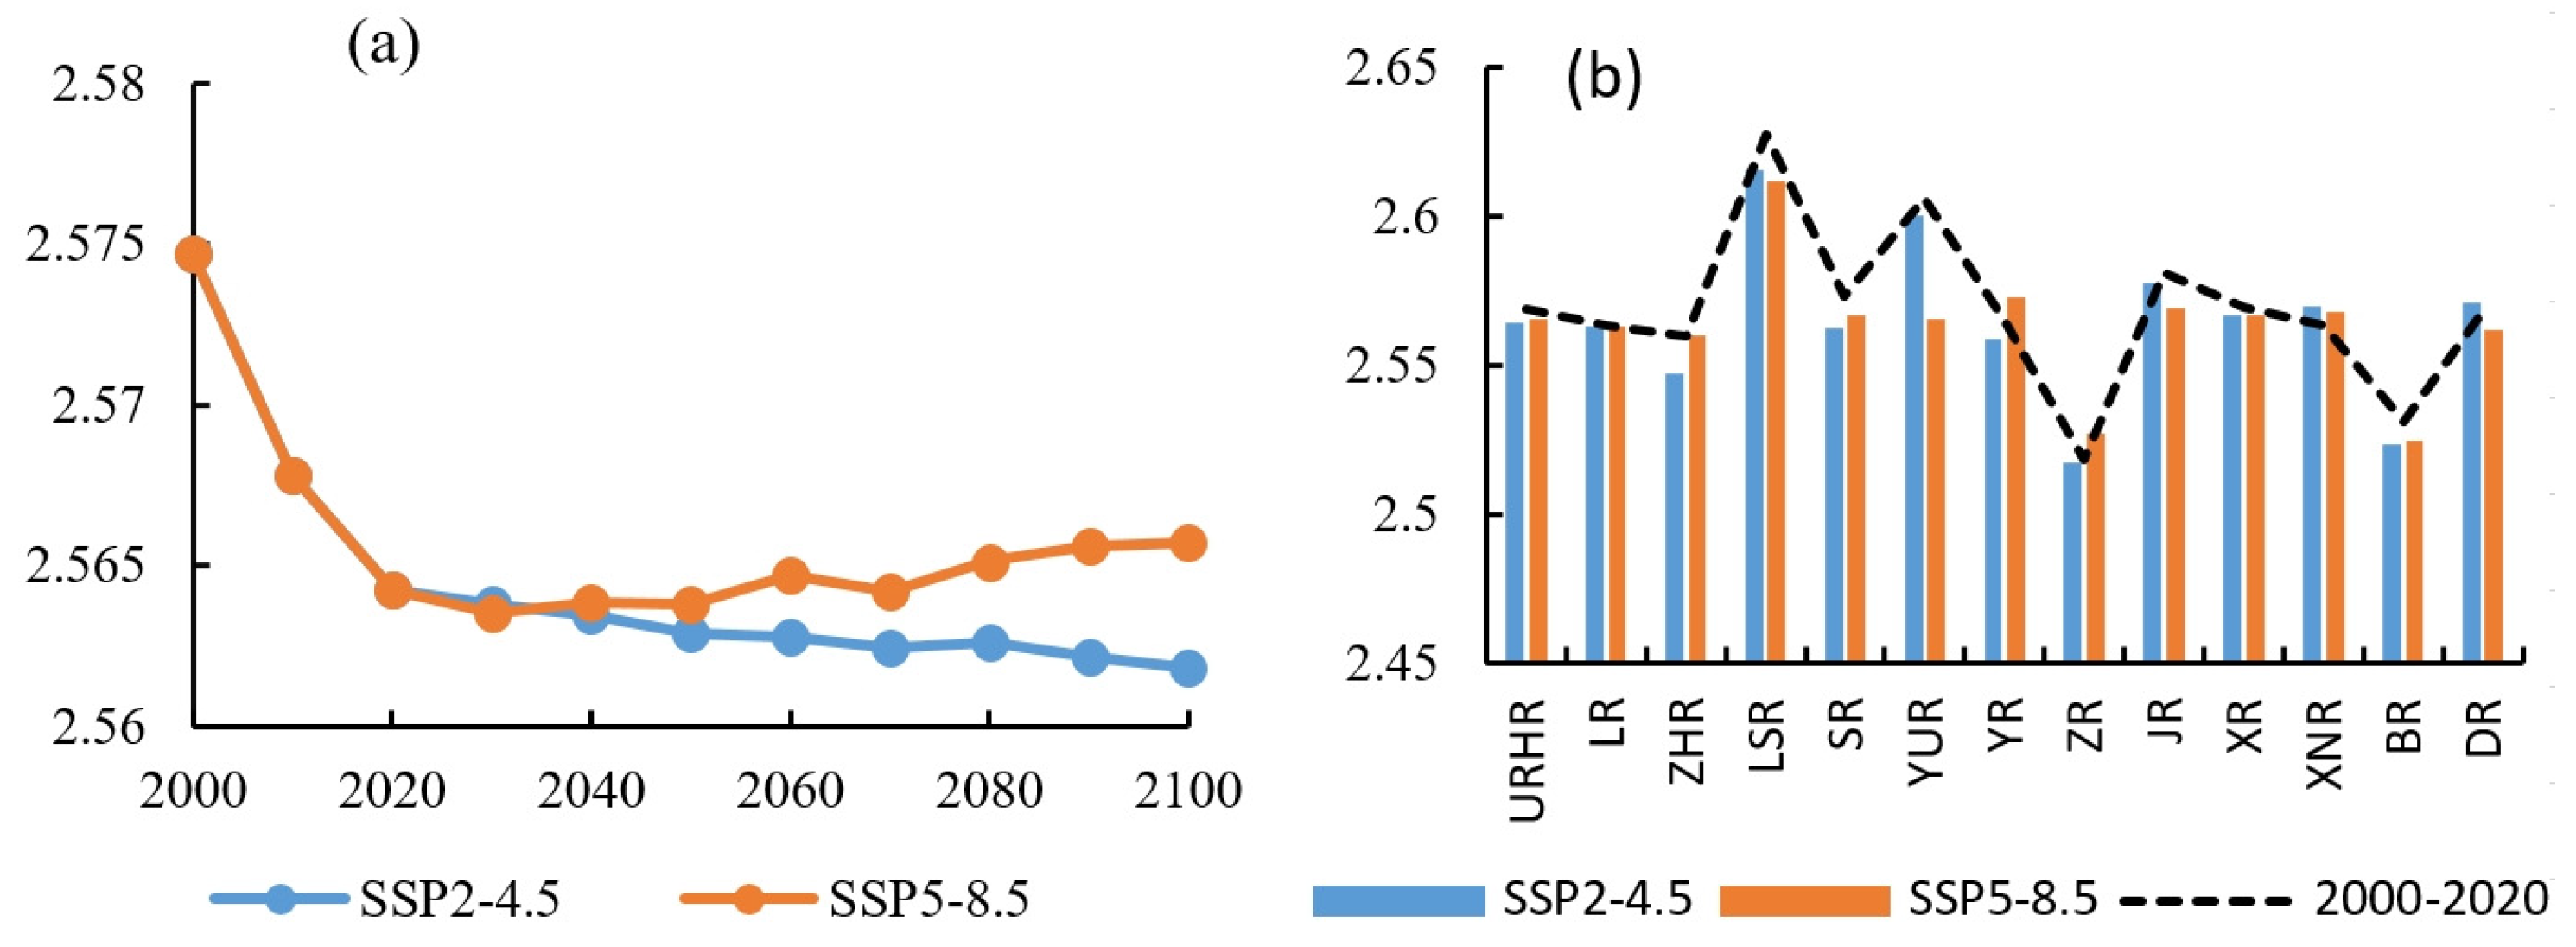
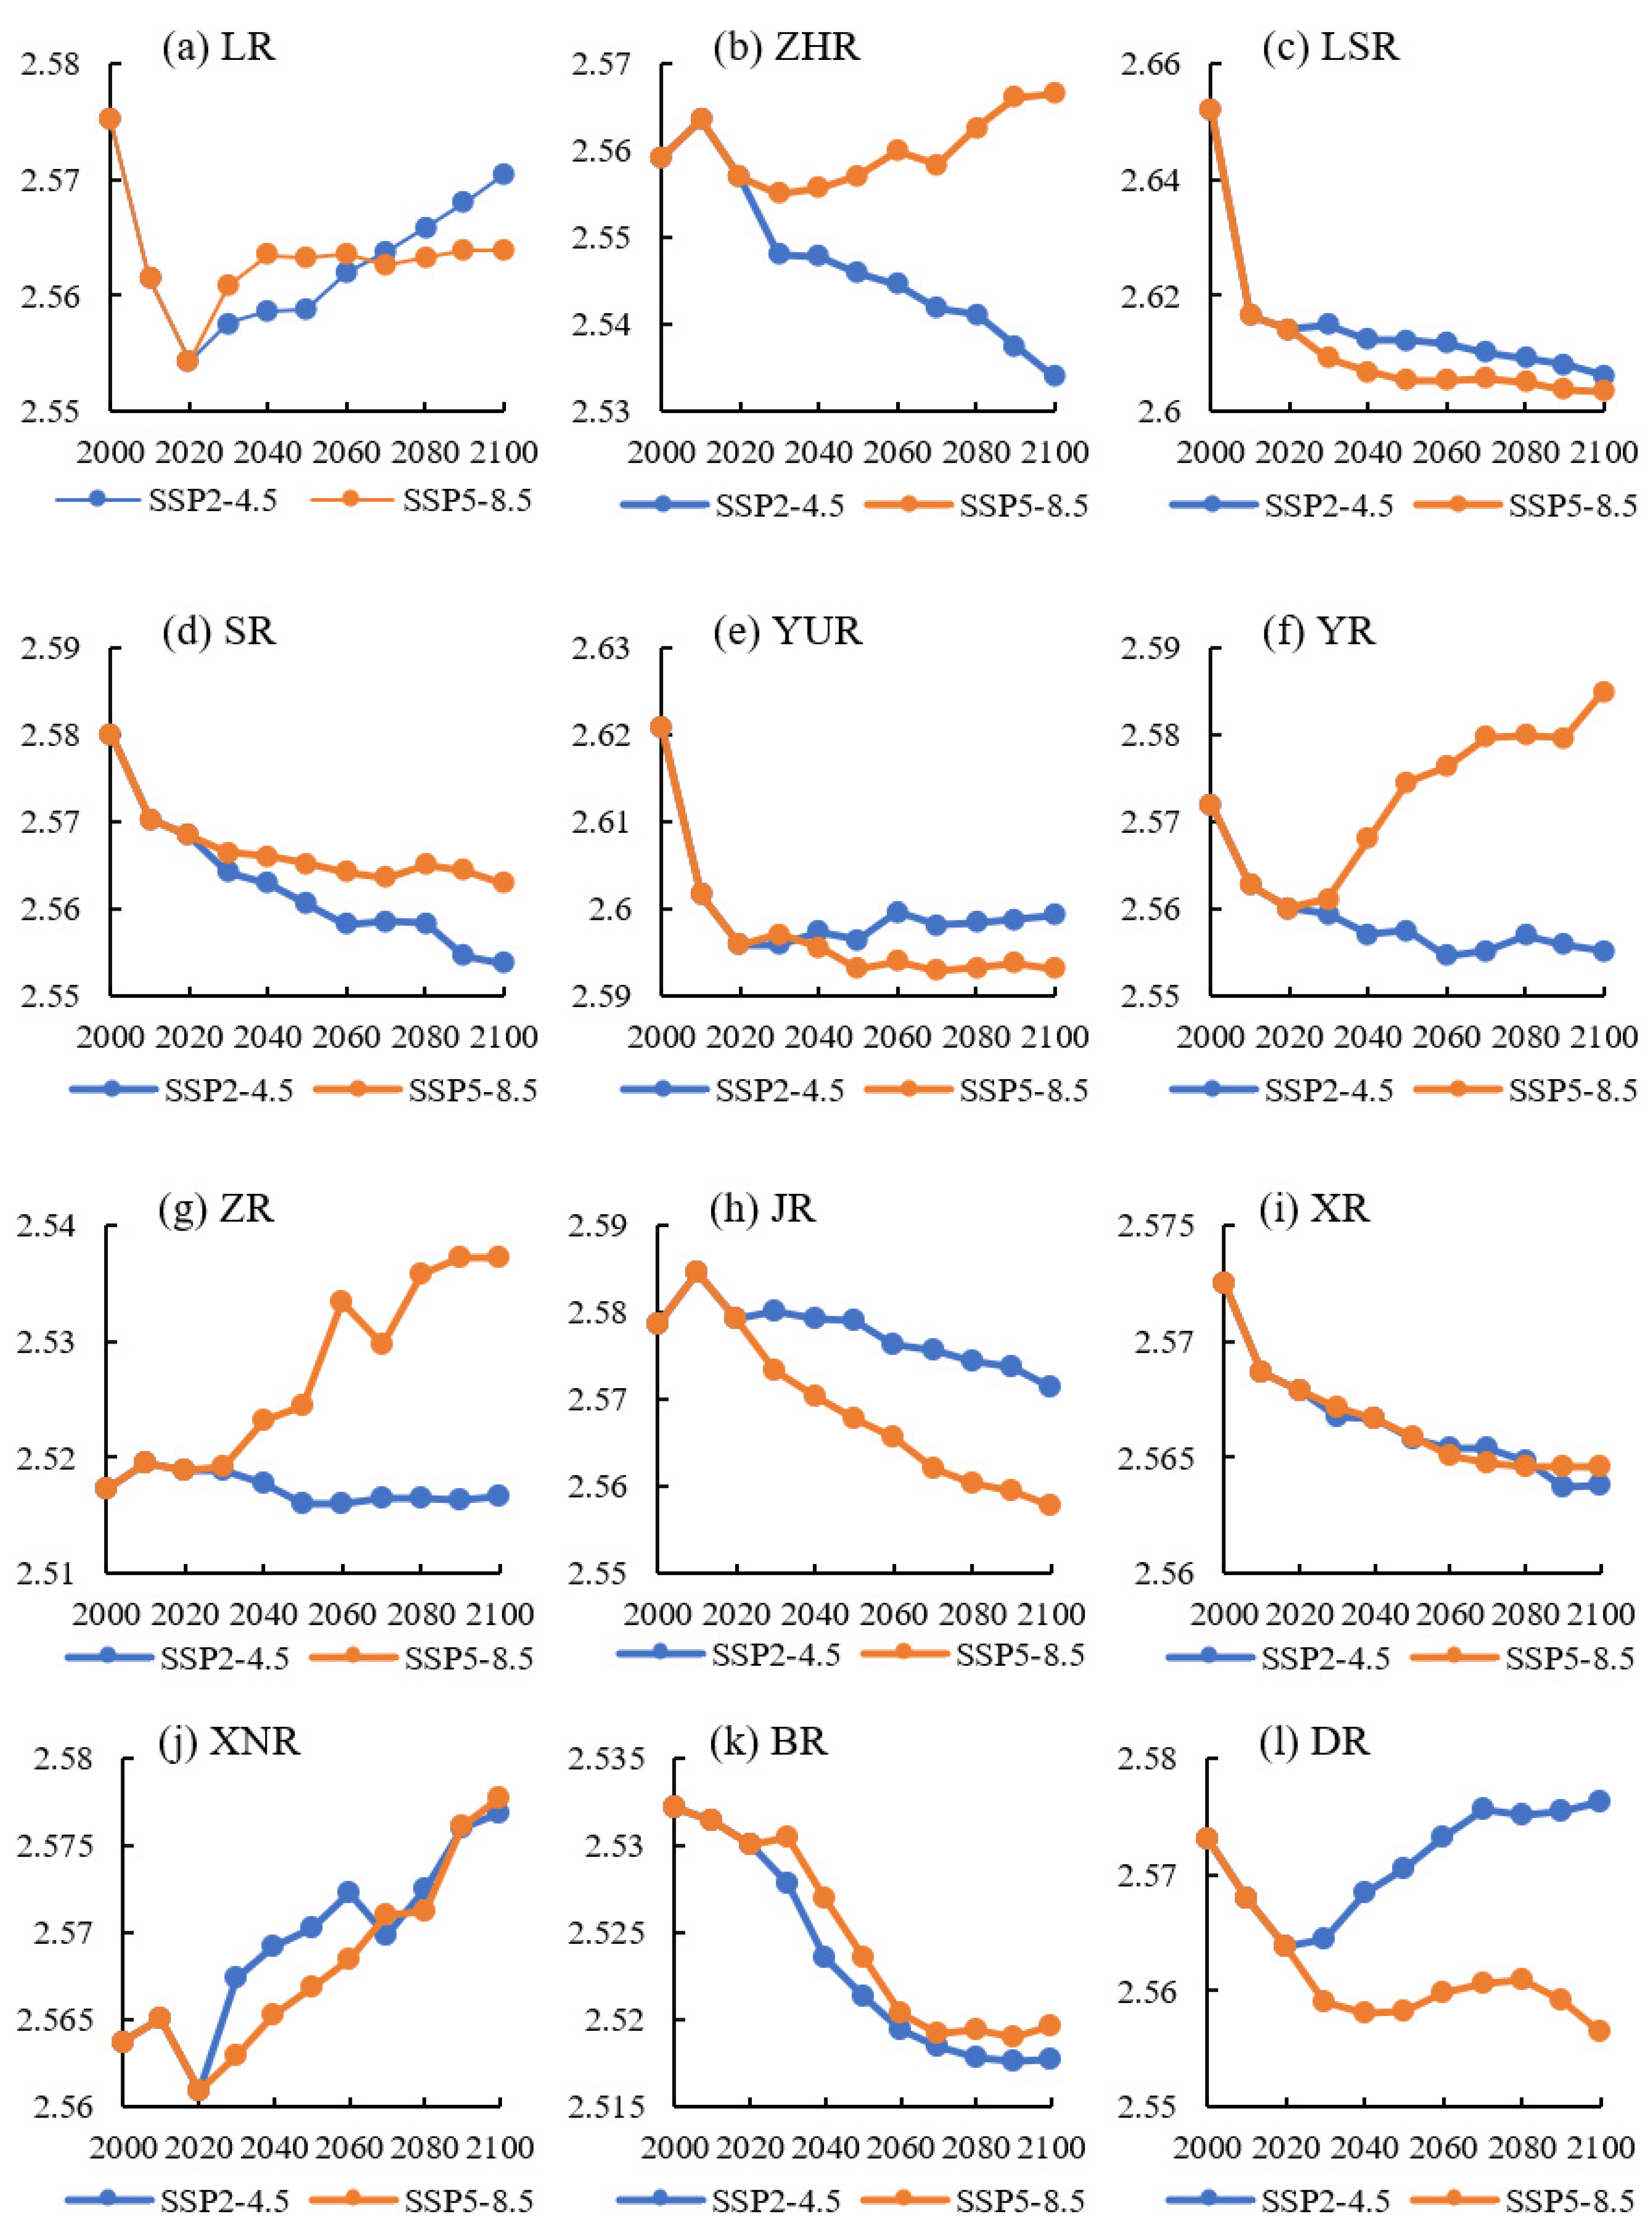
3.3.2. Temporal Variations of PLESI

The temporal variations in PLESI were evaluated through the PLES function measurement model (Figure 9). During 2000–2100, PLESI in the whole region is projected to descend under two scenarios. The results showed that PLESI had a large downward trend from 2000 to 2020, and the PLESI in the whole region decreased from 2.57 in 2000 to 2.56 in 2020. And after 2020, the PLESI changes under the two scenarios are projected significantly different. Under the SSP5-8.5 scenario, PLESI is projected a relatively obvious rising trend, while decreasing in the SSP2-4.5 scenario. For sub-basins, LSR, YUR and JR are the high-value regions of PLESI, while ZHR, ZR and BR are in low-value of PLESI.
The results showed that the change trends of PLESI in each sub-basin will differ greatly in the future (Figure 10). In ZHR, YR and ZR, the PLESI value is projected in higher upward trend under the SSP5-8.5 scenario than that in the SSP2-4.5 scenario. The PLESI in DR is projected in dramatic rise under the SSP2-4.5 scenario and the value is projected larger than that in the SSP5-8.5 scenario.
Similar change trends of PLESI are projected in the LSR, SR, YUR, JR, XR, XNR and BR under the two scenarios. In LSR, YUR and JR, the PLESI value in the SSP2-4.5 scenario will be larger than that under the SSP5-8.5 scenario, while in SR and BR, it is the opposite in the case.

4. Discussion

4.1. Implications of Land Use Multifunctionality Assessment

The results showed that forest land and dryland, forest land and grassland are the main types in the transfer of land use in the different periods. The transformation of forest land and dryland involves the mutual transformation of ES and PS. The areas of PLES type transfer in different periods are mainly BR, DR and XNR, which is consist with the distribution characteristics of the spatial transfer of land use. The alluvial plain spread over in the Hanjiang River valley area, with fertile soil low and flat terrain, of which dryland and building land are widely distributed. Due to intensive human activities, land use in these regions change frequently with more competition and conflicts in PLES space, and these regions becomes the main area for the mutual transformation of PLES types. The spatial and temporal changes in PLES types on a longer time scale were assessed through future climate scenarios and land use data, which has important scientific reference value for regional sustainable development [18,31].
The land system is a combination of economic, social and ecological subsystems [23], providing complex and comprehensive land functions such as environment, society and economy. In addition to dominant functions, land use also has secondary and tertiary functions [13]. Given this, it is necessary and imperative to conduct a comprehensive assessment of the land multifunctionality to guide the optimal allocation of land use scientifically and rationally.
The mutual transformation of forest land and grassland in different periods in this research represents the transformation of the ES type. This change has no impact on the spatial pattern of PLES, but bound to have certain impact on the land multifunctionality of PLES. The findings revealed that the comprehensive level of land function showed a continuous downward trend during 2000–2100 under the two scenarios. Meanwhile, PLESI had a large downward trend from 2000 to 2020, and PLESI presents a relatively obvious rising and dropping trend afterwards in the future. As for the zoning results, under the future scenario, PLESI is projected generally a significant increase trend in DR, YUR, XNR and LR border areas, and the western region of YR. Combined with the PLESI model, the multifunctionality of different land types in this research have been further clarified by systematic, comprehensive and quantitative methods [19]. It is also an important supplement to assessment of the spatiotemporal variations in PLES.
The ecosystem and land resources of the ecological protection areas are strictly managed and protected in the URHR. The study on PLES can clarify the spatial pattern of protected areas, then ES, LS and PS can be managed and controlled in different areas. Specifically, ES should be focused on in core protection areas and important protected areas, while LS and PS can be appropriately developed in general protected areas. The findings showed that PLESI can be taken to comprehensively evaluate land multifunctionality and monitor the coordination and conflict of PLES in these areas, ensuring reasonable protection and development of PLES in the study area. Besides, as an important ecological protection area in China, the evolution pattern of PLES and PLESI in Qinling Mountains have a certain reference effect on the territorial space development of similar ecological protection places. Meanwhile, it is noteworthy that the multifunctionality of land categories can be further clarified by systematic, comprehensive, and quantitative methods by the PLESI index. This research provides an insight for the comprehensive assessment of land functions in PLES at the regional and national scales.

4.2. Implications of Scenario Analysis for PLES

The superiority of CMIP6 scenarios lies in that the data are updated from previous climate models and deeply coupled with SSP data [65,66,67]. The simulation of land use in this research also involves regional social and economic development and policy formulation. The simulation of land use under future scenarios reflected the significant changes of major land types such as forest land, grassland and dryland, the significant changed areas such as DR, XNR, BR, and the significant differences in land use changes are existing in different years under SSP2-4.5 and SSP5-8.5.
From the perspective of land functional assessment, the PLESI decreased sharply from 2000 to 2020, and will moderate during 2030–2100. PLESI showed a relatively upward trend in LR, ZNR, DR, etc., indicating that the land functional level in these regions would be greatly improved in the future, probably due to the significant increase in precipitation in the study area under global warming [68,69].
The simulation of future PLES scenarios can supply spatially explicit assessment for land use change in different time scales and regions, different land categories and climate scenarios. The framework in this research would play an effective role in promoting social and economic development and ecological management at the regional and national scales.

4.3. PLES Management Implementation

As an important ecological barrier in central China, it is necessary to develop measures for territorial space protection and ecological management to ensure the stable development of ecological functions in the URHR. Firstly, in terms of the research on PLES, the ecological protection red line had been delimited within the region for spatial control [70]. The development activities of PS and LS should be banned in core and key protected areas, while the moderate development of PS and LS can proceed in general protected areas.
Secondly, considering the urgent needs of local economic development and ensuring people’s livelihoods, the industrial structures need to be further optimized to improve the land use efficiency in production and life as well as the land function level of PS and LS. Additionally, ecological compensation could be received in the form of goods production in the surrounding areas by utilizing the advantages of a high-quality ecological environment, especially in water conservation areas. Moreover, the tertiary industries such as ecotourism and rural tourism could also be developed. Based on the research framework and methods in this research, the ultimate goal is to coordinate the spatial pattern of PLES structure on the basis of ensuring the stability of the ecosystem structure [31], thus promoting the balanced development of ecosystems and social economy.
Thirdly, the findings showed that forest land has been well protected as the major contributor to the regional ES. While as the main contributor to PS, building land is also limited by the policies of ecological protection in the study area, showing a weak expansion trend in the future. In terms of land multifunctionality, the ecological functions of dryland and paddy field are weaker than forest land and their residential functions are weaker than building land. In this context, cultivated land can be used to balance the changes of ES and PS and can be a key entry point for the coordinated development of PLES and the alleviation of regional land use in the URHR. The PLESI adopted in this research can be used as an effective tool to quantitatively evaluate the multifunctionality of different land use types in the area, and evaluate the spatial variations in the coordination and conflict of PLES, to ensure the stable development of land functionality in the whole region.
Lastly, with the time change and scenario analysis outcomes, the possible changes of PLES and PLESI in different climate scenarios and different periods were clarified, informing the long-term planning and protection of regional land resource management. In the long term, DR, XNR, BR and other areas could become the key areas for social sustainable development and ecosystem management. In addition, the mutual transformation between forest land and dryland, forest land and grassland under the two scenarios should be concerned further, which is in accord with the previous study [71].

4.4. Limitations and Future Research

The statistical downscaling method was employed to process the future climate scenarios, which can improve the regional applicability and simulation accuracy. Nevertheless, there are many driving factors affecting the simulation of land use, and the statistical scale and accuracy of data are different, resulting in a certain impact on the simulation effect. Finer resolutions of various forms of data collection in the further study are needed to effectively optimize and improve the simulation in the future scenarios, and inform reliable policy-making in the management of PLES. Additionally, the priority scenarios of PS, LS, ES and a comprehensive space optimization scenario would also be optimally designed for the regional PLES management.
The integrated approach of PLES and PLESI can be carried out in the management of regional PLES more comprehensively. However, the same land type in different regions also has great differences in its corresponding production, living and ecological functions due to the differences in soil environment, terrain and geomorphic conditions, climate and regional socio-economic conditions. The PLESI model applied in this study still needs to be improved in combination with regional actual conditions and socio-economic development indicators and ecological environment indicators, so as to improve the precision of PLESI assessment. Furthermore, how to clarify the competition and cooperation relationship, coordinate and balance the development of PLES are critical to advance the social sustainable development in the Qinling Mountains and other similar ecological function regions.

5. Conclusions

The spatial–temporal variations in land use and PLES in the URHR were simulated in the historical period and different scenarios through the combination of the newly released CMIP6 climate model, geographic ecology and socioeconomic data.
The findings indicated that the spatial pattern of land use and PLES in the future period will be almost consistent with that in the historical period. And the spatial transformations between forest land and dryland, forest land and grassland in each period resulted in the main transformation of PLES, which are reflected in the mutual conversions of PS and ES. Spatially, DR, XNR and BR are the main areas of the change in land use and PLES. As for the horizontal comparison of scenarios, a greater impact on the mutual transformation of forest land and grassland will be distinctive in the SSP5-8.5 scenario, while it will occur between FL and dryland under the SSP2-4.5 scenario, affecting the time-space transformation and distribution pattern of PS and ES. PLESI is projected trending downward under two different scenarios during 2000–2100. Meanwhile, PLESI was in a significant downward trend from 2000 to 2020, but in a relatively obvious upward trend under the SSP5-8.5 scenario and downward trend under the SSP2-4.5 scenario. This research is conducted with the aim to provide explicit reference for land resources planning, ecological environment governance and the socio-economic sustainability at the regional and national scales.

Author Contributions

All authors made significant contributions to the preparation of this manuscript. Conceptualization, P.W., X.L. and L.Z.; methodology, P.W. and X.L.; software, X.L. and Z.W.; formal analysis, P.W. and X.L.; resources, Z.W., J.B., Y.S. and T.Z.; writing—original draft preparation, P.W., X.L. and L.Z.; writing—review and editing, X.L., L.Z., H.H., T.Z., G.H. and J.Y.; funding acquisition, P.W. and J.Y. All authors have read and agreed to the published version of the manuscript.

Funding

This research was funded by the Natural Science Basic Research Program of Shaanxi Province of China (2021JQ-768), the Scientific Research Project of Shaanxi Provincial Education Department (21JK0306), the Special Research Project of Philosophy and Social Sciences of Shaanxi Province (2023HZ957), the Social Science Planning Fund Program of Xi’an city (23JX150).

Data Availability Statement

All data and materials are available upon request.

Conflicts of Interest

The authors declare no conflict of interest.

References

  1. Verburg, P.H.; van de Steeg, J.; Veldkamp, A.; Willemen, L. From land cover change to land function dynamics: A major challenge to improve land characterization. J. Environ. Manag. 2009, 90, 1327–1335. [Google Scholar] [CrossRef] [PubMed]
  2. Fu, B.; Zhang, L.; Xu, Z.; Zhao, Y.; Wei, Y.; Skinner, D. Ecosystem services in changing land use. J. Soil Sediment. 2015, 15, 833–843. [Google Scholar] [CrossRef]
  3. Siddique, M.N.E.A.; Lobry de Bruyn, L.A.; Osanai, Y.; Guppy, C.N. Determining the role of land resource, cropping and management practices in soil organic carbon status of rice-based cropping systems. Agric. Ecosyst. Environ. 2023, 344, 108302. [Google Scholar] [CrossRef]
  4. Lilburne, L.; Eger, A.; Mudge, P.; Ausseil, A.-G.; Stevenson, B.; Herzig, A.; Beare, M. The Land Resource Circle: Supporting land-use decision making with an ecosystem-service-based framework of soil functions. Geoderma 2020, 363, 114134. [Google Scholar] [CrossRef]
  5. Lourenço, I.B.; Guimarães, L.F.; Alves, M.B.; Miguez, M.G. Land as a sustainable resource in city planning: The use of open spaces and drainage systems to structure environmental and urban needs. J. Clean. Prod. 2020, 276, 123096. [Google Scholar] [CrossRef]
  6. Dorninger, C.; von Wehrden, H.; Krausmann, F.; Bruckner, M.; Feng, K.; Hubacek, K.; Erb, K.-H.; Abson, D.J. The effect of industrialization and globalization on domestic land-use: A global resource footprint perspective. Glob. Environ. Chang. 2021, 69, 102311. [Google Scholar] [CrossRef]
  7. Furtado, I.S.; Martins, M.B. The impacts of land use intensification on the assembly of drosophilidae (Diptera). Glob. Ecol. Conserv. 2018, 16, e00432. [Google Scholar] [CrossRef]
  8. Almulhim, A.I.; Cobbinah, P.B. Can rapid urbanization be sustainable? The case of Saudi Arabian cities. Habitat Int. 2023, 139, 102884. [Google Scholar] [CrossRef]
  9. Thaweepworadej, P.; Evans, K.L. Urbanisation of a growing tropical mega-city during the 21st century—Landscape transformation and vegetation dynamics. Landsc. Urban Plan. 2023, 238, 104812. [Google Scholar] [CrossRef]
  10. Kangas, K.; Brown, G.; Kivinen, M.; Tolvanen, A.; Tuulentie, S.; Karhu, J.; Markovaara-Koivisto, M.; Eilu, P.; Tarvainen, O.; Simila, J.; et al. Land use synergies and conflicts identification in the framework of compatibility analyses and spatial assessment of ecological, socio-cultural and economic values. J. Environ. Manag. 2022, 316, 115174. [Google Scholar] [CrossRef]
  11. Baldini, C.; Marasas, M.E.; Tittonell, P.; Drozd, A.A. Urban, periurban and horticultural landscapes—Conflict and sustainable planning in La Plata district, Argentina. Land Use Policy 2022, 117, 106120. [Google Scholar] [CrossRef]
  12. Zhang, K.; Wei, W.; Yin, L.; Zhou, J. Spatial-Temporal Evolution Characteristics and Mechanism Analysis of Urban Space in China’s Three-River-Source Region: A Land Classification Governance Framework Based on “Three Zone Space”. Land 2023, 12, 1380. [Google Scholar] [CrossRef]
  13. Liu, J.; Liu, Y.; Li, Y. Classification evaluation and spatial-temporal analysis of “Production–Living–Ecological” spaces in China. Acta Geol. Sin. 2017, 72, 1290–1304. [Google Scholar]
  14. Li, C.; Wu, J. Land use transformation and eco-environmental effects based on Production–Living–Ecological spatial synergy: Evidence from Shaanxi Province, China. Environ. Sci. Pollut. Res. Int. 2022, 29, 41492–41504. [Google Scholar] [CrossRef] [PubMed]
  15. Ma, Q.; Wang, Z.; Zhao, Y. Evolution of Spatial-Temporal Pattern and Functional Measurement of “Production–Living–Ecological” Space in Xi’an, China. Mt. Res. 2021, 39, 722–733. [Google Scholar] [CrossRef]
  16. Chen, J.; Fu, H.; Chen, S. Multi-Scenario Simulation and Assessment of Ecosystem Service Value at the City Level from the Perspective of Production–Living–Ecological-Spaces: A Case Study of Haikou, China. Land 2023, 12, 1021. [Google Scholar] [CrossRef]
  17. Zou, L.; Liu, Y.; Yang, J.; Yang, S.; Wang, Y.; Cao, z.; Hu, X. Quantitative identification and spatial analysis of land use ecological-production-living functions in rural areas on China’s southeast coast. Habitat Int. 2020, 100, 102182. [Google Scholar] [CrossRef]
  18. Liu, X.; Wang, X.; Chen, K.; Li, D. Simulation and prediction of multi-scenario evolution of ecological space based on FLUS model: A case study of the Yangtze River Economic Belt, China. J. Geogr. Sci. 2023, 33, 373–391. [Google Scholar] [CrossRef]
  19. Jin, X.; Lu, Y.; Lin, J.; Qi, X.; Hu, G.; Li, X. Research on the evolution of spatiotemporal patterns of Production–Living–Ecological space in an urban agglomeration in the Fujian Delta region, China. Acta Ecol. Sin. 2018, 38, 4286–4295. [Google Scholar]
  20. Song, Y.; Xia, S.; Xue, D.; Luo, S.; Zhang, L.; Wang, D. Land Space Change Process and Its Eco-Environmental Effects in the Guanzhong Plain Urban Agglomeration of China. Land 2022, 11, 1547. [Google Scholar] [CrossRef]
  21. Wang, A.; Liao, X.; Tong, Z.; Du, W.; Zhang, J.; Liu, X.; Liu, M. Spatial-temporal dynamic evaluation of the ecosystem service value from the perspective of “Production–Living–Ecological” spaces: A case study in Dongliao River Basin, China. J. Clean. Prod. 2022, 333, 130218. [Google Scholar] [CrossRef]
  22. Zhao, J.; Zhao, Y. Synergy/trade-offs and differential optimization of production, living, and ecological functions in the Yangtze River economic Belt, China. Ecol. Indic. 2023, 147, 109925. [Google Scholar] [CrossRef]
  23. Zhou, D.; Xu, J.; Lin, Z. Conflict or coordination? Assessing land use multi-functionalization using production-living-ecology analysis. Sci. Total. Environ. 2017, 577, 136–147. [Google Scholar] [CrossRef] [PubMed]
  24. Turner, B.L.; Lambin, E.F.; Reenberg, A. Land Change Science Special Feature: The emergence of land change science for global environmental change and sustainability. Proc. Natl. Acad. Sci. USA 2008, 105, 2751. [Google Scholar] [CrossRef]
  25. Musakwa, W.; Wang, S. Landscape change and its drivers: A Southern African perspective. Curr. Opin. Environ. Sust. 2018, 33, 80–86. [Google Scholar] [CrossRef]
  26. Domingo, D.; Palka, G.; Hersperger, A.M. Effect of zoning plans on urban land-use change: A multi-scenario simulation for supporting sustainable urban growth. Sustain. Cities Soc. 2021, 69, 102833. [Google Scholar] [CrossRef]
  27. Molinero-Parejo, R.; Aguilera-Benavente, F.; Gómez-Delgado, M.; Shurupov, N. Combining a land parcel cellular automata (LP-CA) model with participatory approaches in the simulation of disruptive future scenarios of urban land use change. Comput. Environ. Urban Syst. 2023, 99, 101895. [Google Scholar] [CrossRef]
  28. Bacău, S.; Domingo, D.; Palka, G.; Pellissier, L.; Kienast, F. Integrating strategic planning intentions into land-change simulations: Designing and assessing scenarios for Bucharest. Sustain. Cities Soc. 2022, 76, 103446. [Google Scholar] [CrossRef]
  29. Liu, X.; Liang, X.; Li, X.; Xu, X.; Ou, J.; Chen, Y.; Li, S.; Wang, S.; Pei, F. A future land use simulation model (FLUS) for simulating multiple land use scenarios by coupling human and natural effects. Landsc. Urban Plan. 2017, 168, 94–116. [Google Scholar] [CrossRef]
  30. Liang, X.; Liu, X.; Li, X.; Chen, Y.; Tian, H.; Yao, Y. Delineating multi-scenario urban growth boundaries with a CA-based FLUS model and morphological method. Landsc. Urban Plan. 2018, 177, 47–63. [Google Scholar] [CrossRef]
  31. Zhang, Y.; Zheng, M.; Qin, B. Optimization of spatial layout based on ESV-FLUS model from the perspective of “Production–Living–Ecological”: A case study of Wuhan City. Ecol. Model. 2023, 481, 110356. [Google Scholar] [CrossRef]
  32. Gebhardt, S.; van Dijk, J.; Wassen, M.J.; Bakker, M. Agricultural intensity interacts with landscape arrangement in driving ecosystem services. Agric. Ecosyst. Environ. 2023, 357, 108692. [Google Scholar] [CrossRef]
  33. Bell, J.K.; Siciliano, S.D.; Lamb, E.G. Seasonality and bacterial community assembly processes dominate prairie ecosystem service disruption during invasion. Soil Biol. Biochem. 2023, 184, 109120. [Google Scholar] [CrossRef]
  34. Wenzel, W.W.; Philipsen, F.N.; Herold, L.; Kingsland-Mengi, A.; Laux, M.; Golestanifard, A.; Strobel, B.W.; Duboc, O. Carbon sequestration potential and fractionation in soils after conversion of cultivated land to hedgerows. Geoderma 2023, 435, 116501. [Google Scholar] [CrossRef]
  35. Tao, Y.; Wang, Q. Quantitative Recognition and Characteristic Analysis of Production–Living–Ecological Space Evolution for Five Resource-Based Cities: Zululand, Xuzhou, Lota, Surf Coast and Ruhr. Remote Sens. 2021, 13, 1563. [Google Scholar] [CrossRef]
  36. Li, X.; Li, S.; Zhang, Y.; O’Connor, P.J.; Zhang, L.; Yan, J. Landscape Ecological Risk Assessment under Multiple Indicators. Land 2021, 10, 739. [Google Scholar] [CrossRef]
  37. Wang, P.; Zhang, L.; Li, Y.; Jiao, L.; Wang, H.; Yan, J.; Lü, Y.; Fu, B. Spatio-temporal variations of the flood mitigation service of ecosystem under different climate scenarios in the Upper Reaches of Hanjiang River Basin, China. J. Geogr. Sci. 2018, 28, 1385–1398. [Google Scholar] [CrossRef]
  38. Li, X.; Zhang, L.; J. O’Connor, P.; Yan, J.; Wang, B.; Liu, D.L.; Wang, P.; Wang, Z.; Wan, L.; Li, Y. Ecosystem Services under Climate Change Impact Water Infrastructure in a Highly Forested Basin. Water 2020, 12, 2825. [Google Scholar] [CrossRef]
  39. Wang, P.; Zhang, L.; Li, Y.; Jiao, L.; Wang, H.; Yan, J.; Lv, Y.; Fu, B. Spatio-temporal characteristics of the trade-off and synergy relationships among multiple ecosystem services in the Upper Reaches of Hanjiang River Basin. Acta Geol. Sin. 2017, 72, 2064–2078. [Google Scholar]
  40. Riahi, K.; van Vuuren, D.P.; Kriegler, E.; Edmonds, J.; O’Neill, B.C.; Fujimori, S.; Bauer, N.; Calvin, K.; Dellink, R.; Fricko, O.; et al. The Shared Socioeconomic Pathways and their energy, land use, and greenhouse gas emissions implications: An overview. Glob. Environ. Chang. 2017, 42, 153–168. [Google Scholar] [CrossRef]
  41. Carvalho, D.; Rocha, A.; Costoya, X.; deCastro, M.; Gómez-Gesteira, M. Wind energy resource over Europe under CMIP6 future climate projections: What changes from CMIP5 to CMIP6. Renew. Sustain. Energy Rev. 2021, 151, 111594. [Google Scholar] [CrossRef]
  42. Hamed, M.M.; Nashwan, M.S.; Shahid, S.; Ismail, T.b.; Wang, X.-j.; Dewan, A.; Asaduzzaman, M. Inconsistency in historical simulations and future projections of temperature and rainfall: A comparison of CMIP5 and CMIP6 models over Southeast Asia. Atmos. Res. 2022, 265, 105927. [Google Scholar] [CrossRef]
  43. Bağçaci, S.Ç.; Yucel, I.; Duzenli, E.; Yilmaz, M.T. Intercomparison of the expected change in the temperature and the precipitation retrieved from CMIP6 and CMIP5 climate projections: A Mediterranean hot spot case, Turkey. Atmos. Res. 2021, 256, 105576. [Google Scholar] [CrossRef]
  44. Liu, D.L.; Zuo, H. Statistical downscaling of daily climate variables for climate change impact assessment over New South Wales, Australia. Clim. Chang. 2012, 115, 629–666. [Google Scholar] [CrossRef]
  45. Wang, B.; Liu, D.L.; Macadam, I.; Alexander, L.V.; Abramowitz, G.; Yu, Q. Multi-model ensemble projections of future extreme temperature change using a statistical downscaling method in South-Eastern Australia. Clim. Chang. 2016, 138, 85–98. [Google Scholar] [CrossRef]
  46. Mohanty, M.P.; Simonovic, S.P. Changes in floodplain regimes over Canada due to climate change impacts: Observations from CMIP6 models. Sci. Total Environ. 2021, 792, 148323. [Google Scholar] [CrossRef]
  47. Buhay Bucton, B.G.; Shrestha, S.; Kc, S.; Mohanasundaram, S.; Virdis, S.G.P.; Chaowiwat, W. Impacts of climate and land use change on groundwater recharge under shared socioeconomic pathways: A case of Siem Reap, Cambodia. Environ. Res. 2022, 211, 113070. [Google Scholar] [CrossRef]
  48. Viseh, H.; Bristow, D.N. How climate change could affect different cities in Canada and what that means for the risks to the built-environment functions. Urban Clim. 2023, 51, 101639. [Google Scholar] [CrossRef]
  49. Russo, M.A.; Carvalho, D.; Martins, N.; Monteiro, A. Future perspectives for wind and solar electricity production under high-resolution climate change scenarios. J. Clean. Prod. 2023, 404, 136997. [Google Scholar] [CrossRef]
  50. Fournier, A.; Martinez, A.; Iglesias, G. Impacts of climate change on wind energy potential in Australasia and South-East Asia following the Shared Socioeconomic Pathways. Sci. Total Environ. 2023, 882, 163347. [Google Scholar] [CrossRef]
  51. Seker, M.; Gumus, V. Projection of temperature and precipitation in the Mediterranean region through multi-model ensemble from CMIP6. Atmos. Res. 2022, 280, 106440. [Google Scholar] [CrossRef]
  52. Rodríguez-Aguilar, O.; López-Collado, J.; Soto-Estrada, A.; Vargas-Mendoza, M.d.l.C.; García-Avila, C.d.J. Future spatial distribution of Diaphorina citri in Mexico under climate change models. Ecol. Complex. 2023, 53, 101041. [Google Scholar] [CrossRef]
  53. Das, P.; Zhang, Z.; Ghosh, S.; Lu, J.; Ayugi, B.; Ojara, M.A.; Guo, X. Historical and projected changes in Extreme High Temperature events over East Africa and associated with meteorological conditions using CMIP6 models. Glob. Planet. Chang. 2023, 222, 104068. [Google Scholar] [CrossRef]
  54. Taylor, K.E. Summarizing multiple aspects of model performance in a single diagram. J. Geophys. Res. Atmos. 2001, 106, 7183–7192. [Google Scholar] [CrossRef]
  55. Grose, M.R.; Narsey, S.; Trancoso, R.; Mackallah, C.; Delage, F.; Dowdy, A.; Di Virgilio, G.; Watterson, I.; Dobrohotoff, P.; Rashid, H.A.; et al. A CMIP6-based multi-model downscaling ensemble to underpin climate change services in Australia. Clim. Serv. 2023, 30, 100368. [Google Scholar] [CrossRef]
  56. Hersi, N.A.M.; Mulungu, D.M.M.; Nobert, J. Prediction of future climate in semi-arid catchment under CMIP6 scenarios: A case study of Bahi (Manyoni) catchment in Internal Drainage basin (IDB), Tanzania. Phys. Chem. Earth Parts A/B/C 2023, 129, 103309. [Google Scholar] [CrossRef]
  57. Pierce, D.W.; Barnett, T.P.; Santer, B.D.; Gleckler, P.J. Selecting global climate models for regional climate change studies. Proc. Natl. Acad. Sci. USA 2009, 106, 8441–8446. [Google Scholar] [CrossRef]
  58. Chen, W.; Jiang, Z.; Li, L. Probabilistic Projections of Climate Change over China under the SRES A1B Scenario Using 28 AOGCMs. J. Clim. 2011, 24, 4741–4756. [Google Scholar] [CrossRef]
  59. Gleckler, P.J.; Taylor, K.E.; Doutriaux, C. Performance metrics for climate models. J. Geophys. Res. 2008, 113, D06104. [Google Scholar] [CrossRef]
  60. Santer, B.D.; Taylor, K.E.; Gleckler, P.J.; Bonfils, C.; Barnett, T.P.; Pierce, D.W.; Wigley, T.M.; Mears, C.; Wentz, F.J.; Bruggemann, W.; et al. Incorporating model quality information in climate change detection and attribution studies. Proc. Natl. Acad. Sci. USA 2009, 106, 14778–14783. [Google Scholar] [CrossRef]
  61. Camacho, A.M.; Perotto-Baldivieso, H.L.; Tanner, E.P.; Montemayor, A.L.; Gless, W.A.; Exum, J.; Yamashita, T.J.; Foley, A.M.; DeYoung, R.W.; Nelson, S.D. The broad scale impact of climate change on planning aerial wildlife surveys with drone-based thermal cameras. Sci. Rep. 2023, 13, 4455. [Google Scholar] [CrossRef] [PubMed]
  62. Samuel, S.; Dosio, A.; Mphale, K.; Faka, D.N.; Wiston, M. Comparison of multi-model ensembles of global and regional climate model projections for daily characteristics of precipitation over four major river basins in southern Africa. Part II: Future changes under 1.5 °C, 2.0 °C and 3.0 °C warming levels. Atmos. Res. 2023, 293, 106921. [Google Scholar] [CrossRef]
  63. Fan, Z. Simulation of land cover change in Beijing-Tianjin-Hebei region under different SSP-RCP scenarios. Acta Geol. Sin. 2022, 77, 228–244. [Google Scholar]
  64. Yang, Y.; Bao, W.; Li, Y.; Wang, Y.; Chen, Z. Land Use Transition and Its Eco-Environmental Effects in the Beijing–Tianjin–Hebei Urban Agglomeration: A Production–Living–Ecological Perspective. Land 2020, 9, 285. [Google Scholar] [CrossRef]
  65. Eyring, V.; Bony, S.; Meehl, G.A.; Senior, C.A.; Stevens, B.; Stouffer, R.J.; Taylor, K.E. Overview of the Coupled Model Intercomparison Project Phase 6 (CMIP6) experimental design and organization. Geosci. Model. Dev. 2016, 9, 1937–1958. [Google Scholar] [CrossRef]
  66. Siabi, E.K.; Awafo, E.A.; Kabo-bah, A.T.; Derkyi, N.S.A.; Akpoti, K.; Mortey, E.M.; Yazdanie, M. Assessment of Shared Socioeconomic Pathway (SSP) climate scenarios and its impacts on the Greater Accra region. Urban Clim. 2023, 49, 101432. [Google Scholar] [CrossRef]
  67. Mondal, S.K.; Huang, J.; Wang, Y.; Su, B.; Zhai, J.; Tao, H.; Wang, G.; Fischer, T.; Wen, S.; Jiang, T. Doubling of the population exposed to drought over South Asia: CMIP6 multi-model-based analysis. Sci. Total. Environ. 2021, 771, 145186. [Google Scholar] [CrossRef]
  68. Zhu, X.; Lee, S.-Y.; Wen, X.; Ji, Z.; Lin, L.; Wei, Z.; Zheng, Z.; Xu, D.; Dong, W. Extreme climate changes over three major river basins in China as seen in CMIP5 and CMIP6. Clim. Dynam. 2021, 57, 1187–1205. [Google Scholar] [CrossRef]
  69. Wu, X.; Wang, L.; Niu, Z.; Jiang, W.; Cao, Q. More extreme precipitation over the Yangtze River Basin, China: Insights from historical and projected perspectives. Atmos. Res. 2023, 292, 106883. [Google Scholar] [CrossRef]
  70. Ma, Q.; Wang, P.; Yang, X.; Yuan, J.; Li, J.; Liu, W. Research on Delineation of Ecological Protection Red Line for Biodiversity Conservation in Qinling Mountains. Resour. Environ. Yangtze Basin 2020, 29, 634–642. [Google Scholar]
  71. Jing, C.; Jiang, T.; Su, B.; Wang, Y.; Wang, G.; Huang, J.; Gao, M.; Lin, M.; Liu, S.; Zhai, J. Multiple application of shared socioeconomic pathways in land use, energy and carbon emission research. Trans. Atmos. Sci. 2022, 45, 397–413. [Google Scholar] [CrossRef]
Figure 1. Geography situation of the URHR: (a) location, elevation and sub basins distribution of the URHR in China; (b) location of administrative cities.
Land 12 01770 g001
Figure 2. Research framework of the study.
Land 12 01770 g002
Figure 3. Spatial patterns of historical land use and PLES in the URHR.
Land 12 01770 g003
Figure 4. Spatial distribution of the future PLES under the SSP2-4.5 and SSP5-8.5 scenarios in the URHR.
Land 12 01770 g004
Figure 5. Transition matrix of future land use under SSP2-4.5 and SSP5-8.5.
Land 12 01770 g005
Figure 6. Transition matrix of future land use in near-term under (a) SSP2-4.5 and (b) SSP5-8.5, medium-term under (c) SSP2-4.5 and (d) SSP5-8.5 and long-term under (e) SSP2-4.5 and (f) SSP5-8.5 in sub-basins.
Land 12 01770 g006
Figure 7. Space transition matrix of future PLES under the SSP2-4.5 and SSP5-8.5 scenarios.
Land 12 01770 g007
Figure 8. Spatial variations of future PLESI in the URHR from 2000 to 2100.
Land 12 01770 g008
Figure 9. (a) Temporal variations of PLESI in the URHR from 2000–2100; (b) annual average values of PLESI in sub-basins in the historical period and under two scenarios.
Land 12 01770 g009
Figure 10. Temporal variations of PLESI in sub-basins (al) from 2000–2100 under SSP2-4.5 and SSP5-8.5.
Land 12 01770 g010
Table 1. Summary information of data.
Data CategoryData NameTime ResolutionSpatial ResolutionData Sources
Land use-2000–2020300 mESA CCI Land Cover project
(https://cds.climate.copernicus.eu/cdsapp#!/dataset/satellite-land-cover?tab=overview accessed on 20 September 2021)
Climate datatemperature
precipitation
2000–2020Meteorological stationChina Meteorology Administration (http://data.cma.cn accessed on 10 December 2021)
Climate scenariostemperature
precipitation
2021–2100-World Climate Research Programme
(https://esgf-node.llnl.gov/search/cmip6/ accessed on 1 July 2021)
Terrain DataDEM200330 mNASA Shuttle Radar Topographic Mission (https://srtm.csi.cgiar.org/ accessed on 15 June 2020)
Socioeconomic dataGDP
population
20151 km1 km Grid GDP, 1 km Grid population of Chinese Academy of Sciences (www.resdc.cn/ accessed on 20 June 2020)
residential site2020vector dataNational Geographic Information Data
(www.webmap.cn/commres.do?method=dataDownload accessed on 3 September 2021)
traffic network
Table 2. PLES classification and multi-functional assessment in the URHR.
PLESLand UseProduction FunctionEcological FunctionLiving Function
production spacedryland530
paddy field530
ecological spaceforest land050
grassland351
water land350
living spacebuilding land305
Table 3. Transition matrix of future PLES in the URHR (km2).
Research PeriodPLESSSP 2-4.5SSP 5-8.5
PSESLSPSESLS
2020–2030PS12,216373112,495960
ES45949,422017849,7011
LS5521173211
2030–2050PS12,056356112,2032083
ES52149,522138049,6612
LS133219811216
2050–2100PS11,200790011,4195710
ES120149,245198149,4651
LS129234147234
Disclaimer/Publisher’s Note: The statements, opinions and data contained in all publications are solely those of the individual author(s) and contributor(s) and not of MDPI and/or the editor(s). MDPI and/or the editor(s) disclaim responsibility for any injury to people or property resulting from any ideas, methods, instructions or products referred to in the content.

