Abstract
It is vital to conduct urban ecosystem service evaluations and demarcate ecological management zoning to preserve regional ecological security and the spatial optimization of urban functions. This study assessed and examined the spatial distribution characteristics of the supply and demand of five typical ecosystem services in Zhengzhou and their matching pattern. Based on Maslow’s hierarchy of needs, urban ecological management zoning was demarcated to guide the spatial optimization of urban functions. The results showed that most of the ecological goods and services in Zhengzhou were generally provided in the west and south of the city. High-value areas of ecosystem service demand were mainly found in the urban center. There was a definite circle structure of total ecosystem service demand. Carbon sequestration, grain production, water yield, and habitat maintenance in the urban center area indicated an ecological deficit. Soil conservation in most regions was a surplus trend. Zhengzhou was demarcated into five groups of ecological management zoning. Different preferences had an impact on the ecosystem service supply and demand. The rise in living conditions led to an increase in the demand for high-level ecological services. This study can provide an essential theoretical basis and practical assistance for urban space optimization and ecosystem service management.
1. Introduction
Natural ecosystems are the material underpinning of human existence and development [1,2]. Along with the tremendous increase in the world’s productivity, severe damage has been done to ecosystems in recent years. At present, 75 percent of the global terrestrial environment and 66 percent of the global marine environment have been severely altered by human activities, and more than 60 percent of ecosystem services are rapidly declining, profoundly affecting human well-being and the sustainable development of natural–social–economic complex systems [3,4]. A significant reason for this is that ecosystem services and regional socioeconomics have not been optimally configured and effective management of ecosystem services is lacking [5,6]. As a typical natural–social–economic complex system, cities have become the center of human production and life with the concentration of population and social and economic resources. With the deepening of urbanization in China, high-intensity development and construction have encroached on a large amount of urban ecological space, triggering the transformation of the original structure and function of the ecosystem, causing ecological deficits and reducing the quality of urban habitat and regional well-being [7]. China has established an ecological civilization system to construct a new pattern of modern cities where people and nature coexist. Although the current process of land urbanization has converged, human demand for natural ecosystem services has gradually increased, creating newer and greater demands on regional and urban sustainable development [8,9]. To this end, the United Nations Sustainable Development Goals call for inclusive, safe, resilient, and sustainable cities and human settlements that protect, conserve, restore, and promote ecosystems within cities and communities, minimize environmental impacts, and shift toward sustainable consumption and production patterns. Therefore, how to achieve more reasonable spatial allocation, scientifically manage the ecosystem, improve the structure and function of the biosphere, and improve the satisfaction of human well-being in the context of sustainable urban development has become a critical issue to be solved in the current urbanization development process [10].
Eco-zoning is a new technique to increase human well-being and accomplish sustainable ecological growth. Eco-zoning aims to build and restore ecological integrity and sustainable supply of ecosystem services and seeks solutions with spatial differentiation and functional synergy from the integrated perspective of pattern-process-service-sustainability, which is of great significance for the fine management of urban ecosystems and differentiated control of ecological governance. Early eco-zoning was primarily centered on a single factor. With the development of ecosystem integrity and hierarchy theory, Bailey [11] first proposed the true sense of eco-zoning from the perspective of an ecosystem, considered eco-zoning the process of combining natural units by spatial relationships, and compiled the eco-zoning map of the United States. After that, Rowe [12], Prentice [13], Olson [14], Spalding [15], and Abell [16] also released different eco-zonings one after another. Most of these schemes are aimed at ecosystem protection and cover multiple ecosystems such as terrestrial, marine, and freshwater, showing the spatial differentiation of environmental factors such as temperature, moisture, geomorphology, vegetation, and soil among regions [17,18]. However, traditional eco-zoning ignores the features of the regional human–land relationship. Some studies have shown that due to the single purpose of eco-zoning, there is a geographical mismatch between global priority areas for biodiversity conservation and high-value areas of terrestrial ecosystem services [19]. The study has also revealed that places aiming to enhance biodiversity do not deliver more ecosystem services than randomly selected regions [19]. Although the purpose of ecosystem conservation is fulfilled, it does not give more ecosystem benefits to humans than the protection of other regions. It is challenging to attain sustainable development goals such as providing ecological security and sustaining human well-being [20]. Ecosystem services are a vital link between human society and the natural environment [12,21,22]. Compared with stationary environmental conditions, the supply–demand relationship or influence degree between ecosystem services and human society is more likely to lead to changes in ecosystem management [20]. Carrying out eco-zoning based on ecosystem services is more conducive to determining the response of ecosystems to natural and human disturbances and establishing regional ecological security and coordination of people-land relations [23].
Ecosystem services have been a major issue in the past 30 years [24,25]. Most of the current common eco-zoning studies incorporate ecosystem services, which are undertaken based on ecosystem service attributes, such as ecosystem service bundles [26], multiple environmental variables [27], and structural characteristics [28]. Study content comprises several characteristics such as ecosystem function and health [29,30], involving elements such as water [31], wetlands [32], and woodlands [33]. Study scales are primarily focused on the watershed [34], province [26], and county [35], and the methods employed are the 3S approach [36], hierarchical analysis [37], and principal component analysis [38], respectively. Some studies have mostly conducted zoning exploration based on individual ecosystem services, but it is difficult to reflect the overall status of the ecosystem, and the results are biased [39]. The Chinese government has also implemented eco-zoning at the national level, analyzed several forms of ecosystem service individually, and built China’s ecological function area using a top-down delineation approach. These studies have established a scientific basis for ecosystem and natural resource management and sustainable usage in China [40]. However, there are certain loopholes in these eco-zonings. Most of them are based on the potential supply capacity of ecosystems, ignoring human demand for ecological products and services and failing to evaluate whether ecosystem services can indeed be translated into human well-being. Current studies on ecosystem services increasingly emphasize a human-centered mentality, with human needs and well-being receiving more emphasis. Ecosystem services are the utility that people obtain from ecosystems. The structure and processes of ecosystems cannot form a complete ecosystem service if significant human needs are ignored [41,42]. Moreover, at present, eco-zoning is still dominated by large scales, leading to difficulty in identifying the internal heterogeneity of areas, and a lack of village-scale studies, which leads to poor applicability of zoning conclusions. Therefore, combining the supply and demand of ecosystem services and conducting village-scale eco-zoning is an area where ecological management zoning needs to be strengthened.
Studies on the supply and demand of ecosystem services have made considerable progress in recent years. Most studies have provided information to support eco-zoning by analyzing the mismatch between supply and demand of ecosystem services in terms of space and quantity, ecosystem service flows, and exploring trade-offs between supply and demand of ecosystem services [43,44,45,46]. Studies have addressed different ecosystem services, such as provisioning, regulating, and cultural services, but less research has been carried out on supporting services [47]. Study scale types include global [48], national [49], regional [46], watershed [45], urban [50], towns and streets [51], and raster [52]. Most of the methods used are land-use estimation [43,53], ecological process simulation [54,55], questionnaire survey [56,57], and comprehensive integrated models [58,59,60]. These studies analyze the complex interactions between the supply and demand of different ecosystem services under the influence of natural environmental and socio-economic factors, greatly enriching the connotations of ecosystem services and providing the theoretical basis and scientific support to enhance and improve the ecosystem service management system. However, there is little research that hierarchizes ecosystem service demand. Maslow [61] created the “hierarchy of needs” hypothesis, which classified human demand from lower to higher levels into five levels: physiological, safety, love/belonging, esteem, and self-actualization. Lower-level demand is more fundamental than higher-level [62]. Therefore, when carrying out eco-zoning, it is vital to consider the disparities in the levels of ecosystem services.
The rising tension between more restricted natural resources and future socio-economic development needs has established more robust criteria for ecosystem management in China: analyze the supply–demand relationship and spatial characteristics of regional ecosystem services, study the relationship between ecosystem service supply, social demand, and human well-being, and demarcate ecological management zoning, which meets the requirements of ecological civilization construction. As a new national central city in China, Zhengzhou has undergone significant economic growth in recent years. As a result, it environmental carrying capacity has been dramatically reduced, biodiversity has declined, fresh water quality is reduced, soil erosion and geological disasters have intensified, and ecological inadequacies have become increasingly evident. In response to the existing environmental difficulties and the need for economic and social growth in Zhengzhou, this study chose the village as the primary study unit. Based on the hierarchy of needs, five categories of ecosystem services, including grain production, water yield, carbon sequestration, soil conservation, and habitat maintenance, were hierarchically determined in Zhengzhou. By studying the spatial distribution features of the supply and demand of the five types of ecosystem services and the matching pattern, variations in the matching pattern were explored, optimized countermeasures were developed, and ecological management zones were demarcated. Theoretically, researching the matching situation of village administrative units can assist in deepening and expanding the application potential of ecosystem service theory in geography and management disciplines. In practice, demarcating ecological management zoning and proposing zone-specific management methods can provide important guidance for urban space optimization and ecosystem service management and conservation.
2. Materials and Methods
2.1. Description of the Study Area
Zhengzhou is an important national central city in the central area, comprising six districts, five county-level cities and one county (Figure 1). Zhengzhou has a land area of 7567 km2 and its terrain is high in the west and low in the east, with plains and hills dominating the landscape. Human activities have led to a decreased supply of regional ecosystem services, and resource constraints on socio-economic development are becoming increasingly obvious. Zhengzhou’s strategic goal in this new phase is to establish a modern national central city, and the major criteria of this project are stable high-quality development and ecological protection. Demarcating eco-zoning assists decision-makers in optimizing urban spatial structure and developing a green metropolis.
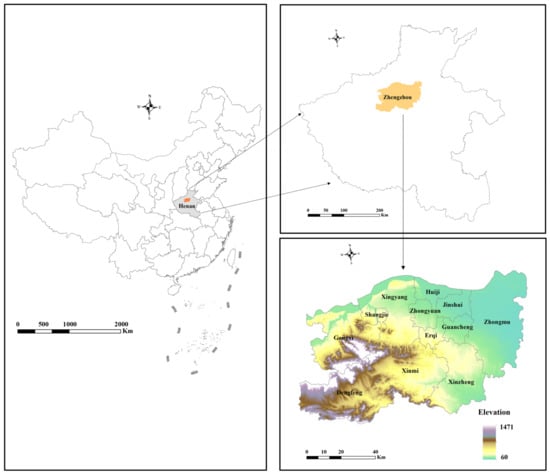
Figure 1.
Location of the study area.
2.2. Data Sources
Land-use data were gathered from the Resource and Environment Science and Data Center. Population density data were gathered from WorldPop. NDVI was provided by the National Ecosystem Science Data Center, National Science & Technology Infrastructure of China [63]. Meteorological data were from the National Earth System Science Data Center [64]. Soil data were gathered from the HWSD and Soil and Terrain Database. DEM were from ASTER GDEM. Carbon emission data were obtained from Carbon Emission Accounts and Datasets. Grain production supply and consumption statistics and water resources data were from the statistical yearbook and water resources bulletin. Species data were from Global Biodiversity Information Facility. Traffic data were from China’s Basic Geographic Information Center.
2.3. Methods
2.3.1. Conceptual Framework
Ecosystem services are a crucial bridge linking social systems and ecosystems. The essence of eco-zoning is to optimize urban spatial structure, strengthen the self-regulation and restoration ability of ecosystems, and balance the supply and demand of ecosystem services [46]. Eco-zoning directly influences regional ecosystem services by altering the structure and composition of distinct ecosystem constituents. The structure and function of an ecosystem determine the potential of a particular ecosystem to offer ecological goods and services. Changes in ecosystem services inevitably provide feedback to different stakeholders, resulting in changes in demand. The situation of supply–demand in a region defines its ecological status. For instance, if supply exceeds demand, it will result in wasted resources. If the supply is smaller than the demand, it will lead to a shortage of benefits on the demand side, generating an imbalance in the total supply and demand and spatial allocation, worsening ecological risk and consequently impacting human well-being [65,66].
The nature of ecosystem services and human needs vary, resulting in hierarchical disparities in ecosystem services [67]. Services that provide basic resources for human survival and maintain the basic living environment to support human physiological needs should be the basis [68]. The hierarchy of services that preserve the stability and sustainability of ecosystems to meet their own needs for life and security should be the second level [69]. Ecosystem services that improve the living environment and promote human well-being should be at the third level [70]. Services that satisfy one’s cognitive and aesthetic needs should be at the fourth level [71,72]. Ecosystems may be able to supply services that satisfy self-actualization and transcendence needs, which can be characterized as the fifth level [73,74]. Thus, based on the hierarchy of needs and the types of ecosystem services, ecosystem services can be classified into five levels from low to high: physiological needs, safety needs, needs for improvement of the living environment, needs for cognitive and aesthetic improvement and needs for self-actualization and over-actualization.
According to the New Urban Agenda put forward by the United Nations Conference on Housing and Sustainable Urban Development [75], cities should gradually achieve universal access to safe and affordable drinking water and sanitation for all, as well as equal access for all to food security and public goods and services such as nutrition, infrastructure, energy, and air quality. Water yield, grain production, and oxygen release are the basic ecosystem services supporting human life. SDG11, outlined in the 2030 Agenda for Sustainable Development, states that inclusive, safe, disaster-resilient, sustainable cities and human settlements should be constructed [76]. Services that ensure survival security, such as soil conservation, carbon sequestration, wind and sand control, and habitat maintenance, should be placed in the second tier [77,78]. Ecosystem services such as temperature regulation, air purification, noise abatement, and water purification can considerably enhance human well-being, and they can be used as needs for the improvement of the living environment [46,79]. Cities with a significant amount of spatially well-laid blue and green spaces can boost their residents’ cognitive well-being and aesthetics. Therefore, ecosystem services that provide spiritual, recreational, and cultural benefits can be viewed as the fourth level of services, which emphasizes passive human feelings [80,81]. Certain cultural services that enable a particular group of individuals to achieve self-transcendence at a specific period, such as religious beliefs, can be classified as the fifth level of services. This can lead to actively helping others and making the world a better place.
First, the supply and demand of ecosystem services at different hierarchies should be quantified under theories from sociology, management, geography, ecology, and other disciplines. Second, the correlation, coupling mechanism, and spatial characteristics of supply and demand matching should be clarified, and the key reasons for ecosystem service supply and demand imbalance should be examined. Finally, according to the similarity and difference in supply and demand of ecosystem services in different locations, eco-zoning is defined, control measures are formulated, ecological resources are appropriately allocated, and sustainable management of ecosystem services is supported (Figure 2).
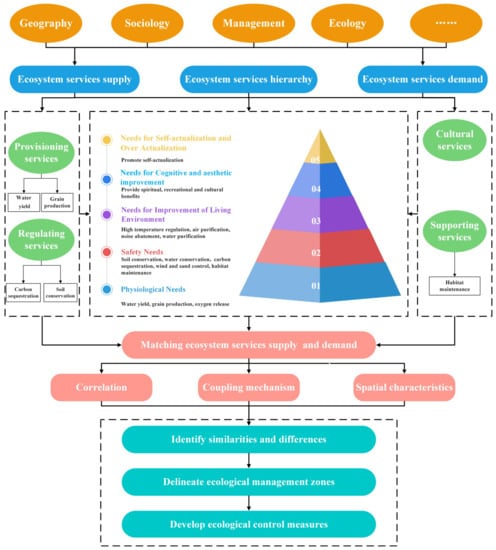
Figure 2.
Conceptual framework.
2.3.2. Calculation of Ecosystem Service supply and Demand
The study employed the annual water yield and carbon storage and sequestration modules of the InVEST model to calculate the carbon sequestration and water yield supply. The parameters can be found in the Supplementary Materials. The population density was combined with per capita carbon emissions and per capita water consumption to obtain the carbon sequestration and water yield demand, respectively. The linear relationship between crop yield and NDVI was utilized to predict the regional distribution of grain production supply [82]. Based on the per capita grain demand data published in the statistical yearbook and the population density, grain production demand can be derived. Soil conservation services were used as soil conservation supply in this study. The actual quantity of soil erosion was what humans expected to be managed, and the amount of ecosystem services humans expected to obtain was considered the soil conservation demand. The Revised Universal Soil Loss Equation (RUSLE) was used to estimate regional soil conservation and erosion [83,84,85].
Habitat maintenance supply was computed using the habitat quality module provided by the InVEST model. In this study, habitat maintenance demand was obtained from the perspectives of species survival and human activities. Species survival demand relates to the fact that the denser the species distribution, the larger the habitat maintenance demand. Human activity demand is the demand that develops from the loss in habitat maintenance owing to the utilization of habitat by humans for production and livelihood. Human activity demand is determined using the degree of habitat degradation and NDVI change variables. The higher the degree of habitat degradation, the more urgent the habitat maintenance demand. In places with smaller NDVI values, forests and grasslands are encroached on for construction land, resulting in a decline in habitat maintenance services and increased ecosystem demand. There are dimensional discrepancies in different datasets, and this study used standardized data to generate the habitat maintenance demand. Based on Maslow’s hierarchy of needs and the conceptual framework proposed in this study, this paper assigned different scores to five different ecosystem services in the calculation process according to their own hierarchy to calculate the total ecosystem service supply and demand. The calculation process needed to standardize the supply and demand of the five ecosystem services to facilitate analysis and comparison. The formulae are as follows:
Carbon sequestration:
is the carbon sequestration supply; , , , and are the carbon densities of aboveground and belowground biomass, soil and dead organic matter, respectively. is the area of different land-use types. is the carbon sequestration demand. is per capita carbon emission data. is population density.
Grain production:
is grain production supply of grid i. is the total grain production from statistical data. is the NDVI value of cultivated land i. is the sum of NDVI value of cultivated land. is grain production demand. is per capita grain demand. is population density.
Soil conservation:
SC is soil conservation amount. USLE is actual soil erosion. R is the rainfall erosion factor. K is the erodibility coefficient. LS is the slope gradient and slope length. P is engineering measures factor. C is the vegetation coverage factor.
Water yield:
is the annual water yield. is the annual actual evapotranspiration for grid x. is the annual precipitation on grid x. is the potential evapotranspiration. is the plant (vegetation) evapotranspiration coefficient. is the reference evapotranspiration. is the volume of plant-available water content. is an empirical parameter. is an empirical constant. is water yield demand. is per capita water consumption. is population density.
Habitat maintenance:
is the habitat quality of grid x in class j. is the habitat suitability of land-use type j. is the degree of habitat degradation in grid x with habitat type j. k is the half-saturation constant. z is the normalized constant, usually equal to 2.5. is the habitat maintenance demand. , and are normalized data of the kernel density index of species observation POI, NDVI change value for the grid i and the degree of habitat degradation, respectively.
Total ecosystem services:
and refer to total ecosystem service supply and demand, respectively. is the hierarchy of different types of ecosystem services. The lower on the hierarchy of ecosystem services, the more fundamental and important they are. and are the different types of ecosystem service supply and demand, respectively. This paper assigned different scores to five different ecosystem services in the calculation process according to their hierarchy to calculate the total ecosystem service supply and demand. Specific scores are shown in Table 1.

Table 1.
Parameters for four scenarios.
2.3.3. Matching Ecosystem Service supply and Demand
The study used the ecosystem services supply–demand ratio (ESSDR) to measure regional supply–demand status. ESSDR relates the ecosystem service supply to human demand, enabling the coupling of supply and demand, and is used to reveal the nature of surplus or deficit. The formula is as follows:
S and D refer to the ecosystem service supply and demand in the region, respectively. and are the highest value of ecosystem service supply and demand in the assessment area, respectively. ESSDR > 0 suggests an overabundance of ecosystem services. ESSDR = 0 shows that supply and demand are in balance. ESSDR < 0 indicates that demand exceeds supply.
2.3.4. Ecological Management Zoning
This study utilized the grouping analysis tool in ArcGIS to calculate ecological management zoning (EMZ) for the study region. The grouping analysis tool is based on machine learning approaches that do not require a collection of pre-classified elements to guide or train to discover natural groups of data so that all elements in each group are as similar as possible to each other but as distinct as possible from one group to another. Grouping effectiveness is quantified using the Calinski–Harabasz pseudo F-statistic, which is a ratio representing within-group similarity and between-group difference [86]:
where , and SST is a reflection of between-group differences and SSE reflects within-group similarity:
where n is the number of features, is the number of features in group i, is the number of classes, is the number of variables used to group features, is the value of the variable of the feature in the group, is the mean value of the variable, is the mean value of the variable in group i. When a group has the maximum pseudo F-statistic, it indicates that it is most effective at distinguishing the features and variables specified.
3. Result
3.1. Matching Patterns of Different Ecosystem Service Supply and Demand
Significant regional disparities existed in the different kinds of ecosystem service supply and demand in the study area (Figure 3a,b, Figure 4a,b, Figure 5a,b, Figure 6a,b and Figure 7a,b). High-value regions for carbon sequestration, soil conservation, and habitat maintenance were concentrated mainly in the western hills with superior environmental conditions, but water yield was the weakest in this area. Low-value regions for carbon sequestration, grain production, and habitat maintenance were positioned in cities with considerable economic activity. The plains had a good grain-producing capacity but were deficient in soil conservation. The plains were typical agro-ecosystems, providing limited carbon sequestration and habitat maintenance. Influenced by rainfall, southeastern Zhengzhou was able to provide the most robust water yield. Soil conservation and water yield displayed apparent directionality, and carbon sequestration, grain production, and habitat maintenance had a typical hierarchical structure. Soil conservation supply was characterized by a steady weakening from west to east. Water yield supply was low in the northwest and high in the southeast. Carbon sequestration, grain production, and habitat maintenance supply were generally lacking in the urban core, while ecosystem service provision rose farther out from the urban core.
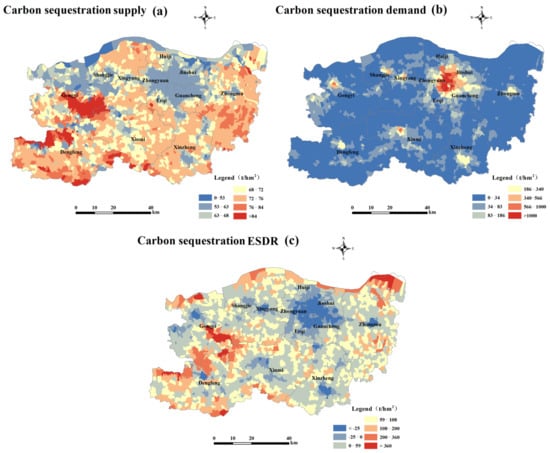
Figure 3.
Spatial distribution of carbon sequestration supply, demand and matching pattern.
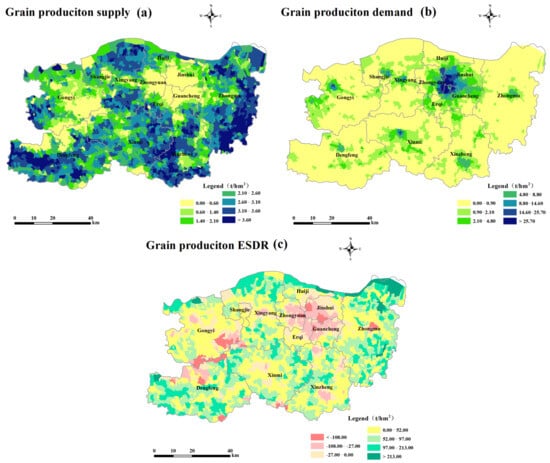
Figure 4.
Spatial distribution of grain production supply, demand and matching pattern.
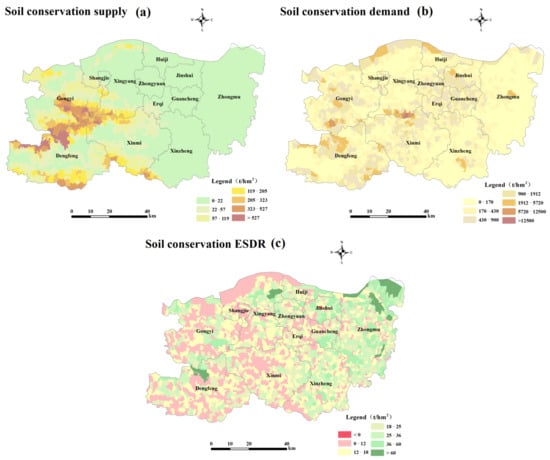
Figure 5.
Spatial distribution of soil conservation supply, demand and matching pattern.
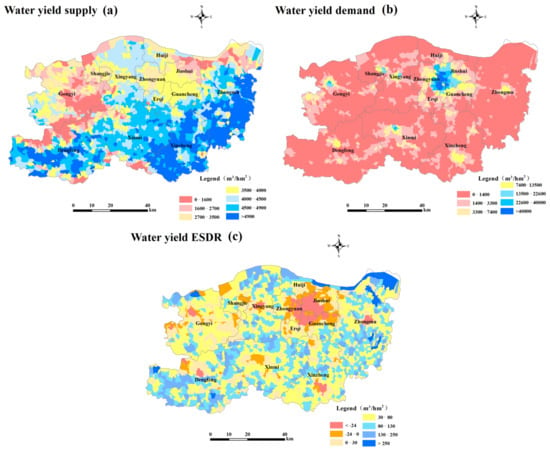
Figure 6.
Spatial distribution of water yield supply, demand and matching pattern.
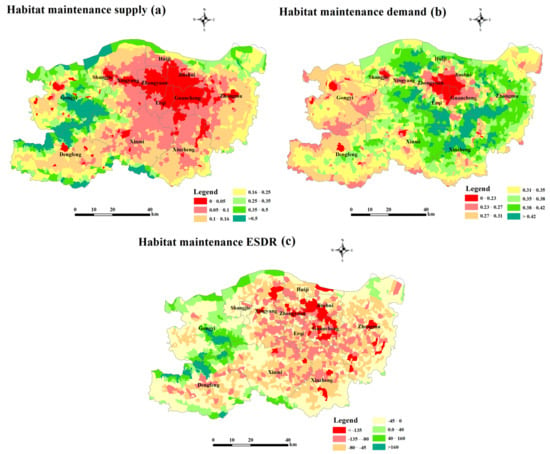
Figure 7.
Spatial distribution of habitat maintenance supply, demand and matching pattern.
Carbon sequestration, grain production, and water yield demand were directly connected to population density, with high values centered in the core areas of cities and counties. The suburban areas were less densely populated than the urban core and had weaker demand. Agricultural production areas and hilly areas had the lowest population density and the lowest demand. Soil conservation demand was high in the west and low in the east. Habitat maintenance demand was the most specific. The hills in the west had an excellent environment and offered a considerable number of habitat maintenance services, enough to meet demand. The urban core, on the other hand, is not habitat and does not need habitat maintenance services. Therefore, the habitat maintenance demand was relatively minimal. The city was surrounded by agricultural areas. The growth of agricultural land destroyed natural vegetation, and improper management generated environmental problems such as soil erosion, diminishing soil fertility, over-abstraction of groundwater and surface water, and salinization. Moreover, the rapid expansion of the urban built-up area in Zhengzhou in recent decades has resulted in a high degree of habitat degradation, leading to a higher habitat maintenance demand due to the reduced habitat.
The matching situation between distinct ecosystem service supply and demand had considerable regional variances (Figure 3c, Figure 4c, Figure 5c, Figure 6c and Figure 7c). Carbon sequestration, grain production, and water yield ran ecological deficits in urban centers and surplus in plain areas. The farther carbon sequestration and grain production were from the metropolitan core, the more ecological surplus there was. Most rural regions showed a surplus trend in soil conservation, although the eastern portions were substantially better. Habitat maintenance services differed from other types, most urban cores and plains were in ecological deficit, and the ecological surplus areas were primarily concentrated in the hills in the southwest of Zhengzhou. Carbon sequestration, grain production, water yield, and habitat maintenance had significant negative spatial correlations, and soil conservation was positive. The natural endowment, environmental condition, and population distribution of each region were the direct variables that influenced the matching situation.
3.2. Spatial Distribution of Total Ecosystem Service Supply and Demand
Western Zhengzhou was a significant ecological barrier with suitable environmental conditions. Except for water yield and grain production, all other ecosystem services had significant value in this location. The alluvial plains of the Huang He River Inundated Area in southeastern Zhengzhou, with its relatively flat topography and fertile soil, provided much of the region’s food and guaranteed regional food security. The hills in the west and the plains in the south contributed most of the ecological products and services to Zhengzhou. With high economic and population densities, cities are the core of regional economic development. Because urbanization has the property of vicious plundering of natural resources, the urban environment tended to have numerous issues and had the worst potential to offer products and services among all ecosystems. In addition to portions of each district, low-value areas of the total ecosystem service supply were spatially spread out and primarily rural areas with good economic development (Figure 8a). In particular, some villages in the southwest were scattered in a “mosaic” around the high-value sectors. The villages in the north, mostly covered by the Yellow River, were also poor in total ecosystem service supply. Many villages were in the rural–urban fringe. Although human activity intensity and population density were much lower than in the urban core, land fragmentation was high, and the primary land type was construction land. Moreover, many places were difficult to govern, leading to unlawful land occupancy, low efficiency in land resource exploitation, and even higher environmental pollution than metropolitan centers, resulting in their limited ecosystem service supply capability.
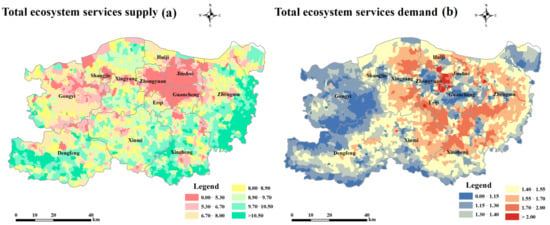
Figure 8.
Total ecosystem service supply and demand. Note: The standardized five types of ecosystem services were used to calculate the total ecosystem service supply and demand according to Equations (13) and (14).
The total ecosystem service demand exhibited a distinct circle structure (Figure 8b). The junction of Zhongyuan, Guancheng, Erqi, and Jinshui were the urban core areas of Zhengzhou City, with high population density and strong economic activity, and were areas where ecosystem service demand was the highest. The demand was substantially lower in the circles outside of the metropolitan core. A decrease in population density, notably in the western part of Zhongyuan and the central part of Guancheng, was a significant factor in this phenomenon. As the circle continued to extend outward, demand again increased dramatically. These places were distinctive and largely distributed at the borders of various county administrative units. A fundamental explanation for this phenomenon was the high habitat maintenance demand. The large rural areas in the outer layer, where land-use types were mostly arable land and low population densities, did not have a strong demand for essential ecosystem services. The total ecosystem service demand was likewise lower in the outermost region, directly related to the lower human density and better environmental conditions.
3.3. Demarcating Ecological Management Zoning
The maximum pseudo F-statistic is 5 (Figure 9). In this study, the EMZ of Zhengzhou was demarcated into five groups (Figure 10). Different groups mirrored the regional peculiarities.
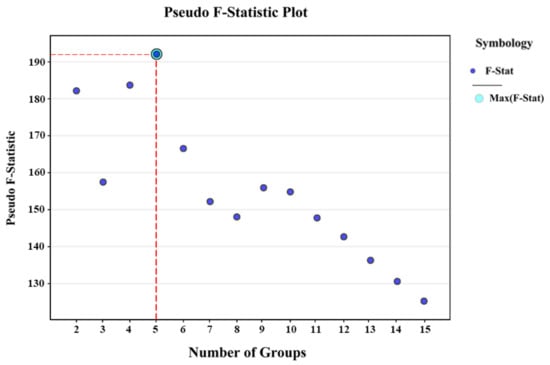
Figure 9.
Pseudo F-statistic plot. Note: The circled point on the graph is the largest F-statistic, indicating how many groups will be most effective at distinguishing the features and variables you specified.
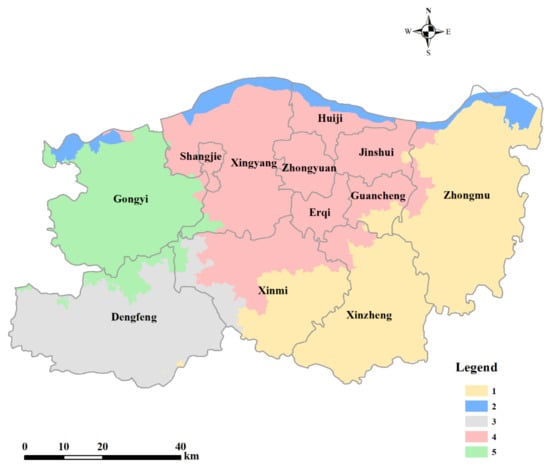
Figure 10.
Location of ecological management zoning.
No. 1 EMZ was famous for the Huang He River Inundated Area in China. Due to the deposit of Yellow River sediment, the soil here is deep, the terrain is flat, and the agricultural economy is relatively developed, making it a good base for grain, fruit, and vegetable production in Zhengzhou. The region should implement ecological agriculture focused on the development of a planting industry with pollution-free anti-seasonal vegetable and high-quality grain and seedling production, strengthen arable land and basic farmland protection, strictly control the disorderly expansion of large and medium-sized cities and the indiscriminate occupation of arable land, and improve the agricultural ecological environment.
No. 2 EMZ was the area where the Yellow River dominated. The region has a certain degree of soil erosion due to the high terrain of the river banks, and pollution from upstream threatens the ecological security of the wetlands. The region should strengthen its pollution control and treatment of industrial enterprises along the river, focus on protecting the river water, shoreline, and beach areas, implement the conversion of riverbank farmland to grassland, protect the natural vegetation on both banks, and prevent and control soil erosion.
No. 3 EMZ was distributed in the southwest, with vast mineral resources and was an important mining location. Frequent human activities have contributed to the fragmentation of surface habitats. Special, green, and organic agriculture should be promoted where the land is in good condition. In places with substantial soil erosion, private mining should be rigorously restricted, and the restoration and reclamation of industrial and mining wasteland and the complete usage of tailings should be carried out to improve the mining environment.
No. 4 EMZ contained another large grain-producing area and the metropolitan core. The grain-producing area has low values of water yield in Zhengzhou, and water resources hamper the coordinated growth of the social economy and ecological building. There is also a certain degree of soil erosion. The area should focus on improving the utilization rate of water resources, strengthening nutrient and soil protection, enhancing ecological management of agricultural land, and improving vegetation cover. The urban core should adhere to green development and low-carbon development, promote the green and ecological transformation of urban areas, vigorously implement the construction of small and micro-green spaces, increase urban ecological space supply, maintain the natural form of rivers, lakes, and waterfront areas, and form a relatively complete urban blue and green space system.
No. 5 EMZ featured varied terrain such as plains, mountains, and hills and was a critical ecotourism region. The region should strengthen ecological construction, prevent soil erosion, improve forest coverage, strengthen historical and cultural resources and natural environmental protection, focus on developing large-scale plantations and agricultural leisure industries, and expand cultural tourism using natural and humanistic scenery as appropriate.
4. Discussion
4.1. Impact of the Different Hierarchy of Preference on Ecosystem Service Supply and Demand
According to the hierarchy of needs, humans must first satisfy fundamental physiological needs, then safety, love/belonging, esteem, and eventually self-actualization. As fundamental needs are met, higher hierarchy needs are the next set of requirements that humans aspire to acquire in order to have a strong sense of well-being and the prospects for sustainable development rise [67,87,88]. This is expressed in the assumption of an environmental Kuznets curve, which yields an inverted U-shaped relationship between economic growth and environmental quality [89]. The assumption is that there is a trade-off between economic growth and environmental quality when income is low. As affluence continues to climb, economic progress is complemented by improvements in environmental quality. In the case of forests, for example, when humans are in a primitive stage, slash-and-burn agriculture is utilized to gather the food, shelter, or clothing necessary for survival in order to meet fundamental physiological needs and provide safety from danger. Deforestation is expected during this stage, resulting in widespread forest degradation and a declining environmental state. As human existence becomes richer, basic needs eventually expand to the hierarchy of socialization, self-esteem, and self-actualization [69]. Higher-level needs include more pleasant environmental, spiritual, or social needs. Forest ecosystem services are regarded more highly, and humans have embarked on various forms of ecological restoration initiatives in an effort to repair damaged lands via replanting to satisfy the demand for greater recreational activities, spirituality, and culture. The value of different types of forests in Europe and the United States in terms of entertainment and tourism, water production quantity and quality, comfort value, wildlife, and biodiversity was similar to that of wood products [69,90,91]. Higher income leads to a change from diminishing to growing forest areas. Forest management has evolved from high ecological impact to environmentally friendly, with more emphasis on comfort value [92]. This is also verified by the luxury effect, where urban plant biodiversity frequently increases with the affluence of the people [93,94].
Four scenarios, including the Maslow scenario, equal weight scenario, affluence, and poverty scenarios, were utilized in this study to try to mimic the impact of varied preferences on the ecosystem service supply and demand. The Maslow scenario was weighted according to the hierarchy of needs, and the affluence scenario focused more on regulating and supporting services and least on provisioning services (Table 1). The poverty scenario, on the other hand, focused more on provisioning services. The findings demonstrated considerable geographical disparities in the ecosystem service supply and demand under different scenarios. Poverty and affluence scenarios were the two extremes, and Maslow and the equal weight scenario were closer to reality. In the Maslow scenario, the supply in diverse places dropped with increasing distance from the metropolitan hub while the demand showed wave-like change (Figure 11). The supply capability of the peri-urban areas under the equal weight scenario was weaker than the Maslow scenario (Figure 12). The mountainous areas in the west showed the opposite pattern, with an increase in supply capacity. There was a significant difference between the demand in the equal weight and the Maslow scenario and the demand intensity in the suburban areas was elevated. Comparing the two scenarios, the Maslow scenario seemed more in line with people’s expectations. The poverty scenario was more focused on provisioning services, resulting in many villages in the east and south of this scenario having the highest total ecosystem service supply of the four scenarios (Figure 13). While the demand for two categories of provisioning services expanded, the importance of the demand for other types of ecosystem services was underestimated, resulting in poor total demand. The affluence scenario, with increased emphasis on regulating and supporting services, resulted in weak total supply in most of Zhengzhou, which was only high in select hilly locations. Accordingly, increased high-level ecosystem service demand accompanied a gain in quality of life (Figure 14).
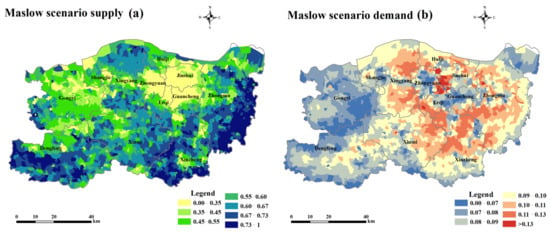
Figure 11.
Total ecosystem service supply and demand of Maslow scenario.
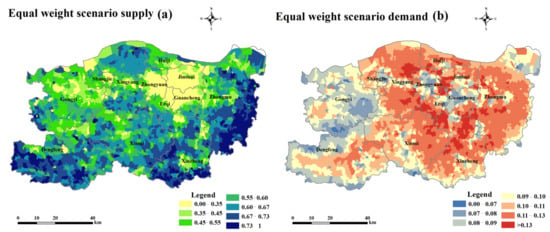
Figure 12.
Total ecosystem service supply and demand of equal weight scenario.
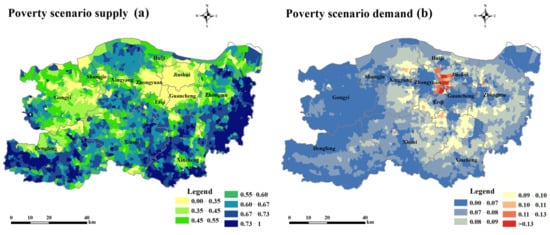
Figure 13.
Total ecosystem service supply and demand of poverty scenario.
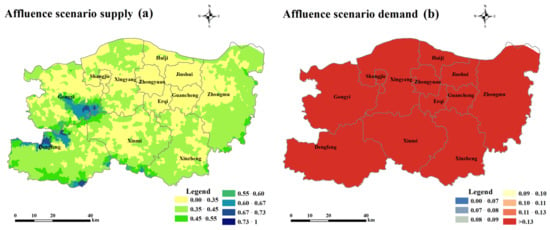
Figure 14.
Total ecosystem service supply and demand of affluence scenario.
The total ecosystem service demand was high in all of Zhengzhou. The poverty and affluence scenario results were similar to those of previous studies. With urbanization and rising wages, Chinese residents’ demand for public goods and services has expanded, and people’s physical and spiritual needs are changing [95]. Studies in metropolitan areas showed that the production of low-income gardeners was concentrated on edible species. High-income gardeners chose more decorative plants that satisfied aesthetic needs because they could meet their food needs commercially [94,96]. Residents in rich places were prepared to pay more for a higher level of ecological service, yet this was more of a luxury for people in poor areas. Many studies also indicated the increased demand for healthy, organically farmed foods in developed Western countries (90 percent of total organic food consumption) [97,98]. With increased money, the ecosystem service demand has altered substantially, and economic and social factors can dramatically affect biodiversity. Today, the major social dilemma in China has evolved into the contradiction between the people’s growing need for a better life and unbalanced and insufficient development. How to respond to the changing structure of citizens’ demands and achieve sustainable growth is a crucial challenge for policymakers.
4.2. Transforming Values to Avoid Rigidity Traps to Achieve Sustainable Development and Enhance Human Well-Being
The ultimate objective of studying ecosystem services is to sustain and promote human well-being. Urban eco-zoning in connection with human demands is carried out to allocate space more rationally, optimize and develop the ecosystem service supply capacity, and promote the satisfaction of human well-being. Human well-being primarily encompasses fundamental economic, environmental, and subjective well-being, the composition of which is similar to Maslow’s hierarchy of needs. Fundamental and environmental needs require the provisioning service, while economic needs and subjective well-being rely on the availability of ecosystem services and social goods and benefits. Fundamental human needs include food, water, and shelter. Environmental needs include the desire to ensure environmental conditions away from tipping points in ecological systems to ensure environmental safety, including the availability of clean air and water, acceptable levels of biodiversity, minimal exposure to toxic pollutants, and minimal light and noise pollution, and involve multiple levels of Maslow’s hierarchy of needs [67]. Economic needs primarily concern urban services such as suitable employment, education, health care, and particular basic social needs without strict dependence on natural systems [99]. Subjective well-being is an overall assessment of the quality of one’s life based on subjective feelings, resulting in a condition of predominant satisfaction and good emotions about life [100]. It involves the social needs (friendship), respect, and self-actualization stages of Maslow’s theory. Subjective well-being is influenced by several elements, the two most important drivers of which are probably life satisfaction [101] and happiness [102]. Physical perception (seeing, hearing, smell, etc.), psychological intuition (higher level feelings such as comfort, security, etc.), and cultural perceptions (ideology, lifestyle, customs, religious beliefs, etc.) work together to influence people’s life satisfaction and happiness. Current research on the factors influencing happiness is mostly concentrated on the topic of values.
Values are people’s opinions about the importance of things, which are abstract, transcendent, and worthy aims that lead one’s life or other social existence [103]. The Schwartz hypothesis of fundamental values is universal and defines ten basic individual values [104]. A ring structure can represent the relationship between the ten values. The more similar the values, the more similar the motivation types, and the greater the likelihood that individuals will engage in consistent behavior or judgment. Fundamental values have been demonstrated to be stable and universal across cultures. However, the hierarchy of values and the types of goals or motives they convey may alter over organizational levels and time [105,106]. As societies mature, human values from diverse economic and cultural backgrounds alter in scale, and the variations in higher-level demands become increasingly relevant. Several studies show that residents in Europe and the United States are more concerned with cultural ecosystem services, including aesthetics and entertainment, while residents in developing countries value the basic materials that secure their lives most, and the underlying reason for this is different values [107,108,109,110]. Moreover, due to the complexity and spatial and temporal diversity of the coupled human–nature system, residents’ needs may fluctuate over developmental periods rather than change linearly [111]. For example, as individuals grow older and people form families and hold stable positions, values typically shift from self-enhancement to more significant concern for the welfare of others. It has been demonstrated that socio-economic development tends to produce intergenerational value differences and a shift from survival values to self-expression, with an increased likelihood of achieving sustainable development [112].
Values are considered essential in sustainability studies but are typically disregarded [113]. Values influence landscape conditions by promoting or constraining human activity and can also play a vital role in determining the acceptability of landscape conditions [114] because all human activities occur within ecosystems and are directly or indirectly fully dependent on them. Ecosystem services are communicated to humans through the ecosystem structure–function–value chain. Ecosystem services are intimately tied to human needs and values. As highly connected systems, social–ecological systems are highly susceptible to rigidity traps. A certain degree of rigidity is necessary and essential to sustain the integrity of the social structure [115]. Examples include basic needs and environmental needs in human well-being. Humans cannot survive without water and food, and survival situations cannot exist without security. Institutions in social–ecological systems can become highly interwoven, self-reinforcing, and rigid over time, resulting in a lack of diversity of perspectives or viewpoints. The response of the system in this situation is rigid and unable to absorb fresh knowledge or experience. Rigidity traps are also used to characterize natural resource or land management, in which the core is the incapacity of social or ecological feedback mechanisms to prompt management changes under stressful conditions [116]. For example, overly regulated planning and management of land use and intensive agricultural systems may lead to rigidity traps that enhance desertification processes in the Apulia region (southern Italy), eroding resilience rather than the adaptability needed to cope with the surprises of climate change [117]. Forest fire suppression in the southwestern United States tries to lessen the wildfire hazard by moderating fire. However, it ignored the ecological functions of fire in forest systems, leading to the accumulation of biomass fueling catastrophic fires [118]. The ultimate goal of sustainability is to find out which combinations of variables in an ecosystem lead to relatively sustainable and productive use of a given resource system operating on a given spatial and temporal scale and which combinations may instead lead to resource collapse and high costs to humans. Ecosystems have a considerable number of stochastically related interactions, yet their essential character can be articulated as a small number of critical control processes [119]. To avoid falling into the rigidity trap, ecosystems must actively manage this small number of critical control processes by maintaining and enhancing ecosystem resilience.
As a social–ecological system grows more complex and interrelated, the more inputs are required to maintain them, the more rigid and conservative they become [115]. Moreover, changing circumstances provoke a need to reconsider values, and human beings need to modify values in reaction to changes in the socio-economic system. Moving away from rigidity is challenging, which means humans need to shift away from values they have long held or believed in. Unless humans are continually exposed to new views and constantly innovate, shifting values or seeing things from a different perspective is impossible. When human values change, there is considerable variance in the response between groups as the perceived problem magnitude increases. Typically, if a problem is not severe, the vast majority of people are reactive. However, if the severity of the problem has exceeded a critical point, the public will respond to the problem with a proactive attitude [120]. Another key issue is how to recognize this critical point. In the long run, successful landscape planning can assist in maintaining numerous ecosystem services, enhance the synergy of ecosystem services, and maximize human well-being. However, attaining this is not easy, as the decision-making process is riddled with a wide range of values and worldviews, even contradictory ones. Stakeholder value differences must be adequately considered to guarantee that all genuine opinions are acknowledged in the decision-making process [92]. Moreover, humans regularly experience the social dilemma in which individual and community interests conflict [121]. When each group member chooses to prioritize short-term positive rewards, there is a propensity to overexploit resources. However, the interests of the group members, including oneself, will eventually be compromised. There is a need to improve the total level of human cognition to a high degree, to enhance the perception of similarity among stakeholder groups, to convert values, prevent slipping into the rigidity trap, and to encourage the transformation of societal values.
4.3. Methodological Limitations and Challenges for Future Research
Ecosystem services and social goods and benefits are implicitly included in Maslow’s hierarchy of needs. A portion of the findings has proven that people’s demands for different ecosystem services are comparable to Maslow’s theory, implicitly proving the validity of the hierarchy of needs theory [108,121]. Some scholars have used this theory to assess how a community hierarchy of needs influences the degree of the implementation of different models of policing [122] and the exploration of housing attribute choices [123], demonstrating the potential of the theory’s application in urban planning. Based on the hierarchy of needs theory and the knowledge of ecology, geography, management, and sociology, this study demarcated urban ecological management zoning from the perspective of ecosystem service supply and demand at the village scale and discussed the “human–earth relationship” and its management practices from the perspective of social–ecological systems, providing a new idea for managing ecosystem services to improve human well-being and promote regional sustainable development.
However, due to the lack of data availability and expertise, the types of ecosystem services included in the study do not adequately reflect the capability of regional ecosystems to deliver goods and services. Moreover, the types of ecosystem services required by stakeholders differ among places, and further investigation of stakeholder characteristics is lacking. This study also does not focus on the impact of specific values on ecosystem services. It lacks indicators such as physiological and psychological sensations, resulting in less comprehensive and detailed results.
Most existing plans are regional, static, and short-term landscape plans. Ecosystem services have a distinct scale effect and can play diverse roles at different scales. Policy implementation, however, is within administrative districts and represents the scale of action for decision-makers. Existing ecosystem service indicators may not fully meet the needs of decision-makers, resulting in a scale mismatch between ecosystem services and spatial planning. Moreover, ecosystem services have evident temporal dynamics. It is difficult to determine whether a certain ecosystem service regarded as vital by the public today will remain important. Changes in ecosystem structure and processes, as well as population dynamics, technological advancements, and new knowledge insights, all impact the ecosystem service supply and demand. In future study, it will be necessary to change societal values from the root causes of over-regulation and rigidity, breakthrough administrative boundaries, integrate spatial and temporal processes, and implement whole-area, dynamic, and long-term landscape planning to achieve more sustainable land use.
5. Conclusions
The results showed that the hills in the west and the plains in the south gave most of the ecological products and services to Zhengzhou, and the total ecosystem service demand had a distinct circle structure. The natural background, environmental condition, and population distribution of each region were the direct variables affecting the matching pattern of ecosystem service supply and demand. Carbon sequestration, grain production, water yield, and habitat maintenance were ecological deficits in the urban core, and soil maintenance in most places showed a surplus pattern. Zhengzhou was demarcated into five groups of ecological management zoning. The impact of varied preferences on the ecosystem service supply and demand. The Maslow scenario of ecosystem service supply and demand seemed more aligned with reality. A more prosperous was accompanied by an increase in the demand for higher-level ecosystem services.
Supplementary Materials
The following supporting information can be downloaded at: https://www.mdpi.com/article/10.3390/land12091661/s1, Table S1. Maximum distance and weight of the threats affecting habitat quality (Habitat Maintenance). Table S2. The sensitivity of habitat types to each threat factor (Habitat Maintenance). Table S3. Carbon pool table (Carbon Sequestration). Table S4. Biophysical Table (Water Yield).
Author Contributions
Conceptualization, T.Z. and L.H.; methodology, Y.C.; software, M.C.; validation, T.Z., L.H., P.Z. and Y.C.; formal analysis, Y.L.; investigation, T.Z.; resources, W.C.; data curation, G.D.; writing—original draft preparation, T.Z.; writing—review and editing T.Z., C.Z. and M.C.; visualization, E.C.; supervision, T.Z.; project administration, J.W.; funding acquisition, T.Z., L.L. and C.L. All authors have read and agreed to the published version of the manuscript.
Funding
This work was funded by the National Natural Science Foundation of China (Grant Nos. 42101298, 42077004), Key R&D and Promotion Special Project (Science and Technology) of Henan Province, China (Grant No. 232102320195), the special fund for young talents of Henan Agricultural University (Grant No. 30500956), and Henan Agricultural University Science and Technology Innovation Fund (Grant No. KJCX2016A17).
Data Availability Statement
Not applicable.
Conflicts of Interest
The authors declare no conflict of interest.
References
- Paudyal, K.; Baral, H.; Keenan, R.J. Local actions for the common good: Can the application of the ecosystem services concept generate improved societal outcomes from natural resource management? Land Use Pol. 2016, 56, 327–332. [Google Scholar] [CrossRef]
- Brilha, J.; Gray, M.; Pereira, D.I.; Pereira, P. Geodiversity: An integrative review as a contribution to the sustainable management of the whole of nature. Environ. Sci. Policy 2018, 86, 19–28. [Google Scholar] [CrossRef]
- Millennium Ecosystem Assessment. In Ecosystems and Human Well-Being: Synthesis; Island Press: Washington, DC, USA, 2008.
- Bongaarts, J. IPBES, 2019. Summary for policymakers of the global assessment report on biodiversity and ecosystem services of the Intergovernmental Science-Policy Platform on Biodiversity and Ecosystem Services. Popul. Dev. Rev. 2019, 45, 680–681. [Google Scholar] [CrossRef]
- Wang, H.; Gao, Y.; Wang, Z.; Sha, W.; Wu, J. Urban ecological management division based on ecosystem services: A case study of Shenzhen City. Acta Ecol. Sin. 2020, 40, 8504–8515. [Google Scholar]
- Han, Z.; Liu, C.; Yan, X.; Li, X.; Wang, X. Coupling coordination and matches in ecosystem services supply-demand for ecological zoning management: A case study of Dalian. Acta Ecol. Sin. 2021, 41, 9064–9075. [Google Scholar] [CrossRef]
- Wu, X.; Zhang, J.; Geng, X.; Wang, T.; Wang, K.; Liu, S. Increasing green infrastructure-based ecological resilience in urban systems: A perspective from locating ecological and disturbance sources in a resource-based city. Sustain. Cities Soc. 2020, 61, 102354. [Google Scholar] [CrossRef]
- Rong, Y.; Yan, Y.; Zhao, C.; Zhu, J.; Zheng, T.; Wang, C.; Lu, H.; Zhang, W. Multi-scale characteristics of landsenses ecology and its application based on supply and demand of ecosystem services. Acta Ecol. Sin. 2020, 40, 8034–8043. [Google Scholar]
- Liang, X.; Jin, X.; He, J.; Wang, X.; Xu, C.; Qiao, G.; Zhang, X.; Zhou, Y. Impacts of land management practice strategy on regional ecosystems: Enlightenment from ecological redline adjustment in Jiangsu, China. Land Use Pol. 2022, 119, 106137. [Google Scholar] [CrossRef]
- Wang, S.; Hu, M.; Wang, Y.; Xia, B. Dynamics of ecosystem services in response to urbanization across temporal and spatial scales in a mega metropolitan area. Sustain. Cities Soc. 2022, 77, 103561. [Google Scholar] [CrossRef]
- Bailey, R.G. Ecoregions of the United States; U.S. Forest Service, Intermountain Region: Ogden, UT, USA, 1976; (Map only; scale 1:7,500,000.). [Google Scholar]
- Sun, R.; Jin, X.; Han, B.; Liang, X.; Zhang, X.; Zhou, Y. Does scale matter? Analysis and measurement of ecosystem service supply and demand status based on ecological unit. Environ. Impact Assess. Rev. 2022, 95, 106785. [Google Scholar] [CrossRef]
- Prentice, I.C.; Cramer, W.; Harrison, S.P.; Leemans, R.; Monserud, R.A.; Solomon, A.M. Special paper: A global biome model based on plant physiology and dominance, soil properties and climate. J. Biogeogr. 1992, 19, 117–134. [Google Scholar] [CrossRef]
- Olson, D.M.; Dinerstein, E.; Wikramanayake, E.D.; Burgess, N.D.; Powell, G.V.; Underwood, E.C.; D’Amico, J.A.; Itoua, I.; Strand, H.E.; Morrison, J.C. Terrestrial Ecoregions of the World: A New Map of Life on Earth: A new global map of terrestrial ecoregions provides an innovative tool for conserving biodiversity. Bioscience 2001, 51, 933–938. [Google Scholar] [CrossRef]
- Spalding, M.D.; Fox, H.E.; Allen, G.R.; Davidson, N.; Ferdaña, Z.A.; Finlayson, M.; Halpern, B.S.; Jorge, M.A.; Lombana, A.L.; Lourie, S.A. Marine ecoregions of the world: A bioregionalization of coastal and shelf areas. Bioscience 2007, 57, 573–583. [Google Scholar] [CrossRef]
- Abell, R.; Thieme, M.L.; Revenga, C.; Bryer, M.; Kottelat, M.; Bogutskaya, N.; Coad, B.; Mandrak, N.; Balderas, S.C.; Bussing, W. Freshwater ecoregions of the world: A new map of biogeographic units for freshwater biodiversity conservation. Bioscience 2008, 58, 403–414. [Google Scholar] [CrossRef]
- Wilson, K.A.; Mcbride, M.F.; Bode, M.; Possingham, H.P. Prioritizing global conservation efforts. Nature 2006, 440, 337–340. [Google Scholar] [CrossRef]
- Maron, M.; Mitchell, M.G.; Runting, R.K.; Rhodes, J.R.; Mace, G.M.; Keith, D.A.; Watson, J.E. Towards a threat assessment framework for ecosystem services. Trends Ecol. Evol. 2017, 32, 240–248. [Google Scholar] [CrossRef]
- Naidoo, R.; Balmford, A.; Costanza, R.; Fisher, B.; Green, R.E.; Lehner, B.; Malcolm, T.R.; Ricketts, T.H. Global mapping of ecosystem services and conservation priorities. Proc. Natl. Acad. Sci. USA 2008, 105, 9495–9500. [Google Scholar] [CrossRef]
- Liu, Y.X.; Fu, B.J.; Wang, S.; Zhao, W.W. From biogeography to ecological function: Progress and prospect of global ecological regionalization research. Acta Ecol. Sin. 2017, 37, 7761–7768. [Google Scholar] [CrossRef][Green Version]
- Pham, K.T.; Lin, T. Effects of urbanisation on ecosystem service values: A case study of Nha Trang, Vietnam. Land Use Policy 2023, 128, 106599. [Google Scholar] [CrossRef]
- Zhou, S.; Li, W.; Lu, Z.; Yue, R. An analysis of multiple ecosystem services in a large-scale urbanized area of northern China based on the food-energy-water integrative framework. Environ. Impact Assess. Rev. 2023, 98, 106913. [Google Scholar] [CrossRef]
- Rozas-Vasquez, D.; Fuerst, C.; Geneletti, D. Integrating ecosystem services in spatial planning and strategic environmental assessment: The role of the cascade model. Environ. Impact Assess. Rev. 2019, 78, 106291. [Google Scholar] [CrossRef]
- Huang, C.; Zhao, D.; Deng, L. Landscape pattern simulation for ecosystem service value regulation of Three Gorges Reservoir Area, China. Environ. Impact Assess. Rev. 2022, 95, 106798. [Google Scholar] [CrossRef]
- Gutierrez, M.; Bekessy, S.A.; Gordon, A. Biodiversity and ecosystem services in strategic environmental assessment: An evaluation of six Australian cases. Environ. Impact Assess. Rev. 2021, 87, 106552. [Google Scholar] [CrossRef]
- Li, H.; Peng, J.; Hu, Y.; Wu, W. Ecological function zoning in Inner Mongolia Autonomous Region based on ecosystem service bundles. Chin. J. Appl. Ecol. 2017, 28, 2657–2666. [Google Scholar] [CrossRef]
- Liu, X.; Zongxue, X.U.; Zhang, S. Scale analysis of environmental factors and their relationship with the size of hierarchical aquatic ecoregion: A case study in the Liao River basin. Acta Ecol. Sin. 2012, 32, 3613–3620. [Google Scholar] [CrossRef]
- Fan, H.; Huang, Y.; Cao, X.F.; Gao, Z.; Jiang, D.L. Level III Aquatic Ecological Function Regionalization in Dianchi Lake Basin Based on the Aquatic Ecosystem Structure. Acta Sci. Circumstantiae 2016, 36, 1447–1456. [Google Scholar] [CrossRef]
- Zhang, M.; Bao, Y.; Xu, J.; Han, A.; Liu, X.; Zhang, J.; Tong, Z. Ecological security evaluation and ecological regulation approach of East-Liao River basin based on ecological function area. Ecol. Indic. 2021, 132, 108255. [Google Scholar] [CrossRef]
- Zhao, X.; Huang, G. Urban watershed ecosystem health assessment and ecological management zoning based on landscape pattern and SWMM simulation: A case study of Yangmei River Basin. Environ. Impact Assess. Rev. 2022, 95, 106794. [Google Scholar] [CrossRef]
- Peng, J.; Wang, A.; Luo, L.; Liu, Y.; Li, H.; Hu, Y.; Meersmans, J.; Wu, J. Spatial identification of conservation priority areas for urban ecological land: An approach based on water ecosystem services. Land Degrad. Dev. 2019, 30, 683–694. [Google Scholar] [CrossRef]
- Zhu, J.; Zhou, Y.; Wang, S.; Wang, L.; Liu, W.; Li, H.; Mei, J. Ecological function evaluation and regionalization in Baiyangdian Wetland. Acta Ecol. Sin. 2020, 40, 459–472. [Google Scholar] [CrossRef]
- Pukkala, T. Effect of species composition on ecosystem services in European boreal forest. J. For. Res. 2018, 29, 261–272. [Google Scholar] [CrossRef]
- Xie, L.X.; Bai, Y.P.; Che, L.; Qiao, F.W.; Sun, S.S.; Yang, X.D. Construction of ecological zone based on value-risk ecological function area in the Upper Yellow River. J. Nat. Resour. 2021, 36, 196–207. [Google Scholar] [CrossRef]
- Zhang, C.S.; Xie, G.D.; Cao, S.Y.; Leng, Y.; Yu, X. The distribution patterns of China’s county ecological function. Resour. Sci 2012, 34, 1636–1646. [Google Scholar]
- Chen, D.; Jin, G.; Zhang, Q.; Arowolo, A.O.; Li, Y. Water ecological function zoning in Heihe River basin, Northwest China. Phys. Chem. Earth Parts A/B/C 2016, 96, 74–83. [Google Scholar] [CrossRef]
- Fu, X.; Liu, G.; Liu, Y.; Xue, Z.; Chen, Z.; Jiang, S.; Chen, H.; Yu, H.; Wang, C. Evaluation of the implementation of marine functional zoning in China based on the PSR-AHP model. Ocean Coastal Manag. 2021, 203, 105496. [Google Scholar] [CrossRef]
- Pivovarova, I.I.; Makhovikov, A.B. Ecological regionalization methods of oil producing areas. J. Ecol. Eng. 2017, 18, 35–42. [Google Scholar] [CrossRef]
- Guan, Q.; Hao, J.; Xu, Y.; Ren, G.; Kang, L. Zoning of agroecological management based on the relationship between supply and demand of ecosystem services. Resour. Sci. 2019, 41, 1359–1373. [Google Scholar] [CrossRef]
- Sun, R.H.; Li, Z.; Chen, L.D. Review of ecological regionalization and classification in China: Ecological patterns, functions, and ecosystem services. Acta Ecol. Sin. 2018, 38, 5271–5278. [Google Scholar] [CrossRef][Green Version]
- Fisher, B.; Turner, R.K.; Morling, P. Defining and classifying ecosystem services for decision making. Ecol. Econ. 2009, 68, 643–653. [Google Scholar] [CrossRef]
- De Groot, R.S.; Alkemade, R.; Braat, L.; Hein, L.; Willemen, L. Challenges in integrating the concept of ecosystem services and values in landscape planning, management and decision making. Ecol. Complex. 2010, 7, 260–272. [Google Scholar] [CrossRef]
- Burkhard, B.; Kroll, F.; Nedkov, S.; Müller, F. Mapping ecosystem service supply, demand and budgets. Ecol. Indic. 2012, 21, 17–29. [Google Scholar] [CrossRef]
- Jafarzadeh, A.A.; Mahdavi, A.; Shamsi, S.R.F.; Yousefpour, R. Assessing synergies and trade-offs between ecosystem services in forest landscape management. Land Use Policy 2021, 111, 105741. [Google Scholar] [CrossRef]
- Zhai, T.; Zhang, D.; Zhao, C. How to optimize ecological compensation to alleviate environmental injustice in different cities in the Yellow River Basin? A case of integrating ecosystem service supply, demand and flow. Sustain. Cities Soc. 2021, 75, 103341. [Google Scholar] [CrossRef]
- Xu, Z.; Peng, J.; Dong, J.; Liu, Y.; Liu, Q.; Lyu, D.; Qiao, R.; Zhang, Z. Spatial correlation between the changes of ecosystem service supply and demand: An ecological zoning approach. Landsc. Urban Plan. 2022, 217, 104258. [Google Scholar] [CrossRef]
- Ma, L.; Liu, H.; Peng, J.; Wu, J. A review of ecosystem services supply and demand. Acta Geogr. Sin. 2017, 72, 1277–1289. [Google Scholar] [CrossRef]
- Schulp, C.; Lautenbach, S.; Verburg, P.H. Quantifying and mapping ecosystem services: Demand and supply of pollination in the European Union. Ecol. Indic. 2014, 36, 131–141. [Google Scholar] [CrossRef]
- Wang, J.; Zhai, T.; Lin, Y.; Kong, X.; He, T. Spatial imbalance and changes in supply and demand of ecosystem services in China. Sci. Total Environ. 2019, 657, 781–791. [Google Scholar] [CrossRef]
- Guo, Y.; Fu, B.; Wang, Y.; Xu, P.; Liu, Q. Identifying spatial mismatches between the supply and demand of recreation services for sustainable urban river management: A case study of Jinjiang River in Chengdu, China. Sustain. Cities Soc. 2022, 77, 103547. [Google Scholar] [CrossRef]
- Shi, Y.; Shi, D.; Zhou, L.; Fang, R. Identification of ecosystem services supply and demand areas and simulation of ecosystem service flows in Shanghai. Ecol. Indic. 2020, 115, 106418. [Google Scholar] [CrossRef]
- Chen, Y.; Zhai, Y.; Gao, J. Spatial patterns in ecosystem services supply and demand in the Jing-Jin-Ji region, China. J. Clean. Prod. 2022, 361, 132177. [Google Scholar] [CrossRef]
- Wu, X.; Liu, S.; Zhao, S.; Hou, X.; Xu, J.; Dong, S.; Liu, G. Quantification and driving force analysis of ecosystem services supply, demand and balance in China. Sci. Total Environ. 2019, 652, 1375–1386. [Google Scholar] [CrossRef] [PubMed]
- Nedkov, S.; Burkhard, B. Flood regulating ecosystem services—Mapping supply and demand, in the Etropole municipality, Bulgaria. Ecol. Indic. 2012, 21, 67–79. [Google Scholar] [CrossRef]
- Stürck, J.; Poortinga, A.; Verburg, P.H. Mapping ecosystem services: The supply and demand of flood regulation services in Europe. Ecol. Indic. 2014, 38, 198–211. [Google Scholar] [CrossRef]
- García-Nieto, A.P.; García-Llorente, M.; Iniesta-Arandia, I.; Martín-López, B. Mapping forest ecosystem services: From providing units to beneficiaries. Ecosyst. Serv. 2013, 4, 126–138. [Google Scholar] [CrossRef]
- Zoderer, B.M.; Tasser, E.; Carver, S.; Tappeiner, U. Stakeholder perspectives on ecosystem service supply and ecosystem service demand bundles. Ecosyst. Serv. 2019, 37, 100938. [Google Scholar] [CrossRef]
- Boithias, L.; Acuña, V.; Vergoñós, L.; Ziv, G.; Marcé, R.; Sabater, S. Assessment of the water supply: Demand ratios in a Mediterranean basin under different global change scenarios and mitigation alternatives. Sci. Total Environ. 2014, 470, 567–577. [Google Scholar] [CrossRef]
- Bagstad, K.J.; Villa, F.; Batker, D.; Harrison-Cox, J.; Voigt, B.; Johnson, G.W. From theoretical to actual ecosystem services: Mapping beneficiaries and spatial flows in ecosystem service assessments. Ecol. Soc. 2014, 19, 64. [Google Scholar] [CrossRef]
- Capriolo, A.; Boschetto, R.G.; Mascolo, R.A.; Balbi, S.; Villa, F. Biophysical and economic assessment of four ecosystem services for natural capital accounting in Italy. Ecosyst. Serv. 2020, 46, 101207. [Google Scholar] [CrossRef]
- Maslow, A.H. A theory of human motivation. Psychol. Rev. 1943, 50, 370–396. [Google Scholar] [CrossRef]
- Wilkerson, M.L.; Mitchell, M.G.; Shanahan, D.; Wilson, K.A.; Ives, C.D.; Lovelock, C.E.; Rhodes, J.R. The role of socio-economic factors in planning and managing urban ecosystem services. Ecosyst. Serv. 2018, 31, 102–110. [Google Scholar] [CrossRef]
- Yang, J.; Dong, J.; Xiao, X.; Dai, J.; Wu, C.; Xia, J.; Zhao, G.; Zhao, M.; Li, Z.; Zhang, Y. Divergent shifts in peak photosynthesis timing of temperate and alpine grasslands in China. Remote Sens. Environ. 2019, 233, 111395. [Google Scholar] [CrossRef]
- Peng, S.; Ding, Y.; Liu, W.; Li, Z. 1 km monthly temperature and precipitation dataset for China from 1901 to 2017. Earth Syst. Sci. Data 2019, 11, 1931–1946. [Google Scholar] [CrossRef]
- Wang, Z.; Zhang, L.; Li, X.; Li, Y.; Fu, B. Integrating ecosystem service supply and demand into ecological risk assessment: A comprehensive framework and case study. Landsc. Ecol. 2021, 36, 2977–2995. [Google Scholar] [CrossRef]
- Moran, D.; Kanemoto, K. Identifying species threat hotspots from global supply chains. Nat. Ecol. Evol. 2017, 1, 23. [Google Scholar] [CrossRef] [PubMed]
- Summers, J.K.; Smith, L.M.; Case, J.L.; Linthurst, R.A. A review of the elements of human well-being with an emphasis on the contribution of ecosystem services. Ambio 2012, 41, 327–340. [Google Scholar] [CrossRef]
- Elliott, M.; Higgins, T.G.O. From DPSIR the DAPSI (W) R (M) Emerges… a Butterfly–‘protecting the natural stuff and delivering the human stuff’. In Ecosystem-Based Management, Ecosystem Services and Aquatic Biodiversity: Theory, Tools and Applications; Springer: Berlin/Heidelberg, Germany, 2020; pp. 61–86. [Google Scholar] [CrossRef]
- Cubbage, F.; Harou, P.; Sills, E. Policy instruments to enhance multi-functional forest management. For. Policy Econ. 2007, 9, 833–851. [Google Scholar] [CrossRef]
- Lu, H.; Yan, Y.; Zhao, C.; Wu, G. Framework of constructing multi-scale ecological security pattern in Xiongan New Area. Acta Ecol. Sin. 2020, 40, 7105–7112. [Google Scholar]
- Luisetti, T.; Turner, R.K.; Jickells, T.; Andrews, J.; Elliott, M.; Schaafsma, M.; Beaumont, N.; Malcolm, S.; Burdon, D.; Adams, C. Coastal Zone Ecosystem Services: From science to values and decision making; a case study. Sci. Total Environ. 2014, 493, 682–693. [Google Scholar] [CrossRef]
- Liu, J.; Deng, Y.; Wang, Y.; Huang, H.; Du, Q.; Ren, F. Urban nighttime leisure space mapping with nighttime light images and POI data. Remote Sens. 2020, 12, 541. [Google Scholar] [CrossRef]
- Maslow, A.H. Motivation and Personality, 2nd ed.; Harper and Row: New York, NY, USA, 1970. [Google Scholar]
- Maslow, A.H. Religions, Values, and Peak Experiences; Penguin: New York, NY, USA, 1970. [Google Scholar]
- The New Urban Agenda. Available online: https://habitat3.org/the-new-urban-agenda/ (accessed on 6 October 2022).
- 2030 Agenda for Sustainable Development. Available online: https://sdgs.un.org/2030agenda (accessed on 5 August 2022).
- Jiang, C.; Li, D.; Wang, D.; Zhang, L. Quantification and assessment of changes in ecosystem service in the Three-River Headwaters Region, China as a result of climate variability and land cover change. Ecol. Indic. 2016, 66, 199–211. [Google Scholar] [CrossRef]
- Gomes, E.; Inácio, M.; Bogdzevič, K.; Kalinauskas, M.; Karnauskaitė, D.; Pereira, P. Future scenarios impact on land use change and habitat quality in Lithuania. Environ. Res. 2021, 197, 111101. [Google Scholar] [CrossRef]
- Baró, F.; Haase, D.; Gómez-Baggethun, E.; Frantzeskaki, N. Mismatches between ecosystem services supply and demand in urban areas: A quantitative assessment in five European cities. Ecol. Indic. 2015, 55, 146–158. [Google Scholar] [CrossRef]
- Daniel, T.C.; Muhar, A.; Arnberger, A.; Aznar, O.; Boyd, J.W.; Chan, K.M.; Costanza, R.; Elmqvist, T.; Flint, C.G.; Gobster, P.H. Contributions of cultural services to the ecosystem services agenda. Proc. Natl. Acad. Sci. USA 2012, 109, 8812–8819. [Google Scholar] [CrossRef] [PubMed]
- Tengberg, A.; Fredholm, S.; Eliasson, I.; Knez, I.; Saltzman, K.; Wetterberg, O. Cultural ecosystem services provided by landscapes: Assessment of heritage values and identity. Ecosyst. Serv. 2012, 2, 14–26. [Google Scholar] [CrossRef]
- Liu, L.; Liu, C.; Wang, C.; Li, C. Supply and demand matching of ecosystem services in loess hilly region: A case study of Lanzhou. Acta Geogr. Sin. 2019, 74, 1921–1937. [Google Scholar] [CrossRef]
- Wischmeier, W.H.; Johnson, C.B.; Cross, B.V. A soil erodibility nomograph for farmland and construction sites. J. Soil Water Conserv. 1971, 26, 189–193. [Google Scholar]
- Han, X.; Tian, P.; Huang, J.; Wang, K.; Wang, J.; Liu, M.; Pan, C. Quantitative evaluation of soil erosion factors in Wuhan based on observation data of runoff plots during 2009–2018. Acta Ecol. Sin. 2021, 41, 3878–3890. [Google Scholar] [CrossRef]
- Cao, X.; Long, H.; Lei, Q.; Zhang, R. Assessment and Analysis of the Topsoil Erodibility K Values in Hebei Province. Soils 2015, 47, 1192–1198. [Google Scholar] [CrossRef]
- How Grouping Analysis Works. Available online: https://desktop.arcgis.com/en/arcmap/latest/tools/spatial-statistics-toolbox/how-grouping-analysis-works.htm (accessed on 5 December 2022).
- Tay, L.; Diener, E. Needs and subjective well-being around the world. J. Pers. Soc. Psychol. 2011, 101, 354. [Google Scholar] [CrossRef]
- Sidiropoulos, E. Education for sustainability in business education programs: A question of value. J. Clean. Prod. 2014, 85, 472–487. [Google Scholar] [CrossRef]
- Dinda, S. Environmental Kuznets curve hypothesis: A survey. Ecol. Econ. 2004, 49, 431–455. [Google Scholar] [CrossRef]
- Bengston, D.N.; Fan, D.P.; Celarier, D.N. A new approach to monitoring the social environment for natural resource management and policy: The case of US national forest benefits and values. J. Environ. Manag. 1999, 56, 181–193. [Google Scholar] [CrossRef]
- Butler, B.J.; Leatherberry, E.C. America’s family forest owners. J. For. 2004, 102, 4–14. [Google Scholar]
- Wang, S. Forest economics in an increasingly urbanized society: The next frontier. For. Policy Econ. 2013, 35, 45–49. [Google Scholar] [CrossRef]
- Cocks, M. Biocultural diversity: Moving beyond the realm of ‘indigenous’ and ‘local’people. Hum. Ecol. 2006, 34, 185–200. [Google Scholar] [CrossRef]
- Clarke, L.W.; Jenerette, G.D. Biodiversity and direct ecosystem service regulation in the community gardens of Los Angeles, CA. Landsc. Ecol. 2015, 30, 637–653. [Google Scholar] [CrossRef]
- Kang, Y.; Cheng, C.; Liu, X.; Zhang, F.; Li, Z.; Lu, S. An ecosystem services value assessment of land-use change in Chengdu: Based on a modification of scarcity factor. Phys. Chem. Earth Parts A/B/C 2019, 110, 157–167. [Google Scholar] [CrossRef]
- van Heezik, Y.; Freeman, C.; Porter, S.; Dickinson, K.J. Garden size, householder knowledge, and socio-economic status influence plant and bird diversity at the scale of individual gardens. Ecosystems 2013, 16, 1442–1454. [Google Scholar] [CrossRef]
- Rana, J.; Paul, J. Consumer behavior and purchase intention for organic food: A review and research agenda. J. Retail. Consum. Serv. 2017, 38, 157–165. [Google Scholar] [CrossRef]
- Asif, M.; Xuhui, W.; Nasiri, A.; Ayyub, S. Determinant factors influencing organic food purchase intention and the moderating role of awareness: A comparative analysis. Food. Qual. Prefer. 2018, 63, 144–150. [Google Scholar] [CrossRef]
- Antognelli, S.; Vizzari, M.; Schulp, C.J. Integrating ecosystem and urban services in policy-making at the local scale: The SOFA framework. Sustainability 2018, 10, 1017. [Google Scholar] [CrossRef]
- Diener, E.; Suh, E.M.; Lucas, R.E.; Smith, H.L. Subjective well-being: Three decades of progress. Psychol. Bull. 1999, 125, 276. [Google Scholar] [CrossRef]
- Vemuri, A.W.; Costanza, R. The role of human, social, built, and natural capital in explaining life satisfaction at the country level: Toward a National Well-Being Index (NWI). Ecol. Econ. 2006, 58, 119–133. [Google Scholar] [CrossRef]
- Costanza, R.; Fisher, B.; Ali, S.; Beer, C.; Bond, L.; Boumans, R.; Danigelis, N.L.; Dickinson, J.; Elliott, C.; Farley, J. Quality of life: An approach integrating opportunities, human needs, and subjective well-being. Ecol. Econ. 2007, 61, 267–276. [Google Scholar] [CrossRef]
- Schwartz, S.H.; Bilsky, W. Toward a universal psychological structure of human values. J. Pers. Soc. Psychol. 1987, 53, 550. [Google Scholar] [CrossRef]
- Schwartz, S.H. Universals in the content and structure of values: Theoretical advances and empirical tests in 20 countries. In Advances in Experimental Social Psychology; Elsevier: Amsterdam, The Netherlands, 1992; Volume 25, pp. 1–65. ISBN 0065-2601. [Google Scholar] [CrossRef]
- Schwartz, S.H.; Bardi, A. Value hierarchies across cultures: Taking a similarities perspective. J. Cross-Cult. Psychol. 2001, 32, 268–290. [Google Scholar] [CrossRef]
- Zurlini, G.; Petrosillo, I.; Bozsik, A.; Cloud, J.; Aretano, R.; Lincoln, N.K. Sustainable landscape development and value rigidity: The Pirsig‘s monkey trap. Landsc. Online 2015, 40, 1–19. [Google Scholar] [CrossRef]
- Ziter, C. The biodiversity–ecosystem service relationship in urban areas: A quantitative review. Oikos 2016, 125, 761–768. [Google Scholar] [CrossRef]
- Haida, C.; Rüdisser, J.; Tappeiner, U. Ecosystem services in mountain regions: Experts’ perceptions and research intensity. Reg. Environ. Chang. 2016, 16, 1989–2004. [Google Scholar] [CrossRef]
- Quintas-Soriano, C.; Brandt, J.S.; Running, K.; Baxter, C.V.; Gibson, D.M.; Narducci, J.; Castro, A.J. Social-ecological systems influence ecosystem service perception. Ecol. Soc. 2018, 23, 3. [Google Scholar] [CrossRef]
- Lapointe, M.; Cumming, G.S.; Gurney, G.G. Comparing ecosystem service preferences between urban and rural dwellers. Bioscience 2019, 69, 108–116. [Google Scholar] [CrossRef]
- Pan, H.; Page, J.; Zhang, L.; Cong, C.; Ferreira, C.; Jonsson, E.; Näsström, H.; Destouni, G.; Deal, B.; Kalantari, Z. Understanding interactions between urban development policies and GHG emissions: A case study in Stockholm Region. Ambio 2020, 49, 1313–1327. [Google Scholar] [CrossRef] [PubMed]
- Inglehart, R.; Welzel, C. Modernization, Cultural Change, and Democracy: The Human Development Sequence; Cambridge University Press: Cambridge, UK, 2005. [Google Scholar]
- Miller, T.R.; Wiek, A.; Sarewitz, D.; Robinson, J.; Olsson, L.; Kriebel, D.; Loorbach, D. The future of sustainability science: A solutions-oriented research agenda. Sustain. Sci. 2014, 9, 239–246. [Google Scholar] [CrossRef]
- Tindale, S.; Vicario-Modroño, V.; Gallardo-Cobos, R.; Hunter, E.; Miškolci, S.; Price, P.N.; Sánchez-Zamora, P.; Sonnevelt, M.; Ojo, M.; Mcinnes, K. Citizen perceptions and values associated with ecosystem services from European grassland landscapes. Land Use Policy 2023, 127, 106574. [Google Scholar] [CrossRef]
- Holling, C.S.; Gunderson, L.H. Panarchy: Understanding Transformations in Human and Natural Systems; Island Press: Washington, DC, USA, 2002. [Google Scholar]
- Turner, V.K. Obstacles to developing sustainable cities: The real estate rigidity trap. Ecol. Soc. 2017, 22, 1. [Google Scholar] [CrossRef]
- Zurlini, G.; Jones, K.B.; Riitters, K.H.; Li, B.; Petrosillo, I. Early warning signals of regime shifts from cross-scale connectivity of land-cover patterns. Ecol. Indic. 2014, 45, 549–560. [Google Scholar] [CrossRef]
- Carpenter, S.R.; Brock, W.A. Adaptive capacity and traps. Ecol. Soc. 2008, 13, 40. [Google Scholar] [CrossRef]
- Holling, C.S. Understanding the complexity of economic, ecological, and social systems. Ecosystems 2001, 4, 390–405. [Google Scholar] [CrossRef]
- Scheffer, M.; Westley, F.R. The evolutionary basis of rigidity: Locks in cells, minds, and society. Ecol. Soc. 2007, 12, 36. [Google Scholar] [CrossRef]
- Wang, Z.; Jusup, M.; Wang, R.; Shi, L.; Iwasa, Y.; Moreno, Y.; Kurths, J. Onymity promotes cooperation in social dilemma experiments. Sci. Adv. 2017, 3, e1601444. [Google Scholar] [CrossRef]
- De Guzman, M.C.; Kim, M. Community hierarchy of needs and policing models: Toward a new theory of police organizational behavior. Police Pract. Res. 2017, 18, 352–365. [Google Scholar] [CrossRef]
- Zavei, S.J.A.P.; Jusan, M.M. Exploring housing attributes selection based on Maslow’s hierarchy of needs. Procedia-Soc. Behav. Sci. 2012, 42, 311–319. [Google Scholar] [CrossRef]
Disclaimer/Publisher’s Note: The statements, opinions and data contained in all publications are solely those of the individual author(s) and contributor(s) and not of MDPI and/or the editor(s). MDPI and/or the editor(s) disclaim responsibility for any injury to people or property resulting from any ideas, methods, instructions or products referred to in the content. |
© 2023 by the authors. Licensee MDPI, Basel, Switzerland. This article is an open access article distributed under the terms and conditions of the Creative Commons Attribution (CC BY) license (https://creativecommons.org/licenses/by/4.0/).