
Carbon Storage in Cropland Soils: Insights from Iowa, United States


 , , , and
Abstract
1. Introduction
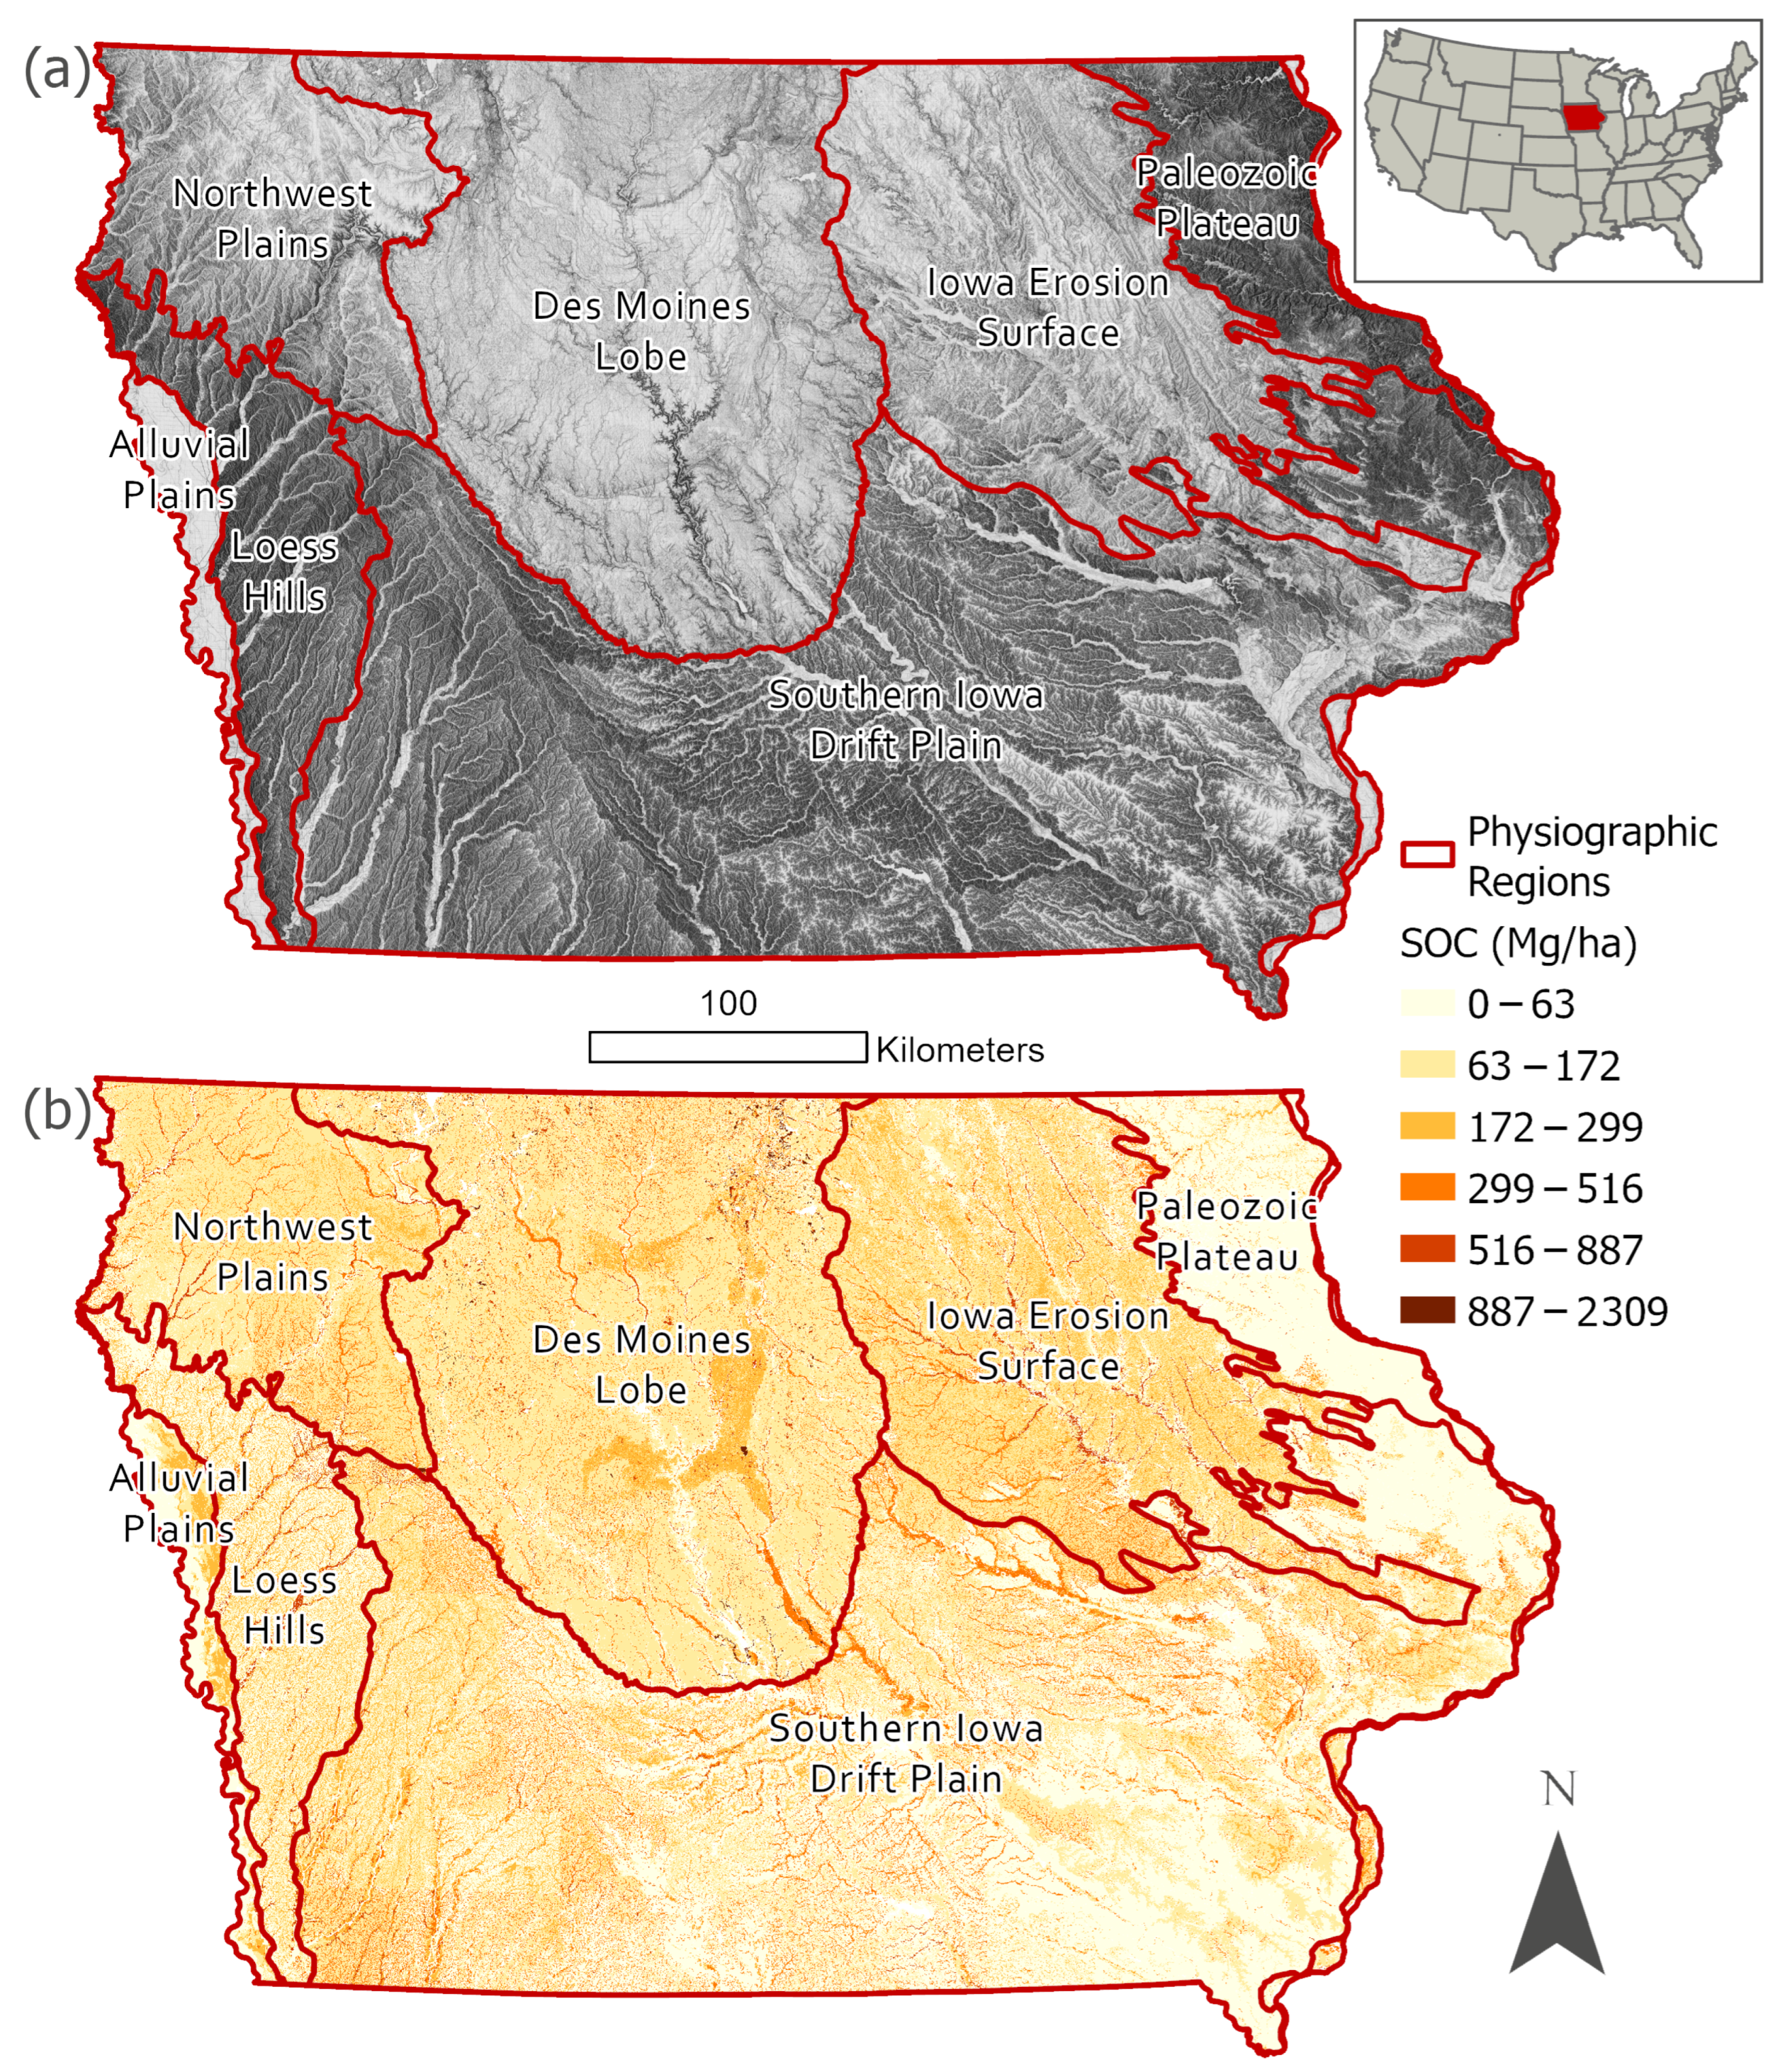
2. Iowa Soils and Agriculture
3. Agricultural Management Practices and Soil Organic Carbon: Long-Term Studies in Iowa
3.1. Reduced Tillage
3.2. Diversified Rotations
3.3. Converting Cropland to Perennial Vegetation
4. Implications for Soil Organic Carbon Measurement and Management
4.1. What to Measure and Why
4.1.1. Soil Depth
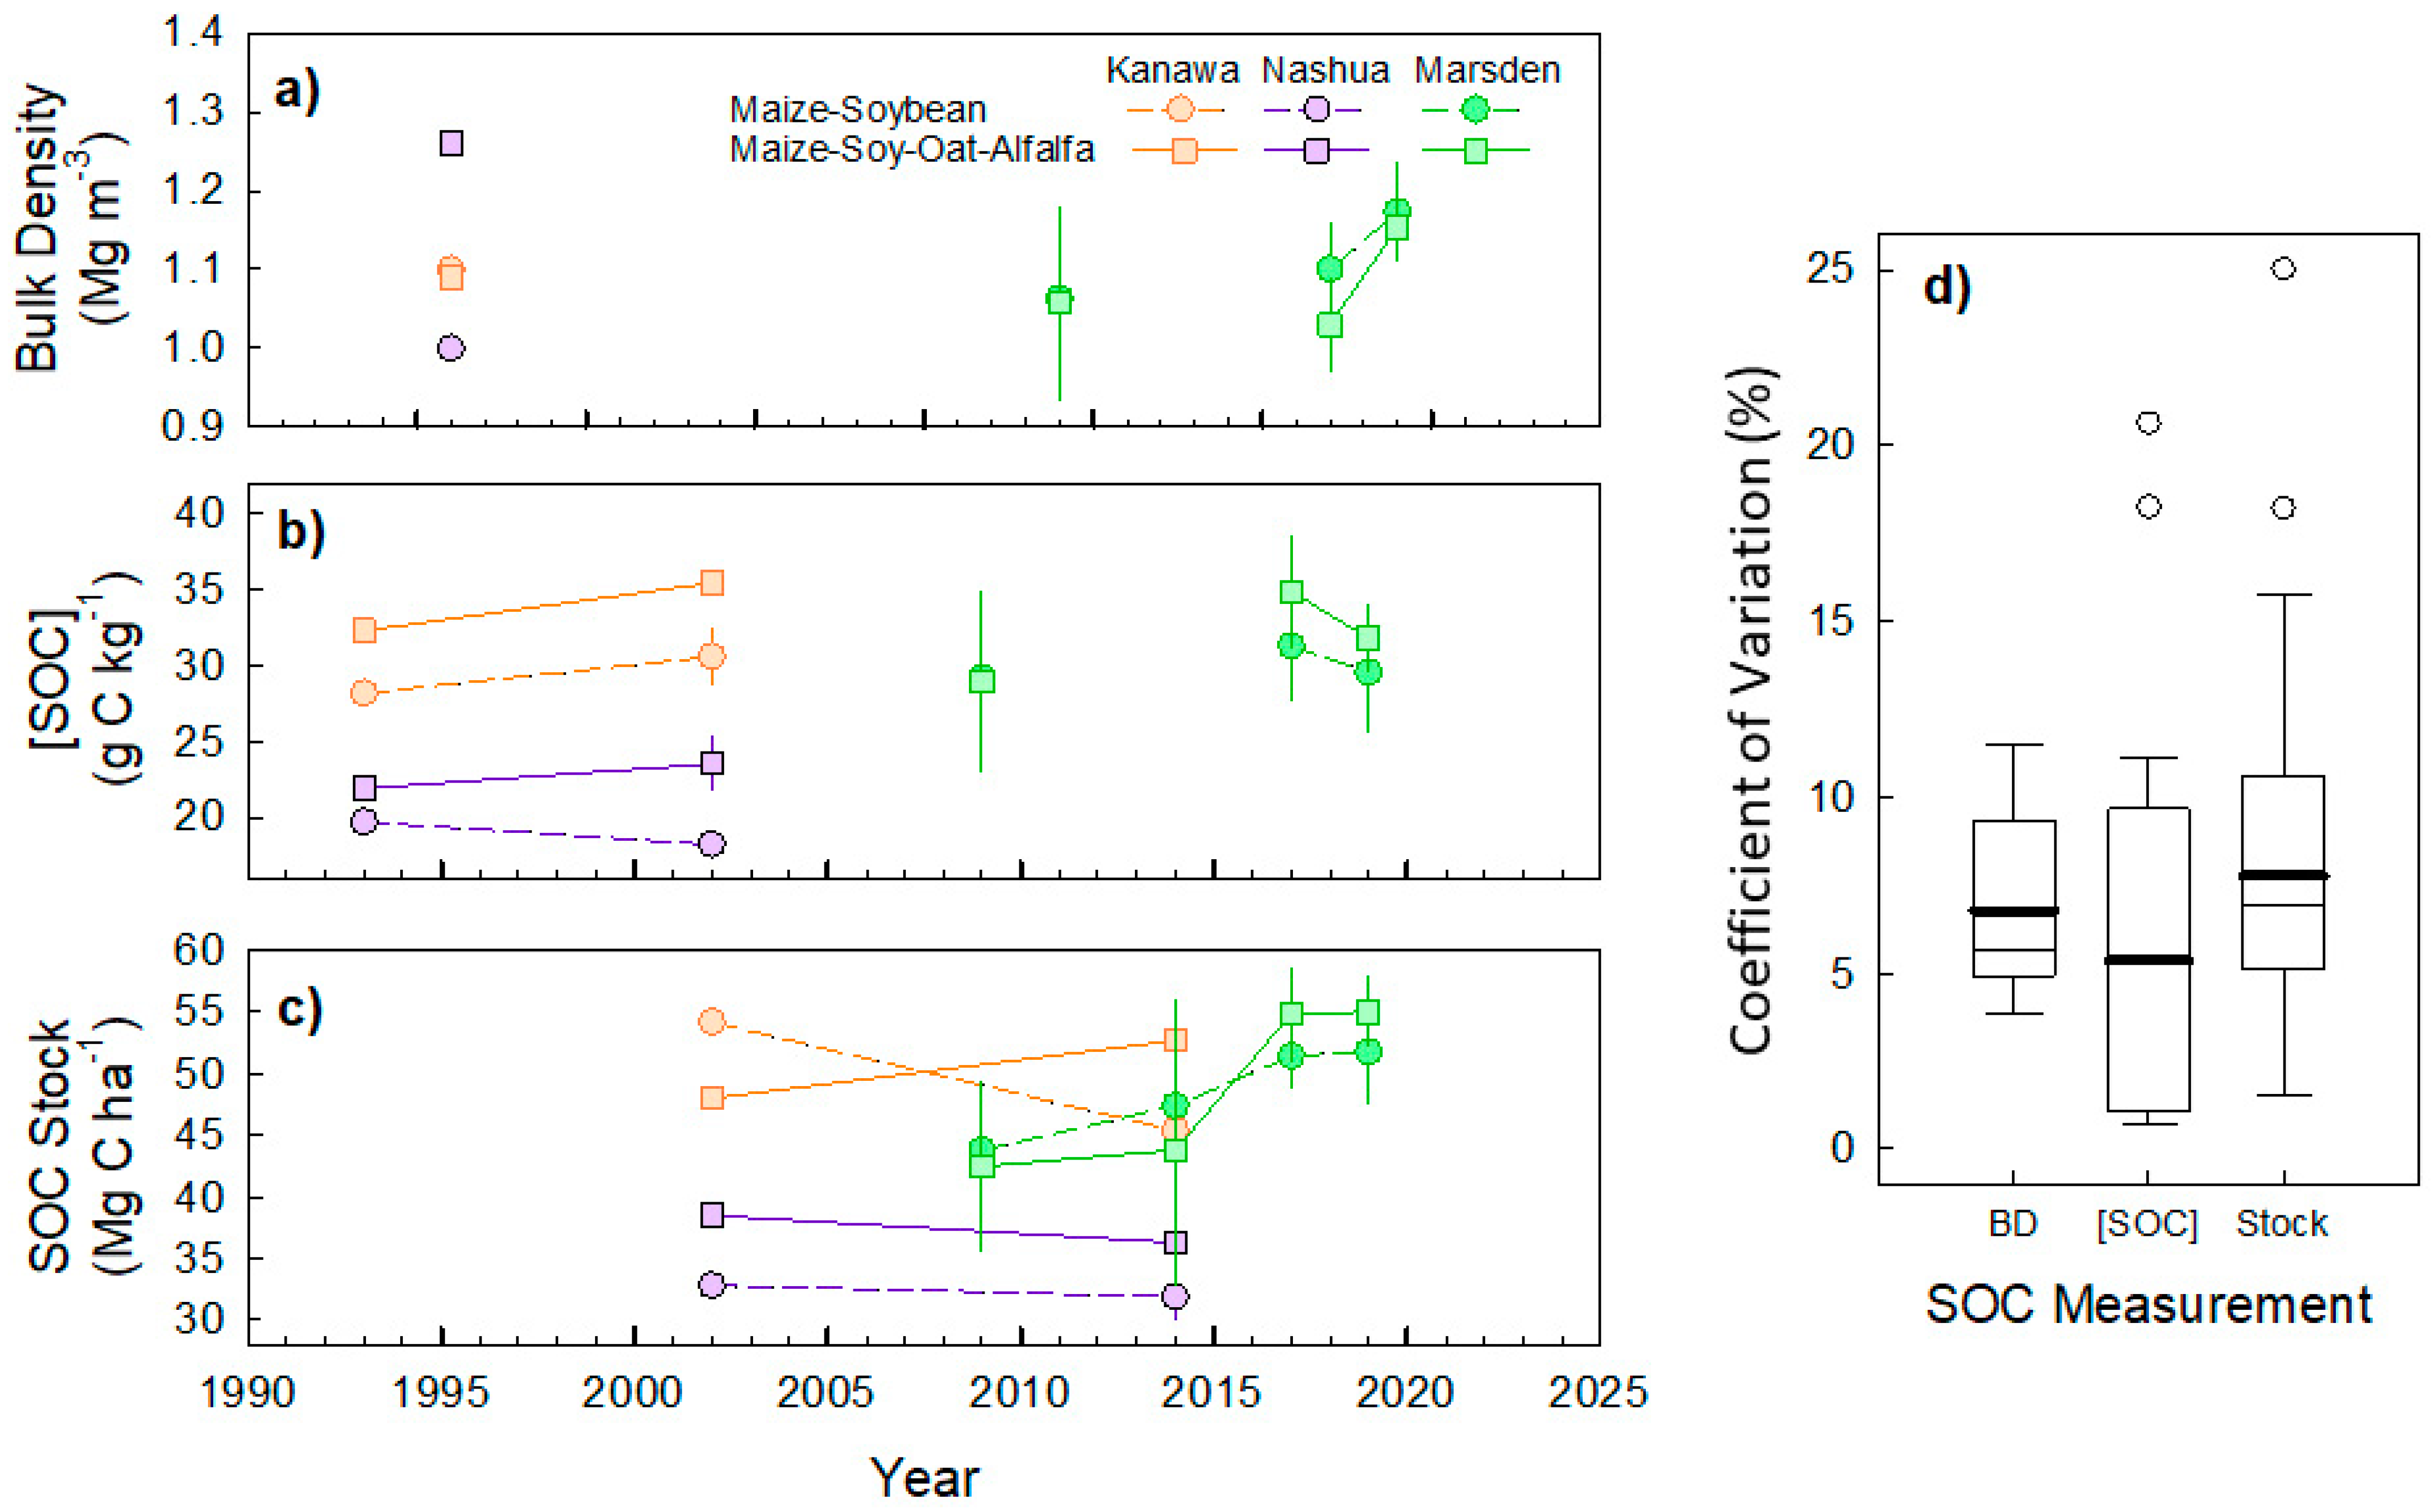
4.1.2. Bulk Density
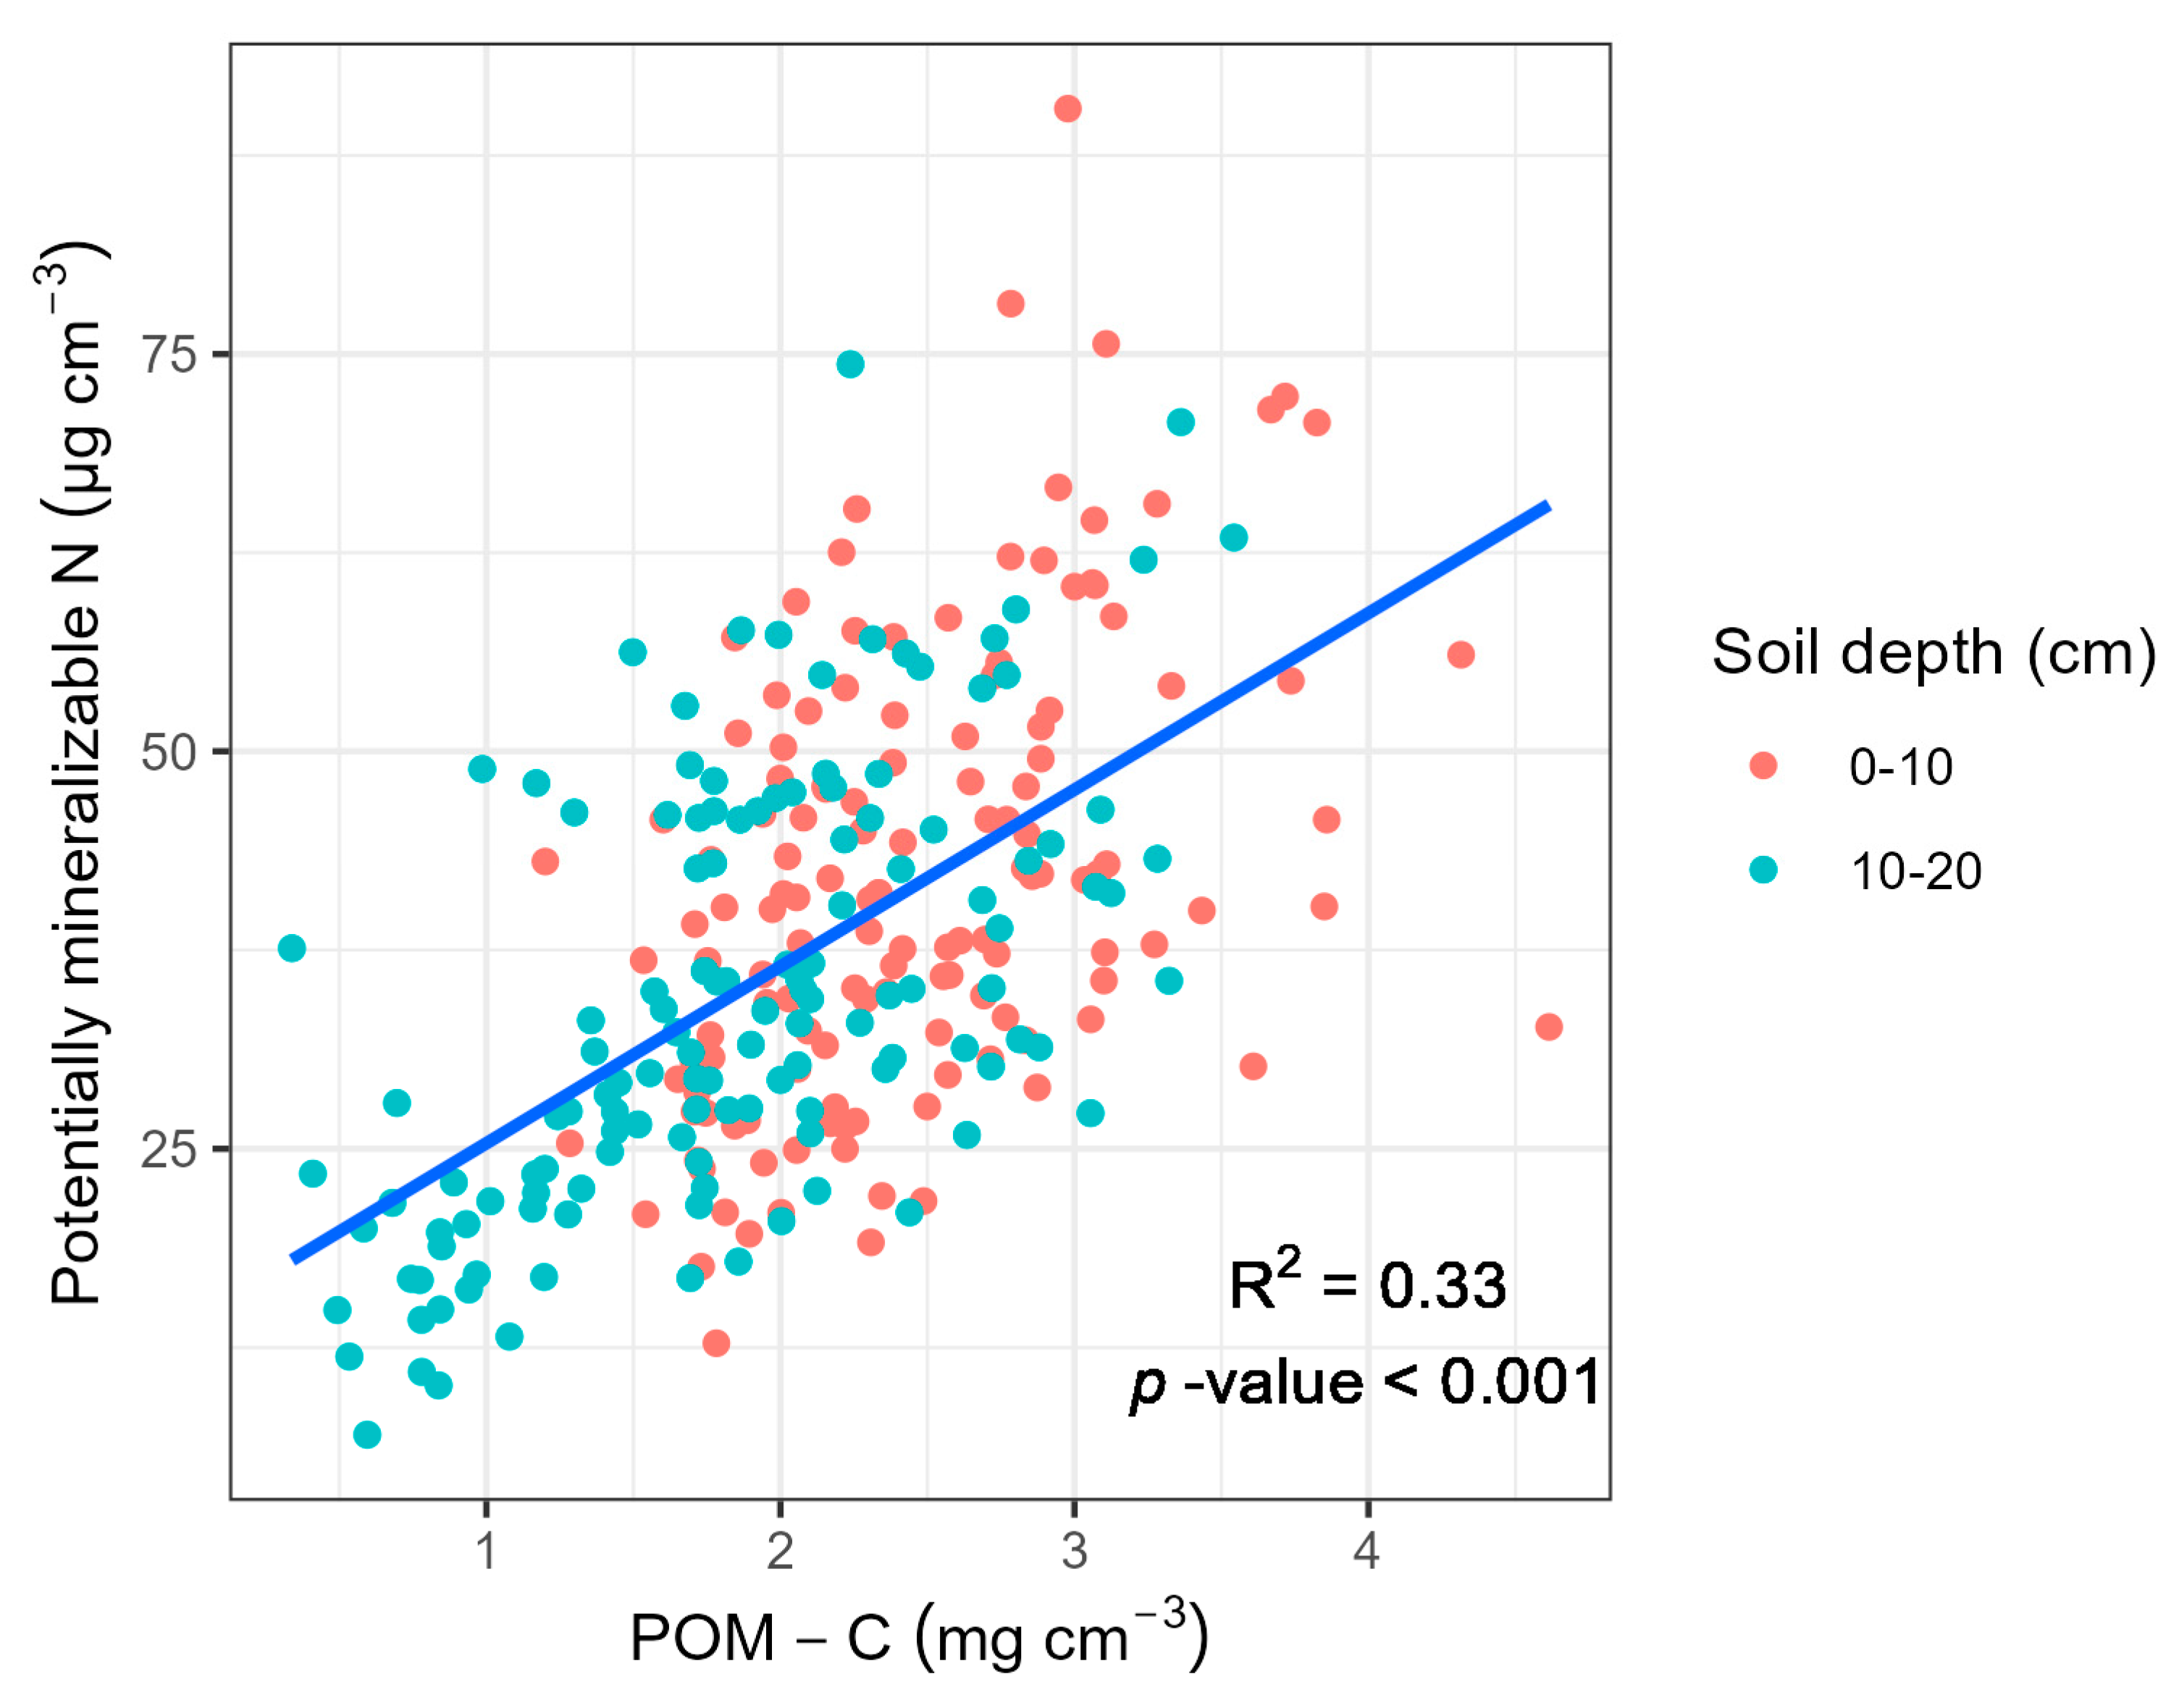
4.1.3. SOM Fractions
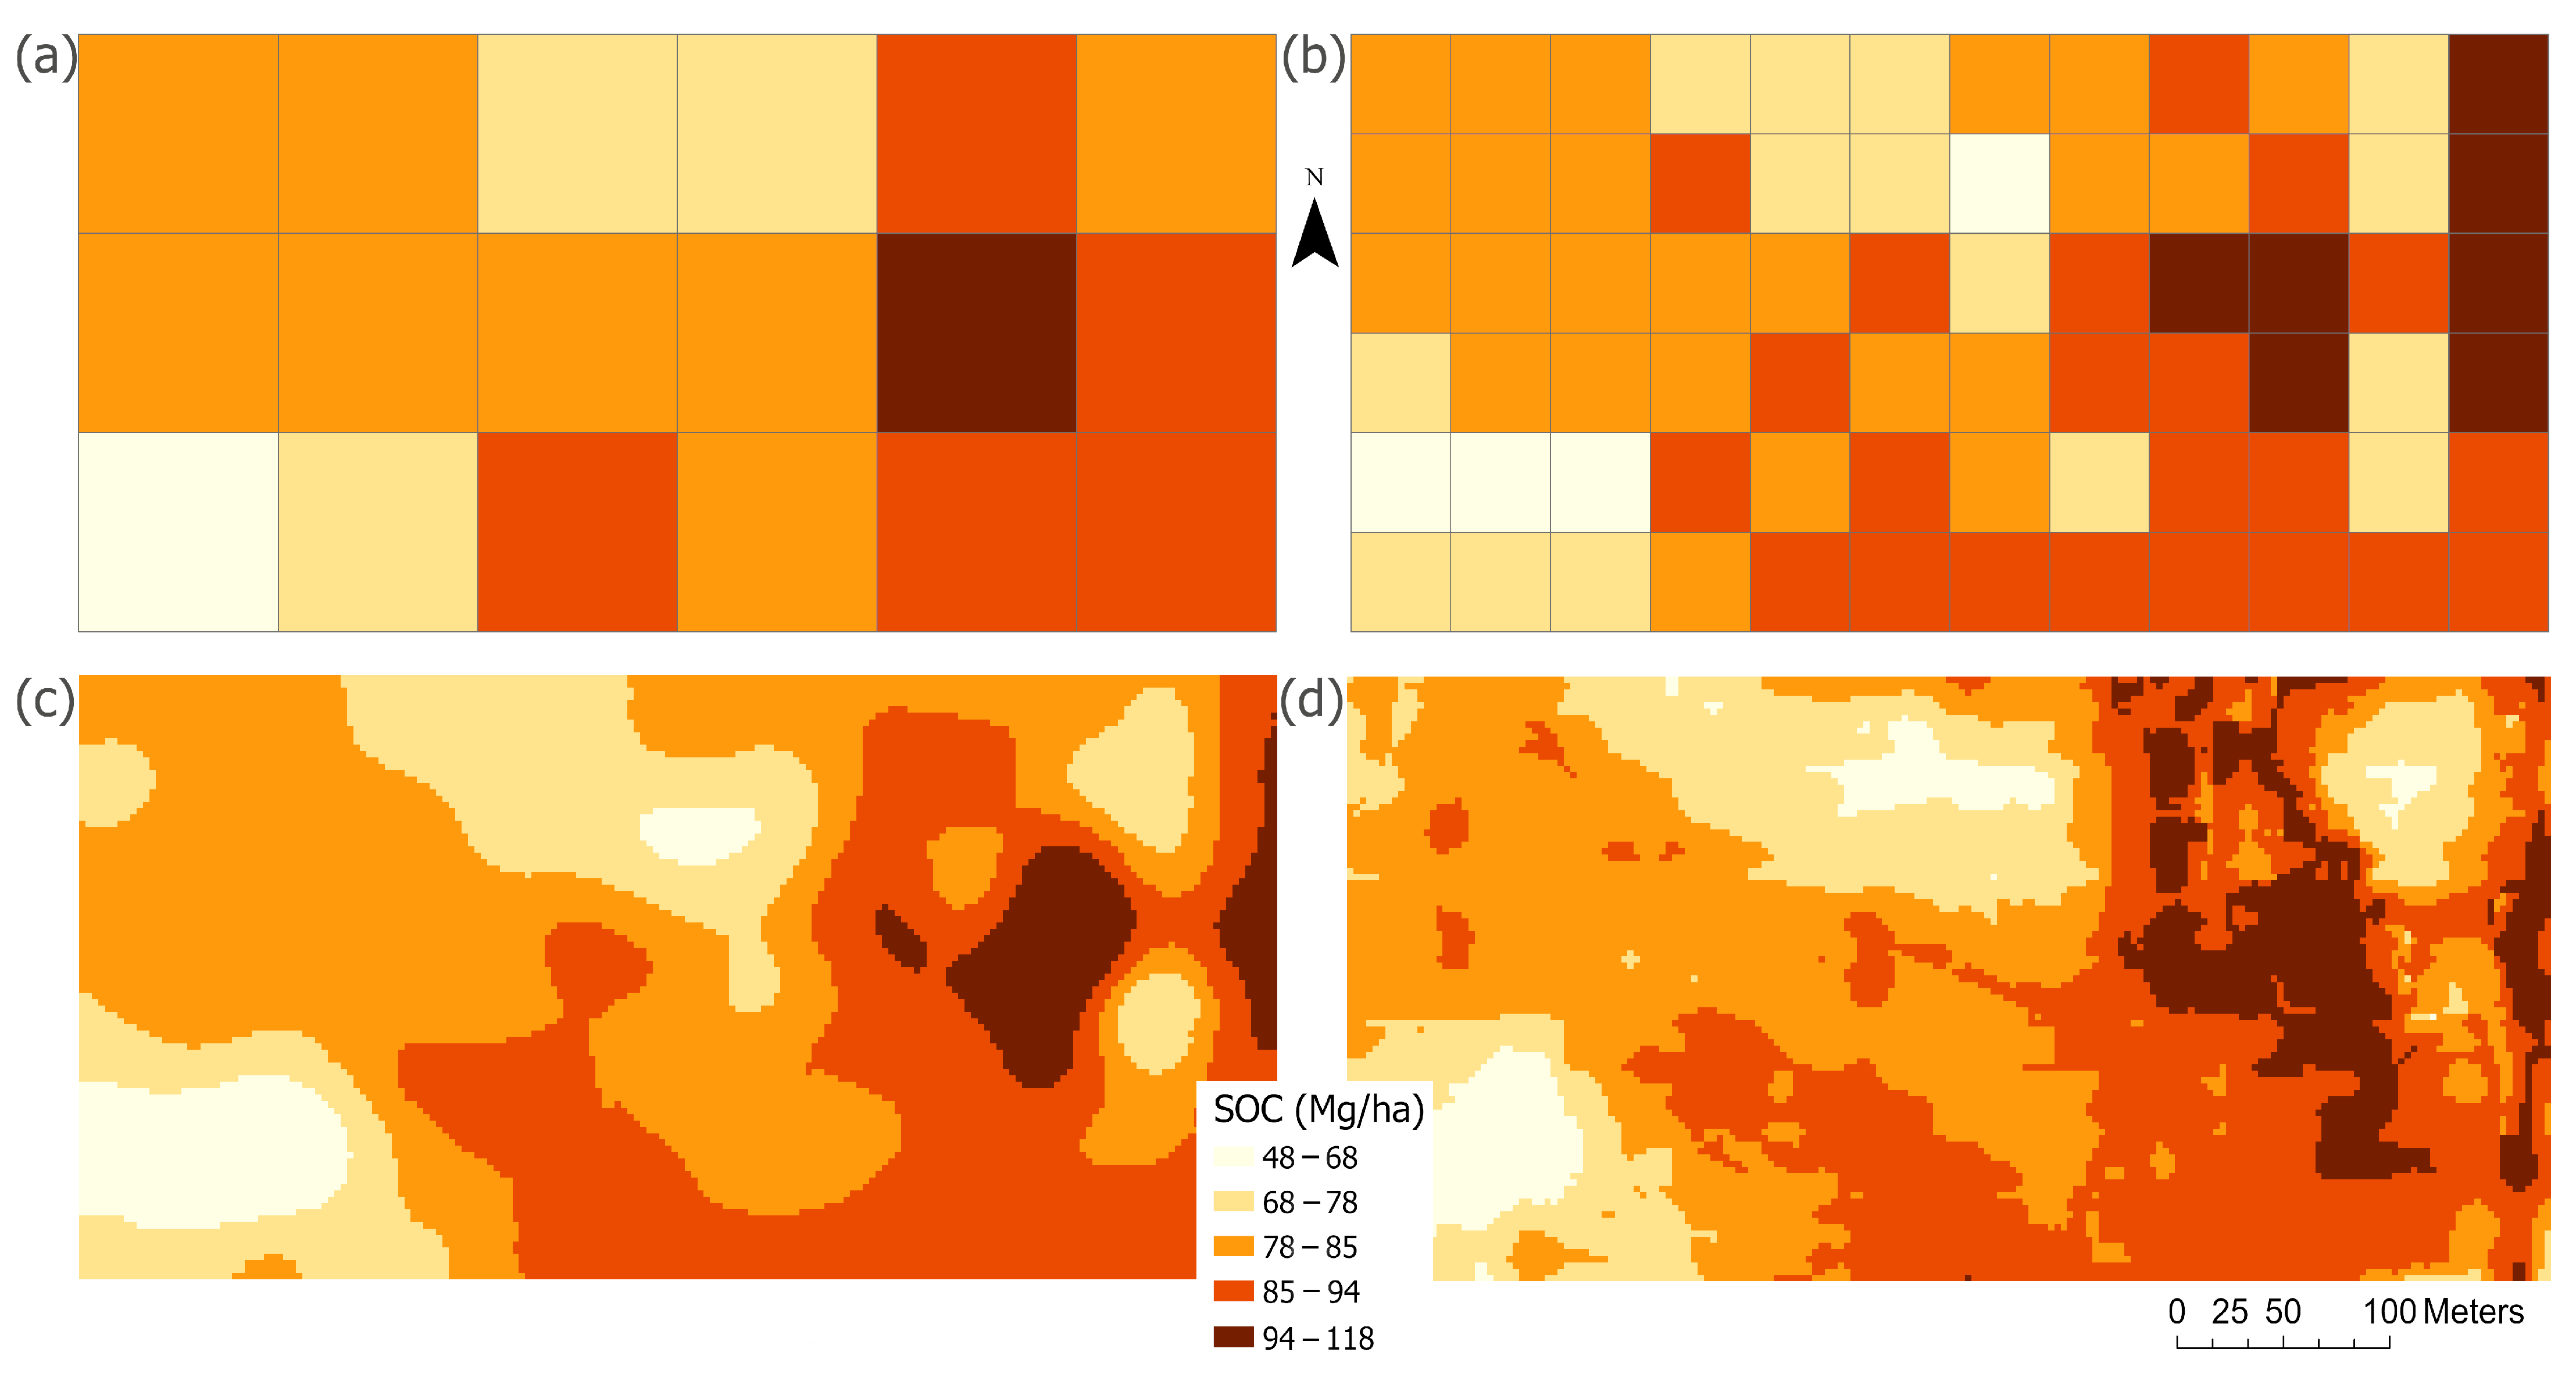
4.2. Spatial and Temporal Variation in SOC
4.3. Other Considerations
5. Conclusions
Author Contributions
Funding
Data Availability Statement
Conflicts of Interest
References
- IPCC. Summary for Policy Makers. In Climate Change 2022: Mitigation of Climate Change; Contribution of Working Group III to the Sixth Assessment Report of the Intergovernmental Panel on Climate Change; IPCC: Geneva, Switzerland, 2022. [Google Scholar]
- Smith, S.M.; Geden, O.; Nemet, G.; Gidden, M.; Lamb, W.F.; Powis, C.; Bellamy, R.; Callaghan, M.; Cowie, A.; Cox, E.; et al. The State of Carbon Dioxide Removal; Smith School of Enterprise and the Environment (SSEE): Oxford, UK, 2023. [Google Scholar]
- Robertson, G.P.; Hamilton, S.K.; Paustian, K.; Smith, P. Land-Based Climate Solutions for the United States. Glob. Chang. Biol. 2022, 28, 4912–4919. [Google Scholar] [CrossRef]
- Moinet, G.Y.K.; Hijbeek, R.; van Vuuren, D.P.; Giller, K.E. Carbon for Soils, Not Soils for Carbon. Glob. Chang. Biol. 2023, 29, 2384–2398. [Google Scholar] [CrossRef]
- Bossio, D.A.; Cook-Patton, S.C.; Ellis, P.W.; Fargione, J.; Sanderman, J.; Smith, P.; Wood, S.; Zomer, R.J.; von Unger, M.; Emmer, I.M.; et al. The Role of Soil Carbon in Natural Climate Solutions. Nat. Sustain. 2020, 3, 391–398. [Google Scholar] [CrossRef]
- Vermeulen, S.; Bossio, D.; Lehmann, J.; Luu, P.; Paustian, K.; Webb, C.; Augé, F.; Bacudo, I.; Baedeker, T.; Havemann, T.; et al. A Global Agenda for Collective Action on Soil Carbon. Nat. Sustain. 2019, 2, 2–4. [Google Scholar] [CrossRef]
- Plastina, A. The U.S. Voluntary Agricultural Carbon Market: Where to From Here? Farm Foundation: Oak Brook, IL, USA, 2022. [Google Scholar]
- Oldfield, E.; Eagle, A.; Rubin, R.; Sanderman, J.; Gordon, D. Agricultural Soil Carbon Credits: Making Sense of Protocols for Carbon Sequestration and Net Greenhouse Gas Removals; Environmental Defense Fund: New York, NY, USA, 2021. [Google Scholar]
- Schulte, L.A.; Jordahl, J.L. Carbon Science for Carbon Markets: Emerging Opportunities in Iowa; Iowa State University Extension and Outreach: Ames, IA, USA, 2022. [Google Scholar]
- Erb, T.; Perciasepe, B.; Radulovic, V.; Niland, M. Corporate Climate Commitments: The Trend Towards Net Zero. In Handbook of Climate Change Mitigation and Adaptation; Lackner, M., Sajjadi, B., Chen, W.-Y., Eds.; Springer: New York, NY, USA, 2020; pp. 1–34. ISBN 978-1-4614-6431-0. [Google Scholar]
- USDA. Partnerships for Climate-Smart Commodities Project Summaries; USDA: Washington, DC, USA, 2022.
- Stokstad, E. New Law’s Big Payout for Farming Has Uncertain Climate Payoff. Science 2022, 377, 800–801. [Google Scholar] [CrossRef]
- Pribyl, D.W. A Critical Review of the Conventional SOC to SOM Conversion Factor. Geoderma 2010, 156, 75–83. [Google Scholar] [CrossRef]
- Ontl, T.A.; Schulte, L.A. Soil Carbon Storage. Nat. Educ. Knowl. 2012, 3, 35. [Google Scholar]
- King, A.; Ali, G.; Gillespie, A.; Wagner-Riddle, C. Soil Organic Matter as Catalyst of Crop Resource Capture. Front. Environ. Sci. 2020, 8, 50. [Google Scholar] [CrossRef]
- Cotrufo, M.F.; Lavallee, J.M. Chapter One—Soil Organic Matter Formation, Persistence, and Functioning: A Synthesis of Current Understanding to Inform Its Conservation and Regeneration. In Advances in Agronomy; Sparks, D.L., Ed.; Academic Press: Cambridge, MA, USA, 2022; Volume 172, pp. 1–66. [Google Scholar]
- Wiesmeier, M.; Urbanski, L.; Hobley, E.; Lang, B.; von Lützow, M.; Marin-Spiotta, E.; van Wesemael, B.; Rabot, E.; Ließ, M.; Garcia-Franco, N.; et al. Soil Organic Carbon Storage as a Key Function of Soils—A Review of Drivers and Indicators at Various Scales. Geoderma 2019, 333, 149–162. [Google Scholar] [CrossRef]
- Ros, G.H.; Temminghoff, E.J.M.; Hoffland, E. Nitrogen Mineralization: A Review and Meta-Analysis of the Predictive Value of Soil Tests. Eur. J. Soil Sci. 2011, 62, 162–173. [Google Scholar] [CrossRef]
- Janzen, H.H. The Soil Carbon Dilemma: Shall We Hoard It or Use It? Soil Biol. Biochem. 2006, 38, 419–424. [Google Scholar] [CrossRef]
- Hopkins, C. Soil Fertility and Permanent Agriculture. Nature 1911, 86, 272–273. [Google Scholar] [CrossRef][Green Version]
- USDA-NRCS Gridded Soil Survey Geographic (GSSURGO) Database|Natural Resources Conservation Service. Available online: https://www.nrcs.usda.gov/resources/data-and-reports/gridded-soil-survey-geographic-gssurgo-database (accessed on 21 June 2023).
- Hassink, J. The Capacity of Soils to Preserve Organic C and N by Their Association with Clay and Silt Particles. Plant Soil 1997, 191, 77–87. [Google Scholar] [CrossRef]
- Plante, A.F.; Conant, R.T.; Stewart, C.E.; Paustian, K.; Six, J. Impact of Soil Texture on the Distribution of Soil Organic Matter in Physical and Chemical Fractions. Soil Sci. Soc. Am. J. 2006, 70, 287–296. [Google Scholar] [CrossRef]
- USDA-NRCS National Soil Information System (NASIS)|Natural Resources Conservation Service. Available online: https://www.nrcs.usda.gov/resources/education-and-teaching-materials/national-soil-information-system-nasis (accessed on 29 June 2023).
- Miller, B.A.; Schaetzl, R.J. The Historical Role of Base Maps in Soil Geography. Geoderma 2014, 230–231, 329–339. [Google Scholar] [CrossRef]
- Most U.S. Fuel Ethanol Production Capacity at the Start of 2022 Was in the Midwest. Available online: https://www.eia.gov/todayinenergy/detail.php?id=53539 (accessed on 27 June 2023).
- NASS. Iowa’s Rank in United States Agriculture; United States Department of Agriculture National Agricultural Statistics Service: Washington, DC, USA, 2022.
- Hurt, R.D. Indian Agriculture in America: Prehistory to the Present; University Press of Kansas: Lawrence, KS, USA, 1987; ISBN 978-0-7006-0337-4. [Google Scholar]
- Green, W.; Arzigian, C. Agricultural Origins and Development in the Midcontinent; The Office of the State Archaeologist: Iowa City, IA, USA, 1994. [Google Scholar]
- Landon, A. The “How” of the Three Sisters: The Origins of Agriculture in Mesoamerica and the Human Niche; Nebraska Anthropologist; University of Nebraska-Lincoln: Lincoln, NE, USA, 2008. [Google Scholar]
- Veenstra, J.J.; Lee Burras, C. Soil Profile Transformation after 50 Years of Agricultural Land Use. Soil Sci. Soc. Am. J. 2015, 79, 1154–1162. [Google Scholar] [CrossRef]
- Thaler, E.A.; Larsen, I.J.; Yu, Q. The Extent of Soil Loss across the US Corn Belt. Proc. Natl. Acad. Sci. USA 2021, 118, e1922375118. [Google Scholar] [CrossRef] [PubMed]
- Sawadgo, W.; Plastina, A. The Invisible Elephant: Disadoption of Conservation Practices in the United States. Choices 2022, 37, 1–13. [Google Scholar]
- USDA. Summary Report: 2017 National Resources Inventory; U.S. Department of Agricultuire: Natural Resources Conservation Service: Washington, DC, USA; Center for Survey Statistics and Methodology, Iowa State University: Ames, IA, USA, 2020.
- Sanderman, J.; Hengl, T.; Fiske, G.J. Soil Carbon Debt of 12,000 Years of Human Land Use. Proc. Natl. Acad. Sci. USA 2017, 114, 9575–9580. [Google Scholar] [CrossRef]
- Aref, S.; Wander, M.M. Long-Term Trends of Corn Yield and Soil Organic Matter in Different Crop Sequences and Soil Fertility Treatments on the Morrow Plots. In Advances in Agronomy; Sparks, D.L., Ed.; Academic Press: Cambridge, MA, USA, 1997; Volume 62, pp. 153–197. [Google Scholar]
- Nafziger, E.D.; Dunker, R.E. Soil Organic Carbon Trends Over 100 Years in the Morrow Plots. Agron. J. 2011, 103, 261–267. [Google Scholar] [CrossRef]
- Karlen, D.L.; Berry, E.C.; Colvin, T.S.; Kanwar, R.S. Twelve-year Tillage and Crop Rotation Effects on Yields and Soil Chemical Properties in Northeast Iowa. Commun. Soil Sci. Plant Anal. 1991, 22, 1985–2003. [Google Scholar] [CrossRef]
- Barber, S.A. Corn Residue Management and Soil Organic Matter1. Agron. J. 1979, 71, 625–627. [Google Scholar] [CrossRef]
- Robinson, C.A.; Cruse, R.M.; Ghaffarzadeh, M. Cropping System and Nitrogen Effects on Mollisol Organic Carbon. Soil Sci. Soc. Am. J. 1996, 60, 264–269. [Google Scholar] [CrossRef]
- Poffenbarger, H.J.; Olk, D.C.; Cambardella, C.; Kersey, J.; Liebman, M.; Mallarino, A.; Six, J.; Castellano, M.J. Whole-Profile Soil Organic Matter Content, Composition, and Stability under Cropping Systems That Differ in Belowground Inputs. Agric. Ecosyst. Environ. 2020, 291, 106810. [Google Scholar] [CrossRef]
- Hoover, N.L.; Law, J.Y.; Long, L.A.M.; Kanwar, R.S.; Soupir, M.L. Long-Term Impact of Poultry Manure on Crop Yield, Soil and Water Quality, and Crop Revenue. J. Environ. Manag. 2019, 252, 109582. [Google Scholar] [CrossRef] [PubMed]
- Moore, E.B.; Wiedenhoeft, M.H.; Kaspar, T.C.; Cambardella, C.A. Rye Cover Crop Effects on Soil Quality in No-Till Corn Silage–Soybean Cropping Systems. Soil Sci. Soc. Am. J. 2014, 78, 968–976. [Google Scholar] [CrossRef]
- Studt, J.E.; McDaniel, M.D.; Tejera, M.D.; VanLoocke, A.; Howe, A.; Heaton, E.A. Soil Net Nitrogen Mineralization and Leaching under Miscanthus × Giganteus and Zea Mays. GCB Bioenergy 2021, 13, 1545–1560. [Google Scholar] [CrossRef]
- Ibrahim, M.A.; Chua-Ona, T.; Liebman, M.; Thompson, M.L. Soil Organic Carbon Storage under Biofuel Cropping Systems in a Humid, Continental Climate. Agron. J. 2018, 110, 1748–1753. [Google Scholar] [CrossRef]
- Banik, C.; Bartel, C.A.; Laird, D.A.; Moore, K.J.; Lenssen, A.W. Perennial Cover Crop Influences on Soil C and N and Maize Productivity. Nutr. Cycl. Agroecosyst. 2020, 116, 135–150. [Google Scholar] [CrossRef]
- Guzman, J.G.; Al-Kaisi, M.M. Soil Carbon Dynamics and Carbon Budget of Newly Reconstructed Tall-Grass Prairies in South Central Iowa. J. Environ. Qual. 2010, 39, 136–146. [Google Scholar] [CrossRef]
- Al-Kaisi, M.M.; Kwaw-Mensah, D. Quantifying Soil Carbon Change in a Long-term Tillage and Crop Rotation Study across Iowa Landscapes. Soil Sci. Soc. Am. J. 2020, 84, 182–202. [Google Scholar] [CrossRef]
- Robinson, C. Long-Term Cropping System and Nitrogen Management Effects on Soil Properties. Ph.D. Dissertation, Iowa State University, Ames, IA, USA, 1993. [Google Scholar]
- Russell, A.E.; Cambardella, C.A.; Laird, D.A.; Jaynes, D.B.; Meek, D.W. Nitrogen Fertilizer Effects on Soil Carbon Balances in Midwestern U.S. Agricultural Systems. Ecol. Appl. 2009, 19, 1102–1113. [Google Scholar] [CrossRef]
- Russell, A.E.; Laird, D.A.; Parkin, T.B.; Mallarino, A.P. Impact of Nitrogen Fertilization and Cropping System on Carbon Sequestration in Midwestern Mollisols. Soil Sci. Soc. Am. J. 2005, 69, 413–422. [Google Scholar] [CrossRef]
- Lazicki, P.A.; Liebman, M.; Wander, M.M. Root Parameters Show How Management Alters Resource Distribution and Soil Quality in Conventional and Low-Input Cropping Systems in Central Iowa. PLoS ONE 2016, 11, e0164209. [Google Scholar] [CrossRef] [PubMed]
- Baldwin-Kordick, R.; De, M.; Lopez, M.D.; Liebman, M.; Lauter, N.; Marino, J.; McDaniel, M.D. Comprehensive Impacts of Diversified Cropping on Soil Health and Sustainability. Agroecol. Sustain. Food Syst. 2022, 46, 331–363. [Google Scholar] [CrossRef]
- Bugeja, S.M.; Castellano, M.J. Physicochemical Organic Matter Stabilization across a Restored Grassland Chronosequence. Soil Sci. Soc. Am. J. 2018, 82, 1559–1567. [Google Scholar] [CrossRef]
- De, M.; Riopel, J.A.; Cihacek, L.J.; Lawrinenko, M.; Baldwin-Kordick, R.; Hall, S.J.; McDaniel, M.D. Soil Health Recovery after Grassland Reestablishment on Cropland: The Effects of Time and Topographic Position. Soil Sci. Soc. Am. J. 2020, 84, 568–586. [Google Scholar] [CrossRef]
- Sanderman, J.; Baldock, J. Accounting for Soil Carbon Sequestration in National Inventories: A Soil Scientist’s Perspective. Environ. Res. Lett. 2010, 5, 034003. [Google Scholar] [CrossRef]
- IDALS. Acessibility Version: Tracking the Iowa Nutrient Reduction Strategy; Version 1.0; Iowa Department of Agriculture and Land Stewardship, Iowa Department of Natural Resources, Iowa State University: Ames, IA, USA, 2021. [Google Scholar]
- 2017 Census by State—Iowa|2017 Census of Agriculture|USDA/NASS. Available online: https://www.nass.usda.gov/Publications/AgCensus/2017/Full_Report/Census_by_State/Iowa/index.php (accessed on 28 June 2023).
- Pittelkow, C.M.; Linquist, B.A.; Lundy, M.E.; Liang, X.; van Groenigen, K.J.; Lee, J.; van Gestel, N.; Six, J.; Venterea, R.T.; van Kessel, C. When Does No-till Yield More? A Global Meta-Analysis. Field Crops Res. 2015, 183, 156–168. [Google Scholar] [CrossRef]
- West, T.O.; Post, W.M. Soil Organic Carbon Sequestration Rates by Tillage and Crop Rotation. Soil Sci. Soc. Am. J. 2002, 66, 1930–1946. [Google Scholar] [CrossRef]
- Virto, I.; Barré, P.; Burlot, A.; Chenu, C. Carbon Input Differences as the Main Factor Explaining the Variability in Soil Organic C Storage in No-Tilled Compared to Inversion Tilled Agrosystems. Biogeochemistry 2012, 108, 17–26. [Google Scholar] [CrossRef]
- Meurer, K.H.E.; Haddaway, N.R.; Bolinder, M.A.; Kätterer, T. Tillage Intensity Affects Total SOC Stocks in Boreo-Temperate Regions Only in the Topsoil—A Systematic Review Using an ESM Approach. Earth-Sci. Rev. 2018, 177, 613–622. [Google Scholar] [CrossRef]
- Nicoloso, R.S.; Rice, C.W. Intensification of No-till Agricultural Systems: An Opportunity for Carbon Sequestration. Soil Sci. Soc. Am. J. 2021, 85, 1395–1409. [Google Scholar] [CrossRef]
- Ogle, S.M.; Alsaker, C.; Baldock, J.; Bernoux, M.; Breidt, F.J.; McConkey, B.; Regina, K.; Vazquez-Amabile, G.G. Climate and Soil Characteristics Determine Where No-Till Management Can Store Carbon in Soils and Mitigate Greenhouse Gas Emissions. Sci. Rep. 2019, 9, 11665. [Google Scholar] [CrossRef] [PubMed]
- Baker, J.M.; Ochsner, T.E.; Venterea, R.T.; Griffis, T.J. Tillage and Soil Carbon Sequestration—What Do We Really Know? Agric. Ecosyst. Environ. 2007, 118, 1–5. [Google Scholar] [CrossRef]
- Cai, A.; Han, T.; Ren, T.; Sanderman, J.; Rui, Y.; Wang, B.; Smith, P.; Xu, M.; Li, Y. Declines in Soil Carbon Storage under No Tillage Can Be Alleviated in the Long Run. Geoderma 2022, 425, 116028. [Google Scholar] [CrossRef]
- Powlson, D.S.; Stirling, C.M.; Jat, M.L.; Gerard, B.G.; Palm, C.A.; Sanchez, P.A.; Cassman, K.G. Limited Potential of No-till Agriculture for Climate Change Mitigation. Nat. Clim. Chang. 2014, 4, 678–683. [Google Scholar] [CrossRef]
- Luo, Z.; Wang, E.; Sun, O.J. Can No-Tillage Stimulate Carbon Sequestration in Agricultural Soils? A Meta-Analysis of Paired Experiments. Agric. Ecosyst. Environ. 2010, 139, 224–231. [Google Scholar] [CrossRef]
- Mondal, S.; Chakraborty, D.; Paul, R.K.; Mondal, A.; Ladha, J. No-till Is More of Sustaining the Soil than a Climate Change Mitigation Option. Agric. Ecosyst. Environ. 2023, 352, 108498. [Google Scholar] [CrossRef]
- Simpson, Z.; Jordahl, J.; Simpson, A.; Miguez, F.; Niemi, J.; Schulte, L.; Thompson, M.; Villarino, S.; McDaniel, M. No-Tillage Does Not on Average Reduce Soil Carbon Storage Compared to Conventional Tillage. Comment on “Declines in Soil Carbon Storage under No Tillage Can Be Alleviated in the Long Run” by Cai et al. Geoderma 2022, 430, 116307. [Google Scholar] [CrossRef]
- Alvarez, R. A Review of Nitrogen Fertilizer and Conservation Tillage Effects on Soil Organic Carbon Storage. Soil Use Manag. 2005, 21, 38–52. [Google Scholar] [CrossRef]
- Seitz, S.; Prasuhn, V.; Scholten, T. Controlling Soil Erosion Using No-Till Farming Systems. In No-Till Farming Systems for Sustainable Agriculture: Challenges and Opportunities; Dang, Y.P., Dalal, R.C., Menzies, N.W., Eds.; Springer International Publishing: Cham, Switzerland, 2020; pp. 195–211. ISBN 978-3-030-46409-7. [Google Scholar]
- Montgomery, D.R. Soil Erosion and Agricultural Sustainability. Proc. Natl. Acad. Sci. USA 2007, 104, 13268–13272. [Google Scholar] [CrossRef] [PubMed]
- Moorman, T.B.; Cambardella, C.A.; James, D.E.; Karlen, D.L.; Kramer, L.A. Quantification of Tillage and Landscape Effects on Soil Carbon in Small Iowa Watersheds. Soil Tillage Res. 2004, 78, 225–236. [Google Scholar] [CrossRef]
- Basche, A.D.; Miguez, F.E.; Kaspar, T.C.; Castellano, M.J. Do Cover Crops Increase or Decrease Nitrous Oxide Emissions? A Meta-Analysis. J. Soil Water Conserv. 2014, 69, 471–482. [Google Scholar] [CrossRef]
- Liu, X.; Wu, X.; Liang, G.; Zheng, F.; Zhang, M.; Li, S. A Global Meta-Analysis of the Impacts of No-Tillage on Soil Aggregation and Aggregate-Associated Organic Carbon. Land Degrad. Dev. 2021, 32, 5292–5305. [Google Scholar] [CrossRef]
- Zuber, S.M.; Villamil, M.B. Meta-Analysis Approach to Assess Effect of Tillage on Microbial Biomass and Enzyme Activities. Soil Biol. Biochem. 2016, 97, 176–187. [Google Scholar] [CrossRef]
- Waring, E.R.; Lagzdins, A.; Pederson, C.; Helmers, M.J. Influence of No-till and a Winter Rye Cover Crop on Nitrate Losses from Tile-Drained Row-Crop Agriculture in Iowa. J. Environ. Qual. 2020, 49, 292–303. [Google Scholar] [CrossRef]
- Brown, P.W.; Schulte, L.A. Agricultural Landscape Change (1937–2002) in Three Townships in Iowa, USA. Landsc. Urban Plan. 2011, 100, 202–212. [Google Scholar] [CrossRef]
- Liebman, M.; Gibson, L.R.; Sundberg, D.N.; Heggenstaller, A.H.; Westerman, P.R.; Chase, C.A.; Hartzler, R.G.; Menalled, F.D.; Davis, A.S.; Dixon, P.M. Agronomic and Economic Performance Characteristics of Conventional and Low-External-Input Cropping Systems in the Central Corn Belt. Agron. J. 2008, 100, 600–610. [Google Scholar] [CrossRef]
- Poffenbarger, H.J.; Barker, D.W.; Helmers, M.J.; Miguez, F.E.; Olk, D.C.; Sawyer, J.E.; Six, J.; Castellano, M.J. Maximum Soil Organic Carbon Storage in Midwest U.S. Cropping Systems When Crops Are Optimally Nitrogen-Fertilized. PLoS ONE 2017, 12, e0172293. [Google Scholar] [CrossRef] [PubMed]
- Cotrufo, M.F.; Ranalli, M.G.; Haddix, M.L.; Six, J.; Lugato, E. Soil Carbon Storage Informed by Particulate and Mineral-Associated Organic Matter. Nat. Geosci. 2019, 12, 989–994. [Google Scholar] [CrossRef]
- McDaniel, M.D.; Tiemann, L.K.; Grandy, A.S. Does Agricultural Crop Diversity Enhance Soil Microbial Biomass and Organic Matter Dynamics? A Meta-Analysis. Ecol. Appl. 2014, 24, 560–570. [Google Scholar] [CrossRef] [PubMed]
- Maillard, É.; Angers, D.A. Animal Manure Application and Soil Organic Carbon Stocks: A Meta-Analysis. Glob. Chang. Biol. 2014, 20, 666–679. [Google Scholar] [CrossRef]
- Rui, Y.; Jackson, R.D.; Cotrufo, M.F.; Sanford, G.R.; Spiesman, B.J.; Deiss, L.; Culman, S.W.; Liang, C.; Ruark, M.D. Persistent Soil Carbon Enhanced in Mollisols by Well-Managed Grasslands but Not Annual Grain or Dairy Forage Cropping Systems. Proc. Natl. Acad. Sci. USA 2022, 119, e2118931119. [Google Scholar] [CrossRef]
- Hunt, N.D.; Liebman, M.; Thakrar, S.K.; Hill, J.D. Fossil Energy Use, Climate Change Impacts, and Air Quality-Related Human Health Damages of Conventional and Diversified Cropping Systems in Iowa, USA. Environ. Sci. Technol. 2020, 54, 11002–11014. [Google Scholar] [CrossRef]
- Hunt, N.D.; Hill, J.D.; Liebman, M. Cropping System Diversity Effects on Nutrient Discharge, Soil Erosion, and Agronomic Performance. Environ. Sci. Technol. 2019, 53, 1344–1352. [Google Scholar] [CrossRef]
- IDNR Prairie Resource Center—Iowa Department of Natural Resources. Available online: https://www.iowadnr.gov/conservation/prairie-resource-center (accessed on 27 June 2023).
- DeLuca, T.H.; Zabinski, C.A. Prairie Ecosystems and the Carbon Problem. Front. Ecol. Environ. 2011, 9, 407–413. [Google Scholar] [CrossRef]
- Schulte, L.A.; Niemi, J.; Helmers, M.J.; Liebman, M.; Arbuckle, J.G.; James, D.E.; Kolka, R.K.; O’Neal, M.E.; Tomer, M.D.; Tyndall, J.C.; et al. Prairie Strips Improve Biodiversity and the Delivery of Multiple Ecosystem Services from Corn–Soybean Croplands. Proc. Natl. Acad. Sci. USA 2017, 114, 11247–11252. [Google Scholar] [CrossRef]
- Brandes, E.; Mcnunn, G.; Schulte, L.; Bonner, I.; Muth, D.; Babcock, B.; Sharma, B.; Heaton, E. Subfield Profitability Analysis Reveals an Economic Case for Cropland Diversification. Environ. Res. Lett. 2016, 11, 014009. [Google Scholar] [CrossRef]
- Berger, H.; Meyer, C.K.; Mummert, A.; Tirado, L.; Saucedo, L.; Bonello, H.; Van Arsdale, D.; Williams, G. Land Use Dynamics within the Tallgrass Prairie Ecosystem: The Case for the Conservation Reserve Program (CRP). Theor. Ecol. 2020, 13, 289–300. [Google Scholar] [CrossRef]
- Garten, C.T., Jr.; Wullschleger, S.D. Soil Carbon Inventories under a Bioenergy Crop (Switchgrass): Measurement Limitations. J. Environ. Qual. 1999, 28, 1359–1365. [Google Scholar] [CrossRef]
- Ye, C.; Hall, S.J. Mechanisms Underlying Limited Soil Carbon Gains in Perennial and Cover-Cropped Bioenergy Systems Revealed by Stable Isotopes. GCB Bioenergy 2020, 12, 101–117. [Google Scholar] [CrossRef]
- Sokol, N.W.; Bradford, M.A. Microbial Formation of Stable Soil Carbon Is More Efficient from Belowground than Aboveground Input. Nat. Geosci. 2019, 12, 46–53. [Google Scholar] [CrossRef]
- An, H.; Wu, X.; Zhang, Y.; Tang, Z. Effects of Land-Use Change on Soil Inorganic Carbon: A Meta-Analysis. Geoderma 2019, 353, 273–282. [Google Scholar] [CrossRef]
- Guo, L.B.; Gifford, R.M. Soil Carbon Stocks and Land Use Change: A Meta Analysis. Glob. Chang. Biol. 2002, 8, 345–360. [Google Scholar] [CrossRef]
- Kristensen, J.A.; Svenning, J.-C.; Georgiou, K.; Malhi, Y. Can Large Herbivores Enhance Ecosystem Carbon Persistence? Trends Ecol. Evol. 2022, 37, 117–128. [Google Scholar] [CrossRef]
- Fargione, J.E.; Bassett, S.; Boucher, T.; Bridgham, S.D.; Conant, R.T.; Cook-Patton, S.C.; Ellis, P.W.; Falcucci, A.; Fourqurean, J.W.; Gopalakrishna, T.; et al. Natural Climate Solutions for the United States. Sci. Adv. 2018, 4, eaat1869. [Google Scholar] [CrossRef]
- Button, E.S.; Pett-Ridge, J.; Murphy, D.V.; Kuzyakov, Y.; Chadwick, D.R.; Jones, D.L. Deep-C Storage: Biological, Chemical and Physical Strategies to Enhance Carbon Stocks in Agricultural Subsoils. Soil Biol. Biochem. 2022, 170, 108697. [Google Scholar] [CrossRef]
- Wijewardane, N.K.; Hetrick, S.; Ackerson, J.; Morgan, C.L.S.; Ge, Y. VisNIR Integrated Multi-Sensing Penetrometer for in Situ High-Resolution Vertical Soil Sensing. Soil Tillage Res. 2020, 199, 104604. [Google Scholar] [CrossRef]
- von Lützow, M.; Kögel-Knabner, I.; Ludwig, B.; Matzner, E.; Flessa, H.; Ekschmitt, K.; Guggenberger, G.; Marschner, B.; Kalbitz, K. Stabilization Mechanisms of Organic Matter in Four Temperate Soils: Development and Application of a Conceptual Model. J. Plant Nutr. Soil Sci. 2008, 171, 111–124. [Google Scholar] [CrossRef]
- Cotrufo, M.F.; Soong, J.L.; Horton, A.J.; Campbell, E.E.; Haddix, M.L.; Wall, D.H.; Parton, W.J. Formation of Soil Organic Matter via Biochemical and Physical Pathways of Litter Mass Loss. Nat. Geosci. 2015, 8, 776–779. [Google Scholar] [CrossRef]
- Lavallee, J.M.; Soong, J.L.; Cotrufo, M.F. Conceptualizing Soil Organic Matter into Particulate and Mineral-Associated Forms to Address Global Change in the 21st Century. Glob. Chang. Biol. 2020, 26, 261–273. [Google Scholar] [CrossRef] [PubMed]
- Angst, G.; Mueller, K.E.; Castellano, M.J.; Vogel, C.; Wiesmeier, M.; Mueller, C.W. Unlocking Complex Soil Systems as Carbon Sinks: Multi-Pool Management as the Key. Nat. Commun. 2023, 14, 2967. [Google Scholar] [CrossRef] [PubMed]
- Six, J.; Conant, R.T.; Paul, E.A.; Paustian, K. Stabilization Mechanisms of Soil Organic Matter: Implications for C-Saturation of Soils. Plant Soil 2002, 241, 155–176. [Google Scholar] [CrossRef]
- Stewart, C.E.; Paustian, K.; Conant, R.T.; Plante, A.F.; Six, J. Soil Carbon Saturation: Concept, Evidence and Evaluation. Biogeochemistry 2007, 86, 19–31. [Google Scholar] [CrossRef]
- Stewart, C.E.; Plante, A.F.; Paustian, K.; Conant, R.T.; Six, J. Soil Carbon Saturation: Linking Concept and Measurable Carbon Pools. Soil Sci. Soc. Am. J. 2008, 72, 379–392. [Google Scholar] [CrossRef]
- Begill, N.; Don, A.; Poeplau, C. No Detectable Upper Limit of Mineral-Associated Organic Carbon in Temperate Agricultural Soils. Glob. Chang. Biol. 2023, 29, 4662–4669. [Google Scholar] [CrossRef]
- Haynes, R. Labile Organic Matter Fractions as Central Components of the Quality of Agricultural Soils: An Overview. Adv. Agron. 2005, 85, 221–268. [Google Scholar] [CrossRef]
- Ontl, T.A.; Cambardella, C.A.; Schulte, L.A.; Kolka, R.K. Factors Influencing Soil Aggregation and Particulate Organic Matter Responses to Bioenergy Crops across a Topographic Gradient. Geoderma 2015, 255–256, 1–11. [Google Scholar] [CrossRef]
- Daly, A.B.; Jilling, A.; Bowles, T.M.; Buchkowski, R.W.; Frey, S.D.; Kallenbach, C.M.; Keiluweit, M.; Mooshammer, M.; Schimel, J.P.; Grandy, A.S. A Holistic Framework Integrating Plant-Microbe-Mineral Regulation of Soil Bioavailable Nitrogen. Biogeochemistry 2021, 154, 211–229. [Google Scholar] [CrossRef] [PubMed]
- Yu, W.; Huang, W.; Weintraub-Leff, S.R.; Hall, S.J. Where and Why Do Particulate Organic Matter (POM) and Mineral-Associated Organic Matter (MAOM) Differ among Diverse Soils? Soil Biol. Biochem. 2022, 172, 108756. [Google Scholar] [CrossRef]
- Lefebvre, D.; Williams, A.; Meersmans, J.; Kirk, G.J.D.; Sohi, S.; Goglio, P.; Smith, P. Modelling the Potential for Soil Carbon Sequestration Using Biochar from Sugarcane Residues in Brazil. Sci. Rep. 2020, 10, 19479. [Google Scholar] [CrossRef] [PubMed]
- Amonette, J.E.; Blanco-Canqui, H.; Hassebrook, C.; Laird, D.A.; Lal, R.; Lehmann, J.; Page-Dumroese, D. Integrated Biochar Research: A Roadmap. J. Soil Water Conserv. 2021, 76, 24A–29A. [Google Scholar] [CrossRef]
- Lehmann, J.; Cowie, A.; Masiello, C.A.; Kammann, C.; Woolf, D.; Amonette, J.E.; Cayuela, M.L.; Camps-Arbestain, M.; Whitman, T. Biochar in Climate Change Mitigation. Nat. Geosci. 2021, 14, 883–892. [Google Scholar] [CrossRef]
- Mao, J.-D.; Johnson, R.L.; Lehmann, J.; Olk, D.C.; Neves, E.G.; Thompson, M.L.; Schmidt-Rohr, K. Abundant and Stable Char Residues in Soils: Implications for Soil Fertility and Carbon Sequestration. Environ. Sci. Technol. 2012, 46, 9571–9576. [Google Scholar] [CrossRef] [PubMed]
- Basso, A.S.; Miguez, F.E.; Laird, D.A.; Horton, R.; Westgate, M. Assessing Potential of Biochar for Increasing Water-Holding Capacity of Sandy Soils. GCB Bioenergy 2013, 5, 132–143. [Google Scholar] [CrossRef]
- Lawrinenko, M.; Laird, D.A. Anion Exchange Capacity of Biochar. Green Chem. 2015, 17, 4628–4636. [Google Scholar] [CrossRef]
- Fidel, R.B.; Laird, D.A.; Thompson, M.L.; Lawrinenko, M. Characterization and Quantification of Biochar Alkalinity. Chemosphere 2017, 167, 367–373. [Google Scholar] [CrossRef] [PubMed]
- Fang, X.; Chua, T.; Schmidt-Rohr, K.; Thompson, M.L. Quantitative 13C NMR of Whole and Fractionated Iowa Mollisols for Assessment of Organic Matter Composition. Geochim. Cosmochim. Acta 2010, 74, 584–598. [Google Scholar] [CrossRef]
- Smith, P.; Soussana, J.-F.; Angers, D.; Schipper, L.; Chenu, C.; Rasse, D.P.; Batjes, N.H.; van Egmond, F.; McNeill, S.; Kuhnert, M.; et al. How to Measure, Report and Verify Soil Carbon Change to Realize the Potential of Soil Carbon Sequestration for Atmospheric Greenhouse Gas Removal. Glob. Chang. Biol. 2020, 26, 219–241. [Google Scholar] [CrossRef]
- Vance, E.D.; Brookes, P.C.; Jenkinson, D.S. An Extraction Method for Measuring Soil Microbial Biomass C. Soil Biol. Biochem. 1987, 19, 703–707. [Google Scholar] [CrossRef]
- Liang, C.; Amelung, W.; Lehmann, J.; Kästner, M. Quantitative Assessment of Microbial Necromass Contribution to Soil Organic Matter. Glob. Chang. Biol. 2019, 25, 3578–3590. [Google Scholar] [CrossRef] [PubMed]
- Wang, B.; An, S.; Liang, C.; Liu, Y.; Kuzyakov, Y. Microbial Necromass as the Source of Soil Organic Carbon in Global Ecosystems. Soil Biol. Biochem. 2021, 162, 108422. [Google Scholar] [CrossRef]
- Villarino, S.H.; Talab, E.; Contisciani, L.; Videla, C.; Di Geronimo, P.; Mastrángelo, M.E.; Georgiou, K.; Jackson, R.B.; Piñeiro, G. A Large Nitrogen Supply from the Stable Mineral-Associated Soil Organic Matter Fraction. Biol. Fertil. Soils. 2023; in press. [Google Scholar] [CrossRef]
- Haney, R.; Haney, E.; Hossner, L.; Arnold, J. Modifications to the New Soil Extractant H3A-1: A Multinutrient Extractant. Commun. Soil Sci. Plant Anal. 2010, 41, 1513–1523. [Google Scholar] [CrossRef]
- Yost, M.; Veum, K.; Kitchen, N.R.; Sawyer, J.E.; Camberato, J.; Carter, P.R.; Ferguson, R.; Fernández, F.; Franzen, D.; Laboski, C.A.; et al. Evaluation of the Haney Soil Health Tool for Corn Nitrogen Recommendations across Eight Midwest States. J. Soil Water Conserv. 2018, 73, 587–592. [Google Scholar] [CrossRef]
- Franzluebbers, A.J. Soil-Test Biological Activity with the Flush of CO2: III. Corn Yield Responses to Applied Nitrogen. Soil Sci. Soc. Am. J. 2018, 82, 708–721. [Google Scholar] [CrossRef]
- Franzluebbers, A.J.; Pershing, M.R. Soil-Test Biological Activity with the Flush of CO2: II. Greenhouse Growth Bioassay from Soils in Corn Production. Soil Sci. Soc. Am. J. 2018, 82, 696–707. [Google Scholar] [CrossRef]
- Franzluebbers, A.J.; Pershing, M.R.; Crozier, C.; Osmond, D.; Schroeder-Moreno, M. Soil-Test Biological Activity with the Flush of CO2: I. C and N Characteristics of Soils in Corn Production. Soil Sci. Soc. Am. J. 2018, 82, 685–695. [Google Scholar] [CrossRef]
- Leifeld, J.; Kögel-Knabner, I. Soil Organic Matter Fractions as Early Indicators for Carbon Stock Changes under Different Land-Use? Geoderma 2005, 124, 143–155. [Google Scholar] [CrossRef]
- Powlson, D.S.; Prookes, P.C.; Christensen, B.T. Measurement of Soil Microbial Biomass Provides an Early Indication of Changes in Total Soil Organic Matter Due to Straw Incorporation. Soil Biol. Biochem. 1987, 19, 159–164. [Google Scholar] [CrossRef]
- Berthelin, J.; Laba, M.; Lemaire, G.; Powlson, D.; Tessier, D.; Wander, M.; Baveye, P. Soil Carbon Sequestration for Climate Change Mitigation: Mineralization Kinetics of Organic Inputs as an Overlooked Limitation. Eur. J. Soil Sci. 2022, 73, e13221. [Google Scholar] [CrossRef]
- Abramoff, R.; Xu, X.; Hartman, M.; O’Brien, S.; Feng, W.; Davidson, E.; Finzi, A.; Moorhead, D.; Schimel, J.; Torn, M.; et al. The Millennial Model: In Search of Measurable Pools and Transformations for Modeling Soil Carbon in the New Century. Biogeochemistry 2018, 137, 51–71. [Google Scholar] [CrossRef]
- Dwivedi, D.; Tang, J.; Bouskill, N.; Georgiou, K.; Chacon, S.S.; Riley, W.J. Abiotic and Biotic Controls on Soil Organo–Mineral Interactions: Developing Model Structures to Analyze Why Soil Organic Matter Persists. Rev. Mineral. Geochem. 2019, 85, 329–348. [Google Scholar] [CrossRef]
- Zhang, Y.; Lavallee, J.M.; Robertson, A.D.; Even, R.; Ogle, S.M.; Paustian, K.; Cotrufo, M.F. Simulating Measurable Ecosystem Carbon and Nitrogen Dynamics with the Mechanistically Defined MEMS 2.0 Model. Biogeosciences 2021, 18, 3147–3171. [Google Scholar] [CrossRef]
- McBratney, A.B.; Mendonça Santos, M.L.; Minasny, B. On Digital Soil Mapping. Geoderma 2003, 117, 3–52. [Google Scholar] [CrossRef]
- Miller, B.A.; Koszinski, S.; Wehrhan, M.; Sommer, M. Comparison of Spatial Association Approaches for Landscape Mapping of Soil Organic Carbon Stocks. SOIL 2015, 1, 217–233. [Google Scholar] [CrossRef]
- McBratney, A.B.; Webster, R. Optimal Interpolation and Isarithmic Mapping of Soil Properties. J. Soil Sci. 1983, 34, 137–162. [Google Scholar] [CrossRef]
- Asbjornsen, H.; Hernández-Santana, V.; Liebman, M.; Bayala, J.; Chen, J.; Helmers, M.; Ong, C.; Schulte, L.A. Targeting Perennial Vegetation in Agricultural Landscapes for Enhancing Ecosystem Services. Renew. Agric. Food Syst. 2013, 29, 101–125. [Google Scholar] [CrossRef]
- Kuhn, M.; Weston, C.; Coulter, R.; Quinlan, R. Package “Cubist”: Rule-and Instance-Based Regression Modeling. Available online: https://cran.r-project.org/web/packages/Cubist/Cubist.pdf (accessed on 15 May 2023).
- Kravchenko, A.N.; Robertson, G.P. Whole-Profile Soil Carbon Stocks: The Danger of Assuming Too Much from Analyses of Too Little. Soil Sci. Soc. Am. J. 2011, 75, 235–240. [Google Scholar] [CrossRef]
- Castellano, M.J.; Mueller, K.E.; Olk, D.C.; Sawyer, J.E.; Six, J. Integrating Plant Litter Quality, Soil Organic Matter Stabilization, and the Carbon Saturation Concept. Glob. Chang. Biol. 2015, 21, 3200–3209. [Google Scholar] [CrossRef]
- Crolla, A.; Kinsley, C.; Pattey, E. 13—Land Application of Digestate. In The Biogas Handbook; Wellinger, A., Murphy, J., Baxter, D., Eds.; Woodhead Publishing Series in Energy; Woodhead Publishing: Sawston, UK, 2013; pp. 302–325. ISBN 978-0-85709-498-8. [Google Scholar]
- Takle, E.S.; Gutowski, W.J. Iowa’s Agriculture Is Losing Its Goldilocks Climate. Phys. Today 2020, 73, 26–33. [Google Scholar] [CrossRef]
- Pan, Z.; Arritt, R.W.; Takle, E.S.; Gutowski, W.J., Jr.; Anderson, C.J.; Segal, M. Altered Hydrologic Feedback in a Warming Climate Introduces a “Warming Hole”. Geophys. Res. Lett. 2004, 31, L17109. [Google Scholar] [CrossRef]
- Hatfield, J.L.; Wright-Morton, L.; Hall, B. Vulnerability of Grain Crops and Croplands in the Midwest to Climatic Variability and Adaptation Strategies. Clim. Chang. 2018, 146, 263–275. [Google Scholar] [CrossRef]
- Jin, Z.; Zhuang, Q.; Wang, J.; Archontoulis, S.V.; Zobel, Z.; Kotamarthi, V.R. The Combined and Separate Impacts of Climate Extremes on the Current and Future US Rainfed Maize and Soybean Production under Elevated CO2. Glob. Chang. Biol. 2017, 23, 2687–2704. [Google Scholar] [CrossRef]
- Pan, Z.; Andrade, D.; Segal, M.; Wimberley, J.; McKinney, N.; Takle, E. Uncertainty in Future Soil Carbon Trends at a Central U.S. Site under an Ensemble of GCM Scenario Climates. Ecol. Model. 2010, 221, 876–881. [Google Scholar] [CrossRef]
- Schulte, L.A.; Dale, B.E.; Bozzetto, S.; Liebman, M.; Souza, G.M.; Haddad, N.; Richard, T.L.; Basso, B.; Brown, R.C.; Hilbert, J.A.; et al. Meeting Global Challenges with Regenerative Agriculture Producing Food and Energy. Nat. Sustain. 2022, 5, 384–388. [Google Scholar] [CrossRef]
- Culman, S.W.; Snapp, S.S.; Ollenburger, M.; Basso, B.; DeHaan, L.R. Soil and Water Quality Rapidly Responds to the Perennial Grain Kernza Wheatgrass. Agron. J. 2013, 105, 735–744. [Google Scholar] [CrossRef]
- Nakagaki, N.; Wieczorek, M. Estimates of Subsurface Tile Drainage Extent for 12 Midwest States 2012; United States Geological Survey: Reston, VA, USA, 2016.
- Castellano, M.J.; Archontoulis, S.V.; Helmers, M.J.; Poffenbarger, H.J.; Six, J. Sustainable Intensification of Agricultural Drainage. Nat. Sustain. 2019, 2, 914–921. [Google Scholar] [CrossRef]
- Jin, C.; Sands, G.; Kandel, H.; Wiersma, J.; Hansen, B. Influence of Subsurface Drainage on Soil Temperature in a Cold Climate. J. Irrig. Drain. Eng. 2008, 134, 83–88. [Google Scholar] [CrossRef]
- Meersmans, J.; Van Wesemael, B.; De Ridder, F.; Fallas Dotti, M.; De Baets, S.; Van Molle, M. Changes in Organic Carbon Distribution with Depth in Agricultural Soils in Northern Belgium, 1960–2006. Glob. Chang. Biol. 2009, 15, 2739–2750. [Google Scholar] [CrossRef]
- Fernández, F.G.; Fabrizzi, K.P.; Naeve, S.L. Corn and Soybean’s Season-Long in-Situ Nitrogen Mineralization in Drained and Undrained Soils. Nutr. Cycl. Agroecosyst. 2017, 107, 33–47. [Google Scholar] [CrossRef]
- James, H.R.; Fenton, T.E. Water Tables in Paired Artificially Drained and Undrained Soil Catenas in Iowa. Soil Sci. Soc. Am. J. 1993, 57, 774–781. [Google Scholar] [CrossRef]
- Climate Action Reserve. Soil Enrichment Protocol: Reducing Emissions and Enhancing Soil Carbon Sequestration on Agricultural Lands; Version 1.1; Climate Action Reserve: Los Angeles, CA, USA, 2022. [Google Scholar]
- EPA. Inventory of U.S. Greenhouse Gas Emissions and Sinks: 1990–2021; EPA: Washington, DC, USA, 2023.
- Parkin, T.B.; Kaspar, T.C. Nitrous Oxide Emissions from Corn–Soybean Systems in the Midwest. J. Environ. Qual. 2006, 35, 1496–1506. [Google Scholar] [CrossRef]
- Parkin, T.B.; Kaspar, T.C.; Jaynes, D.B.; Moorman, T.B. Rye Cover Crop Effects on Direct and Indirect Nitrous Oxide Emissions. Soil Sci. Soc. Am. J. 2016, 80, 1551–1559. [Google Scholar] [CrossRef]
- Lawrence, N.C.; Tenesaca, C.G.; VanLoocke, A.; Hall, S.J. Nitrous Oxide Emissions from Agricultural Soils Challenge Climate Sustainability in the US Corn Belt. Proc. Natl. Acad. Sci. USA 2021, 118, e2112108118. [Google Scholar] [CrossRef]
- Guenet, B.; Gabrielle, B.; Chenu, C.; Arrouays, D.; Balesdent, J.; Bernoux, M.; Bruni, E.; Caliman, J.-P.; Cardinael, R.; Chen, S.; et al. Can N2O Emissions Offset the Benefits from Soil Organic Carbon Storage? Glob. Chang. Biol. 2021, 27, 237–256. [Google Scholar] [CrossRef]
- Elliott, E.T.; Paustian, K.; Frey, S.D. Modeling the Measurable or Measuring the Modelable: A Hierarchical Approach to Isolating Meaningful Soil Organic Matter Fractionations. In Proceedings of the Evaluation of Soil Organic Matter Models; Powlson, D.S., Smith, P., Smith, J.U., Eds.; Springer: Berlin/Heidelberg, Germany, 1996; pp. 161–179. [Google Scholar]
- Coleman, K.; Jenkinson, D.S. RothC-26.3—A Model for the Turnover of Carbon in Soil. In Proceedings of the Evaluation of Soil Organic Matter Models; Powlson, D.S., Smith, P., Smith, J.U., Eds.; Springer: Berlin/Heidelberg, Germany, 1996; pp. 237–246. [Google Scholar]
- Parton, W.J. The CENTURY Model. In Proceedings of the Evaluation of Soil Organic Matter Models; Powlson, D.S., Smith, P., Smith, J.U., Eds.; Springer: Berlin/Heidelberg, Germany, 1996; pp. 283–291. [Google Scholar]


| Measure | Min | Max | Mean | STD | Median | 90th Percentile |
|---|---|---|---|---|---|---|
| Silt (%) | 1 | 90 | 54 | 15 | 61 | 71 |
| Sand (%) | 0 | 96 | 19 | 17 | 9.5 | 41 |
| Clay (%) | 0 | 60 | 27 | 6 | 28 | 34 |
| SOM (%) | 0 | 85 | 4 | 3 | 3 | 6 |
| Bulk Density (g/cm3) | 0.2 | 1.7 | 1.3 | 0.1 | 1.3 | 1.5 |
| Mollic Thickness (cm) | 0 | 203 | 45 | 36 | 43 | 94 |
| SOC Stock (Mg/ha) | 0 | 2309 | 120 | 132 | 95 | 294 |
| Practice Intended to Increase SOC | Number of Sites/Studies | Length of Studies’ SOC Monitoring (years) | Sampling Depth (cm) | Approach | Treatments | References |
|---|---|---|---|---|---|---|
| Reduced Tillage | 7 | 12 | 0 to 60 | Sampled annually, with baseline * |
| [48] |
| Diversified Crop Rotations | 3 | 10–12 | 0 to 30–90 | Sporadic sampling, no baseline * |
| [40,41,49,50,51,52,53] |
| Conversion to Perennial Vegetation | 4 | 7–40 | 0 to 15–30 | Various, chronosequence, most without baseline * |
| [45,47,54,55] |
| Study Citation | Region in Iowa (Nearest City) | Soil Texture | Classification Based on USDA’s Soil Taxonomy | Years since Conversion | Cropland SOC (Mg C ha−1) | Restored Perennial Grassland SOC (Mg C ha−1) | Native Prairie Remnant SOC (Mg C ha−1) | SOC Accrual Rate (Mg C ha−1 y−1) | Significant Difference between Crop and Restored Grassland |
|---|---|---|---|---|---|---|---|---|---|
| [47] | Central (Prairie City, IA) | Silty clay loam | Aquertic and Typic Argiudolls | 14 | 44 | 35–39 | 55 | 0.74 | Variable |
| [54] | Central (Prairie City, IA) | Silty clay loam | Oxyaquic, Aquertic, and Typic Argiudolls | 21 | 25 | 40 | 58 | 0.59 | NA |
| [45] | Central (Boone, IA) | Clay loam | Typic Endoaquoll, Aquic Hapludoll | 7 | 55 | 60 | NA | 0.71 † | No |
| [55] | North central (Various) | Various | Various | 40 | 49 | 54 | 60 | 0.21 | Yes |
Disclaimer/Publisher’s Note: The statements, opinions and data contained in all publications are solely those of the individual author(s) and contributor(s) and not of MDPI and/or the editor(s). MDPI and/or the editor(s) disclaim responsibility for any injury to people or property resulting from any ideas, methods, instructions or products referred to in the content. |
© 2023 by the authors. Licensee MDPI, Basel, Switzerland. This article is an open access article distributed under the terms and conditions of the Creative Commons Attribution (CC BY) license (https://creativecommons.org/licenses/by/4.0/).
Share and Cite
Jordahl, J.; McDaniel, M.; Miller, B.A.; Thompson, M.; Villarino, S.; Schulte, L.A. Carbon Storage in Cropland Soils: Insights from Iowa, United States. Land 2023, 12, 1630. https://doi.org/10.3390/land12081630
Jordahl J, McDaniel M, Miller BA, Thompson M, Villarino S, Schulte LA. Carbon Storage in Cropland Soils: Insights from Iowa, United States. Land. 2023; 12(8):1630. https://doi.org/10.3390/land12081630
Chicago/Turabian StyleJordahl, Jim, Marshall McDaniel, Bradley A. Miller, Michael Thompson, Sebastian Villarino, and Lisa A. Schulte. 2023. "Carbon Storage in Cropland Soils: Insights from Iowa, United States" Land 12, no. 8: 1630. https://doi.org/10.3390/land12081630
APA StyleJordahl, J., McDaniel, M., Miller, B. A., Thompson, M., Villarino, S., & Schulte, L. A. (2023). Carbon Storage in Cropland Soils: Insights from Iowa, United States. Land, 12(8), 1630. https://doi.org/10.3390/land12081630