Article

Quantifying Damages to Soil Health and Emissions from Land Development in the State of Illinois (USA)

1
Department of Forestry and Environmental Conservation, Clemson University, Clemson, SC 29634, USA
2
Arkansas Forest Resources Center, University of Arkansas Division of Agriculture, University of Arkansas System, Monticello, AR 71656, USA
3
College of Forestry, Agriculture, and Natural Resources, University of Arkansas at Monticello, Monticello, AR 71656, USA
4
Department of Biological Science and Biotechnology, Minnan Normal University, Zhangzhou 363000, China
5
University Key Lab for Geomatics Technology and Optimized Resources Utilization in Fujian Province, No. 15 Shangxiadian Road, Fuzhou 350002, China
6
Department of Environmental Engineering and Earth Sciences, Clemson University, Anderson, SC 29625, USA
7
Geography Department, Portland State University, Portland, OR 97202, USA
8
School of Law, Emory University, Atlanta, GA 30322, USA
*
Author to whom correspondence should be addressed.
Land 2023, 12(8), 1567; https://doi.org/10.3390/land12081567
Submission received: 1 July 2023 / Revised: 27 July 2023 / Accepted: 28 July 2023 / Published: 8 August 2023
(This article belongs to the Special Issue Soil Management for Soil Health)

Abstract

:
The concept of soil health is increasingly being used as an indicator for sustainable soil management and even includes legislative actions. Current applications of soil health often lack geospatial and monetary analyses of damages (e.g., land development), which can degrade soil health through loss of carbon (C) and productive soils. This study aims to evaluate the damages to soil health (e.g., soil C, the primary soil health indicator) attributed to land developments within the state of Illinois (IL) in the United States of America (USA). All land developments in IL can be associated with damages to soil health, with 13,361.0 km2 developed, resulting in midpoint losses of 2.5 × 10¹¹ of total soil carbon (TSC) and a midpoint social cost of carbon dioxide emissions (SC-CO2) of $41.8B (where B = billion = 109, USD). More recently developed land area (721.8 km2) between 2001 and 2016 likely caused the midpoint loss of 1.6 × 10¹⁰ kg of TSC and a corresponding midpoint of $2.7B in SC-CO2. New developments occurred adjacent to current urban areas near the capital cities of Springfield, Chicago, and St. Louis (the border city between the states of Missouri and IL). Results of this study reveal several types of damage to soil health from developments: soil C loss, associated “realized” soil C social costs (SC-CO2), and loss of soil C sequestration potential from developments. The innovation of this study has several aspects. Geospatial analysis of land cover combined with corresponding soil types can identify changes in the soil health continuum at the landscape level. Because soil C is a primary soil health indicator, land conversions caused by developments reduce soil health and the availability of productive soils for agriculture, forestry, and C sequestration. Current IL soil health legislation can benefit from this landscape level data on soil C loss with GHG emissions and associated SC-CO2 costs by providing insight into the soil health continuum and its dynamics. These techniques and data can also be used to expand IL’s GHG emissions reduction efforts from being solely focused on the energy sector to include soil-based emissions from developments. Current soil health legislation does not recognize that soil’s health is harmed by disturbance from land developments and that this disturbance results in GHG emissions. Soil health programs could be broadened to encourage less disturbance of soil types that release high levels of GHG and set binding targets based on losses in the soil health continuum.

1. Introduction

The concept of soil health and its definition are gaining popularity among scientists, practitioners, and even legislators [1]. Although the definition of soil health is constantly evolving, it is commonly defined as the capacity of soil functions to sustain life (e.g., crop production plus additional ecosystem services such as soil biodiversity, regulating water, cycling nutrients, etc. [1]), which is based on the intersection of soil type and land cover and/or land use/land cover (LULC) change over time and scale [2]. Most soil health testing protocols include evaluation of soil organic matter (SOM), soil acidity (pH), plant-available potassium and phosphorus, bulk density, and water storage [1]. Among these properties, SOM and soil C are often considered the most important soil health indicators [1,2].
Previous research has focused primarily on developing soil health measurement methods and applying them to mostly agronomic systems; however, there is considerable interest in expanding the range of soil health indicators as well as their assessment methods [1]. This new focus is driven by a societal need to address a broader scope of environmental problems in addition to agronomic needs [1]. One of these needs is managing soil health for climate change mitigation, which has been largely ignored [1]. It is not enough to measure soil C; this measurement needs to be tied to GHG emissions, which have been identified as a challenge because of the variable rate of release of GHG emissions depending on environmental conditions (e.g., temperature, moisture). Another issue is how to generalize these measurements from fields to represent regions. This study proposes to enhance current soil health evaluation techniques using a rapid geospatial analysis leveraging remote sensing that identifies the magnitude of GHG emissions caused by land development (Figure 1). This newly proposed method can potentially be used for landscape-level identification of changes in the soil health continuum where increased soil disturbance is associated with lower soil health [2]. Furthermore, this study connects soil C emissions from land disturbance with SC-CO2, which allows the translation of soil C loss to a monetary value that can be potentially linked to soil health. This landscape-level analysis identifies emission hotspots from land cover change that can help prioritize soil health measurements in interlinked forest, agricultural, and urban systems. This research utilizes the state of IL as an example to evaluate soil C loss and emissions caused by land development to support the plans in IL’s legislation related to soil health that call for research and surveys [3].

The Role of Soils in Illinois’ Soil Health and Climate Actions

On 23 August 2019, IL passed an amendment to the Soil and Water Conservation District Act (Public Act 101-0484), which declared that soil conservation, soil health, and SOM were in the public interest [3]. Furthermore, this amendment relied on a soil health definition as “the overall composition of the soil, including the amount of organic matter stored in the soil, and the continued capacity of soil to function as a vital living ecosystem that sustains plants, animals, and humans” [3]. This amendment also directs that surveys and research should be conducted and that comprehensive soil health improvement plans should be developed to improve soil health [3]. Although IL has legislation on clean energy with the goal of 100% renewable energy by 2050 (Public Act 102-0662), it does not address soil-based GHG emissions [4].
The soil diversity (pedodiversity) of Illinois is described by six soil orders, which are comprised of strongly weathered soils (Ultisols), moderately weathered soils (Mollisols, Alfisols), and slightly weathered soils (Histosols, Inceptisols, and Entisols), with various inherent soil health capacities (Table S1 and Figure 2). Illinois has selected the State Soil as Drummer (soil order: Mollisols) because it is the most extensive and productive soil (prime farmland) in the state [5]. The soils of IL contribute numerous ecosystem services (cultural, regulation/maintenance, and provisioning) within the state’s economic development regions (Figure 2) [6].
Illinois has been facing multiple impacts from climate change, including increasing atmospheric temperatures and precipitation, more frequent flooding; intensification of weather extremes, and many others [9,10]. These impacts can have various effects on soil health and its chemical, physical, and biological indicators. For example, increased atmospheric precipitation may intensify soil erosion, soil acidification, and nutrient leaching from soil [11]. An increase in atmospheric temperatures may elevate the soil C loss from accelerated SOM decomposition [12]. Climate change impacts soil health within large geographic areas in comparison with agricultural practices, which are often limited within an agricultural field [13]. Land use/land cover change can exacerbate soil health status in a changing climate [14]. In a similar way to climate change impacts, land cover change affects large geographic areas [14].
The present study hypothesizes that the soil health continuum (soil health status that varies with soil type and LULC [2]) can be represented by mapping soil type and LULC. Furthermore, individual soil health indicators associated with soil type and LULC can be joined so that the impact of land cover change can be evaluated based on the soil types. For example, this study examines the link between soil C, a key soil health indicator, and potential GHG emissions because of land cover change within IL between 2001 and 2016. Soil health should be considered from individual farmers’ fields to the landscape level, and these types of data should be used together to develop overall soil health databases that can be tracked over time with changing management and land cover changes. Individual soil health indicators can be tracked using the proposed soil health database system because there is also a need to connect individual soil health indicators to soil functions and ecosystem services (e.g., GHG emissions and C sequestration).
Illinois is not the only state that has addressed soil health through legislation. In fact, several states have recently passed such legislation or have legislation pending [15]. Since 2016, 10 states have enacted one or more statutes addressing soil health, while another 22 states have soil-health legislation pending [15]. Research has begun to examine aspects of this legislation and other aspects of soil health. The passed and proposed legislation has focused primarily on water quality and soil C sequestration and has typically been supported by a range of different stakeholders and coalitions [16]. Additional needs with regard to soil management are standardized soil health evaluation methods [1] and economic models to demonstrate the benefits of soil health for producers and policymakers [17].
Our present paper fills a gap in this literature, noting for the first time that the current understanding of soil health at the landscape level is incomplete. Any disturbance of soil, whether for agricultural purposes or some other purpose such as development, reduces soil health because the act of disturbing the soil releases GHG. Accordingly, the application of the soil health concept should be broadened to include the degree to which soil is disturbed. This is especially true for types of soils whose disturbance releases much GHG. Methods should be created that allow soil health mapping over time and over larger spatial extents [18]. This would provide opportunities to manage soil health across fields, forests, and urban areas, not solely at the agricultural field scale. Also, soil health metrics may vary depending on current or future land use, which is another motivation to examine soil health on a landscape scale.
The aims of this study were to: (1) map the continuum of soil health using soil and land cover analysis; (2) connect soil C (a key soil health indicator) to potential GHG emissions from C loss; (3) determine soil C quantities of soil inorganic carbon (SIC), soil organic carbon (SOC), and total soil carbon (TSC) within IL, and (4) evaluate the soil C change over a 15-year time period formulated from the avoided emissions from C sequestration and the social cost of C (SC-CO2), assumed to be $46 for each metric ton of CO2 emitted (applicable for the year 2025 using 2007 U.S. dollars and an average discount rate of 3% provided by the US Environmental Protection Agency (EPA)) [19]. This study gives estimates of monetary values for SOC, SIC, TSC, and within IL at different levels of aggregation using the Soil Survey Geographic Database (SSURGO), State Soil Geographic (STATSGO), the information provided by Guo et al., (2006) [20], and the framework in Table S2 [21].

2. Materials and Methods

Land use/land cover (LULC) change for IL was analyzed from 2001 to 2016 by utilizing previously classified land cover spatial datasets created from Landsat satellite image mosaics at a 30-m resolution acquired from the Multi-Resolution Land Characteristics Consortium (MRLC), which lists detailed information on the classes and methods used on its website [22]. Land cover changes, including their soil types, were calculated using ArcGIS Pro 2.6 [23] using the 2001 and 2016 data and by converting the raster land cover data to a vector format and then performing a union operation on the resulting dataset with the soils data from the same spatial extent from the Soil Survey Geographic (SSURGO) Database, which provides the most detailed soils data available at the national level at various taxonomic categories [7].
Monetary values associated with soil health indicators such as SIC, SOC, and TSC in IL were determined using both science-based biophysical and boundary-based administrative accounting methods (Figure 2 and Table S2). Reported estimated contents (kg m−2) of SIC, SOC, and TSC are from Guo et al. (2006) [20] and were subsequently valued using the social cost of carbon (SC-CO2) value of $46 per metric ton of CO2 from the EPA [19] (Table S3). The EPA’s SC-CO2 value was developed as a comprehensive climate change damage estimate. It is important to note that this monetary value is likely an underestimation of the true costs and damages from CO2 emissions because of the exclusion of multiple climate change impacts that have been identified in the scientific literature [19]. Equation (1) was used to determine area-normalized monetary values ($ m−2), and total monetary estimates were determined by summing over the appropriate spatial boundary (given a metric tonne is equal to 1000 kg (kg) or 1 megagram (Mg), and SC = soil carbon):
$ m 2 = S C   C o n t e n t , k g m 2 × 1   M g 10 3   k g × 44   M g   C O 2 12   M g   S C × $ 46 M g   C O 2
For example, for the Mollisols soil order, Guo et al., (2006) [20] provided a midpoint SOC content estimate of 13.5 kg m−2 (2-m soil depth; Table S3). When this SOC content value is used in Equation (1), an area-normalized SOC value of $2.28 m−2 is calculated. When the SOC content and its corresponding area-normalized value are multiplied by the total area of Mollisols in IL (52,808.2 km2), a predicted SOC stock of 7.1 × 10¹¹ kg with a corresponding monetary value of $120.4B is calculated.

3. Results

Soil should be seen as a non-renewable resource that contains differing C contents. The estimated total mid-point monetary SC-CO2 and storage values for TSC within IL (2016) were $386.9B (i.e., $386.9B billion U.S. dollars, where B = billion = 109) and 2.3 × 10¹² kg C, respectively (Table 1). From these total estimates, SOC represented 60% of the total value (1.4 × 10¹² kg C, $232.4B), and SIC represented 40% of the total value (9.2 × 10¹¹ kg C, $154.5B). We have reported previously that the state of IL ranked 18th for SOC [24], 15th for SIC [21], and 17th for TSC [25] for the SC-CO2 values among the 48 conterminous U.S. states. This overall SOC accounting at the state level provides a key metric to evaluate the overall soil health of the “soil bank.” It should be noted that soil health assessments do not typically include SIC, which is directly related to soil pH, which is a common soil health indicator. These calculations, including SC-CO2, provide a mechanism to link soil C storage to potential GHG emissions from C loss and the concept of “avoided” vs. “realized” SC-CO2. One of the newest priorities in soil health research is to link SOC to GHG emissions and climate change. This type of landscape-level “soil bank” assessment provides a critical picture of the overall soil resources and how they can be damaged by land cover change. Field level measurements, which are common in soil health evaluations, can serve to update and inform field level changes to SOC, which again impact the overall “soil bank”.

3.1. SOC Storage and Value by County and Soil Order for Illinois (IL)

Soil orders in IL with the highest midpoint storage and monetary SOC estimates were Mollisols (7.1 × 10¹¹ kg C, $120.4B), Alfisols (4.2 × 10¹¹ kg C, $71.1B), and Histosols (1.2 × 10¹¹ kg C, $20.7B) (Table S4). Almost 52% of SOC is from the Mollisol soil order. Counties in IL with the highest estimated midpoint SOC contents included Iroquois (3.4 × 10¹⁰ kg C, $5.7B), LaSalle (3.2 × 10¹⁰ kg C, $5.5B), and Champaign (3.1 × 10¹⁰ kg C, $5.4B).

3.2. SIC Storage and Value by County and Soil Order for Illinois (IL)

Soil orders in IL with the highest midpoint storage and monetary SIC estimates were Mollisols (6.1 × 10¹¹ kg C, $101.9B), Alfisols (2.4 × 10¹¹ kg C, $40.3B), and Entisols (4.5 × 10¹⁰ kg C, $7.7B) (Table S4). The preponderance of SIC was from the Mollisols soil order. Counties in IL with the highest midpoint SIC values included Champaign (2.7 × 10¹⁰ kg C, $4.5B), LaSalle (2.6 × 10¹⁰ kg C, $4.4B), and McLean (2.3 × 10¹⁰ kg C, $3.9B).

3.3. TSC (SOC + SIC) Value and Storage by County and Soil Order for Illinois (IL)

Soil orders with the highest midpoint monetary value and storage for TSC were Mollisols (1.3 × 10¹² kg C, $222.3B), Alfisols (6.6 × 10¹¹ kg C, $111.4B), and Histosols (1.2 × 10¹¹ kg C, $21.1B) (Table S4). Counties in IL with the highest midpoint TSC values included LaSalle (5.9 × 10¹⁰ kg C, $9.9B), Champaign (5.8 × 10¹⁰ kg C, $9.8B), and Iroquois (5.7 × 10¹⁰ kg C, $9.6B).

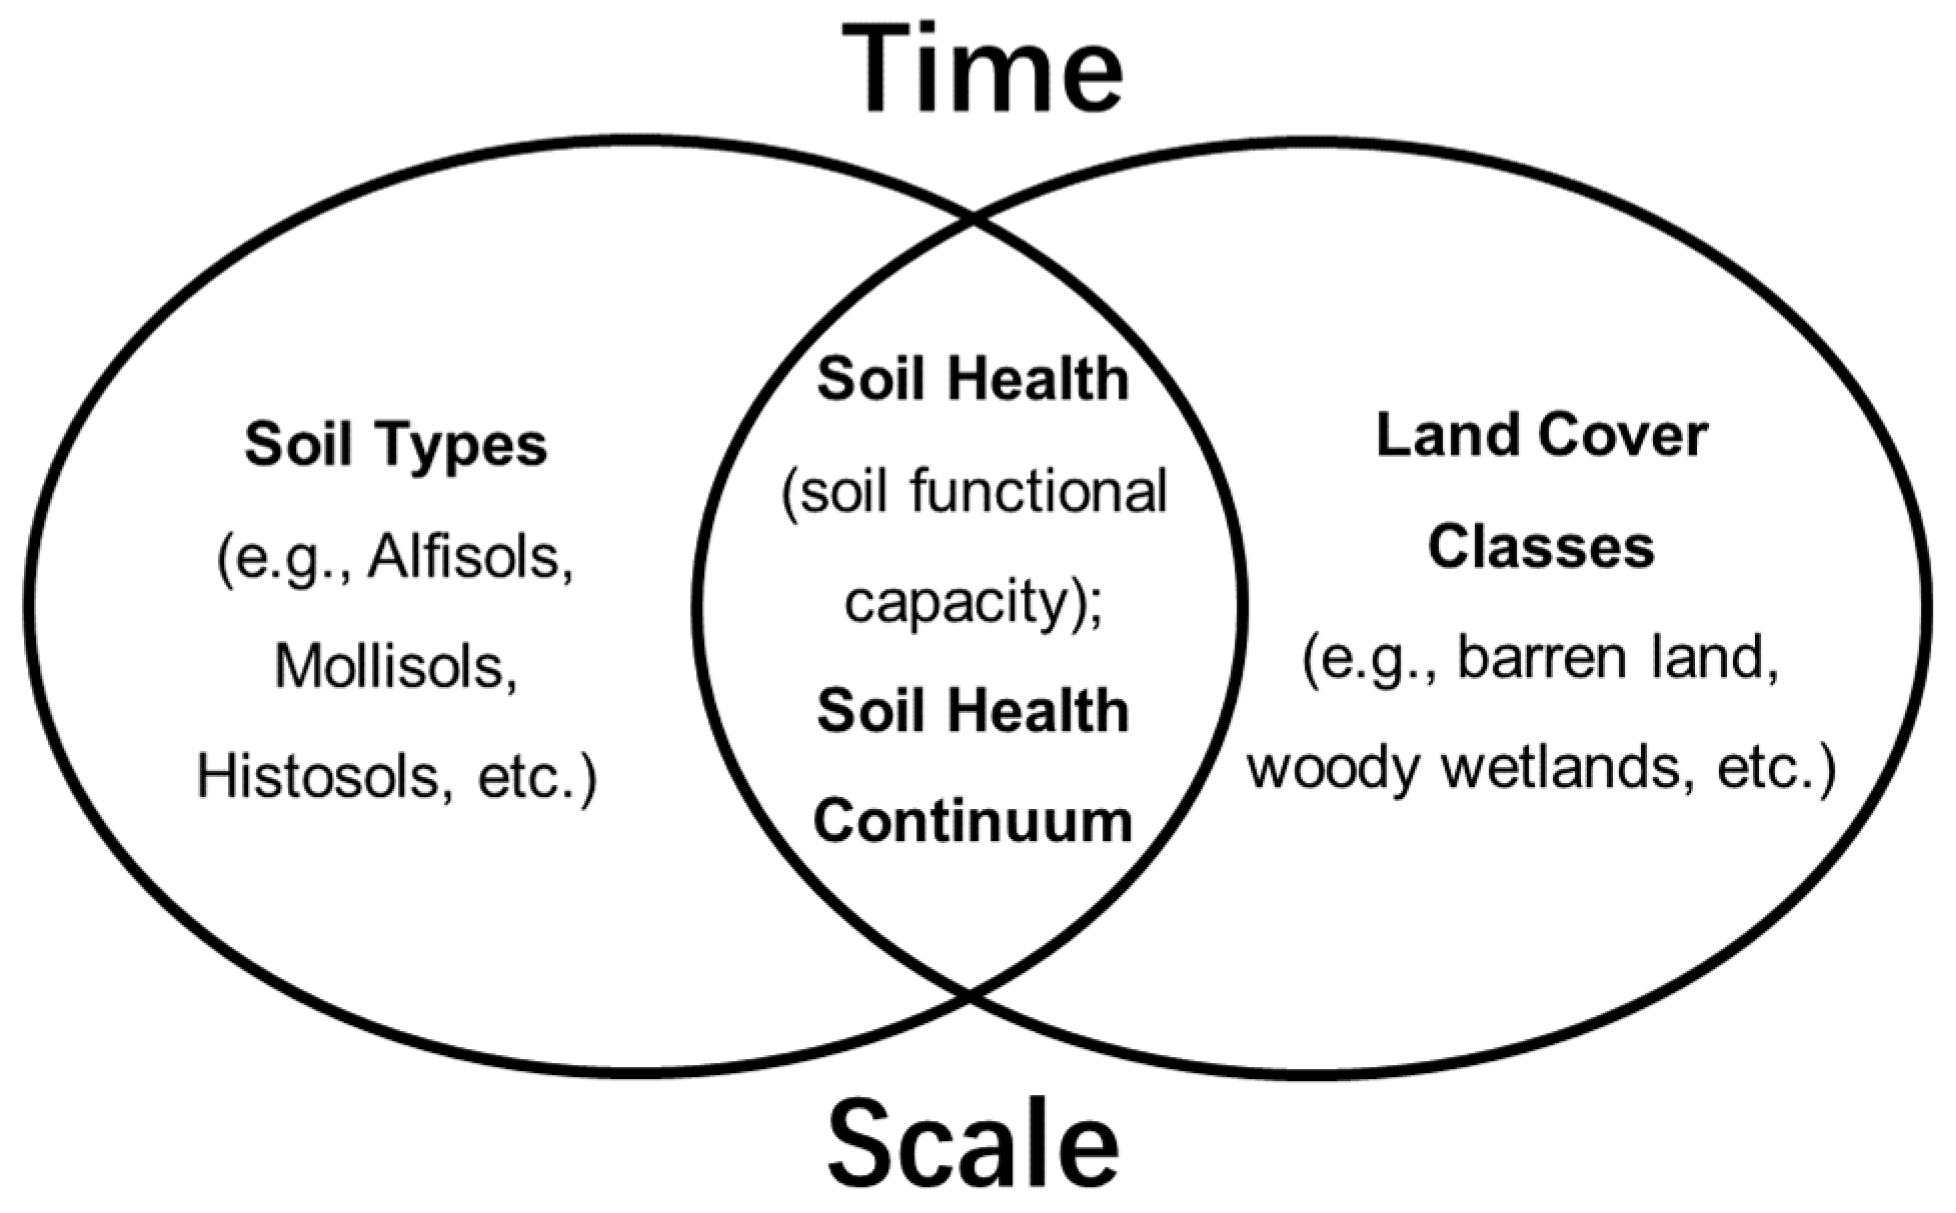
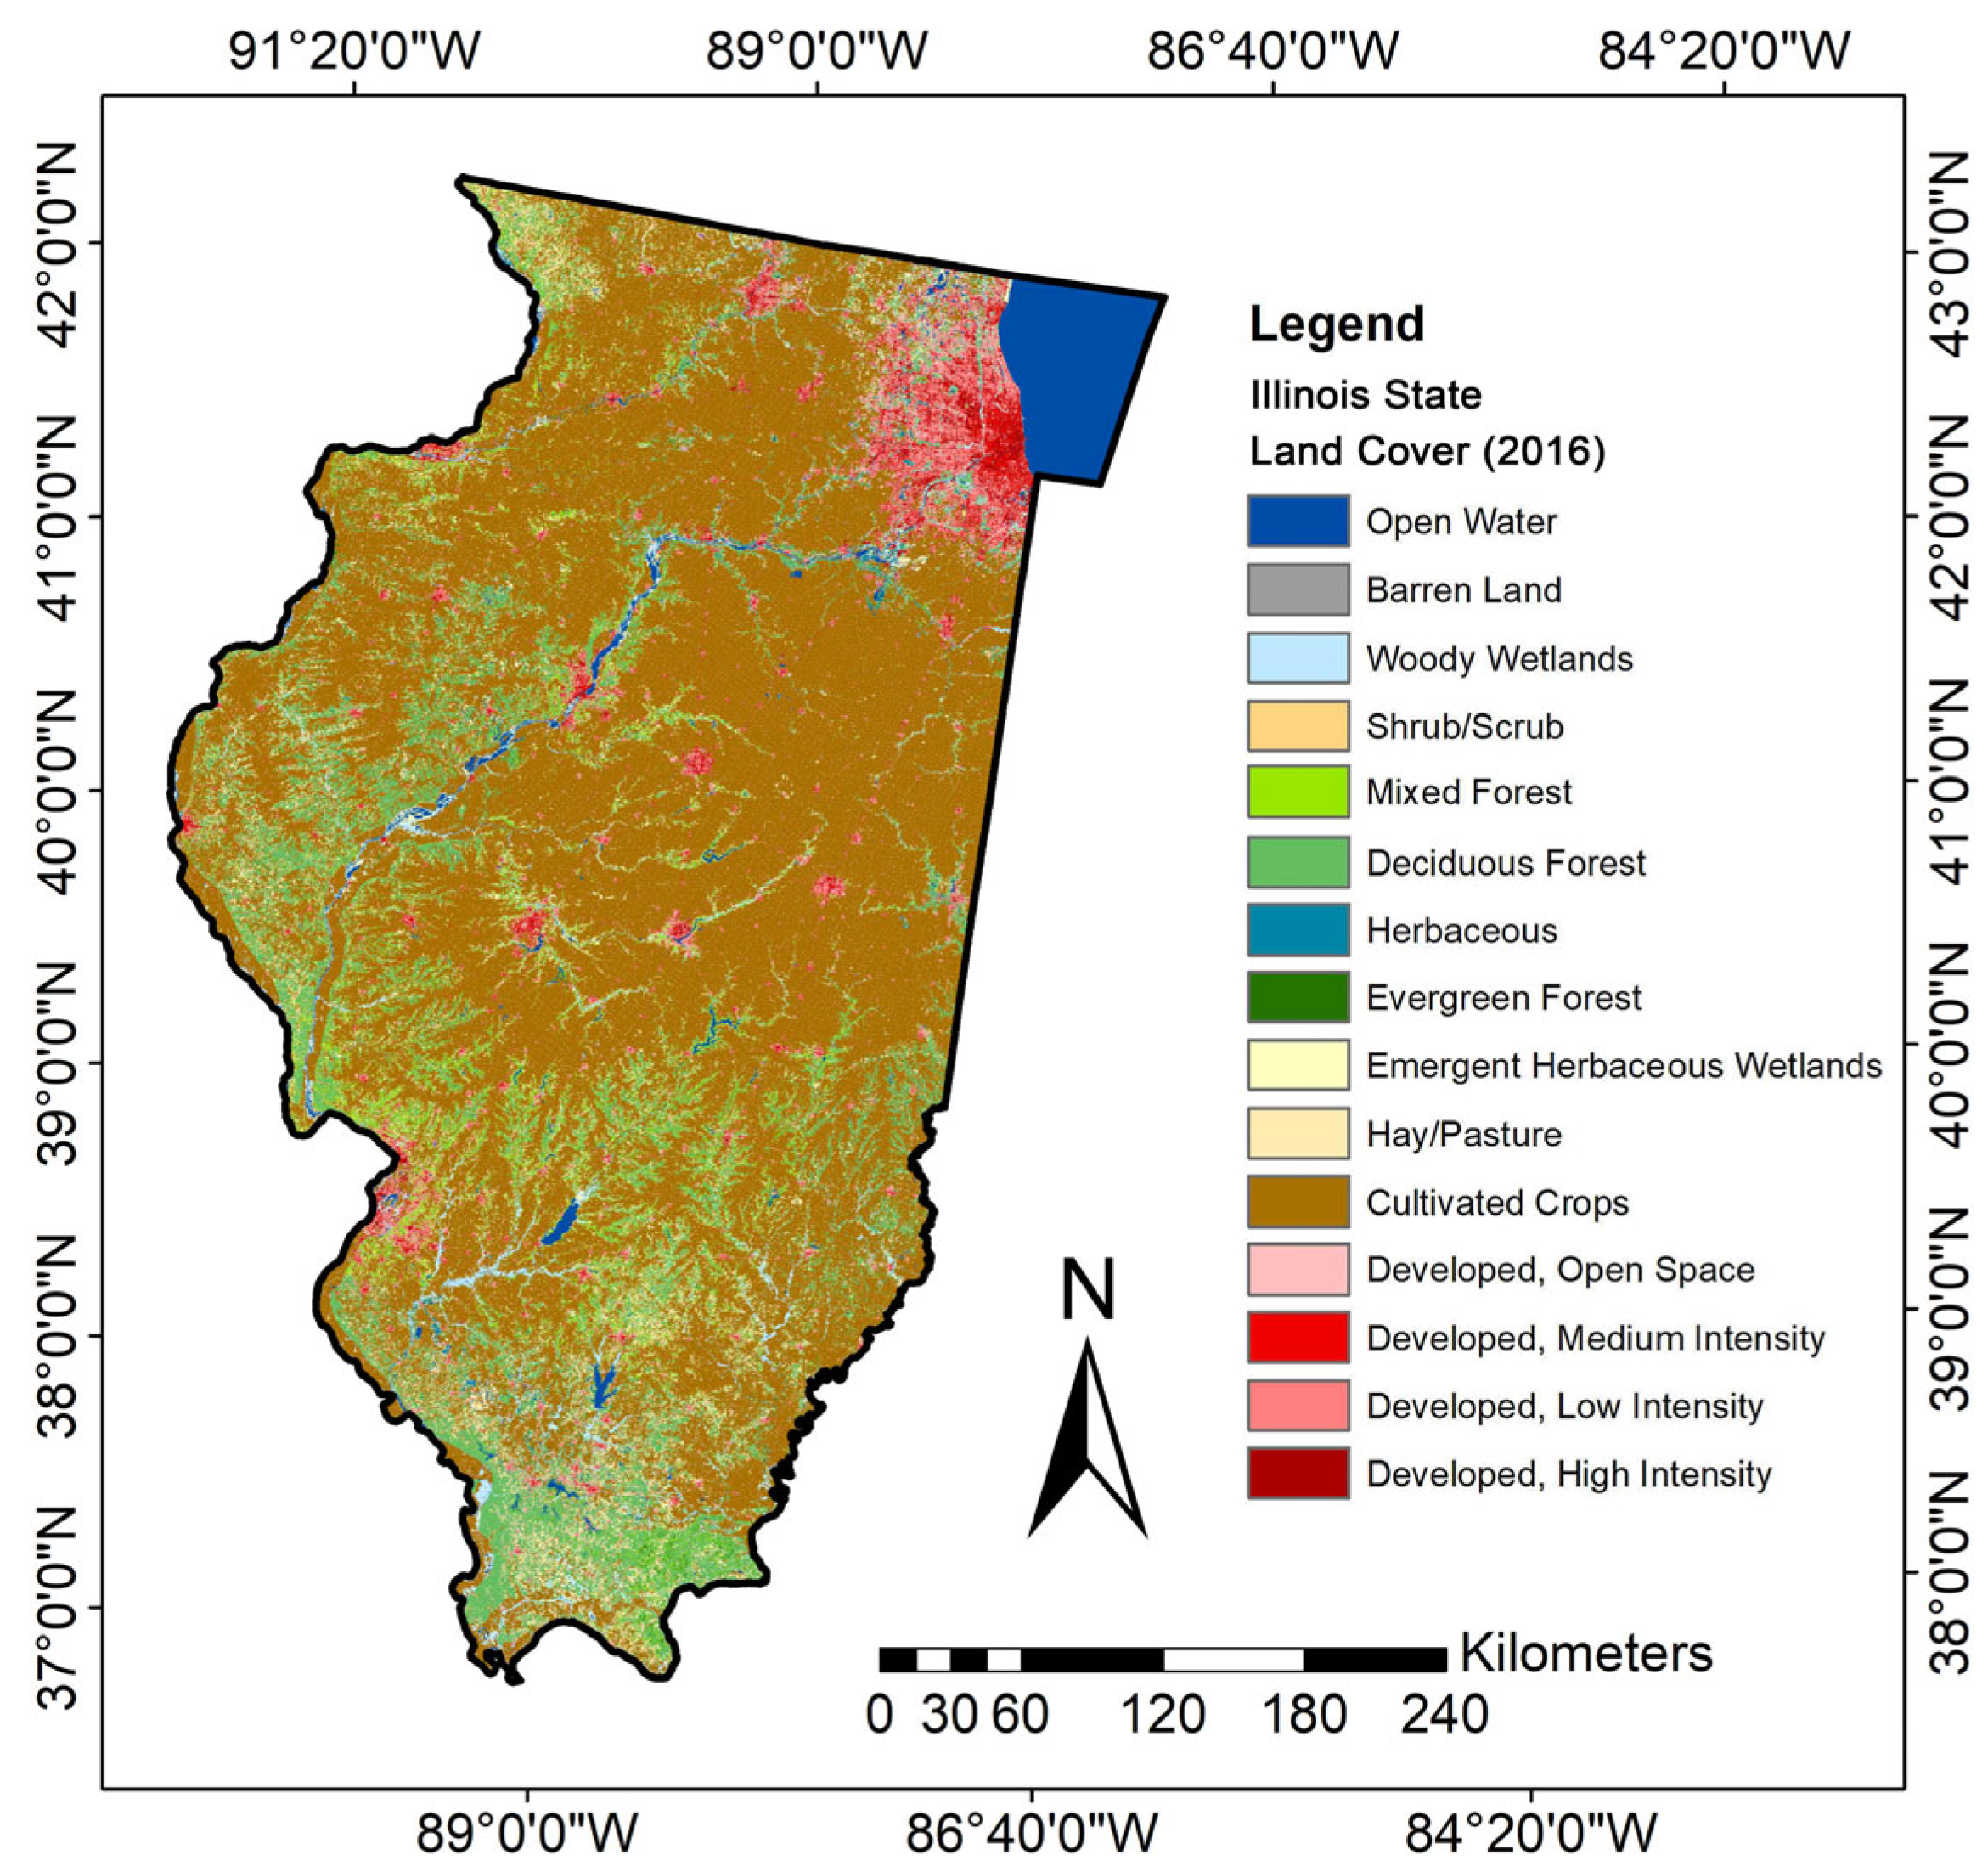
3.4. Land Use/Land Cover in the State of Illinois (IL) in 2016 and the Soil Health Continuum

The 2016 land cover with related soil types (Figure 3, Table 2) represents the overall soil health continuum (sequence of soil health status that varies with soil type and LULC [2]). Table 2 shows areas of various land covers by soil order that are linked to land uses with varying degrees of soil disturbance that range from low disturbance (e.g., woody wetlands, emergent herbaceous wetlands, evergreen forest, deciduous forest, mixed forest, herbaceous, shrub/scrub, hay/pasture), medium disturbance (e.g., cultivated crops), and high disturbance (e.g., developments of various intensities). In IL, the soil health continuum is dominated by medium disturbance (cultivated crops), which constitutes more than 60% of the land area. More than 10% of the state land area has a high degree of soil disturbance under developed land use, and about 30% of the soil health continuum is in low disturbance land cover. Figure 3 complements Table 2 by helping to visualize the distribution and concentration of land cover types, which indicate disturbance levels at the county level. By also considering the spatial distribution of soils shown in Figure 2, it is possible to understand the relationship between soil types and land covers (e.g., Mollisols and Alfisols in cultivated crop areas).
Soils have inherent or “natural” soil health associated with their physical and chemical properties without human disturbance. This can be difficult to assess given the wide human disturbance of soil worldwide and the land cover change and different management within a particular land cover (e.g., tilling cultivated cropland). If known or if it can be estimated, this could provide a valuable baseline to understand the many impacts of various land use practices. Illinois is predominately composed of medium- and high-disturbance land covers.
Soil health is most often described in an agronomic context, driven by agronomic practices and soil testing, which are linked to food production. This often includes soil physical (e.g., available water capacity, soil hardness), biological (e.g., SOM, soil respiration), and chemical (e.g., soil pH, extractable phosphorus, and potassium); however, it does not provide an overall indication of the available soil resources or “soil bank” at the landscape and administrative scales. Soil resources expand beyond agronomic uses, and land cover conversions can greatly alter soil health and the overall availability of soil to support humans, plants, and animals. In a larger context, land use decisions that impact soil health can also directly and indirectly impact human health (e.g., GHG emissions that contribute to climate change).

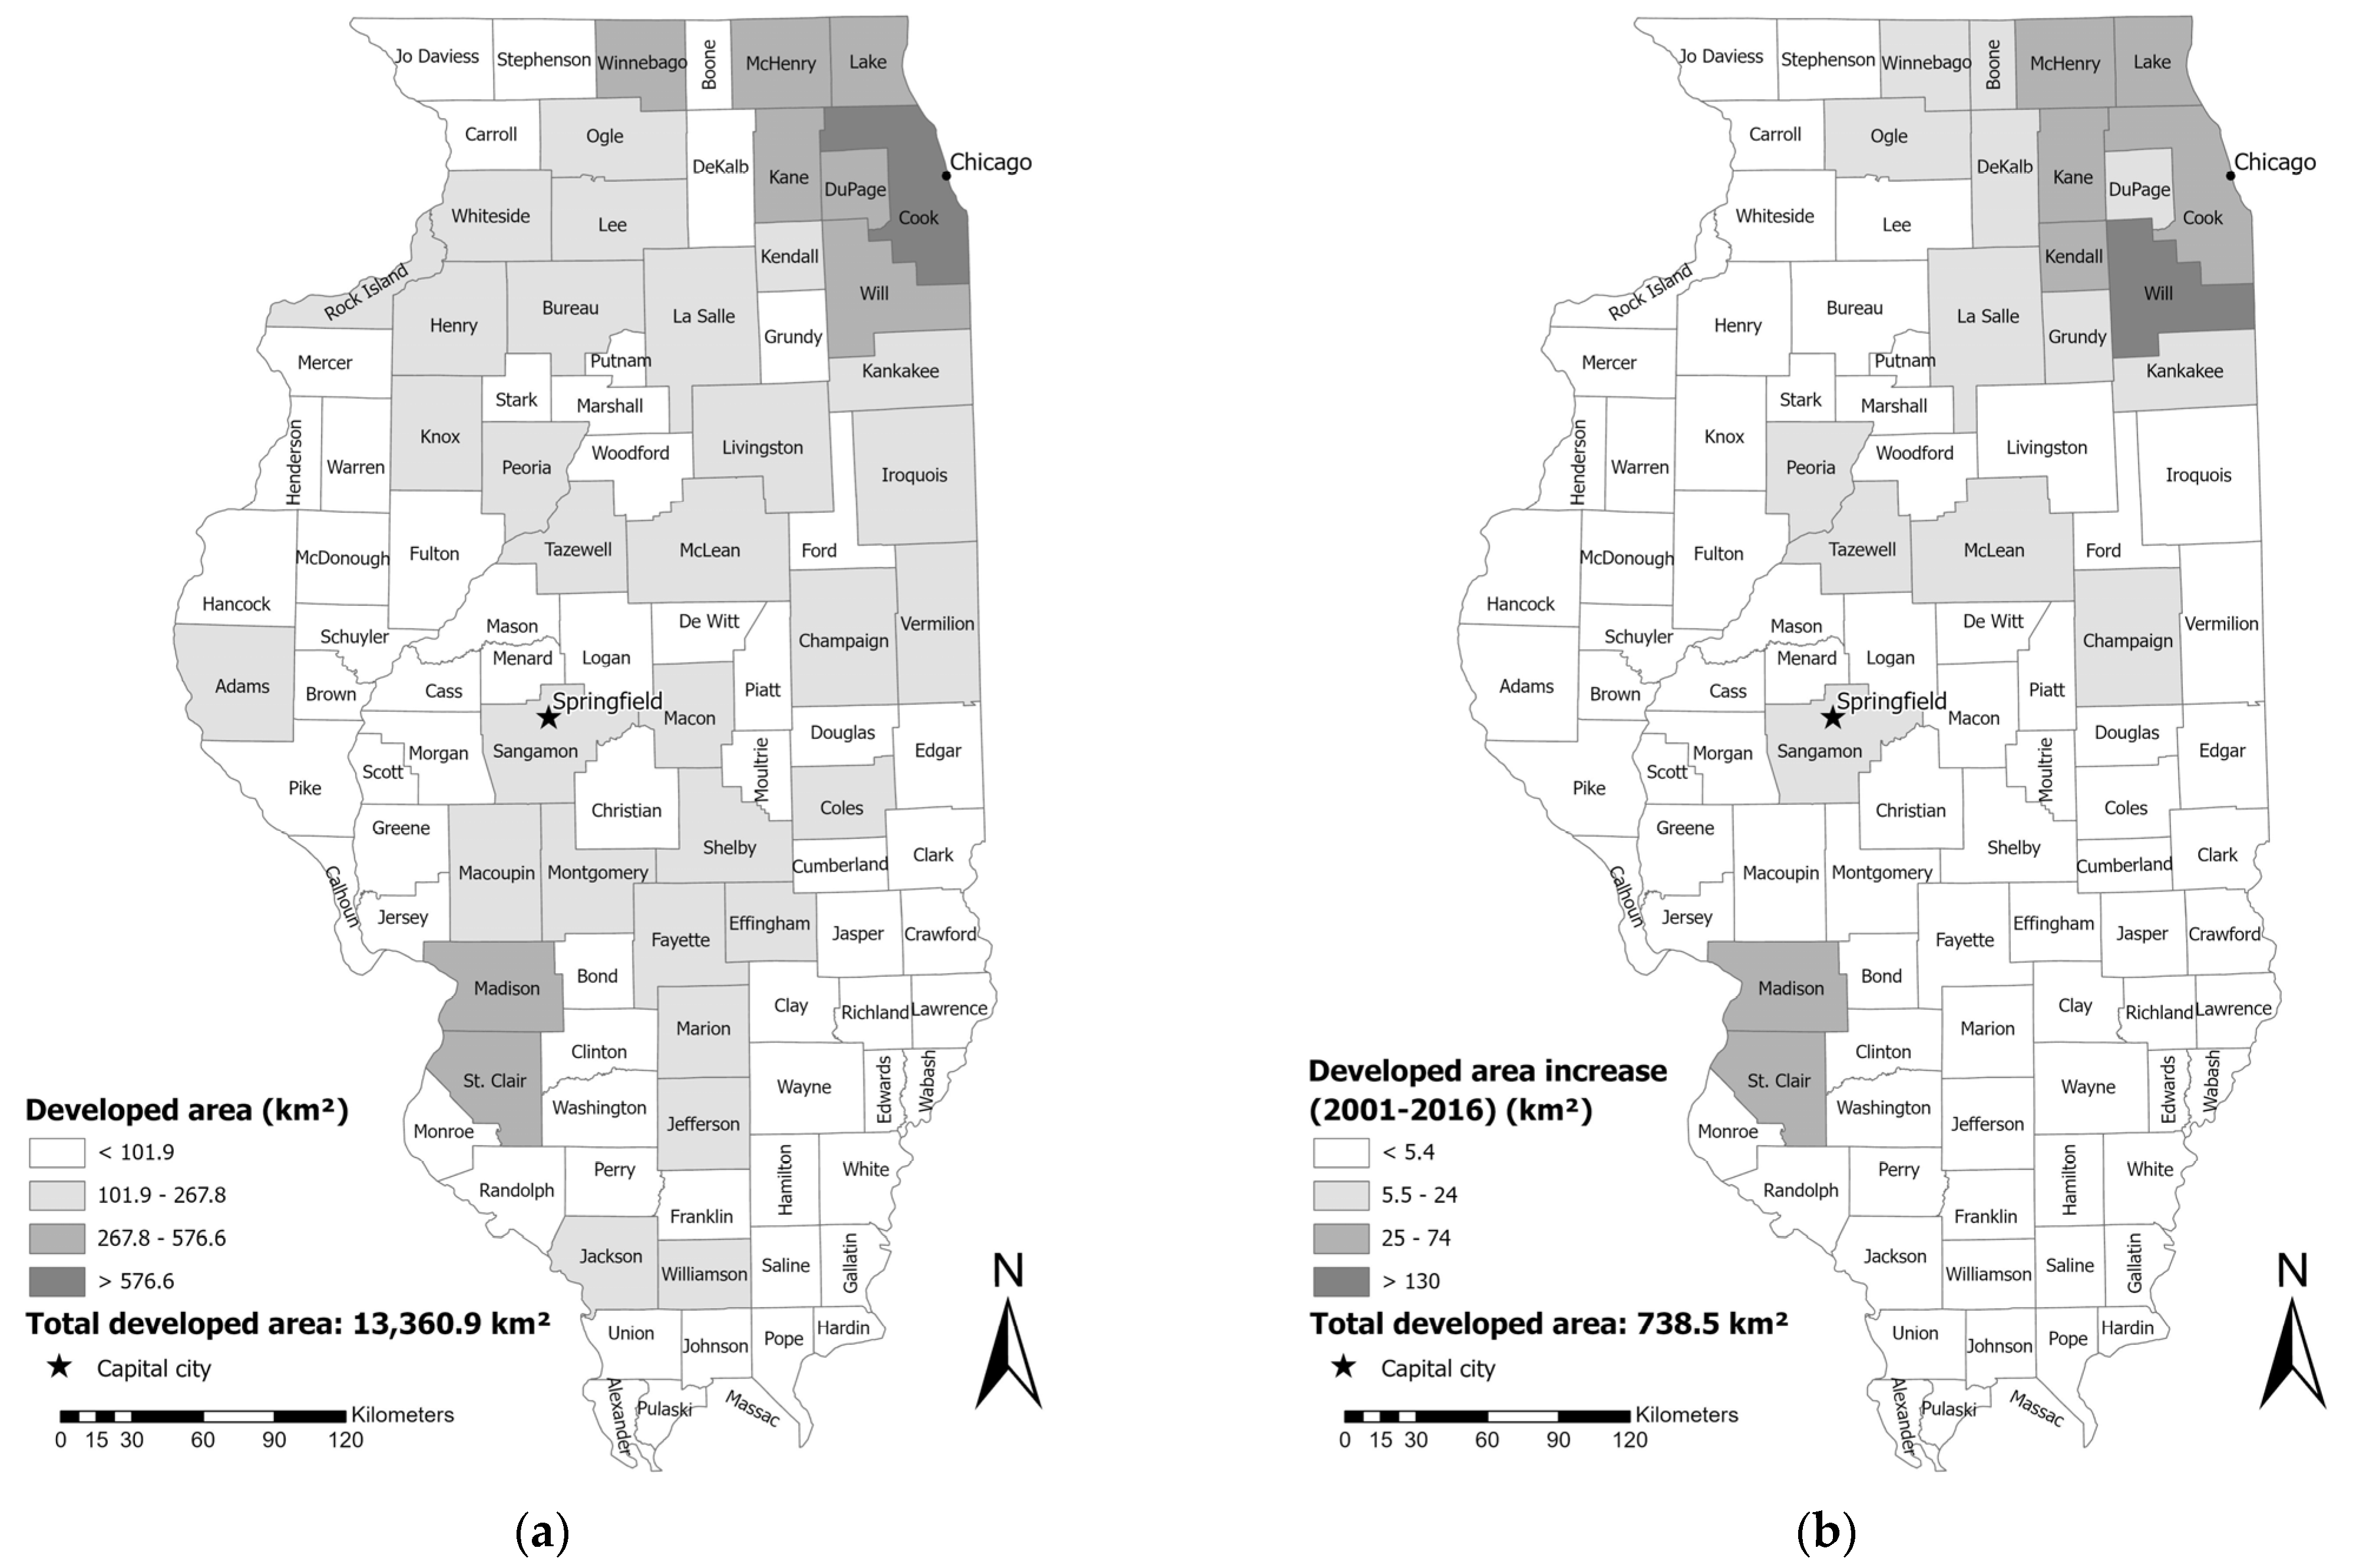
3.5. Land Use/Land Cover Change in the State of Illinois (IL) from 2001 to 2016 and the Soil Health Continuum Dynamics

The soil health continuum is not static because land cover and land use change with time. There are land conversions that have the potential to improve soil health (e.g., change from cultivated crops to forest or pasture); however, the majority of land cover change increases the level of disturbance, which can cause deteriorating soil health or even “soil death” when soil is no longer providing ecosystem services that help sustain plant, animal, or human health (e.g., forest to developed, high intensity).
The state of IL had substantial LULC transitions over the 15-year evaluation period (Table 3, Figure 3), causing soil C loss, a key soil health indicator, as well as GHG emissions from soils caused by developments in place of C retention or sequestration under alternative land covers. The total developed area increase from 2001 to 2016 was 721.8 km2, which caused a loss of 1.6 × 10¹⁰ kg of TSC, resulting in $2.7B in SC-CO2 (Table 4). All of IL’s counties and economic development regions have seen LULC changes over time. The soil health continuum changed by soil order and LULC classification, with the majority of soil orders having reductions in “low disturbance” LULC classes (e.g., hay/pasture, evergreen forest) while increasing in areas with “developed” LULC classes. The largest percentage increases in land area were seen in the LULC land classes associated with high-intensity (+16.7%) and medium-intensity (+11.3%) developed classes (Table 3). Land Use/Land Cover changes also varied by soil order. When considering the high-intensity developed LULC class, large increases were seen in the soil orders of Ultisols (+100%), Mollisols (+35.2%), and Inceptisols (+30.1%). Histosols, which are typically carbon-rich, experienced increases in all development categories.
Development associated with Histosols was linked to a related loss of emergent herbaceous wetlands (−2.0%) despite wetlands commonly being protected through legislation at the federal and state levels. Twenty-one (out of 102) counties in IL had increases in developments in Histosols. These increases in developments were at the expense of land covers associated with C sequestration, including mixed forest (−7.7%), deciduous forest (−5.0), and evergreen (−6.1%), as well as emergent herbaceous wetlands (−2.0%), hay/pasture cover (−15.1%), and cultivated crops (−0.9) (Table 3). There was a large increase in shrubs/scrubs (+118.6%); however, this LULC class had a small overall extent (64.6 km2).
One of the newly identified research priorities in soil health is to link soil C dynamics to GHG emissions [1]. This study quantified the disturbance area, soil C loss, and associated SC-CO2 (Table 4). Changes in the level of disturbance affected the soil health continuum within the newly developed land cover classes, with the “developed, open space” category generating the highest losses of TSC (4.7 × 10⁹ kg C loss) and the associated SC-CO2 ($795.2M). Categories of “developed” land cover can help identify the urban soil health continuum, where some areas retain soil function, and others are lost (e.g., under impervious surfaces).

4. Discussion

4.1. Significance of the Results for Illinois’ Soil Health Actions and Soil Health in General

The state of IL recognizes the importance of soil health and surveying and measuring soil health; however, it is important to consider the soil health continuum at the state and landscape levels. Our study makes an important contribution not only to the conceptual framework to help quantify and understand soil health in IL but also provides quantitative data to evaluate how land cover change is impacting the soil health continuum and soil C, which is a key soil health indicator and is linked to GHG emissions. This data could also be used by the state of IL in its efforts to limit soil health damage. Results from this study detail evidence for the above claims as follows:
(1) Damage to soil health because of soil carbon (C) loss and associated emissions from land developments in IL (USA), with an estimated midpoint total of 2.5 × 10¹¹ kg of C losses (Table S6). The highest soil C losses were found in Cook (2.5 × 10¹⁰ kg C), Lake (1.5 × 10¹⁰ kg C), and Will (1.3 × 10¹⁰ kg C) counties. New development activity between 2001 and 2016 caused a total of 1.6 × 10¹⁰ kg in C losses. The highest soil C losses were found in Will (2.9 × 10⁹ kg C), Kane (1.9 × 10⁹ kg C), and Lake (1.4 × 10⁹ kg C) counties (Figure 4). All these counties are located near the urban center of Chicago.
(2) Damage to soil health because of loss of land that could be used for potential soil carbon (C) sequestration because of land development within IL (USA), with a sum of 13,360.9 km2 of land area converted to developments before and up through 2016 (Table S6). The largest area losses from developments were found in the counties Cook (1670.3 km2), Lake (576.6 km2), and Will (560.0 km2). Between 2001 and 2016, new developments caused a total of 738.5 km2 of conversion to developments. The largest area losses from development were found in the counties Will (130.8 km2), Kane (73.6 km2), and Lake (54.3 km2). Most developments occurred adjacent to the Chicago urban area and came at the expense of cultivated and forest areas (Figure 5).
This analysis determined that between 2001 and 2016, land developments occurred mainly near established urban areas. In the state of IL, there is only a small amount of land (0.6% of the state area) that could be used for nature-based C sequestration methods [27] (e.g., 0.1% shrub/scrub, 0.1% barren land, 0.4% herbaceous) (Table 2). The state of IL soils also inherently have limited potential for C sequestration because of the prevalence of intensive agriculture within the state. Projected increases in urbanization will likely cause a further reduction in land available for C sequestration. This study evaluates both recent developments between 2001 and 2016 and the overall development history [28] that impacted more than 13,000 km2 of developed land through 2016, which also had soil-based GHG emissions and the loss of land area for potential future sequestration, which should be seen as part of the total soil health damages.
(3) Damage to soil health, which can be measured as “realized” social costs of soil carbon (C) (SC-CO2) released from the land development process before and through 2016 within the state of IL (USA), with a total midpoint value of $41.8B in SC-CO2 (Table S6). The highest costs were found in Cook ($4.3B), Lake ($2.5B), and Will ($2.2B) counties. From 2001 to 2016, new developments caused $2.7B in SC-CO2. The highest costs were found in Will ($487.6M), Kane ($325.3M), and Lake ($240.3M) counties (Figure 6). Soil health legislation is intended to address land degradation by evaluating soil health status and providing management techniques to improve soil health. Soil health economics should not only focus on landowner profitability but also use a debt-based approach [28] to repay past soil health debt (e.g., loss of C).

4.2. Damage to Soil Health and Scale Considerations

Land cover change directly impacts both soil health and the available land resources for sustainable forest and agriculture practices. Considering land cover change at a higher resolution, for example, at the county level (Figure 7, Table 5), shows dramatic lacerations of the landscape. By visualizing all of the land cover changes at this detailed scale, it is possible to understand the location and magnitude of land cover changes. All of these changes, whether from forest to agriculture or hay/pasture to development, will serve to reduce the soil quality. Each land cover conversion represents increased disturbance, which likely causes reductions in organic C and soil health indicators. Many of these conversions involve going from a land cover with very little soil disturbance (e.g., forest, hay/pasture, barren, etc.) to some form of development that involves the loss of soil C. Even in the case of forest land that remains in forestry production, tree removal, and land management can reduce soil health [29]. It is important to evaluate the extent of LULC change to help quantify soil health in terms of soils that are still available for providing ecosystem services.
Lake County, IL, experienced land cover change, which generated an increase of 54.3 km2 in developed land categories with an estimated loss of 1.4 × 10⁹ kg C and a related loss of $240.3M of SC-CO2. There are considerable losses in multiple land cover categories (Table 5), with notable losses in cultivated crop (−18.1%) and hay/pasture (−13.1%) and mixed (−10.1%), deciduous (−7.4%), and evergreen forest (−6.4%) land cover categories. Many of these conversions included highly productive soils (e.g., Alfisols and Mollisols) as well as typically protected wetland soils (Histosols).

4.3. Redefining the Soil Health Continuum at the Landscape Level

A traditional view of the soil health continuum is often limited to focusing on crop and soil management practices at the field scale [2]. In this context, soil health is described in terms of cropping systems, with annual cropping systems associated with lower soil health levels than perennial systems that typically have higher soil health [2]. This representation of the soil health continuum associates high soil health with lower soil disturbance levels and low soil health with high soil disturbance regimes [2]. This traditional view of soil health is limited to agronomic fields and neglects a broader view of soil health at the landscape level, which encompasses various land cover classes and soil types. Current soil health levels and future potential come from the intersection of soil type and land cover, which makes the concept of soil health both soil type- and land cover-specific (Figure 8). Focusing solely on agronomic field measurements can be limiting when considering the land use impact on soil health key indicators (e.g., soil C) and their link to the broader environmental impact of land management (e.g., GHG emissions). Land cover change analysis over time helps track conversions to land uses that may increase or decrease overall soil health and keep an overall account of the loss of healthy, productive soils and how humans impact soil resources. Within each type of land use and land cover, a range of practices change soil health, and future soil health evaluation techniques should expand beyond agronomic systems.

4.4. The Legal Aspects of the Soil Health Legislative Actions

4.4.1. Benefits and Limitations of Soil Health Legislative Actions

A wave of soil-health laws has recently swept across the country (Figure 9). Starting with California in 2016, ten states have enacted soil-health legislation. Another 22 states have legislation that, although not yet enacted, is pending [15]. After passage by state legislatures and signing by the state’s governor, the new laws that have been enacted create various regulations and incentives that encourage efforts to improve soil health.
The new laws provide encouragement rather than a requirement. Rather than forbidding practices that harm soil health or requiring new healthy practices, the statutes tend to gently encourage healthy soil practices by providing information and by offering grants and tax incentives. For example, the IL statute empowers state authorities to create a comprehensive plan for soil improvement and conservation in a certain area. The statute does not enable the state to implement the plan coercively; the state is forbidden to force landowners to do anything. Instead, the state may provide information to landowners about best practices and may provide financial aid and the use of machinery, equipment, and plant material [3]. Private land ownership is important in IL, as documented by the high proportion of private land (95.9%) [30]. Regardless of which landowner creates negative externalities (e.g., GHG emissions), this type of legislation requires the taxpayer to provide all funding and incentives for soil health-related activities.
Soil statutes in other states are similar, with none imposing any requirements on landowners. Instead, the statutes foster soil health by providing landowners with information and incentives. For example, the new laws in California (CA), Maryland (MD), New Mexico (NM), Washington (WA), Vermont (VT), and Massachusetts (MA) enable each state to provide technical and financial assistance. New York’s statute provides tax credits [16].
Although not all of the statutes and bills define healthy soil, several do, most following the California model. The California statute notes: “ ’Healthy soils’ means soils that enhance their continuing capacity to function as a biological system, increase SOM, improve soil structure and water- and nutrient-holding capacity, and result in net long-term greenhouse gas benefits” [31].
The California statute’s name, “Agricultural Lands: Greenhouse Gases: Healthy Soil Program,” suggests the focus both on the California statute and on the other statutes that have followed it [31]. The focus is on the soil used in agriculture, offering ways to enhance farming practices to improve the soil’s health and output. Likewise, other state soil-health statutes focus on “regenerative agriculture,” again focusing on improving farming and grazing practices [16]. A midwest activist summed up how the goal of soil-health legislation was to improve practices in farming and grazing: “We needed to figure out a way to promote wider use of these practices among farmers and land managers. We thought we needed to put a big spotlight on these practices through the creation of a healthy soils initiative and formation of a task force” [16].
The statutes attempt to improve soil health by encouraging beneficial farming practices. Certain recommended practices are mentioned in many of the statutes, while other practices are mentioned less frequently. The practices that are promoted in the statutes are as follows, listed in decreasing order of the number of statutes that mention them: cover cropping, no-till cultivation, rotational grazing, manure or compost application, planting perennials, reducing chemical application, planting hedgerows and using native vegetation, multi-cropping, and soil microbial inoculations [16].
Although some of the statutes mention an objective being C sequestration, the consistently stated goal is “preserving an environment sustainable for crops and animal production over time” [16]. Soil-health statutes in liberal states such as California mention as objectives C sequestration, reducing GHG, and limiting climate change. However, in conservative states, a bill that proclaimed such goals would be doomed; voters and legislators in such states generally oppose anything that addresses C, GHG, or climate change. An activist in a conservative state noted that “discussing carbon and climate change in legislation presented a significant barrier to legislation proposal and passage: ‘if you mention climate change to the legislature, then 50% of them are already against what you are going to talk about.’” Another stated, “Any program that mentions carbon is sort of toxic to begin with, regardless of where the money flows” [16].
Therefore, in conservative states, soil-health statutes have been passed only by focusing on how soil health will improve farms’ profitability. An interviewee felt that successful agricultural programs needed to benefit farm profitability, stating, “if you can make an argument for how you will improve their bottom lines like reducing the use of fertilizer, pesticides, fuel, and irrigated water, you get their attention” [16].
Such attempts to improve agricultural practices to make farming more sustainable and less reliant on fertilizer are not new and are similar in content, if not in name, to federal programs, both old and new. Reacting to the dust-bowl conditions of the 1930s, federal programs convinced farmers to change their cultivation practices to avoid topsoil erosion [32]. Although these programs were not called “soil health,” their contents were similar.
Although recent soil-health bills are being considered primarily in state legislatures, the federal government has also become involved. The 2018 Farm Bill included programs to encourage crop rotation, cover cropping, and rotational grazing [33]. These programs are similar to those in state soil-health legislation.
What has permitted the statutes to pass is their use of “carrots” rather than “sticks.” Politically, a soil-health statute can pass only if farmers support it. Such support will not exist for bills that prevent farmers from doing what they would otherwise like to do. So rather than imposing prohibitions, the bills, as noted above, provide farmers with financial incentives. “Main legislative interventions … include financial and technical assistance programs offering incentive-based grants, equipment loans, and education” [16].
A gap in these programs exists. Absent from the soil-health bills is any attempt to address the focus of our present paper: how any disturbance of the soil effectively reduces soil health by releasing GHG. This reduction in soil health results regardless of whether the soil is disturbed away from a farm. Soil health is reduced, and GHGs are released anywhere a bulldozer digs undisturbed soil. Greenhouse gas emissions represent negative externalities, both in agricultural and development scenarios, that should be the responsibility of the emitter. Soil health legislation often includes education and monitoring components that can improve soil management; however, it does not assign the cost of GHG emissions to the polluters. Incentives to improve soil health should not be funded by taxpayers but instead, come through fees on GHG emission-related externalities.
The United States is not alone in considering soil health-related legislation. A recent draft of a soil health law by the European Union (EU) focused on monitoring soil health and did not include any binding targets to improve soil health [34]. This draft was met with heavy criticism from various businesses and academics who argue that binding targets are necessary for the soil health law to be effective [34].

4.4.2. Refining Soil Health Legislative Actions

Soil-health initiatives, whether at the state or federal level, should be broadened to deter the unnecessary disturbance of soil, whether on a farm or elsewhere. That is, statutes should recognize that the healthiest soil is undisturbed soil. It should be recognized that harming a soil’s health by disturbing it has a cost (Table 6). And this paper’s analysis demonstrates that the cost of the resultant release of GHG can be substantial (Table 6). Soil should be disturbed only when it is efficient to do so and when the benefits of disturbance exceed the costs. Economic analysis suggests that soil is now disturbed excessively and inefficiently because developers are not compelled to pay the costs that result from soil disturbance (Table 6).
Accordingly, soil-health initiatives could be broadened to deter unnecessary soil disturbance. To have a chance of obtaining through the legislature, such programs would probably need to rely on payments rather than prohibitions. It has been seen that existing soil-health bills succeeded only when structured as “carrots” rather than “sticks.” Legislation should not merely deny owners the right to develop their land. Instead, legislation should provide tax incentives and financial assistance to owners who develop their land in responsible ways that limit harmful disturbance. The limitation of this approach is that it essentially punishes the taxpayers who subsidize these incentives.
In the long term, this approach may only exacerbate the issue because there are no consequences for entities that harm soil health.
A common criticism is that binding targets are not included and are necessary for the soil health law to be effective [34]. This is understandable because soil health research is often focused on the field scale [2] and lacks landscape-level analysis of how soil resources have been degraded or removed from the soil health continuum (both recent and historic losses from land development) (Table 6). This study generated quantitative geospatial data on land conversion by soil type to development, which resulted in the loss of land assets for future C sequestration, corresponding soil C loss, and the associated social cost of these GHG emissions. Soil health is not isolated from economic forces, which drive land development in many places in the world, including the state of IL. Past and recent deteriorations in soil health from developments are associated with economic development in the state, with the Northeast Economic Region in the lead (Table 6). This information can help develop binding targets for improving soil health that can compensate for this loss of soil resources. Soil health initiatives cannot ignore the overall soil health inventory, soil health continuum, and dynamics linked to economic forces when considering both initiatives and targets.

4.5. Study Implications in a Broader Context

The results of this study have a range of implications for the United Nations (UN) Sustainable Development Goals (SDGs), which were adopted in 2015 [35]. Soils are directly and indirectly relevant to the SDGs, but the role of soil health in the SDGs is overlooked [36]. This study uniquely provides both spatial and quantitative metrics that can quantify and monitor SDGs at multiple temporal and spatial scales, as illustrated below for the State of Illinois for several soil-related goals within the SDGs [37,38]:
  • An overall decrease in the land identified as hay/pasture occurred from 2001 to 2016 in the State, affecting all soil orders (Table 3). The loss of hay/pasture area results in an overall reduced production capacity from this land use/cover (which addresses SDG 2: Zero Hunger);
  • Although land development occurred in all six soil orders in the State, the most productive agricultural soils (e.g., Alfisols and Mollisols) and the C-rich Histolsols experienced the highest conversions (addressing SDG 12: Responsible Consumption and Production);
  • The State has legislation on clean energy with the goal of 100% renewable energy by 2050 (Public Act 102-0662), but it does not address other sources of GHG emissions (e.g., soil GHG emissions) [4]. Land development in IL has caused damage to soil health due to the loss of soil C and subsequent emission of carbon dioxide (CO2). There is only a small amount of land (less than 1% of the total land area) that can be used for nature-based C sequestration techniques [27] (addressing SDG 13: Climate Action);
  • Overall degradation of soil resources (pedodiversity) has occurred in all soil orders of IL in the past and recently over the period 2001–2016 due to changes in land use/land cover, for example, reductions in woody and emergent herbaceous wetlands and other herbaceous land covers (Table 3). There were also reductions in the total forest area. In addition to a reduced forest production capacity, the decrease in deciduous and evergreen forests shrinks existing C sinks, allowing for more GHG emissions and pollutants in the atmosphere (addressing SDG 15: Life on Land).

5. Conclusions

The geospatial analysis presented in this study revealed soil health degradation in IL between 2001 and 2016, which is documented by the loss of productive soil to development as well as the associated loss of forest and hay/pasture land covers (among others). This follows the historic trend in land development for the State, that is, the conversion of soils with a higher soil health status to land covers and uses that degrade the overall soil health of the State. Decreasing soil health represents losses and damages, which should be a portion of the targets as part of soil health initiatives to improve the state soil health continuum. For example, the current soil health continuum in IL is skewed towards lower soil health (63% cultivated crops and 10% developed) compared to the overall soil health continuum (20% cultivated crops and 6% developed) within the contiguous U.S. Past and recent deteriorations in soil health from developments are associated with economic development in the state, with the Northeast Economic Region in the lead.
Soil-health legislation should be broadened to address the harms associated with soil disturbance. For example, soil-health statutes and proposed legislation typically focus only on practices on farms but do not address the harms of soil disturbance, even in an agricultural context. Experience with existing soil-health initiatives suggests that to increase the chance of legislative success, programs should focus on tax incentives and grants rather than prohibitions. The limitations of this approach include the cost borne by taxpayers who are forced to subsidize these incentives. Over time, this approach may only exacerbate the issue because there are no consequences for entities that harm soil health, and the economic reward for development may be higher than the subsidies offered to discourage the development of highly productive soils. It may be necessary to use an approach that fines or taxes development where it would damage soil health to preserve soil health at the landscape level.
Soil management and land cover change are impacting soil health resources and the soil health continuum. This study proposes an innovative technique to understand and monitor soil health at the state and landscape levels using geospatial and remote sensing techniques. Additionally, these techniques can be replicated and scaled to monitor soil resources at the country level. Future linkages between point soil samples, typically used to monitor soil health, and landscape-scale geospatial databases will allow the further refinement and quantification of the “soil bank” that holds valuable soil health resources. Without monitoring soil health at the landscape and state scales, it is impossible to understand how land cover change patterns may be threatening these vital soil resources.

Supplementary Materials

The following supporting information can be downloaded at: https://www.mdpi.com/article/10.3390/land12081567/s1, Table S1. Soil diversity (pedodiversity) is expressed as taxonomic diversity at the level of soil order in the state of Illinois (IL) (USA) [6]; Table S2. An overview of the accounting framework used by this study (adapted from Groshans et al. (2019) [21]) for the state of Illinois (USA); Table S3. Area-normalized content (kg m−2) and monetary values ($ m−2) of soil organic carbon (SOC), soil inorganic carbon (SIC), and total soil carbon (TSC = SOC + SIC) by soil order using data developed by Guo et al. (2006) [20] for the upper 2-m of soil and an avoided social cost of carbon (SC-CO2) of $46 per metric ton of CO2, applicable for 2025 (2007 U.S. dollars with an average discount rate of 3% [19]); Table S4. Distribution of soil carbon regulating ecosystem services in the state of Illinois (USA) by soil order; Table S5. Increases in developed land and potential for realized social costs of carbon (C) due to complete loss of total soil carbon (TSC) of developed land by soil order in the state of Illinois (USA) from 2001 to 2016; Table S6. Developed land and potential for realized social costs of carbon (C) due to complete loss of total soil carbon (TSC) of developed land by soil order in the state of Illinois (USA) prior and through 2016.

Author Contributions

Conceptualization, E.A.M.; methodology, E.A.M., M.A.S. and H.A.Z.; formal analysis, E.A.M. and G.C.P.; writing—original draft preparation, E.A.M. and R.M.D.; writing—review and editing, E.A.M., C.J.P., G.B.S. and M.A.S.; visualization, H.A.Z., L.L. and Z.H. All authors have read and agreed to the published version of the manuscript.

Funding

This research received no external funding.

Data Availability Statement

Not applicable.

Acknowledgments

We would like to thank the reviewers for their constructive comments and suggestions.

Conflicts of Interest

The authors declare no conflict of interest.

Glossary

BBillion
BSBase saturation
CFCarbon footprint
CCAClimate Change Adaptation
CO2Carbon dioxide
COPConference of the Parties
EDEcosystem disservices
ESEcosystem services
EPAEnvironmental Protection Agency
EUEuropean Union
GHGGreenhouse Gases
ILIllinois
L&D Loss and damage
LULCLand use/land cover
LULCCLand use/land cover change
MMillion
NNorth
NOAANational Oceanic and Atmospheric Administration
NRCSNatural Resources Conservation Service
PPPPolluter-pays-principle
RCCAReverse Climate Change Adaptation
SC-CO2Social cost of carbon emissions
SDGsSustainable Development Goals
SOCSoil organic carbon
SICSoil inorganic carbon
SOMSoil organic matter
SSURGOSoil Survey Geographic Database
STATSGOState Soil Geographic Database
TSCTotal soil carbon
USDAUnited States Department of Agriculture
WWest
WIMWarsaw International Mechanism

References

  1. Lehmann, J.; Bossio, D.A.; Koge-Knabner, I.; Rillig, M.C. The concept and future prospects of soil health. Nat. Rev. Earth Environ. 2020, 1, 544–553. [Google Scholar] [CrossRef] [PubMed]
  2. Karlen, D.L.; Veum, K.S.; Sudduth, K.A.; Obrycki, J.F.; Nunes, M.R. Soil health assessment: Past accomplishments, current activities, and future opportunities. Soil Tillage Res. 2019, 195, 104365. [Google Scholar] [CrossRef]
  3. Illinois Public Act 101-0484. Amendment to the Soil and Water Conservation Districts Act. 2019. Available online: https://www.ilga.gov/legislation/fulltext.asp?DocName=&SessionId=108&GA=101&DocTypeId=HB&DocNum=2737&GAID=15&LegID=118981 (accessed on 1 May 2023).
  4. Illinois Public Act 102-0662. Climate and Equitable Jobs Act. 2021. Available online: https://www.ilga.gov/legislation/publicacts/102/PDF/102-0662.pdf (accessed on 1 May 2023).
  5. Soil Science Society of America. n.d. USDA. Drummer—Illinois State Soil. Available online: https://www.soils4teachers.org/files/s4t/k12outreach/il-state-soil-booklet.pdf (accessed on 1 May 2023).
  6. Mikhailova, E.A.; Zurqani, H.A.; Post, C.J.; Schlautman, M.A.; Post, C.J. Soil diversity (pedodiversity) and ecosystem services. Land 2021, 10, 288. [Google Scholar] [CrossRef]
  7. Soil Survey Staff, Natural Resources Conservation Service, United States Department of Agriculture. n.d.a. Soil Survey Geographic (SSURGO) Database. Available online: https://nrcs.app.box.com/v/soils (accessed on 10 September 2022).
  8. The United States Census Bureau. TIGER/Line Boundary Shapefiles. 2018. Available online: https://www.census.gov/geographies/mapping-files/time-series/geo/tiger-line-file.2018.html (accessed on 10 September 2022).
  9. The Nature Conservancy. An Assessment of the Impacts of Climate Change in Illinois. Available online: https://www.nature.org/content/dam/tnc/nature/en/documents/IL_Climate_Assessment_2020_Executive_Summary.pdf (accessed on 1 May 2023).
  10. EPA—United States Environmental Protection Agency. What climate change means for Illinois. EPA 430-F-16-015. August 2016. Available online: https://19january2017snapshot.epa.gov/sites/production/files/2016-09/documents/climate-change-il.pdf (accessed on 1 May 2023).
  11. Mehra, P.; Singh, B.; Kunhikrishnan, A.; Cowie, A.L.; Bolan, N. Soil health and climate change: A critical nexus. Manag. Soil Health Sustain. Agric. 2018, 1, 39–68. [Google Scholar]
  12. Melillo, J.M.; Frey, S.D.; DeAngelis, K.M.; Werner, W.J.; Bernard, M.J.; Bowles, F.P.; Pold, G.; Knorr, M.A.; Grandy, A.S. Long- term pattern and magnitude of soil carbon feedback to the climate system in a warming world. Science 2017, 358, 101–105. [Google Scholar] [CrossRef] [PubMed] [Green Version]
  13. Toor, G.S.; Yang, Y.Y.; Das, S.; Dorsey, S.; Felton, G. Soil health in agricultural ecosystems: Current status and future perspectives. Adv. Agron. 2021, 168, 157–201. [Google Scholar]
  14. Borrelli, P.; Robinson, D.A.; Panagos, P.; Lugato, E.; Yang, J.E.; Alewell, C.; Wuepper, D.; Montanarella, L.; Ballabio, C. Land use and climate change impacts on global soil erosion by water (2015–2070). Proc. Natl. Acad. Sci. USA 2020, 117, 21994–22001. [Google Scholar] [CrossRef] [PubMed]
  15. Soil4Climate, Inc., Healthy Soils Legislation. Available online: https://policy.soil4climate.org (accessed on 1 June 2023).
  16. Delmendo, M.N.; Sipos, Y.; Montgomery, D.R.; Cole, R.P.; Otten, J.J. The scope of U.S. state soil health legislation: A mixed-methods policy analysis. J. Agric. Food Syst. Community Dev. 2021, 10, 69–90. [Google Scholar] [CrossRef]
  17. Stevens, A.W. Review: The economics of soil health. Food Policy 2018, 80, 1–9. [Google Scholar] [CrossRef]
  18. Shen, R.F.; Teng, Y. The frontier of soil science: Soil health. Pedosphere 2023, 33, 6–7. [Google Scholar] [CrossRef]
  19. EPA—United States Environmental Protection Agency. 2016; The Social Cost of Carbon. EPA Fact Sheet. Available online: https://19january2017snapshot.epa.gov/climatechange/social-cost-carbon_.html (accessed on 15 September 2022).
  20. Guo, Y.; Amundson, R.; Gong, P.; Yu, Q. Quantity and spatial variability of soil carbon in the conterminous United States. Soil Sci. Soc. Am. J. 2006, 70, 590–600. [Google Scholar] [CrossRef] [Green Version]
  21. Groshans, G.R.; Mikhailova, E.A.; Post, C.J.; Schlautman, M.A.; Zhang, L. Determining the value of soil inorganic carbon stocks in the contiguous United States based on the avoided social cost of carbon emissions. Resources 2019, 8, 119. [Google Scholar] [CrossRef] [Green Version]
  22. Multi-Resolution Land Characteristics Consortium—MRLC. Available online: https://www.mrlc.gov/ (accessed on 1 September 2021).
  23. ESRI (Environmental Systems Research Institute). ArcGIS Pro 2.6. Available online: https://pro.arcgis.com/en/pro-app/2.6/get-started/whats-new-in-arcgis-pro.htm (accessed on 1 March 2022).
  24. Mikhailova, E.A.; Groshans, G.R.; Post, C.J.; Schlautman, M.A.; Post, G.C. Valuation of soil organic carbon stocks in the contiguous United States based on the avoided social cost of carbon emissions. Resources 2019, 8, 153. [Google Scholar] [CrossRef] [Green Version]
  25. Mikhailova, E.A.; Groshans, G.R.; Post, C.J.; Schlautman, M.A.; Post, G.C. Valuation of total soil carbon stocks in the contiguous United States based on the avoided social cost of carbon emissions. Resources 2019, 8, 157. [Google Scholar] [CrossRef] [Green Version]
  26. Soil Survey Staff, Natural Resources Conservation Service, United States Department of Agriculture. Photos of Soil Orders. Available online: https://www.nrcs.usda.gov/wps/portal/nrcs/detail/soils/edu/?cid=nrcs142p2_053588 (accessed on 20 September 2022).
  27. Keesstra, S.; Nunes, J.; Novara, A.; Finger, D.; Avelar, D.; Kalantari, Z.; Cerdà, A. The superior effect of nature based solutions in land management for enhancing ecosystem services. Sci. Total Environ. 2018, 610–611, 997–1009. [Google Scholar] [CrossRef] [PubMed] [Green Version]
  28. Sanderman, J.; Hengl, T.; Fiske, G.J. Soil carbon debt of 12,000 years of human land use. Proc. Natl. Acad. Sci. USA 2017, 114, 9575–9580. [Google Scholar] [CrossRef] [PubMed]
  29. Kersey, J.; Myrold, D. Response of soil health indicators to organic matter removal and compaction manipulations at six LTSP sites in the Western US. For. Ecol. Manag. 2021, 490, 119104. [Google Scholar] [CrossRef]
  30. U.S. Bureau of the Census. Statistical Abstract of the United States: 1991; U.S. Bureau of the Census: Washington, DC, USA, 1991; p. 201. Available online: https://www.census.gov/library/publications/1991/compendia/statab/111ed.html (accessed on 10 June 2023).
  31. Agricultural Lands: Greenhouse Gases: Healthy Soil Program, SB-1350. 2016. Sacramento, CA: California Legislative Information. Available online: https://leginfo.legislature.ca.gov/faces/billNavClient.xhtml?bill_id=201520160SB1350 (accessed on 2 May 2023).
  32. Dumanski, J. Evolving concepts and opportunities in soil conservation. Int. Soil Water Conserv. Res. 2015, 3, 1–14. [Google Scholar] [CrossRef] [Green Version]
  33. Agriculture Improvement Act of 2018, Public Law 115–334. 115th Congress. Government Printing Office: Washington, DC, USA, 2018. Available online: https://www.govinfo.gov/link/plaw/115/public/334?link-type=pdf (accessed on 2 May 2023).
  34. Abnett, K. EU set to swerve binding targets to improve soil health. Reuters June 30, 2023. Available online: https://www.reuters.com/world/europe/eu-set-swerve-binding-targets-improve-soil-health-2023-06-30/ (accessed on 30 June 2023).
  35. UN. Transforming Our World: The 2030 Agenda for Sustainable Development; United Nations: New York, NY, USA, 2015. [Google Scholar]
  36. Lal, R. United Nations Food Systems Summit: What is the role of soil health in putting the Sustainable Development Goals on track? J. Soil Water Conserv. 2021, 76, 105A–107A. [Google Scholar] [CrossRef]
  37. Yin, C.; Zhao, W.; Pereira, P. Soil conservation service underpins sustainable development goals. Glob. Ecol. Conserv. 2022, 33, e01974. [Google Scholar] [CrossRef]
  38. Report of the Inter-Agency and Expert Group on Sustainable Development Goal Indicators. 2016. Available online: https://digitallibrary.un.org/record/821651?ln=en (accessed on 9 May 2023).
Figure 1. Soil health is defined by the ability of soil functions to sustain life (e.g., regulating water, cycling nutrients, etc.), which is based on the intersection of soil type and land cover and/or land use/land cover (LULC) change over time and scale (adapted from Karlen et al. 2019 [2]). The soil health continuum is composed of a sequence of values that vary with soil type and LULC.
Land 12 01567 g001
Figure 2. State of Illinois (IL), USA, soil map (36°58′ N to 42°30′ N; 87°30′ W to 91°31′ W) derived from the SSURGO soils database [7] with boundaries shown for economic development regions [8].
Land 12 01567 g002
Figure 3. Land cover map of the state of Illinois (IL) (USA) for 2016 (36°58′ N to 42°30′ N; 87°30′ W to 91°31′ W) (based on data from MRLC [22]).
Land 12 01567 g003
Figure 4. Damage to soil health because of soil carbon (C) loss with associated emissions from (a) past land developments (through 2016) and (b) more recent land developments between 2001 and 2016 in Illinois (IL) (USA). Note: M = million = 106; B = billion = 109.
Land 12 01567 g004
Figure 5. Damages to soil health because of loss of land for potential soil carbon (C) sequestration from (a) past developments (through 2016) and (b) land developments that occurred between 2001 and 2016 for Illinois (IL) (USA).
Land 12 01567 g005
Figure 6. Damage to soil health can be measured as “realized” social costs of soil carbon (C) (SC-CO2) from (a) past developments (through 2016) and (b) recent land developments in the state of Illinois (IL) (USA) from 2001 to 2016. Note: M = million = 106; B = billion = 109.
Land 12 01567 g006
Figure 7. Lake County, Illinois (IL), USA. Areas that changed land cover between 2001 and 2016 indicate potential damage to soil health.
Land 12 01567 g007
Figure 8. A newly proposed conceptual diagram showing the soil health continuum is influenced both by soil type (e.g., an example is given based on soil types found in the state of Illinois, IL, USA) and land cover. The lower end of the soil health continuum corresponds to a higher degree of disturbance (developed land classes) or limited soil function (barren land), compared to higher soil health in land classes with limited soil disturbance (e.g., wetlands, etc.) (adapted from Karlen et al. (2019) [2]).
Land 12 01567 g008
Figure 9. Soil health legislation status for the contiguous United States of America (USA) [15].
Land 12 01567 g009
Table 1. Distribution of soil carbon (a key soil health indicator) regulating ecosystem services in the state of Illinois (IL) (USA) by soil order (photos courtesy of USDA/NRCS [26]).
Soil Regulating Ecosystem Services within Illinois
Degree of Soil Development and Weathering
Slight
12.1%
Moderate
87.7%
Strong
0.2%
EntisolsInceptisolsHistosolsAlfisolsMollisolsUltisols
7.5%3.9%0.7%45.1%42.6%0.2%
Land 12 01567 i001Land 12 01567 i002Land 12 01567 i003Land 12 01567 i004Land 12 01567 i005Land 12 01567 i006
Midpoint storage and social cost of soil organic carbon (SOC): 1.4× 10¹² kg C, $232.4B
7.5 × 10¹⁰ kg 4.3 × 10¹¹ kg 1.2 × 10¹¹ kg 4.2 × 10¹¹ kg 7.1 × 10¹¹ kg 1.4 × 10⁹ kg
$12.7B$7.2B$20.7B$71.1B$120.4B$229.1M
5.5%3.1%8.9%30.6%51.8%0.1%
Midpoint storage and social cost of soil inorganic carbon (SIC): 9.2× 10¹¹ kg C, $154.5B
4.5 × 10¹⁰ kg2.5 × 1010 kg2.1 × 109 kg2.4 × 1011 kg6.1 × 1011 kg0
$7.7B$4.1B$359.6M$40.3B$101.9B$0
5.0%2.7%0.2%26.1%66.0%0%
Midpoint storage and social cost of total soil carbon (TSC): 2.3 × 10¹² kg C, $386.9B
1.2 × 10¹¹ kg6.8 × 1010 kg1.2 × 1011 kg6.6 × 1011 kg1.3 × 1012 kg1.4 × 109 kg
$20.4B$11.4B$21.1B$111.4B$222.3B$229.1M
5.3%2.9%5.4%28.8%57.5%0.1%
Sensitivity to climate change
LowLowHighHighHighLow
SOC and SIC sequestration (recarbonization) potential
LowLowLowLowLowLow
Note: Alfisols, Mollisols, Inceptisols, Ultisols, and Entisols are mineral soils. Histosols are most often considered organic soils. M = million = 106; B = billion = 109; $ = United States Dollar (USD). See the Supplemental Table S4 for minimum and maximum values.
Table 2. Land use/land cover (LULC) by soil order for the state of Illinois (IL) (USA) in 2016.
NLCD Land Cover Classes
(LULC),
Soil Health Continuum
2016 Total
Area by LULC
(km2, %)
Degree of Weathering and Soil Development
SlightModerateStrong
EntisolsInceptisolsHistosolsAlfisolsMollisolsUltisols
2016 Area by Soil Order (km2)
Barren land138.8 (0.1)  38.3 8.1  0.9  30.6 60.8  0.1 
Woody wetlands2587.0 (2.1)  719.0 615.5  85.2  178.3 988.8  0.2 
Shrub/Scrub64.6 (0.1)  10.5 3.0  0.4  36.5 14.0  0.1 
Mixed forest4555.6 (3.7)  521.8 258.6  3.9  3087.3 674.7  9.3 
Deciduous forest14,318.3 (11.5)  1666.2 1422.4  49.9  9380.4 1630.4  169.1 
Herbaceous473.2 (0.4)  112.9 13.8  8.2  161.8 176.2  0.2 
Evergreen forest172.9 (0.1)  20.5 3.9  0.3  131.0 15.5  1.7 
Emergent herbaceous wetlands458.0 (0.4)  124.8 56.5  48.5  12.4 215.9  0.0 
Hay/Pasture9342.2 (7.5)  834.0 399.4  33.9  6498.9 1569.7  6.3 
Cultivated crops78,631.4 (63.4)  3132.8 1837.0  520.8  31,075.1 42,064.7  1.0 
Developed, open space5091.8 (4.1)  388.3 130.2  53.2  2564.1 1953.2  2.7 
Developed, medium intensity2031.7 (1.6)  668.2 9.9  15.4  524.7 813.5  0.0 
Developed, low intensity5422.9 (4.4)  752.0 62.6  49.6  2182.3 2376.2  0.2 
Developed, high intensity814.6 (0.7)  431.1 1.5  6.8  120.4 254.8  0.0 
Totals124,103.1 (100%)  9420.54822.5  877.0  55,983.952,808.2  190.9
Note: Entisols, Inceptisols, Alfisols, Mollisols, and Ultisols are mineral soils. Histosols are mostly organic soils.
Table 3. Land use/land cover (LULC) changes between 2001 and 2016 by soil order for the state of Illinois (IL) (USA).
NLCD Land Cover Classes
(LULC),
Soil Health Continuum
Dynamics
Change in Area,
2001–2016
(%)
Degree of Weathering and Soil Development
SlightModerateStrong
EntisolsInceptisolsHistosolsAlfisolsMollisolsUltisols
Change in Area, 2001–2016 (%)
Barren land1.9  5.9 88.5 19.1 −11.9 1.1 6.8 
Woody wetlands−1.0  −1.1 −0.5 1.5 −0.8 −1.4 0.5 
Shrub/Scrub118.6  89.6 34.2 21.6 173.6 75.3 57.4 
Mixed forest0.5  0.7 0.8 −7.7 0.6 −0.1 0.9 
Deciduous forest−0.6  −0.3 0.1 −5.0 −0.6 −1.5 0.0 
Herbaceous−2.6  −2.3 28.6 −18.7 12.0 −13.9 −4.3 
Evergreen forest−0.8  −1.7 1.2 −6.1 −0.1 −5.6 1.2 
Emergent herbaceous wetlands−6.6  −12.1 −1.7 −2.0 0.9 −5.7 −83.3 
Hay/Pasture−7.3  −7.3 −7.0 −15.1 −7.2 −7.6 −5.1 
Cultivated crops0.0  0.1 0.6 −0.9 0.9 −0.6 9.1 
Developed, open space4.2  2.5 1.1 13.7 3.0 6.0 0.2 
Developed, medium intensity11.3  3.8 11.7 19.1 13.3 16.7 0.0 
Developed, low intensity3.7  0.2 1.3 8.5 3.1 5.5 0.0 
Developed, high intensity16.7  5.3 30.1 23.7 28.8 35.2 100.0 
Note: Inceptisols, Entisols, Alfisols, Ultisols, and Mollisols are mineral soils. Histosols are most often organic soils.
Table 4. Increases that occurred between 2001 and 2016 in both the area of developed land and the midpoint potential for realized social costs of carbon (C) because of the assumed complete loss of total soil carbon (TSC) for developed land by soil order in the state of Illinois (IL) (USA).
NLCD Land Cover Classes
(LULC);
Developed Area Increase
between 2001 and 2016 (km2);
Midpoint Complete Loss of Total Soil Carbon (kg);
Midpoint SC-CO2 ($ = USD)
Degree of Weathering and Soil Development
SlightModerateStrong
EntisolsInceptisolsHistosolsAlfisolsMollisolsUltisols
Developed Area Increase between 2001 and 2016 (km2)
Midpoint Complete Loss of Total Soil Carbon (kg)
Midpoint SC-CO2 ($ = USD)
Developed, open space9.61.46.474.7111.30.0
203.5 km2 (4.7 × 10⁹ kg C)1.2 × 1082.0 × 1079.1 × 1088.8 × 1082.8 × 1090.0
$795.2M$20.8M$3.3M$153.8M$148.7M$468.6M0.0
Developed, medium intensity24.31.02.561.6116.50.0
206.0 km2 (4.3 × 10⁹ kg C)3.1 × 1081.4 × 1073.6 × 1087.3 × 1082.9 × 1090.0
$728.2M$52.7M$2.4M$60.1M$122.6M$490.5M0.0
Developed, low intensity1.80.83.965.3124.10.0
195.9 km2 (4.5 × 10⁹ kg C)2.3 × 1071.1 × 1075.6 × 1087.7 × 1083.1 × 1090.0
$751.9M$3.9M$1.9M$93.7M$129.9M$522.5M0.0
Developed, high intensity21.60.31.326.966.30.0
116.5 km2 (2.4 × 10⁹ kg C)2.8 × 1084.2 × 1061.9 × 1083.2 × 1081.7 × 1090.0
$411.5M$46.9M$708,000.0$31.2M$53.5M$279.1M0.0
Totals57.43.614.0228.6418.30.0
721.8 km2 (1.6 × 10¹⁰ kg C)7.3 × 1085.0 × 1072.0 × 1092.7 × 1091.0 × 10100.0
$2.7B$124.6M$8.5M$336.4M$454.9M$1.8B0.0
Note: Inceptisols, Entisols, Alfisols, Ultisols, and Mollisols are mineral soils. Histosols are most often organic soils. M = million = 106; B = billion = 109. Supplemental Table S5 contains the minimum and maximum values.
Table 5. Land use/land cover (LULC) changes between 2001 and 2016 shown by soil order for Lake County, Illinois (IL) (USA).
NLCD Land Cover Classes
(LULC),
Soil Health Continuum
Dynamics
Change in Area,
2001–2016
(%)
Degree of Weathering and Soil Development
SlightModerateStrong
EntisolsInceptisolsHistosolsAlfisolsMollisolsUltisols
Change in Area, 2001–2016 (%)
Barren land−67.5  −37.9 −97.9 −76.8 −76.0 −75.6 0.0
Woody wetlands0.5  −3.9 −90.0 2.2 −5.0 1.0 0.0
Shrub/Scrub−1.9  −12.6 −20.0 61.3 3.7 −10.2 0.0
Mixed forest−10.7  −7.8 −40.0 −16.1 −9.6 −12.6 0.0
Deciduous forest−7.4  −7.5 −13.1 −8.0 −6.9 −7.8 0.0
Herbaceous−26.0  −24.8 −34.9 −32.6 −25.4 −25.8 0.0
Evergreen forest−6.4  −0.6 0.0 −20.0 −7.0 −8.9 0.0
Emergent herbaceous wetlands−4.0  −9.1 0.0 −2.1 −8.4 −4.2 0.0
Hay/Pasture−13.1  −11.8 −7.3 −16.6 −11.6 −15.6 0.0
Cultivated crops−18.1  −14.0 −27.9 −20.5 −17.1 −20.6 0.0
Developed, open space12.9  15.0 68.3 14.6 12.1 12.6 0.0
Developed, medium intensity13.5  13.2 14.4 14.0 13.9 13.2 0.0
Developed, low intensity6.6  7.4 17.0 7.5 6.0 6.7 0.0
Developed, high intensity17.8  12.3 46.2 14.7 21.4 19.5 0.0
Note: Inceptisols, Entisols, Alfisols, Ultisols, and Mollisols are mineral soils. Histosols are predominately organic soils.
Table 6. Past and recent deteriorations in soil health from developments by economic development regions, Illinois (IL) (USA).
Illinois Economic
Development Regions
Past Developments (through 2016) Recent Developments (2001–2016)
Area
(km2)
Midpoint
TSC Loss (kg)
Midpoint
SC-CO2 ($)
Area
(km2)
Midpoint
TSC Loss (kg)
Midpoint
SC-CO2 ($)
Northeast4488.0 9.2 × 10¹⁰$15.4B 451.4 1.1 × 10¹⁰$1.8B 
Northern Stateline612.5 1.3 × 10¹⁰$2.3B 45.5 1.1 × 10⁹$190.9M 
Northwest1101.2 2.2 × 10¹⁰$3.8B 30.9 6.3 × 10⁸$106.7M 
East Central737.5 1.7 × 10¹⁰$2.8B 21.0 4.7 × 10⁸$78.9M 
North Central1126.8 2.3 × 10¹⁰$3.8B 41.8 7.9 × 10⁸$133.6M 
West Central698.7 1.2 × 10¹⁰$2.1B 9.9 1.6 × 10⁸$27.1M 
Central1197.1 2.2 × 10¹⁰$3.7B 29.3 5.1 × 10⁸$86.5M 
Southeast1026.2 1.5 × 10¹⁰$2.5B 11.2 1.7 × 10⁸$27.9M 
Southwest1180.8 1.8 × 10¹⁰$3.0B 83.5 1.4 × 10⁹$236.8M 
Southern1228.2 1.6 × 10¹⁰$2.6B 14.6 1.8 × 10⁸$30.8M 
Total13,397.02.5 × 1011$41.9B738.91.6 × 1010$2.7B
Note: TSC = total soil carbon; SC-CO2 = social costs of carbon dioxide emissions; M = million = 106; B = billion = 109.
Disclaimer/Publisher’s Note: The statements, opinions and data contained in all publications are solely those of the individual author(s) and contributor(s) and not of MDPI and/or the editor(s). MDPI and/or the editor(s) disclaim responsibility for any injury to people or property resulting from any ideas, methods, instructions or products referred to in the content.

