Abstract
Non-grain production of cultivated land (NGPCL) is an essential factor that affects food security and sustainable agricultural development. Due to the large population and limited land area present in China, cultivated land resources are more extensive and valuable in hilly and mountainous areas, though the expansion of NGPCL threatens food security and is detrimental to the sustainable use of cultivated land resources. To better understand the problem of NGPCL in hilly and mountainous areas, this paper initially classifies NGPCL into four distinct types, namely unplanted cultivated land (UCL), planted non-grain crops (PNGC), engineering recoverable (ENR), and immediately recoverable (IMR), based on their planting types and attributes. Subsequently, we analyzed the spatial patterns and differentiation characteristics of these NGPCL types in Le’an County at the village scale through exploratory spatial data analysis and studied their driving factors using the geographical detector model. The findings show that the NGPCL rate in Le’an County was 18.53%, with ENR occupying the largest area, followed by PNGC and UCL, while IMR had the smallest area. The spatial distribution of NGPCL in Le’an County suggests that there are correlations with all four types of NGPCL, which exhibit spatial clustering, except for IMR, which displays spatial heterogeneity. We attribute the phenomenon of NGPCL in Le’an County to natural, social, and economic factors, with the driving forces having varying degrees of influence. Specifically, slope, altitude, and cultivated land protection intensity play significant roles in the overall NGPCL. This paper is of crucial significance to the local agricultural management department’s efforts to prevent and control the non-grain production of cultivated land and the Chinese Government’s efforts to ensure food security.
1. Introduction
The global COVID-19 pandemic and the rise of international unilateralism have resulted in the stacking of trade barriers in global markets, the disruption of normal international trade, and the destruction of food supply chains [1]. In addition, the deterioration in the international security situation and the frequent occurrence of extreme meteorological disasters have led to an unstable global food supply, increasing the risk of people suffering from hunger and making guaranteeing food security an important strategic objective for countries worldwide [2,3,4]. As a major grain producer and consumer, it is significant for China to ensure sufficient cultivated land is available for grain production to maintain food security in China and across the world. However, the phenomenon of non-grain production of cultivated land (NGPCL) has become increasingly prominent in China in recent years, with an average rate of 33.2%, and over one-third of provinces have higher rates than the national average [5]. Some areas even recorded rates of nearly 50% [6]. The seriousness of this issue necessitates exploring appropriate ways to address the NGPCL phenomenon.
NGPCL, broadly speaking, refers to the restructuring of agricultural land use, which includes the conversion of cultivated land into forest land and garden land, among other uses [7]. In a narrower sense, NGPCL only pertains to the adjustment of cultivated land planting structure from grain crop to non-grain crop or other economic crop plantings [8]. Unlike the non-agriculturalization of cultivated land, non-grain cultivated land retains some degree of reversibility to its original grain production purpose [9,10]. Presently, non-grain production has surpassed non-agriculturalization of land and has become a mainstream phenomenon [11]. Against a backdrop of diminishing comparative benefits of food cultivation and strong market demand for non-grain agricultural products, a significant portion of cultivated land has shifted to non-grain crop cultivation. Nonetheless, there are wide variations in non-grain crop cultivation between different regions and cultivated land types [12,13]. Moderate NGPCL is in line with the development trend of agricultural production, which is conducive to the integrated development of rural industries, the increase in farmers’ incomes, and the implementation of rural revitalization strategies. But the disorderly development of NGPCL will lead to the unsustainable utilization of cultivated land resources and pose a severe threat to food security [14,15]. In November 2020, the General Office of the State Council of China issued the “Opinions on Preventing the Non-Grain Production of Cultivated Land and Stabilizing Grain Production”, pointing out that it is necessary to take effective measures to prevent an increase in NGPCL, effectively ensure food security, and clarify the priorities of cultivated land use. It can be seen that NGPCL has become an important issue related to China’s food security and agricultural modernization development, which has attracted significant attention.
Research into NGPCL has mainly focused on analyzing the current situation [16,17], discussing driving forces [18,19,20], examining policy impacts on NGPCL [21,22,23], and proposing countermeasures to address issues related to NGPCL [24,25,26]. Due to significant spatial differences in China’s resource endowment and socioeconomic development, research into the spatial patterns and mechanisms of regional NGPCL has increasingly grown, with studies considering the problem at national- [27,28], provincial- [29], and county-level scales [30]. Most existing studies utilize statistical yearbook data and mathematical measurement methods to quantify non-grain production [31,32]. The study area is mainly concentrated in suburban areas, which are greatly affected by urbanization [6,33,34]; the unique climate terrain areas with poor natural conditions [35,36,37]; the economically developed coastal areas [32]; and the major grain-producing areas with better production conditions [38,39]. The formation mechanism of NGPCL is complex and diverse, resulting from the interactions between natural, economic, and social factors. Numerous research findings have demonstrated that natural elements are fundamental [40], while socioeconomic factors are dominant [18,41]. In different regions, factors such as urbanization [42,43,44], land transfer [31,45], and the influx of industrial and commercial capital into rural areas [46,47,48] play varying roles. Moreover, farmers’ characteristics also significantly impact the tendency of NGPCL to occur, and their behavior ultimately depends on careful consideration of costs and benefits [49,50].
Despite the abundance of existing research into NGPCL, several deficiencies still need to be addressed. Firstly, there is a lack of attention being paid to NGPCL in hilly and mountainous areas. China is a mountainous country, with 34.62% of the country’s cultivated land and 39.60% of the country’s food cultivation area being located in hilly and mountainous counties, and the issue of NGPCL in hilly and mountainous areas is a matter of national food security [51]. Secondly, the majority of existing studies of NGPCL utilize statistical data to explore the topic at the macro-scale, with a scarcity of micro-scale studies conducted at the village level, which use more detailed land use data. Thirdly, studies of the driving forces involved have been carried out, and they mostly treated different types of NGPCL as a unified whole and neglected the differences between them, even though understanding the formation mechanisms driving different types of NGPCL is crucial to managing cultivated land. To address these gaps, this paper uses authoritative and detailed land use data to innovatively summarize four different types of non-grain production of cultivated land and analyze the levels and spatial patterns of non-grain production of cultivated land in hilly and mountainous areas at the village scale. In addition, we study the factors that affect different types of non-grain production of cultivated land from natural, social, and economic perspectives and propose corresponding strategies. Through this study, we hope to better understand the current situation and formation mechanisms driving NGPCL in hilly and mountainous areas, which will provide a reference for refining the management of non-grain production of cultivated land and ensuring national food security.
2. Materials and Methods
2.1. Study Area
Le’an County is located in the hills of southeastern China, at 115°35′–116°10′ E, 26°50′–27°45′ N, and is part of Jiangxi Province, China. The county’s total area is 2412.6 km2, with mountains accounting for 38%, low hills accounting for 51%, and high hills accounting for 11% of territory. The terrain is elevated in the southeast, though it is relatively low; mountainous in the south; and predominantly hilly in the north (Figure 1). As of 2019, the county has about 35,696.18 ha of cultivated land, accounting for 14.80% of its total area, making it a large land resource county with vast cultivated land reserves. Affected by the subtropical monsoon climate, the rain and heat seasons occur in the same period, and the grain production conditions of cultivated land are excellent. However, from 2010 to 2019, the planting area of non-grain crops expanded from 2147.2 to 3654.8 ha, with many cultivated land resources being encroached upon and the risk of NGPCL being high. At the same time, the forest coverage rate of Le’an County is as high as 70.42%, which covers the water conservation area surrounding Fu River and Ganjiang River in Jiangxi Province, which is an integrated ecological restoration area of mountains, rivers, forests, fields, lakes, grasslands, making it one of the areas critical to maintaining ecological security. Under the guidance of the ecological priority goal, the way in which cultivated land resources are used as a spatial carrier for ecological restoration is also affected. Therefore, it was reasonable to select Le’an County as representative of the problem of NGPCL in hilly and mountainous areas, as it could provide a reference for the management of NGPCL in similar areas.
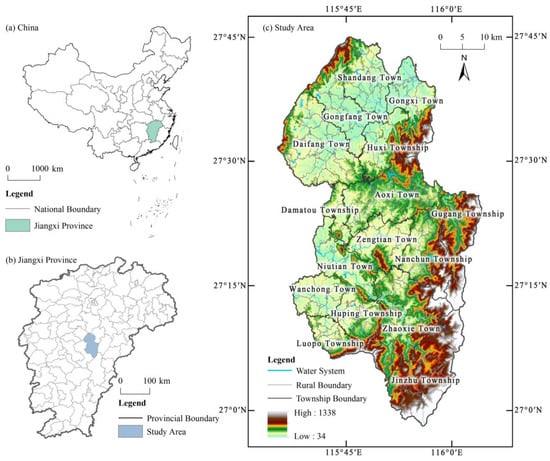
Figure 1.
Location and topography of Le’an County.
2.2. Data Sources
Our data sources mainly included spatial and attribute data. The spatial data included the Third National Land Survey data of Le’an County in 2020, which were derived from the Department of Land and Resources. The digital elevation model (DEM) originates from the Geospatial Data Cloud Platform’s (http://www.gscloud.cn, accessed on 3 March 2023) ASTER GDEM 30-m data. The attribute data included socio-economic data, such as population and industry, and the data sources included the “Fuzhou Statistical Yearbook (2020)”, which we derived from the official website of the Fuzhou Municipal Bureau of Statistics (http://tjj.jxfz.gov.cn, accessed on 10 March 2023), as well as the “Le’an Statistical Yearbook (2020)” and statistical reports on the basic socioeconomic conditions in each town, which were derived from Le’an County Bureau of Statistics.
2.3. Methods
2.3.1. The Definition of NGPCL
Following “The Technical Regulations of the Third National Land Survey of China”, the cultivated land was transformed into forest land, garden land, grassland, and other agricultural lands, which were known as adjustable lands. We categorized the planting attributes as “Immediately Recoverable (IMR)” and “Engineering Recoverable (ENR)” based on the extent of damage and the potential for restoration. IMR refers to the plots of land whose current cultivated land utilization type is one of forest land, garden land, grassland, or other agricultural lands, and they can be easily converted back into cultivated land through simple cleaning processes. ENR refers to the plots of land whose current cultivated land utilization type is one of forest land, garden land, grassland, or other agricultural lands, but they cannot be directly converted back into cultivated land through cleaning alone and need to be recovered by taking specific engineered measures. The NGPCL in this paper falls under the generalized definition and includes two types: firstly, land used for cultivation of types of planting non-grain crops (PNGC, including planted vegetables, cotton, oilseeds, sugar, forage, tobacco, etc.) or unplanted cultivated land (UCL) patches, and, secondly, land patches with planting attributes of IMR and ENR, such as the land use type being one of forest, garden, grassland, or other agricultural lands (including adjustable orchards, tea gardens, bamboo forest land, pasture land, water surfaces of pits and ponds, etc.).
The formula is written as follows:
In Equation (1), is the rate of NGPCL, is the total area of cultivated land, is the cultivated land used for PNGC, is the unplanted cultivated land (UCL), is the agricultural land with IMR planting attributes, and is the agricultural land with ENR planting attributes.
2.3.2. Research Framework
Different types of NGPCL can have varying impacts on the soil tillage layer [52]. To better understand the issue of NGPCL in hilly and mountainous areas at the village scale, it is necessary to explore the spatial characteristics and driving forces of different types of NGPCL. Therefore, we established a four-step research framework (Figure 2). Firstly, we integrated data from the Third Land Survey and field surveys to classify NGPCL into four types based on cultivation types and attributes: UCL, PNGC, IMR, and ENR. This classification represented a broad definition of NGPCL. Next, spatial statistics were employed to comprehend the quantity and specific spatial distributions of the different types of NGPCL. Subsequently, exploratory spatial data analysis was used to investigate the spatial differentiation and association characteristics of overall NGPCL and other types. Additionally, the driving forces of NGPCL were studied by selecting influential factors from the natural–social–economic systems, aided by the geographical detector model. Finally, policy recommendations for preventing and controlling NGPCL are proposed, considering the broader context of food security and the practical need to improve economic efficiency.
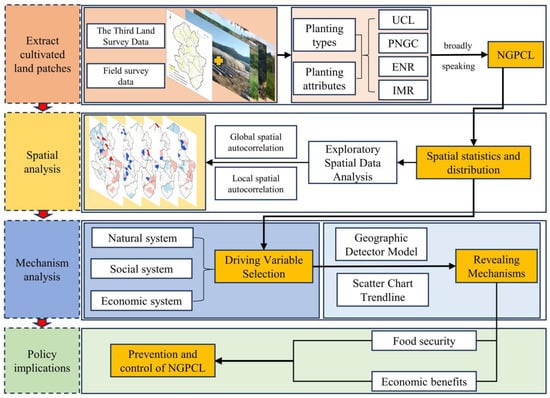
Figure 2.
Research framework of this paper.
2.3.3. Exploratory Spatial Data Analysis
Exploratory spatial data analysis was used to analyze the spatial pattern of NGPCL in Le’an County in terms of both global spatial autocorrelation and local spatial autocorrelation. The global Moran’s index can evaluate the heterogeneity and dependence of a phenomenon in regional space. The formula is written as follows:
In Equation (2), is the spatial unit, is the weight of the spatial unit, and denote the values of the space unit i and the space unit j, and is the mean value of the spatial unit. The value of I is in the range of [0, 1]; a value of I greater than 0 indicates a state of agglomerative distribution, a value of I less than 0 indicates a state of discrete distribution, and a value of I equal to 0 indicates a state of random distribution.
Also, the local Moran’s I is used to analyze the distribution’s characteristics on the regional space. The formula is written as follows:
In Equation (3), a value of greater than 0 indicates that similar spatial agglomeration occurs around space i, and a value of less than 0 indicates that dissimilar spatial agglomeration occurs.
2.3.4. Geographical Detector Model
The geographical detector model can quantify the driving factors of geographical objects or phenomena [53], and this paper uses its factor detector sub-model to analyze the driving factors of NGPCL in Le’an County. The formula is written as follows:
In Equation (4), is the driving force of the influence factor X to the explained variable Y; and are the sample size and variance of the study area, respectively; and is the partition with an impact factor X. The value of ranges from 0 to 1, and a larger value of indicates a stronger driving force.
2.3.5. Driving Variable Selection
The study revealed that the NGPCL is influenced by multiple factors, including resource endowment, demographic conditions, government policies, and economic conditions [18,20]. The undulating topography of Le’an County may have an impact on the NGPCL. The renovation of rural roads and the construction of water conservancy facilities in recent years have improved the cultivation conditions of some arable land, which may also have an impact on the NGPCL. Taking into account the actual situation of the study area, i.e., the representativeness and accessibility of the factors, based on the “nature-society-economy” system, the altitude and slope were selected to represent the topography, the per capita cultivated land area was selected to represent the resource endowment, the intensity of cultivated land protection and ecological protection were selected to represent the government policy, the natural population growth rate was selected to represent the population conditions, the irrigation and transportation convenience were selected to represent the farming conditions, and the proportions of the second and third industrial land types were selected to represent the economic conditions (Table 1).

Table 1.
Variables and descriptions.
3. Results
3.1. Spatial Pattern of NGPCL
Through the analysis of the Third Land Survey data in Le’an County, 20,120 non-grain land patches were extracted, which had a total area of 6614.60 ha, and the NGPCL rate was about 18.53%, according to Equation (1). In terms of the composition of land types, the area of cultivated land was 3697.57 ha, accounting for approximately 55.90% of the total area of NGPCL, of which 1710.68 ha was paddy land and 1986.89 ha was dry land, and there was no irrigated land. The area of adjustable land types was 2917.03 ha, accounting for about 44.10% of the total area of NGPCL, of which the areas of forest land, garden land, grassland, and other agricultural lands were 1921.03 ha, 384.09 ha, 0.30 ha, and 611.61 ha, respectively (Table 2).
Table 2.
Composition of NGPCL.
According to the analysis of NGPCL types and their distribution (Table 2 and Figure 3), the total area of UCL was 1803.20 ha, with the majority of these land types located in Aoxi, Daifang, Gongxi, and other townships. Among them, the area of unplanted paddy land was 1545.34 ha, accounting for 85.70% of the total. These findings clearly illustrate that the abandonment of high-quality cultivated land has become an urgent issue that needs to be addressed. The area of PNGC was 1894.36 ha, which was primarily distributed in the townships of Aoxi, Niutian, Shandang, Daifang, Gongfang, etc. Due to the limitation of irrigation conditions, most dryland grain crops are planted at a higher cost. Indeed, the dryland area in the non-grain cultivated land patches was 1729.03 ha, accounting for 91.27% of the total. ENR cultivated land spanned 2537.29 ha, and it was mainly distributed in high mountain areas, like Zhaoxie, Jinzhu, and Gugang. These areas have high altitudes, undulating terrain, and extensive mountain forests, some of which can be adjusted to allow engineering measures to restore cultivated land; thus, the area of forest land accounts for 75.39%. IMR cultivated land spanned an area of 379.75 ha, with the soil cultivation layer remaining undamaged and easily restored to cultivated land via simple transformations. These types of NGPCL are primarily located in Aoxi, Nancun, Shandang, Daifang, and Gongfang townships, with recoverable garden land accounting for the largest area, i.e., 201.25 ha, or 53.00%, followed by other agricultural lands, i.e., 170.35 ha, or 44.86%.
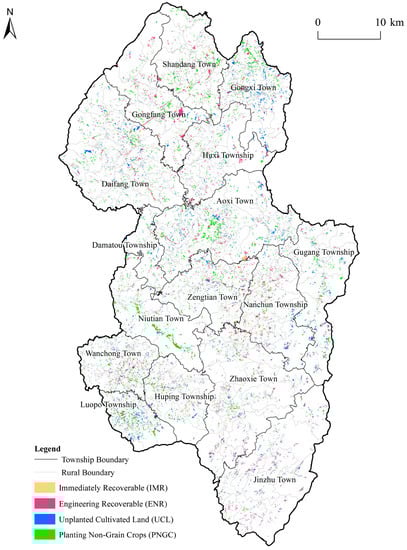
Figure 3.
Spatial distribution of NGPCL.
In the process of NGPCL in Le’an County, the problem of the abandonment of high-quality cultivated land is prominent, the lack of irrigation water leads to the non-grain transformation of dry land becoming more serious, and the conversion of NGPCL into forest land is significant, leading to high costs and later difficulties in the restoration of cultivated land.
3.2. Spatial Differentiation Characteristics of NGPCL
According to Equation (2), the global spatial autocorrelation results showed that the global Moran’s I values of UCL, PNGC, ENR, and Overall were 0.285, 0.523, 0.227, and 0.347, respectively, and passed the significance level test (p < 0.05), which indicates that the rates of the above types of NGPCL and the surrounding village areas have similar trends and show clustering characteristics in space, which may be related to the clustering and diffusion mechanism involved in the development of non-grain crops. In contrast, the global Moran’s I value of −0.002 for the IMR did not pass the significance level test (p < 0.05), with this result related to the small size and scattered distribution of this type of NGPCL.
The calculation results of Equation (3) were visualized using ArcGIS 10.2 software. In Le’an County, villages with significant agglomeration characteristics represented 83.1% of the five types of NGPCL that passed the significance test, with the UCL type being the largest, followed by the Overall and PNGC (Figure 4). The “low-low” type of NGPCL clustering comprises nearly 50% of the total, with significant differences in distribution observed among varying kinds of NGPCL. This pattern is primarily concentrated in the northern part of the county, including Daifang, Gongfang, Shandang, and Nancun townships, with sporadic appearances in villages of other towns. These areas have lower levels of NGPCL and are predominantly focused on grain cultivation. On the other hand, the “high-high” type of NGPCL agglomeration is about 34.74%, being mostly distributed in areas with high rates of NGPCL and evenly distributed among various types of NGPCL. This type of NGPCL is also concentrated in the eastern part of the county, such as Gugang, Zhaoxie, Jinzhu, and Gongxi townships, as well as the county seat Aoxi Town, indicating that these areas are more prone to non-grain crop growth, reflecting the role of economic conditions and transportation locations in promoting non-grain crop production.
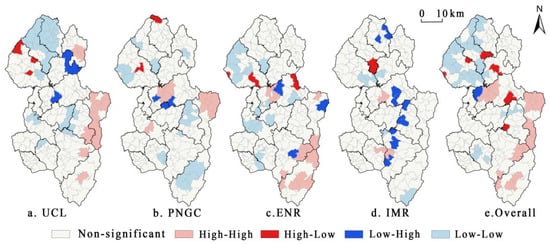
Figure 4.
LISA map of the NGPCL rate at the village scale. (a) UCL; (b) PNGC; (c) ENR; (d) IMR; (e) Overall.
3.3. Driving Factors Analysis of NGPCL
The background of natural resources and social and economic development status in different regions of Le’an County are diverse, and the dominant factors of different types of NGPC also vary. With each type of NGPCL being the dependent variable and the selected driving factors being independent variables (Table 1), the geographical detector model quantitatively analyzed each element to identify the dominant factors of NGPCL based on Equation (4) (Table 3). In order to make up for the lack of interpretation of the positive and negative effects of the driving forces of the factors, the rates of NGPCL and each factor are drawn on a scatter plot, and the driving force direction is determined using the trend line. There are significant differences between the driving forces of each factor regarding the rate of overall NGPCL in Le’an County and different types of NGPCL. The per capita cultivated land area and traffic convenience are negative driving forces, while all other factors were positive driving forces.
Table 3.
Detection results of the driving factors of various types of NGPCL.
The dominant driving forces of overall NGPCL in Le’an County were slope, altitude, and cultivated land protection intensity, which had q-values of 0.312, 0.305, and 0.358, respectively. Altitude and slope significantly positively affected the NGPCL in 2019 in Le’an County. Specifically, the steeper the slope and higher the altitude, the higher the NGPCL. In areas with slope gradients of less than 15°, the area covered by non-grain production accounted for 94.35% of the total NGPCL area, while the NGPCL rate only accounted for 13.05% of that area. However, in areas with slope gradients greater than 35°, cultivated land that was used for non-grain production covered only 2.31 ha, and the NGPCL rate was as high as 82.70% (Figure 5a). In areas located at altitudes of less than 200 m, 3837.54 ha of cultivated land was used for non-grain production, and the NGPCL rate was only 12.08%, while the 0.11 ha of cultivated land located at altitudes above 1000 m was used for non-grain production (Figure 5b). The primary reason for this trend is that the cultivated land in regions with steep slopes and high altitudes is limited and fragmented due to inadequate farming and irrigation infrastructure, resulting in the reduced profitability of grain production and the higher prevalence of NGPCL. The intensity of cultivated land protection in Le’an County did not yield the expected results. In 2019, the NGPCL area accounted for 3262.26 ha, or 49.32%, of the total NGPCL area located in the permanent basic farmland protection area. The substantial area of NGPCL within the permanent basic farmland protection area reveals that the delineation of the reserve did not effectively control the expansion of NGPCL in Le’an County. Meanwhile, the results of the geographical detector model analysis and the scatter plot analysis show that there is a significant positive correlation between the rate of NGPCL and the intensity of cultivated land protection (Table 3 and Figure 6), which indicates that the NGPCL rates in villages with larger permanent basic farmland protection areas are higher.

Figure 5.
Terrain zoning statistics of NGPCL: (a) altitude zoning statistics of NGPCL; (b) slope zoning statistics of NGPCL.
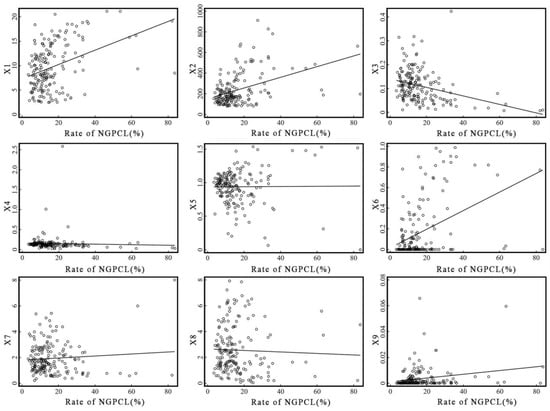
Figure 6.
Scatter plot of the impact of driving factors on NGPCL.
The primary factor influencing the presence of unplanted cultivated land (UCL) was the altitude, which had a q-value of 0.320, while the dominant factor influencing the planting of non-grain crops (PNGC) was the area of cultivated land per capita, which had a q-value of 0.290. As altitude increases, cultivated land becomes more fragmented, and the cost and difficulty of planting crops also increase, leading to the abandonment of the land. The planting of non-grain crops is mainly distributed in regions with vast arable land resources, and the higher per capita cultivated land area leads farmers to put the extra cultivated land to more economically efficient use via non-grain crop cultivation after meeting their own food needs, resulting in a higher level of NGPCL.
The main factors driving engineering recoverable (ENR) cultivated land were the intensity of cultivated land protection and ecological protection, which had q-values of 0.437 and 0.357, respectively. Permanent basic farmland reserves and ecological protection red line areas were often areas with better agricultural production conditions and an excellent ecological environment, though driven by economic incentives and the lack of strict implementation of policy control, some farmers have transformed their arable land into orchards, woodlands, or other agricultural lands to grow cash crops, leading to a high degree of NGPCL. All of the immediately recoverable (IMR) cultivated land factors did not pass the significance test, which is somewhat related to the small proportion of such types relative to the total NGPCL land area and the random causes of their formation.
4. Discussion
4.1. NGPCL in Hilly and Mountainous Areas
The rate of overall NGPCL in hilly and mountainous areas located in Le’an County is lower than the national average [5], but it is higher than that identified in other major grain-producing regions [39]. Compared to the plain areas, the hilly and mountainous areas are more suitable for developing the forestry and fruit industries [54]. At the same time, due to the increasing attention paid to ecological civilization construction, the increase in vegetation coverage inevitably encroaches on some cultivated land, and Le’an County faces the same dilemma as other mountainous areas regarding ecological construction and cultivated land protection [55].
In Le’an County, the spatial pattern of NGPCL exhibits distinct characteristics. Specifically, adjustable and unplanted land dominates the NGPCL, being primarily distributed in high mountain areas, such as Zhaoxie, Jinzhu, and Gugang. The focus on prioritizing ecological preservation efforts has resulted in the sizable transformation of arable land into forested areas in conjunction with elevated land abandonment, and the latter trend can be attributed to the challenging terrain. In contrast, the cultivated land used to plant non-grain crops is chiefly concentrated in the county seat and low hilly areas, such as Niutian, Gongfang, and Shandang. This distribution pattern suggests that cultivated land with better resource endowment conditions is often prone to changes in planting structure, while cultivated land with poor conditions is more susceptible to changes in the agriculture industry’s structure or abandonment [56,57,58].
There is a significant spatial aggregation and diffusion effect of NGPCL in the study area, which is consistent with results of other regional studies [16,20]. The cultivated land with high altitudes and steep slopes has poor irrigation conditions, and it is difficult to carry out mechanized production, meaning that farmers often choose to abandon land or plant more economically efficient cash crops after weighing. In the social network that stems from rural acquaintance, farmers imitate and learn from each other’s planting behaviors [59]. Once a farmer who grows non-grain crops achieves better economic returns, the surrounding farmers often make the same choice, as they’re driven by their financial interests.
4.2. Cultivated Land Protection Policy and NGPCL
China’s per capita cultivated land area is less than half of the global average, and it is China’s basic national condition that there are more people and less land, as well as insufficient reserve cultivated land resources. Therefore, the Chinese Government has optimized cultivated protection policies for many years. Implementing the “Land Management Law” in 1987 marked the beginning of the institutionalization, legalization, and institutionalization of cultivated land protection and quality management in China [60]. In 2008, the State Council of China issued the “Outline of the National Overall Land Use Plan (2006–2020)”, which also made clear requirements regarding the quantity and quality of cultivated land [61]. Subsequently, a series of measures were introduced regarding the cultivated land requisition–compensation balance, the implementation of the permanent basic farmland system, the curbing of non-agriculturalization, and the prevention of non-grain production of cultivated land, and China has, thus, gradually formed a comprehensive protection and utilization system that takes into account quantitative protection, quality construction, and ecological maintenance [62]. The government has devised a complete top-level design program for cultivated land protection. However, as far as the results of this study are concerned, the cultivated land protection policy has yet to achieve the desired results. The behaviors of abandoning cultivated land and destroying the soil layer of cultivated land are frequently displayed, and the phenomenon of NGPCL needs to be effectively curbed. This issue has been confirmed in other studies [20], indicating the broad nature of this phenomenon and the complexity of the reasons behind it.
The NGPCL is affected by a combination of multiple conflicts, of which food security and economic efficiency are major examples [63]. The cultivation of non-grain crops by farmers and other business entities can contribute to increased income, while government promotion of non-grain crop planting can foster regional economic development and reflect managerial performance [64]. The central government’s willingness to protect cultivated land is strongest at this time, and the upward extension of this willingness to protect cultivated land may render the original cultivated land protection policy ineffective [65]. Given that farmers and the government can economically benefit from this situation, cultivating land protection measures may be overshadowed by the pursuit of maximum economic advantage. This issue explains why managers tend to blur the concept of NGPCL to avoid certain regulatory restraints and prioritize adherence to the red line of 1.8 billion mu of cultivated land, rather than monitoring agricultural production that occurs on cultivated land. On one hand, it is the most stringent farmland protection system, while on the other hand, it causes a disparity between the goal of farmland protection and the actual results. Moreover, due to variations in the intensity of current farmland protection policies and legal provisions [66], the awareness of the grain production responsibilities of farmers and other business entities is still relatively low, and the independent management behavior of farmers has not been constrained, which has caused difficulties in the management of NGPCL. The farmland land protection policy is the result of the balancing of multiple interests [67], and the best way to adjust the policy to mobilize farmers, government, and society to participate in the prevention and control of NGPCL and guarantee food production should be the focus of future research.
4.3. Policy Implications
In the context of ecological construction in hilly and mountainous areas, the conversion of cultivated land into forest land and the abandonment phenomenon are the main problems related to the influence of topography and terrain. Together with the failure of the cultivated land protection policy, the various types of NGPCL trends are apparent. With these issues in mind, based on the actual situation of hilly and mountainous areas, we put forward the following proposals from the perspective of balancing food security and economic benefits.
To promote the implementation of land improvement and the construction of high-standard farmland, land leveling of terraced fields and fragmented arable land in hilly and mountainous areas should be prioritized to increase the mechanization of arable land. Additionally, opening up the connection between field paths and main roads should be considered to improve the traffic location conditions of cultivated land. Finally, advancing the construction of the agricultural irrigation capillary network can help to reduce irrigation costs for farmers.
It is essential to consider their unique characteristics to effectively manage different types of NGPCL (Figure 7). Engineering recoverable cultivated land, which is difficult and expensive to restore, should undergo land remediation assessment and restoration in phases. When planting non-grain crops, improving the industrial layout is crucial to guide the rational concentration of economic crops and prevent disorderly expansion. Ecological planting should also be promoted to reduce damage to the soil cultivation layer. Addressing the problem of idle cultivated land, especially the abandonment of high-quality cultivated land, is crucial to prevent and control the NGPCL. Measures such as guiding land transfer and improving incentives for planting should be actively pursued. Finally, immediate control measures must be implemented to prevent the conversion of immediately recoverable cultivated land into engineering recoverable cultivated land.
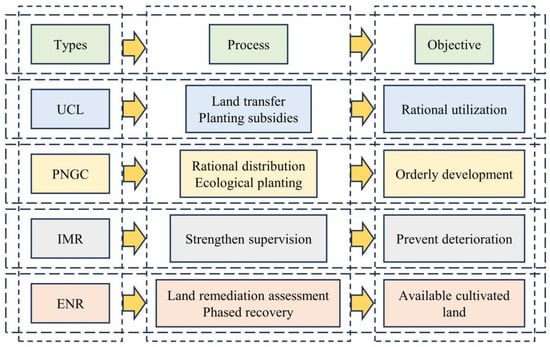
Figure 7.
Control processes and objectives for the different types of NGPCL.
Improved laws and regulations related to the protection of cultivated and strengthened government oversight are required. Under the premise of considering farmers’ interests, government must construct matching laws and rules that reflect the strict cultivated land protection policy and increase the penalty and cost of breaking laws related to damaging cultivated land. At the same time, the government’s supervision and management functions should be strengthened, and non-grain production activities within basic farmland should be strictly prohibited to ensure the reasonable use of cultivated land. Government should also enhance education and make farmers and other businesses aware of their primary responsibility to protect cultivated land.
4.4. Limitations and Future Prospects
This paper analyzes the current situation and spatial distribution of non-grain production of cultivated land in hilly and mountainous areas using authoritative and detailed land use data, providing a new approach for the comprehensive understanding of non-grain production of cultivated land in China. On this basis, we summarize four different types of non-grain production of cultivated land, explore their drivers based on the village scale, and propose coping strategies. This paper provides new insights into the refinement of non-grain production of cultivated land for prevention and control at the village scale. The study results closely reflect the problem of non-grain production of cultivation land in hilly and mountainous areas, making it an essential reference for policy formulation and management of government departments. However, this paper still has some limitations. Firstly, there is a current need for a unified understanding of NGPCL by the Chinese Government and academia [68], resulting in different criteria being used to identify NGPCL in different regions. We combined current research results, field surveys, and experts’ opinions to classify the types of NGPCL based on a broad definition. This discrepancy may result in variations in the research findings being observed in other locations. Secondly, as we were limited by data availability, we only analyzed a single-time cross-section, which may affect our judgements of the trend of changes in NGPCL.
In the follow-up study, we should focus on establishing a unified understanding of NGPCL by combining theoretical and practical perspectives, enabling more effective horizontal comparisons. Meanwhile, data sources need to be enriched to conduct dynamic monitoring studies over long time series. Furthermore, it is crucial to consider the decision-making processes of the main management body, and future research can further explore the driving forces of NGPCL by conducting household surveys.
5. Conclusions
The study of NGPCL in hilly and mountainous counties is of great significance to ensuring food security, but there are few related studies. Based on the Third Land Survey data of Le’an County, this paper analyzes the spatial distribution pattern and spatial differentiation characteristics of NGPCL in Le’an County and discusses the driving forces of NGPCL using the geographical detector model. The main conclusions are as follows.
In 2019, the rate of NGPCL in Le’an County was about 18.53%; the area of engineering recoverable cultivated land was the largest, and significant ratios of adjustment of cultivated land to forest land, garden land, and other agricultural land uses were recorded. The abandonment of high-quality paddy fields and non-grain production in drylands is prominent, and the dominant areas of food production overlap with the concentration of NGPCL.
The spatial distribution of NGPCL in Le’an County has a spatial correlation. Excluding the immediately recoverable cultivated land, the rates of the remaining four types of NGPCL showed spatial clustering. The high-value areas were concentrated in the townships of Aoxi, Gugang, Zhaoxie, and Jinzhu, and the low-value areas were concentrated in Gongfang, Daifang, and Shandang.
The NGPCL in Le’an County is driven by a combination of natural, social, and economic factors, and there is variability in the magnitude and direction of the driving forces of each factor. Slope, altitude, and cultivated land protection intensity have essential impacts on the overall NGPCL. Altitude is an important factor driving UCL, PNGC is mainly influenced by the area of cultivation per capita, and cultivated protection intensity and ecological protection intensity are the main drivers of ENR.
Author Contributions
Conceptualization, Z.Z. and D.Y.; methodology, Z.Z.; software, Z.Z.; validation, L.Z. and D.Y.; formal analysis, Z.Z.; investigation, Z.Z.; resources, L.Z.; data curation, L.Z.; writing—original draft preparation, Z.Z.; writing—review and editing, D.Y.; visualization, Z.Z.; supervision, L.Z.; funding acquisition, L.Z. All authors have read and agreed to the published version of the manuscript.
Funding
This research was funded by the National Natural Science Foundation of China (Grant No. 41661114).
Data Availability Statement
Not applicable.
Conflicts of Interest
The authors declare no conflict of interest.
References
- Jeanne, L.; Bourdin, S.; Nadou, F.; Noiret, G. Economic Globalization and the COVID-19 Pandemic: Global Spread and Inequalities. GeoJournal 2022, 88, 1181–1188. [Google Scholar] [CrossRef]
- Mumuni, S.; Joseph Aleer, M. Zero Hunger by 2030—Are We on Track? Climate Variability and Change Impacts on Food Security in Africa. Cogent Food Agric. 2023, 9, 2171830. [Google Scholar] [CrossRef]
- Harris, F.; Amarnath, G.; Joy, E.J.; Dangour, A.D.; Green, R.F. Climate-Related Hazards and Indian Food Supply: Assessing the Risk Using Recent Historical Data. Glob. Food Secur. 2022, 33, 100625. [Google Scholar] [CrossRef]
- Ben Hassen, T.; El Bilali, H. Impacts of the Russia-Ukraine War on Global Food Security: Towards More Sustainable and Resilient Food Systems? Foods 2022, 11, 2301. [Google Scholar] [CrossRef]
- Li, T.Q.; He, D. Current situation of “non-grain production of cultivated land” in China and the research progress of re-tillage and fertilization technology. Chin. J. Appl. Ecol. 2023, 34, 1703–1712. [Google Scholar] [CrossRef]
- Cheng, X.; Liu, Q.; Tao, Y.; Liu, J.; Wang, F.; Tao, Q.; Ou, W. Non-grain production characteristics of cultivated land in rapidly urbanized regions and their mechanisms. China Popul. Resour. Environ. 2022, 32, 172–182. [Google Scholar]
- Huang, Z.; Li, Z.; Mao, X. The current situation and countermeasures of “non-agriculturalization” and “non-grainfication” of cultivated land in China. Jiang-Huai Trib. 2022, 4, 13–21. [Google Scholar] [CrossRef]
- Wang, Y.; Chen, Y.; Yi, X.; Xiao, B. The non-grain problem in the process of land transfer and the countermeasures. Chin. J. Agric. Resour. Reg. Plan. 2011, 32, 13–16. [Google Scholar]
- Kuang, Y.; Liu, Y. Distingushing “Non-agriculturalization” and “Non-grainification” in the Process of Rural Transfer. Rural Econ. 2018, 4, 1–6. [Google Scholar]
- Chen, M. Analysis and Countermeasures of the “Non-Grain” Phenomenon of Cultivated Land. China Land 2021, 4, 9–10. [Google Scholar] [CrossRef]
- Zhu, S. Analysis of the trend of non-grain and non-agriculturalization of rural land. Rural Bus. Manag. 2013, 1, 24–26. [Google Scholar]
- Wang, J.; Dai, C. Identifying the Spatial–Temporal Pattern of Cropland’s Non-Grain Production and Its Effects on Food Security in China. Foods 2022, 11, 3494. [Google Scholar] [CrossRef] [PubMed]
- Chang, W.; Ma, S. Research on the “non-grain” problem in the scale transfer of farmland. Agric. Econ. 2020, 9, 3–5. [Google Scholar]
- Liu, Y.; Li, Y. Revitalize the World’s Countryside. Nature 2017, 548, 275–277. [Google Scholar] [CrossRef]
- Yang, M.; Pei, Y.; Li, X. Study on grain self-sufficiency rate in China: An analysis of grain, cereal grain and edible grain. J. Nat. Resour. 2019, 34, 881–889. [Google Scholar] [CrossRef]
- Zhu, Z.; Duan, J.; Li, S.; Dai, Z.; Feng, Y. Phenomenon of Non-Grain Production of Cultivated Land Has Become Increasingly Prominent over the Last 20 Years: Evidence from Guanzhong Plain, China. Agriculture 2022, 12, 1654. [Google Scholar] [CrossRef]
- Xue, X.; Zhang, Y. Current Situation, Causes and Countermeasures Regarding Non-Grain Growing of Farmland and in Major Grain-producing Counties. Acad. J. Zhongzhou 2017, 8, 40–45. [Google Scholar]
- Cheng, X.; Tao, Y.; Huang, C.; Yi, J.; Yi, D.; Wang, F.; Tao, Q.; Xi, H.; Ou, W. Unraveling the Causal Mechanisms for Non-Grain Production of Cultivated Land: An Analysis Framework Applied in Liyang, China. Land 2022, 11, 1888. [Google Scholar] [CrossRef]
- Zhang, J.; Li, X.; Xie, S.; Xia, X. Research on the Influence Mechanism of Land Tenure Security on Farmers’ Cultivated Land Non-Grain Behavior. Agriculture 2022, 12, 1645. [Google Scholar] [CrossRef]
- Su, Y.; Qian, K.; Lin, L.; Wang, K.; Guan, T.; Gan, M. Identifying the Driving Forces of Non-Grain Production Expansion in Rural China and Its Implications for Policies on Cultivated Land Protection. Land Use Policy 2020, 92, 104435. [Google Scholar] [CrossRef]
- Qiu, T.; Boris Choy, S.T.; Li, S.; He, Q.; Luo, B. Does Land Renting-in Reduce Grain Production? Evidence from Rural China. Land Use Policy 2020, 90, 104311. [Google Scholar] [CrossRef]
- Leng, Z.; Wang, Y.; Hou, X. Structural and Efficiency Effects of Land Transfers on Food Planting: A Comparative Perspective on North and South of China. Sustainability 2021, 13, 3327. [Google Scholar] [CrossRef]
- Yang, Q.; Zhang, D. The Influence of Agricultural Industrial Policy on Non-Grain Production of Cultivated Land: A Case Study of the “One Village, One Product” Strategy Implemented in Guanzhong Plain of China. Land Use Policy 2021, 108, 105579. [Google Scholar] [CrossRef]
- Huang, J.; Zhang, Z. The Logic and Governance of Local Government’s Participation in the “Non-Grain” Transfer of Cultivated Land: A Case Study Based on Planting and Greening of Cultivated Land. China Land Sci. 2023, 37, 114–123. [Google Scholar] [CrossRef]
- Su, Y.; Su, C.; Xie, Y.; Li, T.; Li, Y.; Sun, Y. Controlling Non-Grain Production Based on Cultivated Land Multifunction Assessment. Int. J. Environ. Res. Public Health 2022, 19, 1027. [Google Scholar] [CrossRef]
- Yang, X.; Jin, X.; Sheng, X.; Fan, Y.; Jia, P.; Zhou, Y. Consolidation zoning method for non-grain cropland integrating suitability and urgency. Trans. Chin. Soc. Agric. Eng. 2022, 38, 287–296. [Google Scholar] [CrossRef]
- Zhu, Z.; Dai, Z.; Li, S.; Feng, Y. Spatiotemporal Evolution of Non-Grain Production of Cultivated Land and Its Underlying Factors in China. Int. J. Environ. Res. Public Health 2022, 19, 8210. [Google Scholar] [CrossRef]
- Feng, Y.; Ke, M.; Zhou, T. Spatio-Temporal Dynamics of Non-Grain Production of Cultivated Land in China. Sustainability 2022, 14, 14286. [Google Scholar] [CrossRef]
- Liang, X.; Jin, X.; Liu, J.; Yin, Y.; Gu, Z.; Zhang, J.; Zhou, Y. Formation Mechanism and Sustainable Productivity Impacts of Non-Grain Croplands: Evidence from Sichuan Province, China. Land Degrad. Dev. 2023, 34, 1120–1132. [Google Scholar] [CrossRef]
- Su, Y.; Li, C.; Wang, K.; Deng, J.; Shahtahmassebi, A.R.; Zhang, L.; Ao, W.; Guan, T.; Pan, Y.; Gan, M. Quantifying the Spatiotemporal Dynamics and Multi-Aspect Performance of Non-Grain Production during 2000–2015 at a Fine Scale. Ecol. Indic. 2019, 101, 410–419. [Google Scholar] [CrossRef]
- Chen, Y.; Li, M.; Zhang, Z. Does the Rural Land Transfer Promote the Non-Grain Production of Cultivated Land in China? Land 2023, 12, 688. [Google Scholar] [CrossRef]
- Sun, Y.; Chang, Y.; Liu, J.; Ge, X.; Liu, G.-J.; Chen, F. Spatial Differentiation of Non-Grain Production on Cultivated Land and Its Driving Factors in Coastal China. Sustainability 2021, 13, 13064. [Google Scholar] [CrossRef]
- Wadduwage, S. Drivers of Peri-Urban Farmers’ Land-Use Decisions: An Analysis of Factors and Characteristics. J. Land Use Sci. 2021, 16, 273–290. [Google Scholar] [CrossRef]
- Zheng, Y. Discussion on measures to prevent “non-agricultural” and “non-grain” of cultivated land in urban villages and suburban villages. Shanxi Agric. Econ. 2021, 15, 90–91. [Google Scholar] [CrossRef]
- Han, H.; Peng, H.; Li, S.; Yang, J.; Yan, Z. The Non-Agriculturalization of Cultivated Land in Karst Mountainous Areas in China. Land 2022, 11, 1727. [Google Scholar] [CrossRef]
- Chang, Y.; Liu, J.; Ma, J.; Yu, H.; Chen, F. Spatial pattern and driving factors of non-grain conversion on cultivated land in arid and semi-arid regions. J. Agric. Resour. Environ. 2023, 40, 333–344. [Google Scholar] [CrossRef]
- Wei, Y.; Wei, F.; Tong, X. Characterization and attribution identification of “non-grain” cultivated land in rocky desertification areas in Guangxi. Resour. Dev. Mark. 2023, 39, 9–15+105. [Google Scholar] [CrossRef]
- Ran, D.; Zhang, Z.; Jing, Y. A Study on the Spatial–Temporal Evolution and Driving Factors of Non-Grain Production in China’s Major Grain-Producing Provinces. Int. J. Environ. Res. Public Health 2022, 19, 16630. [Google Scholar] [CrossRef]
- Chang, Y.; Liu, J.; Zhang, Q.; Yu, H.; Bian, Z.; Chen, F. Spatial pattern differentiation of cultivated land non-grain conversion in major grain-producing areas. J. Agric. Resour. Environ. 2022, 39, 817–826. [Google Scholar] [CrossRef]
- Xiao, R.; Su, S.; Mai, G.; Zhang, Z.; Yang, C. Quantifying Determinants of Cash Crop Expansion and Their Relative Effects Using Logistic Regression Modeling and Variance Partitioning. Int. J. Appl. Earth Obs. Geoinf. 2015, 34, 258–263. [Google Scholar] [CrossRef]
- He, X.; Zhong, J.; Lin, S.; Dai, R.; He, Z.; Shi, G. Characteristics and driving mechanism of spatial differentiation of “Non-grain” cultivated land in karst trough valley area: Taking Wanshan District, Tongren, Guizhou as an example. Sci. Geogr. Sin. 2022, 42, 2207–2217. [Google Scholar] [CrossRef]
- Xu, D.; Guo, S.; Xie, F.; Liu, S.; Cao, S. The Impact of Rural Laborer Migration and Household Structure on Household Land Use Arrangements in Mountainous Areas of Sichuan Province, China. Habitat Int. 2017, 70, 72–80. [Google Scholar] [CrossRef]
- Zhao, X.; Zheng, Y.; Huang, X.; Kwan, M.-P.; Zhao, Y. The Effect of Urbanization and Farmland Transfer on the Spatial Patterns of Non-Grain Farmland in China. Sustainability 2017, 9, 1438. [Google Scholar] [CrossRef]
- Wei, L.; Luo, Y.; Wang, M.; Su, S.; Pi, J.; Li, G. Essential Fragmentation Metrics for Agricultural Policies: Linking Landscape Pattern, Ecosystem Service and Land Use Management in Urbanizing China. Agric. Syst. 2020, 182, 102833. [Google Scholar] [CrossRef]
- Liu, Y.; Wang, C.; Tang, Z.; Nan, Z. Will Farmland Transfer Reduce Grain Acreage? Evidence from Gansu Province, China. China Agric. Econ. Rev. 2018, 10, 277–292. [Google Scholar] [CrossRef]
- Wang, W. Debate on the Advantages and Disadvantages of Industrial and Commercial Capital Going to Rural Areas from the Perspective of Game Theory. Reform Econ. Syst. 2022, 1, 88–94. [Google Scholar]
- Gao, X.; Du, H. The Influence of Farmers’ Income Structure on the “Non-Grain” of Farming–Based on the Perspective of Industrial and Commercial Capital Going to the Countryside. Jianghan Trib. 2022, 6, 12–20. [Google Scholar]
- Huang, J.; Chen, D. The impact of industrial and commercial capital to the countryside on farmers’ behavior of farmland transfer. Resour. Sci. 2022, 44, 913–926. [Google Scholar] [CrossRef]
- Yi, X.; Chen, Y. Analysis of factors influencing farmers’ transfer to farmland and their “non-grain” cultivation behavior and scale–Based on survey data of farmers in Zhejiang and Hebei provinces. China Rural Surv. 2010, 6, 2–10+21. [Google Scholar]
- Qi, T. Analysis of farmers’ willingness to grow grain and its influencing factors in the main grain-producing areas. Stat. Decis. 2013, 17, 91–95. [Google Scholar] [CrossRef]
- Zhang, Z. Some Important Problems and Measures of Farmland Construction Suitable for Mechanization in Hilly and Mountainous Areas during the 14th. Chin. Rural Econ. 2020, 11, 13–28. [Google Scholar]
- Li, C.; Wang, W.; Li, W. Impacts of “non-grain” use on cultivated land quality. China Land 2021, 3, 17–19. [Google Scholar] [CrossRef]
- Wang, J.; Li, X.; Christakos, G.; Liao, Y.; Zhang, T.; Gu, X.; Zheng, X. Geographical Detectors-Based Health Risk Assessment and Its Application in the Neural Tube Defects Study of the Heshun Region, China. Int. J. Geogr. Inf. Sci. 2010, 24, 107–127. [Google Scholar] [CrossRef]
- Zhang, H.; Song, W.; Zhang, W.; Li, X.; Liu, J.; Li, J. Analysis of Spatial Differentiation Characteristics and Influencing Factors of Non-grain Cultivated Land in Shandong Province. China Land Sci. 2021, 35, 94–103. [Google Scholar] [CrossRef]
- Liu, Y.; Zhou, Y. Reflections on China’s Food Security and Land Use Policy under Rapid Urbanization. Land Use Policy 2021, 109, 105699. [Google Scholar] [CrossRef]
- Cheng, X.; Chen, M.; Lai, Z.; Xiao, S. Spatial differentiation pattern and correlation factors of “non-grain” cultivated land in mountainous counties. Trans. Chin. Soc. Agric. Eng. 2023, 39, 203–211. [Google Scholar] [CrossRef]
- Wang, J.; Cao, Y.; Fang, X.; Li, G.; Cao, Y. Does Land Tenure Fragmentation Aggravate Farmland Abandonment? Evidence from Big Survey Data in Rural China. J. Rural Stud. 2022, 91, 126–135. [Google Scholar] [CrossRef]
- He, Y.; Xie, H.; Peng, C. Analyzing the Behavioural Mechanism of Farmland Abandonment in the Hilly Mountainous Areas in China from the Perspective of Farming Household Diversity. Land Use Policy 2020, 99, 104826. [Google Scholar] [CrossRef]
- Cheng, Z.; Chen, Q. The Social Interaction Effect of Farmers’ Planting Diversity Behavior: Based on the Perspective of Social Network. Financ. Econ. 2020, 2, 106–119. [Google Scholar]
- Han, Y. The Policy Evolution, Vision Goal and Realization Path of China’s Cultivated Land Protection and Utilization. J. Manag. World 2022, 38, 121–131. [Google Scholar] [CrossRef]
- Tang, M.; Shao, L. Farmland Protection and Land Leasing Behavior of Local Governments. J. Financ. Econ. 2022, 48, 123–137. [Google Scholar] [CrossRef]
- Zheng, Q.; Shang, X.; Wang, Y. Why Is It Difficult to Protect Arable Land: Objectives, Problems and Countermeasures—Observation from the Main Grain-producing Areas in the West. Economist 2023, 4, 98–107. [Google Scholar] [CrossRef]
- Zhou, H.; Zhou, X. Non-Grain of Cultivated land: Causes, contradictions and countermeasures. Agric. Econ. 2022, 11, 98–100. [Google Scholar]
- Huang, Z.; Du, X.; Castillo, C.S.Z. How Does Urbanization Affect Farmland Protection? Evidence from China. Resour. Conserv. Recycl. 2019, 145, 139–147. [Google Scholar] [CrossRef]
- Zhong, T.; Mitchell, B.; Scott, S.; Huang, X.; Li, Y.; Lu, X. Growing Centralization in China’s Farmland Protection Policy in Response to Policy Failure and Related Upward-Extending Unwillingness to Protect Farmland since 1978. Environ. Plan. C Politics Space 2017, 35, 1075–1097. [Google Scholar] [CrossRef]
- Ren, D.; Peng, B. Research on the Rule of Legal Regulation to Prevent “Non-grain” of Cultivated Land. China Land Sci. 2022, 36, 1–9. [Google Scholar] [CrossRef]
- Liu, M.; Zhang, A. Historical Logic and Optimization Path of the Policy Changes in China’s Cultivated Land Use in the Past 100 Years since the Founding of the CPC. China Land Sci. 2021, 35, 19–28. [Google Scholar] [CrossRef]
- Cao, Y.; Li, G.; Wang, J.; Fang, X.; Sun, K. Systematic Review and Research Framework of “Non-grain” Utilization of Cultivated Land: From a Perspective of Food Security to Multi-dimensional Security. China Land Sci. 2022, 36, 1–12. [Google Scholar]
Disclaimer/Publisher’s Note: The statements, opinions and data contained in all publications are solely those of the individual author(s) and contributor(s) and not of MDPI and/or the editor(s). MDPI and/or the editor(s) disclaim responsibility for any injury to people or property resulting from any ideas, methods, instructions or products referred to in the content. |
© 2023 by the authors. Licensee MDPI, Basel, Switzerland. This article is an open access article distributed under the terms and conditions of the Creative Commons Attribution (CC BY) license (https://creativecommons.org/licenses/by/4.0/).