Article

Spatiotemporal Characteristics and Habitat Quality Analysis in the Temperate Desert Sub-Region of Ordos Plateau, China

1
Key Laboratory of Smart City and Environment Modelling of Higher Education Institute, Xinjiang University, Urumqi 830000, China
2
Key Laboratory of Natural Resource Coupling Process and Effects, Beijing 100055, China
3
Natural Resource Comprehensive Survey Command Center, China Geological Survey, Beijing 100055, China
*
Author to whom correspondence should be addressed.
These authors contributed equally to this work.
Land 2023, 12(7), 1470; https://doi.org/10.3390/land12071470
Submission received: 30 May 2023 / Revised: 7 July 2023 / Accepted: 19 July 2023 / Published: 24 July 2023

Abstract

:
Habitat quality has great significance in terms of regional ecological conservation and human welfare. In this study, we evaluated the spatial and temporal characteristics of land use and habitat quality in the temperate desert sub-region of the Ordos Plateau using patch-generating land use simulation (PLUS) and integrated valuation of ecosystem services and trade-offs (InVEST) models. From 2000 to 2020, the areas of grassland, cropland, and unused land in the study area increased significantly; the areas of water bodies and woodland increased slightly; and the area of wasteland decreased significantly. Moreover, the habitat quality in the temperate desert subzone of the Ordos Plateau showed a trend of initial increase and then decrease between 2000 and 2020. The areas of lower and low habitat quality first decreased and then increased, and the overall area decreased over time. Conversely, the areas of high and higher habitat quality initially increased and then decreased, and the overall area increased over time. The area of medium habitat quality first decreased and then increased, although the overall change was minimal. Based on the PLUS model, the predicted habitat quality of the study area in 2025 under the natural development scenario was compared to that predicted under the ecological conservation scenario. The comparison of results showed higher habitat quality and lower habitat degradation under the ecological conservation development scenario. These results can be used to provide a scientific basis and decision reference for the sustainable use of land resources and encouragement of high-quality socio-economic development in the temperate desert sub-region of the Ordos Plateau.

1. Introduction

Land use change is closely related to human activities, and there is an overarching relationship between the evolution of the natural environment and human socio-economic activities. Land use change can visually reflect the process of conversion of the surface system by human activities, representing the centerpiece of global environmental change research [1]. Habitat quality indicates the ability of an ecosystem to provide suitable conditions for the survival and development of individuals and populations, thus serving as an important measure of biodiversity and regional sustainability [2]. Land use is closely connected to habitat quality, and different types of land use reflect the intensity of human exploitation of the land. The level of habitat quality is negatively related to the intensity of human use of the land, which is expressed as a decrease in land use intensity and an increase in habitat quality [3]. On the basis that land use status can reflect the level of habitat quality, analysis of the spatial and temporal characteristics of land use can help us to further explore the patterns and causes of habitat quality changes [4]. Research into land use change is becoming increasingly advanced in response to increasing demands, and there have been significant advances in dynamic modeling techniques for assessing and predicting land use change in recent years. These mature models enable us to combine geography, ecology, deep learning, and other theories to predict future land use changes. And many current studies use these mature models to assess future habitat quality [5,6].
At present, viable futuristic land use prediction models mainly include the meta-automata and cellular automata (CA)-Markov models (plus references), along with further developments on the basis of the meta-automata model, including the logistic-CA [7], artificial neural network (ANN)-CA [8], Future Land Use Simulation (FLUS) [9], and Patch Generation Land Use Simulation (PLUS) models [10]. Among these examples, the PLUS model incorporates a land-sprawl optimization strategy and a multi-type stochastic patch seed generation mechanism to improve the model’s running speed and simulation accuracy [11,12]. The PLUS model, which was developed by Liang et al. (China University of Geosciences) [13], is a proposed patch-generated land use change model based on raster data. The transformation strategy of the PLUS model includes transformation analysis and pattern analysis. It has the advantage of bridging the shortcomings of previous CA models in terms of exploring the causes of land use change and simulating patch-level changes in multiple land use types at spatial and temporal scales. For example, Liu et al. [14] used a coupled grey multi-objective optimization model and the PLUS model to predict the spatial and temporal evolution of ecosystem service values in the Sichuan–Yunnan region of China under the three scenarios of natural growth, ecological priority, and ecological–economic balance in 2026. Lin et al. [15] used the PLUS model in conjunction with the “14th Five-Year Plan” for transportation in Guangzhou. And they also utilized the PLUS model to simulate the land use pattern of Guangzhou in 2030 based on natural development and transportation planning scenarios. Based on both the PLUS model and the equivalence factor method, Li et al. [16] predicted land use changes in Nujiang Prefecture in 2025 under different scenarios, as well as the ecosystem service values in 2025.
Habitat quality is mainly affected by land use changes because land use causes the flow of material and information between habitat patches [17] The level of habitat quality can visually reflect the functional status and change trends related to ecosystem services in a given area. The study of habitat quality changes in a particular region is important to the sustainable development and ecological protection of that area [18]. Currently, the main models used to assess regional habitat quality include the Integrated Valuation of Ecosystem Services and Tradeoffs (InVEST) and the Social Values for Ecosystem Services (SolVES) models [19,20]. The SolVES model assesses the value of cultural services of ecosystems in terms of their value index (VI). However, the InVEST model is widely used in the field of habitat quality assessment because of its ease of operation, visualization capability, and sound existing theoretical foundation [21]. For example, Bai et al. [22] evaluated the processes of urban expansion and habitat quality evolution in Hohhot, exploring the spatial and temporal mechanisms of habitat quality changes in response to urban land expansion. Liao et al. [23] used a land use transfer matrix to analyze the transfer of each category and applied the habitat quality module of the InVEST model to assess the quality of habitat in the Kunming Dianchi watershed. Qiu et al. [24] used the InVEST model to analyze the spatial and temporal pattern evolution characteristics of land use and habitat quality in the ChangZhuTan urban agglomeration in 2000, 2010, and 2020, and they further analyzed the evolution mechanism and influencing factors. Yang et al. [25] assessed the extent of habitat quality degradation in the Yellow River basin based on the InVEST model. And they analyzed the cold hotspots of habitat quality using spatial statistical methods combined with geo-probing models. Based on this approach, they further explored the main drivers of the spatial distribution characteristics of habitat quality. Thus, the application of the InVEST model to the calculation and assessment of habitat quality at different scales demonstrated the scientific validity and broad applicability of the model.
The Ordos Plateau temperate desert sub-region is located in the hinterland of the loop of the Yellow River, which has several bends. It stretches from the Mawusu Sands Land in the south to the Kubuqi Desert in the north, and it is representative of a typical ecologically fragile area in China [26]. The Ordos Plateau temperate desert sub-region is also a typical transition zone in terms of ecology and geography. With respect to geomorphology, this sub-region forms a transition zone between the Gobi Desert and a Plateau environment [27]. With respect to climate, there is a transition from arid and semi-arid areas to humid areas when moving from west to east. In terms of human activities, the study area is in a transition zone between animal husbandry and agriculture [28] The complex climate change, which is accompanied by human activities, has led to variations in land use change and its driving force role in the region, with obvious spatial heterogeneity. In particular, the implementation of desertification prevention and control policies, such as enclosed grazing; returning farmland to forest (grass); and the urbanization process and mining in the area have all accelerated in the past 10 years. Therefore, the Ordos Plateau [29] offers a typical and representative area for the study of desertification dynamics and their driving mechanisms.
Based on this research background, in this study, we chose to use the temperate desert subzone of the Ordos Plateau as the study area of focus. We combined the advantages of the accuracy of the PLUS model in terms of predicting land use change and the intuitive accuracy of the InVEST model’s habitat quality module in terms of calculating habitat quality. Specifically, these models were used to analyze the process of evolution in land use and habitat quality in the Ordos Plateau from 2000 to 2020. We further predicted land-use scenarios for 2025 based on the scenarios of both natural development and ecological protection to provide a reference for the construction of an ecological civilization with effective regional planning and development in the Ordos Plateau region.

2. Materials and Methods

2.1. Study Area

The Ordos Plateau temperate desert sub-region [30] belongs to the second level of the first-level Inner Mongolia Plateau Grassland Resource Region, which is located in the southeast of the first level at 37°20′–40°50′ N and 106°24′–111°28′ E (Figure 1). This sub-region includes Ordos City in Inner Mongolia and Yulin City in Shaanxi Province. The topography is slightly inclined from northwest to southeast, with gentle undulations occurring [31]. The majority of the land is 862–1627 m above sea level, and the main land use type is grassland, which accounts for approximately 70% of the total area of the region. The study area can be divided into five sections: respective sandy uplands in the central and western regions, lakes and sand dunes in the southeast, the Kubuchi Desert of the Yellow River terrace in the north, and Table Mountain in the west. The soil type in the area is dominated by brown calcium [32]. The climate of the study area is arid and semi-arid continental monsoon, with an average annual temperature of approximately 5 °C and an average annual precipitation rate of approximately 400 mm, which is low and concentrated in summer [33].

2.2. Research Data

The primary data used in this study included land use data, soil data, topographic data, climate data, road accessibility data, and socio-economic data. Referring to previous studies related to land use prediction and habitat quality evaluation, based on the basic context of the study area, as well as the accessibility, timeliness, and significance of the data according to the accuracy and practicality of the PLUS model, 14 driving factors that affected land use change based on natural and human perspectives were selected for a land use simulation study of the study area; these factors are detailed in Table 1.

2.3. Research Methodology

2.3.1. PLUS Model

The selection of driving factors was based on the current context of the Ordos Plateau, the availability of data, and references to existing relevant studies. A total of 14 influencing factors were selected, including slope, elevation, soil texture, average annual rainfall, average annual temperature, distance from rivers, distance from county-level stations, distance from highways, distance from railroads, distance from primary roads, night light data, per capita gross domestic product, and population data [34].
The land use expansion analysis strategy (LEAS) was selected as a random sampling mechanism to reduce the computational effort of the model using the random forest algorithm, which could handle high-dimensional data and solve the covariance of the driving factors, to mine the excessive land use transfer pattern [35] and obtain the development probability of each land use type, which was calculated as follows:
P i , k ( X ) d = n = 1 M I [ h n ( X ) = d ] M
In this equation, P i , k ( X ) d is the probability of the growth of land use type k at spatial unit i; X is a vector that consists of driving factors; M is the number of decision trees; d takes the value of 0 or 1, with 0 indicating that other land classes are not convertible to land class k and 1 indicating the opposite; and the type of land use prediction calculated when the decision tree is n [ h n ( X ) = d ] is the exponential function of the decision tree.
The multi-class random forest patch seed-based CA model (CARS) was used to determine the land use distribution obtained via the simulation by obtaining the development probability that each type of land use belongs to the scenario-driven land use simulation model. CARS is based on a meta-cellular automata simulation of multi-class land use change in Dongguan City created via random forest CA, and the calculation formula of the transfer probability of land use types is as follows:
O P i , k d = 1 , t = P i , k d × Ω i , k t × D k t
In this equation,   O P i , k d = 1 , t is the integrated probability that the transition to ground class k at moment t and spatial unit i occurs, P i , k d is the probability of the suitability of the development of the land type at spatial unit i to land class k, Ω i , k t is the domain effect of cell i, z is the proportion of land use components of land class k that are covered in the next domain, and D k t provides the impact of future demand on land class k [36].
The predictions of 2010 land use data based on the PLUS model using 2000 and 2005 land use data of the temperate desert sub-region of the Ordos Plateau were compared and analyzed using the Kappa coefficient and according to the overall accuracy with respect to the actual land use data retrieved in 2010. The results showed that the overall accuracy was 0.91, while the Kappa coefficient was 0.77. Therefore, the PLUS model has high prediction accuracy and can accurately reflect land use change, with strong general applicability in the study area.

2.3.2. InVEST Model

The InVEST model (version 3.12.0) was released by Sharp et al. at Stanford University [37]. Its habitat quality module is designed to evaluate the impact of human activities on the ecological environment. The InVEST model considers habitat quality as a continuous variable while taking into account the influence distance and spatial weights of stressors, and it fully considers the impact of and changes in land cover patterns related to habitat quality when conducting the assessment [38]. The model was calculated as follows:
D x j = r = 1 R y = 1 Y r ( w r r = 1 R w r ) r y i r x y β x S j r
In this equation, D x j is the degree of habitat degradation for raster x in habitat type j, R is the number of threat sources, W R is the weight of the threat source r, Y r is the number of grids of threat sources, r y is the stress value of grid y, β x is the accessibility of the threat source to the raster x, S j r is the sensitivity of habitat type j to the threat source, and i r x y is the stress value r y of grid y to the stress level of grid x. Two types of decay were considered: linear decay and exponential decay.
Linear   attenuation :   i r x y = 1 ( d x y d r m a x )
Exponential   decay :   i r x y = e x p ( 2.99 d x y d r m a x )
In the above equation, d x y is the linear distance between raster x and raster y, and d r m a x is the maximum stress distance of the threat source r. The habitat quality index was calculated using the following formula:
Q x j = H j 1 ( D x j z D x j z + k z )
In this equation, Q x j is the habitat quality index of raster x in habitat type j, H j is the habitat suitability of habitat type j, k is the half-saturation constant, and z is the normalization constant. Based on the above equations, the weights of the stressors and the maximum stress distance, along with other parameters, were calculated for the study area (Table 2).
The InVEST model, which has the advantages of easily accessible data and high visualization ability, was utilized to assess habitat quality in 2000, 2005, 2010, 2015, and 2020 in the desert sub-region of the Ordos Plateau. According to the characteristics of the InVEST model, previous studies conducted in the agricultural–pastoral interlacing zone of arid and semi-arid regions, as well as the specific situation of the study area, the threat sources were set as the ecological environment’s vulnerability to human activities, including cultivated land, wasteland, and unused land [39,40]. After checking the existing research results and conducting a comprehensive analysis, the weights of threat sources, the maximum impact distance, and the type of degradation were determined [41]. Based on the above conditions, the sensitivity of different site types in the study area to different habitat threat sources was calculated (Table 3).

2.3.3. Multi-Scene Simulation

Two development situations were established for comparison: natural development and ecological protection scenarios [40,41,42]. The Markov chain module in the land use PLUS model for 2025 under the natural development scenario had no restrictions on the conversion of woodland, grassland, and water bodies, as well as no restricted area for development based on the future land use change trends determined according to the 2015–2020 land use change trends. The ecological protection scenario represents the area of high-quality protected habitat predicted to be available in the future. The scenario needs to strictly restrict the conversion of waters, woodland, and grassland to cropland, construction land, and unused land; control the overgrowth of construction land and cropland; and improve the development potential of woodland and grassland. The multi-scenario transfer matrix settings are shown in Table 4, where 1 indicates that the conversion of land types can occur, while 0 indicates that the conversion of land types cannot occur.

2.3.4. Research Flow Chart

In this paper, the PLUS model and InVEST model were used to analyze the spatial and temporal variation in habitat quality in the temperate highland desert subzone of the Ordos Plateau. And this study predicted future land use trends under the two scenarios for 2025 and compared and analyzed the habitat quality present under the two scenarios. The technical route of this study is shown in Figure 2.

3. Results

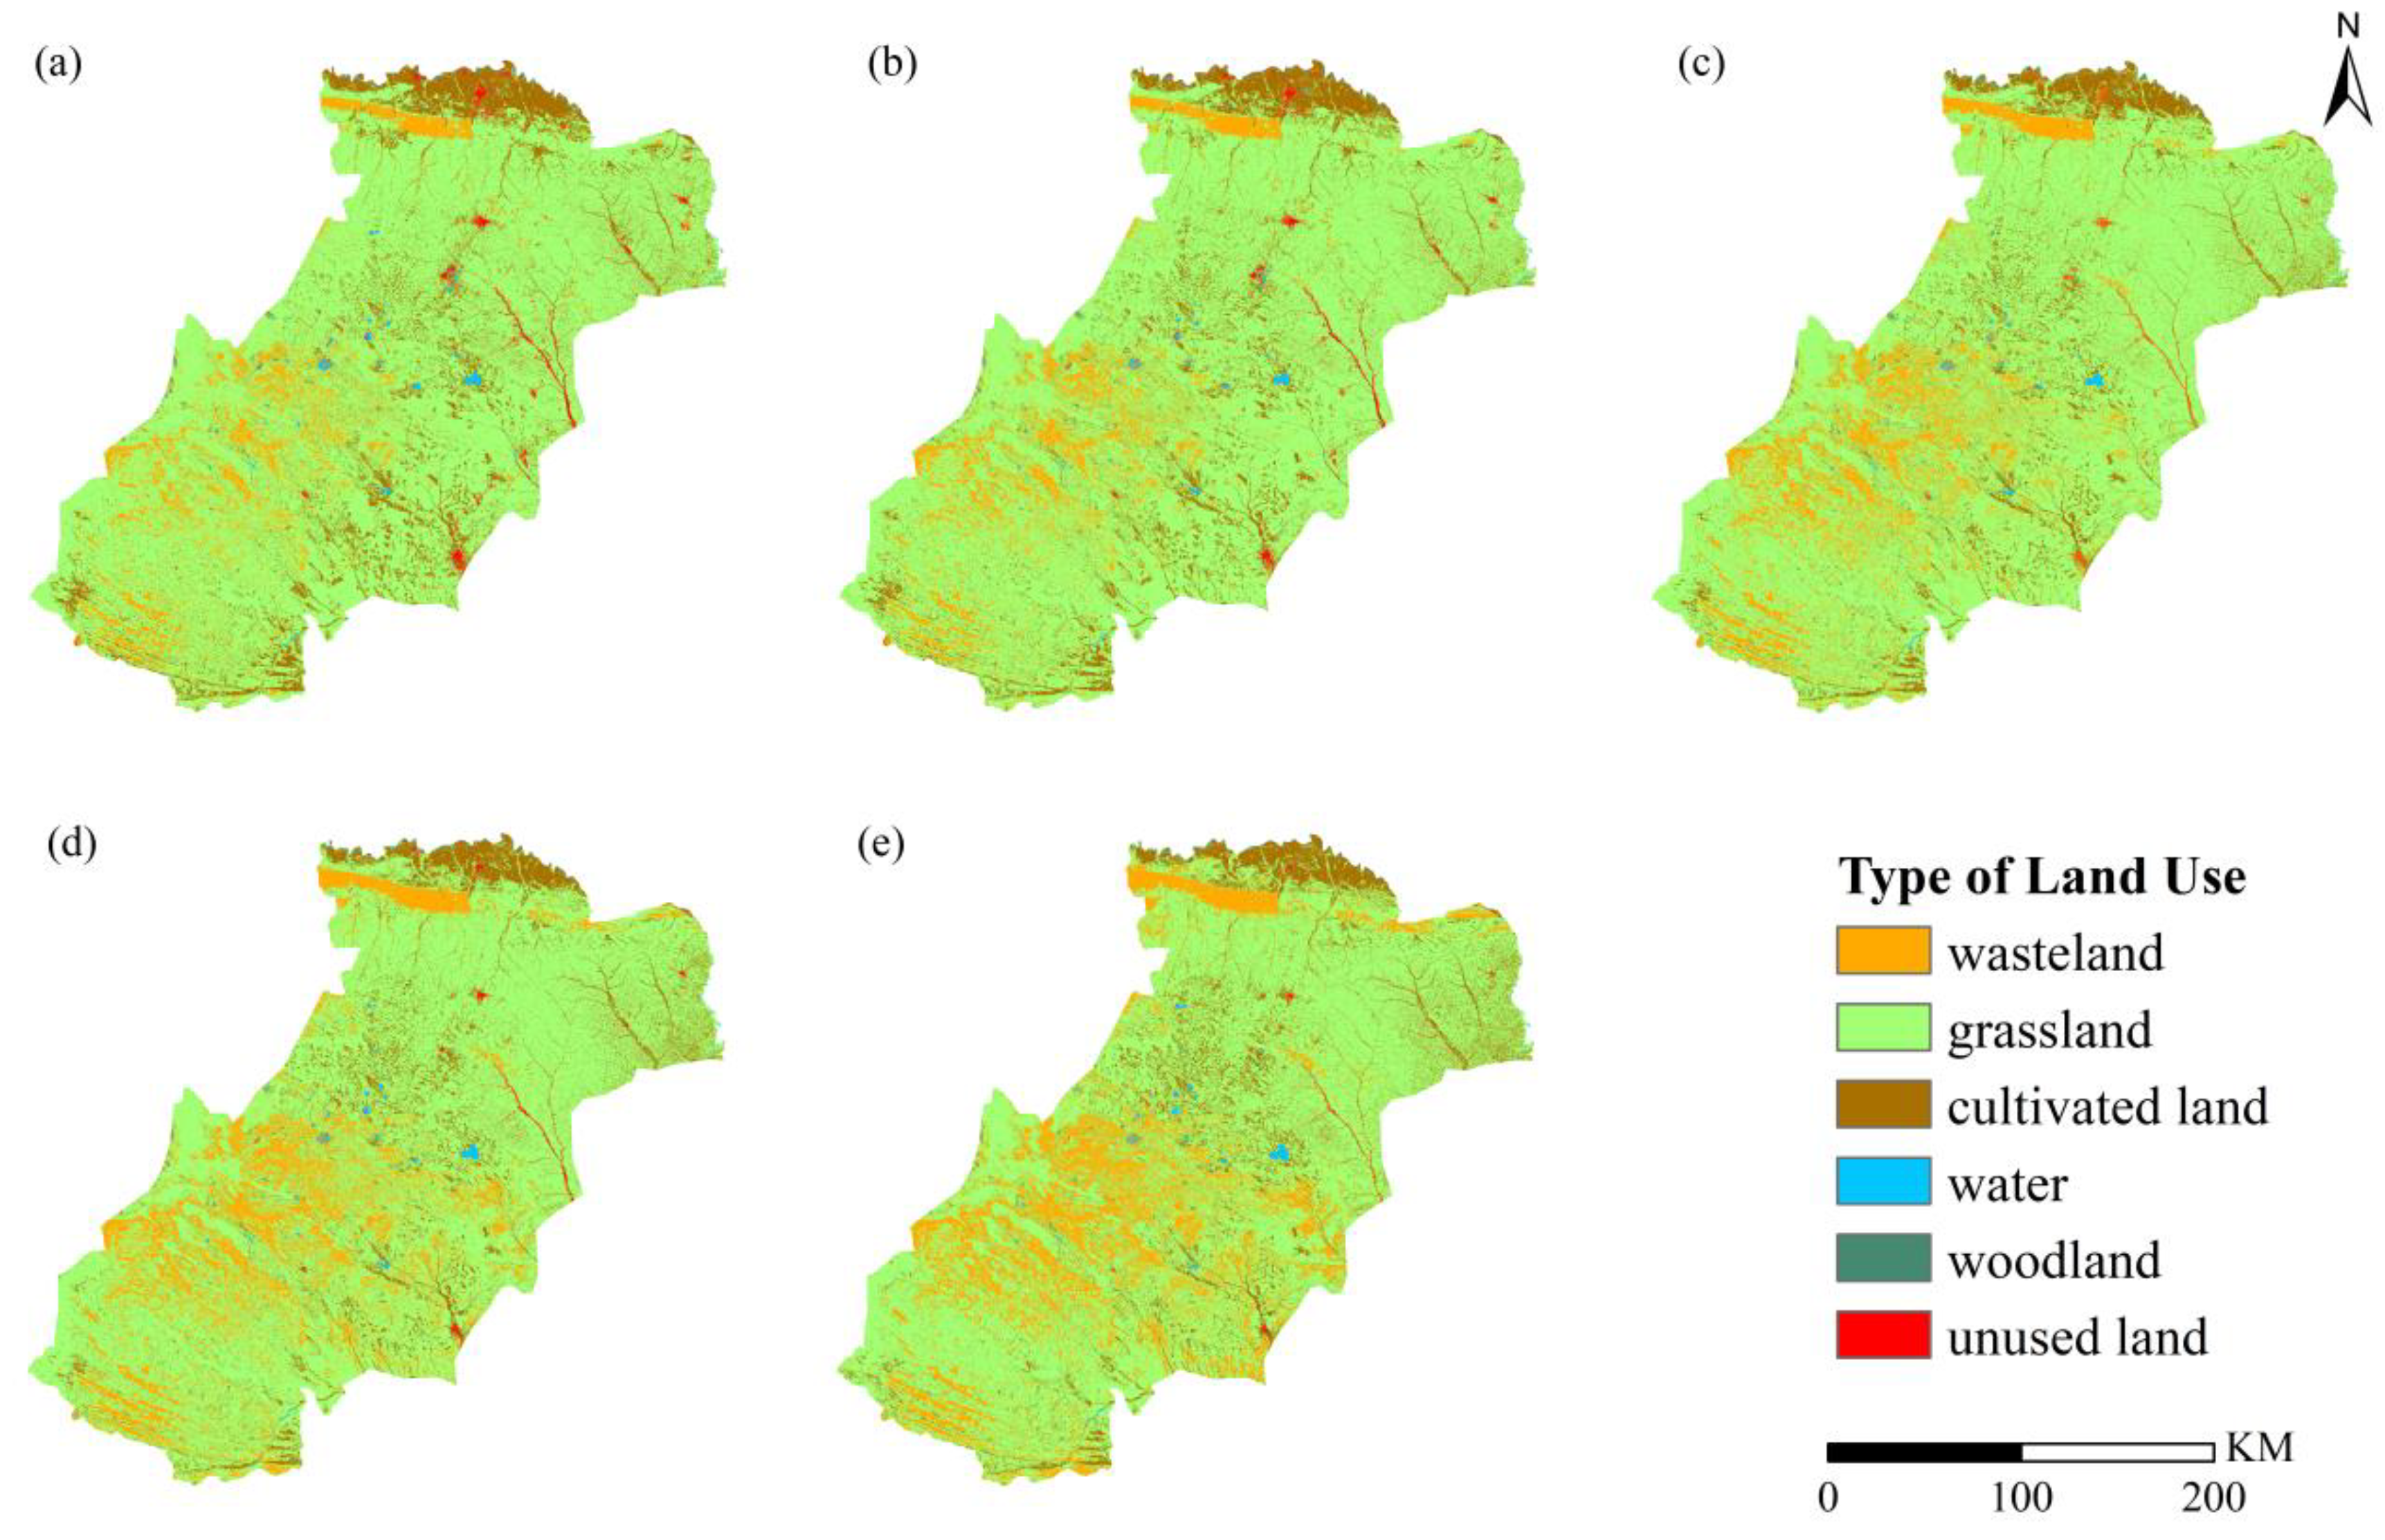
3.1. Land Use Change from 2000 to 2020

We first calculated the area of each type of land in the temperate grassland sub-region of the Ordos Plateau using geographic information spatial analysis (Figure 3). The areas of grassland, unused land, and arable land increased significantly, while the area of wasteland decreased considerably. From 2000 to 2020, the area of unused land increased to a greater extent, and the rates of change in unused land area were 43.09%, 57.55%, 24.23%, and 21.98% in 2005, 2010, 2015, and 2020, respectively. The rates of change in unused land area for these same four years were 43.09%, 57.55%, 24.23%, and 21.98%, respectively, showing a trend of initial decrease and then increase. The rates of change in the water body area in 2005, 2010, 2015, and 2020 were 0.62%, −1.17%, 4.15%, and 12.06%, respectively, showing a gradual trend of increase, with an overall increase in the water body area of 40.58 km2. From 2000 to 2020, the area of grassland first increased and then decreased, with a significant noticed increase in 2020 compared to 2000, and the rates of variation in grassland area in 2005, 2010, 2015, and 2020 were 5.07%, 4.47%, 2.55%, and −1.30%, respectively. The cultivated land area first increased and then decreased, and the rates of change in arable land area were −7.69%, −1.72%, 10.55%, and 9.57% in 2005, 2010, 2015, and 2020, respectively.
The rates of change in the woodland area in 2005, 2010, 2015, and 2020 were 14.78%, 121.53%, 986.38%, and 189.98%, respectively, showing an overall increase over time. The rates of change in the water area were 0.62%, −1.17%, 4.15%, and 12.06% in 2005, 2010, 2015, and 2020, respectively, showing a gradual trend of increase, and the area of water body in 2020 increased by 40.58 km2 compared to that recorded in 2000. The trend is one of increase, and the woodland area in 2020 had increased by 30.83 km² compared to that recorded in 2000, representing an obvious increase over time.
The spatial changes in each category in the study area from 2000 to 2020 were obtained using the standard deviation ellipse calculation (Figure 4) [43]. From 2000 to 2020, the most obvious change was detected in the woodland area, and the center of gravity shifted from the central part of the study area to the northeastern part. The center of gravity of the wasteland shifted from the central part to the northern part over time, and the distribution of the wasteland was more concentrated in 2020 than in 2000. From 2000 to 2020, the center of gravity of grassland was concentrated in the central part of the study area, and the total area of grassland showed a trend of expansion, with obvious expansion in the northeastern part of the study area occurring between 2000 and 2020. The center of gravity of cropland slowly moved southward between 2000 and 2020, and the area of cropland expanded in a southwestern direction. Between 2000 and 2020, the center of gravity of unused land and water bodies slowly shifted, with water bodies concentrated in the western subpart of the central part of the study area, while unused land was concentrated in the southeastern part of the study area.

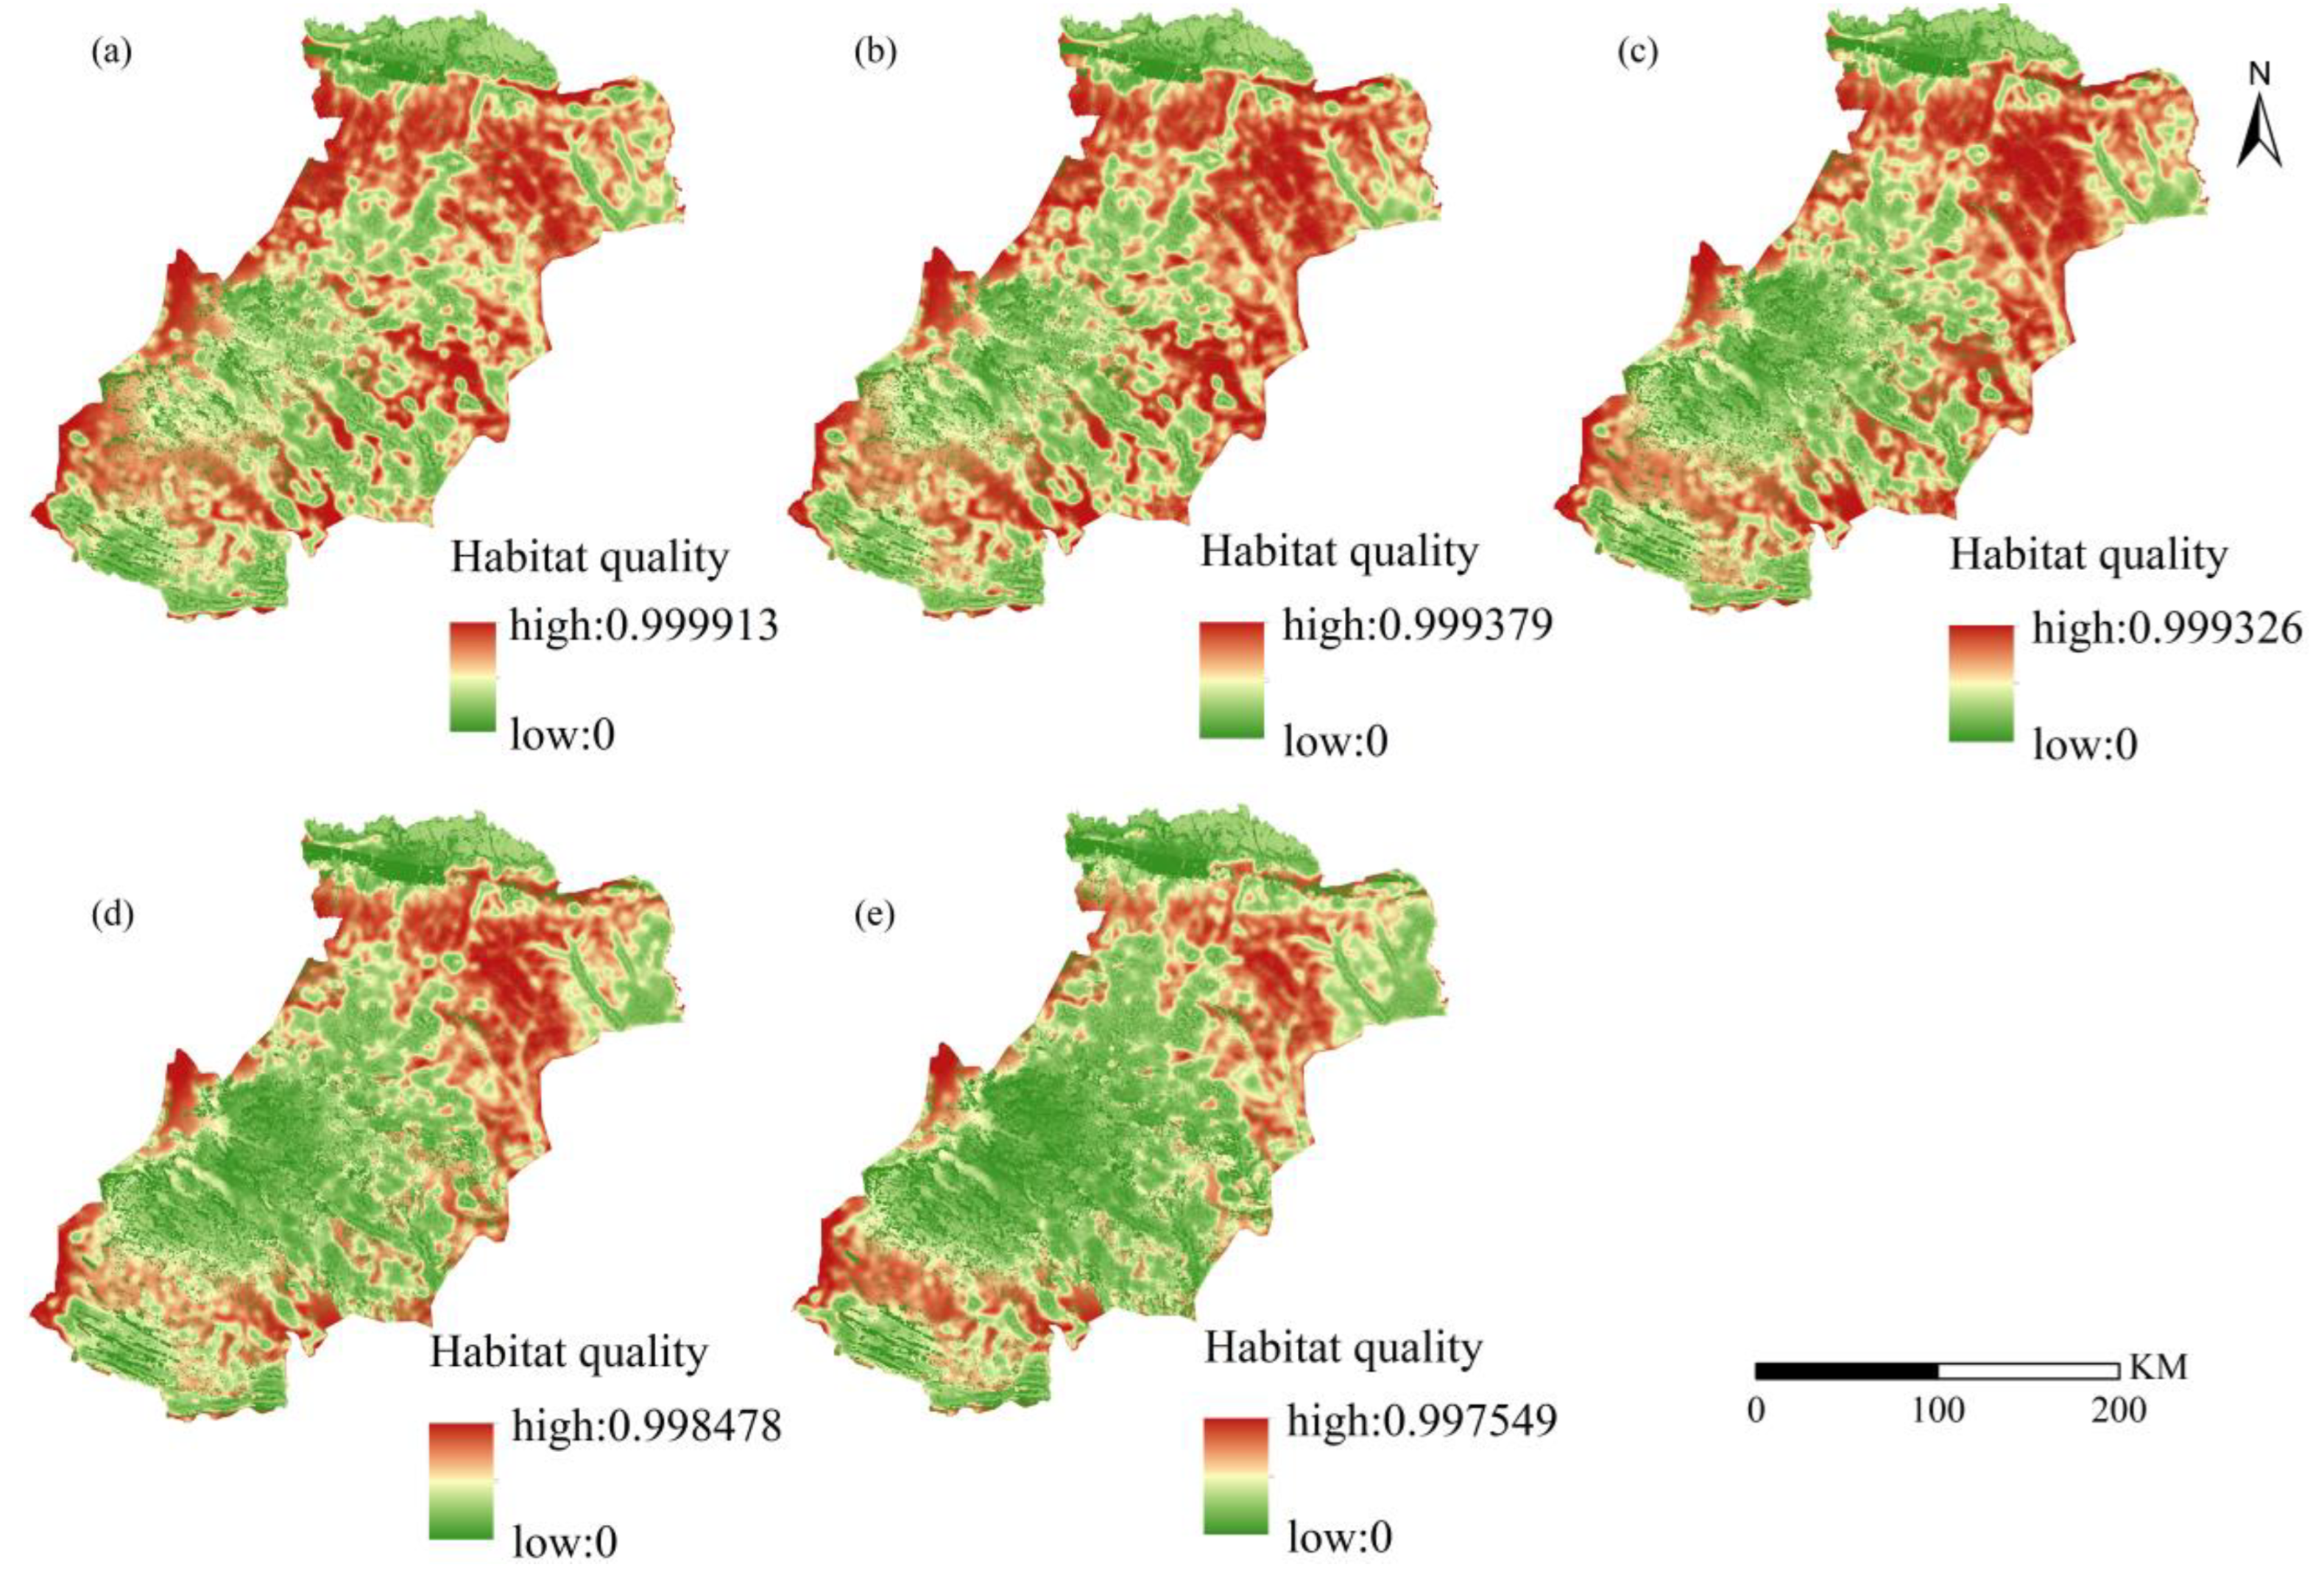
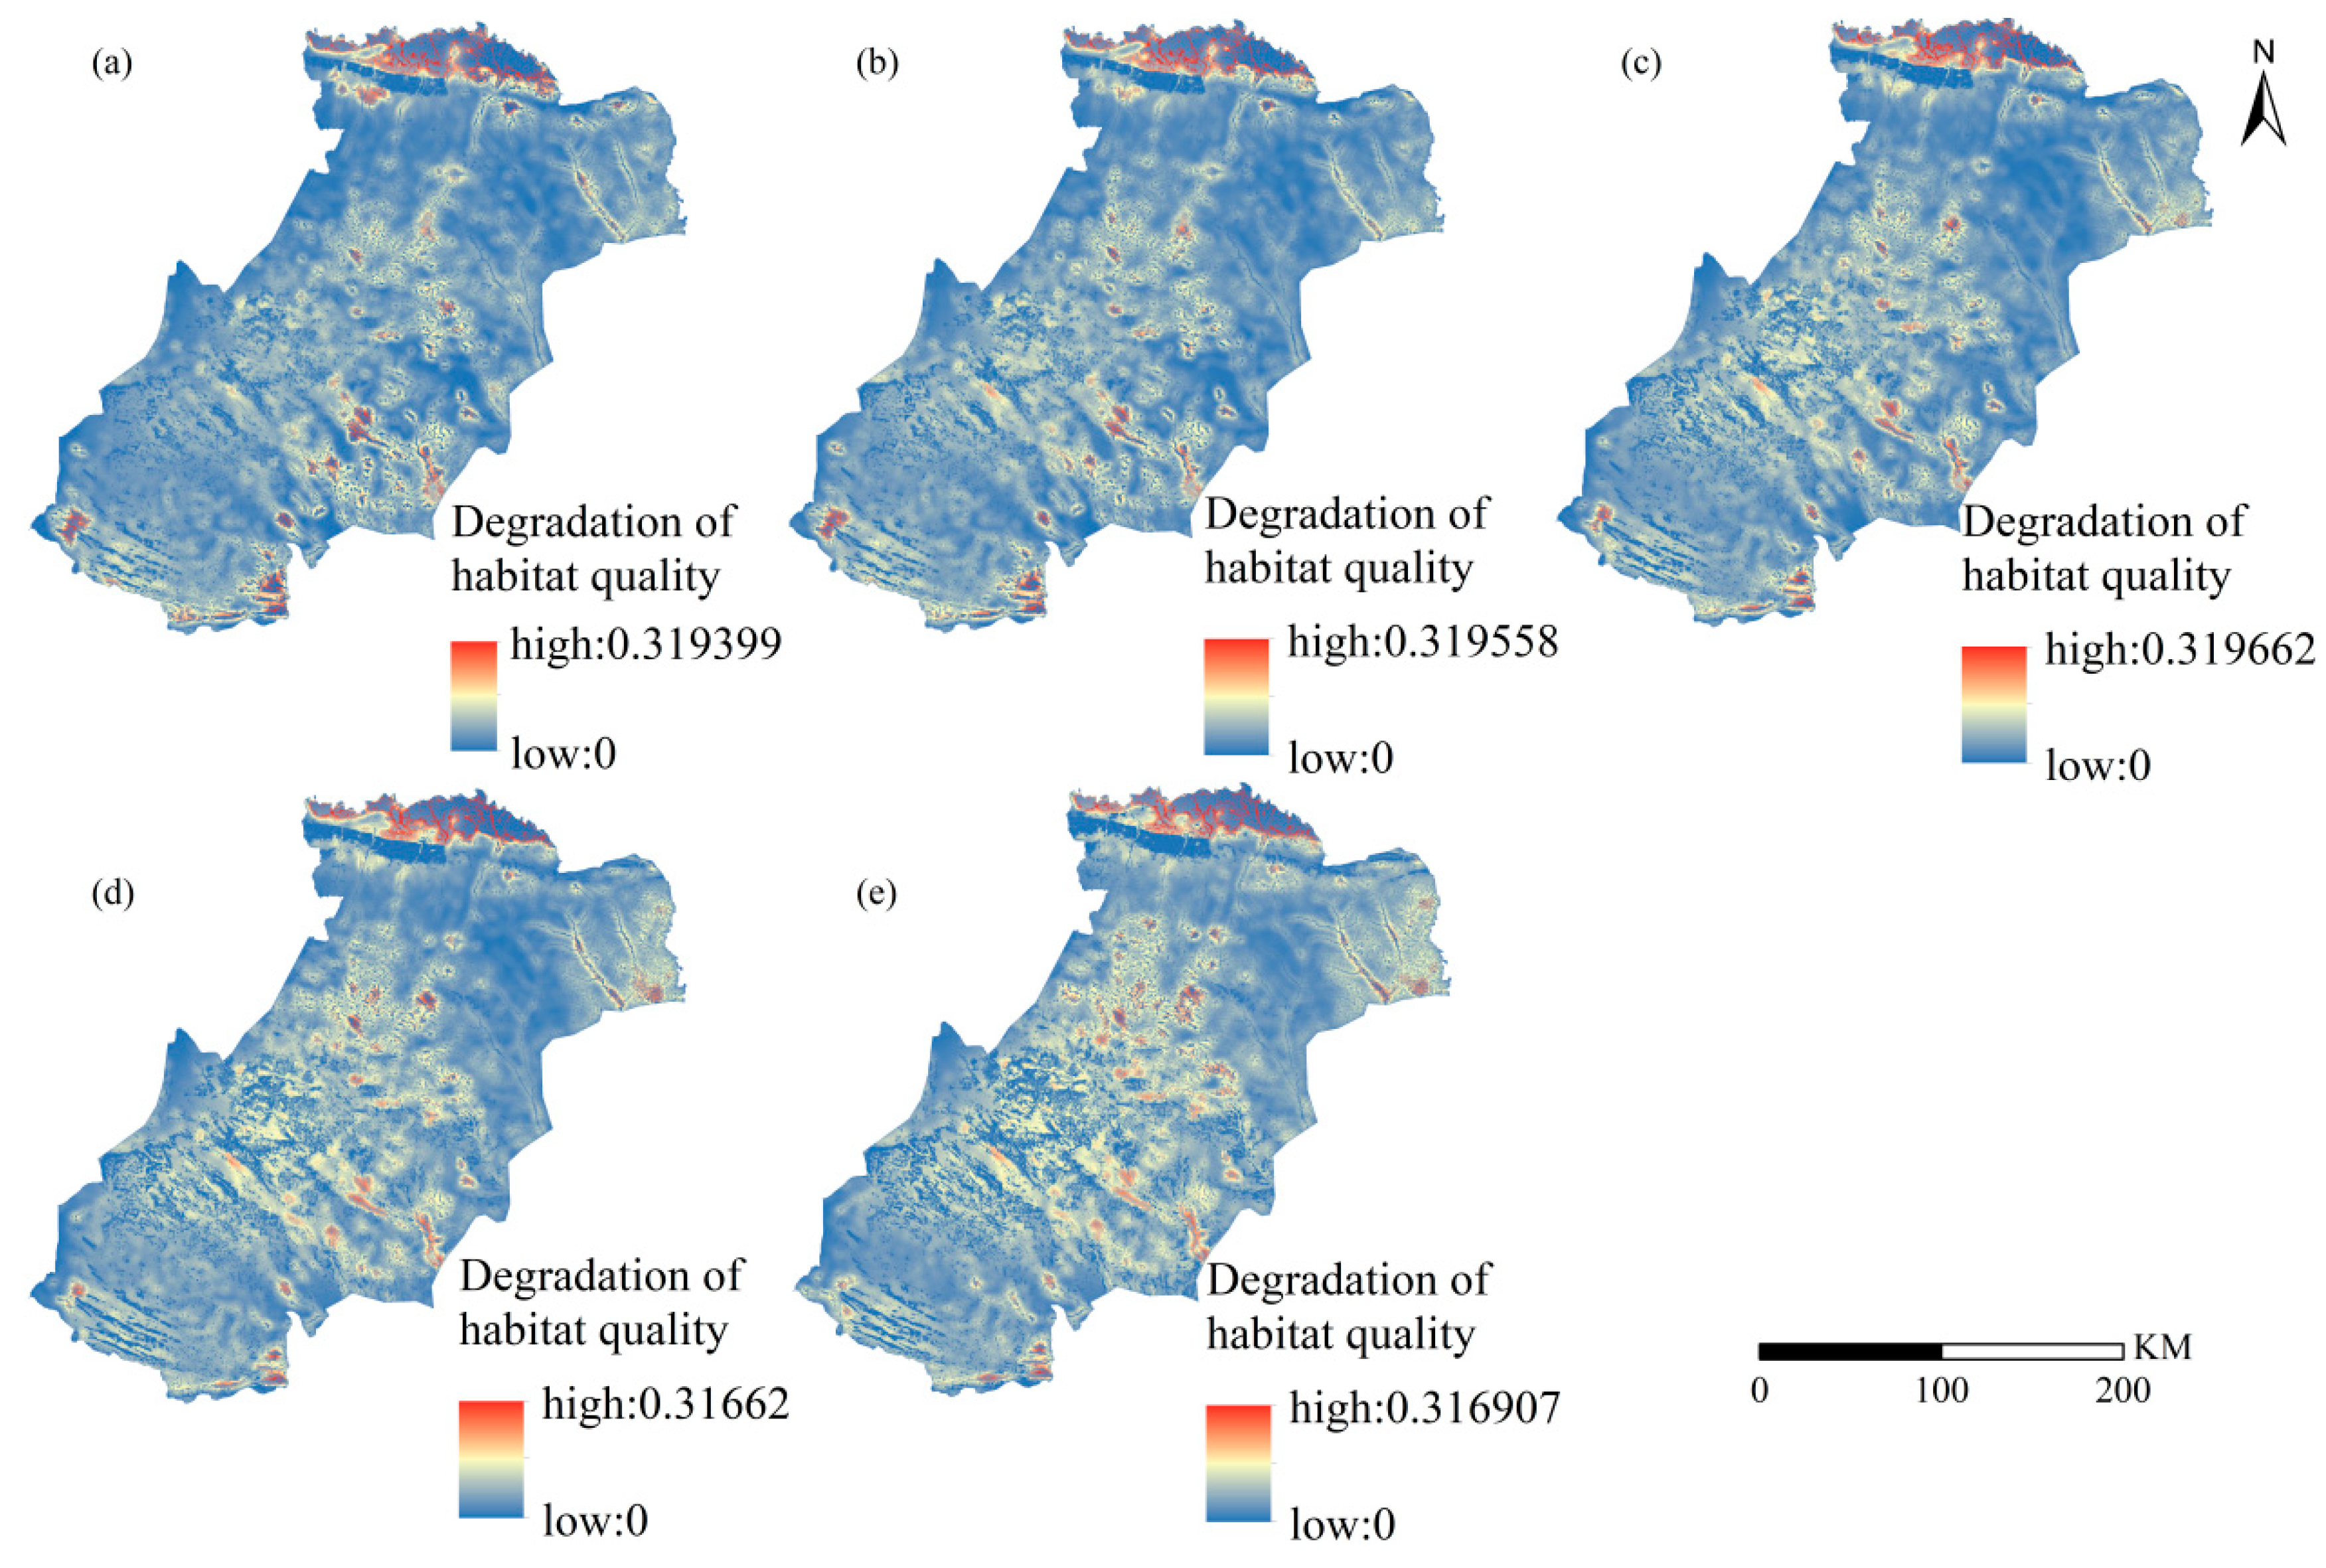
3.2. Habitat Quality Changes from 2000 to 2020

The habitat quality of the study area was analyzed using the habitat quality module of the InVEST model, which demonstrated that the habitat quality of the temperate desert sub-region of the Ordos Plateau ranged from 0 to 1 (Figure 5). The spatial and temporal variations in habitat quality are presented in Figure 4. From 2000 to 2020, the low values of habitat quality were concentrated in the northern and central parts of the study area, whereas the high values of habitat quality were mainly concentrated in the southeastern parts. Grassland was the main land use type in areas with high habitat quality values, with relatively low land use intensity and dense vegetation cover present in this area. Habitat quality in the northern part of the study area was concentrated around lower values, and the main land use type in the northern part was arable land, which is more intensive and influenced by human activities. The habitat quality of the temperate desert sub-region of the Ordos Plateau showed an overall trend of increase during the study period.
The degree of habitat quality degradation in the study area was calculated according to the habitat quality module of the InVEST model (Figure 6). The high values related to the degree of habitat degradation in the Ordos Plateau from 2000 to 2020 were concentrated in the northern and southwestern parts. The land use types in this area were mainly arable land, grassland, and wasteland. The habitat quality largely deteriorated due to human farming and construction planning. Lower habitat degradation values occurred in the grassland cover area in the central part of the study area, which mainly occurred due to the fact that the grassland cover area is not exploited on a large scale and experiences low disturbance by human activities. The degree of habitat degradation was highly variable from 2000 to 2020. From 2000 to 2010, the degree of habitat degradation in the study area increased by 0.28%; from 2010 to 2015, the degree of habitat degradation in the study area decreased by 0.01%; and from 2015 to 2020, the degree of habitat quality degradation in the study area increased by 0.02%.

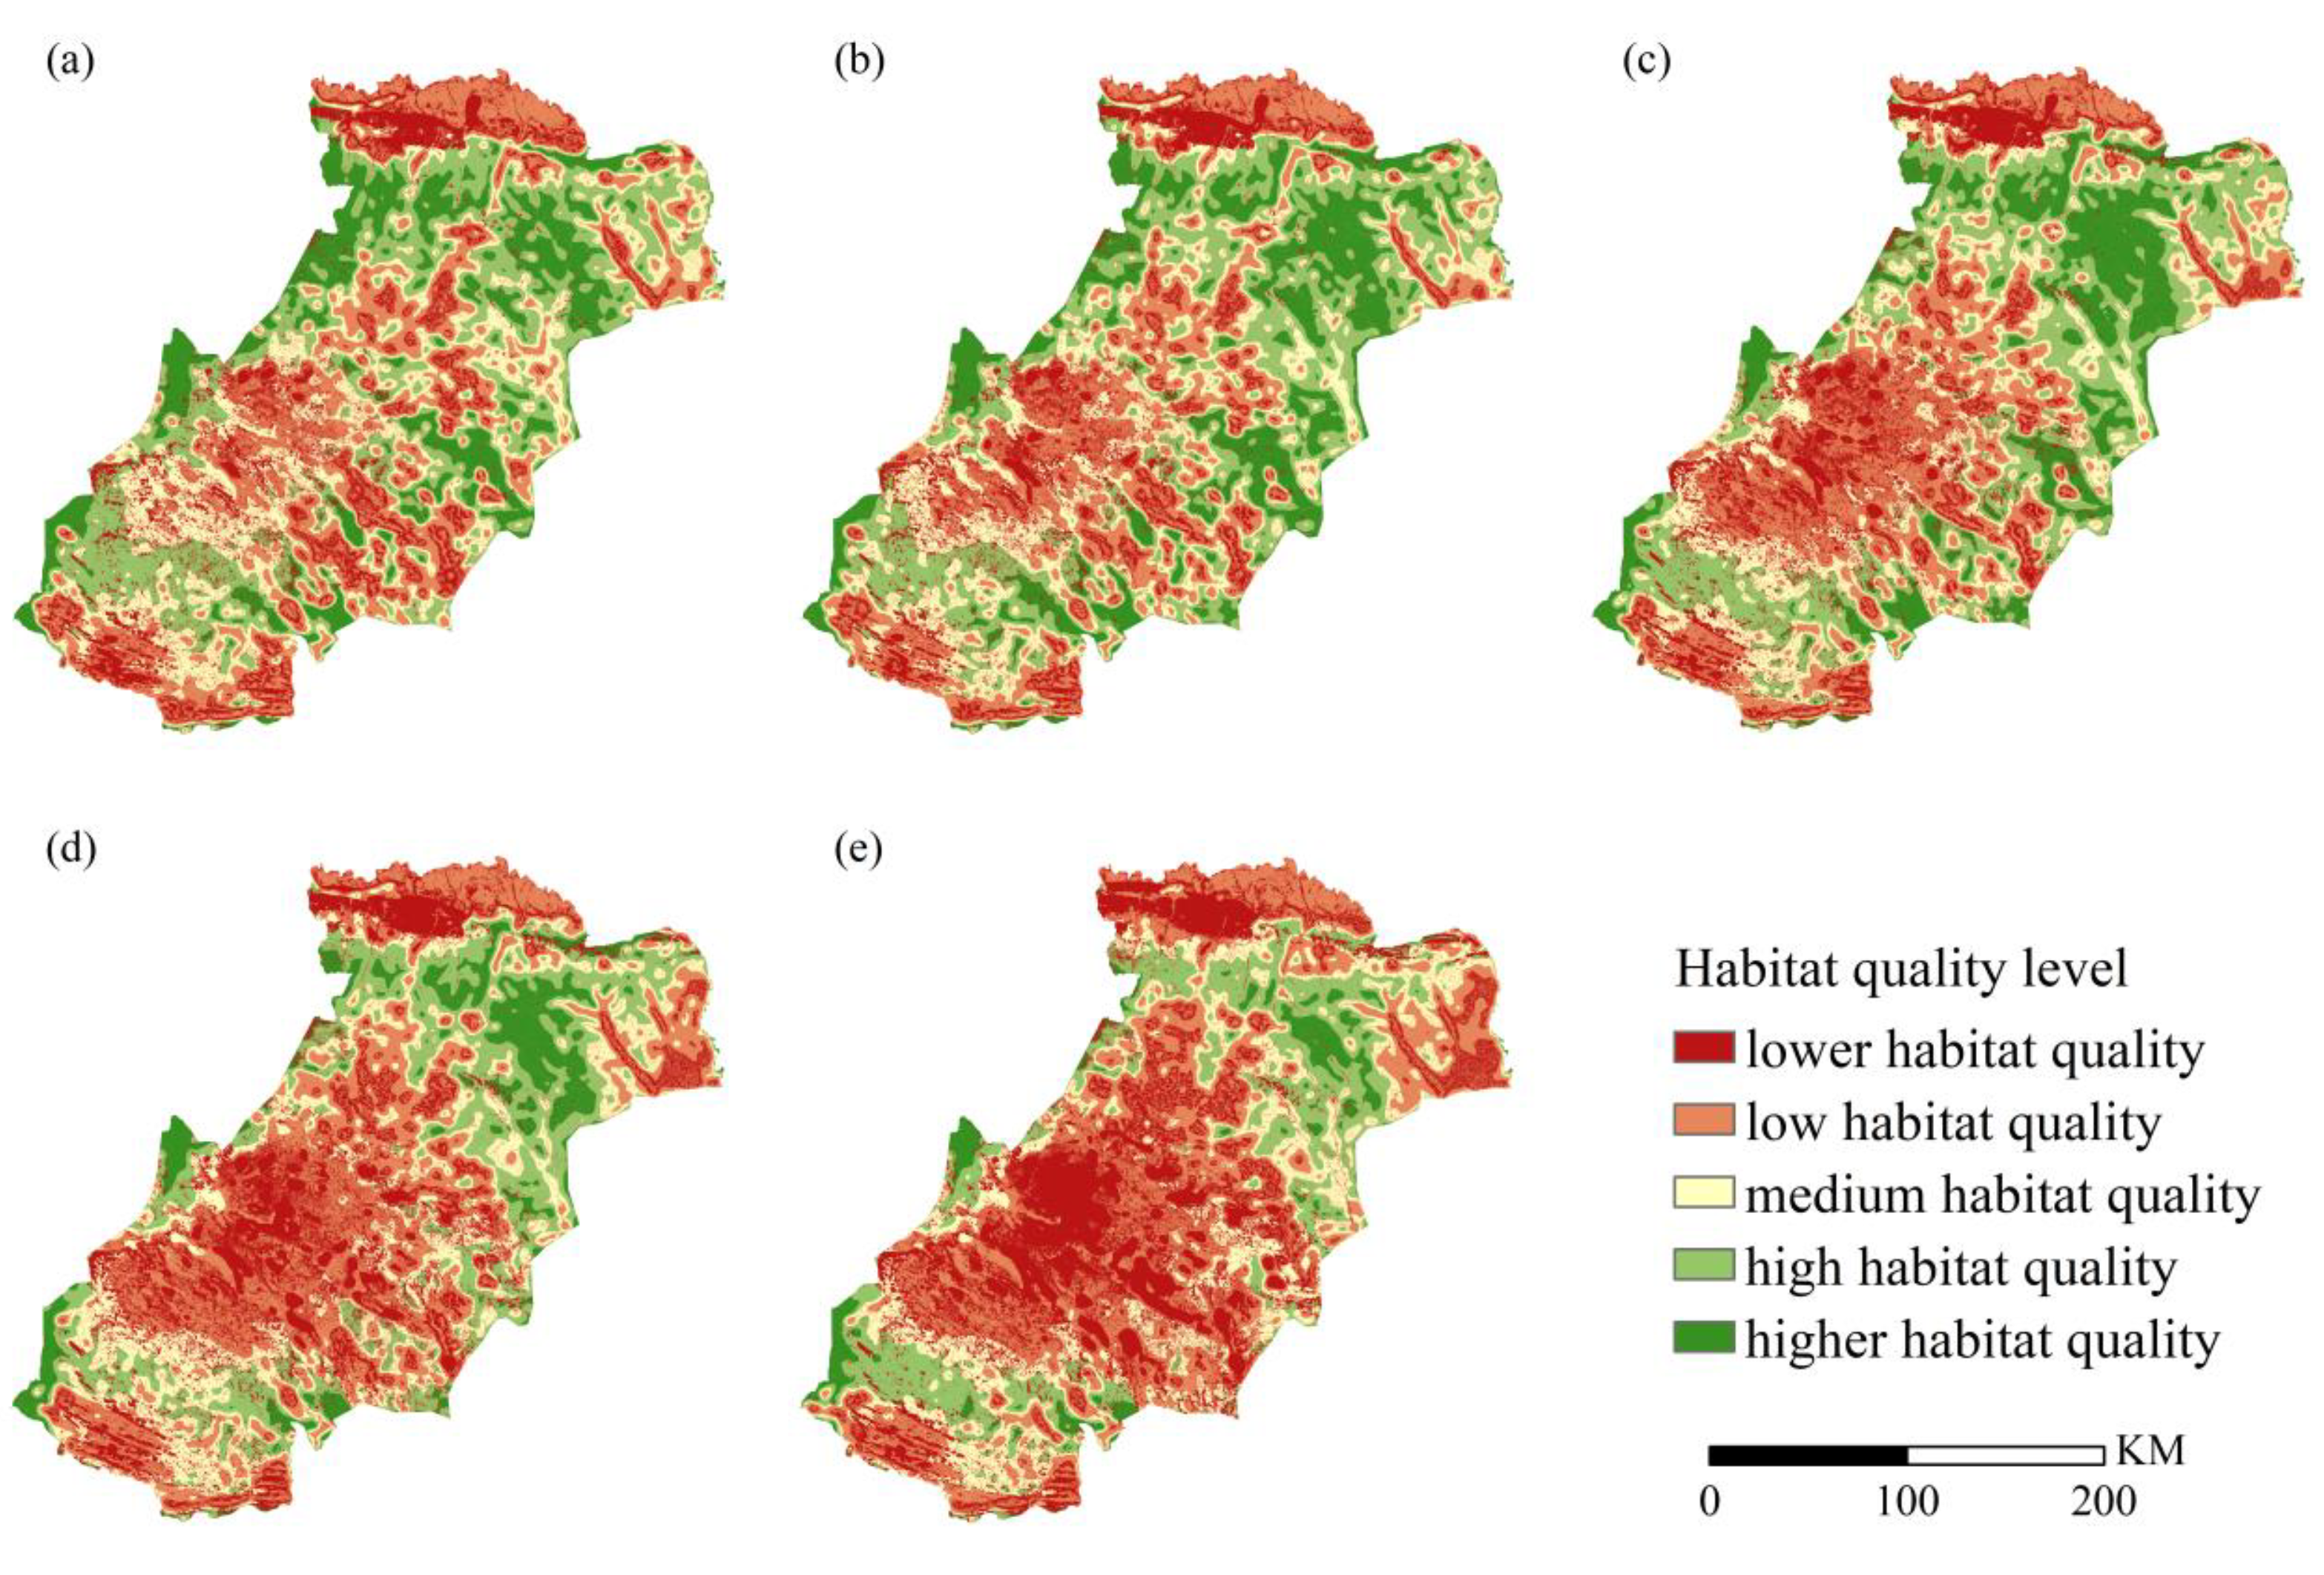
Change in Habitat Quality Class

According to the results of habitat quality classification, the area share of each grade of habitat quality in the study area was determined to be approximately 20%, and the area share of each habitat quality class was relatively uniform. From 2000 to 2020, the lower habitat quality area changed most obviously, showing a trend of rapid decline in land use quality, followed by a slow rise (Figure 7).
From 2000 to 2015, the area of lower habitat quality decreased by 10,045.27 km2 and the area share decreased by 16.59%, whereas from 2015 to 2020, the area of lower habitat quality increased by 575.46 km2 and the area share increased by 0.95%. From 2000 to 2020, the area of lower habitat quality showed a trend of initial decrease and then increase; the total area of lower habitat quality land decreased from 18,146.86 km2 to 15,413.47 km2 from 2000 to 2015, and its area share decreased by 4.52%. In the period 2015–2020, the area share increased by 1.17%, with an absolute increase of 708.80 km2. From 2000 to 2020, the area of medium habitat quality land increased by 1394.12 km2, and its area share increased by 2.30%. Between 2000 and 2010, the area of medium habitat quality land showed a decreasing trend. The area of medium habitat quality showed an increasing trend from 2010 to 2020. The area of high habitat quality land in the study area initially increased and then decreased during the study period. The area share of high habitat quality land increased by 7.45% in the period 2000–2015. From 2015 to 2020, its area share decreased by 0.7%. In 2020, the area of high habitat quality land in the region was 60.36 km2 larger than that recorded in 2000, and the overall area increased by 4088.04 km2, with an area share increase of 6.75%. The area of higher habitat quality land increased by 6011.94 km2. From 2000 to 2015, the area of higher habitat quality land increased significantly, and its area share increased by 12.34%. From 2015 to 2020, the area of high habitat quality land decreased by 1457.35 km2, and its area share decreased by 2.41%.
On the basis of the standard deviation ellipse and mean center of gravity calculations [44], during the period 2000–2020, changes in higher habitat quality were evident, with the center of gravity of higher habitat quality land shifting from the eastern part to the central part, while its distribution moved closer to the central part as time progressed. From 2000 to 2010, the center of gravity of medium habitat quality land shifted significantly, moving from the central part to the northern part, and its area shrunk from east to south. From 2010 to 2020, the center of gravity of medium habitat quality land shifted insignificantly, with little change in the area. During the study period, the center of gravity of lower habitat quality land shifted to the northeastern part, and the area occupied became more northernly concentrated over time. The center of gravity of lower habitat quality shifted to the southern part, and the area occupied by lower habitat quality showed a decreasing trend over time, with obvious changes recorded from 2000 to 2015 (Figure 8).

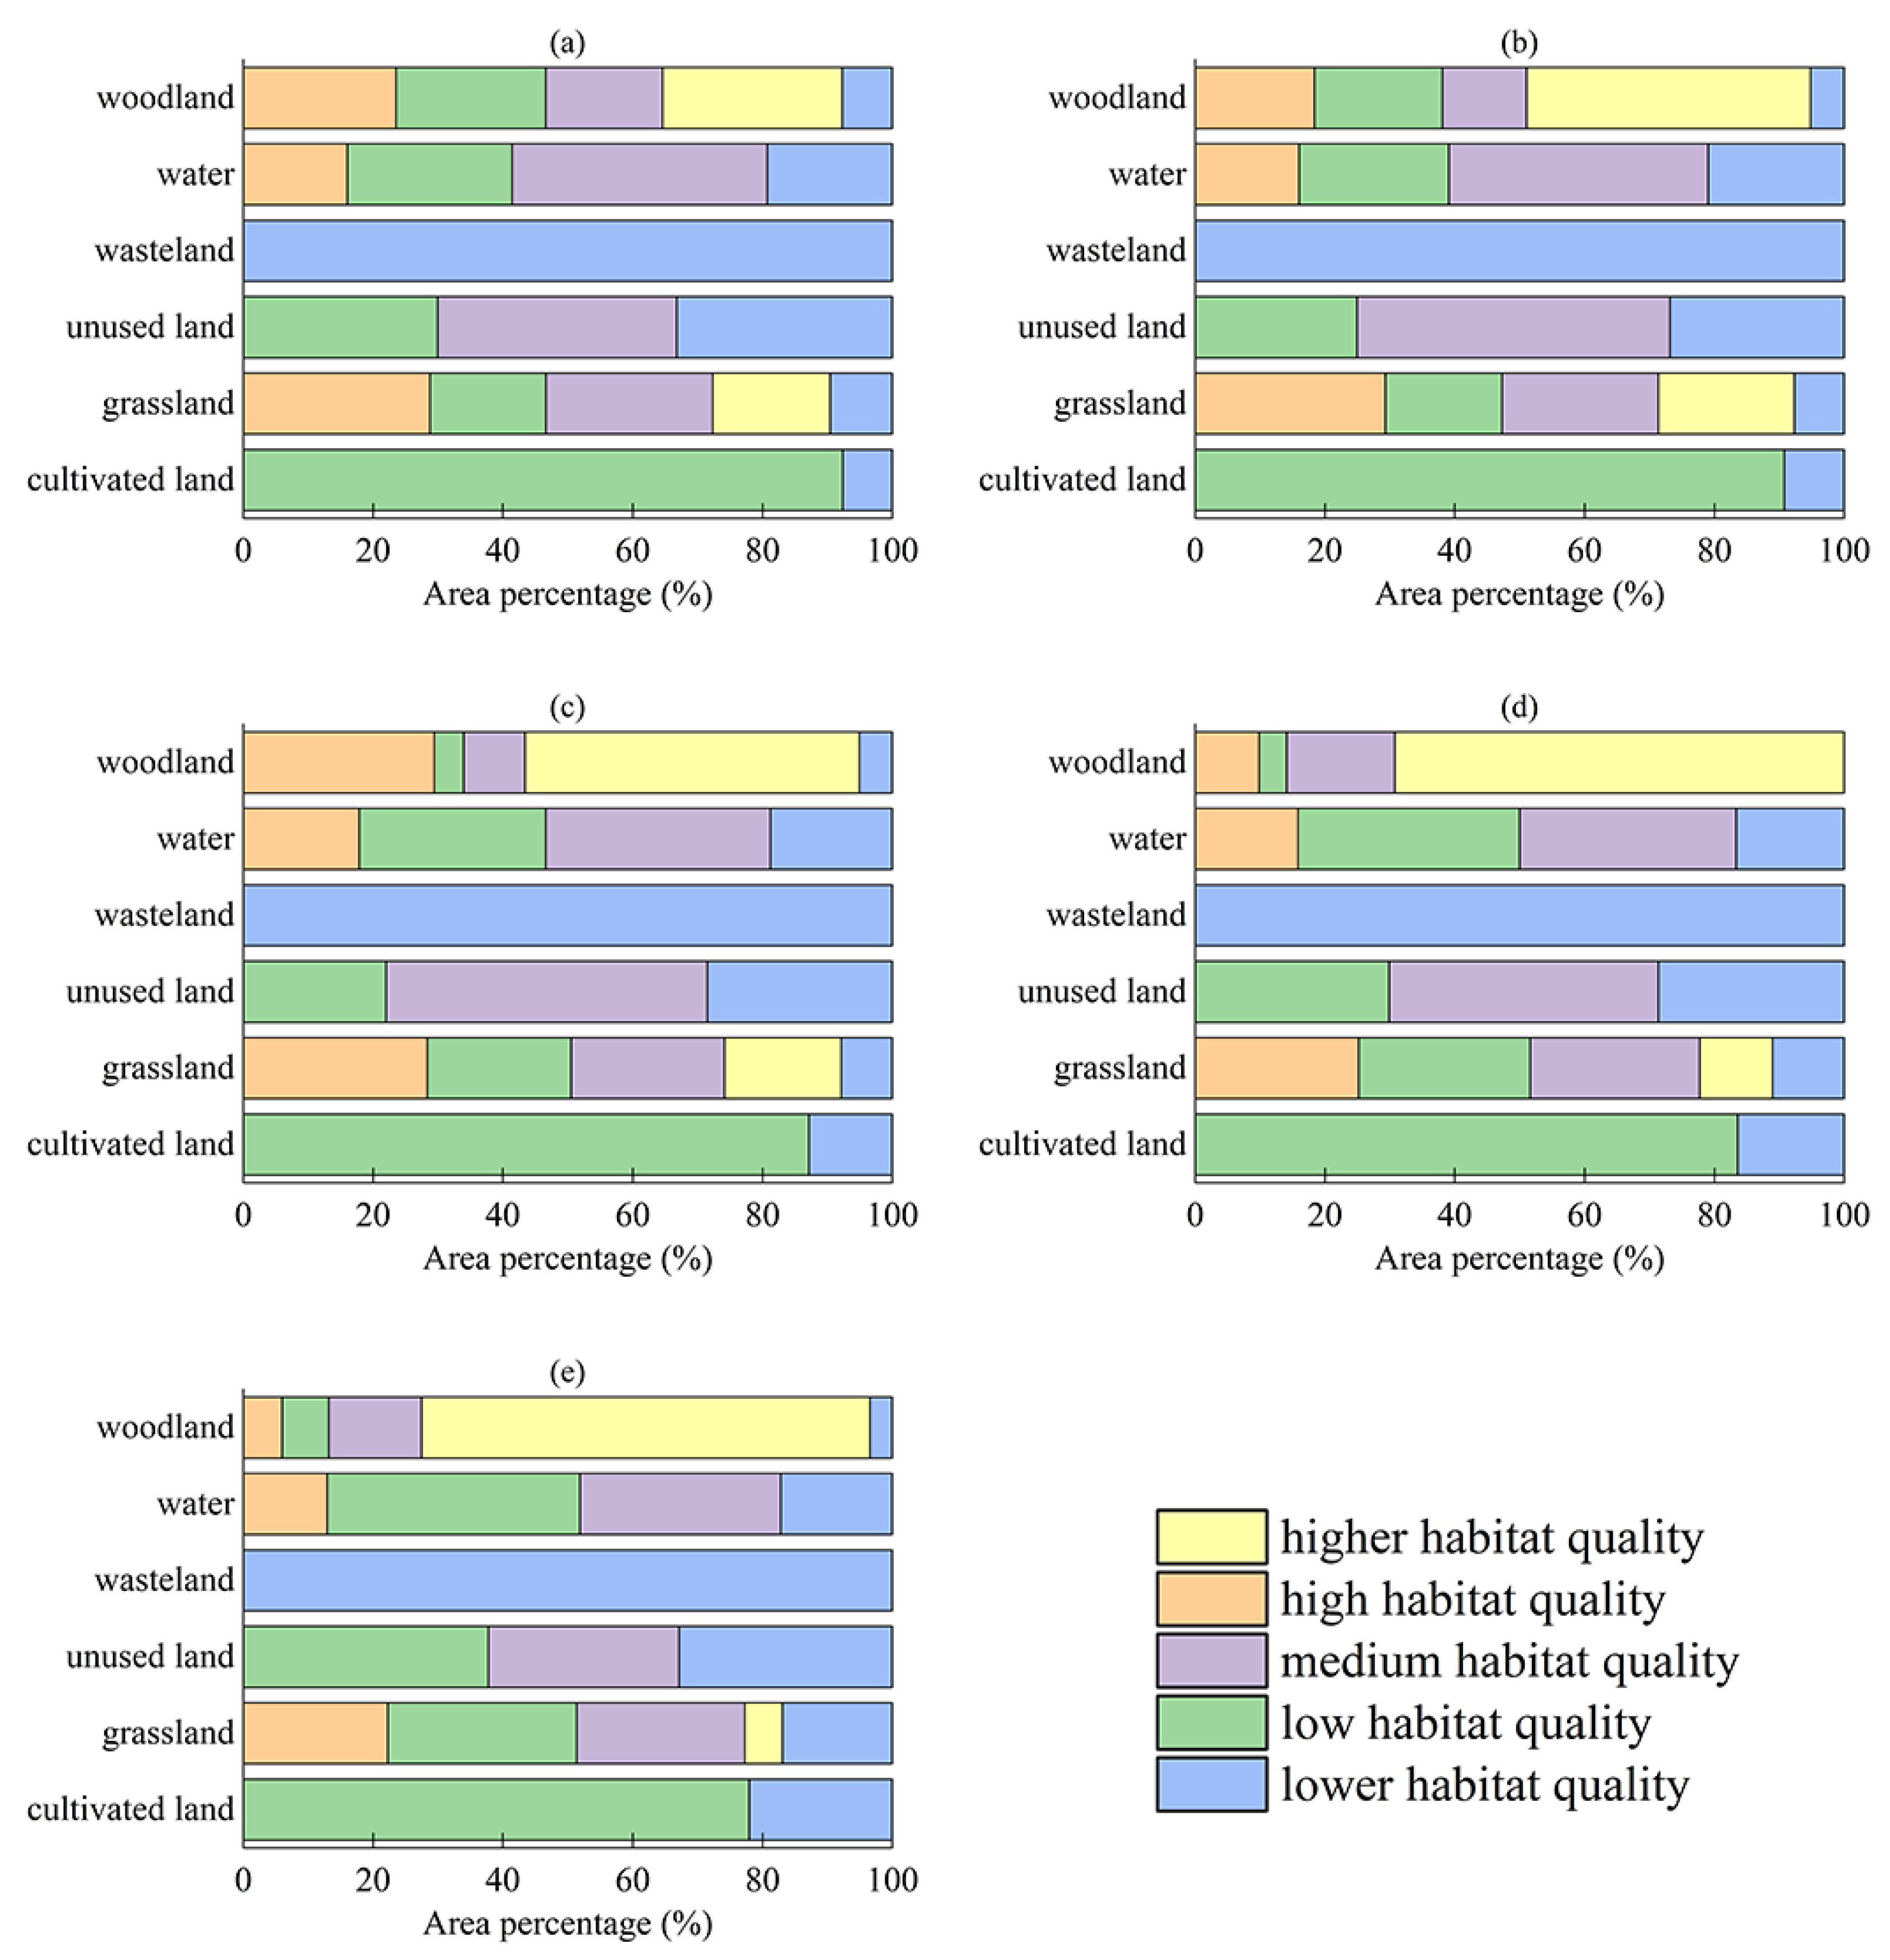
3.3. Habitat Quality in Relation to Land Use

The areas of habitat quality classes that correspond to different land use types were statistically analyzed, and the results are presented in Figure 9. From 2000 to 2020, wasteland, including urban and rural residential construction land and industrial and mining land, represented an area that belonged to high human development, and its habitat quality class was the lowest in all five years. The habitat quality class of cropland was lower in all five years, and the area of the lowest habitat quality class decreased year by year. The habitat quality of unused land was classified as lower and medium; the area of medium habitat quality showed a trend of initial increase and then decrease, while the area of lower habitat quality did not change significantly. All habitat quality classes were represented for woodlands and grasslands. The higher habitat quality of grassland from 2000 to 2015 showed an upward trend, though the area decreased slightly from 2015 to 2020. The high habitat quality class of grassland increased year by year, and the area of medium habitat quality class fluctuated year by year. The area of the lower habitat quality of grassland in 2020 decreased compared to that recorded in 2000. The area of higher habitat quality in the woodland initially increased and then decreased; the area of high habitat quality had a trend of initial increase and then decrease, followed by another increase; and the areas of lower habitat quality and low habitat quality land both had a trend if initial decrease and then increase. In water bodies, the habitat quality included the low habitat quality, lower habitat quality, and medium habitat quality classes. Among these classes, the area of medium habitat quality class initially increased and then decreased. The area of lower habitat quality class decreased continuously from 2000 to 2010, and its share of area increased from 2010 to 2020. The area of lower habitat quality decreased from 2000 to 2005 and from 2010 to 2015, before increasing from 2015 to 2020.

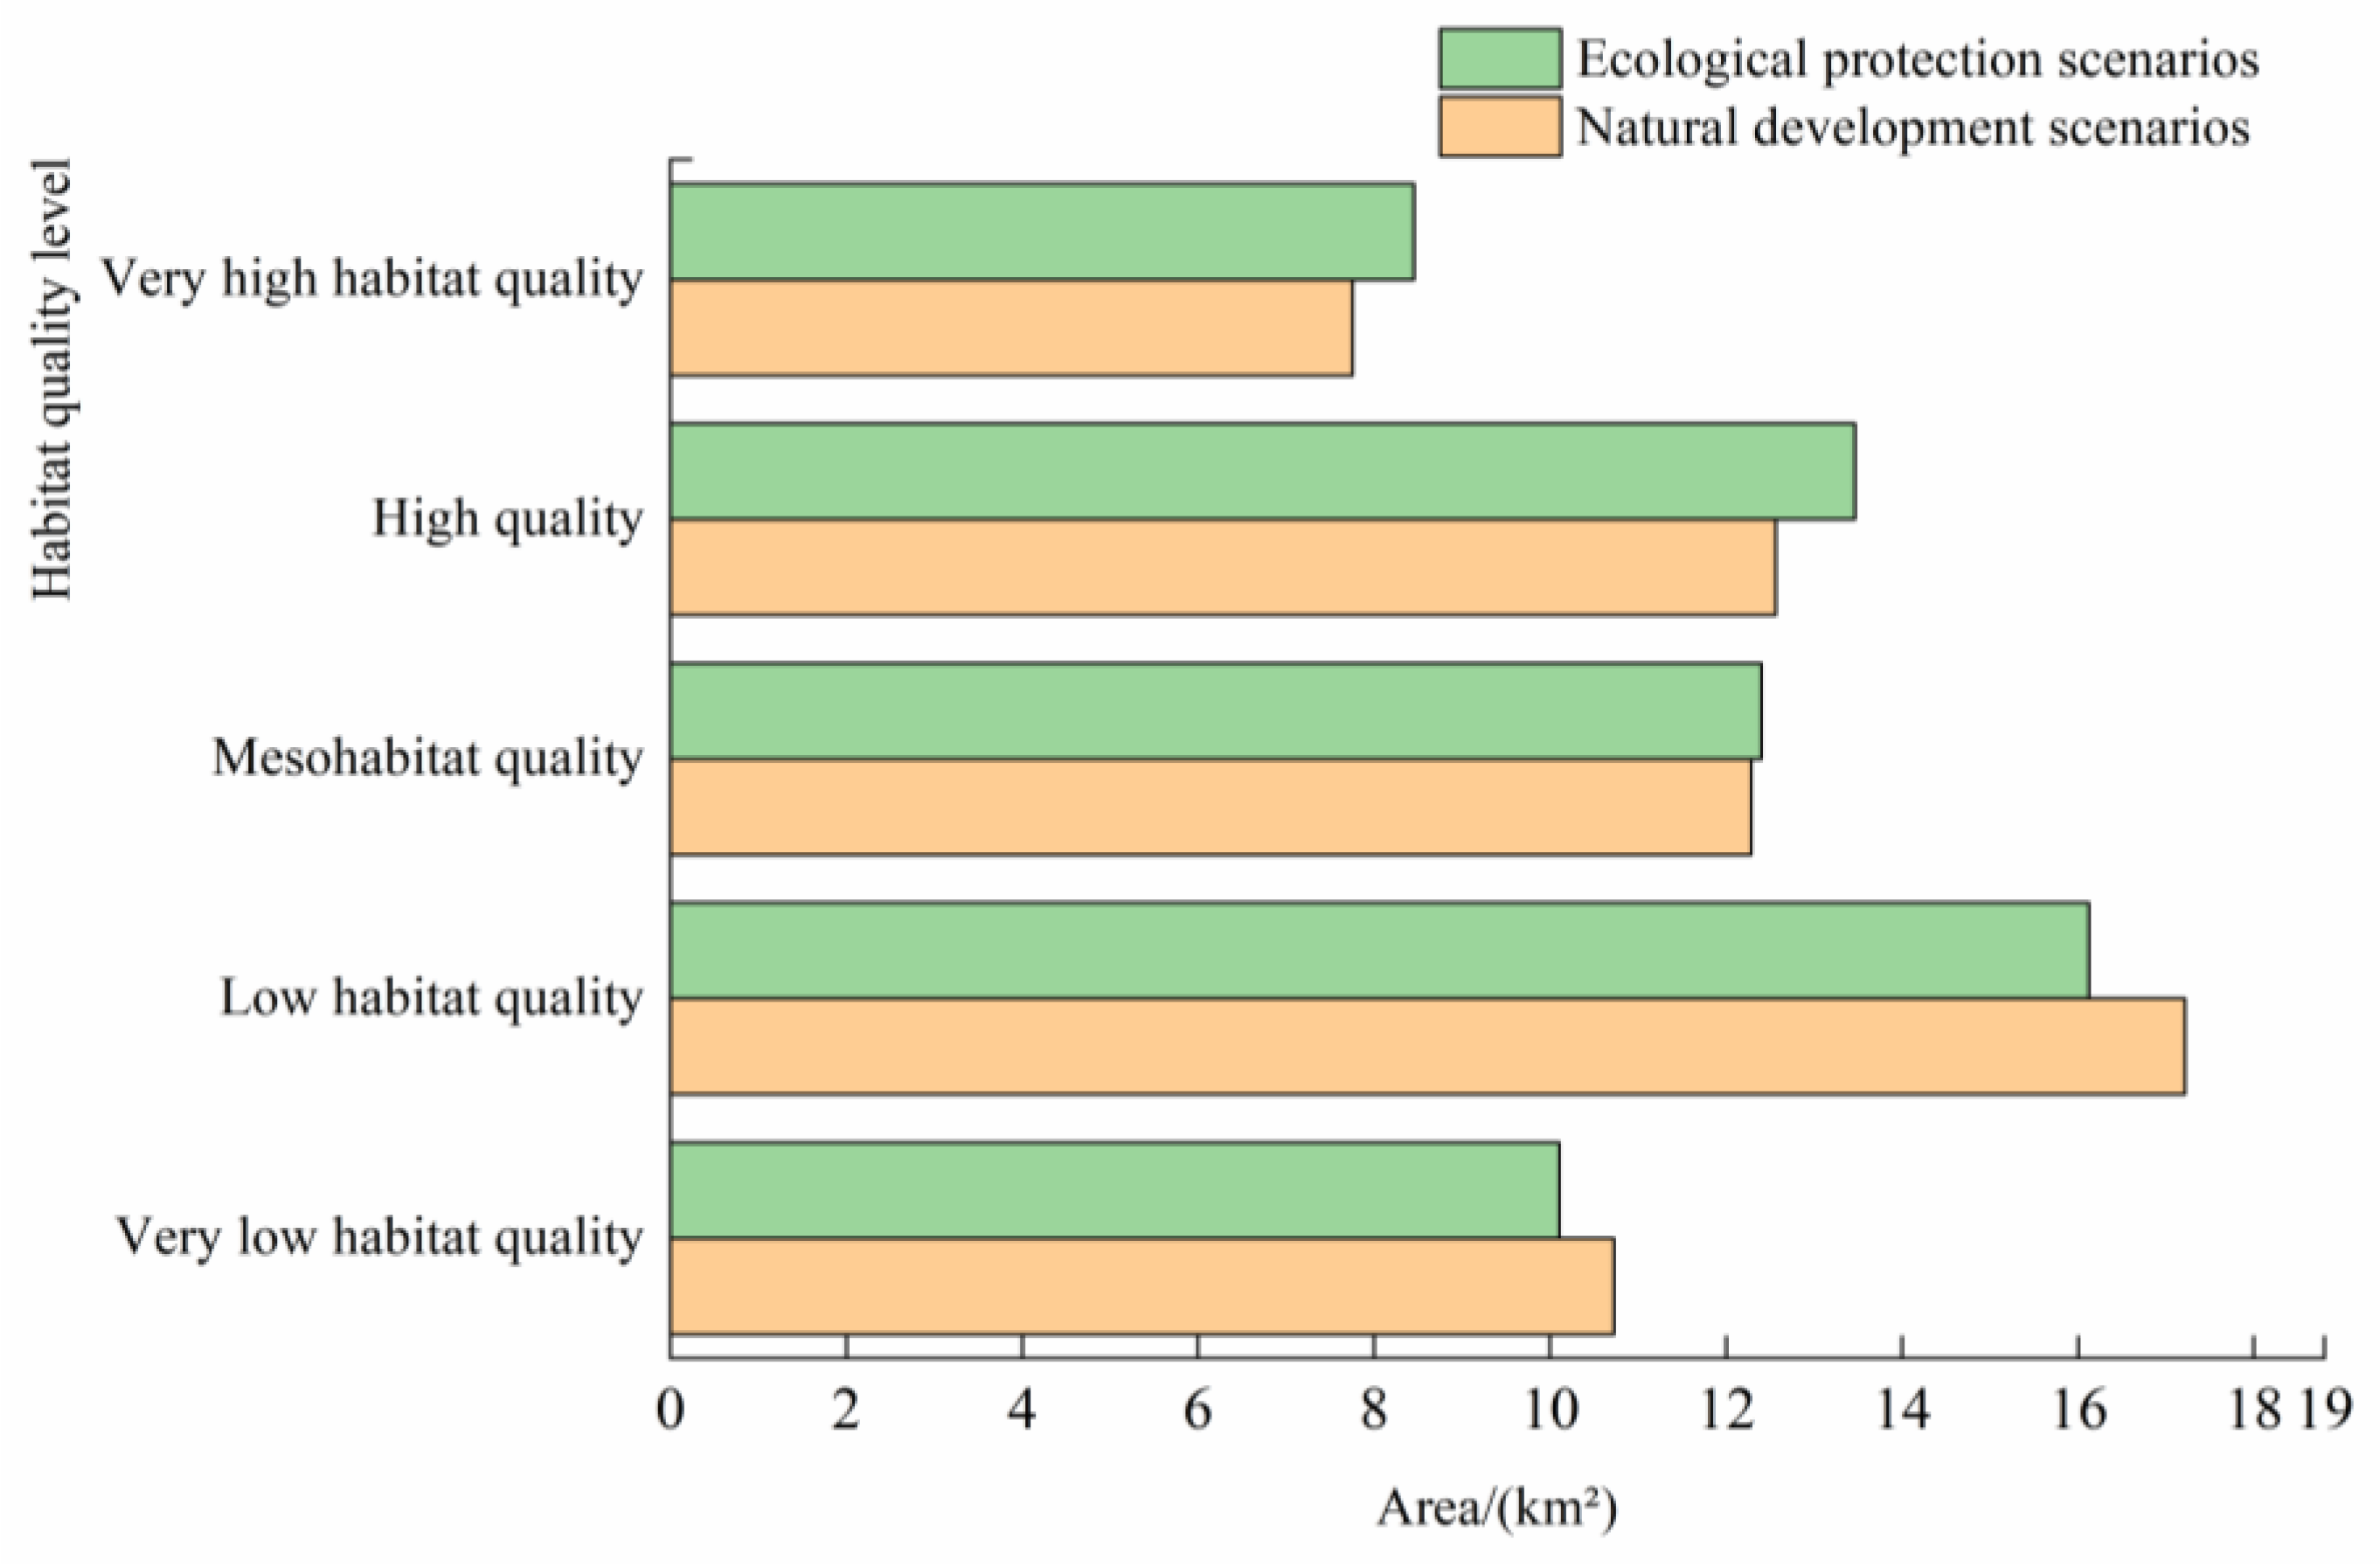
3.4. Land Use Projections to 2025

The PLUS model was used to project land use data for 2025 based on 2020 land use data. Under the nature development scenario, no adjustments were made to the original parameters of the model.
Under the ecological conservation development scenario, the area with lower habitat quality in 2020 was set as the key protected area in the PLUS model (i.e., the restricted conversion area). The land use distribution pattern of the temperate desert sub-region of the Ordos Plateau in 2025 under the ecological conservation scenario was predicted by running the PLUS model. Based on the arithmetic results, the improvement in habitat quality in the study area under the ecological protection scenario was more obvious. Under the natural development scenario, the higher-ranked habitat quality accounted for 20.76% of the total area of the study area, and the highest-ranked habitat quality accounted for 12.76% of the total area of the study area, which was generally lower than the area predicted under the ecological protection scenario. The area with the lowest habitat quality accounted for approximately 17% of the total area under both scenarios. The habitat quality in the study area was higher under ecological conservation development conditions (Figure 10 and Figure 11).

4. Discussion

4.1. Reasons for Land Use Change

The transformation of land use patterns in the temperate desert sub-region of the Ordos Plateau is the result of the combination of many factors [45,46]. Factors that threaten habitat quality include wasteland, unused land, and cropland [47,48]. Changes in the areas of these three land use types directly affect the changes in habitat quality. The Ordos Plateau temperate desert sub-region land use pattern change is, therefore, the result of many elements acting together. Analyzed from the perspective of land use transformation, the area of cultivated land initially decreased before increasing from 2000 to 2020, and the area of woodland continued to increase. The area of woodland present in 2020 represented an increase of 30 km² from that recorded in 2000, and the area of grassland in 2020 increased by 4661.66 km2 compared to that recorded in 2000. Among all land use types, woodland appears to have the most obvious impact on habitat quality. Therefore, we can predict the best balance among ecological restoration, habitat quality conservation, and socio-economic development in arid areas with an inherently fragile ecological environment [49]. In this study, we compared the habitat quality in the study area under two scenarios to the actual situation of the temperate desert sub-region of the Ordos Plateau. And the comparison results show that ecological conservation significantly contributes to the improvement in habitat quality. The results of this study are similar to those of the habitat quality study in Jilin performed by Zhao et al. [50].

4.2. Reasons for Changes in Habitat Quality

In the temperate desert sub-region of the Ordos Plateau, habitat quality is closely related to the status of land use. As a result, the level of habitat quality rose and then fell over time. The continued improvement in habitat quality occurred due to the high cover of grasslands and the active ecological and management measures implemented in recent years. In the southeastern part of the study area, there are large areas of grassland with high and stable habitat quality and low habitat degradation. In the northwestern part of the study area, there are large areas of cultivated land with low habitat quality and high degradation.

4.3. Innovations and Highlights

In this study, the Erdos Temperate Desert sub-region was selected as the study area according to the results of ecological environment division. The study of the Ordos Plateau region was mainly based on the results of administrative division, and this study selected the results of ecological zoning to study the habitat quality and land use pattern changes in the region [51]. In this paper, we used the PLUS model to predict the land use patterns of two scenarios in 2025 and used the InVEST model to evaluate the habitat quality of the two scenarios. Currently, the evaluation of future habitat quality in the study area using the PLUS and InVEST models is among the hot topics of research [52].

4.4. Suggestions and Outlook

The temperate desert sub-region of the Ordos Plateau straddles Ordos City in the Inner Mongolia Autonomous Region and Yulin City in Shaanxi Province, which are located in the Yellow River basin, China, and have a fragile ecosystem. The ecological environment of the study area is of great practical significance in terms of promoting socio-economic development and ecological environment construction [53,54], among other activities. The results of this study show that there are still some problems that need attention according to the analysis of land use and habitat quality changes. The cultivated land area expanded continuously during the period 2000–2020, and the cultivated land area increased significantly in 2020 compared to 2000. During this period, the imbalance in regional economic development is prominent. Therefore, further rational planning of regional land use is needed in the future. In particular, there is a need to further rationalize the planning of regional land development, protect high-quality cultivated land and limit the arbitrary expansion of urban land, clarify urban positioning and functions, and scientifically lead the coordinated development of regional and urban expansion. In terms of habitat quality, areas with a concentrated population and better economic development are characterized by lower habitat quality and a higher degree of degradation. Therefore, we need to focus on these corresponding areas and improve the quality of the habitats through rational planning of land use, returning farmland to forests and other measures.
The predicted results gained by comparing the two scenarios of natural development and ecological protection show that the trend of land use change in 2025 under the ecological protection scenario is stable, and the habitat quality is high. This result can be used as a basis to confirm the rationality and necessity of implementing ecological management and protection in the study area in recent years. The government can establish nature reserves, return farmland to grassland for reforestation, and guide the development of the ecological economy. This process will enhance the regional ecological barrier, improve the quality of the regional ecological environment, and reduce the degradation in the quality of human habitat.

5. Conclusions

In this study, the habitat quality module of the InVEST model was used to appraise the habitat quality of the Ordos Plateau in five periods—2000, 2005, 2010, 2015, and 2020—and characterize the changes. In addition, the PLUS model was used to predict the natural development scenario and ecological conservation. The main conclusions are as follows.
Firstly, the grassland area, arable land area, and woodland area in the temperate desert sub-region of the Ordos Plateau increased significantly from 2000 to 2020; the area of water bodies and unused land increased slightly; and the area of wasteland continued to decrease. Grassland developed rapidly, and the area increased by 4661.66 km2 in 20 years. The area of arable land showed a trend of initial decrease and then increase, though the overall trend was in the upward direction. The area of woodland continued to increase, with the area increasing by 300 times by 2020 compared to that in recorded 2000. The area of wasteland continued to decrease, and the decreasing part had mainly transformed into grassland.
Secondly, the low-value areas of habitat quality in the Ordos Plateau region from 2000 to 2020 are distributed in the northern and central parts of the study area, while the high-value areas of habitat quality are mainly distributed in the southeastern parts. The main land use type in the high-value area is grassland, with relatively low land use intensity, as well as dense forest and grass cover. The low-value area is dominated by arable land, and the land use intensity in this area is higher and more influenced by human activities.
Finally, the following patterns can be seen from the time-lapse analysis. The areas in the temperate desert subzone of the Ordos Plateau are mainly cultivated land types. Habitat quality in the region shows a trend of initial increase and then decrease, and the degradation of habitat quality in the study area shows a fluctuating trend of increase, decrease, and further increase. Analysis of the PLUS model prediction results using the InVEST model showed that the habitat quality in the study area was higher under the ecological conservation scenario in 2025. The ecological conservation scenario shows a decrease in the area of higher habitat quality, an increase in the area of medium and high habitat quality, little change in the area of low habitat quality, a decrease in the area of lower habitat quality, and an overall increase of approximately 5% in the area above the medium habitat quality level compared to the natural development scenario. Thus, habitat quality was higher under the ecological conservation scenario.

Author Contributions

Conceptualization, M.P. and X.L. (Xiaohuang Liu); methodology, M.P. and J.W.; software, M.P.; validation, M.P., X.Z. and H.L.; formal analysis, M.P.; investigation, J.L.; resources, R.W.; data curation, X.L. (Xinping Luo); writing—original draft preparation, M.P.; writing—review and editing, M.P.; visualization, L.X.; supervision, C.W.; project administration, H.Z.; funding acquisition, X.L. (Xiaohuang Liu). All authors have read and agreed to the published version of the manuscript.

Funding

This study was supported by the Research on Integrated Technology System of Natural Resources Observation and Monitoring project, No. DD20230514.

Data Availability Statement

Not applicable.

Conflicts of Interest

The authors declare no conflict of interest.

References

  1. Winkler, K.; Fuchs, R.; Rounsevell, M.; Herold, M. Global land use changes are four times greater than previously estimated Nature Communications. Nat. Commun. 2021, 12, 2501. [Google Scholar] [CrossRef]
  2. Zhang, H.B.; Wu, F.E.; Zhang, Y.N.; Han, S.; Liu, Y.Q. Spatial and temporal changes of habitat quality in Jiangsu Yancheng Wetland National Nature Reserve-Rare birds of China. Appl. Ecol. Environ. Res. 2019, 17, 4807–4821. [Google Scholar] [CrossRef]
  3. Lei, J.R.; Chen, Y.Q.; Li, L.M.; Chen, Z.Z.; Chen, X.H.; Wu, T.T.; Li, Y.L. Spatiotemporal change of habitat quality in Hainan Island of China based on changes in land use. Ecol. Indic. 2022, 145, 109707. [Google Scholar] [CrossRef]
  4. Gomes, E.; Inácio, M.; Bogdzevič, K.; Kalinauskas, M.; Karnauskaitė, D.; Pereira, P. Future scenarios impact on land use change and habitat quality in Lithuania. Environ. Res. 2021, 197, 111101. [Google Scholar] [CrossRef] [PubMed]
  5. Riedler, B.; Lang, S. A spatially explicit patch model of habitat quality, integrating spatio-structural indicators. Ecol. Indic. 2018, 94, 128–141. [Google Scholar] [CrossRef]
  6. Wu, L.L.; Sun, C.G.; Fan, F.L. Estimating the characteristic spatiotemporal variation in habitat quality using the invest model—A case study from Guangdong–Hong Kong–Macao Greater Bay Area. Remote Sens. 2021, 13, 1008. [Google Scholar] [CrossRef]
  7. Gao, L.N.; Tao, F.; Liu, R.R.; Wang, Z.L.; Leng, H.J.; Zhou, T. Multi-scenario simulation and ecological risk analysis of land use based on the PLUS model: A case study of Nanjing. Sustain. Cities Soc. 2022, 85, 104055. [Google Scholar] [CrossRef]
  8. Zhang, C.C.; Wang, P.; Xiong, P.S.; Li, C.H.; Quan, B. Spatial Pattern Simulation of Land Use Based on FLUS Model under Ecological Protection: A Case Study of Hengyang City. Sustainability 2021, 13, 10458. [Google Scholar] [CrossRef]
  9. Liu, X.P.; Liang, X.; Li, X.; Xu, X.C.; Ou, J.P.; Chen, Y.M.; Yi, L.S.; Wang, S.J.; Pei, F.S. A future land use simulation model (FLUS) for simulating multiple land use scenarios by coupling human and natural effects. Landsc. Urban Plan. 2017, 168, 94–116. [Google Scholar] [CrossRef]
  10. Wei, Q.Q.; Abudureheman, M.; Halike, A.; Yao, K.X.; Yao, L.; Tang, H.; Tuheti, B. Temporal and spatial variation analysis of habitat quality on the PLUS-InVEST model for Ebinur Lake Basin, China. Ecol. Indic. 2022, 145, 109632. [Google Scholar] [CrossRef]
  11. Huang, C.; Zhao, D.Y.; Deng, L. Landscape pattern simulation for ecosystem service value regulation of Three Gorges Reservoir Area, China. Environ. Impact Assess. Rev. 2022, 95, 106798. [Google Scholar] [CrossRef]
  12. Wang, Z.Y.; Li, X.; Mao, Y.T.; Li, L.; Wang, X.R.; Lin, Q. Dynamic simulation of land use change and assessment of carbon storage based on climate change scenarios at the city level: A case study of Bortala, China. Ecol. Indic. 2021, 134, 108499. [Google Scholar] [CrossRef]
  13. Zhu, L.Z.; Huang, Y.P. Multi-Scenario Simulation of Ecosystem Service Value in Wuhan Metropolitan Area Based on PLUS-GMOP Model. Sustainability 2022, 14, 13604. [Google Scholar] [CrossRef]
  14. Liu, C.Y.; Zhu, K.W.; Liu, J.P. Evolution and prediction of land cover and biodiversity function in Chongqing section of Three Gorges Reservoir Area. Trans. Chin. Soc. Agric. Eng. 2017, 33, 258–267. [Google Scholar]
  15. Lin, S.L.; Wang, F. Simulation and analysis of land use scenarios in Guangzhou based on PLUS model and taking into account traffic planning. J. Agric. Resour. Environ. 2022, 12, 120. [Google Scholar]
  16. Li, A.L.; Zhou, Y.; Tang, L.Y.; Niu, L.D.; Pan, M. Land use simulation and ecosystem service value assessment in Nujiang Prefecture—A multi-scenario analysis based on PLUS model. China’s Agric. Resour. Zoning 2023, 44, 140–149. [Google Scholar]
  17. Fu, B.J.; Yu, D.D.; Nv, N. Biodiversity and ecosystem services assessment index system in China. Acta Ecol. Sin. 2017, 37, 341–348. [Google Scholar]
  18. Yohannes, H.; Soromessa, T.; Argaw, M.; Dewan, A. Spatio-temporal changes in habitat quality and linkage with landscape characteristics in the Beressa watershed, Blue Nile basin of Ethiopian highlands. J. Environ. Manag. 2021, 281, 111885. [Google Scholar] [CrossRef]
  19. Fu, B.; Zhang, L. Land-use change and ecosystem services: Concepts, methods and progress. Prog. Geogr. 2014, 33, 441–446. [Google Scholar]
  20. Zhao, B.X.; Li, S.J.; Liu, Z.S. Multi-Scenario Simulation and Prediction of Regional Habitat Quality Based on a System Dynamic and Patch-Generating Land-Use Simulation Coupling Model—A Case Study of Jilin Province. Sustainability 2022, 14, 5303. [Google Scholar] [CrossRef]
  21. Pan, Z.J.; Ma, Y.W.; Cai, S.Q.; Chen, Y.; Chen, Y.M. Application of SolVES model in social value assessment of ecosystem service functions. J. World For. Res. 2023, 36, 20–25. [Google Scholar]
  22. Bai, L.M.; Feng, X.H.; Sun, R.F.; Gao, H. Spatial and temporal responses of habitat quality to urbanization: A case study of Changchun City, Jilin Province, China. Ying Yong Sheng Tai Xue Bao 2020, 31, 1267–1277. [Google Scholar] [PubMed]
  23. Liao, Z.M.; Wang, Y. Habitat quality assessment of Dianchi watershed based on InVEST model. Three Gorges Ecol. Environ. Monit. 2022, 7, 42–52. [Google Scholar]
  24. Qiu, T.Q.; Wang, X.R. Spatial-temporal evolution analysis of habitat quality in Changzhutan urban agglomeration based on InVEST model. For. Resour. Manag. 2022, 5, 99–106. [Google Scholar]
  25. Yang, J.; Xie, B.; Zhang, D. Spatial-temporal evolution of habitat quality in the Yellow River Basin and its influencing factors. J. Desert Res. 2021, 41, 12–22. [Google Scholar]
  26. Guo, Q.; Fu, B.H.; Shi, P.L.; Cudahy, T.; Zhang, J.; Xu, H. Satellite monitoring the spatial-temporal dynamics of desertification in response to climate change and human activities across the Ordos Plateau, China. Remote Sens. 2017, 9, 525. [Google Scholar] [CrossRef] [Green Version]
  27. Luo, J.; Xu, D.Y.; Ren, H.Y. Identification of desertification dynamics and the impact of climate change and human activities in Ordos from 2000 to 2010. Glacial Permafr. 2013, 35, 48–56. [Google Scholar]
  28. He, N.; Guo, W.X.; Wang, H.W.; Yu, L.; Cheng, S.Y.; Huang, L.T.; Jiao, X.Y.; Chen, W.X.; Zhou, H.T. Temporal and Spatial Variations in Landscape Habitat Quality under Multiple Land-Use/Land-Cover Scenarios Based on the PLUS-InVEST Model in the Yangtze River Basin, China. Land 2023, 12, 1338. [Google Scholar] [CrossRef]
  29. Zhang, H.Y.; Fan, J.W.; Huang, L.; Tang, Y.L.; Yue, Y.; Yang, Y.; Liu, X.H. Theoretical research and technical scheme of comprehensive zoning of natural resources in China. Resour. Sci. 2020, 42, 1870–1882. [Google Scholar]
  30. Ma, Q.M.; Long, Y.P.; Jia, X.P.; Wang, H.B.; Li, Y.S. Vegetation response to climatic variation and human activities on the Ordos Plateau from 2000 to 2016. Environ. Earth Sci. 2019, 78, 709. [Google Scholar] [CrossRef]
  31. Zhao, Y.L.; Liu, H.X.; Zhang, A.B.; Cui, X.M.; Zhao, A.Z. Spatiotemporal variations and its influencing factors of grassland net primary productivity in Inner Mongolia, China during the period 2000–2014. J. Arid Environ. 2019, 165, 106–118. [Google Scholar] [CrossRef]
  32. Liu, Z.M.; Zhou, Q.L.; Ma, Q.; Kuang, W.N.; Daryanto, S.; Wang, L.X.; Wu, J.; Liu, B.; Zhu, J.L.; Cao, C.Y. Scale effect of climate factors on soil organic carbon stock in natural grasslands of northern China. Ecol. Indi. 2023, 146, 109757. [Google Scholar] [CrossRef]
  33. Fang, Q.; Wu, H.C.; Hinnov, L.A.; Wang, X.L.; Yang, T.S.; Li, H.Y.; Zhang, S.H. A record of astronomically forced climate change in a late Ordovician (Sandbian) deep marine sequence, Ordos Basin, North China. Sediment. Geol. 2016, 341, 163–174. [Google Scholar] [CrossRef] [Green Version]
  34. Lu, C.; Qi, X.; Zheng, Z.S.; Jia, K. PLUS-model based multi-scenario land space simulation of the Lower Yellow River Region and its ecological effects. Sustainability 2022, 14, 6942. [Google Scholar] [CrossRef]
  35. Biau, G. Analysis of a random forests model. J. Mach. Learn. Res. 2012, 13, 1063–1095. [Google Scholar]
  36. Shiferaw, H.; Bewket, W.; Alamirew, T.; Zeleke, G.; Teketay, D.; Bekele, K.; Schaffner, U.; Eckert, S. Implications of land use/land cover dynamics and Prosopis invasion on ecosystem service values in Afar Region, Ethiopia. Sci. Total Environ. 2019, 675, 354–366. [Google Scholar] [CrossRef]
  37. Wang, X.J.; Liu, G.X.; Xiang, A.C.; Xiao, S.M.; Lin, D.R.; Lin, Y.B.; Lu, Y. Terrain gradient response of landscape ecological environment to land use and land cover change in the hilly watershed in South China. Ecol. Indic. 2023, 146, 109797. [Google Scholar] [CrossRef]
  38. Li, M.Y.; Zhou, Y.; Xiao, P.N.; Tian, Y.; Huang, H.; Xiao, L. Evolution of Habitat Quality and Its Topographic Gradient Effect in Northwest Hubei Province from 2000 to 2020 Based on the InVEST Model. Land 2021, 10, 857. [Google Scholar] [CrossRef]
  39. Moreira, M.; Fonseca, C.; Vergílio, M.; Calado, H.; Gil, A. Spatial assessment of habitat conservation status in a Macaronesian island based on the InVEST model: A case study of Pico Island (Azores, Portugal). Land Use Policy 2018, 78, 637–649. [Google Scholar] [CrossRef]
  40. Ren, D.F.; Cao, A.H.; Wang, F.Y. Response and multi-scenario prediction of carbon storage and habitat quality to land use in liaoning Province, China. Sustainability 2023, 15, 4500. [Google Scholar] [CrossRef]
  41. Aneseyee, A.B.; Noszczyk, T.; Soromessa, T.; Elias, E. The InVEST habitat quality model associated with land use/cover changes: A qualitative case study of the Winike Watershed in the Omo-Gibe Basin, Southwest Ethiopia. Remote Sens. 2020, 12, 1103. [Google Scholar] [CrossRef] [Green Version]
  42. Chu, L.; Sun, T.C.; Wang, T.W.; Li, Z.X.; Cai, C.F. Evolution and prediction of landscape pattern and habitat quality based on CA-Markov and InVEST model in Hubei section of Three Gorges Reservoir Area (TGRA). Sustainability 2018, 10, 3854. [Google Scholar] [CrossRef] [Green Version]
  43. Zhao, Y.F.; Wu, Q.R.; Wei, P.P.; Zhao, H.; Zhang, X.W.; Pang, C.K. Explore the mitigation mechanism of urban thermal environment by integrating geographic detector and standard deviation ellipse (SDE). Remote Sens. 2022, 14, 3411. [Google Scholar] [CrossRef]
  44. Li, L.; Wang, J.J.; Yang, C.X.; Wei, C.F. Implementation Process of General Land-Use Planning and Its Adjustment—A Case Study of Rongchang District in Chongqing, China. Environ. Res. Pubilic Health 2021, 18, 5639. [Google Scholar] [CrossRef]
  45. Luo, Z.W.; Hu, X.J.; Wang, Y.Z.; Chen, C.Y. Simulation and Prediction of Territorial Spatial Layout at the Lake-Type Basin Scale: A Case Study of the Dongting Lake Basin in China from 2000 to 2050. Sustainability 2023, 15, 5074. [Google Scholar] [CrossRef]
  46. Wei, L.; Zhou, L.; Sun, D.Q.; Yuan, B.; Hu, F.M. Evaluating the impact of urban expansion on the habitat quality and constructing ecological security patterns: A case study of Jiziwan in the Yellow River Basin, China. Ecol. Indic. 2022, 145, 109544. [Google Scholar] [CrossRef]
  47. Long, Y.; Luo, S.Q.; Liu, X.; Luo, T.Y.; Liu, X.J. Research on the Dynamic Evolution of the Landscape Pattern in the Urban Fringe Area of Wuhan from 2000 to 2020. Geo-Information 2022, 11, 483. [Google Scholar] [CrossRef]
  48. Ma, R.; Lü, Y.; Fu, B.; Lü, D.; Wu, X.; Sun, S.; Zhang, Y. A modified habitat quality model to incorporate the effects of ecological restoration. Environ. Res. Lett. 2022, 17, 104029. [Google Scholar] [CrossRef]
  49. Fu, Y.J.; Shi, X.Y.; He, J.; Yuan, Y.; Qu, L.L. Identification and optimization strategy of county ecological security pattern: A case study in the Loess Plateau, China. Ecol. Indic. 2020, 112, 106030. [Google Scholar] [CrossRef]
  50. Zhao, L.S.; Yu, W.Y.; Meng, P.; Zhang, J.S.; Zhang, J.X. InVEST model analysis of the impacts of land use change on landscape pattern and habitat quality in the Xiaolangdi Reservoir area of the Yellow River basin. China. Land Degrad. Dev. 2022, 33, 2870–2884. [Google Scholar] [CrossRef]
  51. Su, Z.; Yang, Y.; Wang, Y.; Zhang, P.; Luo, X. Study on Spatiotemporal Evolution Features and Affecting Factors of Collaborative Governance of Pollution Reduction and Carbon Abatement in Urban Agglomerations of the Yellow River Basin. Int. J. Environ. Res. Public Health 2023, 20, 3994. [Google Scholar] [CrossRef]
  52. Wang, J.B.; Wu, Y.L.; Gou, A.P. Habitat quality evolution characteristics and multi-scenario prediction in Shenzhen based on PLUS and InVEST models. Front. Environ. Sci. 2023, 11, 1146347. [Google Scholar] [CrossRef]
  53. Sun, X.Q.; Yu, Y.H.; Wang, J.J.; Liu, W.D. Analysis of the spatiotemporal variation in habitat quality based on the invest model—A case study of Shangri-la city, northwest Yunnan, China. J. Phys. Conf. Ser. IOP Publ. 2021, 1961, 012016. [Google Scholar] [CrossRef]
  54. Wang, B.X.; Cheng, W.M. Effects of land use/cover on regional habitat quality under different geomorphic types based on InVEST model. Remote Sens. 2022, 14, 1279. [Google Scholar] [CrossRef]
Figure 1. Location map of the Ordos Plateau.
Land 12 01470 g001
Figure 2. Technology roadmap.
Land 12 01470 g002
Figure 3. Land use change: (a) land use in 2020; (b) land use in 2015; (c) land use in 2010; (d) land use in 2005; (e) land use in 2000.
Land 12 01470 g003
Figure 4. Direction of change in different land types: (a) cultivated land; (b) woodlands; (c) grasslands; (d) water bodies; (e) wasteland; (f) unused land.
Land 12 01470 g004
Figure 5. Changes in habitat quality over time: (a) habitat quality in 2020; (b) habitat quality in 2015; (c) habitat quality in 2010; (d) habitat quality in 2005; (e) habitat quality in 2000.
Land 12 01470 g005
Figure 6. Change in habitat degradation over time: (a) 2020; (b) 2015; (c) 2010; (d) 2005; (e) 2000.
Land 12 01470 g006
Figure 7. Habitat quality level over time: (a) habitat quality rating for 2020; (b) habitat quality rating for 2015; (c) habitat quality rating for 2010; (d) habitat quality rating for 2005; (e) habitat quality rating for 2000.
Land 12 01470 g007
Figure 8. Different landscape species change directions: (a) higher habitat quality; (b) high habitat quality; (c) medium habitat quality; (d) low habitat quality; (e) lower habitat quality.
Land 12 01470 g008
Figure 9. Map of habitat quality and land use in the period 2000–2020: (a) 2020; (b) 2015; (c) 2010; (d) 2005; (e) 2000.
Land 12 01470 g009
Figure 10. Land use and habitat quality grades under different conditions: (a) land use under ecological protection in 2025: (b) habitat quality level in 2025 under ecological conservation scenarios; (c) land use in the context of natural development in 2025; (d) habitat quality in 2025 under natural development scenarios.
Land 12 01470 g010
Figure 11. The corresponding areas of individual habitat quality levels under different development conditions.
Land 12 01470 g011
Table 1. Data sources.
Data TypeSecondary Data TypeData Source
Land use dataLand use data for 2000, 2005, 2010, 2015, and 2020The 30 m annual land cover datasets and its dynamics in China from 1990 to 2021 (https://zenodo.org/record/5816591/export/hx/ (accessed on 20 October 2022))
Soil dataSoil texture dataThe HWSD World Soil Database published by the Food and Agriculture Organization of the United Nations (https://www.fao.org/home/ (accessed on 20 October 2022))
Terrain dataDEMThe “ASTER GDEM 30M Resolution Digital Elevation Model” published by the Geospatial Data Cloud Platform of the Computer Network Information Center of the Chinese Academy of Sciences
Slope
Climate dataAnnual average rainfall dataThe National Geoscience Data Center (http://www.geodata.cn/ (accessed on 20 November 2022))
Annual average temperature data
Road accessibility dataDistance from riverThe remote sensing monitoring data of land use in China released by the Resource Environment Science and Data Center (https://www.resdc.cn/ (accessed on 20 October 2022))
Distance from county seat
Distance from highway
Distance from railroad
Distance from primary roads
Socio-economic dataLuminous data
GDP
PopulationThe spatial distribution of population in 2000, China (https://hub.worldpop.org/ (accessed on 20 October 2022)).
Table 2. Threat feed parameters.
Threat FeedsMaximum Coercive Distance (km)WeightSpatial Attenuation Type
Cultivated land40.6Linear
Wasteland80.4Exponential
Unused land60.5Linear
Table 3. Sensitivity of different site types to habitat threat sources.
Type of Land UseHabitat SuitabilityCultivated LandWastelandUnused Land
Cultivated land0.300.80.4
Woodland10.60.40.2
Grassland0.90.80.60.6
Water0.70.50.40.3
Wasteland0000.1
Unused land0.50.60.40
Table 4. Land use transfer matrix settings for two scenarios: natural development (NDS) and ecological conservation (ECS) scenarios.
Now
Future
Cultivated LandWoodlandGrasslandWaterWastelandUnused Land
SceneryNDSECSNDSECSNDSECSNDSECSNDSECSNDSECS
Cultivated land111111001111
Woodland101111001010
Grassland101111001010
Water101011110000
Wasteland000010001111
Unused land111111001111
Disclaimer/Publisher’s Note: The statements, opinions and data contained in all publications are solely those of the individual author(s) and contributor(s) and not of MDPI and/or the editor(s). MDPI and/or the editor(s) disclaim responsibility for any injury to people or property resulting from any ideas, methods, instructions or products referred to in the content.

