Article

Physical Environment Study on Social Housing Stock in Italian Western Alps for Healthy and Sustainable Communities

1
School of Architecture, South China University of Technology, Guangzhou 510641, China
2
Department of Architecture and Design, Politecnico di Torino, 10125 Torino, Italy
3
State Key Laboratory of Subtropical Building and Urban Science, South China University of Technology, Guangzhou 510641, China
4
Architectural Design & Research Institute Co., Ltd., South China University of Technology, Guangzhou 510641, China
5
Energy Saving Technology Research Institute, South China University of Technology, Guangzhou 510641, China
*
Author to whom correspondence should be addressed.
Land 2023, 12(7), 1468; https://doi.org/10.3390/land12071468
Submission received: 20 June 2023 / Revised: 21 July 2023 / Accepted: 21 July 2023 / Published: 23 July 2023

Abstract

:
Climate change has reduced the comfort of community environments, and there is an urgent need to improve the health and well-being of low-income residents through design and technical measures. Therefore, this paper conducts research in the context of an ongoing social housing renovation project in Aosta, Italy, in a cold winter and hot summer Alpine environment. The study combined interviews, field measurements, and multiple software simulations to analyze the home of an older adult experiencing energy deprivation. The study found that the indoor acoustic environment quality meets the requirements of various sound-related standards. Still, the lighting and thermal environment must be designed to reduce glare and western sun exposure, and the air quality could improve. Residents’ demand for renovation is low technology, low cost, and high comfort. Therefore, suggestions for combining active and passive transformation measures and maximizing the use of climate and resources are proposed. The lighting and thermal environment are optimized based on the green wisdom of the Haylofts building of the Walser family in the Alps: increase ventilation and reduce indoor air age to improve air quality. Overall, a comprehensive assessment of extreme climatic conditions facilitates the quantitative and qualitative study and control of social housing environments, improves occupant comfort, and decarbonizes such social building stock.

1. Introduction

Urban climate change has contributed to the decline of indoor and outdoor comfort, altered habits in interior ventilation, and boosted energy consumption for climatization. Globally, climate change issues are the most critical to global health [1,2,3]. Over the past 2000 years, human activity has warmed the climate alarmingly. According to the Intergovernmental Panel on Climate Change (IPCC) 2021 Summary for Policymakers, global surface temperatures have risen rapidly by at least 0.8 °C over the past 170 years [4]. Due to the critical impact of climate change, in-depth research and discussions have started very early around the world. In 1972, the first world conference on the environment, United Nations Conference on the Human Environment (UNCHE), held in Stockholm, recommended attention to the climate change problem [5]. In 1982, the Nairobi Declaration was published to commemorate the tenth anniversary of the UNCHE. Importantly, this declaration further emphasized the global warming problem for sustainable development [6]. In 1987, Our Common Future, also known as the Brundtland Report, mentioned the carbon dioxide build-up leading to global warming [7,8].
In 1992, the United Nations Conference on Environment and Development (UNCED) was held in Rio de Janeiro. This conference resulted in the agreement of the United Nations Framework Convention on Climate Change (UNFCCC). The Conference of the Parties (COP), the highest decision-making body of the UNFCCC, meets annually to review progress on climate change. In 2007, the ‘Bali Road Map’ was published at the 2007 United Nations Climate Change Conference to affirm that humans must reduce emissions to decrease the risks of climate change [9]. In 2015, the United Nations Climate Change Conference passed the “Paris Agreement.” It aims to limit the global temperature increase to below 2 degrees Celsius above pre-industrial levels and to pursue efforts to keep it below 1.5 degrees Celsius [10,11]. In the same year, the United Nations formulated 17 sustainable development goals (SDGs) in the 2030 Agenda, which promoted the global consensus to address climate change [12]. These include a target on climate action SDG13, which calls for urgent action to address climate change and its impacts. In addition, many countries have developed national climate action plans to reduce emissions and mitigate the effects of climate change. Italy is one of the leading European countries supporting renewable energy sources such as solar [13]. Regional initiatives to reduce climate change also exist, such as the European Union’s 2030 Climate and Energy Framework and the Asia-Pacific Economic Cooperation (APEC) Energy Working Group. In 2020, the European Commission announced the draft “European Climate Law.” All countries are trying to improve climate change and achieve sustainable development [14]. The description of IPCC Working Group III, “Climate Change 2022: Mitigation of Climate Change”, provides an updated global assessment of progress and commitments to climate change mitigation and examines international emission sources [15]. In 2023, scholars refer to the current climate data and use the greenhouse gas concentration trajectory-Representative Concentration Pathways (RCP) adopted by the IPCC to conduct climate analysis on the capitals of each Italian region. The city of Aosta considers the RCP 4.5 scenario (global average temperature increase of 1.1 to 2.6 °C). Research shows that by 2050, the average annual temperature will increase from the current 12.4 °C to 14.3 °C in 2050 and to 15.5 °C in 2100; the relative humidity in 2100 will increase slightly from the current 64.9% to 65.1%; the horizontal global radiation will rise to 306 and 322 Wh/m2 in 2050 and 2100 [16].
Retrofitting existing buildings needs to consider environmental comfort for occupants, especially older adults, affordable technology to meet the needs of low-income families, and minimal impact on climate change. The Italy national bureau of Statistics (ISTAT) divides the types of buildings in the national construction stock into four categories: single-family, two-family, multi-family, and apartment [17]. Residential buildings account for almost 90% of the total construction volume in Italy. Most Italian buildings were built in the 1960s–1970s before the first energy efficiency code was issued in 1991. Italy initially had a low construction replacement rate of less than 1% per year. The regulatory framework for the residential building renovation market has developed since the passage of the first insulation ordinance in 1976—for example, the Renewable Energy Act in 2011 and the Energy Savings Act in 2014. The ‘IEA-EBC’ is published by the International Energy Agency, namely the Strategic Plan 2019–2024: Building Energy and Community Technology Partnership Program. The aim is to retrofit existing buildings with low-tech, functional, and affordable technologies and to support transforming the built environment towards more energy-efficient and sustainable buildings and communities through international collaborative research and open innovation solutions [18]. In October 2020, the European Commission announced the “Renovation Wave” strategy in Brussels, entitled “A Renovation Wave for Europe—greening our buildings, creating jobs, improving lives.” For climate neutrality by 2050, the Renovation Wave strategy will target 220 million buildings in Europe with large-scale retrofitting efforts, aiming to double at least the annual energy renovation of residential and non-residential buildings in the EU [19]. This strategy highlights the consequences of renovating Europe’s building stock due to its relatively old age (85% of existing buildings being over 20 years old) and that most buildings (85–95%) will still be used in 2050. Currently, energy renovation rates in buildings are low (around 1%, with only 0.2% for “deep” energy renovations). To address this, the EU aims to double annual energy retrofit rates over the next decade, focusing on: “(a) Tackling energy poverty and the worst-performing buildings. (b) Public buildings and social infrastructure. (c) Decarbonizing heating and cooling” [20]. The European Commission’s 2021 work program has announced the “Fit for 55” package to reduce greenhouse gas emissions, including aspects such as the energy performance of buildings [21]. According to the 2021 Global Status Report on Buildings and Construction by the United Nations Environment Program (UNEP), buildings accounted for 36% of global energy demand and 37% of energy-related CO2 emissions by 2020. Despite the coronavirus disease (COVID-19) and other obstacles, the share of buildings fell by 10% compared with 2019, reaching the lowest point since 2007 [22]. The characteristic data are shown in Figure 1.
A sustainable indoor physical environment is essential for promoting human health and well-being, reducing environmental impact, and contributing to economic activity. Environmental gerontological theories suggest that the indoor physical environment is a crucial factor affecting the well-being of older adults [23]. The quality of life of most older adult residents in Europe has not been fundamentally targeted to improve [24,25,26]. The aging of the population is a problem that developed countries must face soon. In 2002, the World Health Organization (WHO) proposed an active aging framework, with safe housing for older adults as a critical theme in the physical environment dimension [27,28]. In 2019, The European Union’s (EU) new Smart Healthy Age-Friendly Environments (2019–2023) policy development program began [29]. Humans generally adapt to indoor physical environments through behavioral, physiological, and psychological adaptations [30,31]. A two-way link is being recognized between the built environment and human behavior, health, and well-being [32,33,34]. Scholars have studied how the thermal and acoustic environment critically impacts indoor physical environment quality [35].
Web of Science (WOS) is one of the most influential and authoritative electronic literature databases in the world, and it is also an important channel for global scholars to obtain academic resources. Therefore, the papers included in WOS can reflect the research status and progress of the fields it represents. Before the start of this study, searching the literature on the WOS site with the theme of ‘social housing’ and ‘physical environment’ obtained 1610 results of d in the core collection. Since 1998, the amount of related research literature has gradually increased. The research topics include Place Attachment, Self-rated Health, Physical Activity, and Thermal Comfort. More comprehensive assessments of the four elements of the physical environment of social housing need to be more thorough. Among the results are 170 articles related to older adults, mainly involving physical activity, health self-assessment, falls, and human-computer interaction. There still needs to be more research strategies for improving the built environment of older adult residents to optimize their living comfort in current research. The United States, which ranks first in the number of results, has 484 articles, while Italy, which ranks 14th, has only 36 pieces.
More research and discussion are still needed regarding the physical environment elements of affordable housing, environmental improvement strategies, the activity characteristics of older adult residents, and the environmental needs of older adults. This article examines housing for older adults with diminished physical capacity and economic vulnerability. This housing belongs to the social housing in Italy. Social housing is a series of interventions within the Italian real estate market to facilitate a new living culture diffusion and assists those looking for alternative and temporary housing solutions, such as economically vulnerable individuals and families. Renovation measures address the issues of climate change, carbon emissions, and sustainable development in the context of affordable housing (Among them, affordable housing belongs to A/3 [36], defined as a real estate construction unit that is economical in terms of materials used and decoration. The technical systems are limited to essential systems), where residents often need more financial resources. A significant proportion of residents within this context are older adults. Accordingly, the indoor physical environment should be designed and maintained to support older adults’ comfort, safety, and well-being. Older adults have a range of differences in their tolerance to indoor and outdoor thermal, lighting, acoustic, and air quality. Our research methodology has been based on interviews, simulations, and onsite measurements of the physical environment of the existing building. The aim is to retrofit building systems through natural ventilation, shading, and improving the envelope’s insulation. The objective is to target the building’s energy demand, carbon emissions, and environmental footprint while improving the residents’ health and comfort, increasing energy efficiency, and reducing operating costs for building owners. This paper uses a model of low-cost renovation of social housing buildings to improve the comfort of the living environment of older adults to help the world cope with the wave of climate change.

2. Research Objects

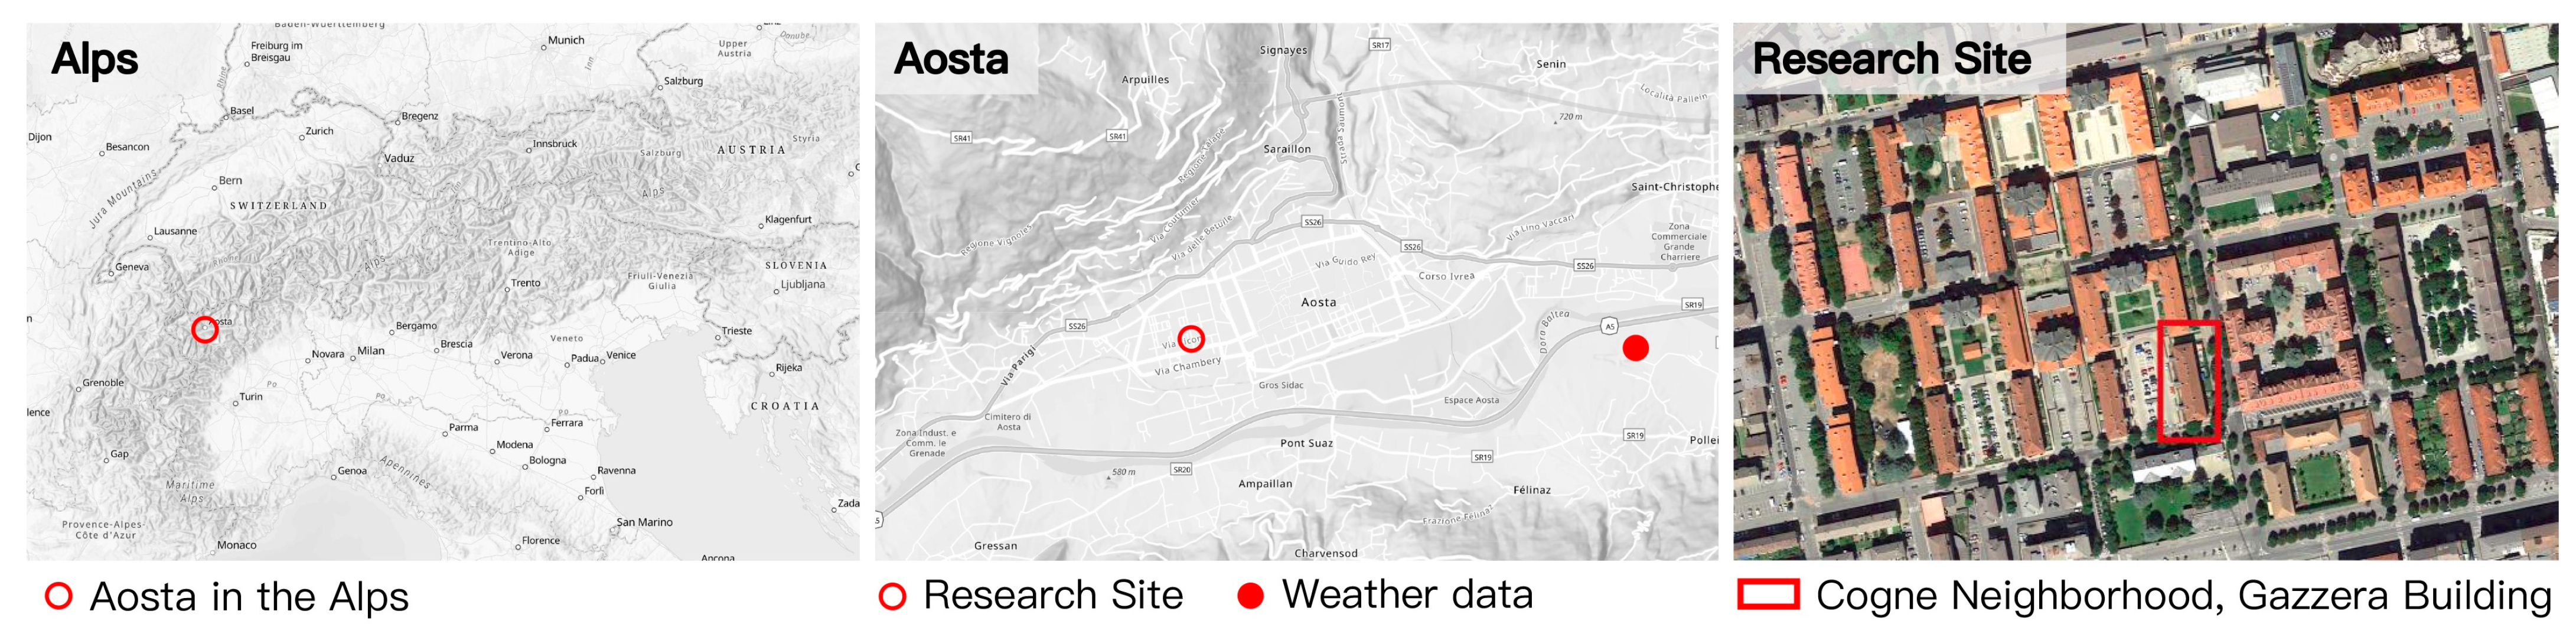
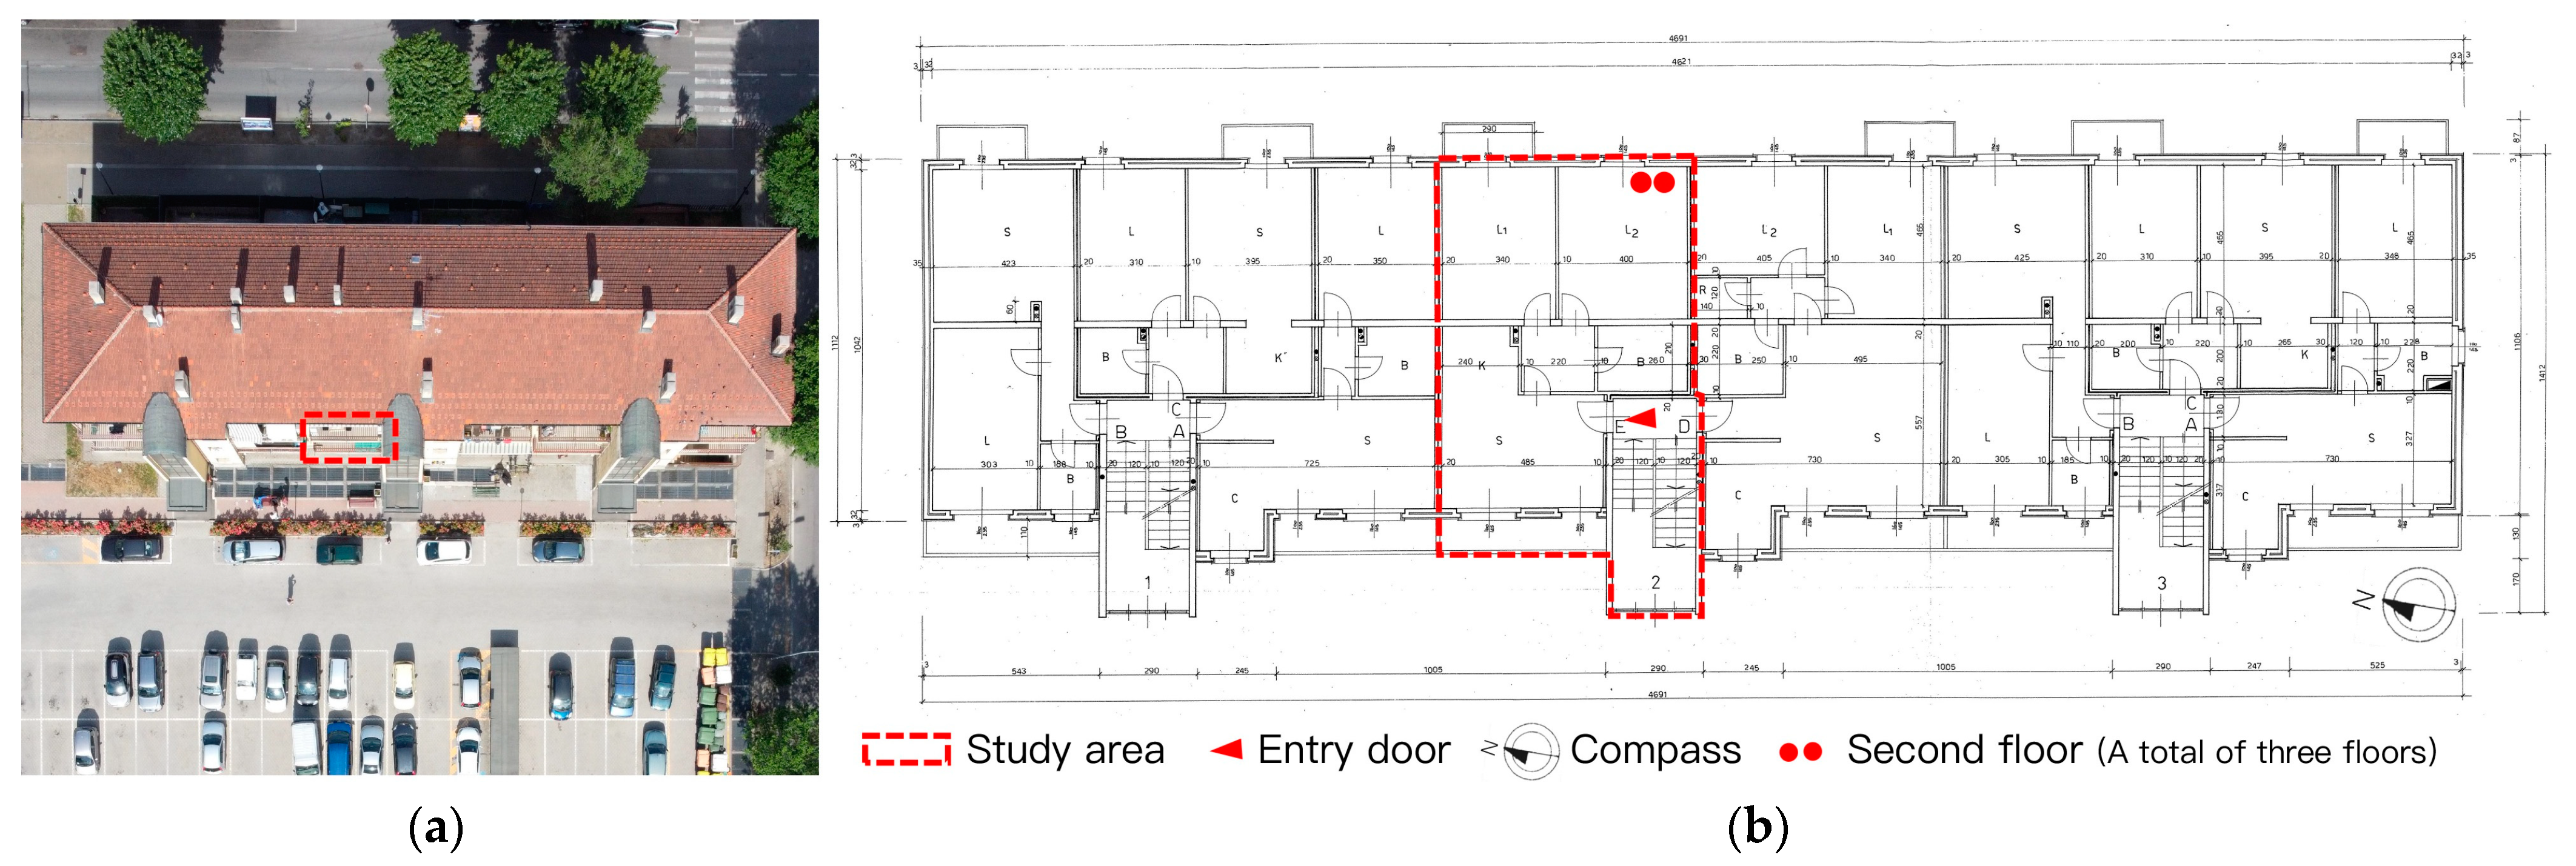
2.1. Aosta Social Housing Stock

The object of study is a social housing dwelling in Aosta. The development of social housing dates back to the late 19th and early 20th centuries when many European countries established public housing programs in response to the need for affordable housing for working-class families, to address the shortage of affordable housing. After World War II, social housing development became an essential part of reconstruction efforts. In the late 20th century, however, the focus shifted to private home ownership, leading to a decline in investment in social housing and a reduction in the total stock of social housing. Over time, the development of social housing in Europe has been affected by the economic and financial crisis, resulting in reduced public spending on housing and increased demand for affordable housing. At the same time, there is growing recognition of the critical role of social housing in addressing housing affordability, promoting social inclusion, and improving the quality of life of low-income households. Today, social housing development is driven by the need to address rising housing costs, income inequality, and the growing demand for affordable housing in urban areas. The focus of social housing has broadened to include a broader range of people, including low-income and marginalized groups such as older adults, people with disabilities, single-parent families, new immigrants, and migrants. Social housing programs play a crucial role in addressing housing affordability, promoting social inclusion, and improving the quality of life for low-income families.
This study discusses a social housing building in which an older adult lives. The Aosta case study focuses on one building to explore the possibility of sustainable renovation at the scale of the Cogne Neighborhood, Italy. The case study is the “Gazzera Buildings,” highlighted in Figure 2. The neighborhood was born in the early 1900s as an “ultramodern” area of the city, housing the workers of the steel company Cogne Acciai Speciali. After over a century, the neighborhood has gradually deteriorated and lost its original connotation, openness, representativeness, and vitality. It cannot meet ever-changing social needs and sustainable development goals. The Cogne block is inserted in Alpine urban climatic conditions. The block has an urban morphology typical to blocks of the same epoch in different urban contexts. Therefore, the social housing renovation case study in Aosta has broader significance and applicability than the local context. The Gazzera in-line houses constitutes the expansion towards the West during the post-war reconstruction period, on the model of a multi-story building with balcony access to workers’ homes in parallel lines with a north-south orientation.
Since the Aosta social housing community in this research belongs to the large-scale construction in the same period, the house types are similar. Moreover, the number of floors of the building is three or four floors, the floor height is low, and the considerable distance between buildings will not cause shading problems. Currently, there are many elderly residents living in the community. Therefore, in this building, the physical environment measurements were performed in an apartment on the second floor (Figure 3). The balcony of this apartment has sun curtains for shading. The apartment was chosen for its dual street frontage, a distribution typical to several blocks’ flats. Currently, an 82-year-older woman lives in this household. Her daughter makes brief visits to take care of the older woman. This study takes the feedback from the residents as the basis for optimizing and renovating the room environment. This study’s methodology and optimization strategies apply to the social housing of other family types in the study area and other areas.

2.2. Climate Conditions in Aosta

In the simulation and onsite measurement, open weather data and measurement data from local weather stations were used to interpret the local environment of Aosta. The impacts of several retrofit strategies have been simulated with Ecotect, Phoenics, and Revit. The Weather Tool 2011 software has been used to assess Aosta’s meteorological conditions. Weather Tool is a sub-software in Autodesk Analysis Ecotect 2011 software. It is widely used in building ecological environment simulation and analysis, improving energy efficiency, and assisting sustainable design. The Weather Tool reads and transforms a range of commonly used Weather data formats, including TMY (Typical Meteorological Year), TMY2, and DAT (Data), in a graphical visual representation. It contains hourly meteorological parameters commonly used in most performance-based building simulations. The TMY weather data format defined in the ISO 15927-4:2005 procedure in building simulations is widely used [37]. When using Ecotect 2011, Phoenics 2019 v1.0 software to simulate the physical environment of the building, historical weather data based on 20 years of collection from 2001 to 2021 are used. The data site is at Aosta.AP, ITA. The corresponding latitude and longitude are 7.3506 and 45.7347. The altitude is 552.0 m. The average annual temperature is 7.1 °C. The annual hottest temperature (99%) is 28.9 °C. The coldest annual temperature (1%) is −13.2 °C. The yearly cumulative horizontal solar radiation is 1492.11 kWh/m2 (https://clima.cbe.berkeley.edu/, accessed on 1 June 2023).

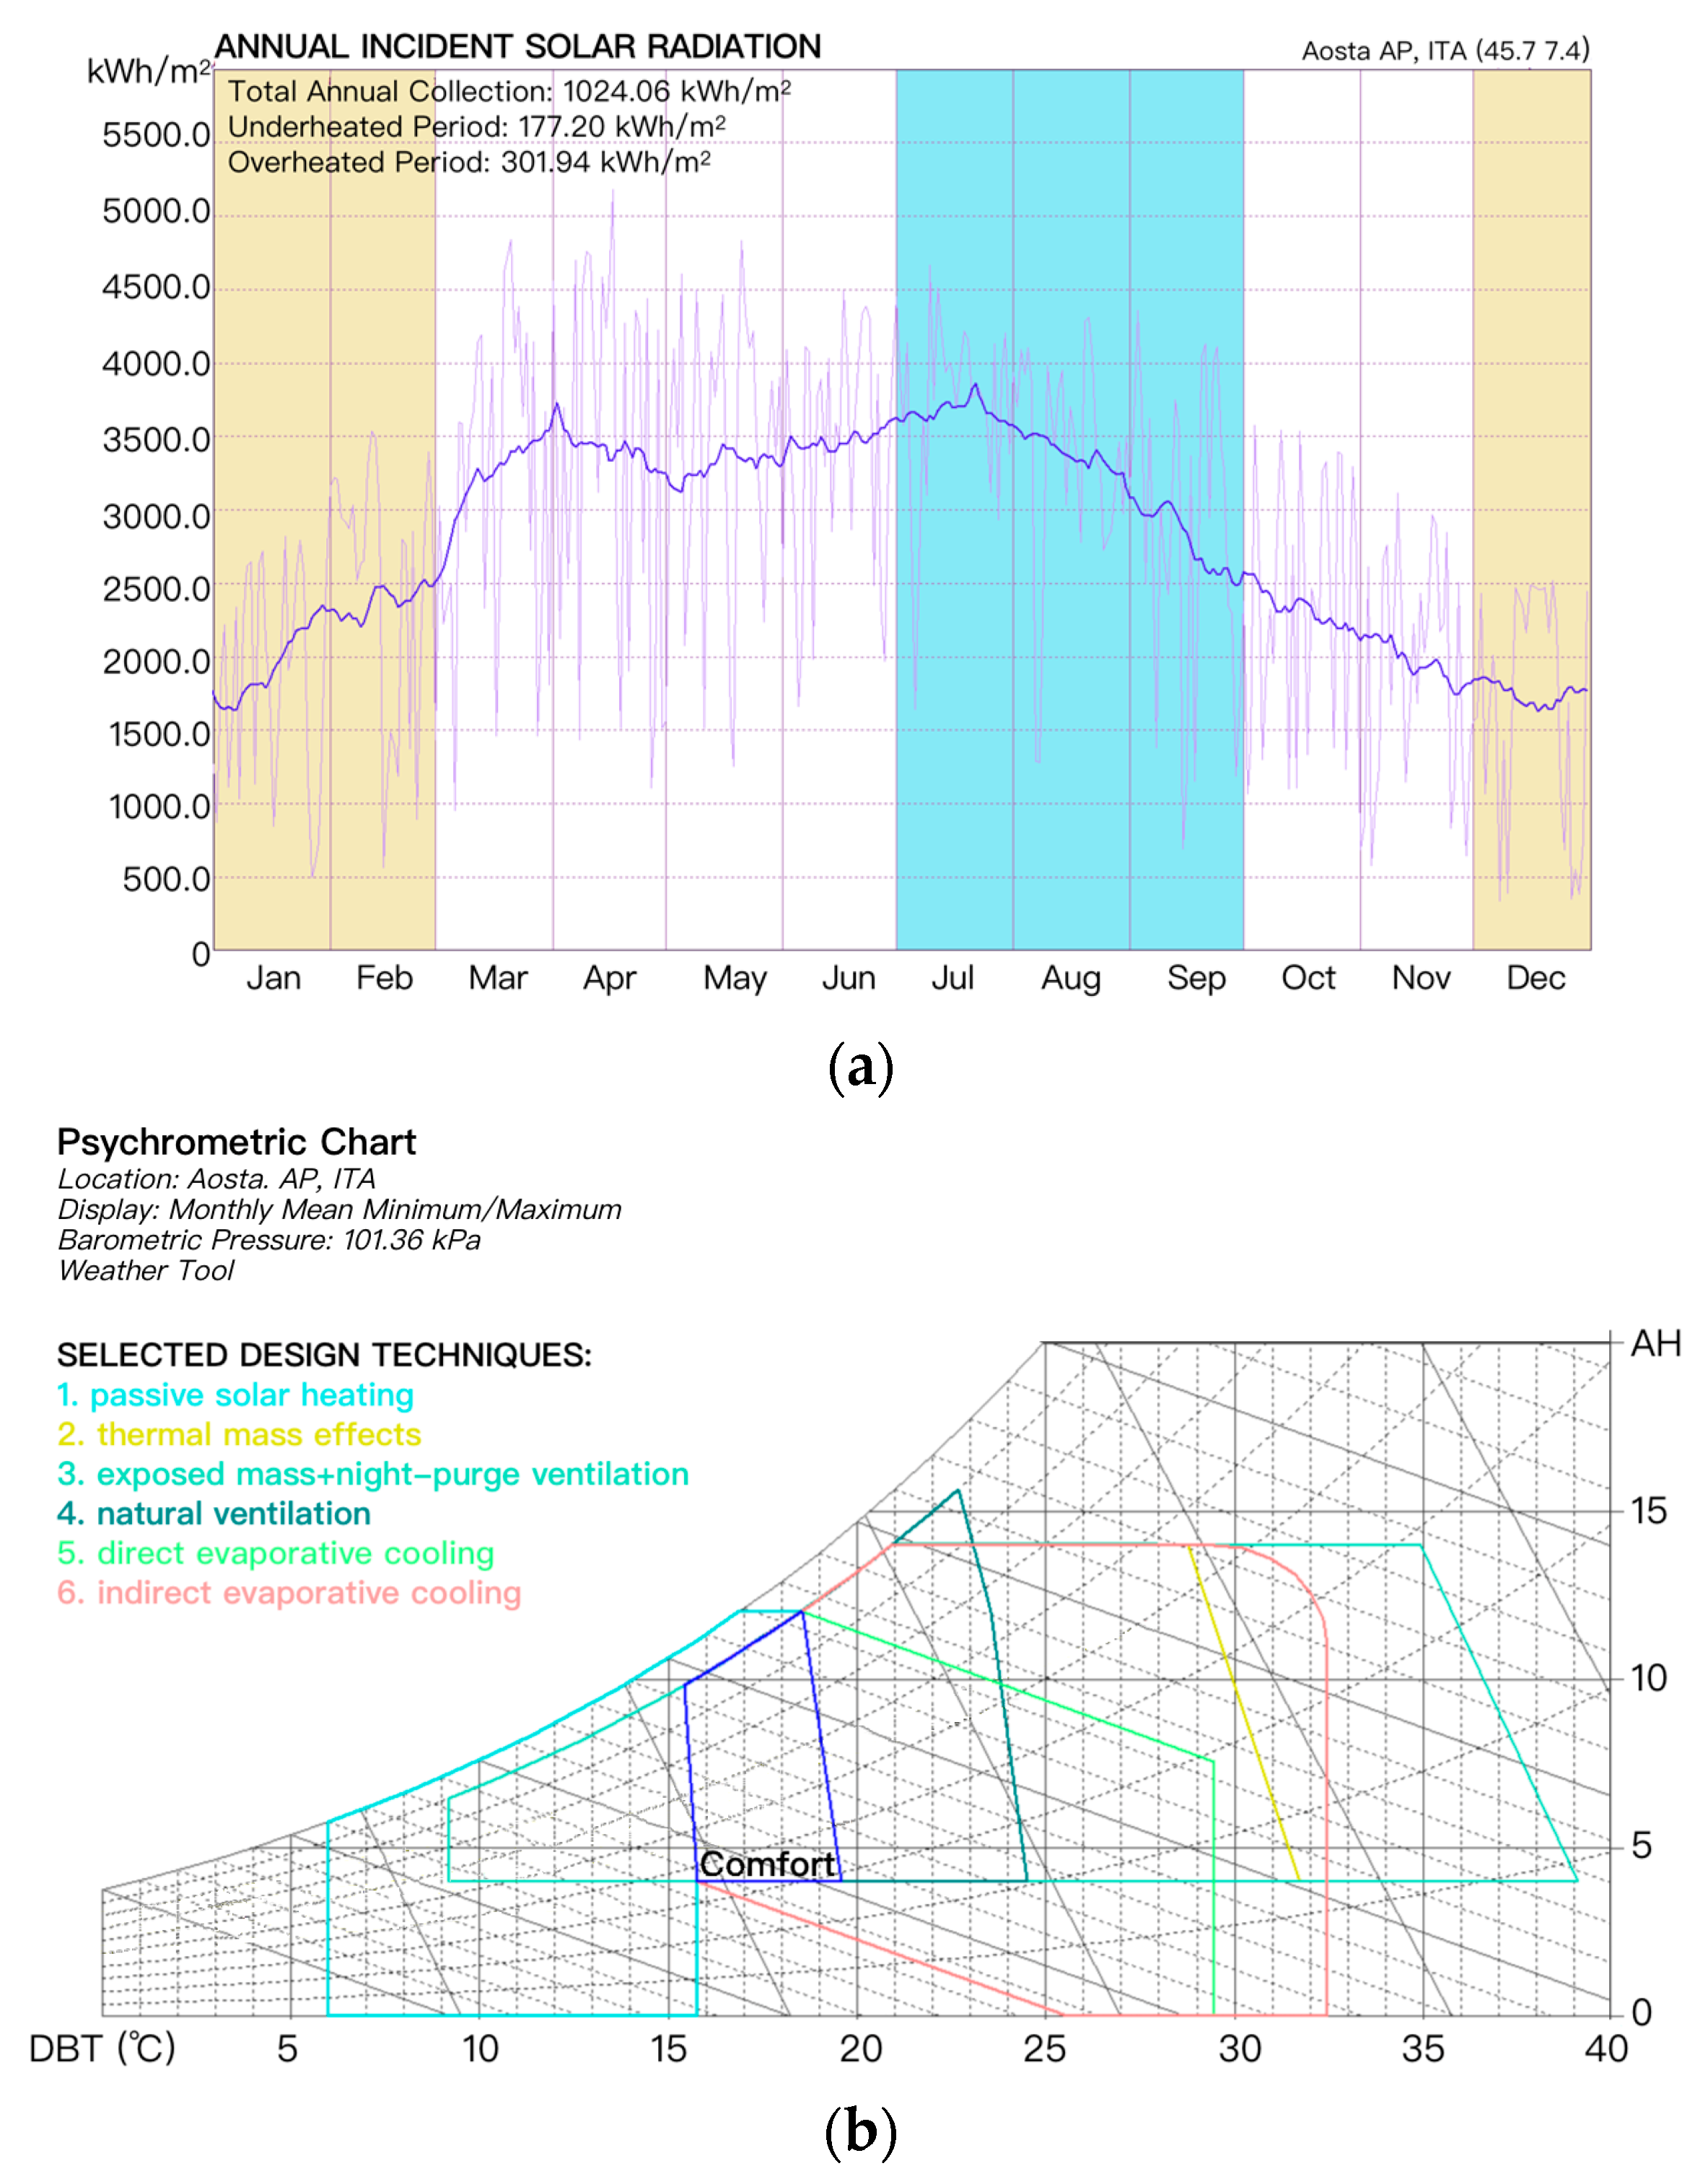
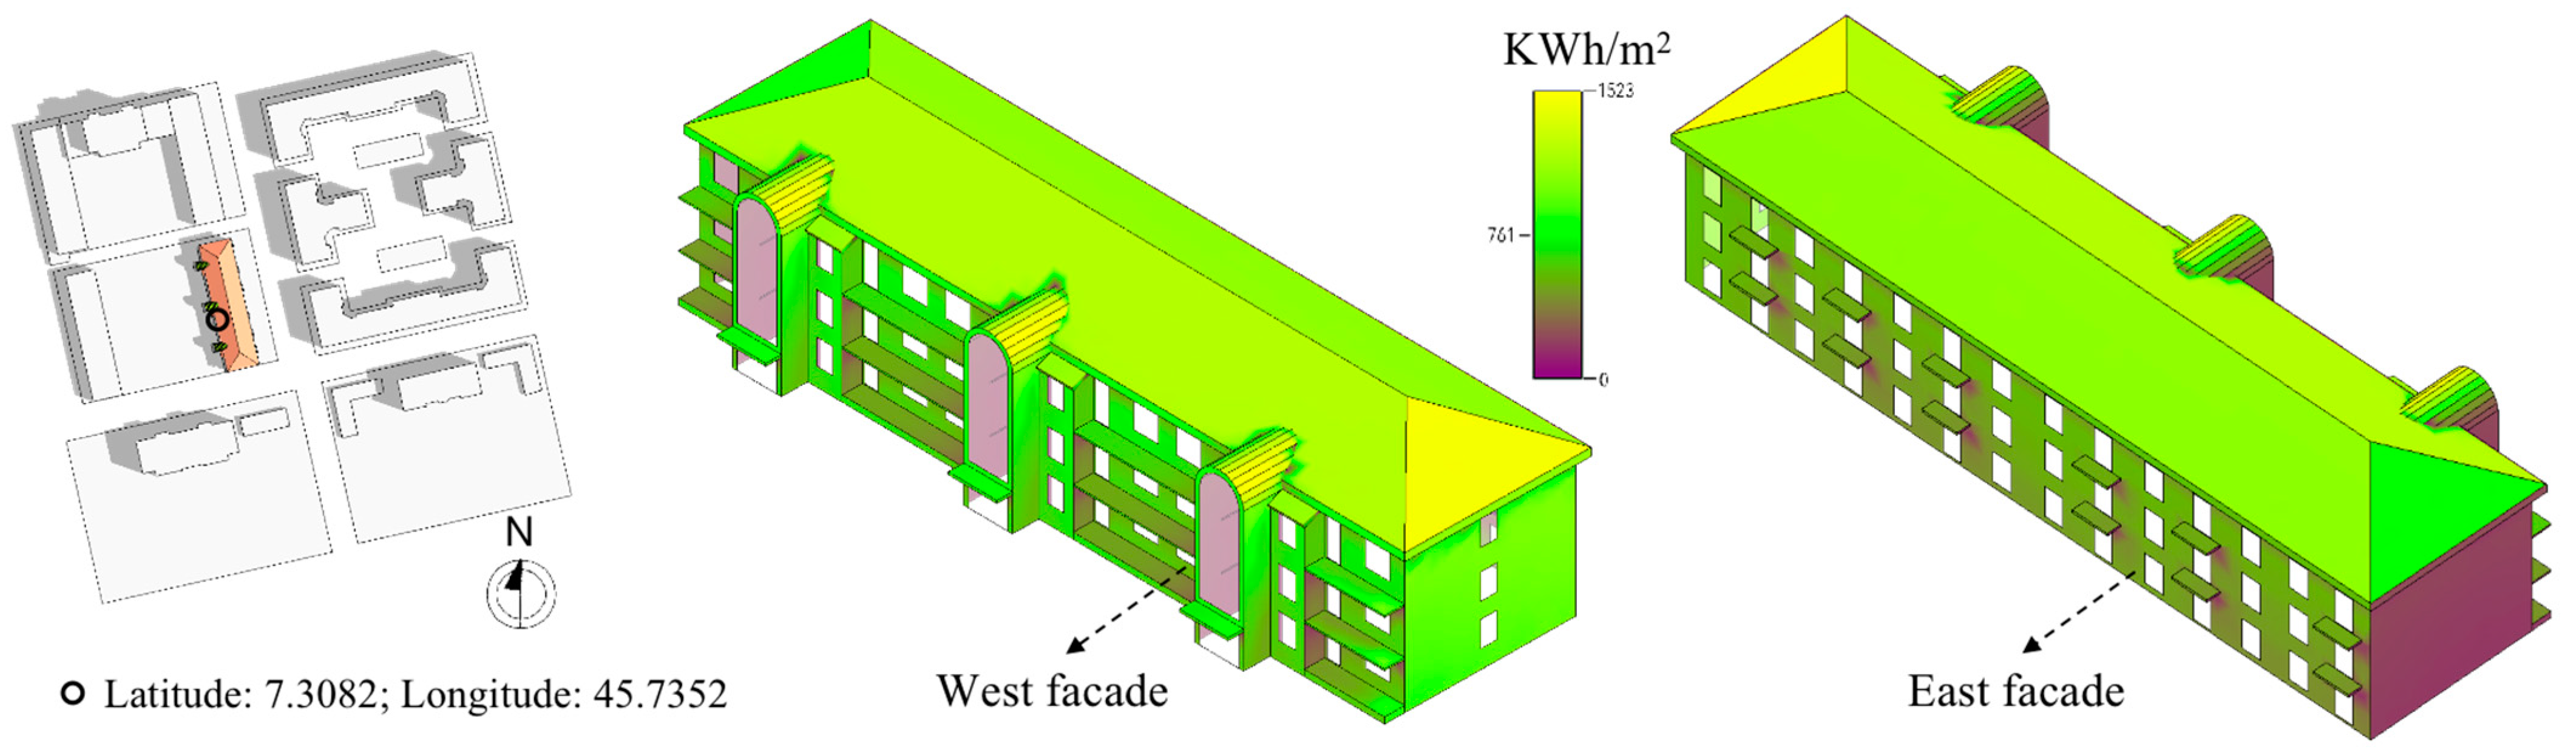
2.2.1. Solar Radiation Analysis

Solar radiation refers to analyzing and comparing annual Solar Radiation on all the building facades. Figure 4a shows that the three hottest months in the blue zone are from July to September in Aosta. The three coldest months in the yellow area are from December to February. The thick purple line represents the 30-day running average, while the thinner, darker purple line shows the recorded total daily solar radiation. We can see that the solar heat gains more heat from March to August. During this period, the full utilization of solar energy can be considered. It is worth noting that scholars evaluate the economic and environmental performance of solar energy investments at the provincial and regional levels, considering Italy’s unique geographical environment. The research results show that all indicators of V. d’Aosta are basically at the lowest value in Italy. For example, its insolation is 10% lower than the average for the entire region of Italy [13]. However, it is worth noting that the energy crisis continued to simmer, the high temperature was superimposed, and the energy cost in the eurozone experienced an unprecedented surge. According to Eurostat’s “Development of electricity prices for household consumers, 2008–2022 [38]”, it can be seen that electricity prices in Europe have soared unprecedentedly in the past two years, which is not a minor disaster for low-income households. The renovation of social housing needs to fully consider the housing affordability of disadvantaged groups and improve the quality of life of low-income families. Currently, renewable energy is already the second-largest source of electricity in the world. According to International Energy Agency (IEA) research, generating electricity from distributed solar photovoltaic systems is already lower than retail electricity prices in most countries. China has driven down solar photovoltaic manufacturing costs. The continuous development of solar thermal technology plays an essential role in optimizing the built environment. Therefore, this study suggests that the Aosta region should fully use the solar thermal system when the future economy is good. The distributed solar modules installed on the house’s roof can meet the owner’s electricity demand and save electricity costs. They can also block the sun’s rays, form a heat insulation layer with the roof, lower the room temperature, and protect the environment while reducing energy consumption.

2.2.2. Psychrometric Chart

The psychrometric chart of the weather tool is suitable for residential buildings with fewer internal thermal sources, so it has been considered convenient for studying the apartment in Aosta. The weather tool provides the analysis function of a psychrometric chart, which can analyze various active and passive design strategies in the psychrometric chart based on meteorological data. Among them, passive systems are closely related to architectural design. Proper use of passive strategies by architects can reduce the impact of buildings on the surrounding environment and the cost of heating, air conditioning, and operating fees. Active methods can also be divided into high-energy low-efficiency and low-energy high-efficiency. Energy can be saved by analyzing the operational strategy on the psychrometric chart. The area shown on the psychrometric chart suits active cooling techniques, including mechanical ventilation, evaporative cooling, et al. The psychrometric chart determines the relationship between temperature, moisture content, and thermal environment. It can be used in the climate design process to intuitively analyze and determine the cold, hot, dry, and wet conditions of the indoor and outdoor climate of the building, as well as the deviation from the comfort zone. The blue line encloses the thermal comfort zone in the figure. Figure 4b shows the selection of six design strategies (passive solar heating, thermal mass effects, exposed mass + night-purge ventilation, natural ventilation, direct evaporative cooling, and indirect evaporative cooling) to achieve different degrees of comfort zone improvement. Figure 5 shows the comfort percentage for the selected six different design strategies. The analysis of passive design techniques is based on simple psychrometrics. Graphical results show the ratio of hourly data points that fall within the base and extended comfort zones due to the effects of each technique. Using the ‘thermal mass effect’ and ‘Exposed mass + Night-purge ventilation’ strategies can obtain better benefits in summer.

2.3. Physical Environment

Thermal comfort is the condition of mind that expresses satisfaction with the thermal environment and is assessed by subjective evaluation [39]. The subjective assessment of satisfaction with the indoor physical environment of social housing can reflect the comfort of the overall environment. Helping to decarbonize the building stock by reducing energy consumption is one way to improve housing conditions for the low-income family. The enhancement of living comfort and decarbonization goals in social housing renovation is directly related to improving indoor physical environment quality (IPEQ). The indoor physical environment includes thermal comfort, lighting, acoustic, and indoor air quality. The IPEQ is also affected by the outdoor environment and the characteristics of the building structure.

2.3.1. Outdoor Environment

According to the Köppen climate classification, Aosta is located in the rain shadow of the Mont Blanc massif. It has a humid subtropical climate (Cfa), bordering on a cool semi-arid climate (BSk) and also bordering on an oceanic climate (Cfb). Aosta has a low average annual rainfall, cool to very cold winters throughout the year, hot summers, and a relatively dry climate. In the Trewartha climate classification, it is considered a temperate maritime climate (Do). The Gazzera building is a strip-shaped house with its long side pointing 12.7° north by west. The ‘world-weather. info’ website provides Aosta’s weather history data. The analysis of the climate characteristics in this area of Aosta shows that the intensity of direct sunlight is higher in June. The judgment that there is a ‘High risk of harm from unprotected sun exposure for people with sensitive skin types’ occurs after six months of exposure. Even in July, August, and September, direct sunlight can cause damage to people with sensitive skin. At the same time, there will be a phenomenon that ‘Meteosensitive people are likely to experience weather-related symptoms.’ Figure 6 records the onsite measurement time of this study, from 30 May to 6 June 2022, corresponding to the outdoor temperature and humidity. It can be seen from the figure that during the onsite measurement period, the outdoor temperature and humidity show periodic changes. The time when the air temperature is higher than 25 °C is rare. It fluctuates around 20 °C. The relative humidity is mostly higher than 50%.

2.3.2. Thermal Quality

The thermal environment includes relative humidity (RH), indoor airflow velocity (Va), earth thermometer temperature (Tg), predicted mean votes (PMV), and many other elements [40]. Extreme temperatures can increase the risk of heat stroke or hypothermia, especially in older adults with difficulty regulating their body temperature. The study found that the thermal sensation of older adults is generally 0.5 scale units lower than the Young’s. Thermal sensation voting is recorded using the American Society of Heating, Refrigerating, and Air-Conditioning Engineers (ASHRAE) thermal sensation seven-point scale, namely −3 cold, −2 cool, −1 slightly cool, 0 neutral, +1 slightly warm, +2 warm, +3 hot [41,42,43]. Therefore, the residential building environment should be comfortable, with heating and cooling systems that can be easily adjusted [44,45]. The thermal comfort zone is a psychological and physiological condition that expresses a person’s perception of the temperature, humidity, and wind environment of the surrounding indoor and outdoor environments [46,47]. However, this range will vary based on personal factors such as health, clothing, and activity level. The thermal comfort range of an indoor environment can be quoted in the standards of the WHO, ASHRAE, the International Organization for Standardization (ISO), and the European Committee for Standardization (CEN). In 1987, WHO’s indoor temperature guidelines recommended that indoor temperatures used by older adults be maintained at 20–21 °C [48]. ASHRAE 55-2020, “Thermal Environmental Conditions for Human Occupation,” recommends a temperature range of 20–24 °C as a guideline for general comfort. The energy performance of buildings (EN) 16798-2019 is discussed in the temperature range of 16–25 °C. Some related studies have shown that in the absence of physical activity, the indoor temperature should be below and close to 25 °C but kept above 20 °C [49]. Other scholars have also demonstrated that controlling the indoor temperature within the range of 22–26 °C during the heating period positively affects the health and comfort of the occupants, especially older adults [50]. Temperature and humidity are critical indicators of the comfort of a room. The humidity limit is 12 g/kg in ASHRAE 55-2013, 40–70% in the chartered institution of building services engineers (CIBSE) Guide A: environmental design, and I: 30–50%, II: 25–60%, III: 20–70%, and <12 g/kg in EN 15251 (European Committee for Standardization) [51].

2.3.3. Lighting Quality

Poor lighting increases the risk of falls and makes it difficult for older adults to navigate their surroundings. Adequate lighting can help older adults with visual impairment or age-related vision changes [52,53]. Older adults require higher lighting levels, especially short-wavelength light, to experience visual and circadian effects compared with non-older adults [54]. In documents from organizations such as the WHO, the Illuminating Engineering Society of North America (IES), and the International Commission on Illumination (CIE), the recommended indoor lighting level for older adults is at least 50 lux. For instance, according to ANSI/IES RP-28-16 “Lighting and the visual environment for seniors and the low vision population”, recommended lighting levels for older adults, the natural lighting in functional areas such as the living room and bedroom should be at least 200 lux, and the artificial lighting should be at least 750 lux. Functional areas such as bathrooms and toilets require at least 200 lux. Functional areas such as activity rooms and meeting rooms shall have at least 300 lux of natural lighting and at least 750 lux of artificial lighting [55]. A study by a Japanese company showed that the overall comfort level of people’s rooms varied between 50 and 250 lux, with older people having more light needs than younger people [56,57]. CIE “Light and lighting—Recommend practice for the design of senior living communities” provides guidelines for lighting design and visual performance. China’s “Standard for lighting design of building, GB50034-2013” stipulates the standard lighting values for different functional areas in buildings where older adults live (Case A), which is much higher than the lighting requirements for available rooms where older adults do not live (Case B).
At the height of 0.75 m, in the bedroom of Case A, the general activity area should meet the standard illuminance value of at least 150 lux, and the bedside and reading areas should complete the mixed lighting of at least 300 lux. In Case B, the general activity area requires at least 100 lux, while the bedside and reading areas involve 300 lux. In the living room of Case A, general activities should meet the mixed illuminance standard of at least 200 lux and at least 500 lux (for writing and reading). In Case B, the general activity area is at least 75 lux, while the bedside and reading areas require at least 500 lux. China’s “Standard for the daylighting design of buildings, GB50033-2013”, standards stipulate that the natural lighting intensity of bedrooms and living rooms in residential buildings should be at least 300 lux.

2.3.4. Acoustic Quality

According to the National Institute for Occupational Safety and Health (NIOSH), prolonged exposure to higher noise levels can harm health by increasing stress, sleep disturbances, hearing loss, and disrupting concentration. It may cause problems such as high blood pressure and migraines. Older adults have a higher sound tolerance but are also more sensitive. Excessive and unnecessary noise can damage the health of older adults and hinder their recovery from hearing loss. Organizations such as the WHO and the American Speech-Hearing Association (ASHA) have researched the effects of noise on hearing and human health, considering factors such as age, health status, and duration of exposure. The recommended maximum indoor volume for older adults is about 55 dB (A), and the recommended top sound level for public places is about 50 dB (A). According to the requirements of WELL, LEED, and the series of acoustic standards, the noise level of bedrooms in residential buildings should be less than 35 dB (A) [58]. According to the Chinese national standard “GB3096-2008” and “Building Design Standards for Elderly Facilities JGJ450-2018”, when the occupants are older adults, good sound insulation and noise reduction devices should be used indoors. In the indoor living environment, the noise in the room should not be greater than 40 dB (A) during the daytime and not greater than 30 dB (A) at night. The lounge is not greater than 40 dB (A) day and night. The air sound insulation of the partition wall of the living room and the restroom shall not be less than 50 dB (A) [59]. Of course, maintaining a quiet and calm acoustic environment minimizes stress and increases comfort for older adults.

2.3.5. Indoor Air Quality

Poor air quality can exacerbate occupant respiratory illnesses and adversely affect occupant health. The cleaner the indoor air, the less chance occupants have of fighting off viruses and infections. The European Environment Agency (EEA) states that air pollution is Europe’s top environmental health risk. Indoor air quality standards for older adults recommended in the literature published by organizations such as WHO and ISO include controlling indoor pollutants, maintaining adequate ventilation, and avoiding exposure to harmful substances. For example, the WHO “Guidelines for Indoor Air Quality: Selected Pollutants” provides indoor air quality and pollution control guidelines. In the 1980s, the scholar Sandberg first proposed the concept of air age [60]. Air age refers to the time from air particles entering the room to reaching a certain point, reflecting the freshness of indoor air. It can comprehensively measure the indoor ventilation effect of residential buildings and is an essential indicator for evaluating indoor air quality. Generally speaking, the smaller the air age, the fresher and the better the air quality. Many scholars have concluded that indoor ventilation is better when the air age is less than 300 s.
Volatile organic compounds (VOCs) are organic compounds that have a high vapor pressure at room temperature [61]. Most VOCs are not acutely toxic but may have long-term chronic effects on human health and the environment. The European Union defines a VOC as “‘volatile organic compound’ means any organic compound as well as the fraction of creosote, having at 293.15 K a vapor pressure of 0.01 kPa or more, or having a corresponding volatility under the particular conditions of use;” [62]. Some VOCs can react with ozone to produce new substances that can cause sensory irritation symptoms, including irritation of the eyes, nose, and throat; headache, loss of coordination, nausea; and liver, kidneys, and central nervous system damage [63,64]. Studies have shown that the concentration of VOCs in indoor air can be two to five times higher than in outdoor air, sometimes even higher [65]. It should be noted that the emission of individual VOCs in the indoor environment is not high. Still, the total concentration of all volatile organic compounds (TVOC) indoors may be five times higher than that outdoors, and the performance is more evident in summer [66,67]. In Gases Evaluated for the WELL Building Standard [68], the Limit for Passing Test value of TVOC is <0.5 mg/m3 (According to the calculation of the teesing.com website, 1 mg/m3 is equivalent to a VOC concentration of 0.31 ppm, that is, TVOC is <0.155 ppm, same as below). Japan’s Renesas Electronics Corporation divides indoor air quality into five levels. Set the TVOC value < 0.3 mg/m3 as Level 1: Very Good (clean, hygienic air). TVOC at 0.3 to 1.0 mg/m3 is set as Level 2: Good (good air quality). TVOC at 1.0 to 3.0 mg/m3 is set as Level 3: Medium (noticeable comfort concerns). TVOC at 3.0 to 10.0 mg/m3 is set as Level 4: Poor (significant comfort issues). TVOC > 10.0 mg/m3 is set as Level 5: Bad (unacceptable conditions) [69]. The Indoor Air Quality Management Group of Hong Kong divides the indoor air quality of offices and other public places into Good and Excellent classes. When the 8-Hour Average of TVOC < 0.6 mg/m3 is a Good class, it is an Excellent Class when the 8-Hour Average of TVOC < 0.2 mg/m3 [70].

3. Research Methods

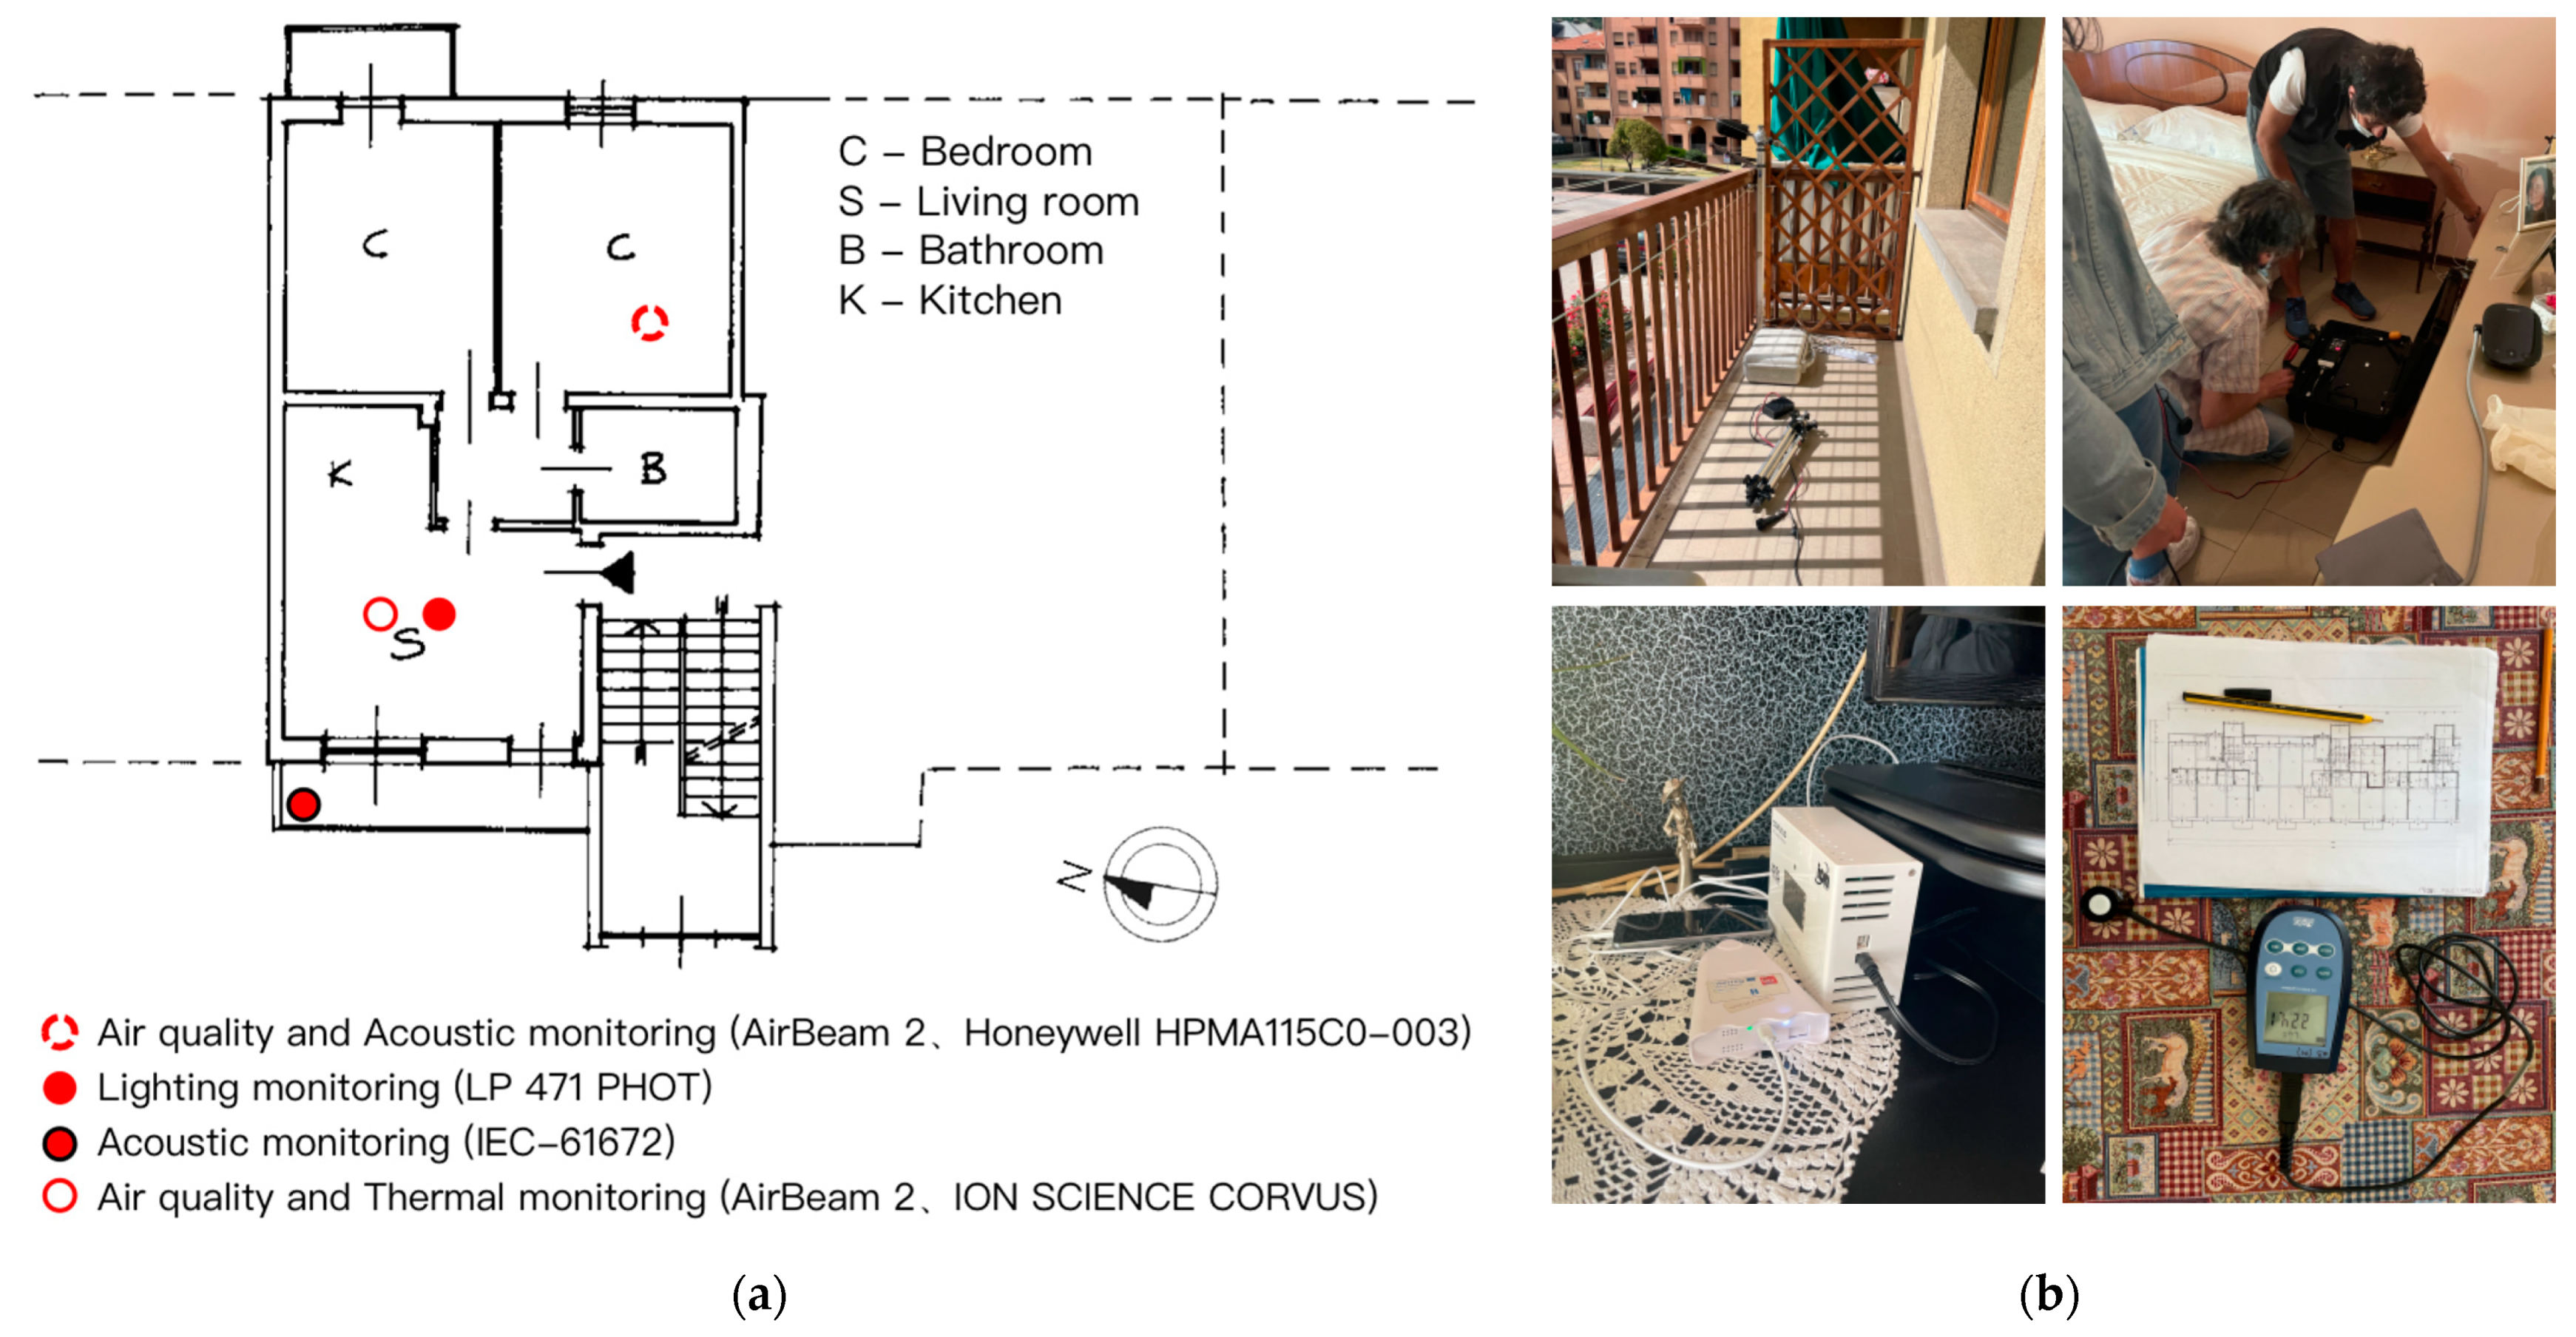
3.1. Onsite Measurement

The research team went to Aosta residential building on 30 May 2022, for onsite measurements. The case-study apartment is visited for interviews with the users and measured by instruments for indoor air quality, acoustic, lighting, and thermal environments. The name of the instrument used and its characteristics, measuring range, and appearance can be seen in Table 1.
Considering the central activity place of the older adult householder, the measurement range selected for this study includes a bedroom, living room, and balcony area. It needs to be emphasized that according to the living habits of the occupants, we set the instrument away from her moving lines and will not affect her daily activities. Meanwhile, occupants spent more time at home during the 3–5 June measurement period than in previous days. For the layout of the instruments, except for the team members checking whether the data were running normally, the rest of the time was arranged in a fixed position in the building without changing. An AirBeam 2 and a multi-sensor Honeywell HPMA115C0-003 were installed in the bedroom to measure the indoor air quality and acoustic environment. An AirBeam 2 and an ION SCIENCECORVUS were established in the living room, and a manually recorded lighting environment instrument LP 471 PHOT, was set up. These instruments were used to measure the indoor air quality of the living room, the lighting environment, and the thermal environment that is more important to the living room (Figure 7). The IEC-61672 series of international standards has strict requirements for measuring the acoustic environment. AirBeam2 is an instrument commonly used by the public, and it needs to be used in conjunction with a mobile phone. The Honeywell HPMA115C0-003 uses light scattering to detect and count particles and is more sensitive for measuring indoor air particles. Specific applications for the ION SCIENCE Corvus IAQ monitor include Indoor Air Quality (Sick Building Syndrome), Process Evaluation, and Emission level monitoring from buildings. An attempt was also made to monitor the indoor natural lighting environment. The LP 471 PHOT instrument was used to measure the indoor lighting environment. It can be judged from the measured value of lighting intensity in poorly lit areas that the indoor lighting intensity is high and meets the requirements of the lighting standard.

3.2. Interviews

Interviews in this study refer to collecting and searching. The research team conducts observation, investigation, questioning, photography, and recording activities to obtain research materials. It is a method of collecting and gathering research information. Interviews include face-to-face communication between the research team and the data subjects. The interview is the process of the research team’s understanding of the physical environment of social housing and the environmental needs of the residents. It is the process of the research team making analyses and judgments through personal observation, listening, and thinking by using personal design viewpoints, knowledge accumulation, and thinking.
Due to the limited access to the residential areas studied, it was impossible to conduct repeated measurements of the built environment. Therefore, our research team has conducted detailed literature surveys and on-site data collection on the site’s environmental conditions and climate characteristics before the measurement. At least three interviews at the beginning, during, and at the end of the field test. Each interview will investigate and record the conditions of older adults and the changing elements of the building’s indoor and outdoor environments. For the main activities to be observed, investigated, photography, and recorded in this study, the research team sets up tables for records. Specifically, they include (1) existing building facade features, including sunshade components and facade materials (by following the facade of the building, it is found that except for the windows in the public staircase, almost all windows facing west have added shades in different ways); (2) the research team members make preliminary judgments and records on the sound insulation effect, lighting and lighting conditions, and thermal sensation of the building’s indoor environment; and (3) the research team conducts a preliminary analysis of the necessity and demand for transforming the physical environment in the building interior. For the main activities of interviewing, photography, and recording in this study, the research team set 15 questions and answers to learn about older adults through Italian dialogues. Specifically, they include (1) investigation and recording of the physical condition of the elderly participants, including their clothing during the actual measurement period, the time and location of indoor activities, and the fundamental development of the body’s perception of heat and cold; (2) the feedback information of the elderly participants on the existing indoor physical environment; and (3) the needs of older adults for the reconstructed physical environment of the building. The research team used the data collected from the interviews in the analysis and judgment of the renovation design to strengthen the reliability of the renovation of the building’s indoor environment.

3.3. Software Simulation

The multidisciplinary nature of renovation design requires us to model the building environment from/with several disciplines. Voinov and Shugart (2013) advance two alternative approaches in modeling multifaceted systems: integral modeling and integrated modeling. In integral modeling, data and information from various sources and fields are represented in a single formalism. In integrated modeling, multi-scale and multi-discipline data-information-methodologies cooperate with different modeling approaches and tools by means of exchange towards integration: “Integrated modeling is the method that is developing to bring together diverse types information, theories and data originating from scientific areas that are different not just because they study different objects and systems, but because they are doing that in very different ways, using different languages, assumptions, scales, and techniques.” [71]. The integration is dynamic in time to match the project’s specific requirements. This research using the software simulation method combined with the on-site investigation method, the lighting, acoustics, thermal environment, and air quality were analyzed in general. Revit 2023 software has been used to simulate solar energy on building exterior surfaces. Ecotect 2011 software simulated the indoor average solar radiation and natural lighting conditions during the measurement period. In addition, the Phoenics 2019 software simulated the indoor PMV. Fitriaty P. used the BIM Revit solar analysis tool to analyze the photovoltaic (PV) installation potential and power generation evaluation of residential building envelopes in equatorial regions through three-dimension (3D) sunlight color rendering. The Revit climate data were compared with local climate data using correlation tests to confirm the reliability of the simulations [72,73]. Lin Q.H. validates this by comparing the solar analysis on a selected surface from the environment plugin with the same analysis carried out with Solar Insight [74]. Vangimalla P.R. verified the accuracy of Autodesk Ecotect thermal and solar simulations. First, the building’s heat load and illuminance levels are measured on-site. The on-site measurements were then compared to the simulated heat load and illuminance levels obtained by Ecotect (TM) [75]. Fiocchi C. verified the Ecotect model accuracy by examining the actual light and shadow projections falling inside or outside any surface at any time of the year (hourly) with corresponding detail based on properly imported weather files and geolocation [76]. Lu M. used Radiance and Autodesk Ecotect Analysis software to evaluate daylight and sunshine availability in high-density residential areas in Northeast China. The sunshine hours at the study location on the facade of the residential building are calculated by the “Sunshine Analysis” function in Ecotect 2011 Analysis software [77]. Assimakopoulos V.D. investigated indoor thermal environment under different living conditions. The comparison of the calculation results of Phoenics software with a large number of experimental measurement results shows that the performance of the numerical model is satisfactory [78]. Stathopoulou O.I. simulated the indoor space of the building in the Phoenics environment and verified the model results based on the experimental data of temperature and other aspects collected in 10 days of actual measurement [79]. All these works show Revit, Phoenics, and Ecotect’s capability to simulate building indoor and outdoor solar radiation conditions, lighting environment conditions, and thermal environment conditions, and there is good consistency between simulation results and local measurements.
Revit 2023 software with the Insight Solar Analysis plug-in has been used to simulate solar energy on building exterior surfaces. The date selection is from 1 January to 31 December 2022, the time is set from 4:00 a.m. to 8:00 p.m. and the time interval is set to 1 h. A year-round cumulative insolation simulation was performed. This study selects 100% of the chosen surface area for analysis. We set a return limit of 50 years. The analysis grid determines the ‘fine’ specification, and the 0.46 m grid has 11,000 analysis points. Furthermore, other parameters are the default values of the system. Ecotect 2011 was used to simulate the apartment. The Aosta historical weather data from 2001 to 2021 were used. The simulated days are the measured dates (30 May to 6 June 2022). The measured time is 4 a.m.–8 p.m. These few days are in the transition season. Although not the hottest period of the whole summer, it is the beginning of the summer. Studying the characteristics of the building’s physical environment at the end of the transition season is significant for building renovation work. Ecotect 2011 software is used to analyze the solar access and lighting environment analysis before and after the building renovation. Regarding insulation analysis, incident solar radiation is calculated, and average daily values are obtained. Regarding lighting environment analysis, the designed sky illuminance is set to 5000 lux according to the calculation result of the model latitude, and the sky brightness distribution model is selected as CIE Overcast Sky. The calculation type is Nature Lighting Levels-Daylight Factors & Levels, choosing the mode of Clean Window. Phoenics 2019 software was used to quantify the thermal level. For natural ventilation indoor environments, PMV is generally used for assessing users’ thermal comfort [80]. The Phoenics 2019 software simulates the PMV results, and the Comfort Index needs to be set. The meteorological parameters of Phoenics 2019 are set to summer. According to the local meteorological data during the measurement period, the wind direction is set to N-N-E (22.5° east to north), and the wind speed is set to 4.53 m/s. Modeling is carried out in the software according to the actual size of the building. The calculation method of the software uses the FLAIR module and the finite volume method to simulate the calculation domain. The turbulence calculation model adopts the standard k-ε turbulence model suitable for near-earth wind simulation and finally generates a grid and starts calculation until the result converges. Moreover, other parameters are the default values of the system. Considering that the on-site measurement time is the beginning of June, and the clothing insulation is set to 1.0 Clo according to the clothes of the elderly residents (that is, the daily clothing of residents in the ISO 9920 standard includes underwear, shirts, trousers, jackets, socks, and shoes [81]). According to the requirements of ISO 7730 and ISO 8996 standards, The Metabolic Rate—is measured in ‘met’ (metabolic units). Considering that older adults often have a lower activity level than the young, this study set the Metabolic Rate of older adults to 1.0 met—seated, relaxed [82,83].

3.4. Methods Evaluation

The data survey can achieve different levels of detail according to the period and time interval of the observations and the data collected. A widely accepted differentiation is defined by Reddy [84], who sets five possible levels of survey (Table 2). The bill data are available at the scale of buildings and unreliable at the scale of apartments. The measurements fitted Level 4 since they spanned a whole week long (30 May to 6 June 2022).
A leading difference between plain software integration and integrated modeling is how data are managed [85]. “For almost all so-called process-based models, they actually describe processes only at a certain level of abstraction and become empirical beyond that. This is probably why most of the process-based environmental models still need to be recalibrated when applied to new areas and study cases. The more different the environmental conditions—the more recalibration needed.” [71]. As more components are combined, the calibration of the whole model becomes more difficult. The integrated model comprises three relatively independent software: Revit 2023, Ecotect 2011, and Phoenics 2019. Each software can operate independently and has been developed by different developer teams. It should be emphasized that according to Voinov and Shugart, integrated modeling for delivering scenario analyses to explore design alternatives and their outcomes can require the researchers to modify parameters and adapt functions. That raises issues on the calibration to evaluate if the simulated scenario is relative to the calibrated base run. The models in this study mainly involve solar radiation, temperature, and humidity. Therefore, for the single model calibration method, the reliability of the software used in this study is proved by many previous studies. However, since the integrated model selected in this study is relatively complex, accurate integrated model calibration is difficult, and more data and research support are still needed in the future to improve the model calibration further.

4. Results

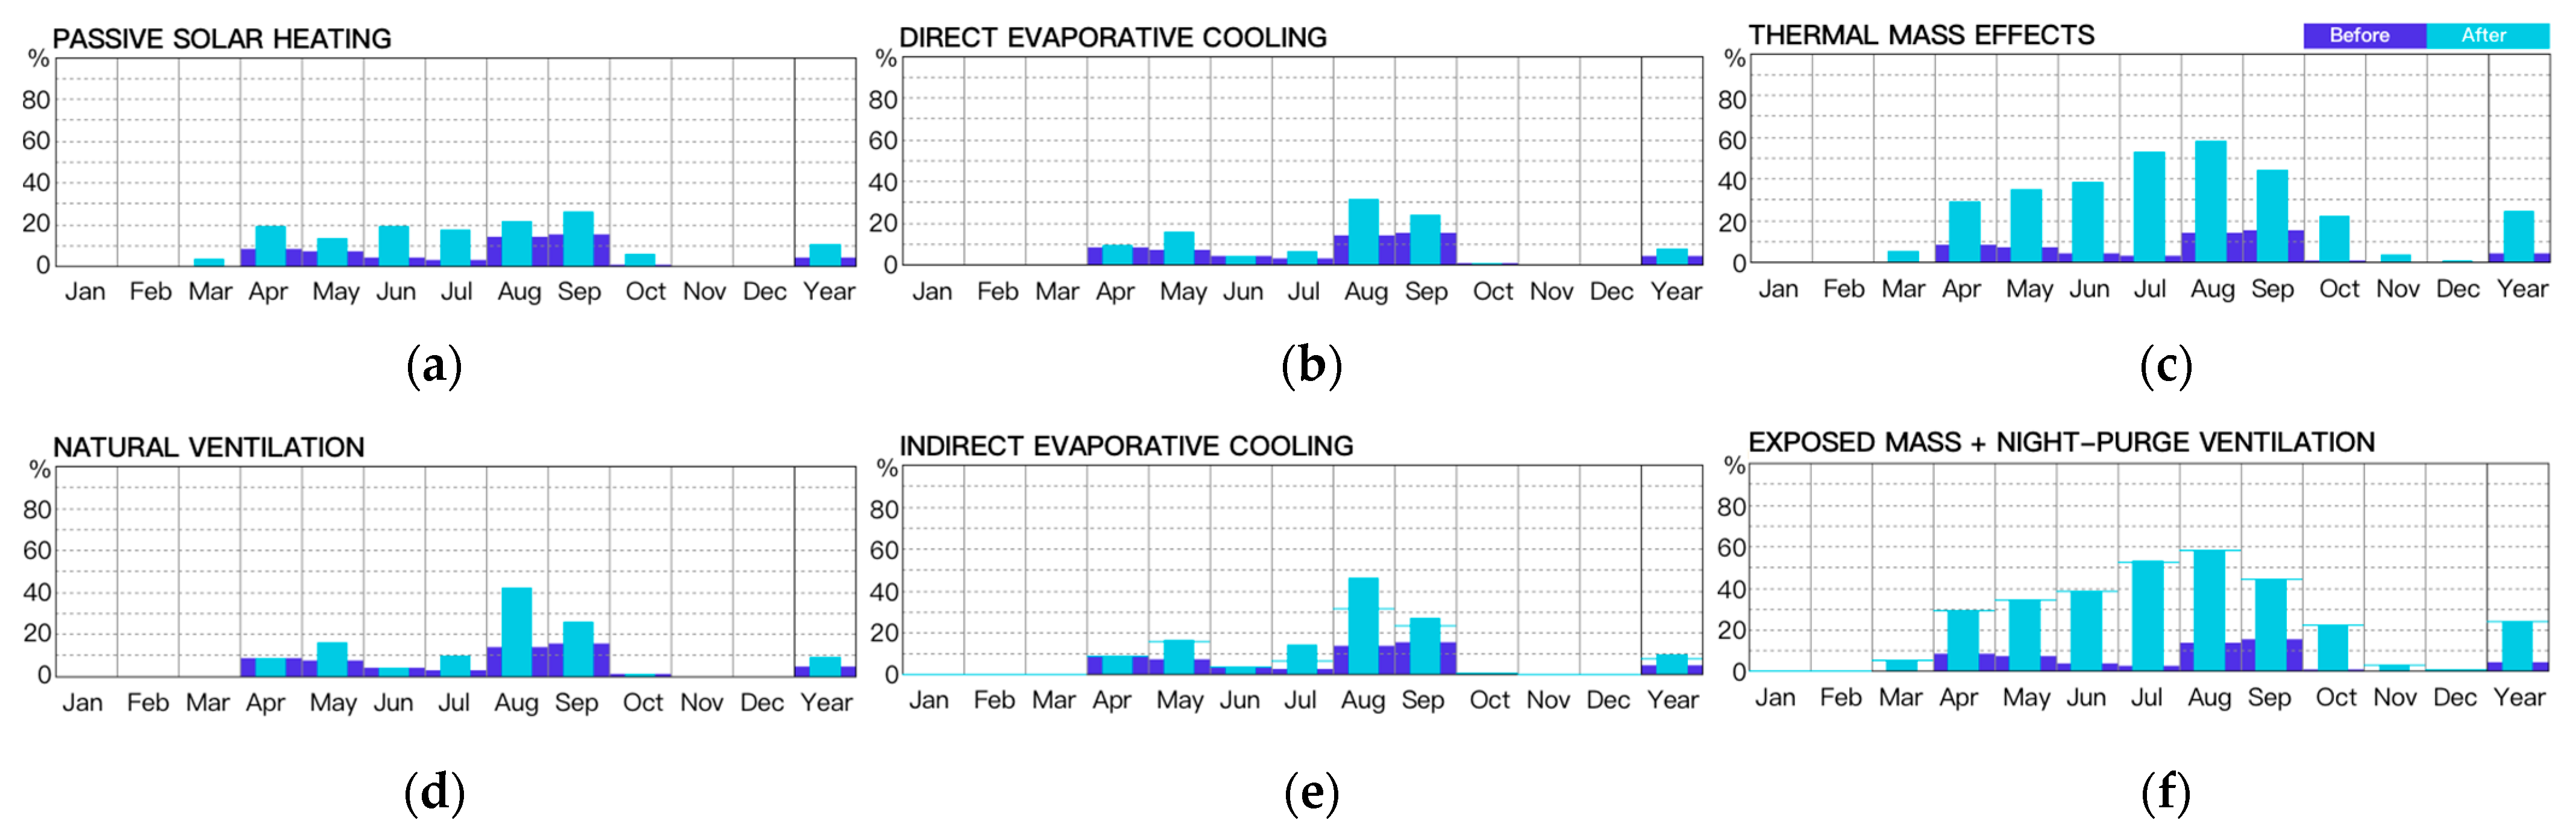
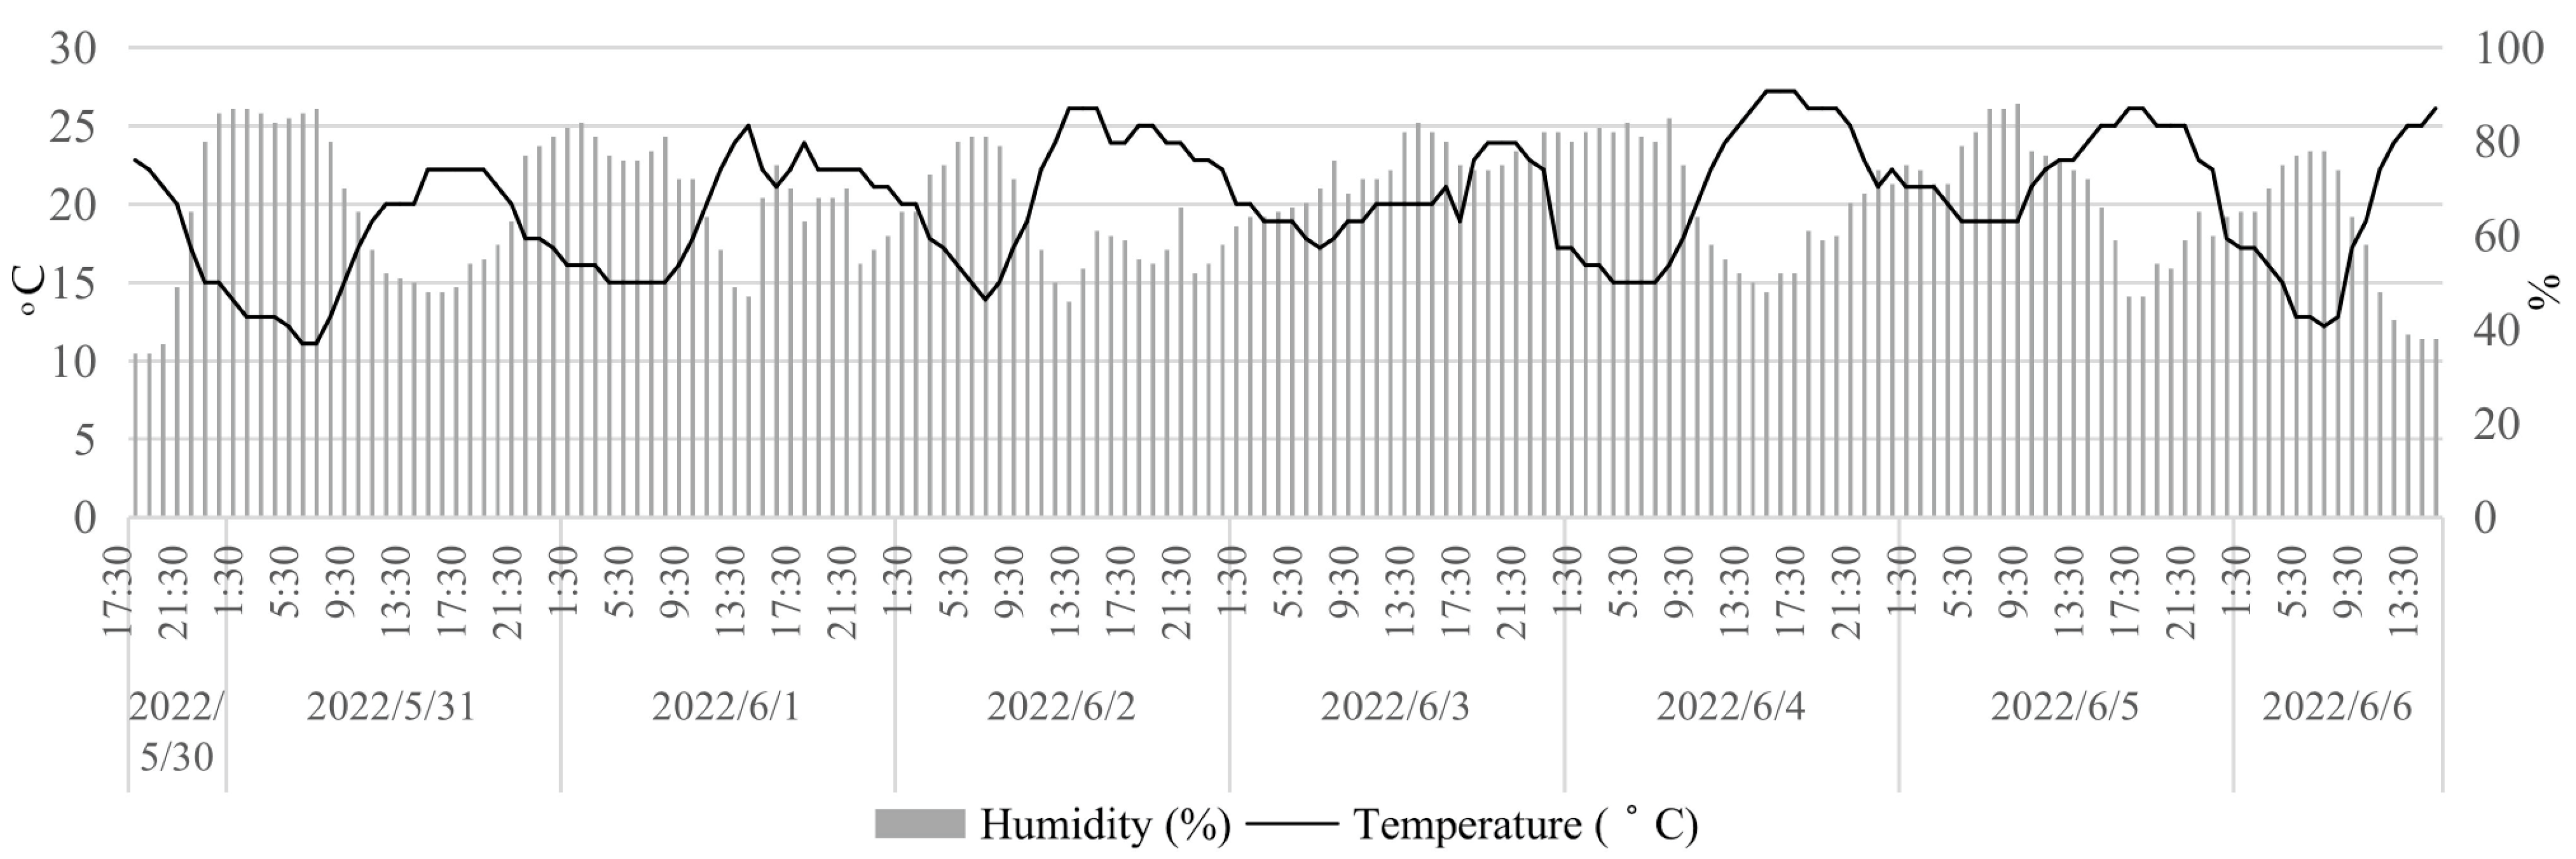
4.1. Climate Analyses

The period for the study in this article is the 2022 transition period in the Aosta region from 30 May to 6 June. This period is when the outdoor ambient temperature of Aosta begins to warm up and transitions to the subsequent hot summer climate. During the onsite measurement period at the end of May and the beginning of June, there was no obvious sign of the hottest indoors due to the influence of the outdoor rainy weather. At noon on 30 May, when installing the equipment, we learned from the feedback from the experimenters that the direct sunlight made the indoor temperature feel high and uncomfortable. Global warming trends predict at least hotter summers than in the past two centuries. In Aosta’s weather history in 2022, the outdoor temperature peaked at 35 °C in Aosta on 19 July. Therefore, after entering summer, especially on sunny days, the indoor environment in the afternoon can be presumed to be in a state of thermal discomfort (after 21 June at the beginning of summer). Retrofit design must address indoor overheating. When we assessed the thermal environment of the west facade, there were apparent problems with the west sun and glare. If the sunshade device is combined with the design of the enclosure structure, the problem of indoor overheating can be solved. Although some residents of the building have installed sunshade curtains on their balconies, the design of the exterior facade still needs to be further explored in consideration of safety and cost performance. The glare effect is not only apparent in summer but also in winter. The glaring problem affects indoor lighting conditions year-round and can lead to overheating indoors. Replacing the window glass material can optimize this problem to ensure lighting transmittance. It is worth considering removing existing windows and installing new ones with certified quality window frames and multiple glazing, such as UNI 11673.

4.2. Environmental Measurement Results

The onsite measurement started on 30 May 2022, and ended on 6 June 2022. A total of 8 days of data were obtained and mainly tested the acoustic environment, thermal environment, lighting environment, and indoor air quality. The following is the interpretation and analysis of the data.

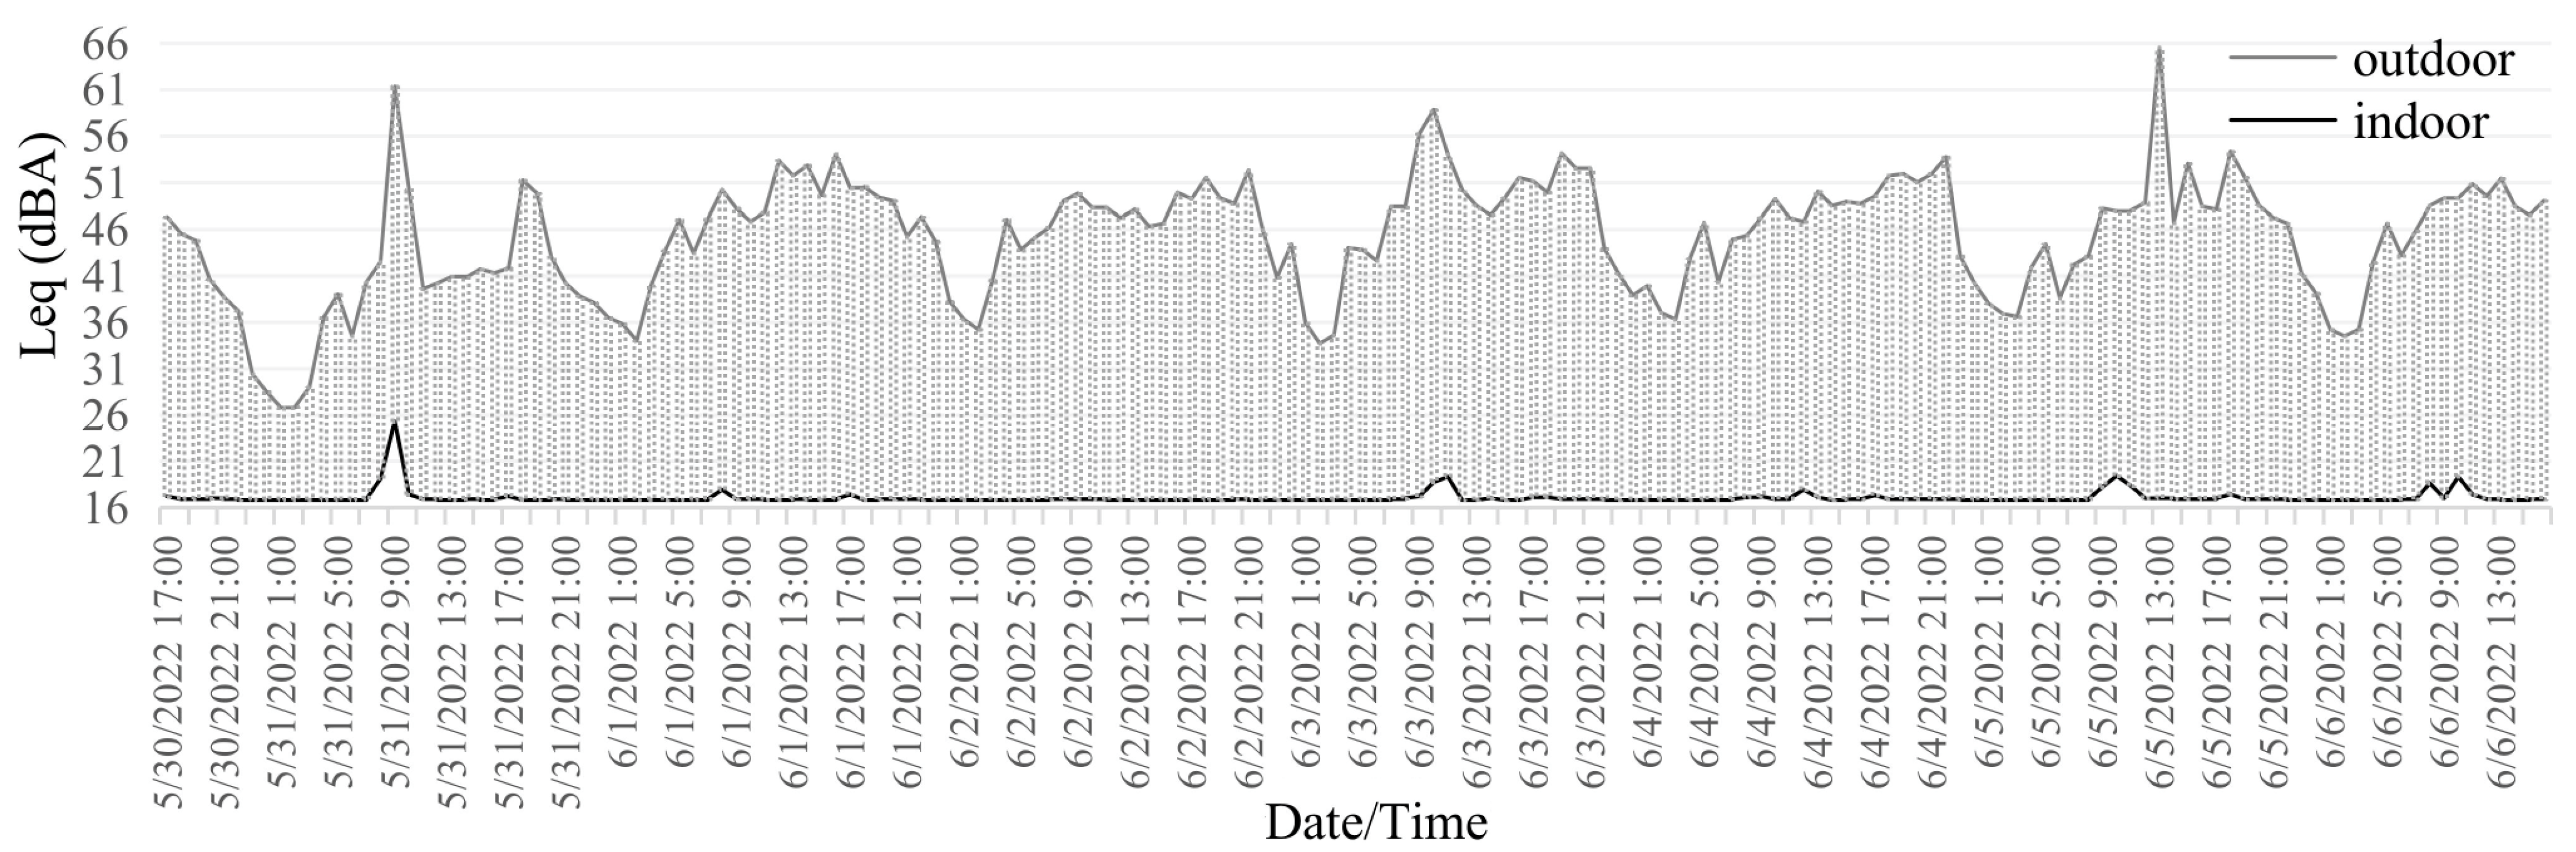
4.2.1. Acoustic Environment Results

Figure 8 shows the outdoor and indoor acoustic environment data. The overall acoustic environment of this social housing community is good. The sounds outside show a regular fluctuating pattern as the day and night change. There may be peaks at times due to outdoor parking noise. The indoor noise is hardly more significant than 20 dB (A), which proves the sound insulation effect of doors and windows to a certain extent, and at the same time, reflects the low activity intensity of the older adult neighbors. Sporadic peaks show a high correlation with outdoor conditions. Compared with the acoustic environment standard, it is found that the acoustic environment here is satisfactory, the negative impact on the older adults is negligible, and no primary intervention is required.

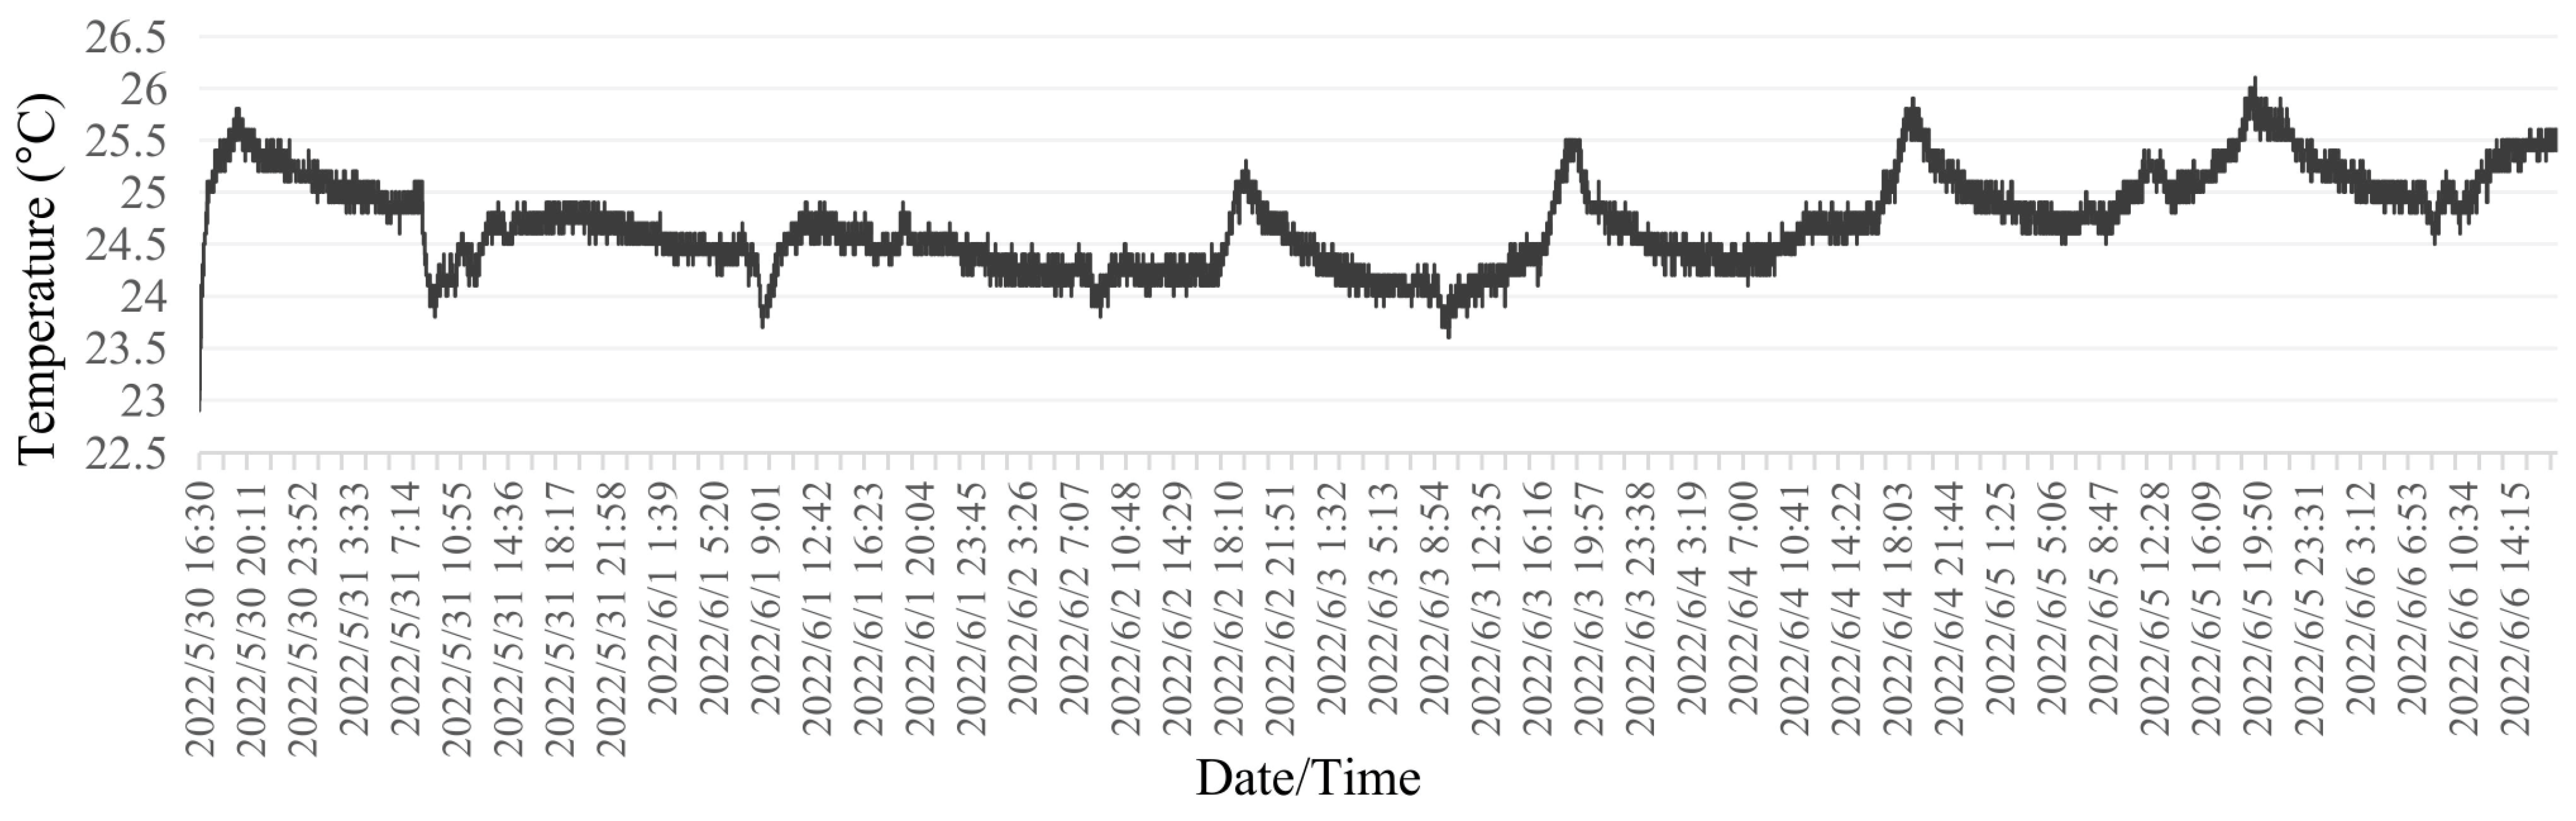
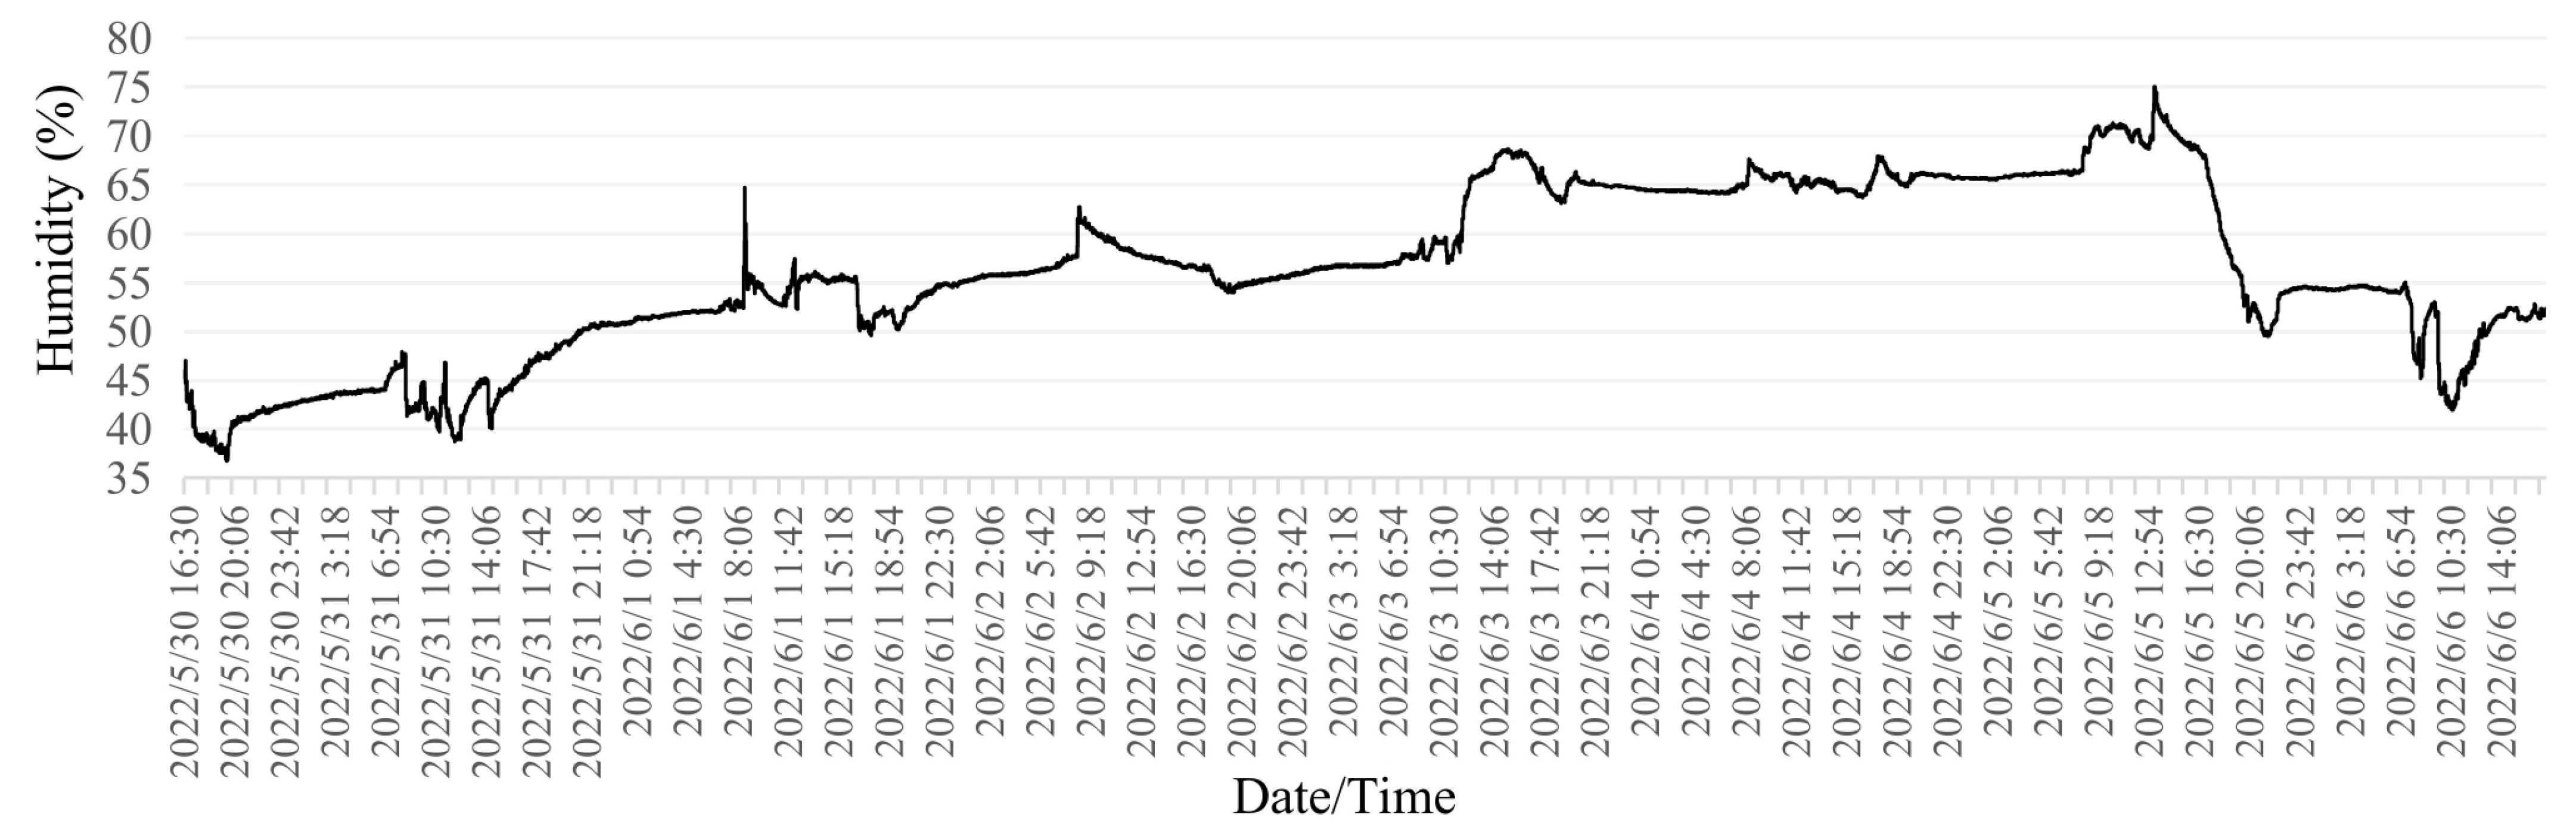
4.2.2. Thermal Environment Results

Figure 9 shows the temperature data for the living room area over this period. According to the statistical data during the actual measurement period, the outdoor weather in Aosta was cloudy from the end of May to the beginning of June, and the temperature did not exceed 25 °C most of the time. The survey data show that the indoor temperature fluctuates between 23.5 °C and 25 °C. It can be seen that this temperature range complies with ASHRAE 55-2020 and EN 16798-2019 on the thermal comfort temperature range of people. However, the measured indoor temperature is higher than the indoor temperature recommended by WHO. It is still necessary to reduce the indoor temperature to meet the indoor temperature needs of older adults. Figure 10 shows the humidity data in the living room area during measurement. It can be seen from the figure that indoor humidity fluctuates between 40% and 70% most of the time, meeting the humidity range requirements in CIBSE Guide A and EN 15251. It can also be seen from the figure that from the afternoon of 30 May to the noon of 5 June, the relative humidity increased from 37.5% to 72.4% and then began to drop. According to the historical records of Aosta weather data, the change of humidity is affected by the showery weather of the day. Moreover, the detection position in the living room is close to the window, and the humidity changes obviously.

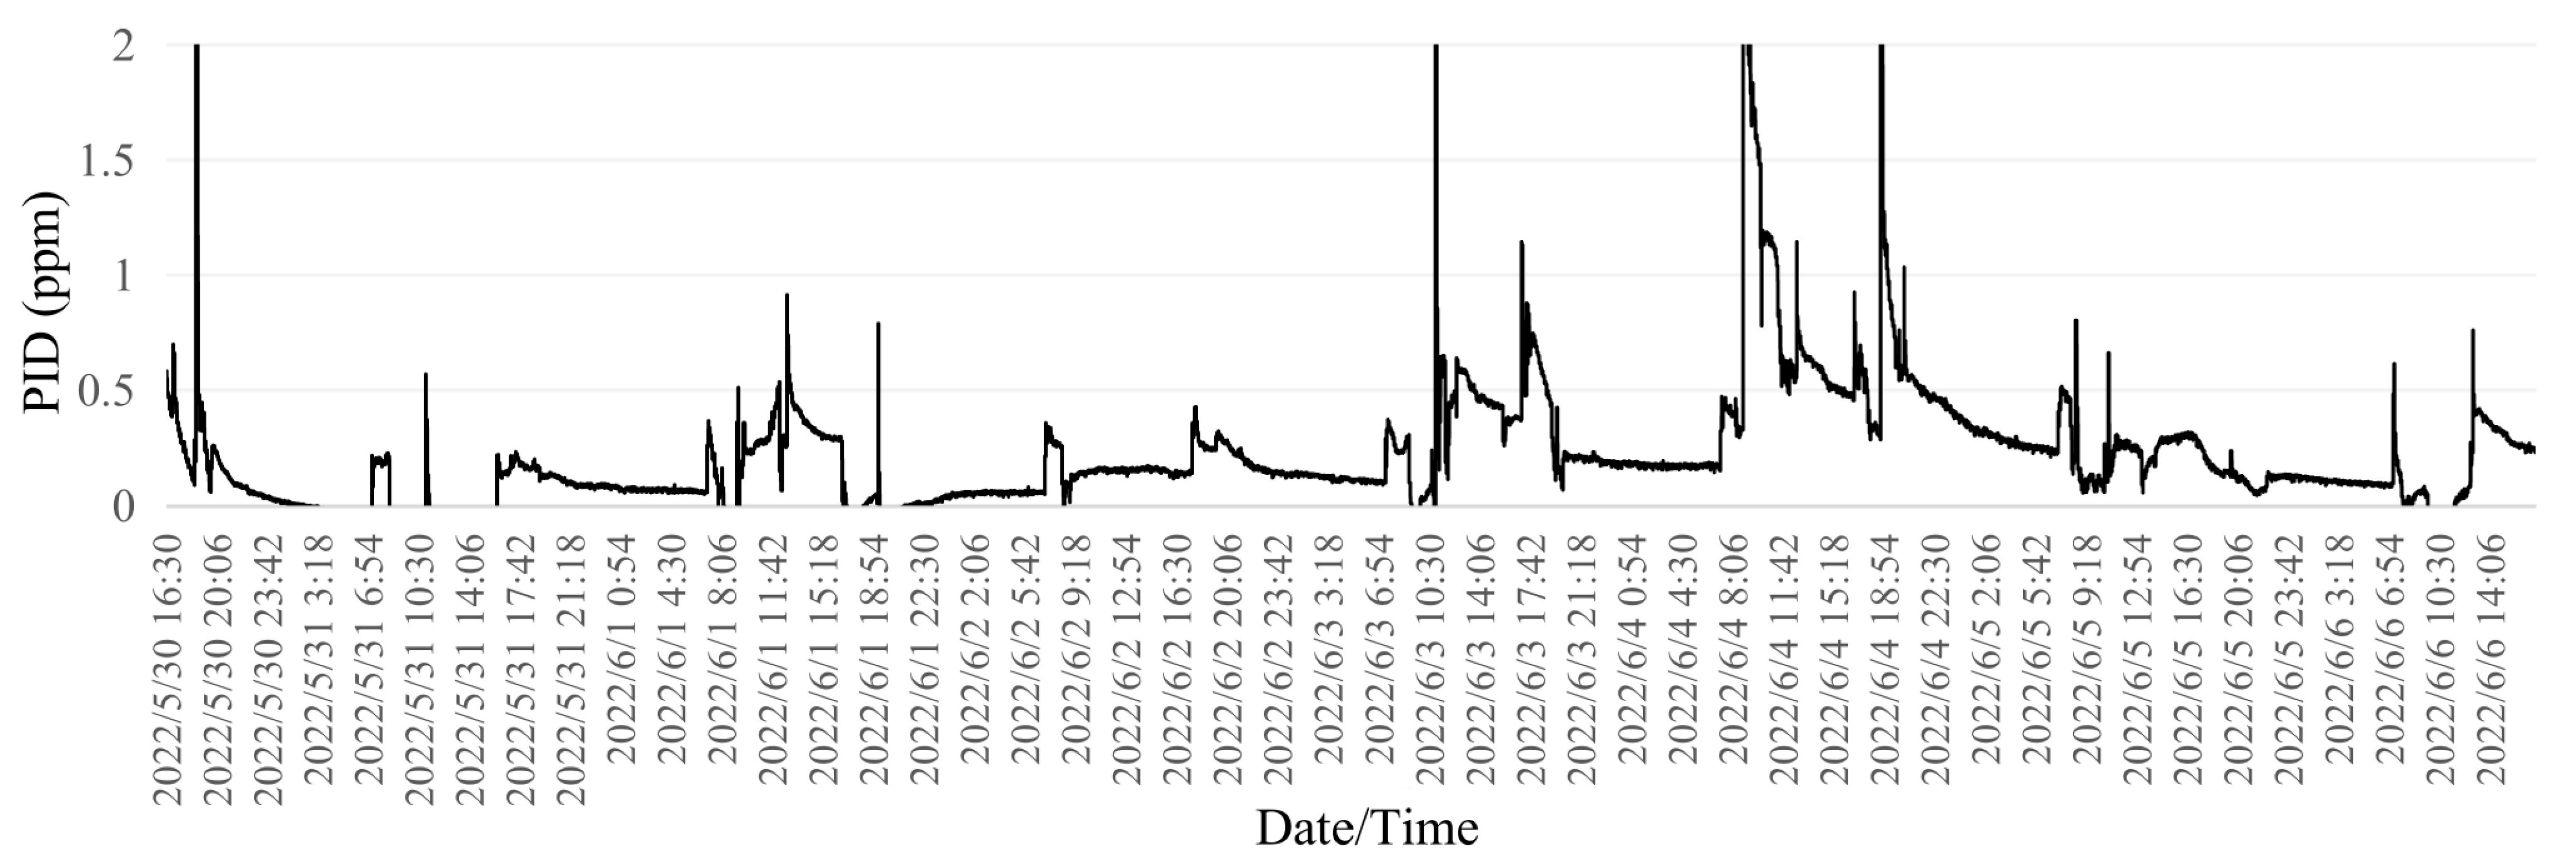
4.2.3. Indoor Air Quality Results

Figure 11 shows the TVOC data of the living room during the field measurement. It can be seen from the figure that the time when the indoor TVOC content is between 0 to 0.15 ppm accounts for about 35% of the entire measurement time, which meets the WELL building standard for indoor environmental quality assessment limits and meets the Japanese Renesas Electronics Corporation’s Level 1, indoor air quality performance is very good. TVOC content between 0.15 to 0.3 ppm accounts for about 40%, reaching Level 2 of Renesas Electronics, and the indoor air quality is good. TVOC content between 0.3 to 1.0 ppm accounts for about 25%. After excluding several abnormal data, it can be seen that it meets Level 3 of Renesas Electronics, and the indoor air quality performance is medium, with noticeable comfort concerns. Overall, most of the time, the indoor TVOC concentration reached a relatively good target, and in a few cases, the TVOC concentration reached a level below the middle class. The period with higher TVOC concentration is due to the impact of more frequent activities of the occupants, and the living room is used as a dining room. The living room is connected to the kitchen space, easily affected by the kitchen fumes. In addition, it can be seen from the figure that TVOC has different concentration levels on different dates. The concentrations in the last four days were higher than in the first. Moreover, it can be found that 24 h a day, the concentration from noon to night is more significant than in other periods. The reasons are mainly the activities of older adults and the use of household appliances. Generally speaking, the indoor TVOC content only sometimes meets the target requirements for indoor air quality. Indoor air quality needs to be improved by increasing the number of indoor air changes and ventilation.

4.3. Software Simulation Analysis

4.3.1. The Current Status

In the frame of integrated modeling, the analysis of the results from Revit 2023 software is being considered. Figure 12 shows that the cumulative solar radiation of the building’s exterior area of 2634 m2 reaches 1,333,742 kWh throughout the year, which is 506 kWh/m2. Gazzera’s west facade receives much more cumulative insolation than the east facade. Exposing the house to the intense afternoon sun can cause many problems: accelerated aging of furniture and wood, affecting the performance of air conditioners, increasing electricity consumption, etc. At the same time, it threatens the health of older adults with weak resistance. Therefore, the building urgently needs the sun exposure problem to be solved.
The thermal environment improvement strategies that significantly affect the building’s comfort are discussed in depth to observe the possibility of implementing the building renovation scheme. The Walsers, who dwell in the Alpine region, built country buildings (hay lofts, barns, mills, wells, and granaries). This rural building was designed with Walser Haylofts’ intelligence to deal with the high heat from direct sunlight. Therefore, this study incorporates this design structure into the building renovation design. The feasibility of the renovation strategy was determined through a comparative study (Figure 13). The simulation analysis below will further discuss and verify this transformation strategy.

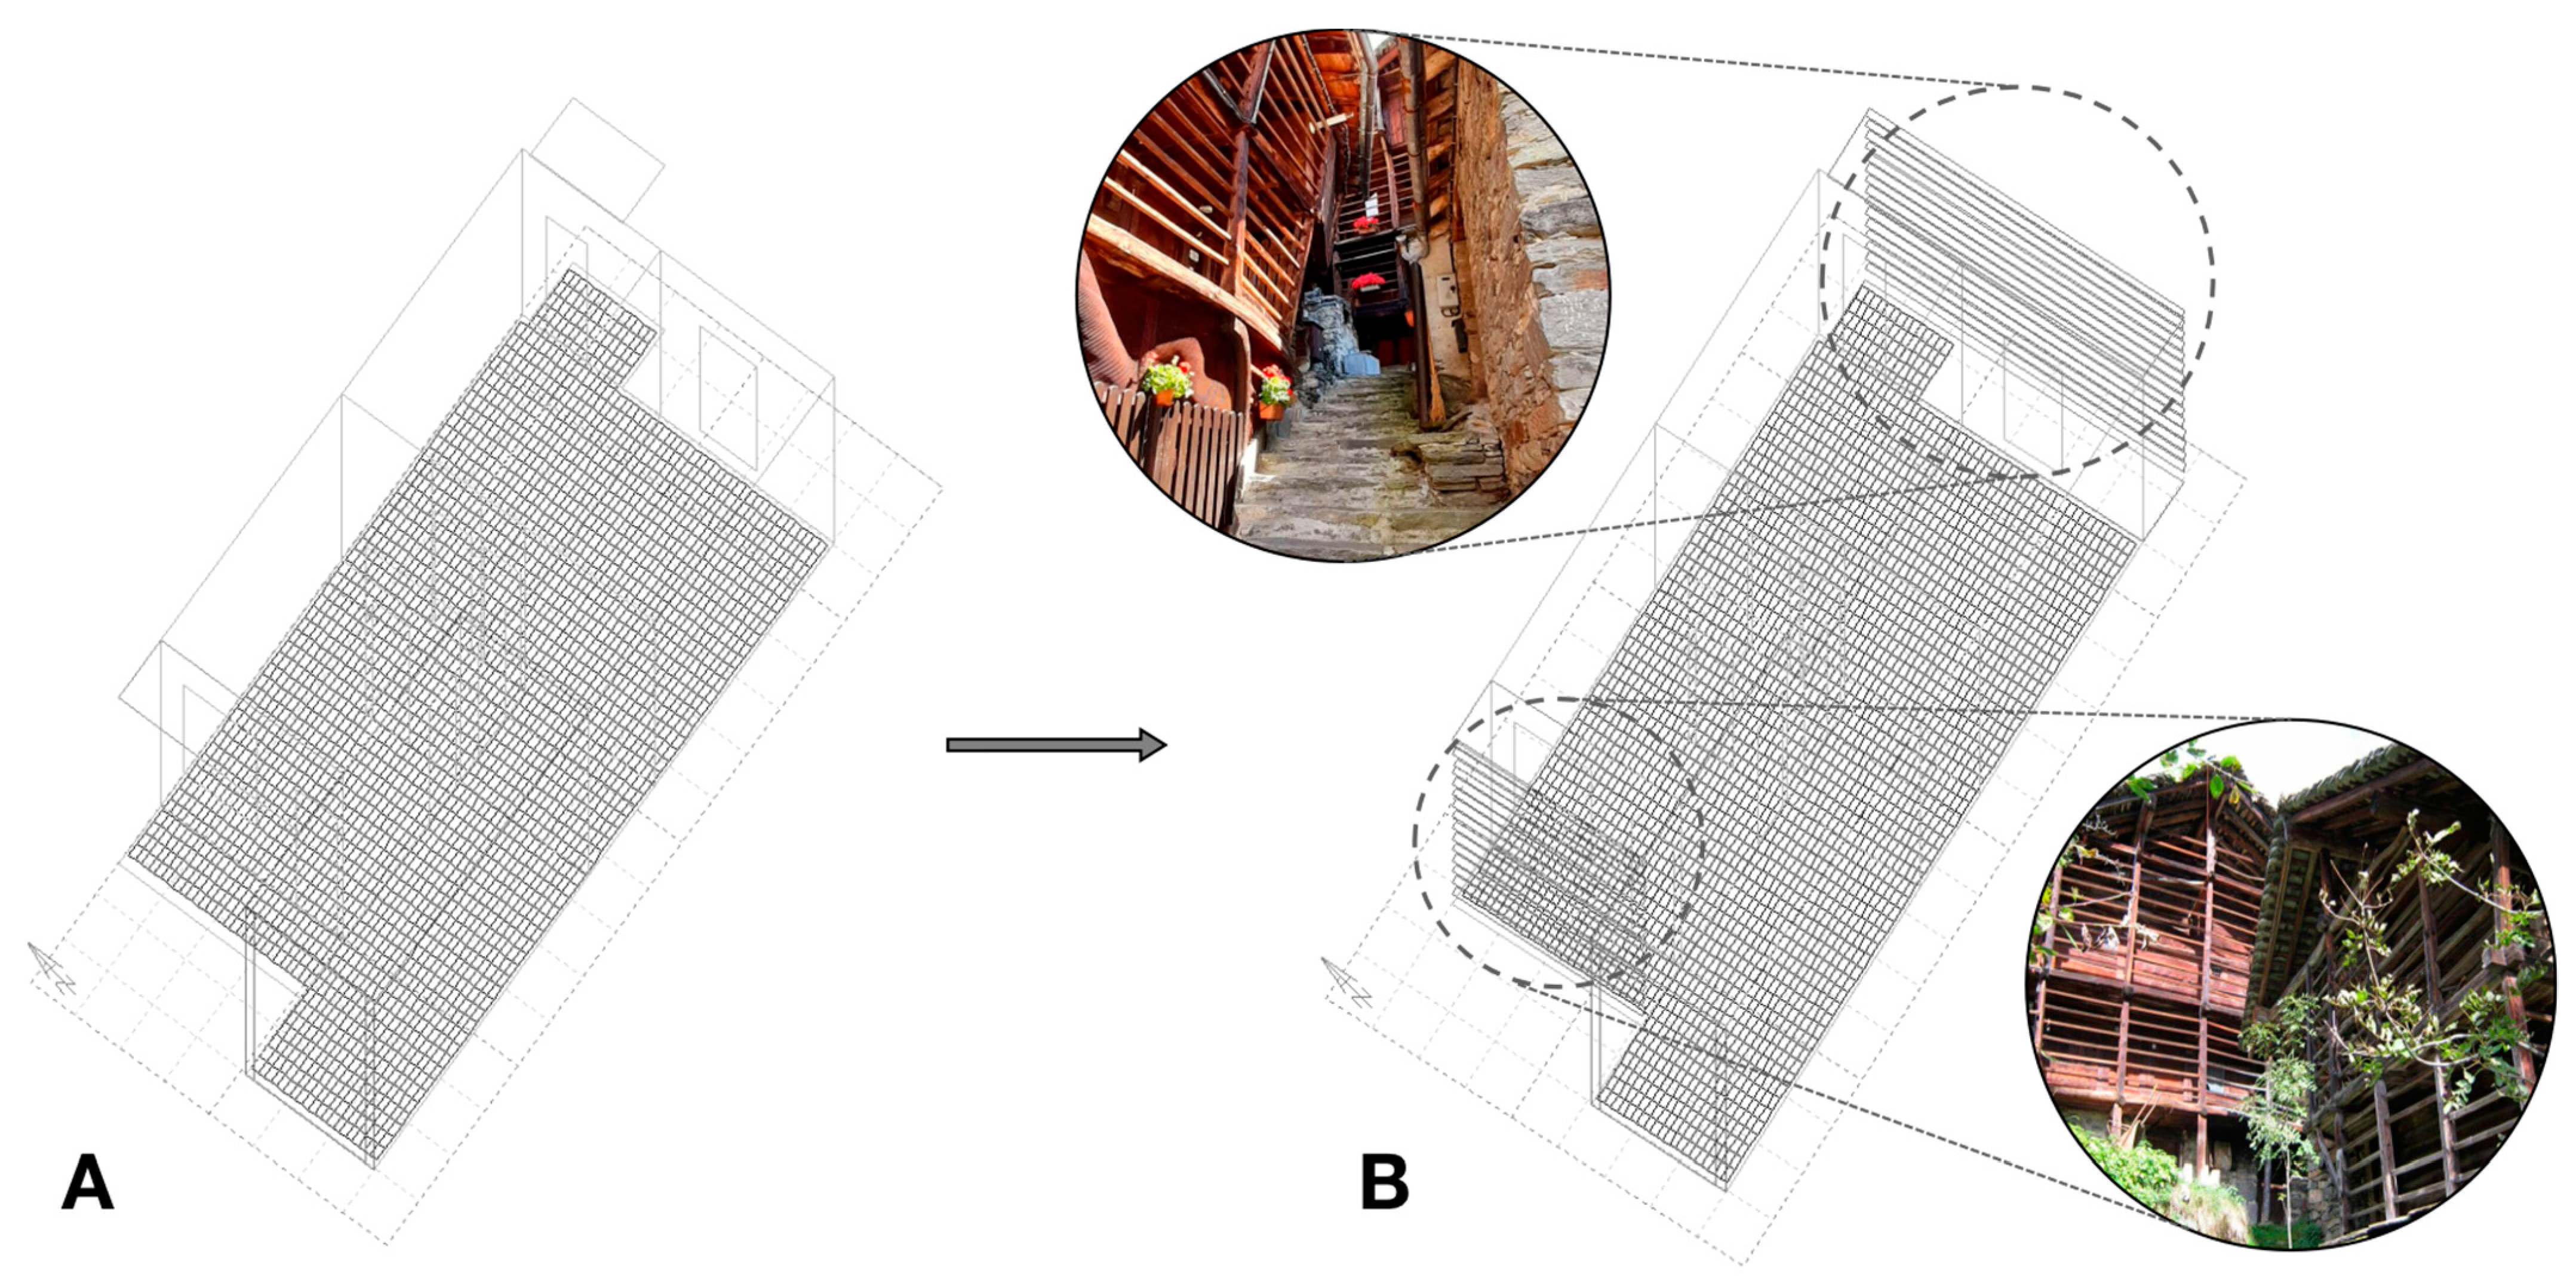
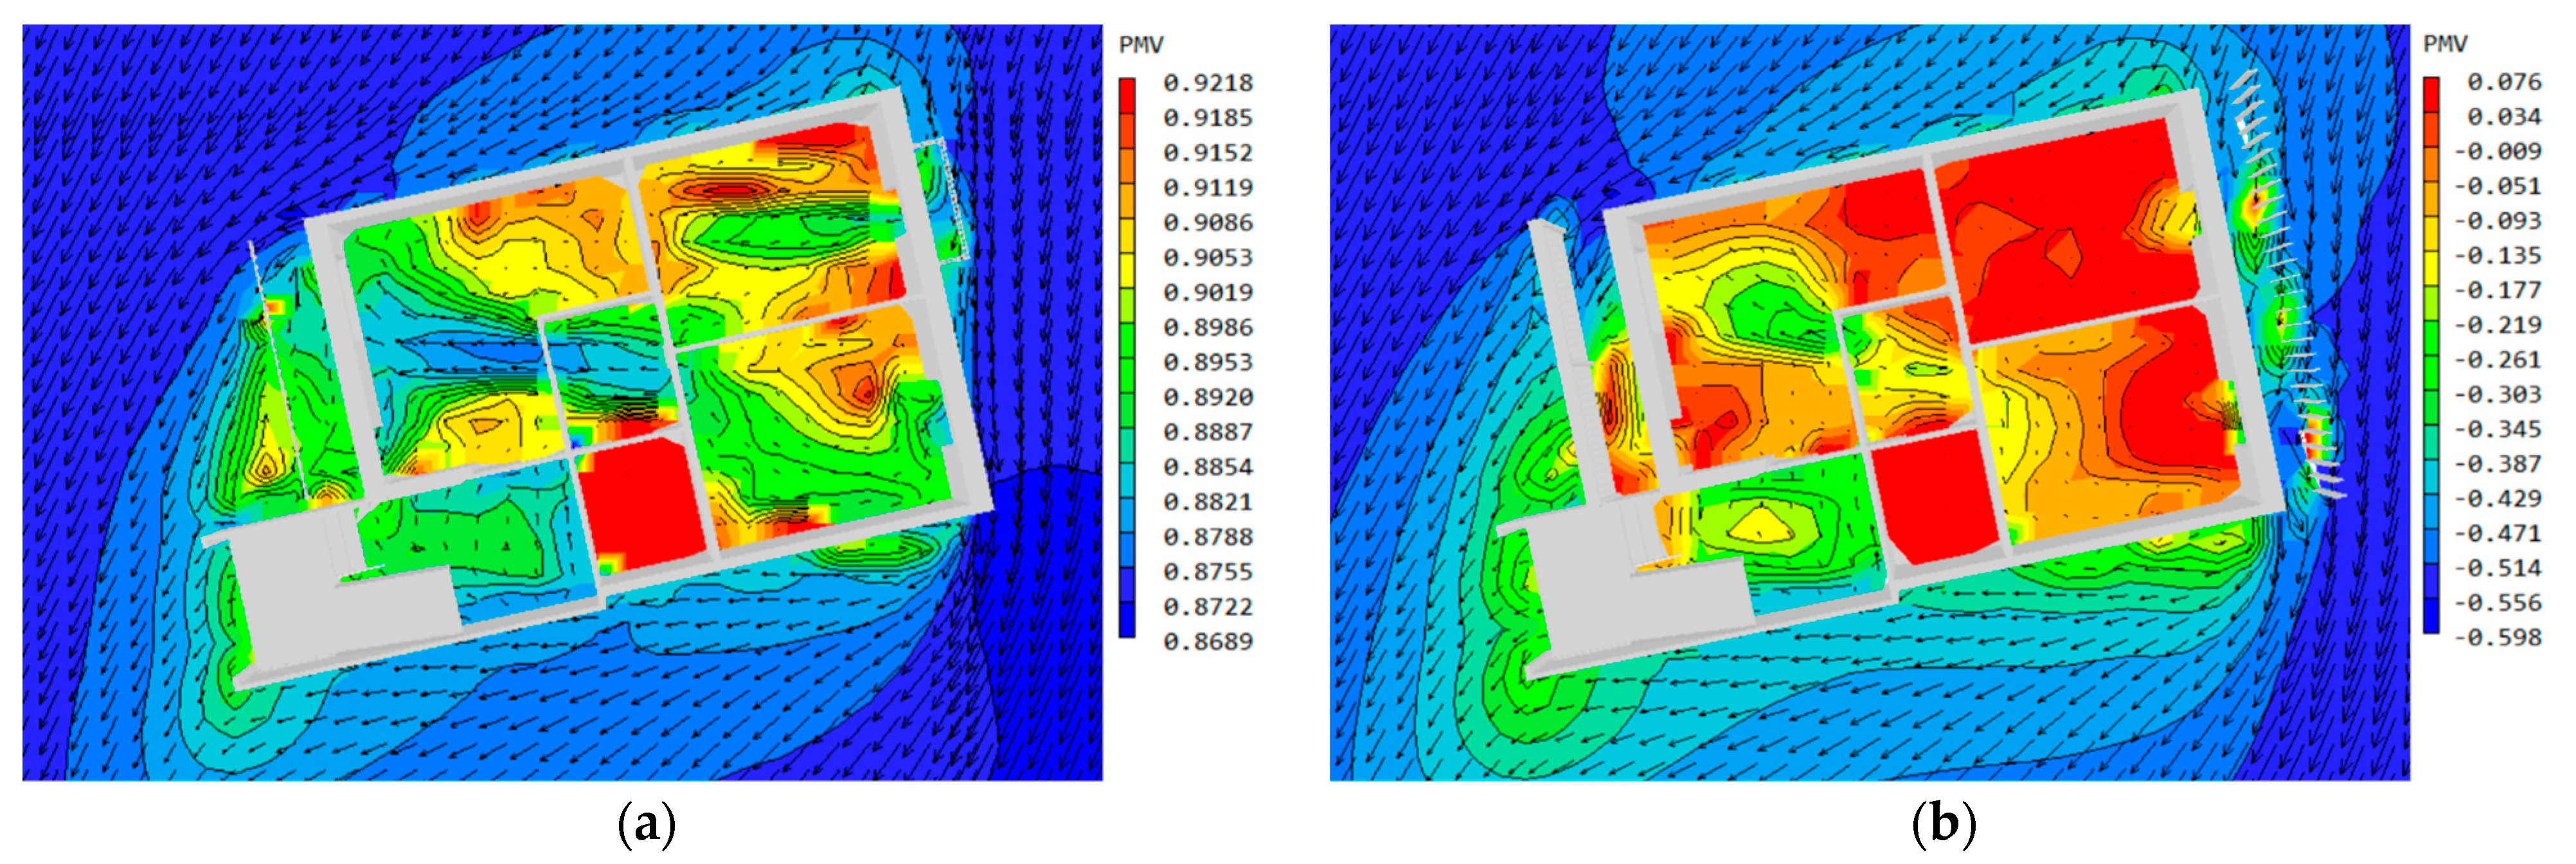
4.3.2. The Renovation Solutions

According to the renovation intention, a sunshade fence (A movable sunshade fence. In winter, the angle of blocking the sunlight of the fence can be adjusted according to the sun’s altitude angle.) was added to the outside of the balcony of the Aosta building. Table 3 shows the simulation results of the building facade before and after renovation from Ecotect 2011 software, including average daily radiation analysis and sunlight analysis. A is the simplified model of building simulation before the renovation, and B is the simplified model after the renovation. From the study of the average daily radiation from 30 May to 6 June 2022, in the figure, it can be seen that without affecting the overall moderate radiation intensity in the room, the problem of building A’s western exposure has been better resolved. The power of solar radiation received by west balconies and west-facing rooms has been weakened recently, positively impacting the indoor thermal environment. It is worth noting that, as a comparative experiment, the solar radiation intensity of the East Terrace was also weakened.
More simulation analysis and comparison are needed for the form of the fence used in the facade to obtain optimal results. Due to the influence of the structure of the facade, it is necessary to judge whether indoor sunlight is greatly affected after the renovation. It can be seen from the figure that most areas in the room still maintain a simulated lighting intensity of at least 2610 lux. In the narrow space of the building close to the inner wall, the daylight intensity is reduced, but it does not affect the needs of life. The overall effect is good.
The Phoenics 2019 software was used to simulate the indoor thermal environment during the transitional season from 30 May to 6 June; the overall interior of the building was relatively comfortable, but the distribution of PMV still found regional differences. The analysis of the different areas and the comparative analysis before and after the renovation can help provide a reference for the environmental improvement strategies in the coming summer. Figure 14a is the analysis before the renovation, and the PMV value is between 0 and 1. That is, the indoor temperature is between thermal comfort and slightly warm. Correspondingly, Figure 14b is the analysis after transformation, and the PMV value is between −1 and 0, that is, between slightly cool and thermal comfort. It can be seen from the comparison that the renovation strategy of the facade has a better effect on the cooling and regulation of the thermal environment. The Walser haylofts selected in this paper have been proven effective in improving the indoor lighting and thermal environment of buildings so that they can be considered for use.

5. Discussion

5.1. Facing Issues

Climate change, which means greater energy demand and less living comfort for social housing, will fundamentally change the performance of the built environment. Given the expected impact of future climate change, such as RCP 4.5 in 2050 (1.1 to 2.6 °C increase in global average temperature) and RCP 8.5 in 2100 (2.6 to 4.8 °C increase in global average temperature), there is an urgent need to find suitable building retrofits Strategies to improve the existing physical environment and amenity. A study of the built environment at Aosta found that lighting, thermal environment, and air quality need to be optimized. In the transition period, the Aosta building envelope has a good performance, the quality of the indoor acoustic environment is high, and the interior is not affected by outdoor noise. The lighting and thermal environments must be designed to solve the problems of glare and western sun exposure problems. While the indoor air quality is good, the air age in the kitchen, dining room, and bathroom areas is relatively high. Optimizing air quality by improving ventilation and increasing the number of air changes is necessary. In renovating existing buildings for vulnerable groups such as older adults with special needs for life, there are differences in the degree of physical environment regulation and energy consumption regulation. Since social housing residents have expanded to vulnerable groups such as older adults, their special physical functions and environmental needs must be considered when renovating the building.

5.2. Retrofits Strategies

The study found that from the end of March to the beginning of September, Aosta’s solar energy gains more heat, and full use can be made of solar energy. Compared with other cities in Italy, the Aosta region cannot achieve significant economic benefits by constructing large-scale solar energy systems. However, the use of solar panels is increased in renovating social housing. In that case, it can effectively solve the shortage of housing resources for vulnerable groups such as older adults. Considering vulnerable groups, in summer, the design method of increasing sunshade construction may be used to reduce the use of indoor air conditioners. This method is favored by disadvantaged groups who like to live in a natural environment. Aosta has extreme climate conditions, cold in winter and hot in summer. The combination of active and passive design measures can be fully considered, such as particular design techniques: (a) Passive solar heating; (b) Direct evaporative cooling; (c) Thermal mass effects; (d) Natural ventilation; (e) Indirect evaporative cooling; and (f) Exposed mass + Night-purge ventilation. The walls and roof could be insulated with the External Thermal Insulation Composite System (ETICS), a compact multi-layer insulation solution designed to improve energy efficiency and the envelope’s performance. Inspired by the characteristics of Alpine vernacular architecture, a balcony sunshade structure is added to the building renovation plan. Through integrated modeling and simulation, it is found that this scheme can better reduce the degree of solar radiation in summer, reduce the problem of seasonal large-area glare, and improve indoor comfort. Software simulation compares the schemes before and after the transformation. At the end of May and the beginning of June, the building’s indoor thermal environment comfort index before the renovation was between thermal comfort and slightly warm, and the indoor thermal environment comfort index after the renovation was between thermal comfort and somewhat cool. This result shows that the indoor thermal environment of the Aosta social housing is in a relatively comfortable state in the transitional season. However, it is still possible to achieve a better comfortable state by adjusting the intensity of solar radiation.

5.3. Limitations

Due to the limited access to the residential areas studied, it was impossible to conduct repeated measurements of the built environment. Therefore, the field surveys were carried out at the end of May and the beginning of June, a transition period in the Aosta area, not the hottest period. Furthermore, some data need to be included in the onsite measurement. The available measured data combined with the local meteorological data, software simulation, and relevant analysis results obtained from the questionnaire still allow a comprehensive analysis and judgment on the physical environment of the building. Social housing during the transitional period has particular lighting and thermal problems, but further research is still needed to improve sustainable building renovation strategies in the hottest summer. In this study, the building renovation strategy is simulated and verified. Still, it is limited to the renovation design of the facade and should be discussed more extensively in future studies.

6. Conclusions

Climate change exacerbates extreme heat, which makes heat waves more intense and frequent, causing many disruptions to our daily lives. The existing physical environment of buildings needs to be transformed and optimized to better deal with these problems. Existing social housing in the Alps is an excellent option for economically vulnerable individuals and families due to its low cost of living. Since the existing social housing has been built for a certain period, the quality of its physical environment still needs further research and optimization. The quality of the physical environment is closely related to human health, comfort, and energy consumption. Strategies for optimizing the physical environment vary based on the unique needs of seniors, low-income families, and more. Therefore, this study comprehensively evaluates the physical environment of buildings in the extreme climate of the Alps Mountains through interviews, on-site measurements, and various software simulations (such as Revit, Ecotect, and Phoenics software) to find an applicable physical environment optimization strategy. The research time is set at the end of May and the beginning of June, which belongs to the transitional period and is about to enter the high-temperature summer. The study found that the existing physical environment of the building performed well in terms of the acoustic environment and met the requirements of internationally recognized standards. However, there is still room for improvement in the lighting environment, thermal environment, and air quality in the space where the occupants often move. By investigating the west facade of the building, it is found that many households have started to use sunshade curtains or fences, and the problem of excessive western sun exposure and sun glare in the afternoon needs to be solved. The solar radiation is intense on sunny days, and the actual measurement found that the living room’s temperature near the west fluctuates around 24.5 °C. This result can predict the thermal discomfort the high-temperature summer will bring the older adult residents. The actual measurement of the air quality in the living room found that the concentration of TVOC meets the requirements of various standards most of the time. However, it still performs moderately 25% of the time, and there will be apparent concerns about comfort, so further optimization is needed. In the study, we tried to learn from the green concept of the Haylofts building of the Walser family in the Alps mountains environment. We set up movable sunshade grilles to solve the problems of Western sun exposure, sun glare, and overheating in summer.
Try to use various computer simulation software to conduct preliminary analysis and discussion on the design scheme before and after the transformation. After research, it is found that the problems of western sun exposure and sun glare have been better resolved without affecting the overall indoor radiation intensity. The west-facing rooms receive less power from solar radiation, positively impacting the thermal comfort of the balcony, living room, and bedroom areas. This design approach is a low-tech, low-cost retrofit strategy that can benefit low-income families in social housing. In addition, the study found that using solar energy is something that buildings in the Aosta area can consider. With the development of solar photovoltaic system components and the reduction in installation costs, making full use of solar energy is an important measure to reduce electricity bills, save energy, and improve the comfort of the building environment in the future for buildings that live for a long time, and can reduce climate warming—coming heat threat. This study still has some limitations, such as the design strategy of optimizing the indoor physical environment through building renovation, and more interview data, experimental measurement, and simulation verification are needed. In addition, this study still needs comparative research on the physical environment of buildings in different seasons, such as winter, and the lack of research on the physical environment of different orientations and floors. It will continue to deepen these contents in future discussions.

Author Contributions

Conceptualization: Y.Z. and B.L.; methodology and formal analysis: X.L., L.C., Q.M. and W.G.; software, resources, and data curation: Y.Z., B.L. and L.C.; validation: Q.M., L.C., W.G. and X.L.; investigation and visualization: Y.Z., B.L. and X.L.; writing—original draft preparation and writing—review and editing: Y.Z., B.L. and X.L.; funding acquisition: X.L., Q.M. and L.C.; supervision: L.C., Q.M. and W.G. All authors have read and agreed to the published version of the manuscript.

Funding

This research was supported by the National Key R&D Program of China (grant no. 2021YFC2009400); National Natural Science Foundation of China (grant no. 52108011); the Fundamental Research Funds for the Central Universities (grant no. QNMS202211); Guangdong Basic and Applied Basic Research Foundation (grant no. 2023A1515011137); the 2022 Guangdong Philosophy and Social Science Foundation (grant no. GD22XGL02); Guangzhou Philosophy and Social Science Planning 2022 Annual Project (grant no. 2022GZQN14); Department of Housing and Urban-Rural Development of Guangdong Province (grant no. 2021-K2-305243); Department of Education of Guangdong Province (grant no. 2021KTSCX004); Guangzhou Basic and Applied Basic Research Foundation (grant no. SL2024A04J00890).

Data Availability Statement

Data sharing is not applicable to this article.

Acknowledgments

This work was also supported in part by a scholarship from the China Scholarship Council (CSC) under the CSC grant nos. 202006150053 and 202106150080. We are grateful for the collaboration with Azienda Regionale Edilizia Residenziale Aosta, manager of the social housing of Cogne Neighborhood, and to Agenzia Regionale per la Protezione dell’Ambiente for the measurement activities.

Conflicts of Interest

The authors have no conflict of interest to declare that are relevant to the content of this article.

References

  1. Li, B.; Guo, W.H.; Liu, X.; Zhang, Y.Q.; Russell, P.J.; Schnabel, M.A. Sustainable Passive Design for Building Performance of Healthy Built Environment in the Lingnan Area. Sustainability 2021, 13, 9115. [Google Scholar] [CrossRef]
  2. Matias, M.; Lopes, S.; Lopes, A. The Climate of My Neighborhood: Households’ Willingness to Adapt to Urban Climate Change. Land 2023, 12, 856. [Google Scholar] [CrossRef]
  3. Zhang, Y.Q.; Liu, X.; Meng, Q.L.; Li, B.; Caneparo, L. Physical environment research of the family ward for a healthy residential environment. Front. Public Health 2022, 10, 15718. [Google Scholar] [CrossRef]
  4. Le Quéré, C.; Andrew, R.M.; Friedlingstein, P.; Sitch, S.; Hauck, J.; Pongratz, J.; Pickers, P.A.; Korsbakken, J.I.; Peters, G.P.; Canadell, J.G.; et al. Global Carbon Budget 2018. Earth Syst. Sci. Data 2018, 10, 2141–2194. [Google Scholar] [CrossRef] [Green Version]
  5. Report of the United Nations Conference on the Human Environment–Stockholm. 1972. Available online: https://wedocs.unep.org/20.500.11822/30829 (accessed on 5 May 2023).
  6. UN Documents–Gathering a Body of Global Agreements. 2022. Available online: http://www.un–documents.net/nair–dec.htm (accessed on 29 July 2022).
  7. Report of the World Commission on Environment and Development–Our Common Future. 1987. Available online: https://www.unicas.it/media/2732719/Rapporto_Brundtland_1987.pdf (accessed on 5 June 2023).
  8. Li, B.; Guo, W.; Liu, X.; Zhang, Y.; Caneparo, L. The Third Solar Decathlon China Buildings for Achieving Carbon Neutrality. Buildings 2022, 12, 1094. [Google Scholar] [CrossRef]
  9. Bali Road Map. 2007. Available online: https://unfccc.int/process/conferences/the–big–picture/milestones/bali–road–map (accessed on 10 April 2023).
  10. Paris Agreement. 2015. Available online: https://unfccc.int/process–and–meetings/the–Paris–agreement (accessed on 12 December 2015).
  11. Marta, T.G.; Henri, W. Assessing the adequacy of the global response to the Paris Agreement: Toward a full appraisal of climate ambition and action. Earth Syst. Gov. 2021, 8, 100102. [Google Scholar] [CrossRef]
  12. Kawakubo, S.; Murakami, S.; Ikaga, T.; Asami, Y. Sustainability assessment of cities: SDGs and GHG emissions. Build. Res. Inf. 2018, 46, 528–539. [Google Scholar] [CrossRef] [Green Version]
  13. Federica, C.; D’Adamo, I.; Koh, S.L. Environmental and economic analysis of building integrated photovoltaic systems in Italian regions. J. Clean. Prod. 2013, 98, 241–252. [Google Scholar] [CrossRef]
  14. European Commission. Regulation (EU) 2021/1119 of the European Parliament and of the Council. Off. J. Eur. Union 2021, L 243, 1–17. Available online: https://eur–lex.europa.eu/legal–content/EN/TXT/?uri=CELEX:32021R1119 (accessed on 30 June 2021).
  15. IPCC: Climate Change 2022: Mitigation of Climate Change. In Contribution of Working Group III to the Sixth Assessment Report of the Intergovernmental Panel on Climate Change; Cambridge University Press: Cambridge, UK; New York, NY, USA, 2022. [CrossRef]
  16. Krizia, B.; David, B.H.; Carlos, R.B. Chapter 20—The influence of climate change on the design strategies of the built environment: The heterogeneous climate of Italy analyzed in future scenarios. In Resilient and Sustainable Cities; Elsevier: Amsterdam, The Netherlands, 2023; pp. 357–396. [Google Scholar] [CrossRef]
  17. Lombardi, F.; Rocco, M.V.; Belussi, L.; Danza, L.; Magni, C.; Colombo, E. Weather-induced variability of country-scale space heating demand under different refurbishment scenarios for residential buildings. Energy 2022, 239, 122152. [Google Scholar] [CrossRef]
  18. IEA-EBC: Strategic Plan 2019‑2024. Energy in Buildings and Communities, Technology Collaboration Programme, International Energy Agency. 2019. Available online: https://iea-ebc.org/Data/Sites/1/media/docs/EBC_Strategic_Plan_2019_2024.pdf (accessed on 5 May 2023).
  19. European Commission. Renovation Wave. 2020. Available online: https://energy.ec.europa.eu/system/files/2020-10/stakeholder_consultation_on_the_renovation_wave_initiative_0.pdf (accessed on 10 June 2023).
  20. Donatello, S.; Aleksandra, A.; Zahara, P. Background research for the revision of EU Green Public Procurement criteria for Buildings. Jrc Science For Policy Report 2022. Available online: https://susproc.jrc.ec.europa.eu/product-bureau/sites/default/files/2022-03/GPP_Buildings_BR_v1.0.pdf (accessed on 5 May 2023).
  21. European Green Deal. Fit for 55, Council of the European Union. 2021. Available online: https://swedish-presidency.consilium.europa.eu/en/news/new-agreements-confirmed-on-the-fit-for-55-package/ (accessed on 5 May 2023).
  22. 2021 Global Status Report for Buildings and Construction: Towards a Zero–emission, Efficient and Resilient Buildings and Construction Sector. 2021. Available online: https://www.unep.org/resources/report/2021–global–status–report–buildings–and–construction (accessed on 19 October 2021).
  23. Schwarz, B. Environmental gerontology: What now? J. Hous. Elder. 2012, 26, 4–19. [Google Scholar] [CrossRef]
  24. Van, H.J.; Schellen, L.; Soebarto, V.; Wong, J.K.W.; Kazak, J.K. Ten questions concerning thermal comfort and aging. Build. Environ. 2017, 120, 123–133. [Google Scholar] [CrossRef]
  25. Aghamolaei, R.; Ghaani, M. Balancing the impacts of energy efficiency strategies on comfort quality of interior places: Application of optimization algorithms in domestic housing. J. Build. Eng. 2020, 29, 101174. [Google Scholar] [CrossRef]
  26. Niemela, T.; Vinha, J.; Lindberg, R.; Ruuska, T.; Laukkarinen, A. Carbon dioxide permeability of building materials and their impact on bedroom ventilation need. J. Build. Eng. 2017, 12, 99–108. [Google Scholar] [CrossRef]
  27. World Health Organization. Global Strategy and Action Plan on Aging and Health. Available online: https://www.who.int/publications/i/item/9789241513500 (accessed on 2 January 2017).
  28. World Health Organization. Active Ageing: A Policy Framework. World Health Organization. 2002. Available online: https://apps.who.int/iris/handle/10665/67215 (accessed on 10 June 2023).
  29. Smart Age–Friendly Living and Working Environment: AI System for Sustainable Ageing at Work. 2019. Available online: https://doi.org/10.3030/826343 (accessed on 1 January 2019).
  30. Liu, H.; Wu, Y.; Li, B.; Cheng, Y.; Yao, R. Seasonal variation of thermal sensations in residential buildings in the hot summer and cold winter zone of China. Energy Build. 2017, 140, 9–18. [Google Scholar] [CrossRef]
  31. Liu, X.; He, J.; Xiong, K.; Liu, S.; He, B.-J. Identification of Factors Affecting Public Willingness to Pay for Heat Mitigation and Adaptation: Evidence from Guangzhou, China. Urban. Clim. 2023, 48, 101405. [Google Scholar] [CrossRef]
  32. Liu, S.; Wang, Y.; Liu, X.; Yang, L.; Zhang, Y.; He, J. How does future climatic uncertainty affect multi-objective building energy retrofit decisions? Evidence from residential buildings in subtropical Hong Kong. Sustain. Cities Soc. 2023, 92, 104482. [Google Scholar] [CrossRef]
  33. Ozcelik, G.; Becerik–Gerber, B.; Chugh, R. Understanding human–building interactions under multimodal discomfort. Build. Environ. 2019, 151, 280–290. [Google Scholar] [CrossRef]
  34. Kim, A.; Wang, S.; Kim, J.-E.; Reed, D. Indoor/outdoor environmental parameters and window–opening behavior: A structural equation modeling analysis. Buildings 2019, 9, 94. [Google Scholar] [CrossRef] [Green Version]
  35. Tweed, C.; Humes, N.; Zapata–Lancaster, G. The changing landscape of thermal experience and warmth in older people's dwellings. Energy Policy 2015, 84, 223–232. [Google Scholar] [CrossRef] [Green Version]
  36. Amministrazioni Comunali. Tabella Delle Categorie Catastali. 2020. Available online: https://www.amministrazionicomunali.it/docs/pdf/categorie_catastali.pdf (accessed on 5 May 2023).
  37. Libralato, M.; Murano, G.; De Angelis, A.; Saro, O.; Corrado, V. Influence of the Meteorological Record Length on the Generation of Representative Weather Files. Energies 2020, 13, 2103. [Google Scholar] [CrossRef] [Green Version]
  38. Eurostat. Electricity Price Statistics. 2023. Available online: https://ec.europa.eu/eurostat/statistics-explained/index.php?title=Electricity_price_statistics#Electricity_prices_for_household_consumers (accessed on 5 May 2023).
  39. ANSI/ASHRAE Standard 55-2017; Thermal Environmental Conditions for Human. ASHRAE and the American National Standards Institute: Peachtree Corners, GA, USA. Available online: https://www.ashrae.org/file%20library/technical%20resources/standards%20and%20guidelines/standards%20addenda/55_2017_d_20200731.pdf (accessed on 5 May 2023).
  40. Parsons, K. Human Thermal Environments: The Effects of Hot, Moderate, and Cold Environments on Human Health, Comfort, and Performance, 3rd ed.; CRC Press: Boca Raton, FL, USA, 2002. [Google Scholar] [CrossRef]
  41. Schellen, L.; Van Marken Lichtenbelt, W.D.; Loomans, M.G.; Toftum, J.; De Wit, M.H. Differences between young adults and elderly in thermal comfort, productivity, and thermal physiology in response to a moderate temperature drift and a steady–state condition. Indoor Air 2010, 20, 273–283. [Google Scholar] [CrossRef] [PubMed]
  42. ASHRAE. Thermal Environmental Conditions for Human Occupancy; American Society of Heating, Refrigerating and Air Conditioning Engineers, Inc.: Atlanta, GA, USA, 2020. [Google Scholar]
  43. Soebarto, V.; Williamson, T.; Carre, A.; Arakawa Martins, L. Understanding indoor environmental conditions and occupant's responses in houses of older people. IOP Conf. Ser. Mater. Sci. Eng. 2019, 609, 042096. [Google Scholar] [CrossRef] [Green Version]
  44. Facundo, B.; Victor, D.F. A computational multi–objective optimization method to improve energy efficiency and thermal comfort in dwellings. Energy Build. 2017, 154, 283–294. [Google Scholar] [CrossRef] [Green Version]
  45. Gou, S.; Nik, V.; Scartezzini, J.; Zhao, Q.; Li, Z. Passive design optimization of newly–built residential buildings in Shanghai for improving indoor thermal comfort while reducing building energy demand. Energy Build. 2018, 169, 484–506. [Google Scholar] [CrossRef]
  46. Gao, W.; Tu, R.; Li, H.; Fang, Y.; Que, Q. In the subtropical monsoon climate high–density city, what features of the neighborhood environment matter most for public health? Int. J. Environ. Res. Public. Health 2020, 17, 9566. [Google Scholar] [CrossRef]
  47. Lai, J.H.; Yik, F.W. Perception of importance and performance of the indoor environmental quality of high–rise residential buildings. Build. Environ. 2009, 44, 352–360. [Google Scholar] [CrossRef]
  48. World Health Organization. Health Impact of Low indoor Temperatures: Report on a WHO Meeting: Copenhagen 11–14 November 1985; World Health Organization Regional Office for Europe: Copenhagen, Denmark, 1987. [Google Scholar]
  49. Teixeira, J.P.; Botelho, A.; Neuparth, N.; Caires, I.; Papoila, A.; Martins, P.; Paixão, P.; Aelenei, D.; Viegas, J.; Cano, M.; et al. Geriatric Study in Portugal on Health Effects of Air Quality in Elderly Care Centers. Medicine 2015, 74245735. [Google Scholar]
  50. Fan, G.; Xie, J.; Yoshino, H.; Yanagi, U.; Hasegawa, K.; Wang, C.; Zhang, X.; Liu, J. Investigation of indoor thermal environment in the homes with elderly people during heating season in Beijing, China. Build. Environ. 2017, 126, 288–303. [Google Scholar] [CrossRef]
  51. Lush, D.; Butcher, K.; Appleby, P. Environmental Design: CIBSE Guide A.; The Yale Press Ltd.: London, UK, 1999; ISBN 9781906846541. [Google Scholar]
  52. Sinoo, M.M.; Van Hoof, J.; Kort, H.S. Light conditions for older adults in the nursing home: Assessment of environmental illuminances and color temperature. Build Environ. 2011, 46, 1917–1927. [Google Scholar] [CrossRef] [Green Version]
  53. Van Hoof, J.; Kort, H.S.M.; Duijnstee, M.S.H.; Rutten, P.G.S.; Hensen, J.L.M. The indoor environment and the integrated design of homes for older people with dementia. Build Environ. 2010, 45, 1244–1261. [Google Scholar] [CrossRef] [Green Version]
  54. Nastaran, S.; Mohamed, B.; Elizabeth, A.L.S.-M.; Rogers, W.A. Tuning environmental lighting improves objective and subjective sleep quality in older adults. Build. Environ. 2021, 204, 108096. [Google Scholar] [CrossRef]
  55. IES: Illuminating Engineering Society of North America. In RP–28–16–ANSI/IES—Lighting and the Visual Environment for Seniors and the Low Vision Population; The Illuminating Engineering Society of North America: New York, NY, USA, 2016; p. 10005.
  56. Ichimori, A.; Tsukasaki, K.; Koyama, E. Measuring illuminance and investigating methods for its quantification among elderly people living at home in Japan to study the relationship between illuminance and physical and mental health. Geriatr Gerontol Int. 2013, 13, 798–806. [Google Scholar] [CrossRef] [PubMed]
  57. Mishima, K.; Okawa, M.; Shimizu, T.; Hishikawa, Y. Diminished melatonin secretion in the elderly caused by insufficient environmental illumination. J. Clin. Endocr. Metab. 2001, 86, 129–134. [Google Scholar] [CrossRef] [PubMed]
  58. Torresin, S.; Albatici, R.; Aletta, F.; Babich, F.; Oberman, T.; Kang, J. Acoustic Design Criteria in Naturally Ventilated Residential Buildings: New Research Perspectives by Applying the Indoor Soundscape Approach. Appl. Sci. 2019, 9, 5401. [Google Scholar] [CrossRef] [Green Version]
  59. Thomas, P.; Aletta, F.; Filipan, K.; Mynsbrugge, T.V.; De Geetere, L.; Dijckmans, A.; Botteldooren, D.; Petrovic, M.; Van de Velde, D.; de Vriendt, P.; et al. Noise environments in nursing homes: An overview of the literature and a case study in Flanders with quantitative and qualitative methods. Appl. Acoust. 2020, 159, 107103. [Google Scholar] [CrossRef]
  60. Buratti, C.; Palladino, D. Mean Age of Air in Natural Ventilated Buildings: Experimental Evaluation and CO2 Prediction by Artificial Neural Networks. Appl. Sci. 2020, 10, 1730. [Google Scholar] [CrossRef] [Green Version]
  61. Carroll, G.T.; Kirschman, D.L. A Peripherally Located Air Recirculation Device Containing an Activated Carbon Filter Reduces VOC Levels in a Simulated Operating Room. ACS Omega 2022, 7, 46640–46645. [Google Scholar] [CrossRef]
  62. Industrial Emissions Directive, 2010, Article 3. Available online: http://data.europa.eu/eli/dir/2010/75/2011-01-06 (accessed on 10 June 2023).
  63. Wolkoff. Organic compounds in office environments—Sensory irritation, odor, measurements and the role of reactive chemistry. Indoor Air 2006, 16, 7–19. [Google Scholar] [CrossRef]
  64. Health.state.mn.us. Volatile Organic Compounds (VOCs) in Your Home—EH: Minnesota Department of Health. Retrieved. 2018. Available online: https://www.health.state.mn.us/communities/environment/air/toxins/voc.htm (accessed on 10 June 2023).
  65. EPA. Volatile Organic Compounds’ Impact on Indoor Air Quality. 2016. Available online: https://www.epa.gov/indoor-air-quality-iaq/volatile-organic-compounds-impact-indoor-air-quality (accessed on 10 June 2023).
  66. Cincinelli, A.; Martellini, T. Indoor Air Quality and Health. Int. J. Environ. Res. Public Health 2017, 14, 1286. [Google Scholar] [CrossRef] [Green Version]
  67. Holøs, S.B.; Yang, A.; Lind, M.; Thunshelle, K.; Schild, P.; Mysen, M. VOC emission rates in newly built and renovated buildings, and the influence of ventilation—A review and meta-analysis. Int. J. Of Vent. 2019, 18, 153–166. [Google Scholar] [CrossRef]
  68. International WELL. Building Institute: The WELL Building Standard with Q3 2017 Addenda; International WELL Building Institute pbc and Delos Living LLC: New York, NY, USA, 2017. [Google Scholar]
  69. Christian Meyer. Overview of TVOC and Indoor Air Quality. 2021. Available online: https://www.renesas.com/us/en/document/whp/overview-tvoc-and-indoor-air-quality (accessed on 5 May 2023).
  70. Indoor Air Quality Management Group, Hong Kong SAR Government, A Guide on Indoor Air Quality Certification Scheme for Offices and Public Places. 2019. Available online: https://www.iaq.gov.hk/wp-content/uploads/2021/04/new-iaq-guide_eng.pdf (accessed on 5 May 2023).
  71. Voinov, A.; Shugart, H.H. ‘Integronsters’, integral and integrated modeling. Environ. Model. Softw. 2012, 39, 149–158. [Google Scholar] [CrossRef]
  72. Fitriaty, P.; Shen, Z. Predicting energy generation from residential building attached Photovoltaic Cells in a tropical area using 3D modeling analysis. J. Clean. Prod. 2018, 195, 1422–1436. [Google Scholar] [CrossRef]
  73. Fitriaty, P.; Shen, Z.; Sugihara, K.; Kobayashi, F.; Nishino, T. 3D Insolation Colour Rendering for Photovoltaic Potential: Evaluation on Equatorial Residential Building Envelope. Int. Rev. Spat. Plan. Sustain. Dev. 2017, 5, 73–88. [Google Scholar] [CrossRef] [PubMed] [Green Version]
  74. Lin, Q.; Kensek, K.; Schiler, M.; Choi, J. Streamlining sustainable design in building information modeling BIM-based PV design and analysis tools. Arch. Sci. Rev. 2021, 64, 467–477. [Google Scholar] [CrossRef]
  75. Vangimalla, P.R.; Olbina, S.J.; Issa, R.R.; Hinze, J. Validation of Autodesk Ecotect TM accuracy for thermal and daylighting simulation. In Proceedings of the 2011 Winter Simulation Conference (WSC), Phoenix, AZ, USA, 11–14 December 2011; pp. 3383–3394. [Google Scholar] [CrossRef]
  76. Fiocchi, C.; Hoque, S.; Shahadat, M. Climate Responsive Design and the Milam Residence. Sustainability 2011, 3, 2289–2306. [Google Scholar] [CrossRef] [Green Version]
  77. Lu, M.; Du, J.T. Assessing the daylight and sunlight availability in high-density residential areas: A case in North-east China. Archit. Sci. Rev. 2013, 56, 168–182. [Google Scholar] [CrossRef]
  78. Assimakopoulos, V.D.; Stathopoulou, O.I.; Halios, C.; Helmis, C.G. Numerical Investigation of Indoor Environmental Conditions in an Office. Int. J. Vent. 2008, 6, 315–326. [Google Scholar] [CrossRef]
  79. Stathopoulou, O.I.; Assimakopoulos, V.D. Numerical Study of the Indoor Environmental Conditions of a Large Athletic Hall Using the CFD Code PHOENICS. Environ. Model. Assess. 2008, 13, 449–458. [Google Scholar] [CrossRef]
  80. Fanger, P.O.; Toftum, J. Extension of the PMV model to non-air-conditioned buildings in warm climates. Energy Build. 2002, 34, 533–536. [Google Scholar] [CrossRef]
  81. ISO 9920:2009; Ergonomics of the Thermal Environment—Estimation of Thermal Insulation and Water Vapour Resistance of a Clothing Ensemble. International Organisation for Standardisation: Geneva, Switzerland, 2009.
  82. ISO 7730:2005; Ergonomics of the Thermal Environment—Analytical Determination and Interpretation of Thermal Comfort Using Calculation of the PMV and PPD Indices and Local Thermal Comfort Criteria. International Organisation for Standardisation: Geneva, Switzerland, 2005.
  83. ISO 8996:2021; Ergonomics of the Thermal Environment—Determination of Metabolic Rate. International Organisation for Standardisation: Geneva, Switzerland, 2021.
  84. Reddy, T.A. Literature Review on Calibration of Building Energy Simulation Programs: Uses, Problems, Procedures, Uncertainty, and Tools. ASHRAE Trans. 2006, 112, 226–240. [Google Scholar]
  85. Mavromatidis, G.; Orehounig, K.; Bollinger, L.A.; Hohmann, M.; Marquant, J.F.; Miglani, S.; Morvaj, B.; Murray, P.; Waibel, C.; Wang, D.; et al. Ten questions concerning modeling of distributed multi-energy systems. Build. Environ. 2019, 165, 106372. [Google Scholar] [CrossRef]
Figure 1. Buildings and construction’s share of global final energy and energy-related CO2 emissions, 2020 (Reference from: https://globalabc.org/resources/publications/2021-global-status-report-buildings-and-construction/, accessed on 29 July 2022).
Land 12 01468 g001
Figure 2. Aosta Social Housing: Location of the chosen building.
Land 12 01468 g002
Figure 3. Aosta Social Housing: (a) Gazzera building top view; (b) Building second-floor plan.
Land 12 01468 g003
Figure 4. (a) Annual incident solar radiation; (b) Psychrometric chart (The abscissa in the psychrometric chart represents the dry bulb temperature (°C), the ordinate represents the absolute humidity (g/kg)).
Land 12 01468 g004
Figure 5. Comfort percentages, selected design techniques: (a) Passive solar heating; (b) Direct evaporative cooling; (c) Thermal mass effects; (d) Natural ventilation; (e) Indirect evaporative cooling; (f) Exposed mass + Night-purge ventilation.
Land 12 01468 g005
Figure 6. Outdoor Environment (from 30 May to 6 June 2022).
Land 12 01468 g006
Figure 7. Environment instruments: (a) Monitoring position (outdoor and indoor); (b) Preparation before measuring.
Land 12 01468 g007
Figure 8. Acoustic environment results, Equivalent Continuous Level (Leq, dB (A)).
Land 12 01468 g008
Figure 9. Thermal environment results, Air Temperature (°C).
Land 12 01468 g009
Figure 10. Thermal environment results, Relative Humidity (%).
Land 12 01468 g010
Figure 11. Indoor air quality results, TVOC (ppm).
Land 12 01468 g011
Figure 12. Cumulative insolation simulation results.
Land 12 01468 g012
Figure 13. Retrofit design with wisdom from Walser haylofts. (A): before renovation; (B): after renovation. (https://www.alagna.it/en/routes–walks–trekking–monterosa/the–antique–hamlets/, accessed on 12 June 2023).
Land 12 01468 g013
Figure 14. Phoenics 2019 software simulation results: (a) PMV (before renovation); (b) PMV (after renovation).
Land 12 01468 g014
Table 1. Measured instruments.
NumberInstruments ModelDescriptionMeasurement PrecisionMeasuring RangeInstrument
1IEC-61672Acoustic environment measuring instruments. Measurements of A-weighted sound levels of audible sound.±3 dBMeasure sounds generally in the range of human hearing. 0 dB to 140 dBLand 12 01468 i001
2AirBeam 2AirBeam 2 measures fine particulate matter (PM1.0, PM2.5, and PM10), temperature, and relative humidity.2–9%Measures hyperlocal concentrations of harmful microscopic particles in the air; 0–400 µg/m3; Sampling frequency: 1 sLand 12 01468 i002
3Honeywell HPMA115C0-003Indoor air quality monitors. Detects and counts particles using light scattering. PM1.0, PM2.5, PM4.0, and PM10 (µg/m3).±15%0 µg/m3 to 1000 µg/m3; Response time < 6 sLand 12 01468 i003
4ION SCIENCE CORVUSContinuous monitoring and data logging of low-level VOCs, temperature, humidity and atmospheric pressure found in public buildings. Detects Volatile Organic Compounds (VOCs) down to parts per billion (ppb) levels. Photoionization detection (PID): ±5 ppb; Temperature: ±1 °C; Relative humidity: ±4%; Barometric pressure: ±1.5%Photoionization detection (PID): 0 to 50 ppb; Temperature: −40 °C to 125 °C; Relative humidity: 0 to 99%; Barometric pressure: 70 kPa to 106 kPaLand 12 01468 i004
5LP 471 PHOTPhotometric probe for measuring the ILLUMINANCE, spectral response according to the photopic curve, class B according to CIE N° 69, cosine correction diffuser.0.01 lux to 0.01 × 103 lux0.10 lux to 200 × 103 luxLand 12 01468 i005
Table 2. Survey levels.
LevelsBuilding Input Data Available
Utility BillsAs-Built DataInspectionDetailed AuditShort-Term MonitoringLong-Term Monitoring
Level 1XX
Level 2XXX
Level 3XXXX
Level 4XXXXX
Level 5XXXXXX
Table 3. Comparison and Analysis of Insolation or Daylight Before and After Renovation.
ModelsInsolation AnalysisDaylight Analysis
Land 12 01468 i006
Disclaimer/Publisher’s Note: The statements, opinions and data contained in all publications are solely those of the individual author(s) and contributor(s) and not of MDPI and/or the editor(s). MDPI and/or the editor(s) disclaim responsibility for any injury to people or property resulting from any ideas, methods, instructions or products referred to in the content.

