Article

Spatio-Temporal Patterns of Warm-Season Ground Surface Temperature—Surface Air Temperature Difference over China Mainland

1
Department of Atmospheric Science, School of Environmental Studies, China University of Geosciences, Wuhan 430074, China
2
Laboratory for Climate Studies, National Climate Center, China Meteorological Administration, Beijing 100081, China
*
Author to whom correspondence should be addressed.
Land 2023, 12(5), 1057; https://doi.org/10.3390/land12051057
Submission received: 26 March 2023 / Revised: 25 April 2023 / Accepted: 10 May 2023 / Published: 12 May 2023
(This article belongs to the Section Land–Climate Interactions)

Abstract

:
Examining large-scale characteristics of the difference between ground surface temperature (GST) and surface air temperature (SAT) and its long-term trend will help understand land surface energy exchange and the effect of land-atmosphere interaction on climate change and variability. Based on a homogenized monthly dataset of GST and SAT from 1961 to 2018, this study analyzes the spatial distribution and long-term trend of the difference between ground surface temperature and surface air temperature (GST–SAT) in the warm season (April to October) over China mainland. The results show that the warm-season mean GST–SAT in the Qinghai-Tibet Plateau and the northwestern deserts have the largest GST–SAT. On average, the GST–SAT in China is the greatest in summer, with the maximum monthly value occurring in July. During 1961–2018, the warm-season mean GST–SAT undergoes a significant increasing trend (0.04 °C/10yr, p < 0.01), with the largest increase seen in mid-late spring (April and May), and the smallest increase in August. Spatially, the GST–SAT increases significantly in the northern region, decreases slightly in the southern region, and remains unchanged in the Qinghai-Tibet Plateau. The warm-season mean GST–SAT is significantly positively correlated with altitude and sunshine duration (R = 0.50, 0.40; p < 0.05), and significantly negatively correlated with relative humidity and precipitation (R = 0.48, −0.42; p < 0.05), in the country on a whole in the analysis period.

1. Introduction

Land-atmosphere interaction plays a vital role in the formation, variability, and change of regional climate [1,2,3]. Strengthening research on scientific issues related to land-atmosphere interaction will help to develop theories and technologies of climate predictability [4,5]. Since the 1980s, a series of large-scale comprehensive observation experiments and research projects have been organized in the world including China, to improve the scientific understanding of land-atmosphere processes such as water and heat exchange and their impact on climate [6,7,8,9]. Due to its intrinsic thermal properties, soil can record climate anomalies [10,11,12,13], affecting terrestrial surface climate and climate variability by interacting with the atmosphere, and can be used as a predictor of seasonal climate anomalies and extreme events [14,15]. Here soil “records” mainly refer to soil moisture and temperature persistence. As an example, precipitation anomalies may lead to soil moisture anomalies, which may take weeks to months to eliminate through evaporation and other surface processes [10].
In the process of land-atmosphere interaction, the surface sensible heat flux is an essential energy source for the lower atmosphere, and its non-uniform horizontal distribution will lead to spatial differences in surface air heating, which in turn affects regional climate variability and change [16,17,18]. Surface sensible heat flux can be estimated from surface air density, near-surface wind speed, ground surface temperature, near-surface air temperature, and turbulence exchange coefficient [19,20]. This estimation method is straightforward and also probably an important application of the Monin-Obukhov Similarity Theory (MOST) [21,22]. MOST describes the influence of shear stress and buoyancy on near-surface turbulent transport with the method of similarity and dimensional analysis and establishes a general expression of near-surface meteorological elements profiles. However, there are some limitations to the application of MOST. The use of MOST is generally limited to the surface layer with low surface roughness or homogeneous surfaces, and the stable air conditions of boundary layer [23]. The difference between ground surface temperature and surface air temperature (GST–SAT) can be characterized by the difference between the 0 m soil temperature and 1.5 m air temperature. The GST is the ground skin temperature or 0-cm soil temperature measured at the stations, and the SAT is the 150-cm shelter air temperature. The GST–SAT is one of the main contributors to surface sensible heat flux, and it can be used as a good indicator for variation of surface sensible heat flux [18,24]. Therefore, studying the temporal and spatial distribution and long-term change of GST–SAT over China is meaningful for characterizing the distribution and change characteristics of surface sensible heat flux, which in turn is important for understanding the mechanisms of climate change and variability and improving regional climate prediction skills.
Some researchers have investigated the distribution and variation of GST–SAT in a few regions of China mainland. For example, Zhang et al. [25] found that the GST–SAT in the Qinghai-Tibet Plateau (QTP) had an obvious zonal distribution from northwest to southeast, and had a quasi-two-year periodic oscillation. Based on the EOF decomposition, Fan et al. [24] discussed the distribution types of GST–SAT in the arid region of Northwest China. Previous studies also discovered that the GST–SAT in the arid and semi-arid regions of Northwest China had a quasi-periodic oscillation and interdecadal variability [26,27]. A dramatic increase in the GST–SAT in northern China (north of 40° N) in winter since 2005 was observed by Wang et al. [28]. They believed that this trend of GST–SAT was related to the increase in winter snow depth in northern China in recent decades. However, Liao et al. [29] pointed out that automatic weather station (AWS) observation has been generally adopted in place of manual observation in China’s national meteorological stations since 2005. Due to the different technical specifications of observation, the ground surface temperature observed by AWS is higher than that observed by the traditional manual observation. Therefore, the abnormal increase of GST–SAT in northern China in winter may have been caused by the inhomogeneity of observation data. Based on the homogenized GST and SAT data from less than 700 national stations, Shi and Chen [30] found that except for a significant upward trend in spring, the GST–SAT showed a downward trend in the other three seasons in China during the last decades, which was different from the previous research results [28,29].
Some researchers have used reanalysis data, such as ERA-5, to discuss the spatiotemporal patterns of land surface-air temperature differences around the global scale. There is some variation in the results obtained from different datasets. During 2001–2016, the global land surface-air temperature difference exhibited decreased trend, especially in northern South America [31]. The highest mean land surface-air temperature difference values from 1981–2019 are mainly distributed in West Asia, Northern Africa, and Australia, and the lowest values are mainly located in Greenland. The areas with significantly increasing land surface-air temperature difference areas are mainly distributed in the Western United States, Northern Argentina, Southwest China, and Central Africa. The significantly decreased areas are mainly located in Northwestern North America, East Asia, and South Africa [32].
Different properties of the surface and near-surface atmosphere including soil moisture, vegetation, snowpack, and atmospheric vapor content will affect GST–SAT. For example, the effect of soil moisture on GST–SAT shows a non-linear relationship due to the different background values of soil moisture and temperature [32]. The variation of net radiation with latitude mainly determines the global spatial heterogeneity of GST–SAT. As the snowpack increases, the high albedo of the snowpack leads to a decrease in GST, and thus to a decrease in GST–SAT [33].
In some of the previous studies on the spatiotemporal variations of GST–SAT in China mainland, the results may be biased due to the inhomogeneity of observation data. Although Shi and Chen [30] used the homogenized data to analyze the variation characteristics of GST–SAT, the meteorological station data they used only include 686 stations, and their conclusions obtained were somewhat different from other previous studies. At present, therefore, there is still a lack of sufficient understanding of the climatological characteristics and long-term variation of GST–SAT in China. In this study, the multi-scale spatial and temporal characteristics of GST–SAT in China mainland and some of its possible influencing factors are studied by using the updated homogenized GST and SAT data at the national stations of more than 2000. The high-density observational network and the improved homogenized GST and SAT data will help deepen the understanding of GST–SAT climatology and trends in the country. This study focuses on long-term trend characteristics since 1961, which we hope to provide new reference information for researchers in the fields related to hydrological climate, land-atmosphere interaction, and climate models.

2. Data and Methods

2.1. Data

This study uses the homogenized monthly GST [34] and SAT [35] data from 2400 meteorological stations in China provided by the National Meteorological Information Center (NMIC), China Meteorological Administration (CMA). Significant inhomogeneities exist in the GST data series due to the transition from manual meteorological stations to AWS around 2003 in China mainland, and homogenization of the data is necessary. Homogenization has been conducted by the NMIC [34]. At Miyun station of Beijing and Wuhan station, for example, data breakpoints occurred around 2004 and 2009 respectively due to the instrumentation, and the time series of annual mean GST have significant differences before and after homogenization (Figure 1). The data homogenization takes into account the influence of non-climatic factors such as observation instrument replacement, station relocation, and abrupt changes in the surrounding environment of the stations. The homogenized SAT and GST historical data from the high-density observational stations can better represent the long-term variation of GST–SAT.

2.2. Methods

Considering the continuity and integrity of the data, this study selects the warm season (April to October) from 1961 to 2018 as the research period and selects the records of 2171 stations having both GST and SAT with no missing record for more than 30 consecutive years as the research data. The reason to analyze the warm season GST–SAT change is that, although the homogenization has been completed for the instrumentation change from manual to AWS around 2005, there are still some problems with the homogeneity of GST data during winter due to the tremendous change in the observational specification, and also the warm season is the period when the most active interaction between the land surface and low-layer atmosphere occurs in a year. There is snow cover in the three major snow areas of China (northern Xinjiang province, northeast China and the Qinghai-Tibet Plateau) in April and October, but the number of snow days and snow depth are small, and it may affect the homogenization of the data at the end months of the warm-season [36,37,38]. We selected 15, 11, and 15 stations in the northern Xinjiang province (>45° N), the northernmost part of northeast China (>50° N), and the eastern Qinghai-Tibet Plateau (32–36° N; 96–102° E), respectively, to evaluate the possibly remaining breakpoints in the data series at both ends of the warm-season. We found no inhomogeneity in the homogenized GST data series of April and October for the selected stations in the three major snow cover regions of China (Figures S1–S3 in Supporting Information S1). This indicates that homogenization eliminates the impact of the transition from manual meteorological stations to AWS in the colder end months of the warm season due to accidental snowfall [34].
When analyzing the factors including altitude (ALT), sunshine duration (SSD), precipitation (PRE), and relative humidity (RH) affecting the GST–SAT, the same-length monthly data of sunshine duration, precipitation, and relative humidity provided by the NMIC are also used in this paper. These observational data are obtained from the same stations with the GST and SAT, among which the monthly precipitation and relative humidity data have been homogenized in the NMIC. All of these station data we used are quality controlled by the NMIC before homogenization.
The warm season is further divided into three stages: mid-late spring (April-May, AM), summer (June-July-August, JJA), and early-mid autumn (September-October, SO). We analyze the spatial and temporal distribution characteristics of GST–SAT in the whole warm season and the three different stages. To better understand the various characteristics of GST–SAT in different regions, China’s mainland is divided into six sub-regions (Figure 2) referring to the zoning methods of Wang and Zuo [39] and You et al. [40]. The methods originally referred to the climate and natural zones of China divided by the Chinese Academy of Sciences in the 1980s. Region-averaged values of basic climate elements and urbanization levels for each sub-region are given in Table 1. Climatological means in the table are the averages of the monthly means for SAT and relative humidity, and of the warm season accumulated values for precipitation, in the period of 1961–2018. The urbanization level is calculated by using the method proposed by Tysa et al. [41]. They classified all national stations (2400) into six levels and assigned values from 1 to 6, with larger values indicating higher levels of urbanization. The largest values of SAT, precipitation, and relative humidity all appear in South China; the smallest regional averages of SAT occur in the Qinghai-Tibet Plateau and Northeast China and of precipitation and relative humidity in Northwest China. Northeast China and Central China see the highest urbanization levels.
There is a great difference in the coverage of meteorological stations in eastern and western China. To reduce the influence of the spatial heterogeneity of station distribution and the altitude differences of stations on the analysis results, the method of grid area-weighted average [42] is used. We divide China’s mainland into 2° × 2° grids to ensure at least one station in each grid and use anomaly time series to calculate the mean trend, which can reduce the influence of spatial heterogeneity of stations on the estimates of the trends. The climate reference period for calculating the anomaly is the entire period analyzed (1961–2018). The arithmetic average of the observed data anomaly of all stations in each grid is taken as the grid anomaly value, and Formula (1) is used for the area-weighted average to obtain the regional average warm-season mean anomaly value.
T = i = 1 n cos φ i T i i = 1 n cos φ i
where T is the regional average temperature, n is the number of grids, φ i is the center latitude of the grid-box, and T i is the arithmetic mean of each grid box. If the grid value is missing, the grid does not participate in the calculation of the weighted average. For the 2171 stations we used for the analysis, the data after the 1980s is basically complete, but there are some missing ground surface temperature data before the 1980s in Sichuan and Fujian Provinces (Figure S4 in Supporting Information S1). Due to the large samples of the observations, and the standard calculation methods for regional mean, the missed records will not significantly affect the analysis results.
The data series of monthly mean GST–SAT basically follows the Gaussian distribution. The changing trend of GST–SAT is calculated by the least square method, and the significance of the linear trend is tested by using the student t-test. When the linear trend of GST–SAT passes the statistical test at p < 0.05 and p < 0.01 levels, it is considered to be significant at the 95% and 99% levels, respectively.

3. Results

3.1. Spatial Distribution

Figure 3a displays the spatial distribution of GST–SAT in the warm season in China mainland over the period 1961–2018. It can be seen that the GST–SAT varies with geographic location, and the spatial pattern is generally high in the west and low in the east. This result is consistent with those obtained by Liao et al. [29] who applied a subset of the temperature data used in this study. In most areas of western China, especially west of 100° E, the GST–SAT is above 4.0 °C (the average value in China mainland is 3.9 °C (Table 2)), while it is below 4 °C in most areas of the Eastern Monsoon Region. The high-value centers of GST–SAT are mainly in the QTP and southwest Xinjiang Province, and the low-value areas are in the three Northeastern China provinces, the Sichuan Basin and its southwest side, northern Xinjiang Province, and parts of the coastal zone. The spatial characteristic in mid-late spring and summer (Figure 3b,c) is similar to that in the whole warm season. The high-value centers of GST–SAT in mid-late spring are located in the QTP and southern Xinjiang Province. The areas with GST–SAT below 2.0 °C are mainly in southern and southwestern Central China. In summer, the GST–SAT is mostly greater than 3.0 °C, and the high-value centers of GST–SAT are mainly in the QTP, southern and western Xinjiang Province. Compared with GST–SAT in mid-late spring and summer, the temperature difference in early-mid autumn (Figure 3d) is lower, and the areas with values above 4.0 °C mainly appear in the QTP and South China, in particular along the Himalayan Mountains. The zonal distribution of GST–SAT in early-mid autumn is more obvious, characterized by a decrease with increasing latitude, with most of the low-value areas located north of 40° N. In addition, the GST–SAT in the Sichuan Basin and the Bohai Bay area is also lower than 2.0 °C. The average GST–SAT in China mainland is the highest in summer, followed by mid-late spring and early-mid autumn (Table 2).

3.2. Temporal Variations

Figure 4a shows temporal variations of the warm season mean GST and SAT, and their difference (GST–SAT) in China mainland during 1961–2018. Overall, the GST and SAT both exhibit wavelike rising trends, and the rises are obviously more significant after the early 1990s. They have a highly synchronous interannual variability [43,44,45]. Since the rising trend of GST is greater than that of SAT, the GST–SAT anomaly shows an increasing trend throughout the study period. The increasing trend is 0.04 °C/10yr. The temporal variations of GST–SAT in mid-late spring, summer, and early-mid autumn are displayed in Figure 4b–d. It can be seen that the trends of seasonal GST–SAT in China are similar to that in the whole warm season, with each of them showing an increasing trend. However, the magnitude of the increase in each season is different. The rising trend in mid-late spring is most significant, reaching 0.10 °C/10yr, followed by early-mid autumn and summer. All linear trends in Figure 3 pass the 99% confidence test, except that the trend of GST–SAT in summer only passes the 95% confidence test (Table 2). It can be seen from the figure that the ground surface temperature and surface air temperature fluctuated greatly in the mid-late spring of 2010 and the summer of 1976. In the spring of 2010 and the summer of 1976, the abnormal low temperature in Northeast and North China caused low-temperature disasters, so the mean temperature was low and fluctuated greatly [46,47].
According to the year-month profile of the monthly mean GST–SAT anomaly in the warm season (Figure 5), the whole study period can be roughly divided into three sub-periods: 1961–1980, 1980–2000, and after 2000. In general, the GST–SAT is mainly negative in the first and third stages. The negative anomaly in the first stage is mainly in mid-late spring and early summer (between April and June). There is an obvious positive anomaly center in this stage, which occurs in August and September in the middle and late 1960s. The negative anomaly in the third stage, however, is mainly in summer and early-mid autumn (from June to October), and the negative anomaly in mid-late spring of the first stage is replaced by a positive anomaly. In the second stage, the GST–SAT is usually positive, and the center of the positive anomaly is mostly in late summer (late July to August). During the whole period of 1961–2018, the GST–SAT in mid-late spring (April-May) is relatively low in the early period and begins to increase after the late 1970s to early 1980s. It can be also seen that the GST–SAT from June to October increases first and then decreases, with the greatest changes in late July and August, and the mid-late spring GST–SAT does not show a decrease after it increases since the early 1980s.
Figure 6a presents the spatial distribution of the linear trends of GST–SAT in the warm season. For the warm season, the areas where the GST–SAT increases significantly are mainly in the northern region of China, western QTP, and southern Sichuan Province. The most obvious area of GST–SAT increase is in southeastern Xinjiang Province, with an increasing trend of more than 0.4 °C/10yr. The regions where the GST–SAT decreases significantly in the warm season are mainly in southeastern QTP, parts of the southeastern coastal zone, and parts of Central China. In general, the GST–SAT decreases in southern China and increases in northern China. The GST–SAT increases in the northernmost regions of China mainland, because of the more rapid warming rate of GST than that of SAT. In the southern regions, the warming trend of GST is generally less than that of SAT, resulting in a downward trend in GST–SAT. In mid-late spring (Figure 6b), the GST–SAT shows an increasing trend in most areas of China, but the regions that pass the significance test are dominantly in the north. The center of the positive trend is located in southeastern Xinjiang Province. The regions where the GST–SAT decrease is mainly in northern Xinjiang Province, eastern QTP, parts of the North China Plain, and the southern coastal areas. In summer and early-mid autumn (Figure 6c,d), the region where the GST–SAT increase is also mainly in the north, and the positive center of linear trend is the same as that in mid-late spring; the GST–SAT decreases in the southern region, especially in the southeastern coast of China. The mean GST–SAT in China mainland increases the most in mid-late spring because of the stronger warming in GST than SAT in most areas of China in the season compared with in summer and early-mid autumn.
The intra-seasonal variation of the monthly mean GST–SAT in China mainland displays a single-peak curve (Figure 7a), with the maximum value occurring in July at 4.17 °C. The time when the GST–SAT reaches its maximum differs in different sub-regions. The maximum GST–SAT is in May in the QTP, June in the northern sub-regions (Northwest China, Northeast China, and North China), August in Central China, and July in South China. Among the six sub-regions, Northwest China has the largest intra-seasonal variation, and its maximum value is the largest, reaching 6.5 °C. The GST–SAT reaches its maximum in the northern regions earlier than that in the southern regions.
Figure 7b shows the intra-seasonal (April-October) variation of linear trends of the GST–SAT in China mainland and its sub-regions. For China mainland, the linear trend variation is characterized by an asymmetrical “v” type, showing a maximum linear trend in April, decreasing first, and then increasing after reaching the minimum in August. The variation in the southern sub-regions (QTP, Central China, and South China) is similar to China mainland, with minimum values in July or August. The variation in trend in the three northern sub-regions, however, is different, with the linear trend in Northeast China and North China having the maximum in April and minimum in October, and that in Northwest China the maximum in May and the minimum in August. The GST–SAT trends in the southern regions and the QTP are negative in most months of the warm season.
From the perspective of the trends of GST–SAT in the six sub-regions (Figure 8), the warm-season GST–SAT in the north of China, including Northwest China, Northeast China, and North China shows a remarkable increase. Among the three regions, Northeast China has the largest increasing trend in the warm-season GST–SAT. While in Central China and South China, the warm-season GST–SAT decreases, and the decreasing trend in South China is more obvious than that in Central China. The warm-season GST–SAT in the QTP on the whole has no apparent change during the entire study period. In general, the warm-season GST–SAT increases in northern regions and decreases in southern regions. The decrease of GST–SAT in the south is much smaller than its increase in the north, so on average, the mean GST–SAT in the warm season in China mainland shows an overall increasing trend (Figure 4a).
There are obvious differences in the trends of seasonal GST–SAT in the six sub-regions. In mid-late spring, except for South China, the GST–SAT increases significantly in the other five sub-regions, with the increasing trend in Northwest China and Northeast China being more significant. In summer, the GST–SAT increases significantly in the northern sub-regions, with the largest increase in Northeast China; significant decreases are seen in the southern sub-regions, with the largest reduction in Central China. Early-mid autumn sees a significant increase in Northwest China and a significant decrease in South China and Central China. For the northern sub-regions where GST–SAT increases in each season, the increasing rate is the largest in mid-late spring and the smallest in early-mid autumn; for the southern sub-regions, however, the GST–SAT increases in mid-late spring but decreases in summer and early-mid autumn. Since the GST–SAT in mid-late spring generally increases in every sub-region, the increasing trend of average GST–SAT in China mainland in the season is the largest. In summer and early-mid autumn, however, the GST–SAT slightly decreases in the southern sub-regions but greatly increases in the north, so the average GST–SAT in China mainland in the two seasons shows a weaker increasing trend (Figure 4).

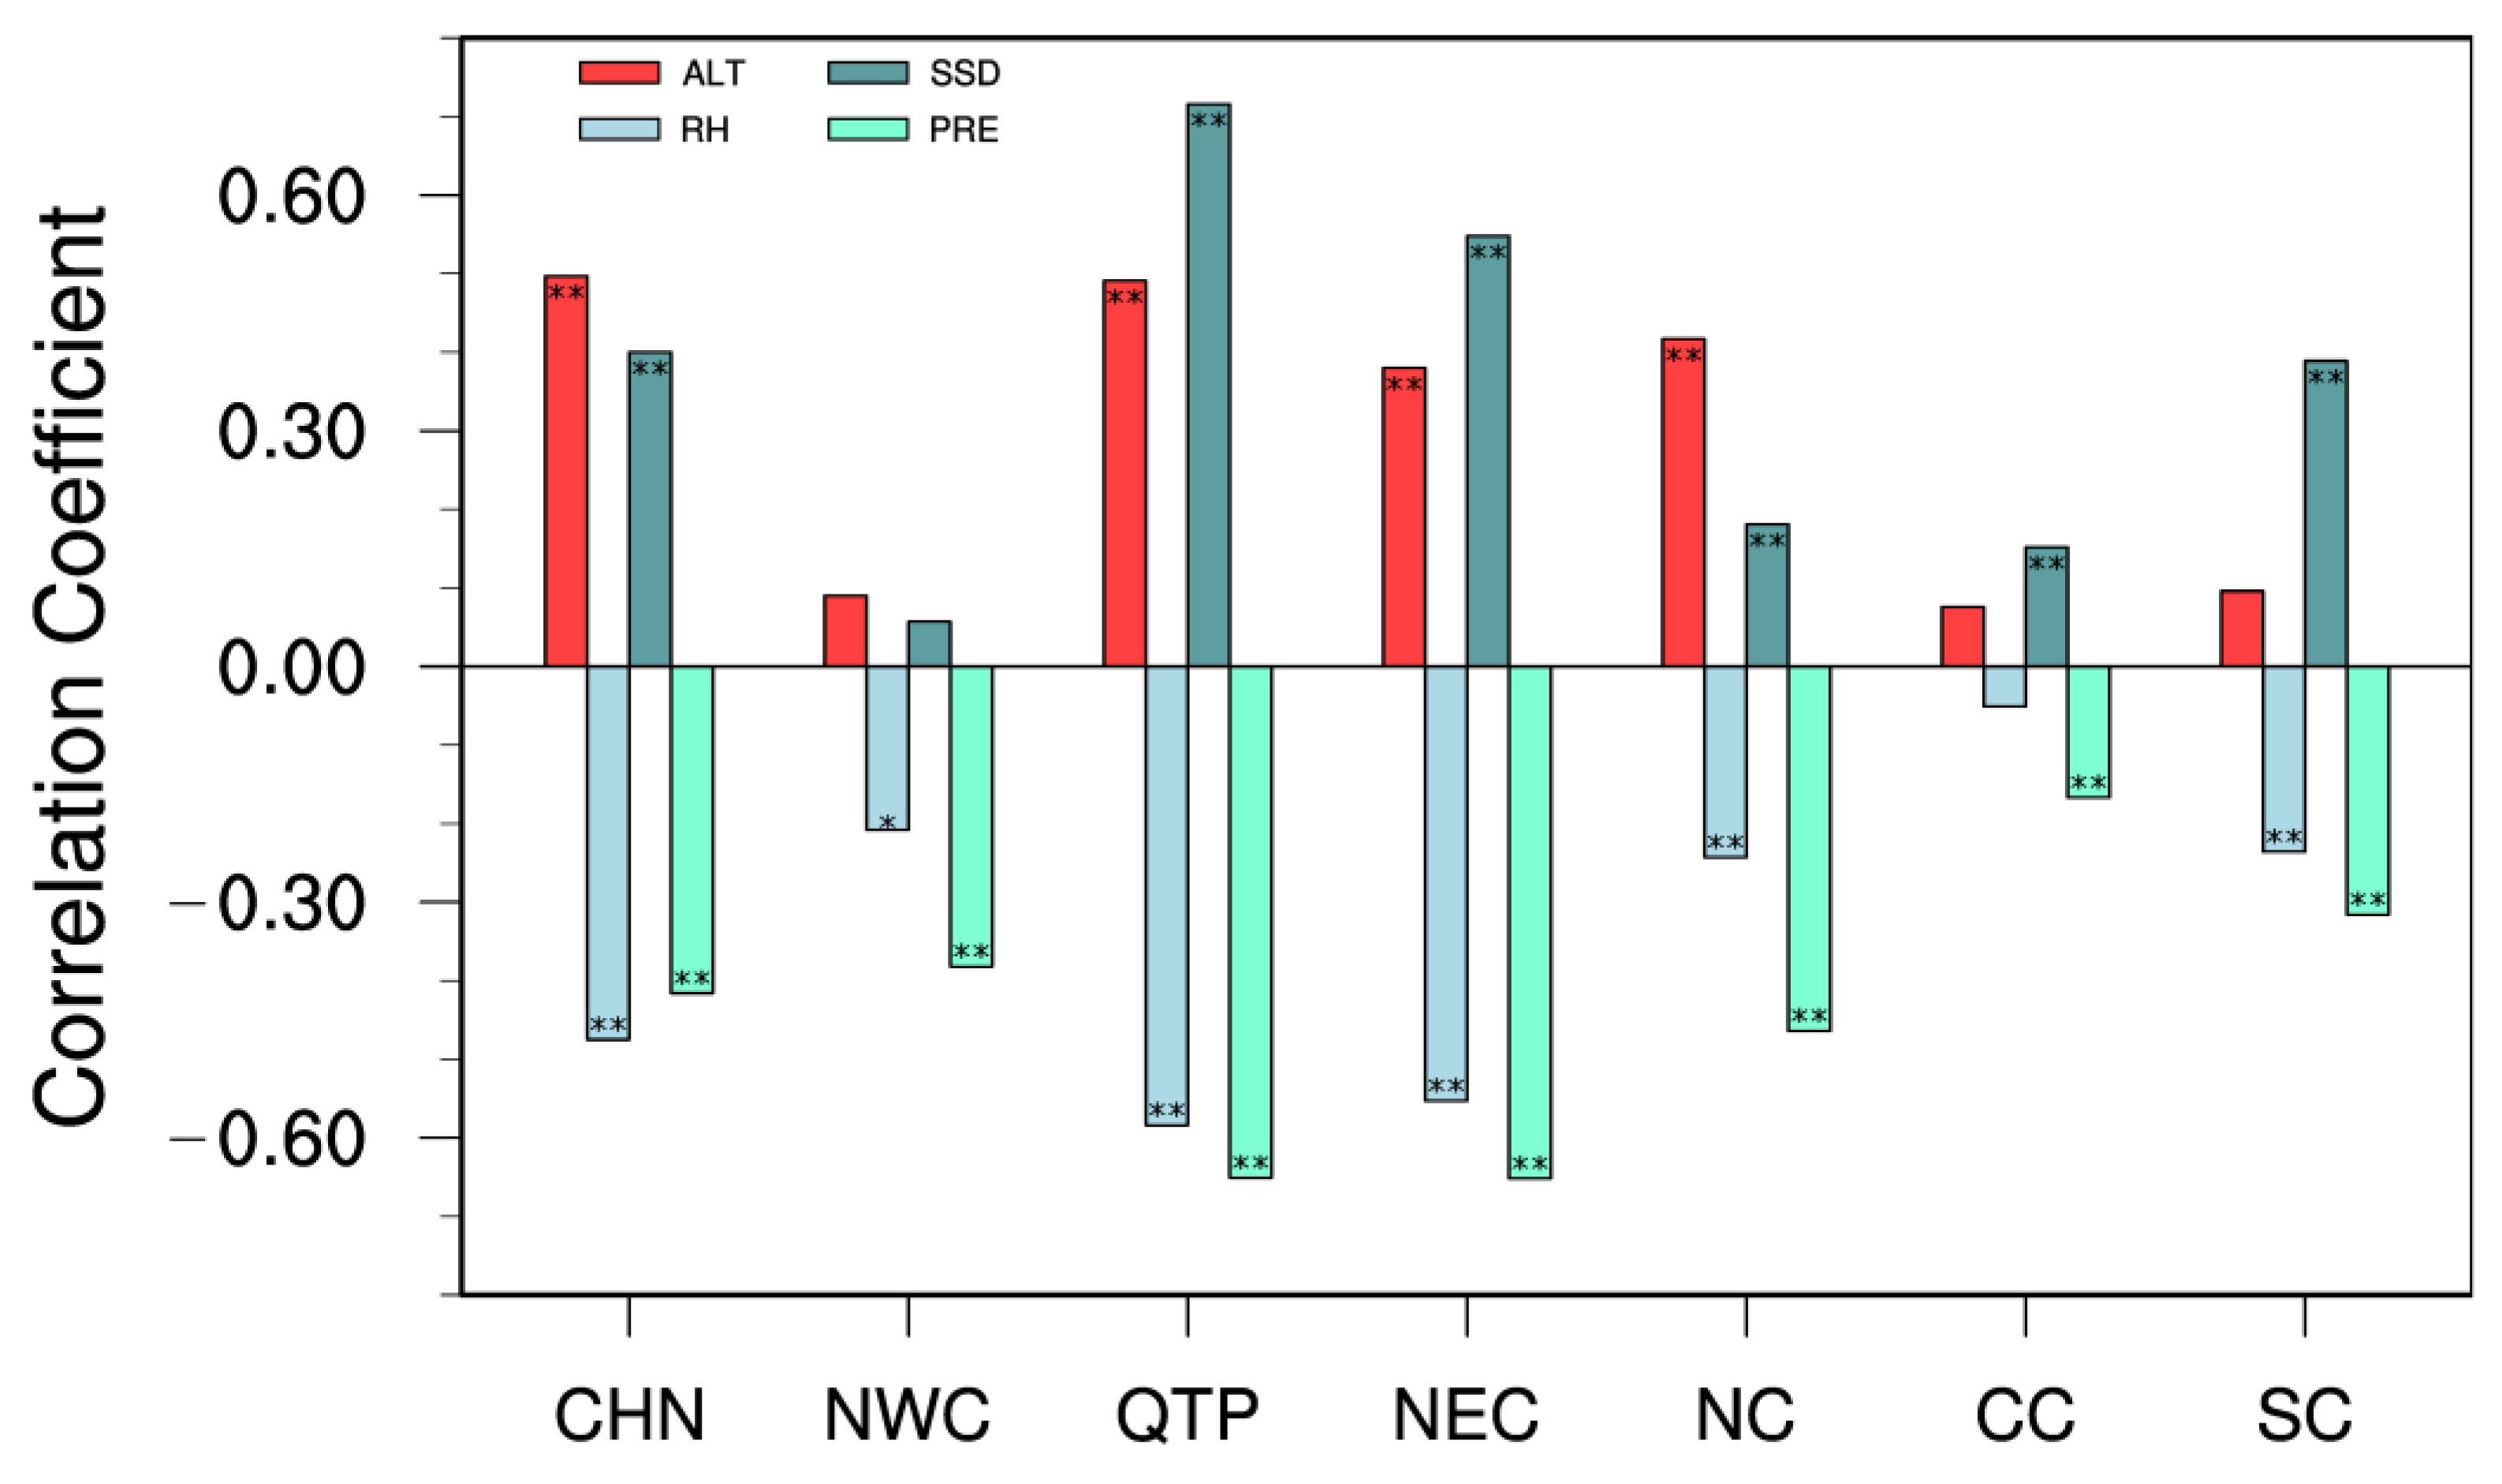
3.3. Possible Factors Affecting GST–SAT

In Section 3.1 and Section 3.2, we have analyzed the main climatological characteristics and the long-term trends of the warm-season GST–SAT difference in China mainland. The main causes or drives of the tempo-spatial pattern and trends of GST–SAT are beyond the scope of this paper, and they need further investigation. However, here we make a brief analysis of the altitude and some climatic factors that may affect the GST–SAT. The climatic factors include warm-season sunshine duration, relative humidity, and precipitation. The reason why we choose climatic factors is that they are obtained from observation and the long time series data at the same time period are available. All four factors are physically related to the GST–SAT through surface radiation and energy balance. Although relative humidity and precipitation are not independent, they are somewhat different in that relative humidity describes mainly the humid condition of the air, while precipitation can affect not only the near-surface air moisture but control the soil moisture and energy balance. Therefore, they are treated as two independent variables in the analysis.
Figure 9 shows that the GST–SAT in the warm season is significantly positively correlated with the altitude and sunshine duration and is significantly negatively correlated with relative humidity and precipitation. That is to say, the higher the altitude, the longer the sunshine duration, the larger the GST–SAT, and the larger the relative humidity and precipitation, the smaller the GST–SAT.
The explanation for the correlations is easily understandable. The higher the altitude, the shorter the distance that the solar radiation passes through the atmosphere, the smaller the solar radiation attenuation by the atmosphere, mainly due to the less scattering and absorption by the air molecules and aerosols, and the larger the solar radiation received on the surface [48,49,50], which is conducive to the increase of ground surface temperature, leading to a higher GST–SAT. In addition, the air temperature decreases with the increase of altitude, and the surface air temperature in high altitude areas is low due to the sustained replenishment by cold air advection, which is also beneficial to the larger GST–SAT in the altitude areas.
Water vapor, as an important greenhouse gas in the atmosphere, can make the atmosphere absorb heat and increase the surface air temperature [51]. When the moisture content of the atmosphere is higher (higher relative humidity), more heat is absorbed by the low-layer atmosphere, thus reducing the difference between the GST and SAT. In addition, water in the air is the only component that can undergo phase change within the range of atmospheric temperature variations. The process of phase change in water is accompanied by the absorption and release of latent heat, which can cause the transfer of heat, thus affecting the air temperature change. When precipitation occurs, the water content of the soil and the near-surface atmosphere will increase. The rising soil moisture will increase the surface evapotranspiration, which will raise the latent heat flux and lower the sensible heat flux [52], as a result of the decreased ground surface temperature and the increased surface air temperature, leading to a drop of GST–SAT. In addition to the influence of precipitation on soil moisture, changes in precipitation affect cloud cover, and clouds are very important for the earth’s surface radiation and energy balance [53]. Low cloud covers resulting from the low regional precipitation may have a net cooling or warming effect on the surface climate [54], differentially affecting the GST and SAT. These need to be further investigated in the future.
Regardless of whether it is in China mainland as a whole or each sub-region (Figure 2), the GST–SAT is positively correlated with altitude and sunshine duration, and negatively correlated with relative humidity and precipitation (Figure 10). However, there are certain differences in the correlations between the GST–SAT and the four factors among the sub-regions, which may be related to the properties of the varied underlying surface in different regions. The strongest correlations appear in the Qinghai-Tibet Plateau and Northeast China, and the weakest ones occur in Northwest China, Central China, and South China, with a few (mostly with altitude) not statistically significant due to the relatively flat landforms.

4. Discussion

4.1. GST–SAT

In this paper, we used a homogenized GST dataset with the stations selected from all of the national station networks to analyze the climatological characteristic and long-term trends of GST–SAT in China mainland. The new high-quality data used should significantly improve the reliability of the analysis results, especially of the calculated linear trends, which is the major focus of this work.
To illustrate the improvement, we conduct a comparative analysis of the linear trend of GST–SAT using the data before and after homogenization, and from 2171 stations and 775 stations. By calculation, the GST–SAT both before and after homogenization showed a significant increasing trend in the warm season, but the trend obtained with the data before homogenization [28] showed a greater trend than that obtained with the data after homogenization. Overall, the trend of GST–SAT calculated with the homogenized data is 0.02~0.03 °C/10yr lower than the trend calculated with the non-homogenized data (Table 3). The cause for the difference needs to be investigated, but it may be related to the transformation from a manual to an autonomous weather station system in China around 2003, which has led to a large positive bias in GST after the instrumentation change. Therefore, using the homogenized data can better describe the spatial and temporal characteristics of GST–SAT, and is also more confident in the detection of regional GST and SAT change.
Previous studies on the GST–SAT mostly focused on the Qinghai-Tibet Plateau and the arid and semi-arid northwestern China [25,26], and the time of these studies focused on the middle and late 20th century. Our research used homogenized data to focus on the change of GST–SAT in the warm season in China mainland in the last 60 years. A remarkable change or regional warming slowdown occurred in the period since 1998 (2000) [55]. The updated analysis of the whole China mainland using homogenized data would be also relevant to understand the new features of regional climate change. Wen et al. [27] compared and analyzed the GST–SAT differences between southeastern and northwestern China, but did not cover the whole of China. In this paper, we divided the country into six sub-regions and compared the GST–SAT differences among sub-regions. The comparison reveals some obvious differences in GST–SAT among these regions.
Liao et al. [29] used quality-controlled but non-homogenized data from more than 800 meteorological stations, and they showed a rising trend of 0.06 °C/10yr for the GST–SAT from April to October. In our analysis, we obtained a 0.04 °C/10yr arising rate using the homogenized data from 2400 stations in the country. The results of this study suggest that the increasing trend of the GST–SAT is substantially lower, mainly due to the correction of the positive bias in the GST data.
The trend of GST–SAT obtained by Shi and Chen [30] using the homogenized data of 800 stations is different from the previous study. They indicated that the GST–SAT only increases in spring, but decreases in all other seasons, and also decreases on average for the whole of China mainland. This is also different from our analysis and the previous studies. Our results show that the GST–SAT in the warm season shows an increasing trend, and the average GST–SAT of China mainland also increases slightly in summer.
We also found that, in the previous studies on GST–SAT changes in China mainland, the absolute value of the GST–SAT is used directly to calculate the change trend. However, due to the great difference in the numbers and density of eastern and western stations and the great difference in altitude and other geographical characteristics, the GST–SAT trend calculated in this way has a large uncertainty. It is more reasonable to use the method of anomaly and grid area-weighted average in a large region with complicated topographical features [42]. We used a calculated method of temperature anomalies and longitude*latitude grid area-weighted average to obtain regional averaged GST and SAT time series, and then to derive the linear trends of warm-season mean GST–SAT. This method guarantees as high as possible accuracy of the estimates.
Observation of ground surface temperature is available in only a few countries, and observation data are temporarily unavailable. Therefore, studies on GST–SAT have mainly focused on the Chinese region. Jiang et al. [32,33] used ERA-5 reanalysis data to discuss global land surface-air temperature differences. They found that the mean land surface-air temperature difference showed an increasing trend on the eastern QTP and in northern China and eastern Inner Mongolia. This increasing trend was greater in the eastern Tibetan Plateau in spring and in northern China and eastern Inner Mongolia in summer, which is significantly different from our results. This may be due to the different time periods of different studies. Moreover, the surface temperature from the reanalysis data is somewhat different from the observed surface temperature. The observed surface temperature is the 0 cm soil temperature (Ground surface temperature), while the surface temperature in ERA-5 is the skin temperature (The skin temperature is the theoretical temperature that is required to satisfy the surface energy balance). The difference between the observed surface temperature and satellite remote sensing surface temperature is a question worthy of further study.

4.2. Influencing Factors of GST–SAT

The change of GST–SAT is determined by changes in ground surface temperature and surface air temperature. Since the exchange of energy and moisture between the land surface and the atmosphere is affected by surface conditions [56,57,58,59] and climate change [60,61]. Precipitation replenishes soil moisture and causes strong evaporative cooling, which hinders the rise in surface temperature [52,62]. Changes in land use type and vegetation cover will cause changes in surface albedo and atmospheric water vapor, which in turn will affect changes in ground surface temperature and air temperature [31,63]. There are complex interactions and connections between the land surface and atmosphere, so there are many factors that affect the GST–SAT and its change with time.
The changes in GST–SAT may be also related to near-surface wind speed, surface evaporation, changes in the surface environment, or changes in greenhouse gases and aerosols in the atmosphere [64,65,66,67]. Changes in aerosol and cloud cover will directly affect solar irradiance. When aerosols decrease (increase), solar irradiance increases (decreases), and surface temperature increases (decreases). On the other hand, snow or seasonally frozen soil [14,68] in winter may also affect the variation of GST–SAT.
Other possible influential factors, including the variation of soil moisture content, atmospheric circulation (such as sea level pressure field or wind speed), and varied-scale land use and land cover change, should also be further investigated. Among these, the local anthropogenic activity such as urbanization and training of wetlands near the observational sites may have played a role. The warm season GST–SAT trends are the largest in Northeast China and Northwest China, and the smallest in South China and the Qinghai-Tibet Plateau (Figure 8). A preliminary analysis shows significant increases in annual mean GST–SAT at urban stations relative to rural stations in a few areas of eastern China and northeastern China. The average urbanization level in Northeast China is also among the largest ones in the country, and that of the Qinghai-Tibet Plateau is the lowest (Table 1), indicating a possible association of the GST–SAT trends with the urbanization levels around the observational stations. Urbanization may have differentially affected the heating of surface and near-surface air through the changed surface energy flux, and thus lead to an increased trend in GST–SAT at urban stations. In the future, we will conduct further and more comprehensive research on the possible influence of the urbanization effect.
In addition to the possible influence of urbanization on the observed GST–SAT trends, the larger increase in the warm season GST–SAT over the north than the south also implies a role played by changes in climate and geographical conditions. For example, it was well known that the north including Northeast China and Northwest China widely experienced a more rapid climate warming during the last 50–60 years [35,55,69]. Our analysis result in this study indicates an asymmetric warming of GST and SAT in the north, with the GST seeing a more rapid increase than the SAT. What has caused the differentiated increase in GST and SAT at the observational stations of northern China compared to those of southern China deserves further investigation.
Although the causes of the observed pattern and change of GST–SAT are not studied in more depth, the analysis results reported in this paper would be of reference to a further understanding of the large-scale land-atmosphere interaction. In particular, the extremely high climatological means of GST–SAT in the Qinghai-Tibet plateau and the northwestern deserts in mid-late spring and summer, and the significant increase in the warm-season GST–SAT and the resulting upward trend of the sensible heat flux in most regions of the country, as shown in the analysis, would be relevant for addressing the scientific issues such as the formation and change of regional surface climate pattern in China mainland.

5. Conclusions

In this study, the spatial-temporal distribution characteristics and long-term trend of GST–SAT in the warm season in China mainland are analyzed by using homogenized GST and SAT from high-density meteorological stations during 1961–2018. The main results of this study are as follows.
(1) During 1961–2018, the GST–SAT in the warm season presents a high value in the west and a low value in the east, with the Qinghai-Tibet Plateau and the northwestern deserts having the largest warm-season mean GST–SAT. On average, the GST–SAT in China is the greatest in summer, with the maximum monthly value occurring in July. The GST–SAT reaches its maximum in the northern regions earlier than that in the southern regions.
(2) The warm-season GST–SAT in China mainland shows a significant rising trend of 0.04 °C/10yr (p < 0.01) during the whole period of 1961–2018. The regions where the GST–SAT increases in the warm season are mainly in the northern regions, especially in southeastern Xinjiang Province. The rising trend in spring is most significant, reaching 0.10 °C/10yr (p < 0.01), followed by autumn and summer. The GST–SAT in the southern regions shows a weak decreasing trend, with significant decreases occurring in southeastern QTP and parts of the southeastern coastal zone.
(3) The smallest increase in GST–SAT over China mainland is in August. The intra-seasonal variation of GST–SAT trends between the northern and southern regions is significantly different. The linear trends for all months in the northern are greater than zero, while most of the trends in the southern regions and the QTP are negative. The intra-seasonal variation in the northern and southern regions has one thing in common: the increasing trend of GST–SAT is greatest in April (May).
(4) The warm-season mean GST–SAT increases in Northwest China, Northeast China, and North China, and decreases in South China and Central China. The change of GST–SAT in the QTP is not large and significant. No matter which region it is, the increasing trend of GST–SAT in mid-late spring is the largest. The increasing trend of GST–SAT is generally the smallest in early-mid autumn.
(5) The warm-season mean GST–SAT is significantly positively correlated with altitude and sunshine duration with correlation coefficients of 0.50 and 0.40 (p < 0.05), and significantly negatively correlated with relative humidity and precipitation with correlation coefficients of −0.48 and −0.42 (p < 0.05), in the country on a whole in the analysis period.

Supplementary Materials

The following supporting information can be downloaded at: https://www.mdpi.com/article/10.3390/land12051057/s1, Figure S1: The GST time-series after homogenization at 15 stations in the eastern Qinghai-Tibet Plateau (32–36° N; 96–102° E) in April and October; Figure S2: The GST time-series after homogenization at 15 stations in the northern Xinjiang province (>45° N) in April October; Figure S3: The GST time-series after homogenization at 11 stations in the most northern of northeast China (>50° N) in April and October; Figure S4: Spatial distribution of observation stations (Red dots indicate both GST and SAT data, blue dots indicate only SAT data without GST data).

Author Contributions

Conceptualization, methodology, formal analysis, investigation, resources, data curation, Y.L. and G.R.; software, validation, writing—original draft preparation, Y.L.; writing—review and editing, supervision, project administration, funding acquisition, G.R. All authors have read and agreed to the published version of the manuscript.

Funding

This study is supported by the National Key Research and Development Program of China (2018YFA0605603).

Data Availability Statement

The data sets of meteorological stations are provided by the NMIC, CMA, and the data cannot be provided or made public in accordance with national laws. However, the grid data will be available at the research group website (http://www.rengy.org/ accessed on 9 May 2023) after the paper is published.

Acknowledgments

We appreciate the technical assistance from Wenhui Xu, NMIC, CMA, in preparing this manuscript.

Conflicts of Interest

The authors declare no conflict of interest.

References

  1. Dickinson, R.E. Land Surface Processes and Climate—Surface Albedos and Energy Balance. Adv. Geophys. 1983, 25, 305–353. [Google Scholar]
  2. Bonan, G.B. Forests and climate change: Forcings, feedbacks, and the climate benefits of forests. Science 2008, 320, 1444–1449. [Google Scholar] [CrossRef] [PubMed]
  3. Matsumura, S.; Yamazaki, K.; Tokioka, T. Summertime land-atmosphere interactions in response to anomalous springtime snow cover in northern Eurasia. J. Geophys. Res. Atmos. 2010, 115, D20107. [Google Scholar] [CrossRef]
  4. Xue, Y.K.; Juang, H.M.H.; Li, W.P.; Prince, S.; DeFries, R.; Jiao, Y.; Vasic, R. Role of land surface processes in monsoon development: East Asia and West Africa. J. Geophys. Res. Atmos. 2004, 109, D03105. [Google Scholar] [CrossRef]
  5. Siemann, A.L.; Chaney, N.; Wood, E.F. Development and Validation of a Long-Term, Global, Terrestrial Sensible Heat Flux Dataset. J. Clim. 2018, 31, 6073–6095. [Google Scholar] [CrossRef]
  6. André, J.C.; Goutorbe, J.P.; Perrier, A. HAPEX—MOBLIHY: A Hydrologic Atmospheric Experiment for the Study of Water Budget and Evaporation Flux at the Climatic Scale. Bull. Am. Meteorol. Soc. 1986, 67, 138–144. [Google Scholar] [CrossRef]
  7. Sellers, P.; Hall, F.; Ranson, K.J.; Margolis, H.; Kelly, B.; Baldocchi, D.; den Hartog, G.; Cihlar, J.; Ryan, M.G.; Goodison, B.; et al. The Boreal Ecosystem–Atmosphere Study (BOREAS): An Overview and Early Results from the 1994 Field Year. Bull. Am. Meteorol. Soc. 1995, 76, 1549–1577. [Google Scholar] [CrossRef]
  8. Tao, S.Y.; Chen, L.S.; Xu, X.D. Theoretical Research Progress of the Second Atmospheric Science Experiment on the Qinghai-Tibet Plateau; China Meteorological Press: Beijing, China, 1999. (In Chinese) [Google Scholar]
  9. Zhang, Q.; Huang, R.H.; Wang, S.; Wei, G.A.; Cao, X.Y.; Hou, X.H. NWC-ALIEX and its research advances. Adv. Earth Sci. 2005, 20, 357–362. (In Chinese) [Google Scholar]
  10. Koster, R.D.; Suarez, M.J. Soil moisture memory in climate models. J. Hydrometeorol. 2001, 2, 558–570. [Google Scholar] [CrossRef]
  11. Hu, Q.; Feng, S. A Role of the Soil Enthalpy in Land Memory. J. Clim. 2004, 17, 3633–3643. [Google Scholar] [CrossRef]
  12. Hu, Q.; Feng, S. Why Has the Land Memory Changed? J. Clim. 2004, 17, 3236–3243. [Google Scholar] [CrossRef]
  13. Yang, K.; Zhang, J.Y. Spatiotemporal characteristics of soil temperature memory in China from observation. Theor. Appl. Climatol. 2015, 126, 739–749. [Google Scholar] [CrossRef]
  14. Xue, Y.K.; Yao, T.D.; Boone, A.A.; Diallo, I.; Liu, Y.; Zeng, X.; Lau, W.K.M.; Sugimoto, S.; Tang, Q.; Pan, X.; et al. Impact of Initialized Land Surface Temperature and Snowpack on Subseasonal to Seasonal Prediction Project, Phase I (LS4P-I): Organization and experimental design. Geosci. Model Dev. 2021, 14, 4465–4494. [Google Scholar] [CrossRef]
  15. Shi, P.F.; Lu, H.; Leung, L.R.; He, Y.J.; Wang, B.; Yang, K.; Yu, L.; Liu, L.; Huang, W.Y.; Xu, S.M.; et al. Significant Land Contributions to Interannual Predictability of East Asian Summer Monsoon Rainfall. Earth’s Future 2021, 9, e2020EF001762. [Google Scholar] [CrossRef]
  16. Zhou, L.T.; Huang, R.H. Regional differences in surface sensible and latent heat fluxes in China. Theor. Appl. Climatol. 2013, 116, 625–637. [Google Scholar] [CrossRef]
  17. Li, M.X.; Ma, Z.G. Sensible and latent heat flux variability and response to dry–wet soil moisture zones across China. Bound. Layer Meteorol. 2014, 154, 157–170. [Google Scholar] [CrossRef]
  18. Zhou, L.T.; Wu, T.H.; Huang, R.H. Variability of surface sensible heat flux over northwest China. Atmos. Ocean. Sci. Lett. 2015, 3, 75–80. [Google Scholar]
  19. Zhou, L.T.; Huang, R.H. An assessment of the quality of surface sensible heat flux derived from reanalysis data through comparison with station observations in Northwest China. Adv. Atmos. Sci. 2010, 27, 500–512. [Google Scholar] [CrossRef]
  20. Pan, J.Y.; Lin, H. Calculation of the sensible heat flux of the global ocean using satellite data. Int. J. Remote Sens. 2012, 33, 5289–5305. [Google Scholar] [CrossRef]
  21. Monin, A.S.; Obukhov, A.M. Basic laws of turbulent mixing in the surface layer of the atmosphere. Tr. Akad. Nauk SSSR Geophiz. Inst. 1954, 24, 163–187. [Google Scholar]
  22. Yang, K.; Qin, J.; Guo, X.F.; Zhou, D.G.; Ma, Y.M. Method development for estimating sensible heat flux over the Tibetan Plateau from CMA Data. J. Appl. Meteorol. Climatol. 2009, 48, 2474–2486. [Google Scholar] [CrossRef]
  23. Foken, T. 50 Years of the Monin–Obukhov Similarity Theory. Bound. Layer Meteorol. 2006, 119, 431–447. [Google Scholar] [CrossRef]
  24. Fan, L.J.; Wei, Z.G.; Dong, W.J. The characteristic of temporal and spatial distribution of the differences between ground and air temperature in the arid region of northwest China. Plateau Meteor 2004, 23, 360–367. (In Chinese) [Google Scholar]
  25. Zhang, W.G.; Li, S.X.; Wu, T.H.; Pang, Q.Q. Changes and spatial patterns of the differences between ground and air temperature over the Qinghai-Xizang plateau. J. Geogr. Sci. 2007, 17, 20–32. [Google Scholar] [CrossRef]
  26. Zhou, L.T.; Huang, R.H. Characteristics of interdecadal variability of the difference between surface temperature and surface air temperature in spring in arid and semi-arid region of northwest China and its impact on summer precipitation in north China. Clim. Environ. Res. 2006, 11, 1–13. (In Chinese) [Google Scholar]
  27. Wen, L.M.; Zhou, L.T.; Huang, R.H.; Fan, G.Z. Characteristics of interdecadal variability in the difference between surface temperature and surface air temperature in Southeast and Northwest China. Clim. Environ. Res. 2014, 19, 636–648. (In Chinese) [Google Scholar]
  28. Wang, Y.J.; Hu, Z.Z.; Yan, F. Spatiotemporal variations of differences between surface air and ground temperatures in China. J. Geophys. Res. Atmos. 2017, 122, 7990–7999. [Google Scholar] [CrossRef]
  29. Liao, Y.M.; Chen, D.L.; Liu, Q.F. The spatiotemporal characteristics and long-term trends of surface-air temperatures difference in China. Clim. Chang. Res. 2019, 15, 374–384. (In Chinese) [Google Scholar]
  30. Shi, X.H.; Chen, J.Q. Trends in the differences between homogenized ground surface temperature and surface air temperature in China during 1961–2016 and its possible causes. Theor. Appl. Climatol. 2021, 144, 41–54. [Google Scholar] [CrossRef]
  31. Feng, H.H.; Zou, B. A greening world enhances the surface-air temperature difference. Sci. Total Environ. 2019, 658, 385–394. [Google Scholar] [CrossRef]
  32. Jiang, K.; Pan, Z.; Pan, F.; Wang, J.; Han, G.; Song, Y.; Zhang, Z.; Huang, N.; Ma, S.; Chen, X. Influence patterns of soil moisture change on surface-air temperature difference under different climatic background. Sci. Total Environ. 2022, 822, 153607. [Google Scholar] [CrossRef]
  33. Jiang, K.; Pan, Z.; Pan, F.; Wang, J.; Han, G.; Song, Y.; Zhang, Z.; Huang, N.; Ma, S.; Chen, X.; et al. The global spatiotemporal heterogeneity of land surface-air temperature difference and its influencing factors. Sci. Total Environ. 2022, 838, 156214. [Google Scholar] [CrossRef] [PubMed]
  34. Xu, W.H.; Sun, C.H.; Zuo, J.Q.; Ma, Z.G.; Li, W.J.; Yang, S. Homogenization of monthly ground surface temperature in China during 1961–2016 and performances of GLDAS reanalysis products. J. Clim. 2019, 32, 1121–1135. [Google Scholar] [CrossRef]
  35. Cao, L.J.; Zhu, Y.N.; Tang, G.L.; Yuan, F.; Yan, Z.W. Climatic warming in China according to a homogenized dataset from 2419 stations. Int. J. Climatol. 2016, 36, 4384–4392. [Google Scholar] [CrossRef]
  36. Ma, L.; Qin, D. Spatial-Temporal characteristics of observed key parameters for snow cover in China during 1957–2009. J. Glaciol. Geocryol. 2012, 34, 1–11. (In Chinese) [Google Scholar]
  37. Ke, C.; Li, X.; Xie, H.; Ma, D.; Liu, X.; Kou, C. Variability in snow cover phenology in China from 1952 to 2010. Hydrol. Earth Syst. Sci. 2016, 20, 755–770. [Google Scholar] [CrossRef]
  38. Zou, Y.; Sun, P.; Ma, Z.; Lv, Y.; Zhang, Q. Snow Cover in the Three Stable Snow Cover Areas of China and Spatio-Temporal Patterns of the Future. Remote Sens. 2022, 14, 3098. [Google Scholar] [CrossRef]
  39. Wang, J.A.; Zuo, W. Geographic Atlas of China; China Atlas Press: Beijing, China, 2009. (In Chinese) [Google Scholar]
  40. You, Q.L.; Jiang, Z.H.; Kong, L.; Wu, Z.W.; Bao, Y.T.; Kang, S.C.; Pepin, N. A comparison of heat wave climatologies and trends in China based on multiple definitions. Clim. Dyn. 2016, 48, 3975–3989. [Google Scholar] [CrossRef]
  41. Tysa, S.K.; Ren, G.Y.; Qin, Y.; Zhang, P.F.; Ren, Y.Y.; Jia, W.Q.; Wen, K.M. Urbanization Effect in Regional Temperature Series Based on a Remote Sensing Classification Scheme of Stations. J. Geophys. Res. Atmos. 2019, 124, 10646–10661. [Google Scholar] [CrossRef]
  42. Jones, P.D.; Hulme, M. Calculating regional climatic time series for temperature and precipitation methods and illustrations. Int. J. Climatol. 1996, 16, 361–377. [Google Scholar] [CrossRef]
  43. Beltrami, H.; Ferguson, G.; Harris, R.N. Long-term tracking of climate change by underground temperatures. Geophys. Res. Lett. 2005, 32, L19707. [Google Scholar] [CrossRef]
  44. Chudinova, S.M.; Frauenfeld, O.W.; Barry, R.G.; Zhang, T.; Sorokovikov, V.A. Relationship between air and soil temperature trends and periodicities in the permafrost regions of Russia. J. Geophys. Res. Earth Surf. 2006, 111, F02008. [Google Scholar] [CrossRef]
  45. Wang, J.L.; Pan, Z.H.; Han, G.L.; Cheng, L.; Dong, Z.Q.; Zhang, J.T.; Pan, Y.Y. Variation in ground temperature at a depth of 0 cm and the relationship with air temperature in China from 1961 to 2010. Resour. Sci. 2016, 38, 1733–1741. (In Chinese) [Google Scholar]
  46. Wang, Z.Y.; Zeng, H.L.; Gao, G.; Chen, Y.; Si, D.; Liu, B. Climatic Characters in 2010’ China. Meteorol. Mon. 2011, 37, 349–445. (In Chinese) [Google Scholar]
  47. Yang, Q.; Wang, G.; Zhao, M.; Sun, Y.; Qi, J. Characteristics of cold and warm summer variation in the Northeast China. J. Anhui Agric. Sci. 2010, 38, 12907–12909. (In Chinese) [Google Scholar]
  48. Piazena, H. The effect of altitude upon the solar UV-B and UV-A irradiance in the tropical Chilean Andes. Sol. Energy 1996, 57, 133–140. [Google Scholar] [CrossRef]
  49. Dvorkin, A.Y.; Steinberger, E.H. Modeling the altitude effect on solar UV radiation. Sol. Energy 1999, 65, 181–187. [Google Scholar] [CrossRef]
  50. Pfeifer, M.T.; Koepke, P.; Reuder, J. Effects of altitude and aerosol on UV radiation. J. Geophys. Res. Atmos. 2006, 111, D01203. [Google Scholar] [CrossRef]
  51. Kiehl, J.T.; Trenberth, K.E. Earth’s Annual Global Mean Energy Budget. Bull. Am. Meteorol. Soc. 1997, 78, 197–208. [Google Scholar] [CrossRef]
  52. Lian, X.; Zeng, Z.Z.; Yao, Y.T.; Peng, S.S.; Wang, K.C.; Piao, S.L. Spatiotemporal variations in the difference between satellite-observed daily maximum land surface temperature and station-based daily maximum near-surface air temperature. J. Geophys. Res. Atmos. 2017, 122, 2254–2268. [Google Scholar] [CrossRef]
  53. Lu, A.G. Precipitation effects on temperature—A case study in China. J. Earth Sci. 2011, 22, 792–798. [Google Scholar]
  54. Carslaw, K.S.; Harrison, R.G.; Kirkby, J. Cosmic Rays, Clouds, and Climate. Science 2002, 298, 1732–1737. [Google Scholar] [CrossRef]
  55. Sun, X.B.; Ren, G.Y.; Ren, Y.Y.; Fang, Y.H.; Liu, Y.L.; Xue, X.Y.; Zhang, P.F. A remarkable climate warming hiatus over Northeast China since 1998. Theor. Appl. Climatol. 2017, 133, 579–594. [Google Scholar] [CrossRef]
  56. Chapin, F.S.; Randerson, J.T.; McGuire, A.D.; Foley, J.A.; Field, C.B. Changing feedbacks in the climate–biosphere system. Front. Ecol. Environ. 2008, 6, 313–320. [Google Scholar] [CrossRef] [PubMed]
  57. Ellison, D.; Morris, C.E.; Locatelli, B.; Sheil, D.; Cohen, J.; Murdiyarso, D.; Gutierrez, V.; Noordwijk, M.v.; Creed, I.F.; Pokorny, J.; et al. Trees, forests and water: Cool insights for a hot world. Glob. Environ. Chang. 2017, 43, 51–61. [Google Scholar] [CrossRef]
  58. Shiflett, S.A.; Liang, L.L.; Crum, S.M.; Feyisa, G.L.; Wang, J.; Jenerette, G.D. Variation in the urban vegetation, surface temperature, air temperature nexus. Sci. Total Environ. 2017, 579, 495–505. [Google Scholar] [CrossRef] [PubMed]
  59. Sun, W.Z.; Yang, K.; Luo, Y. The influence of vegetation cover change on the land surface temperature in the central Guizhou urban agglomeration from 2000 to 2019. IOP Conf. Ser. Earth Environ. Sci. 2021, 658, 012009. [Google Scholar] [CrossRef]
  60. Wang, K.C.; Dickinson, R.E. Contribution of solar radiation to decadal temperature variability over land. Proc. Natl. Acad. Sci. USA 2013, 110, 14877–14882. [Google Scholar] [CrossRef]
  61. Du, J.Z.; Wang, K.C.; Wang, J.K.; Ma, Q. Contributions of surface solar radiation and precipitation to the spatiotemporal patterns of surface and air warming in China from 1960 to 2003. Atmos. Chem. Phys. 2017, 17, 4931–4944. [Google Scholar] [CrossRef]
  62. Bustos, E.; Meza, F.J. A method to estimate maximum and minimum air temperature using MODIS surface temperature and vegetation data: Application to the Maipo Basin, Chile. Theor. Appl. Climatol. 2014, 120, 211–226. [Google Scholar] [CrossRef]
  63. Feng, H.; Liu, H.; Wu, L. Monitoring the Relationship Between the Land Surface Temperature Change and Urban Growth in Beijing, China. IEEE J. Sel. Top. Appl. Earth Obs. Remote Sens. 2014, 7, 4010–4019. [Google Scholar] [CrossRef]
  64. Twomey, S. Aerosols, clouds and radiation. Atmos. Environ. Part A Gen. Top. 1991, 25, 2435–2442. [Google Scholar] [CrossRef]
  65. Zhang, T.; Barry, R.G.; Gilichinsky, D.; Bykhovets, S.S.; Sorokovikov, V.A.; Ye, J.P. An amplified signal of climatic change in soil temperatures during the last century at Irkutsk, Russia. Clim. Chang. 2001, 49, 41–76. [Google Scholar] [CrossRef]
  66. Feng, H.H.; Zou, B.; Luo, J.H. Coverage-dependent amplifiers of vegetation change on global water cycle dynamics. J. Hydrol. 2017, 550, 220–229. [Google Scholar] [CrossRef]
  67. Freychet, N.; Tett, S.F.B.; Bollasina, M.; Wang, K.C.; Hegerl, G.C. The Local Aerosol Emission Effect on Surface Shortwave Radiation and Temperatures. J. Adv. Model. Earth Syst. 2019, 11, 806–817. [Google Scholar] [CrossRef]
  68. Zhang, H.X.; Yuan, N.M.; Ma, Z.G.; Huang, Y. Understanding the soil temperature variability at different depths: Effects of surface air temperature, snow cover, and the soil memory. Adv. Atmos. Sci. 2021, 38, 493–503. [Google Scholar] [CrossRef]
  69. Ren, G.Y.; Xu, M.Z.; Chu, Z.Y.; Guo, J.; Li, Q.X.; Liu, X.N.; Wang, Y. Changes of Surface Air Temperature in China During 1951—2004. Clim. Environ. Res. 2005, 10, 717–727. [Google Scholar]
Figure 1. Temporal variations of warm-season mean GST before (blue dotted line) and after (red solid line) homogenization for (a) Miyun station (ID: 54416) of Beijing and (b) Wuhan station (ID: 57494) from 1961 to 2018.
Land 12 01057 g001
Figure 2. (a) Spatial distribution of observation stations and (b) the six sub-regions in China mainland (Northwest China―NWC, 73.25° E–103.25° E/37.25° N–49.75° N; Qinghai-Tibet Plateau―QTP, 73.25° E–103.25° E/26.75° N–37.25° N; Northeast China―NEC, 109.75° E–135.75° E/42.75° N–54.75° N; North China―NC, 103.25° E–129.75° E/33.75° N–42.75° N; Central China―CC, 103.25° E–122.75° E/26.75° N–33.75° N; South China―SC, 97.25° E–122.75° E/17.25° N–26.75° N). The scale bar in (b) is the same as that in (a).
Land 12 01057 g002
Figure 3. Spatial distribution of mean GST–SAT in (a) the warm season, (b) mid-late spring (AM), (c) summer (JJA), and (d) early-mid autumn (SO) in China mainland from 1961 to 2018 (unit: °C).
Land 12 01057 g003
Figure 4. Temporal variations of mean GST, SAT, and GST–SAT anomaly in (a) the warm season, (b) mid-late spring (AM), (c) summer (JJA), and (d) early-mid autumn (SO) in China mainland from 1961 to 2018. The black solid line represents the difference between GST and SAT or GST–SAT, the red solid line and blue line represent the ground surface temperature and surface air temperature, respectively, and the dashed line represents the linear trend.
Land 12 01057 g004
Figure 5. Year-month profile of the monthly mean GST–SAT anomaly in China mainland (Unit: °C).
Land 12 01057 g005
Figure 6. Spatial distribution of linear trend of mean GST–SAT in (a) the warm season, (b) mid-late spring (AM), (c) summer (JJA), and (d) early-mid autumn (SO) in China mainland from 1961 to 2018 (unit: °C/10yr). The red color represents an increase, the blue color represents a decrease, and the dotted area (grid) indicates that the trend passes the 95% confidence test.
Land 12 01057 g006
Figure 7. Intra-seasonal (April to October) variations of (a) GST–SAT and (b) its trends in China mainland and its six sub-regions during 1961–2018. The gray dashed line in (a) indicates the warm-season mean GST–SAT. Bars in (b) indicate one standard deviation.
Land 12 01057 g007
Figure 8. Trends of warm season and seasonal (AM, JJA, SO) mean GST–SAT in the six sub-regions in China mainland from 1961 to 2018 (*: denotes the trend that passes the 95% confidence test; **: denotes the trend that passes the 99% confidence test).
Land 12 01057 g008
Figure 9. Correlation between warm-season mean GST–SAT and (a) altitude, (b) relative humidity, (c) sunshine duration, and (d) precipitation of observational stations in China mainland from 1961 to 2018. All correlation coefficients in the figure pass the significance test of p < 0.01.
Land 12 01057 g009
Figure 10. Correlation coefficients between warm-season mean GST–SAT and the possible influencing factors (ALT, SSD, RH, and PRE) in China mainland and its six sub-regions from 1961 to 2018 (*: denotes the correlation that passes the p < 0.05 confidence test; **: denotes the correlation that passes the p < 0.01 confidence test).
Land 12 01057 g010
Table 1. Region-averaged values of basic climatic elements in warm-season and urbanization level in six sub-regions.
SAT (°C)Precipitation (mm)RH (%)Urbanization Level
NWC16.03119.8843.052.71
QTP10.74436.4256.441.86
NEC13.90422.0061.553.18
NC17.66486.3163.603.03
CC22.13960.1976.153.14
SC23.721255.0277.843.07
Table 2. Mean GST, SAT, and GST–SAT, and their trends in the warm season (WS), spring (AM), summer (JJA), and autumn (SO) in China mainland from 1961 to 2018.
Trend (°C/10yr)Mean (°C)
GSTSATGST–SATGSTSATGST–SAT
Warm Season0.27 **0.23 **0.04 **21.4417.433.88
AM0.35 **0.25 **0.10 **18.2514.293.81
JJA0.22 **0.20 **0.02 *26.4821.684.67
SO0.26 **0.24 **0.03 **17.0714.202.75
*: Denotes the trend that passes the p < 0.05 confidence test. **: Denotes the trend that passes the p < 0.01 confidence test.
Table 3. Mean GST–SAT trends in the warm season, mid-late spring (AM), summer (JJA), and early-mid autumn (SO) in China mainland from 1961 to 2018.
GST–SAT’s Trend (°C/10yr)Warm SeasonAMJJASO
HOMO (2171 stations)0.04 **0.10 **0.02 *0.02 **
Non-HOMO (2171 stations)0.07 **0.12 **0.05 **0.05 **
HOMO (775 stations)0.03 **0.09 **0.010.02 *
*: Denotes the trend that passes the p < 0.05 confidence test. **: Denotes the trend that passes the p < 0.01 confidence test.
Disclaimer/Publisher’s Note: The statements, opinions and data contained in all publications are solely those of the individual author(s) and contributor(s) and not of MDPI and/or the editor(s). MDPI and/or the editor(s) disclaim responsibility for any injury to people or property resulting from any ideas, methods, instructions or products referred to in the content.

