Abstract
A qualitative and quantitative deterioration of natural environments occurred recently worldwide. Loss of ecological capacities and agricultural decline are the critical consequences of urbanisation. This paper focuses on the value of assessing the urban sprawl in a southern Italy territory in order to evaluate the significant landscape transformations and provide a document to local administrators for a more balanced management of land use. The importance to calculate the soil consumption dynamics is remarkable in the investigated territory, Rende municipality in the Calabria region, southern Italy, since it is characterized by the same human pressure that occurred in other Mediterranean areas, so it is well representative of wider territories included in the Mediterranean setting. The transition from rural areas to urban settlements has been investigated via landscape analysis, and conducted for spatial and temporal changes over 25 years. The landscape analysis has integrated data from the orthophotos and Esri topographic base map. Quantitatively, the estimation of urban growth, in all its components, and soil consumption are evident by analysis of the number of patches. Qualitatively, the occurred consumption of fertile soil has caused a significant impact on local environmental conditions and on human activities resulting in decreasing of arable land, which decreased significantly over the considered period. This study addresses how knowledge of the change in urban areas is needed to effectively manage urban environmental impacts.
1. Introduction
In the 19th century, the global population increased from 224 million in 1900 to 2.9 billion in 1999 [1]. In the next ten years, more than 60% of the projected world population will live in cities: 56.2% of the population in developing countries and 83.5% of that in developed countries [2,3]. Projecting further in time, the urban settlements will reach an increase of 68%. Consequently, in absolute terms, an increase of about 2.5 billion people will occur by 2050 [4]. This trend is confirmed by European and, particularly, Italian data [5,6].
The monitoring of the development of urban areas is progressively appealing to the concern of land managers and administrations, considering that globally, urban areas could continue to expand into surrounding agro-ecological regions as well as natural regions, with dramatic effects on the environment [7,8,9]. Indeed, the population development in urban areas requires more natural areas, including land for building infrastructures for housing and industrial purposes, commercial and transport with recognisable consequences on human health, wellbeing and soil consumption [10,11,12,13].
Although urban development is required for a sustainable economy, uncontrolled or sprawling urban growth can cause several complications such as loss of open space, landscape modification, environmental pollution, traffic overcrowding, infrastructure pressure and other social and economic concerns [14].
Particularly, the fertile soils are the ones which experience the main change in properties and processes in the expansion of cities [15,16] being employed for buildings or industrial and commercial areas. The fertile soils are limited natural resources; their main application concerns both agricultural practices, food production and ecosystem facilities [17,18,19] including buffering activities, pollution phenomena and use for recreation, information and knowledge [20,21]. Consequently, fertile soils are key factors for the quality of water and air, climate change and human health assessment [22].
Overbuilding and urban sprawl, deforestation, leaving of the countryside, stream grafting, occupation of riverbeds and compaction phenomena determine a severe decay of soil conditions favour soil erosion [23,24,25]. In addition, soils in the urban environment can be a net source or sink for potentially harmful elements, generating some ecosystem disservices [10,26,27,28,29]. The change of land cover from natural to artificial areas to perform urban functions is usually defined as soil consumption [30,31,32].
These landscape changes need to be interpreted either for land use or for land cover [33,34]. The term “land use” is defined as a territory in terms of its socio-economic and ecological purposes characterised by its present and potential functions [35]. The term “land cover” is defined as the cover of the earth considered by its biophysical characteristics, which can be detected by any earth observation platform [36]. In this viewpoint, the measurement of changes in land use/cover over time is a key issue for observing and modifying ecological consequences.
An issue of great significance in modelling urban development considers the spatial and temporal dynamics, scale dynamics and land use changes by anthropogenic activities [14].
The landscape metrics are useful tools to relate the spatial heterogeneity of land use to urban morphological characteristics and the ecological patterns and processes observed [37,38,39,40,41].
The process, which underlies the landscape changes, is not a simple transformation from one type of land cover to another, but a slow conversion of land features which extends into long-term dynamics [42,43,44]. A multi-temporal analysis of this process allows us to identify the transformation of land cover and recognise the physical and topographic variables, which are key factors influencing the ecological dynamics [45].
The analysis of these processes, through multi-temporal indices, has been applied to the municipality of Rende, in the Calabria region, southern Italy, to analyse and interpret quantity, spatial distribution and the dynamics of urban expansion and transformation of the landscape in a territory already penalised for drought and environmental pollution [46,47].
A period of 25 years (1990–2015) has been selected for analysing land cover and use changes, in which urbanisation has been invasive. This analysis has been carried out by patterns of landscape diversity such as patch density, edge density and area weight.
Landscape metrics have been successfully applied to indicate landscape function and at least provide a quantitative basis for measuring how landscape structure may change over time. The present study is a progress status of the research presented by Ricca and Guagliardi [48]. The new features, which allow us to improve the knowledge of the soil consumption dynamics over space and time in the selected urban sprawling area, include a more detailed analysis of landscape metrics and a deeper understanding of the changing aspects related to the territory. For this reason, the study area has been divided into two parts by an altitude band of 270 m a.s.l., one flatter, most affected by the sprawl phenomena, the other in which the agricultural activities are prevalent.
The novelty of our research is related to some reasons. No many studies on the soil consumption of the study area are present in the literature because changes in the territorial system occur slowly and the characteristics of land use are subject to many influences such as changes in population and economic development, which are difficult to isolate and which should be involved in a more comprehensive evaluation of urban quality study.
The present study innovatively approaches the multi-temporal land use changing analysis using maps on a scale of detail in high resolution, instead of satellite images, combining the extension for ArcGIS, Patch Analyst with performing indicators. The study area represents a very particular territory in which the adopted approach can quantitatively demonstrate the success of merging data of urban sprawl and change in soil resources to illustrate the soil response to rapid urban expansion.
Analysing the dynamics of the urban environments of Rende municipality in the Cosenza province has, additionally, a key application because despite being a centre which concentrate people and resources into a relatively small area, economies of scale improve innovation in it. The increased population has helped exchanges between sociocultural and environmental components of the urban ecosystem.
In addition, the study area is located in the Mediterranean landscape where the fragmentation of land uses and the weakening in high-quality soil resources deriving from urbanisation is a typical trait. Therefore, the investigated territory is representative of the average Mediterranean environments for land use changes, land degradation and urbanisation. Consequently, the adopted methodologies in this analysis could be replied to assess the urban expansion in wider territories of the Mediterranean setting. Indeed, the uniqueness of the Mediterranean region is in the physiographic conditions and historical and societal developments.
2. Materials and Methods
2.1. Study Area
The NW sector of Calabria region (southern Italy) is located in the municipality of Rende (Figure 1), which represents the study area. It is within the Crati valley and its area is 55.28 km2 and its altitude ranges from 129 to 1137 m a.s.l.
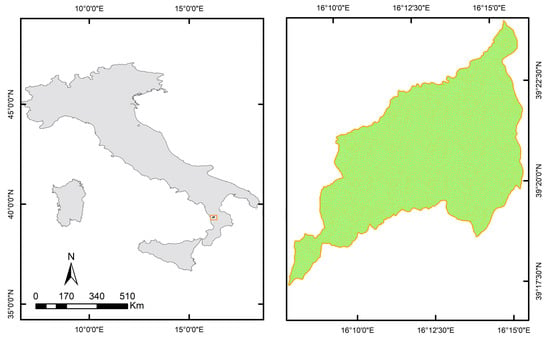
Figure 1.
Location of Rende municipality, southern Italy.
The Crati valley represents a tectonic depression NW oriented and situated in axial position respecting the Apennine Chain, and it is limited by faults [49,50]. It is a graben enclosed in three morpho-structural highs: the Sila Massif to the east, the Coastal Chain to the west and south, and the Pollino group to the north [51,52].
The main soil types falling in Rende municipality vary from poorly to moderately differentiated soils [53] such as Fluvisols, Leptosols, Arenosols, Cambisols, Calcisols, Umbrisols and Phaeozems to more developed Vertisols and Luvisols [54], and Entisols, Inceptisols, Mollisols, Vertisols and Alfisols [55].
The climate system of the study area is typically Mediterranean with some marked seasonal differences [56,57,58], in which the orography of the region plays a key role [59,60,61].
Rende has a population of approximately 36,000 inhabitants. Its main land use is urban comprising housing, a road network, a limited presence of industries, commercial activities and parks and gardens [62,63]. One of the most important structures inside the territory is the University of Calabria, established in 1968, which consists of an area of over 200 hectares, which stretches along two bridges placed on top of each other for vehicular and pedestrian walkways and is surrounded by buildings. The downstream area setting is characterised by some university services including the Multifunctional Complex, some residential accommodation areas and the Sports Centre. Over time, the University has brought numerous urban and social changes to the municipality.
2.2. Data Source and Processing
The adopted steps for the procedure can be shown in the flowchart shown in Figure 2.

Figure 2.
Flowchart of processing data method steps.
A key issue to recognise and examine urban expansion processes is the accessibility of time-series data sets and updated information concerning current urban spatial composition to outline and localise evolution trends [14].
According to these indications, black and white digital orthophotos for 1990 and Esri topographic basemap [64] for 2015 were employed for multi-temporal analysis of the study area. The black and white high-resolution orthophotos were obtained by the national geoportal, developed by the Ministry of Environment, Land Protection and Sea and are available online (http://www.pcn.minambiente.it/PCN/ (accessed on 13 December 2018)).
In the analysis, data and geographic information systems were combined. Accurate rectification of data is a requirement in a classification process for blending various source data [64]. The employment of ArcGIS [65] was adopted for photo interpretation, georeferencing, rectification and mosaicing of aerial photographs.
Jointly to these data, a ground truthing, which constitutes the primary source of data and is consequently used as reference data and for accuracy assessment, was performed.
Two different methods to identify land use/cover change have been developed [66]: post-classification comparisons and concurrent analysis of multi-temporal data [67]. In this study, the first approach was selected to assess classifications as a posteriori. The choice is due to the structure of the available data detected in different seasons with distinct spatial resolutions. Through the post-classification evaluation, changes in land cover are recognised since the differences between two or more image dates are evident in the classification categories [68]. Some sources of uncertainty are associated with the post-classification comparisons approach [69], among others, inaccuracy in local details in the various classifications and the complications resulting from classification errors.
Accuracy assessment was performed for classified maps. Stratified random sampling design was adopted for this purpose. All categories were considered, including in the design 90 points sampled in order to cover the whole study area.
Interpretation is based on 1990 photographs, a 2015 topographic basemap and field verification.
Accuracy assessment of image classification was conducted using an error matrix, which symbolises the standard method of describing site-specific classification errors [70,71]. The validation data were assumed to represent the “ground truth”, such as pixels. By cross tabulating the classification product and associated validation samples, some metrics were calculated, including overall accuracy (OA, Equation (1)), producer’s accuracy (PA, Equation (2)) and user’s accuracy (UA, Equation (4)), and the Kappa statistic (Equation (4)).
2.3. Land Cover Classification
For the classification of the types of land cover, different datasets coexist, each with different aims and tools. Among them, one of the most relevant for the intent of this study is the European CORINE Land Cover (CLC) which represents a fundamental information source for land cover and land use (LCLU) [72]. The aim of the CLC dataset is to supply spatial data on the state of the European environmental landscape. Updates have been produced in 1990, 2000, 2006, 2012 and 2018. This time series highlight changes in land cover of Europe [73]. Based on these assumptions, the municipality of Rende has been divided into 22 land cover types, named according to CORINE Land Cover legend and subdivided as shown in Table 1.

Table 1.
Land cover classes used for Rende municipality. Adapted from Ricca and Guagliardi [48].
These classes were adopted for mapping land cover for 1990 and for 2015 (Figure 3).
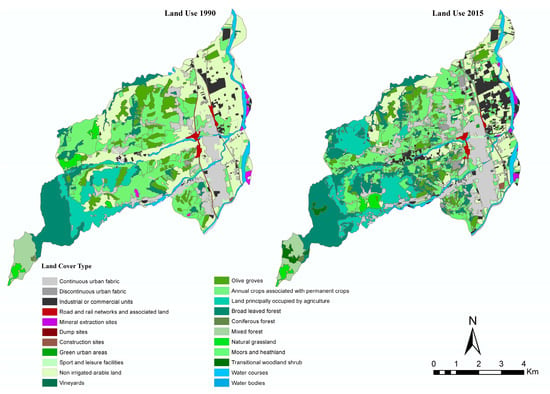
Figure 3.
Maps of land cover changes in the study area. The two maps are referred to changes in different land use classes from the year 1990 to 2015. Adapted from Ricca and Guagliardi [48].
In order to calculate the land use changes from 1990 to 2015, the selected categories, according to II level of CLC, are
- Urban fabric,
- Industrial, commercial and transport units,
- Mine, dump and construction sites,
- Arable land,
- Permanent crops,
- Heterogeneous agricultural areas,
- Forests,
- Shrub and/or herbaceous vegetation associations,
- Inland waters.
They include the wider classification shown above, which has been combined to better highlight the multi-temporal changes in the urban landscape, with specific consideration to agricultural and forestry soil consumption.
2.4. Multi-Temporal Landscape Metrics
Landscape metrics are applied to quantify and mosaic the landscape structure and its complexity. The calculation of the landscape structure [74] is useful to suggest the landscape changes and evaluate their fragility over time, defining the interactions among structural features, landscape function and landscape change.
Patches, the key landscape elements, were digitized as lines and polygons in layers according to distinct years and categories. The quantification of variables was carried out through the extension for ArcGIS, Patch Analyst.
Among the variety of landscape metrics [75,76,77,78,79,80,81,82], which allows for characterising structurally and functionally the territory both at the class and landscape level, those taken into consideration are shown in Table 2. These were selected to define the changes in the landscape over time and to calculate the spatial patterns in heterogeneous landscapes, trying to explain connections between landscape structure and landscape function [83,84]. The characteristics of these landscape patterns influence ecological processes. The selection of landscape indices was addressed to comprehend such process–pattern interactions.

Table 2.
Class level metrics. Adapted from Ricca and Guagliardi [45].
2.5. Soil Consumption Analysis
The indicators developed in the OSDDT Med [85] Project—Land use and sustainable development of territories in Mediterranean areas were employed for the analysis of the dynamics of soil consumption, as follows:
- Consumed soil on a reference surface
Calculation Method: urbanised surface/artificial up to a given date/total reference surface (Province, Department, Municipality) in %:
where C = consumed soil, SU = urbanised or artificial surface (buildings + sport grounds, quarries and docks) and S = reference surface;
C = SU/S
- Intensity of soil consumption
Calculation Method: progression of soil consumption between two periods given in percentages. This calculation needs the amount of soil consumption in two different dates:
where I = intensity of soil consumption, C1 = surface of consumed soil (date 1) and C2 = surface of consumed soil (date 2);
I = 100 − (C2 × 100/C1)
- Average annual rate of the increase in consumed soil
Calculation Method: annually consumed soil consumption expressed in % over a specific period. This calculation needs the amount of consumed soil in two different dates in order to be able to calculate the annual variation:
where Ti = average annual rate of increase, C2 = value/measurement of consumed soil on the date N + n + 1 + n + 2, C1 = value/measurement of consumed soil on date N and a = difference (in number of years) between the two measurements;
Ti = 100 × [(C2 − C1)/(a × C1)]
- Fertile soil consumption
Calculation Method: Fertile consumed soil in a selected period in absolute value compared to the reference surface (at departmental level, Province, Municipality, etc.) expressed in %:
where Csf = consumed fertile soil, SUsf = urbanised or artificial surface (buildings + parking, routes, etc.) and S = surface of fertile reference soil.
Csf = SUsf/S
As above mentioned, the theme ‘fertile soils’ deals with the determining agricultural potential. Soil fertility is a key factor in providing an ideal medium for agricultural production.
- Soil consumption by altimetric bands
Calculation Method: soil consumption by altitude expressed in %:
where Fx = definite altimetric band altitude and CS in Fx = consumed soil for the definite altimetric band.
In order to detect the consumed soil, joining the data relative to the consumed soil with that of altitude is required. The intersection of both values will produce the value of consumed soil by metric calculation.
- Consumed soil by inhabitant
Calculation Method: the correlation between the surface of consumed soil and the population resident on that territory expressed in m2/inhabitant or in ha/inhabitant.
It is important that the relative data of consumed soil have the same date (or the nearest possible date) as that of the resident population. E.g., if the date of consumed soil is referred to 2006, it is opportune comparing to the population of 2006 in that area as
where Cab = soil consumed by inhabitant, CS = soil consumed (m2, ha) and Hab = number of inhabitants.
Cab = CS/hab
- Consumed soil in square metres by inhabitant supplementary between two dates
Calculation Method: the correlation between the increase in consumed soil and the demographic growth:
where CSAbS: consumed soil by supplementary inhabitant, CS1 = consumed soil on period 1, CS2 = consumed soil on period 2, ab1 = number of inhabitants on period 1 and ab2 = number of inhabitants on period 2.
CSAbS = (CS2 − CS1)/(ab2 − ab1)
3. Results
The results of the accuracy assessment are shown in Table 3 and Table 4 for 1990 and 2015, respectively. The columns of the matrices show to which classes the pixels are in the validation set belong (ground truth) and the rows show to which classes the image pixels have been assigned to in the image. The diagonal shows the pixels that are classified correctly. Pixels that are not assigned to the proper class do not occur in the diagonal and give an indication of the confusion between the different land-cover classes in the class assignment.

Table 3.
Error matrix for 1990. Overall accuracy = 87%; Kappa = 0.85.

Table 4.
Error matrix for 2015. Overall accuracy = 85%; Kappa = 0.84.
For 1990, all classes were over 85%, except land principally occupied by agriculture, mixed forests and natural grassland for producer’s accuracy, while all classes were over 85%, except for the industrial or commercial units and moors and heathlands for user’s accuracy. For 2015, all classes were over 90%, except olive groves, annual crops, mixed forests and natural grassland for producer’s accuracy, while all classes were over 85%, except for the sport and leisure facilities, non-irrigated arable land olive groves and transitional woodland-shrubs for user’s accuracy.
The result about the minimum USGS accuracy requirements (minimum overall interpretation accuracy of at least 85%) proposed by the Anderson classification scheme [85] was overall achieved.
The change detection matrices showing the growth or degrowth of land cover area in 1990 compared to 2015 expressed in NumP, CA and percentages are presented Table 5.

Table 5.
Comparison of NumP, CA and increase or decrease in class area on two periods analysed.
From the data analysis obtained through the patch processing, the first result is the increase in the urban fabric, which has expanded its area from 559 ha in 1990 to 838 in 2015, with a percentage increase of 49.9%, as well as the growth of the Number of patches grew from 79 to 116 (Figure 4). Another evaluation derives from the increase in discontinuous urban fabric (included in urban fabric land cover type), i.e., space occupied by buildings, viability and other artefacts that coexist with spaces occupied by vegetation, agricultural land, forest and naked soil.
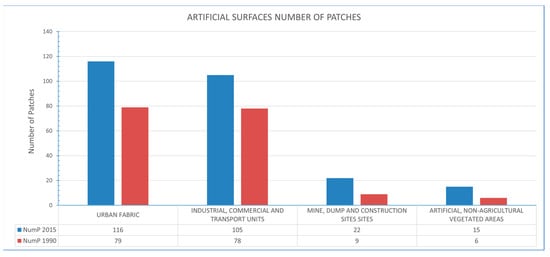
Figure 4.
Comparison of number of patches between 1990 and 2015 for artificial surfaces.
This land cover type has increased from 11.58 ha and two patches in 1990 to 61.52 ha and 11 patches in 2015. This index is very important because, over time, isolated houses tended to join the inhabited centres, causing fast growth of soil consumption. The central and northern parts of the study area were interested in most of these transformations. Other important evidence is the increase in the industrial areas from 207 ha in 1990 to 368 ha in 2015, with a percentage increase of 78.3%. As well as the transport units which are major consumers of soil. It is, in fact, possible to confirm the increase in the transport network. In addition, over the last few decades, the length per capita has progressively increased. Ultimately, during the last decades, the trend was the reduction of green areas pressured as a result of the building of artificial areas. Conversely, by the analysis of the evolutionary dynamics in the city, it is clear an increase in the proportion of service areas. As well as within the mine, dump and construction sites, the increase in construction sites grew from 2.35 ha in 1990 to 8.92 ha in 2015 and, within the artificial non-agricultural vegetated areas, the sport and leisure areas grew from 17 to 40 ha, with a percentage increase of 135.3% for total land cover type. All these increases have occurred at the expense of farmland for sowing, which decreased from 1553 ha in 1990 to 791 ha in 2015 with a reduction of 762 hectares corresponding to 49.1%.
Figure 5 shows the comparison between NumP in 1990 and 2015 for agricultural, forest and seminatural areas and water bodies. The increase in bushes from 414 ha in 1990 to 652 ha in 2015 should also be highlighted.
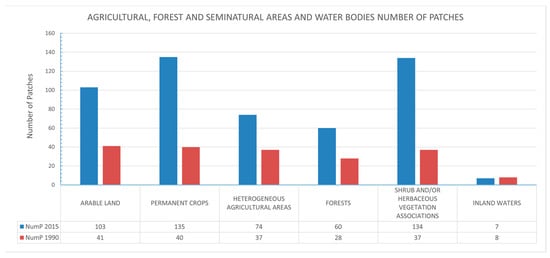
Figure 5.
Comparison of number of patches between 1990 and 2015 for agricultural, forest and seminatural areas and water bodies.
This increase is mainly due to the leaving of the countryside, connected to the reduction of arable land for some specialized crops such as olive groves, which was reduced by 112 ha, representing a decrease of 25.9%. Consequently, the loss of natural areas in favour of artificial surfaces, accelerated by the reducing economic value of the agricultural sector, occurred.
Table 6 shows the results of the indicators of soil consumption applied according to the OSDDT Med Project on the total surface.

Table 6.
Indicators of soil consumption according to OSDDT Med Project on the total surface.
These results confirmed a general soil consumption from 1990 to 2015. The intensity of soil consumption, referring to this period, was attested to be 56.8%, while the average annual rate of increase in soil consumed was 2.2%. The consumption of fertile soil, considered as fertile soil in the whole area of the basin, increased from 17.3% to 30%.
To better recognise the dynamics related to urban, productive and infrastructural settlements, the study area has been divided into two parts by an altitude band of 270 m a.s.l. (Figure 6 and Figure 7). The value of the indicators in the two orographic and altitudinal portions is significantly different; in the part under 270 m a.s.l., which is flatter, the percentages of consumed soil are 22.7% for 1990 and 35.2% for 2015, while for the portion of the territory above 270 m a.s.l., the percentages are 4.5% for 1990 and 7.6% for 2015, respectively (Table 7). Regarding the total number of patches detected, the comparison between the two periods clearly shows the increase in fragmentation, an increase of about 50% for the artificial classes and of 168.6% for the natural classes. It is evident that only the part under 270 m a.s.l. can be evaluated as important for the occurred urban sprawl. It is remarkable that a major part of the above 270 m a.s.l zone included areas located mainly far from the river and which experienced less urban growth then the other part.
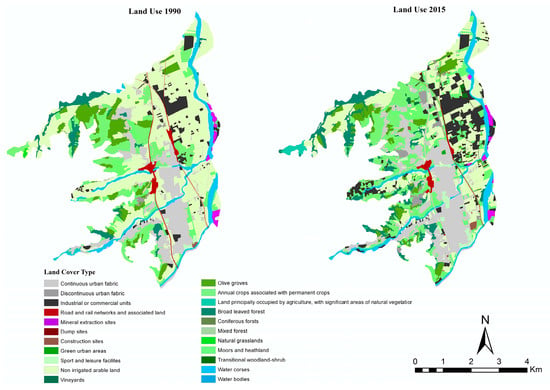
Figure 6.
1990–2015 land cover change map for portion of the territory with altitude < 270 m a.s.l. study area.
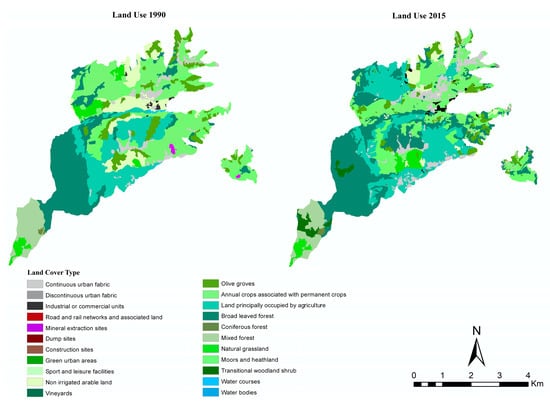
Figure 7.
1990–2015 land cover change map for portion of the territory with altitude < 270 m a.s.l.

Table 7.
Indicators of soil consumption according to OSDDT Med Project in the two altimetric bands considered.
Landscape metrics analysis show the urban and industrial fabric growth, trend confirmed by the CA (Class Area) index.
As shown in Figure 8, the artificial areas increased from 817 ha in 1990 to 1281 ha in 2015, while agricultural, forest and seminatural areas and water bodies decreased from 1990 to 2015 occurred (Figure 9).
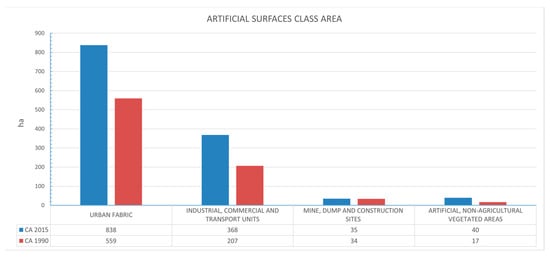
Figure 8.
The change of Class Area (ha) in artificial surface from 1990 to 2015.
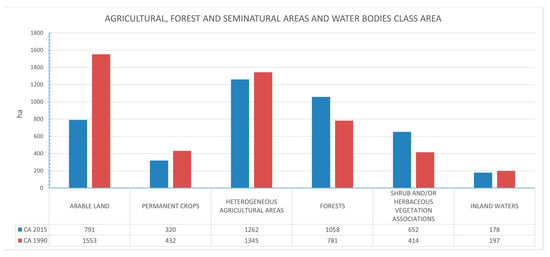
Figure 9.
The change of Class Area (ha) in agricultural, forest and seminatural areas and water bodies from 1990 to 2015.
By analysis of Figure 8 and Figure 9, the change in the composition of the total urban edge indicates a significant growth in the amount of edge between “urban fabric” and “artificial non-agricultural vegetated areas”.
The construction of new urban fabric in Rende municipality has taken place near the green urban areas which suggests more satisfying conditions for citizens that live in these zones and, on the other hand, a sprawl of residential functions.
A more exhaustive comprehension of the influences of the past and current policies on the urban environment can be derived by the analysis of changes in the spatial structure of the study area and, therefore, can be derived from the future approaches for a more sustainable urban expansion. The attested fragmentation of urban landscapes allows us to understand the dynamics that underly the quality of life for citizens and the effects of urbanisation on nature and biodiversity.
Table 8 shows the outcomes of the analysis of landscape metrics for each land cover type in 1990 and 2015.

Table 8.
Analysis of landscape metrics for each land cover type in 1990 and 2015.
The Mean Patch Size (MPS) shows how an unvaried average size of the patches for artificial areas (urban, industrial, mineral and green—Figure 10), and a considerable reduction of all-natural categories (agricultural, woods, etc.—Figure 11).
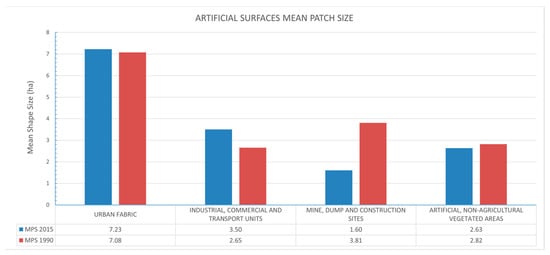
Figure 10.
Analysis of Mean Patch Size in 1990 and 2015 for artificial surfaces.
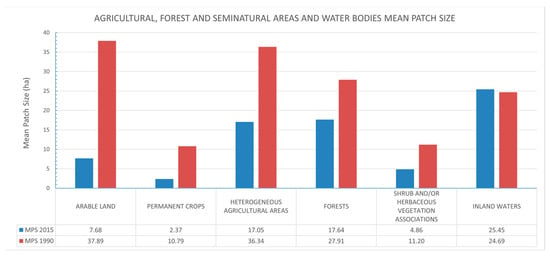
Figure 11.
Analysis of Mean Patch Size in 1990 and 2015 for agricultural, forest and seminatural areas and water bodies.
In this category, a reduction from an average of 24 ha in 1990 to 9 ha in 2015 occurred, excluding the calculation of the inland water; this is an indication of a greater fragmentation of the areas, and the result is attested by the number of patches that, for the same categories, increased from 191 in 1990 to 513 in 2015.
Analyses of the MSI (Mean Shape Index—Figure 12 and Figure 13) and AWMSI (Area Weighted Mean Shape Index) indicate an increase in indices, attesting an increase in the geometric complexity of patch shapes.
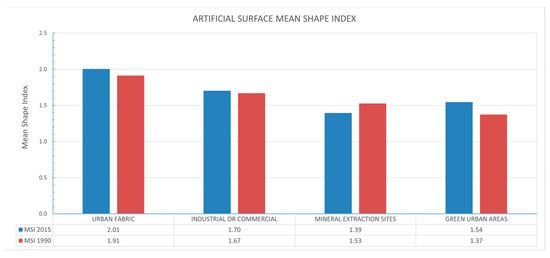
Figure 12.
Mean Shape Index for artificial surface in 1990 and 2015.
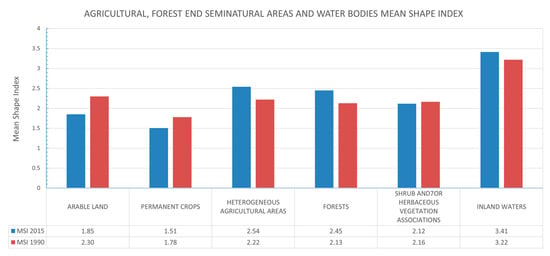
Figure 13.
Mean Shape Index for agricultural, forest and seminatural areas and water bodies in 1990 and 2015.
Another important finding is the evaluation of the SHANNON indices (SHDI and SHEI) which indicates an increase in values over time. The SHDI shows a variation of land use types, considering that its value is far from unity, while the SHEI results in a low value, a sign of the prevalence of elements with a relatively different extension in the landscape (Table 9).

Table 9.
Analysis of Shannon’s Diversity Index (SHDI) and the Shannon’s Evenness Index (SHEI) in 1990 and 2015.
4. Discussion
The not statistical feature of the landscapes is confirmed by climate changes, land use changes and human activities. These modifications, given by a wide range of factors, occurred in the system state of the study area over time and here analysed confirms this circumstance.
The connection between landscape structure and landscape function through landscape metrics has been verified by numerous landscape ecologists, firstly as early efforts, such in the studies of O’Neill et al. [81], Li [77], Turner [82], Turner and Gardner [86] and after with increasing knowledge and tools as GIS and software programs, such as in the studies of Kupfer [87], Turner [88], Wu and Hobbs [89]. The efforts for continuing the assessment of the composition and configuration of landscapes are progressively carried out [90,91].
Hence, the results of this study can be evaluated through comparison with other worldwide analyses.
This analysis recognised urban fabric, industrial, commercial and transport units, arable lands, permanent crops, shrub and herbaceous vegetation associations as the major classes that have involved important changes in the municipality of Rende. By this means, rapid urban sprawl due to population growth and economic developments in the urban area has been identified.
In the plain area, (under the considered altimetric band of 270 m a.s.l.) along the main road and rail communication networks, a greater and more progressive urbanisation of the area against the agricultural and vegetated areas has occurred, with harmful effects on agricultural production and on the soil’s function and water control.
Evidently, the growth has not occurred regularly in all directions but has been more rapid along specific directions. A considerable and incessant depopulation of the innermost areas corresponds to strong urbanisation of the areas adjacent to the communication networks. The presence of the motorway axis has caused the area a sort of slide towards the valley of the inhabited centres and the consequent birth of a series of nuclei.
Previous studies have investigated how land use changes impact the specific changes in landscape patterns. The findings of these surveys can be appropriately compared with the ones obtained in this study because they perfectly trace the evolutionary dynamics of the landscape structure that emerged in Rende municipality, highlighted by the application of landscape metrics method.
Particularly, the case study analysed by Dadashpoor et al. [92] in Tabriz metropolitan area (Iran) revealed land changes from grasslands to bare and urban lands over the past two decades. The results showed that these variations in landscape patterns are strongly connected with changes in different land uses.
Li et al. [93] analysed the landscape patterns in Beijing City, China during the years 2000 and 2010 adopting, i.e., patch density (PD), edge density (ED), Shannon’s diversity index (SHDI) and the aggregation index (AI), as landscape metrics to evaluate. The results showed a deep evolution of urban landscape patterns with changes evident especially from the city centre to the neighbourhoods. Over a 10-year interval, the average PD in the city centre grew by 100.6%, and the growth of AI in the neighbourhood was the largest. In the outer suburb, an increase in PD, ED and SHDI occur.
Fenta et al. [94] estimated the changes and spatial patterns of Mekelle City’s expansion (Ethiopia) in a period from 1984 to 2014. The analyses of spatial metrics showed an urban sprawl characterized by increasing heterogeneity and continuous spreading in the suburbs of the city. In the three analysed decades, the urban area expanded annually by 10%, 9% and 8%, respectively, with an average annual increase of 19% (100 ha year−1). In the period between 1984 and 2014, agricultural lands, which decreased by 39%, were converted into built-up areas. The per capita land consumption amount (ha per person) grew from 0.009 in 1984 to 0.014 in 2014, a sign of modest density urban growth.
Salem et al. [95] showed, in the results of their study in greater Cairo, that the processes of LULC change and urban sprawl have influenced the natural resources, especially agricultural land.
Mariwah et al. [96] analysed the land cover changes in the Tema Metropolis of Ghana from 1990 to 2010, a period in which built-up areas expansion increasingly become the most prevalent land cover type in the metropolis, with a reduction of the vegetation cover.
An accurate comparison of the results achieved in the above-mentioned studies and the present survey gives an overview fairly unvaried about the urbanisation impact on landscape patterns worldwide. The main land uses conversion values compared with each other during the different periods analysed in different countries are shown in Table 6. In all considered cities, as well as in Rende municipality, a progressive increase in urban tissues is observed as a consequent decrease in agricultural land. Conversely to the Iranian case study [93] but accordingly to results of Mariwah et al. [96] in Ghana, Rende municipality has been interested in an increase in gardens or artificial, non-agricultural vegetated areas. These features confirm worldwide globalisation linked to high urbanisation trends, which affects both big cities and local municipal entities.
Obviously, these trends were noted also in the Mediterranean settings, in which the study area is included. The Mediterranean Basin has some common representative components such as the sea, the climate, the landscape, the way of life and much more [61], and in all the cities, the urban sprawl was assessed confirming an overall trend of population growth and a relative increase in transport service with negative consequences on agriculture and use of natural resources.
For this reason, Rende can be considered a microenvironment whose outcomes can be extended to the wider Mediterranean cities’ framework.
The comparison of Corine Land Cover data for 1990, 2000, 2006 and 2012 has allowed us to outline a trend which highlights, at the Mediterranean scale, a generalized increase in urban areas mainly to the loss of agricultural areas and wooded and semi-natural areas. Population growth rates have reduced the amount of soil available per inhabitant, leading to deforestation, the cultivation of marginal areas and the intensification of farming. The massive phenomenon of urbanisation and development of industrial activities, which has affected all the countries of the Mediterranean area, has led to the growth of urban areas by subtracting the most fertile lands from agricultural activity and causing the irreversible loss of fragile ecosystems. The degradation attributed to agricultural activities affects both the marginal inland areas and the more productive areas. In the first case, the phenomena of internal migration, causing the abandonment of the lands, have had a negative impact on the conservation of the territory and the landscape. In the second case, the objectives of agricultural policies, which aim at a rapid increase in agricultural production, exert an excessive exploitation of water resources and a growing pressure on arable lands, forests and pastures.
According to the Mediterranean trend, in Rende municipality, the lack of territorial planning has up to now caused the disordered birth of settlements where the houses alternate without any logic with buildings intended for productive activities against the background of residual agricultural areas.
Rende was the first Calabrian municipality to adopt a Regulatory Plan in 1962, a plan that was able to effectively counteract the speculative pressures of that decade by focusing on quality settlement. With the birth of the University of Calabria in 1968, the equilibrium of the entire provincial territory was evidently transformed: first, there was a relevant increase in the population, which from the 13,157 inhabitants present in 1971 reached almost 35,000 in 2001, an increase which had its peak in the decade 1971–1981 with an increase of over 100%. This event had as its primary effect a centripetal process which saw the centre of gravity shift to the Rende plain and progressively transformed the traditional economy of Rende, which was supplanted exclusively by the associated activities linked to the presence of the university which occupies an area of 200 ha. The effects of this centripetal migration process led to the rapid growth of Rende. Widespread residential settlements have been created, with medium or low density, which triggers phenomena of mobility conditioned by the distance from the main services and work centres.
The settlement dynamics that occurred in Rende have a lively building activity in support of a continuous demand coming from both those who reside and those who come there only to attend university; all this has led, in the last two decades, to a sensitive consumption of land that the municipal urban plans drawn up to date have not been completely able to govern.
This is accompanied by the progress of other activities, linked to the birth and implementation of the industrial area, which is still too weak at a business level. This weakness has led to a progressive and spontaneous transformation of the activities established there which have also begun to include commercial activities that require large areas of exposure.
In this scenario, the role of planning and programming becomes fundamental as tools to guide urban growth considering the territorial rebalancing and sustainable expansion, considering the absence of suitable land use planning and the insufficient measures for sustainable expansion occurred until now.
Therefore, decision makers and urban planners can be equipped with this type of study in order to plan new sustainable scenarios according to area’s needs.
5. Conclusions
Contrarily to the copious literature on urban sprawl worldwide, little is known about southern Italy’s small area of urban sprawl. The present effort provides an assessment and an analysis of the driving force of urban sprawl in the Calabria region, using Rende municipality as a case. For studying, implementing and monitoring the development and management plans of the municipality of Rende in the Calabria region, southern Italy, a diachronic analysis of the evolutionary dynamics of the land cover changes occurring in the urban area over 25 years was carried out. The choice to study this area was addressed according to its characteristics, along with the type of urbanisation, land use and human activities, which are similar to other wide Mediterranean areas, and, therefore, even with its relatively small territory, it can be representative for the wider areas.
The study allows to conclude that
- the development of communities, expansion of urban fabric and enlargement of construction sites, which increased from 1990 to 2015, and diminished the land devoted to agriculture and forestry. The increase in the industrial areas from 1990 to 2015, with a percentage increase of 78.3%, occurred. As well as the artificial non-agricultural vegetated areas and the sport and leisure areas grew. Similarly, elements which play a key role in the landscape ecology, such as farmland for sowing, declined;
- matching the indicators detailed in the OSDDT Med Project, the intensity of soil consumption from 1990 to 2015 was 56.8%, while the average annual rate of increase in soil consumed was equal to 2.2%. As expected, the percentages of consumed soil were really more significant in the altimetric band < 270 m a.s.l., more devoted to urban expansion;
- Class Area index and Mean Patch Size confirmed this trend. The geometric complexity of patch shapes is subjected to a growth according to analysis of the MSI and the AWMSI. The analysis of the SHANNON indices revealed an increase in values over time.
These outcomes can be charged primarily to the population growth of the study area.
The soil consumption indicators have provided a temporal framework of the artificialized areas; the evolution that over time has led entire agricultural and forest areas to be waterproofed through overbuilding. The lack of territorial planning has entailed a chaotic and illogical distribution of settlements and an urban growth unbalanced and unsustainable between 1990 and 2015. Finding fragmentations of ecological units that occurred over time could correspond to a degradation of the ecosystem linked to human factors or physical factors.
The present study has revealed the benefit of using the multi-temporal landscape metrics for the soil consumption analysis to identify, measure and monitor spatio-temporal patterns of urban sprawl in the Rende municipality and its environs by integrating with GIS techniques.
By these findings, important study scenarios can be opened and linked to the planning of the development of human factors such as industries, road networks and urban fabric. Therefore, considering that urban sprawl is an unavoidable phenomenon, studies of this type can contribute to divulge scientific results that can be applied in local planning and ecological construction in order to preserve soil resources and sustainably address the development of human activities with particular attention to agriculture, forestry and ecological elements.
In future challenges, scientific tools for analysing land use changes and their impacts will be required in order to contain urban sprawl and better address a sustainable political approach, which will require pragmatic methods to plan and manage urban environments using modern technology.
Author Contributions
Conceptualization, N.R. and I.G.; methodology, N.R.; software, N.R.; validation, I.G.; formal analysis, N.R.; investigation, N.R. and I.G.; resources, N.R.; data curation, N.R. and I.G.; writing—original draft, N.R. and I.G.; writing—review and editing, I.G.; visualization, I.G.; supervision, N.R. and I.G.; project administration, N.R. All authors have read and agreed to the published version of the manuscript.
Funding
This research received no external funding.
Data Availability Statement
Data is contained within the article.
Conflicts of Interest
The authors declare no conflict of interest.
References
- United Nations. The State of World Population 1999, 6 Billion: A Time for Choices; United Nations Population Fund: New York, NY, USA, 1999. [Google Scholar]
- Alberti, M. The effects of urban patterns on ecosystem function. Int. Reg. Sci. Rev. 2005, 28, 68–192. [Google Scholar] [CrossRef]
- Chakraborty, S.; Maity, I.; Dadashpoor, H.; Novotnẏ, J.; Banerji, S. Building in or out? Examining urban expansion patterns and land use efficiency across the global sample of 466 cities with million+ inhabitants. Habitat Int. 2022, 120, 102503. [Google Scholar] [CrossRef]
- Amponsah, O.; Blija, D.K.; Ayambire, R.A.; Takyi, S.A.; Mensah, H.; Braimah, I. Global urban sprawl containment strategies and their implications for rapidly urbanising cities in Ghana. Land Use Policy 2022, 114, 105979. [Google Scholar] [CrossRef]
- Eurostat. 2016. Available online: http://ec.europa.eu/eurostat/data/database (accessed on 15 June 2016).
- IEA—International Energy Agency. World Energy Outlook 2008; OECD/IEA: Paris, France, 2008. [Google Scholar]
- Arshad, S.; Ahmad, S.R.; Abbas, S.; Asharf, A.; Siddiqui, N.A.; Islam, Z.U. Quantifying the contribution of diminishing green spaces and urban sprawl to urban heat island effect in a rapidly urbanizing metropolitan city of Pakistan. Land Use Policy 2022, 113, 105874. [Google Scholar] [CrossRef]
- Li, S.; Liu, X.; Li, Z.; Wu, Z.; Yan, Z.; Chen, Y.; Gao, F. Spatial and Temporal Dynamics of Urban Expansion along the Guangzhou-Foshan Inter-City Rail Transit Corridor, China. Sustainability 2018, 10, 593. [Google Scholar] [CrossRef]
- Seto, K.C.; Reenberg, A.; Boone, C.G.; Fragkias, M.; Haase, D.; Langanke, T.; Marcotullio, P.; Munroe, D.K.; Olah, B.; Simon, D. Urban land teleconnections and sustainability. Proc. Natl. Acad. Sci. USA 2012, 109, 7687–7692. [Google Scholar] [CrossRef]
- Cicchella, D.; Zuzolo, D.; Albanese, S.; Fedele, L.; Di Tota, I.; Guagliardi, I.; Thiombane, M.; De Vivo, B.; Lima, A. Urban soil contamination in Salerno (Italy): Concentrations and patterns of major, minor, trace and ultra-trace elements in soils. J. Geochem. Explor. 2020, 213, 106519. [Google Scholar] [CrossRef]
- Cox, D.T.C.; Shanahan, D.F.; Hudson, H.L.; Fuller, R.A.; Gaston, K.J. The impact of urbanisation on nature dose and the implications for human health. Landsc. Urban Plan. 2018, 179, 72–80. [Google Scholar] [CrossRef]
- Cozza, V.; Guagliardi, I.; Rubino, M.; Cozza, R.; Martello, A.; Picelli, M.; Zhupa, E. ESOPO: sEnsors and SOcial POllution measurements. CEUR Workshop Proc. 2015, 1478, 52–57. [Google Scholar]
- Domingo, D.; Palka, G.; Hersperger, A.M. Effect of zoning plans on urban land-use change: A multi-scenario simulation for supporting sustainable urban growth. Sustain. Cities Soc. 2021, 69, 102833. [Google Scholar] [CrossRef]
- Nolè, G.; Lasaponara, R.; Lanorte, A.; Murgante, B. Quantifying Urban Sprawl with Spatial Autocorrelation Techniques using Multi-Temporal Satellite Data. Int. J. Agric. Environ. Inf. Syst. 2014, 5, 19–37. [Google Scholar] [CrossRef]
- Francis, R.A.; Millington, J.D.A.; Chadwick, M.A. Urban Landscape and Ecology; Routledge: Abingdon, UK; New York, NY, USA, 2016. [Google Scholar]
- Taghizadeh-Mehrjardi, R.; Schmidt, K.; Toomanian, N.; Heung, B.; Behrens, T.; Mosavi, A.; Band, S.S.; Amirian-Chakan, A.; Fathabadi, A.; Scholten, T. Improving the spatial prediction of soil salinity in arid regions using wavelet transformation and support vector regression models. Geoderma 2021, 383, 114793. [Google Scholar] [CrossRef]
- Emadi, M.; Taghizadeh-Mehrjardi, R.; Cherati, A.; Danesh, M.; Mosavi, A.; Scholten, T. Predicting and Mapping of Soil Organic Carbon Using Machine Learning Algorithms in Northern Iran. Remote Sens. 2020, 12, 2234. [Google Scholar] [CrossRef]
- Taghizadeh-Mehrjardi, R.; Emadi, M.; Cherati, A.; Heung, B.; Mosavi, A.; Scholten, T. Bio-Inspired Hybridization of Artificial Neural Networks: An Application for Mapping the Spatial Distribution of Soil Texture Fractions. Remote Sens. 2021, 13, 1025. [Google Scholar] [CrossRef]
- Uusi-Kämppäa, J.; Keskinen, R.; Heikkinen, J.; Guagliardi, I.; Nuutinen, V. A map-based comparison of chemical characteristics in the surface horizon of arable acid and non-acid sulfate soils in coastal areas of Finland. J. Geochem. Explor. 2019, 200, 193–200. [Google Scholar] [CrossRef]
- Haines-Young, R.; Potschin, M. Common International Classification of Ecosystem Services (CICES); Consultation on Version 4; Fabis Consulting, Ltd.: Nottingham, UK, 2013. [Google Scholar]
- Pindral, S.; Kot, R.; Hulisz, P.; Charzyński, P. Landscape metrics as a tool for analysis of urban pedodiversity. Land Degrad. Dev. 2020, 31, 2281–2294. [Google Scholar] [CrossRef]
- ISPRA—Istituto Superiore per la Protezione e la Ricerca Ambientale. Report 195/2014; ISPRA: Rome, Italy, 2014. [Google Scholar]
- EEA—European Environment Agency. Urban Sprawl in Europe—The Ignored Challenge; EEA Report No. 10; EEA: Copenhagen, Denmark, 2006. [Google Scholar]
- Mosavi, A.; Sajedi-Hosseini, F.; Choubin, B.; Taromideh, F.; Rahi, G.; Dineva, A.A. Susceptibility Mapping of Soil Water Erosion Using Machine Learning Models. Water 2020, 12, 1995. [Google Scholar] [CrossRef]
- Mosavi, A.; Samadianfar, S.; Darbandi, S.; Nabipour, N.; Qasem, S.N.; Salwana, E.; Band, S.S. Predicting soil electrical conductivity using multi-layer perceptron integrated with grey wolf optimizer. J. Geochem. Explor. 2021, 220, 106639. [Google Scholar] [CrossRef]
- Buttafuoco, G.; Guagliardi, I.; Tarvainen, T.; Jarva, J. A multivariate approach to study the geochemistry of urban topsoil in the city of Tampere, Finland. J. Geochem. Explor. 2017, 181, 191–204. [Google Scholar] [CrossRef]
- Guagliardi, I.; Cicchella, D.; De Rosa, R.; Ricca, N.; Buttafuoco, G. Geochemical sources of vanadium in soils: Evidences in a southern Italy area. J. Geochem. Explor. 2018, 184, 358–364. [Google Scholar] [CrossRef]
- Guagliardi, I.; Zuzolo, D.; Albanese, S.; Lima, A.; Cerino, P.; Pizzolante, A.; Thiombane, M.; De Vivo, B.; Cicchella, D. Uranium, thorium and potassium insights on Campania region (Italy) soils: Sources patterns based on compositional data analysis and fractal model. J. Geochem. Explor. 2020, 212, 106508. [Google Scholar] [CrossRef]
- Zuzolo, D.; Cicchella, D.; Lima, A.; Guagliardi, I.; Cerino, P.; Pizzolante, A.; Thiombane, M.; De Vivo, B.; Albanese, S. Potentially toxic elements in soils of Campania region (Southern Italy): Combining raw and compositional data. J. Geochem. Explor. 2020, 213, 106524. [Google Scholar] [CrossRef]
- UN-Habitat. Metadata on SDGs Indicator 11.3.1 Indicator Category: Tier II. Metadata on SDG Indicator 11.3.1. Available online: https://unhabitat.org/wp-content/uploads/2019/04/Metadata-on-SDG-Indicator-11.3.1.pdf (accessed on 10 May 2019).
- European Commission. Guidelines on Best Practice to Limit, Mitigate or Compensate Soil Sealing; SWD 101; European Environment Agency: Brussel, Belgium, 2012. [Google Scholar]
- ISPRA—Istituto Superiore per la Protezione e la Ricerca Ambientale. Consumo di Suolo, Dinamiche Territoriali e Servizi Ecosistemici; Rapporti 288/2018; ISPRA: Rome, Italy, 2018. [Google Scholar]
- Lambin, E.F.; Geist, H. Land-Use and Land Cover Change: Local Processes and Global Impacts; Springer: Berlin/Heidelberg, Germany, 2006. [Google Scholar]
- Strollo, A.; Smiraglia, D.; Bruno, R.; Assennato, F.; Congedo, L.; De Fioravante, P.; Giuliani, C.; Marinosci, I.; Riitano, N.; Munafò, M. Land consumption in Italy. J. Maps 2020, 16, 113–123. [Google Scholar] [CrossRef]
- European Commission. Data Specification on Land Use—Technical Guidelines. D2.8.III.4. 2013. Available online: https://inspire.ec.europa.eu/id/document/tg/lu (accessed on 1 January 2013).
- European Commission. Data Specification on Land Cover—Technical Guidelines. D2.8.II.2. Available online: https://inspire.ec.europa.eu/id/document/tg/lc (accessed on 1 January 2013).
- Godone, D.; Garbarino, M.; Sibona, E.; Garnero, G.; Godone, F. Progressive fragmentation of a traditional Mediterranean landscape by hazelnut plantations: The impact of CAP over time in the Langhe region (NW Italy). Land Use Policy 2014, 36, 259–266. [Google Scholar] [CrossRef]
- Lausch, A.; Herzog, F. Applicability of landscape metrics for the monitoring of landscape change: Issues of scale, resolution and interpretability. Ecol. Indic. 2002, 2, 3–15. [Google Scholar] [CrossRef]
- Malaviya, S.; Munsi, M.; Oinam, G.; Joshi, P.K. Landscape approach for quantifying land use land cover change (1972–2006) and habitat diversity in a mining area in Central India (Bokaro, Jharkhand). Environ. Monit. Assess. 2010, 170, 215–229. [Google Scholar] [CrossRef] [PubMed]
- Sun, C.; Wu, Z.F.; Lv, Z.Q.; Yao, N.; We, J.B. Quantifying different types of urban growth and the change dynamic in Guangzhou using multi-temporal remote sensing data. Int. J. Appl. Earth Obs. Geoinf. 2013, 21, 409–417. [Google Scholar] [CrossRef]
- Zhou, X.; Wang, Y.C. Spatial-temporal dynamics of urban green space in response to rapid urbanization and greening policies. Landsc. Urban Plan. 2011, 100, 268–277. [Google Scholar] [CrossRef]
- Antrop, M. Landscape change: Plan or chaos? Landsc. Urban Plan. 1998, 41, 155–161. [Google Scholar] [CrossRef]
- Bürgi, M.; Russell, E.W.B. Integrative methods to study landscape changes. Land Use Policy 2001, 18, 9–16. [Google Scholar] [CrossRef]
- Coppin, P.; Jonckheere, I.; Nackaerts, K.; Muys, B.; Lambin, E. Digital change detection methods in ecosystem monitoring: A review. Int. J. Remote Sens. 2004, 25, 1565–1596. [Google Scholar] [CrossRef]
- Ricca, N.; Guagliardi, I. Multi-temporal dynamics of land use patterns in a Site of Community Importance in southern Italy. Appl. Ecol. Environ. Res. 2015, 13, 677–691. [Google Scholar]
- Guagliardi, I.; Cicchella, D.; De Rosa, R. A geostatistical approach to assess concentration and spatial distribution of heavy metals in urban soils. Water Air Soil Pollut. 2012, 223, 5983–5998. [Google Scholar] [CrossRef]
- Pellicone, G.; Caloiero, T.; Guagliardi, I. The De Martonne aridity index in Calabria (Southern Italy). J. Maps 2019, 15, 788–796. [Google Scholar] [CrossRef]
- Ricca, N.; Guagliardi, I. Monitoring Urban Growth Evolution by Multi-temporal Dynamics Analysis in a Southern Italy Area. In New Metropolitan Perspectives. NMP 2020. Smart Innovation, Systems and Technologies; Bevilacqua, C., Calabrò, F., Della Spina, L., Eds.; Springer: Cham, Switzerland, 2020; Volume 178. [Google Scholar] [CrossRef]
- Tansi, C.; Folino Gallo, M.; Muto, F.; Perrotta, P.; Russo, L.; Critelli, S. Seismotectonics and landslides of the Crati Graben (Calabrian Arc, Southern Italy). J. Maps 2016, 12, 363–372. [Google Scholar] [CrossRef]
- Iovine, G.; Guagliardi, I.; Bruno, C.; Greco, R.; Tallarico, A.; Falcone, G.; Lucà, F.; Buttafuoco, G. Soil-gas radon anomalies in three study areas of Central-Northern Calabria (Southern Italy). Nat. Hazards 2018, 91, 193–219. [Google Scholar] [CrossRef]
- Gaglioti, S.; Infusino, E.; Caloiero, T.; Callegari, G.; Guagliardi, I. Geochemical Characterization of Spring Waters in the Crati River Basin, Calabria (Southern Italy). Geofluids 2019, 2019, 3850148. [Google Scholar] [CrossRef]
- Infusino, E.; Guagliardi, I.; Gaglioti, S.; Caloiero, T. Vulnerability to Nitrate Occurrence in the Spring Waters of the Sila Massif (Calabria, Southern Italy). Toxics 2022, 10, 137. [Google Scholar] [CrossRef]
- ARSSA (Agenzia Regionale per lo Sviluppo e per i Servizi in Agricoltura). I Suoli Della Calabria. Carta dei Suoli in Scala 1:250000 Della Regione Calabria; Monografia divulgativa: Programma Interregionale Agricoltura-Qualità e Misura 5; ARSSA, Servizio Agropedologia. Rubbettino: Catanzaro, Italy, 2003. [Google Scholar]
- IUSS Working Group WRB. World Reference Base for Soil Resources 2014, International Soil Classification System for Naming Soils and Creating Legends for Soil Maps; World Soil Resources Reports No. 106; FAO: Rome, Italy, 2014. [Google Scholar]
- Guagliardi, I.; Rovella, N.; Apollaro, C.; Bloise, A.; De Rosa, R.; Scarciglia, F.; Buttafuoco, G. Modelling seasonal variations of natural radioactivity in soils: A case study in southern Italy. J. Earth Syst. Sci. 2016, 8, 1569–1578. [Google Scholar] [CrossRef]
- Caloiero, T.; Callegari, G.; Cantasano, N.; Coletta, V.; Pellicone, G.; Veltri, A. Bioclimatic analysis in a region of southern Italy (Calabria). Plant Biosyst. 2016, 150, 1282–1295. [Google Scholar] [CrossRef]
- Coscarelli, R.; Gaudio, R.; Caloiero, T. Climatic trends: An investigation for a Calabrian basin (southern Italy). IAHS AISH Publication 2004, 286, 255–266. [Google Scholar]
- Sirangelo, B.; Caloiero, T.; Coscarelli, R.; Ferrari, E. A stochastic model for the analysis of the temporal change of dry spells. Stoch. Environ. Res. Risk Assess. 2015, 29, 143–155. [Google Scholar] [CrossRef]
- Buttafuoco, G.; Caloiero, T.; Guagliardi, I.; Ricca, N. Drought assessment using the reconnaissance drought index (RDI) in a southern Italy region. In Proceedings of the 6th IMEKO TC19 Symposium on Environmental Instrumentation and Measurements, Reggio Calabria, Italy, 24–25 June 2016; pp. 52–55. [Google Scholar]
- Buttafuoco, G.; Caloiero, T.; Ricca, N.; Guagliardi, I. Assessment of drought and its uncertainty in a southern Italy area (Calabria region). Measurement 2018, 113, 205–210. [Google Scholar] [CrossRef]
- Pellicone, G.; Caloiero, T.; Modica, G.; Guagliardi, I. Application of several spatial interpolation techniques to monthly rainfall data in the Calabria region (southern Italy). Int. J. Climatol. 2018, 38, 3651–3666. [Google Scholar] [CrossRef]
- Guagliardi, I.; Cicchella, D.; De Rosa, R.; Buttafuoco, G. Assessment of lead pollution in topsoils of a southern Italy area: Analysis of urban and peri-urban environment. J. Environ. Sci. 2015, 33, 179–187. [Google Scholar] [CrossRef]
- Guagliardi, I.; Rovella, N.; Apollaro, C.; Bloise, A.; De Rosa, R.; Scarciglia, F.; Buttafuoco, G. Effects of source rocks, soil features and climate on natural gamma radioactivity in the Crati valley (Calabria, Southern Italy). Chemosphere 2016, 150, 97–108. [Google Scholar] [CrossRef]
- Esri. World Topographic Map. 19 February 2012. Available online: http://www.arcgis.com/home/item.html?id=30e5fe3149c34df1ba922e6f5bbf808f (accessed on 14 June 2013).
- ESRI. ArcGIS; version 9.2; ESRI: Redlands, CA, USA, 2006. [Google Scholar]
- Tewabe, D.; Fentahun, T. Assessing land use and land cover change detection using remote sensing in the Lake Tana Basin, Northwest Ethiopia. Cogent Environ. Sci. 2020, 6, 177899. [Google Scholar] [CrossRef]
- Singh, A. Digital change detection techniques using remotely-sensed data. Int. J. Remote Sens. 1989, 10, 989–1003. [Google Scholar] [CrossRef]
- Getu, K.; Bhat, H.G. Analysis of spatio-temporal dynamics of urban sprawl and growth pattern using geospatial technologies and landscape metrics in Bahir Dar, Northwest Ethiopia. Land Use Policy 2021, 109, 105676. [Google Scholar] [CrossRef]
- Liu, H.; Zhou, Q. Accuracy analysis of remote sensing change detection by rule-based rationality evaluation with post-classification comparison. Int. J. Remote Sens. 2004, 25, 1037–1050. [Google Scholar] [CrossRef]
- Aspinall, R.J.; Hill, M.J. Land cover change: A method for assessing the reliability of land cover changes measured from remotely-sensed data. In Proceedings of the International Symposium on Geoscience and Remote Sensing, Singapore, 3–8 August 1997; pp. 269–271. [Google Scholar]
- Campbell, J.B.; Wynne, R.H. Introduction to Remote Sensing, 5th ed.; Guilford Press: New York, NY, USA, 2011. [Google Scholar]
- Feranec, J.; Soukup, T.; Hazeu, G.; Jaffrain, G. (Eds.) European Landscape Dynamics. Corine Land Cover Data; CRC-Press: Boca Raton, CA, USA, 2016. [Google Scholar]
- Aune-Lundberg, L.; Strand, G.-H. The content and accuracy of the CORINE Land Cover dataset for Norway. Int. J. Appl. Earth Obs. Geoinf. 2021, 96, 102266. [Google Scholar] [CrossRef]
- Jaeger, J.A.G. Landscape division, splitting index, and effective mesh size: New measures of landscape fragmentation. Landsc. Ecol. 2000, 15, 115–130. [Google Scholar] [CrossRef]
- Forman, R.T.T.; Godron, M. Landscape Ecology; John Wiley and Sons: New York, NY, USA, 1986. [Google Scholar]
- Gustafson, E.J.; Parker, G.R. Relationships between landcover proportion and indices of landscape spatial pattern. Lands. Ecol. 1992, 7, 101–110. [Google Scholar] [CrossRef]
- Li, H.; Reynolds, J.F. A new contagion index to quantify spatial patterns of landscapes. Landsc. Ecol. 1993, 8, 155–162. [Google Scholar] [CrossRef]
- McGarigal, K.; Marks, B. FRAGSTATS: Spatial Analysis Program for Quantifying Landscape Structure; Gen. Tech. Rep. PNW-GTR-351; USDA Forest Service: Portland, OR, USA, 1995. [Google Scholar]
- Milne, B.T. Lessons from Applying Fractal Models to Landscape Patterns. In Quantitative Methods in Landscape Ecology; Turner, M.G., Gardner, R.H., Eds.; Springer: New York, NY, USA, 1991; pp. 199–235. [Google Scholar]
- Musick, H.B.; Grover, H.D. Image textural measures as indices of landscape pattern. In Quantitative Methods in Landscape Ecology; Turner, M.G., Gardner, R.H., Eds.; Springer: New York, NY, USA, 1991; pp. 289–307. [Google Scholar]
- O’Neill, R.V.; Krummel, J.R.; Gardner, R.H.; Sugihara, G.; Jackson, B.; DeAngelis, D.L.; Milne, B.T.; Turner, M.G.; Zygmunt, B.; Christensen, S.W.; et al. Indices of landscape pattern. Landsc. Ecol. 1988, 1, 153–162. [Google Scholar] [CrossRef]
- Turner, M.G. Spatial and temporal analysis of landscape patterns. Lands. Ecol. 1990, 4, 21–30. [Google Scholar] [CrossRef]
- Nong, D.H.; Lepczyk, C.A.; Miura, T.; Fox, J.M. Quantifying urban growth patterns in Hanoi using landscape expansion modes and time series spatial metrics. PLoS ONE 2018, 13, 0196940. [Google Scholar] [CrossRef]
- Reis, J.P.; Silva, E.A.; Pinho, P. Spatial metrics to study urban patterns in growing and shrinking cities. Urban Geogr. 2016, 37, 246–271. [Google Scholar] [CrossRef]
- OSDDT. Med Project—Land Use and Sustainable Development of Territories of Mediterranean Areas. 2014. Available online: https://www.programmemed.eu/index.php?id=5175&L=1 (accessed on 31 May 2013).
- Turner, M.G.; Gardner, R.H. Quantitative Methods in Landscape Ecology; Springer: New York, NY, USA, 1991. [Google Scholar]
- Kupfer, J.A. Theory in Landscape Ecology and Its Relevance to Bio-Geography. In The SAGE Handbook of Biogeography; Sage: Thousand Oaks, CA, USA, 2011. [Google Scholar]
- Turner, M.G. Landscape ecology: What is the state of the science? Annu. Rev. Ecol. Evol. Syst. 2005, 36, 319–344. [Google Scholar] [CrossRef]
- Wu, J.; Hobbs, R. Key issues and research priorities in landscape ecology: An idiosyncratic synthesis. Landsc. Ecol. 2002, 17, 355–365. [Google Scholar] [CrossRef]
- Li, H.; Wu, J. Use and misuse of landscape indices. Landsc. Ecol. 2004, 19, 389–399. [Google Scholar] [CrossRef]
- Li, W.; Chen, T.; Wentz, E.A.; Fan, C. NMMI: A mass compactness measure for spatial pattern analysis of areal features. Ann. Am. Assoc. Geogr. 2014, 104, 1116–1133. [Google Scholar] [CrossRef]
- Dadashpoor, H.; Azizi, P.; Moghadasi, M. Land use change, urbanization, and change in landscape pattern in a metropolitan area. Sci. Total Environ. 2019, 655, 707–719. [Google Scholar] [CrossRef] [PubMed]
- Li, H.; Peng, J.; Liu, Y.; Hu, Y. Urbanization impact on landscape patterns in Beijing City, China: A spatial heterogeneity perspective. Ecol. Indic. 2017, 82, 50–60. [Google Scholar] [CrossRef]
- Fenta, A.A.; Yasuda, H.; Haregeweyn, N.; Belay, A.S.; Hadush, Z.; Gebremedhin, M.A.; Mekonnen, G. The dynamics of urban expansion and land use/land cover changes using remote sensing and spatial metrics: The case of Mekelle City of northern Ethiopia. Int. J. Remote Sens. 2017, 38, 4107–4129. [Google Scholar] [CrossRef]
- Salem, M.; Tsurusaki, N.; Divigalpitiya, P. Land use/land cover change detection and urban sprawl in the peri-urban area of greater Cairo since the Egyptian revolution of 2011. J. Land Use Sci. 2019, 15, 592–606. [Google Scholar] [CrossRef]
- Mariwah, S.; Osei, K.N.; Amenyo-Xa, M.S. Urban land use/land cover changes in the Tema metropolitan area (1990–2010). GeoJournal 2015, 82, 247–258. [Google Scholar] [CrossRef]
Disclaimer/Publisher’s Note: The statements, opinions and data contained in all publications are solely those of the individual author(s) and contributor(s) and not of MDPI and/or the editor(s). MDPI and/or the editor(s) disclaim responsibility for any injury to people or property resulting from any ideas, methods, instructions or products referred to in the content. |
© 2023 by the authors. Licensee MDPI, Basel, Switzerland. This article is an open access article distributed under the terms and conditions of the Creative Commons Attribution (CC BY) license (https://creativecommons.org/licenses/by/4.0/).