Abstract
Monitoring spatiotemporal changes in tidal wetlands under the disturbance of human activities provides a strong basis for coastal wetland protection and restoration. Long-term serial remote sensing images and other historical data were collected and analysed to investigate the distribution of tidal wetlands of Yueqing Bay in 1969, 1981, 1993, 2003, 2013, and 2021, a case study across the past 50 years. The data revealed that human activities cumulatively caused the net loss of approximately 59.62 km2 in area of tidal wetlands during the observation period. Firstly, between 1969 and 1993, reclamation primarily accounted for the variation of the tidal wetlands. Furthermore, between 1993 and 2013, the invasion of Spartina alterniflora and mudflat aquaculture also became important influencing factors. Between 2013 and 2021, development activities eased, and mangrove planting area increased. Over the analysis period, the overall results revealed that the tidal wetlands in Yueqing Bay underwent a transformation process from the relatively simple effects of exploitation by reclamation to the collective influence of combined exploitation and restoration, increasing the overall diversity of Yueqing Bay tidal wetlands over the study period.
1. Introduction
Coastal wetlands are one of the most important ecosystems worldwide, given that they play an important role in protecting coasts, regulating climate, and sequestering blue carbon [1,2]. Therefore, it is necessary to protect coastal wetlands to ensure the sustainable development of coastal areas [3]. Coastal wetlands have a relatively fragile ecological environment and undergo highly dynamic variation [4,5,6,7,8]. As the main component of coastal wetlands, tidal wetlands between the coastline and the 0 m isobath are the areas most affected by human activities, such as land reclamation and restoration and aquaculture. Therefore, to protect coastal wetlands and strategically manage coastal zones, it is important to monitor the variation in the inner and outer boundaries of tidal wetlands, determine spatiotemporal changes in wetland types, and analyse the effects of combined human activities on wetlands [9,10,11].
Compared to traditional survey methods, remote sensing is the most effective technique for monitoring patterns and spatiotemporal variation in tidal wetlands because of its macroscopic, dynamic, detail, and efficiency advantages [12,13,14,15]. Yang et al. [16] and Wang et al. [17] used time series Landsat images to monitor the spatiotemporal dynamics of tidal flats along the eastern coast of the United States from 1986 to 2020 and the tidal flats along the coast of China from 1986 to 2016, respectively. Lee and Kim [18] used multi-temporal aerial images to monitor topographic change on the tidal flats of Suncheon Bay. Their comparison showed that previous studies monitoring the long-term evolution of tidal wetlands predominantly used Landsat and other medium resolution images, achieving sufficient temporal resolution to enable better time continuity. Meanwhile, it was difficult for studies using high-resolution images to achieve long-term monitoring [4]. Most of them carried out fine classification of wetlands [19,20,21,22]. Therefore, the combination of medium-resolution and high-resolution images can help us to monitor the impact of long-term human activities and accurately draw wetland maps depicting specific time points [23,24,25].
A variety of human activities continuously damaged tidal wetland patterns and functions. This led to a substantial reduction in value in wetland ecosystem services [26,27,28,29,30,31]. Lin and Yu [32] discussed the loss of natural coastal wetlands from land conversion and ecological degradation from coastal urbanisation in China. Most natural coastal wetland conversion losses were for agricultural land use, including aquaculture. Chen et al. found that reclamation surpassed the natural changes and was one of the main reasons for wetland losses. A false increase from the Spartina alterniflora invasion was the reason for the increase in spatial area of saltmarshes [33].
To date, most studies used remote sensing images to extract the outer boundary of tidal wetlands (0 m isobath). The tidal flats are only fully exposed at low tide. This means that the tide can hinder the detection of changes in the range of large tidal flats [34]. However, some studies only focused on the change in the land boundary (coastline) of the tidal wetland under the assumption that the outer boundary did not change [35,36], which is also likely inaccurate. For these reasons, we collected the bathymetric data from the last 50 years and examined changes in the internal and external boundaries of the tidal wetland, to more effectively reflect the changes in the transition area between the sea and the land.
Yueqing Bay is a representative semi-enclosed bay along the Chinese coast of the East China Sea. The total sea area is 436.6 km2, of which tidal wetlands account for approximately 48% [37]. Yueqing Bay has extensive tidal flats, fertile water, and is a rich nursery habitat for bait organisms, supporting the largest natural shellfish culture base in China [38]. It is a vital habitat for many rare and endangered waterfowl during winter and breeding season [38]. Therefore, it was listed as an important bird area by the International Union for the Conservation of Birds [38]. Yueqing Bay is also the northernmost limit of mangrove distribution in China [39]. To reinforce mangrove protection, China’s first national marine protected area was established in 2005 on Ximen Island in the Inner Bay of Yueqing Bay. Since the 1980s, the rapid economic development of coastal areas and human activities, such as reclamation and mudflat aquaculture, substantially changed the coastline of Yueqing Bay over a relatively short period [40]. The ranges and pattern of tidal wetlands in the bay also changed considerably [41]. The invasion and expansion of Spartina alterniflora (S. alterniflora) posed a considerable threat to the mangrove ecosystem and mudflat aquaculture in Yueqing Bay [42]. Conflict between the fragile ecological environment and intense human activities in Yueqing Bay became increasingly prominent [40]. Therefore, Yueqing Bay was taken as a typical case study of the government’s “Blue Bay” renovation and restoration project to explore the monitoring technology path from “over development” to “governance and restoration” and then, to “sustainable development” of tidal wetlands. The specific objectives were: (i) classify the tidal wetlands types in the bay by applying long-term sequence remote sensing images, bathymetric charts, and other data. (ii) Analyse the temporal and spatial changes of tidal wetlands over the past 50 years. (iii) Explore the impacts of various human influence on the changes in tidal wetlands in Yueqing Bay over the study period.
2. Materials and Methods
2.1. Study Area
Yueqing Bay (27°59′09″–28°24′16″ N, 120°57′55″–121°17′09″ E) forms part of the Yueqing, Wenling, and Yuhuan cities in Zhejiang Province (Figure 1). It is located in the subtropical monsoon climate zone, with an average annual temperature of 17–18 °C, and an average annual precipitation of 1300–1700 mm. Seasonal disasters, such as cold waves, droughts, floods, and typhoons, are frequent in this region. The bay is oriented in a north–south direction, surrounded by land on three sides in the east, north, and west, of which the Yandang Mountains are on the west and north sides. The Yuhuan Peninsula is in the east, and Xiaomen and the Damen islands are barriers at the mouth of the bay. This connects to the mouth of the Oujiang River to the west through the Shatou Channel, and to the East China Sea through the Yuhuan South and Huangdaxia Channels to the east. Based on the plane form, the bay can be divided into two parts comprising the south and the north. The southern trumpet-shaped part is the outer bay, where the terrain slopes from the west to the east, and the deep trough is close to the eastern bank. The northern part is an inner bay, controlled by bedrock islands, with alternate development of tidal channels and tidal wetlands. Yueqing Bay is an unconventional semi-diurnal strong tide area, where the average tidal range gradually increases from 4.2 m at the mouth of the bay to approximately 5.2 m at the top of the bay (Jiangxia tide station). Here, the maximum tidal range can reach more than 8.5 m. In 1980, China’s largest tidal power station, Jiangxia Tidal Power Station, was built in this bay and is still operational. The seabed sediments in Yueqing Bay are dominated by silty clay, which covers more than 95% of the area. It is predominantly composed of sediments from the Yangtze River that transport southward with the East China Sea Coastal Current, sediments resuspended from the inner continental shelf, and sediments that flow into the sea from the Oujiang River, all of which are deposited with tidal inflow.
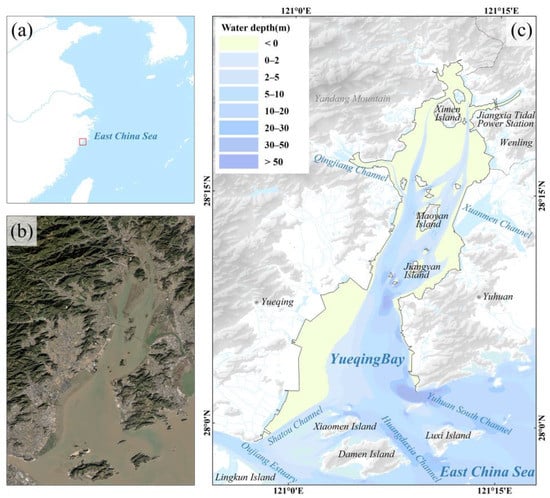
Figure 1.
Map of the study area. (a) Location of the study area. (b) Landsat-8 images: 20 September 2021. (c) Topography of Yueqing Bay in 2021.
2.2. Methods
2.2.1. Data Collection and Pre-Processing
The remotely sensed and bathymetric datasets used in this study are summarised in Table 1. KH-4A satellite images for 1969 and 1970 were obtained from USGS (https://earthexplorer.usgs.gov/, accessed on 5 May 2022), which were used to interpret the coastline location and tidal wetland type in 1969. The Landsat series images were downloaded from Geospatial Data Cloud (http://www.gscloud.cn/, accessed on 5 May 2022). The selected Landsat images were taken in summer to meet the requirements for lush vegetation growth. Through visual inspection and comparison, images at five time points from 1981 to 2021 with low cloud cover and low tide levels were selected.

Table 1.
Data collected.
The latest aerial images were also collected from Zhejiang Provincial Archives of Surveying and Mapping Data to verify the Landsat image classification results and the interpretation of wetland types, including tidal shellfish cultivation and mangrove saplings (Table 1). These images were pre-processed with image mosaics including geometric mosaic and colour mosaic, image optimisation, that is, mainly band correction, atmospheric correction, and image enhancement, and fine image correction.
Bathymetric charts from 1964, 1978, 2002, 2013, and 2020 with the sources listed in Table 1 were acquired to determine the position of the 0 m isobath in Yueqing Bay over different time points. ArcGIS software was used for coordinate transformation and projection transformation to standardise these bathymetric charts to the WGS-84 coordinate system and Gauss–Krüger projection. The intersection points of the square grid were used for geometric registration. Field investigations were conducted in March 2021 and June 2022 for on-site verification, positioning, and photography of the tidal wetland maps.
2.2.2. Coastline and 0 m Isobath Extraction
The coastline is defined as the boundary between the sea and the land at the mean high tide level of the spring tide over many years [43,44]. According to field investigation, the natural coastlines of Yueqing Bay are all rocky coastlines, and their positions are determined at the dry and wet trace lines of the rock base. The rocky coastlines was not changed during the study period because it was not modified by human activities. The artificial coastlines of Yueqing Bay are composed of permanent artificial structures, including seawalls, wharves, and dams on the outer edge of the aquaculture area. During the study period, the location of the artificial coastlines had undergone significant changes. The artificial coastlines at each time point are determined at the seaward edges of the permanent artificial structures of the year, as these edges are the positions where the average spring tide reaches.
In March 2021, we used DGPS to conduct positioning measurements on all artificial coastlines and parts of accessible natural coastlines in Yueqing Bay. We visually interpreted the dry and wet trace lines of the rocky coast in the aerial images to supplement parts of rocky coastlines that were not measured in the field. We aligned our successive Landsat images using the unchanged rocky coastline as a baseline to determine the changing position of the artificial coastline at the various time points. Based on field investigation results and coastline interpretation markers proposed by previous studies [45,46], we used remote sensing images to extract the coastline from 1970 to 2013 [47]. Due to the bright white smooth texture of the artificial coastlines in the pseudo colour composite image, we used the Linear Constructor in ArcGIS 10.6 to extract coastlines for each year of interest in a forward chronological order by editing the changed part of the artificial coastlines in a continuous image pair.
Using ArcGIS 10.6, the “Raster Interpolation” command from the spatial analysis module was used to interpolate the data points of the bathymetric charts. The “Surface Contour” command was then used to extract the position vector of the 0 m isobath. Except for 1993, the satellite images and bathymetric charts were roughly corresponding in time (Table 1). To facilitate analysis and comparison of different time points, linear interpolation was performed on the 0 m isobaths in 1978 and 2002 to generate the 0 m isobath for 1993.
2.2.3. Extraction of Tidal Wetlands
The Ramsar Convention describes offshore and coastal wetlands as shallow seas, coasts, estuaries, and coastal lake wetlands formed by natural coastal landforms. These wetlands can be categorised as mangroves, seagrass wetlands, tidal marshes, and tidal flats. Based on the existing wetland classification system, combined with the state of Yueqing Bay and the feasibility of implementing remote sensing monitoring, the classification system and interpretation symbols of the Yueqing Bay tidal wetlands were determined (Table 2).
Table 2.
Tidal wetland classification system and interpretation symbol.
Supervised classification was widely used to map land cover types in small study areas [22]. Among the various methods of supervised classification, the likelihood classification showed the best interpretation effect in the preliminary test. Therefore, the likelihood classification combined with visual interpretation were used to achieve a more accurate classification of the tidal wetland types in Yueqing Bay.
The tidal wetlands were visually interpreted on the KH-A images of 1969 and 1970. The distribution of tidal wetland types in this time point was regarded as the natural initial state of Yueqing Bay prior to disturbance from human activities. The likelihood classification of supervised classification provided by ENVI 5.3 was then used to classify the Landsat images. During selection of input the training samples, we used NDVI and NDWI indexes to help distinguish vegetation from non-vegetation, and water from non-water. To reduce the error, the classification results were corrected using visual interpretation after automatic classification. In line with the coastline extraction process, the visual interpretation correction of wetland types was also performed recursively forward in time. The areas that changed were modified to obtain the distribution results of wetland types in each time point (Figure 2). The mangroves in Yueqing Bay were all artificially cultivated, and the shape of the patches was relatively regular. The Landsat image series had a more successful interpretation outcome for perennial mangrove forests, but not for newly planted mangrove seeding areas with sparse vegetation and underdeveloped leaves. To this end, this study used up-to-date aerial imageries to supplement the visual interpretation of newly planted mangrove saplings. Mudflat aquaculture in Yueqing Bay is divided into two types with pond cultivation along the coast and shellfish cultivation on the tidal flats, both of which belong to different wetland types. To distinguish these two wetland types, we compared remote sensing images with low cloud cover and high tide levels to the images used for classification in a similar time point. The areas in the images exposed to high tides were pond cultivation areas. Meanwhile, the ones submerged during high tides were the shellfish cultivation areas on tidal flats.
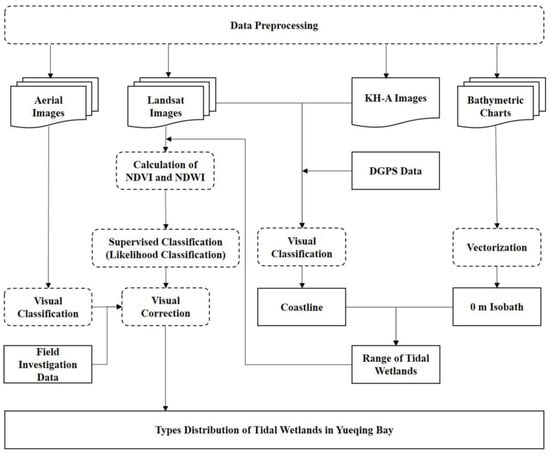
Figure 2.
The technical process used for tidal wetland classification.
3. Results
3.1. Accuracy Assessment on Tidal Wetland Classification
Based on ArcGIS and Excel, we assessed the accuracy of classification results of tidal wetlands in 2021 (Table 3). Considering that the area of different types of wetlands varied greatly, we generated 50 random sample points in each mapped category. Using field investigation samples and high-resolution aerial images as reference, analysts visually judged the classification results of each sample point. When calculating the summary metrics, the PontiusMatrix42.xlsx (http://www2.clarku.edu/~rpontius/, accessed on 5 May 2022) was used to compute the estimated population confusion matrix in a manner that accounts for the stratified sampling design [48]. The assessment results showed that the map had a good estimate of the artificial ponds, with an error of 1%. The map underestimated the size of the tidal marshes by 17% and overestimated the size of the tidal flats by 3%, which may be affected by the tide level when remote sensing images were taken. Most importantly, the map underestimated the size of mangroves by 72%, indicating that the Landsat image did not provide a good interpretation of the artificially cultivated area of mangrove seedlings with sparse leaves in the Yueqing Bay.
Table 3.
Confusion matrices of the classification results for 2021.
3.2. Change of Tidal Wetland Boundary
The extraction results of the coastline and 0 m isobath position information (Figure 3) showed that the boundary of the tidal wetlands in Yueqing Bay was undergoing constant dynamic changes over the last 50 years. The change in the inner boundary (coastline) was predominantly because of the change of the position of the outer edge of the seawall in the reclamation project. The outer boundary (0 m isobath) also roughly showed the seaward expansion, especially in the south tidal flat of Ximen Island in the inner bay, the tidal flats on both sides of the Qingjiang Channel, the southern tidal flat in Xuanmen Channel, and the west tidal flat in the outer bay. In some areas, such as the tidal flat along the western coast of the outer bay, the 0 m isobath receded landwards. As shown in Figure 4, the tidal wetland area in Yueqing Bay decreased from 251.21 km2 in 1969 to 191.59 km2 in 2021.
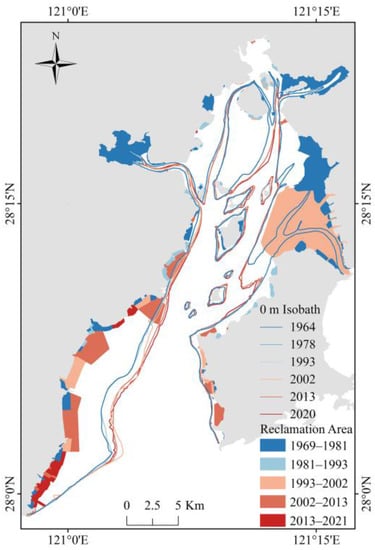
Figure 3.
Changes in coastline and the 0 m isobath in Yueqing Bay. The location of the coastline was determined by the outer boundary of the reclamation area in each time point.
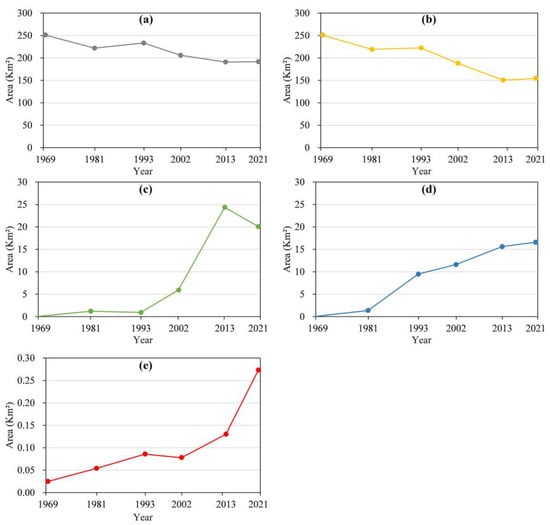
Figure 4.
The area of tidal wetland types in Yueqing Bay during 1969–2021. (a) Total tidal wetlands, (b) tidal flats, (c) tidal marshes, (d) artificial ponds, and (e) mangroves.
3.3. Temporal Evolution of Tidal Wetland Types
After data pre-processing, extraction of dynamic wetland boundaries, and image interpretation and correction, the distribution of various tidal wetland types in Yueqing Bay from 1969 to 2021 was obtained (Figure 5).
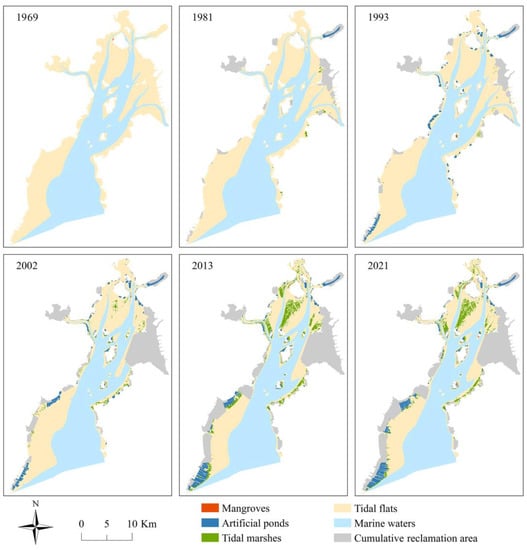
Figure 5.
Map of wetland types distribution in Yueqing Bay from 1969 to 2021.
Since 1969, the tidal wetland area in Yueqing Bay decreased during each time point (Figure 4), and the distribution pattern also changed detectably. As shown in Figure 4, the natural wetland areas decreased from 251.21 km2 in 1969 to 175.00 km2 in 2021, with the proportion of the total wetland area declining from 100% to 91.34%. Artificial wetlands (artificial ponds) were built following the construction of the artificial reservoir of Jiangxia Tidal Power Station in 1981, with an area of about 1.40 km2. After the 1990s, artificial ponds continued to expand, and the area gradually increased to 16.59 km2 in 2021, accounting for about 8.66%. In the natural wetlands, the tidal flats were substantially reduced, with their area decreasing from 251.18 km2 in 1969 to 154.66 km2 in 2021. The tidal marsh area increased substantially from 1.21 km2 in 1981 to 20.07 km2 in 2021. Meanwhile, the mangrove area, which was only 0.03 km2 in 1969, increased to 0.27 km2 in 2021.
The most detectable transformation of various tidal wetland types in Yueqing Bay occurred from tidal flats to land (reclamation area), tidal marshes, and artificial ponds, and showed pronounced phased characteristics (Figure 6). From 1969 to 1993, the conversion from tidal flats to land was the main type of wetland variation during this time interval, with an area of 38.63 km2. The area of shallow marine waters silted into tidal flats was 21.87 km2. From 1993 to 2021, the conversion between various wetland types was more complex than in the previous time interval. The conversion area from tidal flats to land reached 58.53 km2. The area from the water area to tidal flats was 24.99 km2. The relatively large area was the conversion from tidal flats to tidal marshes and artificial ponds, both with the area of 19.69 km2.
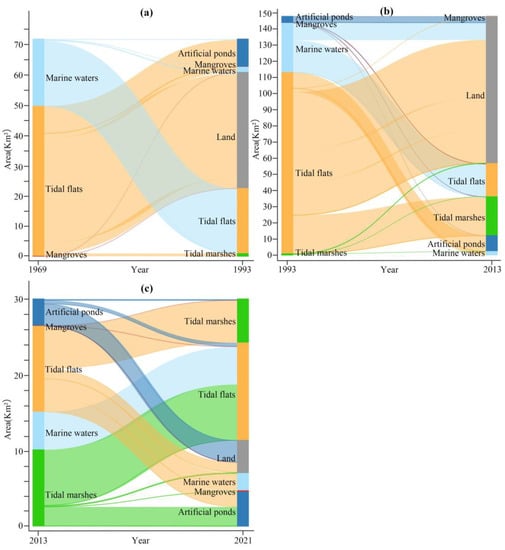
Figure 6.
Sankey diagram of the transformations of the tidal wetland types. (a)1969–1993. (b) 1993–2013. (c) 2013–2021.
3.4. Spatial Transformation of the Tidal Wetland Types
Figure 7 shows that since 1969, the spatial transformation of tidal wetland types in Yueqing Bay occurred in different time intervals. From 1969 to 1993, the change in tidal wetlands mainly occurred in the upper tidal flats along the coast. During 1969–1981, large areas of the tidal flats were transformed into land along the east and west coasts of the inner bay. During 1981–1993, artificial pond cultivation started spreading extensively in the bay. The tidal flats on the west side of the bay continued to silt up and expanded seaward. Compared with the previous time interval, from 1993 to 2021, the areas with changing tidal wetlands gradually extended from the upper tidal flats to the middle tidal flats, and the regions of variation became increasingly fragmented. During 1993–2002, tidal marshes colonised the upper tidal flats of the bay. Pond cultivation in the bay mainly expanded along the coastline, and the large area of tidal flats and shallow marine waters in the Xuanmen Channel area were converted into land. During 2002–2013, parts of the tidal flats along the west side of the outer bay were converted into land. Pond cultivation expanded in the bay, most prominently vertically towards the middle tidal flat areas perpendicular to the coastline. During this time interval, the spatial distribution of the tidal marshes expanded substantially, and vegetation covered all the exposed tidal flats on the upper tidal flats of the bay. During 2013–2021, the number of large patches transitioning to non-wetlands on the upper tidal flats near the coastline decreased compared to previous time intervals. The type conversion mainly occurred between tidal marshes and tidal flats, and was mostly scattered in the middle tidal flats.
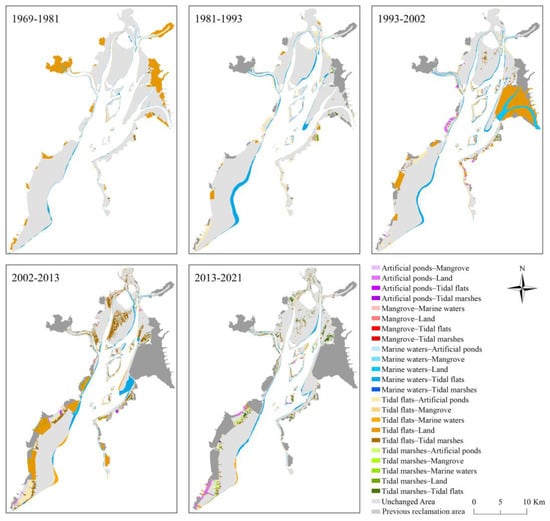
Figure 7.
Spatial distribution of the conversions of the tidal wetland type in different time intervals after 1969.
4. Discussion
4.1. Influence of the Reclamation Project on Tidal Wetlands
The results indicated that the reclamation project was one of the main human factors driving the variation of the spatial pattern of the tidal wetlands [11,15,49]. However, it exhibited dual characteristics of effect on Yueqing Bay. Reclamation projects directly led to the loss of large areas of tidal wetlands (Figure 3) [44,50]. As shown in Figure 8, during 1969–2021, the reclamation area in Yueqing Bay reached 110.51 km2, accounting for 25.34% of the total area in 1969. However, the reclamation scale in each time interval differed considerably (Figure 8). During 1969–1981, the reclamation area was 34.21 km2. Meanwhile, during 1981–1993, only sporadic reclamation along the coast of Yueqing Bay was observed, comprising 3.51 km2. During 1993–2002, the total reclamation area reached 46.09 km2, owing to the Xuanmen Channel reclamation project, which was the largest reclamation project in Yueqing Bay during the study period. The reclamation area from this project reached 36.18 km2 [44]. During 2002–2013 and 2013–2021, the reclamation areas were 22.63 km2 and 4.18 km2, respectively. The large reduction in reclamation area in the last time interval could be attributed to annual enclosing and reclamation quota management that was implemented in China since 2010, especially the strict control of reclamation activities since 2018 [51]. However, the reclamation project promoted siltation [52,53], which accelerated the natural land formation [54]. This was associated with the reduction in the tidal prism in the bay because of reclamation [41]. Overall, the tidal current dynamics was weakened, and the sediment-carrying capacity of the tidal current was reduced. This then facilitated the deposition of suspended sediment [33]. During 1964–1978, the area of newly increased tidal wetlands in Yueqing Bay was 4.78 km2, with an annual average addition rate of only 0.34 km2/year (Figure 8). Considering that the largest Qingjiang Channel reclamation project in this time interval was completed in 1978 (Figure 7), the impact lagged, and the addition rate to the tidal flats during this time interval could be considered as the background rate under no impacts from human activities. During 1978–1993 and 1993–2002, the areas of newly increased tidal wetlands were 14.83 km2 and 18.97 km2, respectively. The annual average addition rates reached 0.99 km2/year and 2.11 km2/year, respectively. During 2002–2013 and 2013–2020, the area of newly increased tidal wetlands was 7.5 km2 and 4.93 km2, respectively, with annual average addition rates of 0.68 km2/year and 0.7 km2/year, respectively. Sedimentation and expansion of tidal wetlands were consistent with the reclamation process (Figure 8). The reclamation project accelerated an increase in the elevation of tidal flats. This determined the boundary position of the tidal marsh with the change in the elevation and the submergence time. Therefore, this may have affected the expansion and spatial distribution of the tidal marshes [55,56].
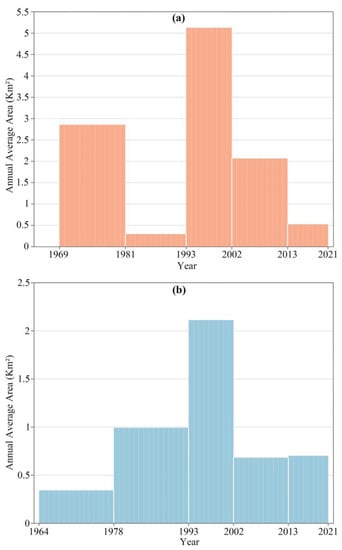
Figure 8.
Reclamation area (a) and natural expansion area (b) of tidal wetlands in Yueqing Bay.
4.2. Influence of S. alterniflora Invasion on Tidal Wetlands
S. alterniflora was first introduced to the coast of northern Jiangsu in China in 1979 [57]. It was cultivated in many areas in the 1980s, and eventually, it rapidly expanded into the intertidal zone south of the Yangtze River in the early 1990s [58]. S. alterniflora promoted sediment siltation [59], helped to stabilise coasts, protected against typhoons, provided ecological and economic benefits for coastal development, provided a habitat for many birds and fish, and considerably affected the marine environment and biodiversity [60,61,62]. However, ecological problems caused by the rapid expansion of S. alternifolia attracted research attention, such as altering traditional landscape, threatening biodiversity, and degrading ecosystem functioning [63,64,65]. Remote sensing images (Figure 5) showed that there was almost no plant growth on the tidal flats of Yueqing Bay in 1969. Only a small proportion of artificially planted mangroves grew on the west coast of Ximen Island. The images in 1981 and 1993 showed that there were scattered tidal marshes on the tidal flats where some local plants grew. In 1989, S. alterniflora was artificially introduced to Lingkun Island near the mouth of the bay for coastal protection and deposition promotion for reclamation. Around 2000, it gradually settled and spread across the tidal flats of Yueqing Bay and became the single dominant species in the tidal marshes of Yueqing Bay [42]. As shown in Figure 4, the area under S. alterniflora in Yueqing Bay was 5.94 km2 and 24.36 km2 in 2002 and 2013, respectively, and decreased slightly to 20.07 km2 in 2021. This evolution process was consistent with the three time intervals proposed by previous researchers; that is, the colonisation period of 1993–1999, the expansion period of 1999–2009, and the slow development period after 2009 [41]. Therefore, the invasion of S. alterniflora changed the pattern of tidal wetland types in Yueqing Bay, affecting the ecology and biodiversity of tidal wetlands. However, based on the distribution of S. alterniflora (Figure 5), most plants were distributed in the middle and lower zones, which was not consistent with its fundamental feature of having the high tidal flats along the coast as its dominant distribution area. According to previous studies on the Yangtze River estuary, reclamation and plant invasion are not isolated phenomena. These two factors together accelerate the siltation of tidal flats in the study area. Meanwhile, the clearance of S. alterniflora by reclamation changed its spatial distribution pattern [56]. For Yueqing Bay, in addition to reclamation, shellfish cultivation activities on the tidal flats was also a reason to shape the spatial form of S. alterniflora (see Section 4.3).
4.3. Influence of Mudflat Aquaculture on Tidal Wetlands
Mariculture covered the largest area of China’s coastal waters assigned for development and use [66,67]. In Yueqing Bay, mudflat aquaculture accounts for most of the mariculture. According to the aquaculture mode, mudflat aquaculture can be divided into two types, that is, pond cultivation along the coast and shellfish cultivation on the tidal flats. Pond cultivation refers to artificially digging ponds for mariculture by building simple dikes to enclose tidal flats. The seawater in these ponds is irregularly replaced through simple sluices, and this corresponds to the wetland category of constructed wetland (Table 2). In line with farmland area, the shellfish cultivation area is divided by low furrows and ridges. During high tide, seawater can flow freely, and when the tide ebbs, a small amount of seawater remains on the tidal flats. Considering the low impact of shellfish cultivation, we classified it under the category of tidal flats (Table 2).
Before the 1990s, pond cultivation was almost absent in Yueqing Bay (Figure 5). However, after the 1990s, with the advance in artificial breeding technology, pond cultivation activities gradually increased, which were mainly distributed on the west coast of Yueqing Bay. The area under these activities was 9.48 km2 in 1993, which increased to 44.61 km2 in 2003, 15.6 km2 in 2013, and 16.59 km2 in 2021. Previous researchers’ monitoring of aquaculture pond areas in China’s coastal areas from 1984 to 2016 showed that the largest expansion of aquaculture ponds in the coastal zone occurred during 1990–2000 [6]. However, the expansion trend slowed down since 2000 [6]. This was consistent with the expansion trend of aquaculture ponds in Yueqing Bay. Similar to the reclamation project, the seaward expansion of aquaculture ponds would also force salt marsh plants to grow in the mudflat zones along the outer edge of the culture area (Figure 5).
Yueqing Bay was always an important natural shellfish seedling base in China. Shellfish cultivation was conducted on its tidal flats for hundreds of years. The area of tidal flat shellfish cultivation reached 68.66 km2 in 2003, accounting for 36.45% of the tidal flat area. However, in recent years, some shellfish cultivation areas were abandoned, as shown by images captured in 2021, and the shellfish cultivation area reduced to 48.80 km2. The large-scale shellfish cultivation area on the tidal flat directly changed the spatial distribution pattern of the tidal marshes. S. alternifolia could only grow and develop a U-shaped distribution along the outer edge or gaps in the cultivation area (Figure 9a,c). S. alternifolia was cleared away in the new shellfish cultivation areas from the tidal marshes (Figure 9c). However, when the shellfish cultivation area was deserted, S. alterniflora re-invaded (Figure 9d), in line with the pattern observed in the south tidal wetlands of Ximen Island.
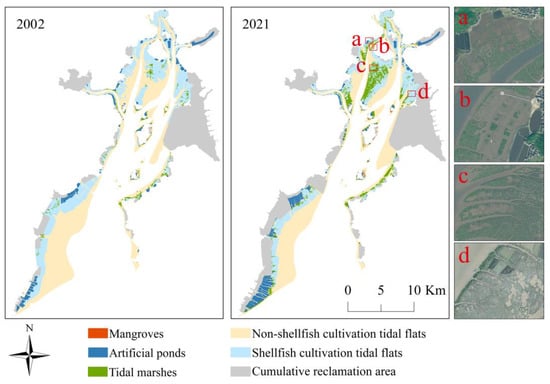
Figure 9.
Distribution of shellfish cultivation, pond cultivation, and tidal marshes in 2003 and 2021. (a) The shellfish cultivation caused the U-shaped distribution pattern of S. alterniflora. (b) S. alterniflora was cleared in mangrove areas. (c) S. alterniflora was cleared in shellfish cultivation areas. (d) S. alterniflora grew again in the abandoned culture area.
4.4. Influence of Mangrove Plantation on Tidal Wetlands
Mangroves act as barriers against wind and waves, protect the coast, purify seawater, sequester blue carbon, maintain ecological stability of the coast, and promote the functioning of the land–sea energy cycle [68,69]. As early as 1957, the Kandelia obovata mangrove was first artificially introduced to Ximen Island in Yueqing Bay, and was then cultivated and propagated in the bay [70]. However, the mangroves in Yueqing Bay were constantly affected by human activities. For example, the construction of coastal protection and reclamation projects after the 1969s and pond cultivation after the 1980s destroyed some mangroves, which, to some extent, hindered the expansion of the mangrove area (Figure 4). In recent years, the local government and public realised the value of mangroves in Yueqing Bay [39]. Therefore, mangroves were introduced and bred in Ximen Island, Maoyan Island, Jiangyan Island, Daqingshan, and many tidal flats on the east coast of Yueqing Bay. By 2021, the mangrove area in Yueqing Bay reached 0.27 km2, eight times compared with 1969. Based on the field investigation in June 2022, new mangrove plantation areas on the north and south sides of the Qingjiang Channel and the east coast of Yueqing Bay were discovered (Figure 10b–d). On the northern bank of the Qingjiang Channel, mangroves were planted on the field ridges in the shellfish cultivation area, to achieve ecological and economic benefits (Figure 10b).
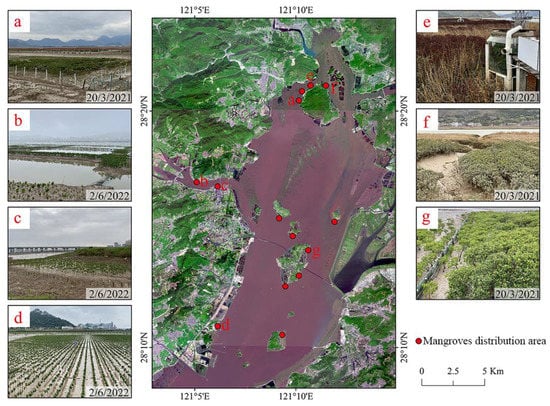
Figure 10.
Distribution of mangroves in Yueqing Bay. (a) The protective net was set to prevent the invasion of S. alterniflora. (b–d) New mangrove afforestation area. (e) Mangrove groups are sheltered in the glasshouses on Ximen Island and mangrove crowns withered because of strong cold waves outside the glasshouses. (f) S. alterniflora invaded the mangrove area. (g) Mangrove area located on Maoyan Island.
Considering the species competition between mangrove species and S. alternifolia, when mangroves were artificially planted, S. alterniflora were holistically cleared initially on the tidal marshes (Figure 10c). The planting area was separated by protective nets to prevent the invasion of S. alterniflora (Figure 10a,g), and mangrove saplings were planted. Compared with the preventive measures in the saplings area, the mangrove area was infested by S. alterniflora, which were not adequately treated (Figure 10e,f). Mangroves mostly grow in tropical and subtropical coastal intertidal zones. Although Kandelia obovata mangroves are resistant to worse climatic conditions, such as low air temperature, low seawater temperature, and frost, owing to the relatively high latitude of Yueqing Bay, this species still face considerable challenges to survival in Yueqing Bay. During the investigation in March 2021, it was found that the previous cold wave in winter caused frostbite, which caused the death of mangrove plants in a large area of Ximen Island. However, the mangroves in the glasshouse used for scientific control in the area grew well (Figure 10e). Therefore, while expanding of mangrove plantation area in the bay, it is important to optimise the cold resistance of plants and improve the ability of mangroves to cope with extreme weather conditions such as low temperature. Therefore, the mangroves in Yueqing Bay can survive and play their ecological roles. These problems still need further study in the future.
5. Conclusions
In this study, long-term serial remote sensing images and other historical data were used to explore the spatiotemporal variation of the tidal wetlands in Yueqing Bay under the influence of human activities over the past 50 years.
In general, the natural seaward expansion of the tidal flats contributed to the increase in the tidal wetlands by 51.01 km2 during the observation period. However, because of the impact of human activities, 110.63 km2 of the tidal wetlands were lost. The overall area of the tidal wetlands in Yueqing Bay was considerably reduced, with a net loss of 59.62 km2.
From 1969 to 1993, the coastal area of Yueqing Bay was gradually exploited. Reclamation was the main reason for the variation of the tidal wetlands during this time interval. This directly caused the loss of 37.72 km2 of tidal wetlands. From 1993 to 2013, compared with the previous time interval, human activities extended from the upper tidal flats to the middle tidal flats, and their intensity also increased. In this time interval, the reclamation area reached 72.91 km2. After being introduced, S. alterniflora survived and rapidly spread in the bay. Its area expanded by approximately 25 times, occupying most of the tidal flats outside the mudflat culture area. The scale of pond cultivation on the west side of the Outer Bay expanded. From 2013 to 2021, under the influence of government policy control, the scale of reclamation and pond cultivation considerably decreased. The implementation of the ecological restoration project reduced the area of S. alterniflora. Meanwhile, the area of mangrove increased by eight times compared with 1969, and its distribution spread to 14 areas in the bay.
This study showed that over the last 50 years, the tidal wetlands in Yueqing Bay underwent a transformation process from simple impacts from reclamation to the joint impacts of various human activities, such as reclamation, invasion of S. alterniflora, the expansion of mudflat aquaculture, and the planting of mangroves. Human activities gradually changed from single exploitation to a combination of exploitation and restoration, improving the overall diversity of tidal wetland over long timescales.
Author Contributions
Research design, X.X.; research implementation, X.X. and M.Z.; writing and revision of the paper, M.Z., X.X. and Y.C.; data collection, M.Z. and X.W.; field investigation and verification, M.Z., Y.L., Z.Z. and J.Z. All authors have read and agreed to the published version of the manuscript.
Funding
This work was funded by the Natural Science Foundation of Zhejiang Province (Grant no. LDT23D06025D06 and Grant no. LZ21D060001).
Data Availability Statement
Not available.
Acknowledgments
We would like to thank Minmin Ding for his help in the field investigation. Anonymous reviewers and the academic editor are thanked for their valuable and constructive comments in improving the overall quality of this work.
Conflicts of Interest
The authors declare no conflict of interest.
References
- Jiang, T.T.; Pan, J.F.; Pu, X.M.; Wang, B.; Pan, J.J. Current status of coastal wetlands in China: Degradation, restoration, and future management. Estuar. Coast. Shelf Sci. 2015, 164, 265–275. [Google Scholar] [CrossRef]
- Sousa, C.A.M.; Cunha, M.E.; Ribeiro, L. Tracking 130 years of coastal wetland reclamation in Ria Formosa, Portugal: Opportunities for conservation and aquaculture. Land Use Policy 2020, 94, 104544. [Google Scholar] [CrossRef]
- Vincent, S.; Owens, K.A. Coastal wetlands of India: Threats and solutions. Wetl. Ecol. Manag. 2021, 29, 633–639. [Google Scholar] [CrossRef]
- Zhang, Y.S.; Wu, H.M.; Liu, D.L. Research on wetland change detection based on Remote Sensing. IOP Conf. Ser. Earth Environ. Sci. 2021, 787, 012061. [Google Scholar] [CrossRef]
- Liao, H.J.; Li, G.S.; Cui, L.L.; Ouyang, N.L.; Zhang, Y.; Wang, S.H. Study on Evolution Features and Spatial Distribution Patterns of Coastal Wetlands in North Jiangsu Province, China. Wetlands 2014, 34, 877–891. [Google Scholar] [CrossRef]
- Wang, J.; Chen, J.S.; Wen, Y.; Fan, W.; Liu, Q.N.; Tarolli, P. Monitoring the coastal wetlands dynamics in Northeast Italy from 1984 to 2016. Ecol. Indic. 2021, 129, 107906. [Google Scholar] [CrossRef]
- Torresan, S.; Critto, A.; Rizzi, J.; Marcomini, A. Assessment of coastal vulnerability to climate change hazards at the regional scale: The case study of the North Adriatic Sea. Nat. Hazards Earth Syst. Sci. 2012, 12, 2347–2368. [Google Scholar] [CrossRef]
- Spencer, T.; Schuerch, M.; Nicholls, R.J.; Hinkel, J.; Lincke, D.; Vafeidis, A.T.; Reef, R.; McFadden, L.; Brown, S. Global coastal wetland change under sea-level rise and related stresses: The DIVA Wetland Change Model. Glob. Planet. Chang. 2016, 139, 15–30. [Google Scholar] [CrossRef]
- Möller, I. Applying Uncertain Science to Nature-Based Coastal Protection: Lessons from Shallow Wetland-Dominated Shores. Front. Environ. Sci. 2019, 7, 49. [Google Scholar] [CrossRef]
- Tian, B.; Wu, W.T.; Yang, Z.Q.; Zhou, Y.X. Drivers, trends, and potential impacts of long-term coastal reclamation in China from 1985 to 2010. Estuar. Coast. Shelf Sci. 2016, 170, 83–90. [Google Scholar] [CrossRef]
- Junk, W.J.; An, S.; Finlayson, C.M.; Gopal, B.; Květ, J.; Mitchell, S.A.; Mitsch, W.J.; Robarts, R.D. Current state of knowledge regarding the world’s wetlands and their future under global climate change: A synthesis. Aquat. Sci. 2012, 75, 151–167. [Google Scholar] [CrossRef]
- Guo, M.; Li, J.; Sheng, C.; Xu, J.; Wu, L. A Review of Wetland Remote Sensing. Sensors 2017, 17, 777. [Google Scholar] [CrossRef] [PubMed]
- Gallant, A. The Challenges of Remote Monitoring of Wetlands. Remote Sens. 2015, 7, 10938–10950. [Google Scholar] [CrossRef]
- Liang, D.; Lu, J.Z.; Chen, X.L.; Liu, C.; Lin, J.J. An investigation of the hydrological influence on the distribution and transition of wetland cover in a complex lake–floodplain system using time-series remote sensing and hydrodynamic simulation. J. Hydrol. 2020, 587, 125038. [Google Scholar] [CrossRef]
- Chen, L.; Ren, C.Y.; Zhang, B.; Li, L.; Wang, Z.M.; Song, K. Spatiotemporal Dynamics of Coastal Wetlands and Reclamation in the Yangtze Estuary During Past 50 Years (1960s–2015). Chin. Geogr. Sci. 2018, 28, 386–399. [Google Scholar] [CrossRef]
- Yang, X.C.; Zhu, Z.; Qiu, S.; Kroeger, K.D.; Zhu, Z.L.; Covington, S. Detection and characterization of coastal tidal wetland change in the northeastern US using Landsat time series. Remote Sens. Environ. 2020, 276, 113047. [Google Scholar] [CrossRef]
- Wang, X.; Xiao, X.; Zou, Z.; Chen, B.; Ma, J.; Dong, J.; Doughty, R.B.; Zhong, Q.; Qin, Y.; Dai, S.; et al. Tracking annual changes of coastal tidal flats in China during 1986-2016 through analyses of Landsat images with Google Earth Engine. Remote Sens. Environ. 2020, 238, 110987. [Google Scholar] [CrossRef] [PubMed]
- Lee, H.; Kim, C. Topographic change monitoring on tidal flat of Suncheon Bay using multi-temporal aerial images. J. Coast. Res. 2019, 91, 386–390. [Google Scholar] [CrossRef]
- Akumu, C.E.; Pathirana, S.; Baban, S.; Bucher, D. Monitoring coastal wetland communities in north-eastern NSW using ASTER and Landsat satellite data. Wetl. Ecol. Manag. 2010, 18, 357–365. [Google Scholar] [CrossRef]
- Roy, D.P.; Wulder, M.A.; Loveland, T.R.; Woodcock, C.E.; Allen, R.G.; Anderson, M.C.; Helder, D.; Irons, J.R.; Johnson, D.M.; Kennedy, R.; et al. Landsat-8: Science and product vision for terrestrial global change research. Remote Sens. Environ. 2014, 145, 154–172. [Google Scholar] [CrossRef]
- Zhu, Z.; Wulder, M.A.; Roy, D.P.; Woodcock, C.E.; Hansen, M.C.; Radeloff, V.C.; Healey, S.P.; Schaaf, C.; Hostert, P.; Strobl, P.; et al. Benefits of the free and open Landsat data policy. Remote Sens. Environ. 2019, 224, 382–385. [Google Scholar] [CrossRef]
- Dang, A.T.N.; Kumar, L.; Reid, M.; Nguyen, H. Remote Sensing Approach for Monitoring Coastal Wetland in the Mekong Delta, Vietnam: Change Trends and Their Driving Forces. Remote Sens. 2021, 13, 3359. [Google Scholar] [CrossRef]
- Cavallo, C.; Papa, M.N.; Gargiulo, M.; Palau-Salvador, G.; Vezza, P.; Ruello, G. Continuous Monitoring of the Flooding Dynamics in the Albufera Wetland (Spain) by Landsat-8 and Sentinel-2 Datasets. Remote Sens. 2021, 13, 3525. [Google Scholar] [CrossRef]
- Mousazadeh, R.; Ghaffarzadeh, H.; Nouri, J.; Gharagozlou, A.; Farahpour, M. Land use change detection and impact assessment in Anzali international coastal wetland using multi-temporal satellite images. Environ. Monit. Assess. 2015, 187, 776. [Google Scholar] [CrossRef]
- Duan, H.L.; Xia, S.X.; Hou, X.Y.; Liu, Y.; Yu, X.B. Conservation planning following reclamation of intertidal areas throughout the Yellow and Bohai Seas, China. Biodivers. Conserv. 2019, 28, 3787–3801. [Google Scholar] [CrossRef]
- Kirwan, M.L.; Megonigal, J.P. Tidal wetland stability in the face of human impacts and sea-level rise. Nature 2013, 504, 53–60. [Google Scholar] [CrossRef] [PubMed]
- Ma, T.T.; Li, X.W.; Bai, J.H.; Cui, B.S. Impacts of Coastal Reclamation on Natural Wetlands in Large River Deltas in China. Chin. Geogr. Sci. 2019, 29, 640–651. [Google Scholar] [CrossRef]
- Tian, Y.L.; Luo, L.; Mao, D.H.; Wang, Z.M.; Li, L.; Liang, J.P. Using Landsat images to quantify different human threats to the Shuangtai Estuary Ramsar site, China. Ocean Coast. Manag. 2017, 135, 56–64. [Google Scholar] [CrossRef]
- Peng, J.W.; Liu, S.G.; Lu, W.Z.; Liu, M.C.; Feng, S.L.; Cong, P.F. Continuous Change Mapping to Understand Wetland Quantity and Quality Evolution and Driving Forces: A Case Study in the Liao River Estuary from 1986 to 2018. Remote Sens. 2021, 13, 4900. [Google Scholar] [CrossRef]
- He, Q.; Bertness, M.D.; Bruno, J.F.; Li, B.; Chen, G.; Coverdale, T.C.; Altieri, A.H.; Bai, J.; Sun, T.; Pennings, S.C.; et al. Economic development and coastal ecosystem change in China. Sci. Rep. 2014, 4, 5995. [Google Scholar] [CrossRef]
- Camacho-Valdez, V.; Ruiz-Luna, A.; Ghermandi, A.; Berlanga-Robles, C.A.; Nunes, P.A. Effects of land use changes on the ecosystem service values of coastal wetlands. Environ. Manag. 2014, 54, 852–864. [Google Scholar] [CrossRef]
- Lin, Q.; Yu, S. Losses of natural coastal wetlands by land conversion and ecological degradation in the urbanizing Chinese coast. Sci. Rep. 2018, 8, 15046. [Google Scholar] [CrossRef] [PubMed]
- Ji, X.; Zhang, Y.; Zhu, D. Study on Marine Environment and Recent Coastal Evolution of Yueqing Bay, Zhejiang Province, China. Mar. Sci. Bull. 2006, 25, 44–53. (In Chinese) [Google Scholar] [CrossRef]
- Murray, N.J.; Clemens, R.S.; Phinn, S.R.; Possingham, H.P.; Fuller, R.A. Tracking the rapid loss of tidal wetlands in the Yellow Sea. Front. Ecol. Environ. 2014, 12, 267–272. [Google Scholar] [CrossRef] [PubMed]
- Wu, M.; Li, C.; Du, J.; He, P.; Fang, S. Quantifying the dynamics and driving forces of the coastal wetland landscape of the Yangtze River Estuary since the 1960s. Reg. Stud. Mar. Sci. 2019, 32, 100854. [Google Scholar] [CrossRef]
- Mao, D.; Wang, Z.M.; Du, B.J.; Li, L.; Tian, Y.L.; Jia, M.M.; Zeng, Y.; Song, K.S.; Jiang, M.; Wang, Y.Q. National wetland mapping in China: A new product resulting from object-based and hierarchical classification of Landsat 8 OLI images. ISPRS J. Photogramm. Remote Sens. 2020, 164, 11–25. [Google Scholar] [CrossRef]
- Editorial Committee for Chinese Harbors and Emdayment (ECCHE). Chinese Harbors and Embayment (Part VI), 1st ed.; China Ocean Press: Beijing, China, 1993; pp. 110–187. [Google Scholar]
- Yang, H. Study on Dominant Resources and Their Utilization Conflict in Leqing Bay. Zhejiang Mar. Sci. Bull. 2003, 22, 49–55. (In Chinese) [Google Scholar] [CrossRef]
- Zheng, C.; Liu, W.; Qiu, J.; Huang, L.; Huang, X.; Chen, S. Comparison of physiological characteristics of Kandelia obovata at different ages in winter in the northernmost mangrove transplanted area of China. Acta Ecol. Sin. 2013, 33, 132–138. [Google Scholar] [CrossRef]
- Peng, X.; Xu, R.; He, Y. Analysis on coastline and coastal wetland changes in Yueqing bay in recent 30 years. Mar. Environ. Sci. 2019, 38, 68–74. (In Chinese) [Google Scholar] [CrossRef]
- Wang, C.; Pan, G.; Xu, X.; Chen, P. Analysis of evolution of tidal prism of the Yueqing Bay. Mar. Sci. 2017, 41, 76–85. (In Chinese) [Google Scholar] [CrossRef]
- Wang, A.; Chen, J.; Jing, C.; Ye, G.; Wu, J.; Huang, Z.; Zhou, C. Monitoring the Invasion of Spartina alterniflora from 1993 to 2014 with Landsat TM and SPOT 6 Satellite Data in Yueqing Bay, China. PLoS ONE 2015, 10, e0135538. [Google Scholar] [CrossRef] [PubMed]
- Wang, X.K. A Study of the Spacial Capacity in Rocky Bay—An Example from Yueqing Bay, China. Ph.D. Thesis, Zhejiang University, Hangzhou, China, 7 March 2019. (In Chinese). [Google Scholar]
- Wang, X.; Yan, F.; Su, F. Changes in coastline and coastal reclamation in the three most developed areas of China, 1980–2018. Ocean Coast. Manag. 2021, 204, 105542. [Google Scholar] [CrossRef]
- Hou, X.Y.; Wu, T.; Hou, W.; Chen, Q.; Wang, Y.; Yu, L. Characteristics of coastline changes in mainland China since the early 1940s. Sci. China Earth Sci. 2016, 59, 1791–1802. (In Chinese) [Google Scholar] [CrossRef]
- Sun, W.; Ma, Y.; Zhang, J.; Liu, S.; Ren, G. Study of Remote Sensing Interpretation Keys and Extraction Technique of Different types of Shoreline. Bull. Surv. Mapp. 2011, 3, 41–44. (In Chinese) [Google Scholar]
- Li, J.; Ye, M.; Pu, R.; Liu, Y.; Guo, Q.; Feng, B.; Huang, R.; He, G. Spatiotemporal Change Patterns of Coastlines in Zhejiang Province, China, over the Last Twenty-Five Years. Sustainability 2018, 10, 477. [Google Scholar] [CrossRef]
- Klemas, V. Remote Sensing Techniques for Studying Coastal Ecosystems: An Overview. J. Coast. Res. 2011, 27, 2–17. [Google Scholar] [CrossRef]
- Jiang, S.; Xu, N.; Li, Z.; Huang, C. Satellite derived coastal reclamation expansion in China since the 21st century. Glob. Ecol. Conserv. 2021, 30, e01797. [Google Scholar] [CrossRef]
- Wu, W.; Yang, Z.; Tian, B.; Huang, Y.; Zhou, Y.; Zhang, T. Impacts of coastal reclamation on wetlands: Loss, resilience, and sustainable management. Estuar. Coast. Shelf Sci. 2018, 210, 153–161. [Google Scholar] [CrossRef]
- Li, F.; Ding, D.; Chen, Z.; Chen, H.; Shen, T.; Wu, Q.; Zhang, C. Change of sea reclamation and the sea-use management policy system in China. Mar. Policy 2020, 115, 103861. [Google Scholar] [CrossRef]
- Luan, H.L.; Ding, P.X.; Wang, Z.B.; Yang, S.L.; Lu, J.Y. Morphodynamic impacts of large-scale engineering projects in the Yangtze River delta. Coast. Eng. 2018, 141, 1–11. [Google Scholar] [CrossRef]
- Xie, J.; Yan, Y.-X. Promoting Siltation Effects and Impacts of Hengsha East Shoal on the Yangtze River Estuary. J. Hydrodynam. B 2011, 23, 649–659. [Google Scholar] [CrossRef]
- Wei, W.; Dai, Z.; Mei, X.; Gao, S.; Liu, J.P. Multi-decadal morpho-sedimentary dynamics of the largest Changjiang estuarine marginal shoal: Causes and implications. Land Degrad. Dev. 2019, 30, 2048–2063. [Google Scholar] [CrossRef]
- Trites, M.; Bayley, S.E. Vegetation communities in continental boreal wetlands along a salinity gradient: Implications for oil sands mining reclamation. Aquat. Bot. 2009, 91, 27–39. [Google Scholar] [CrossRef]
- Liu, Y.-F.; Ma, J.; Wang, X.-X.; Zhong, Q.-Y.; Zong, J.-M.; Wu, W.-B.; Wang, Q.; Zhao, B. Joint Effect of Spartina alterniflora Invasion and Reclamation on the Spatial and Temporal Dynamics of Tidal Flats in Yangtze River Estuary. Remote Sens. 2020, 12, 1725. [Google Scholar] [CrossRef]
- Mao, D.; Liu, M.; Wang, Z.; Li, L.; Man, W.; Jia, M.; Zhang, Y. Rapid Invasion of Spartina alterniflora in the Coastal Zone of Mainland China: Spatiotemporal Patterns and Human Prevention. Sensors 2019, 19, 2308. [Google Scholar] [CrossRef]
- An, S.Q.; Gu, B.H.; Zhou, C.F.; Wang, Z.S.; Deng, Z.F.; Zhi, Y.B.; Li, H.L.; Chen, L.; Yu, D.H.; Liu, Y.H. Spartina invasion in China: Implications for invasive species management and future research. Weed Res. 2007, 47, 183–191. [Google Scholar] [CrossRef]
- Civille, J.C.; Sayce, K.; Smith, S.D.; Strong, D.R. Reconstructing a century of Spartina alterniflora invasion with historical records and contemporary remote sensing. Ecoscience 2016, 12, 330–338. [Google Scholar] [CrossRef]
- Lu, J.B.; Zhang, Y. Spatial distribution of an invasive plant Spartina alterniflora and its potential as biofuels in China. Ecol. Eng. 2013, 52, 175–181. [Google Scholar] [CrossRef]
- Zuo, P.; Zhao, S.; Liu, C.A.; Wang, C.; Liang, Y. Distribution of Spartina spp. along China’s coast. Ecol. Eng. 2012, 40, 160–166. [Google Scholar] [CrossRef]
- Macreadie, P.I.; Anton, A.; Raven, J.A.; Beaumont, N.; Connolly, R.M.; Friess, D.A.; Kelleway, J.J.; Kennedy, H.; Kuwae, T.; Lavery, P.S.; et al. The future of Blue Carbon science. Nat. Commun. 2019, 10, 3998. [Google Scholar] [CrossRef]
- Li, B.; Liao, C.Z.; Zhang, X.D.; Chen, H.L.; Wang, Q.; Chen, Z.Y.; Gan, X.J.; Wu, J.H.; Zhao, B.; Ma, Z.J.; et al. Spartina alterniflora invasions in the Yangtze River estuary, China: An overview of current status and ecosystem effects. Ecol. Eng. 2009, 35, 511–520. [Google Scholar] [CrossRef]
- Chen, Q.; Jian, S.G.; Ma, K.M.; Chen, P.M. Retracted: Differences in macrobenthic faunal communities in mangrove wetland habitats (Zhanjiang, China) invaded and non-invaded by exotic cordgrass Spartina alterniflora. Ecol. Res. 2018, 33, 1113–1123. [Google Scholar] [CrossRef]
- Strong, D.R.; Ayres, D.R. Ecological and evolutionary misadventures of Spartina. Annu. Rev. Ecol. Evol. Syst. 2013, 44, 389–410. [Google Scholar] [CrossRef]
- Liang, Y.X.; Cheng, X.W.; Zhu, H.; Shutes, B.; Yan, B.X.; Zhou, Q.W.; Yu, X.F. Historical Evolution of Mariculture in China during Past 40 Years and Its Impacts on Eco-environment. Chin. Geogr. Sci. 2018, 28, 363–373. [Google Scholar] [CrossRef]
- Yu, J.K.; Yin, W.; Liu, D.H. Evolution of mariculture policies in China: Experience and challenge. Mar. Policy 2020, 119, 104062. [Google Scholar] [CrossRef]
- Jia, M.M.; Wang, Z.M.; Mao, D.H.; Huang, C.L.; Lu, C.Y. Spatial-temporal changes of China’s mangrove forests over the past 50 years: An analysis towards the Sustainable Development Goals (SDGs). Chin. Sci. Bull. 2021, 66, 3886–3901. [Google Scholar] [CrossRef]
- Bouillon, S.; Borges, A.V.; Castañeda-Moya, E.; Diele, K.; Dittmar, T.; Duke, N.C.; Kristensen, E.; Lee, S.Y.; Marchand, C.; Middelburg, J.J.; et al. Mangrove production and carbon sinks: A revision of global budget estimates. Glob. Biogeochem. Cycles 2008, 22, GB2013. [Google Scholar] [CrossRef]
- Chen, Q.; Yang, S.; Wang, J.; Liu, X.; Zheng, J.; Deng, R. The Development Course and Discussion of Mangrove in Zhejiang Province. J. Zhejiang Agric. Sci. 2019, 60, 1177–1181. (In Chinese) [Google Scholar] [CrossRef]


Disclaimer/Publisher’s Note: The statements, opinions and data contained in all publications are solely those of the individual author(s) and contributor(s) and not of MDPI and/or the editor(s). MDPI and/or the editor(s) disclaim responsibility for any injury to people or property resulting from any ideas, methods, instructions or products referred to in the content. |
© 2023 by the authors. Licensee MDPI, Basel, Switzerland. This article is an open access article distributed under the terms and conditions of the Creative Commons Attribution (CC BY) license (https://creativecommons.org/licenses/by/4.0/).