
The Association between Carbon Emission and Urban Spatial Form—A Study of Zhuhai, China


Abstract
1. Introduction
2. Materials and Methods
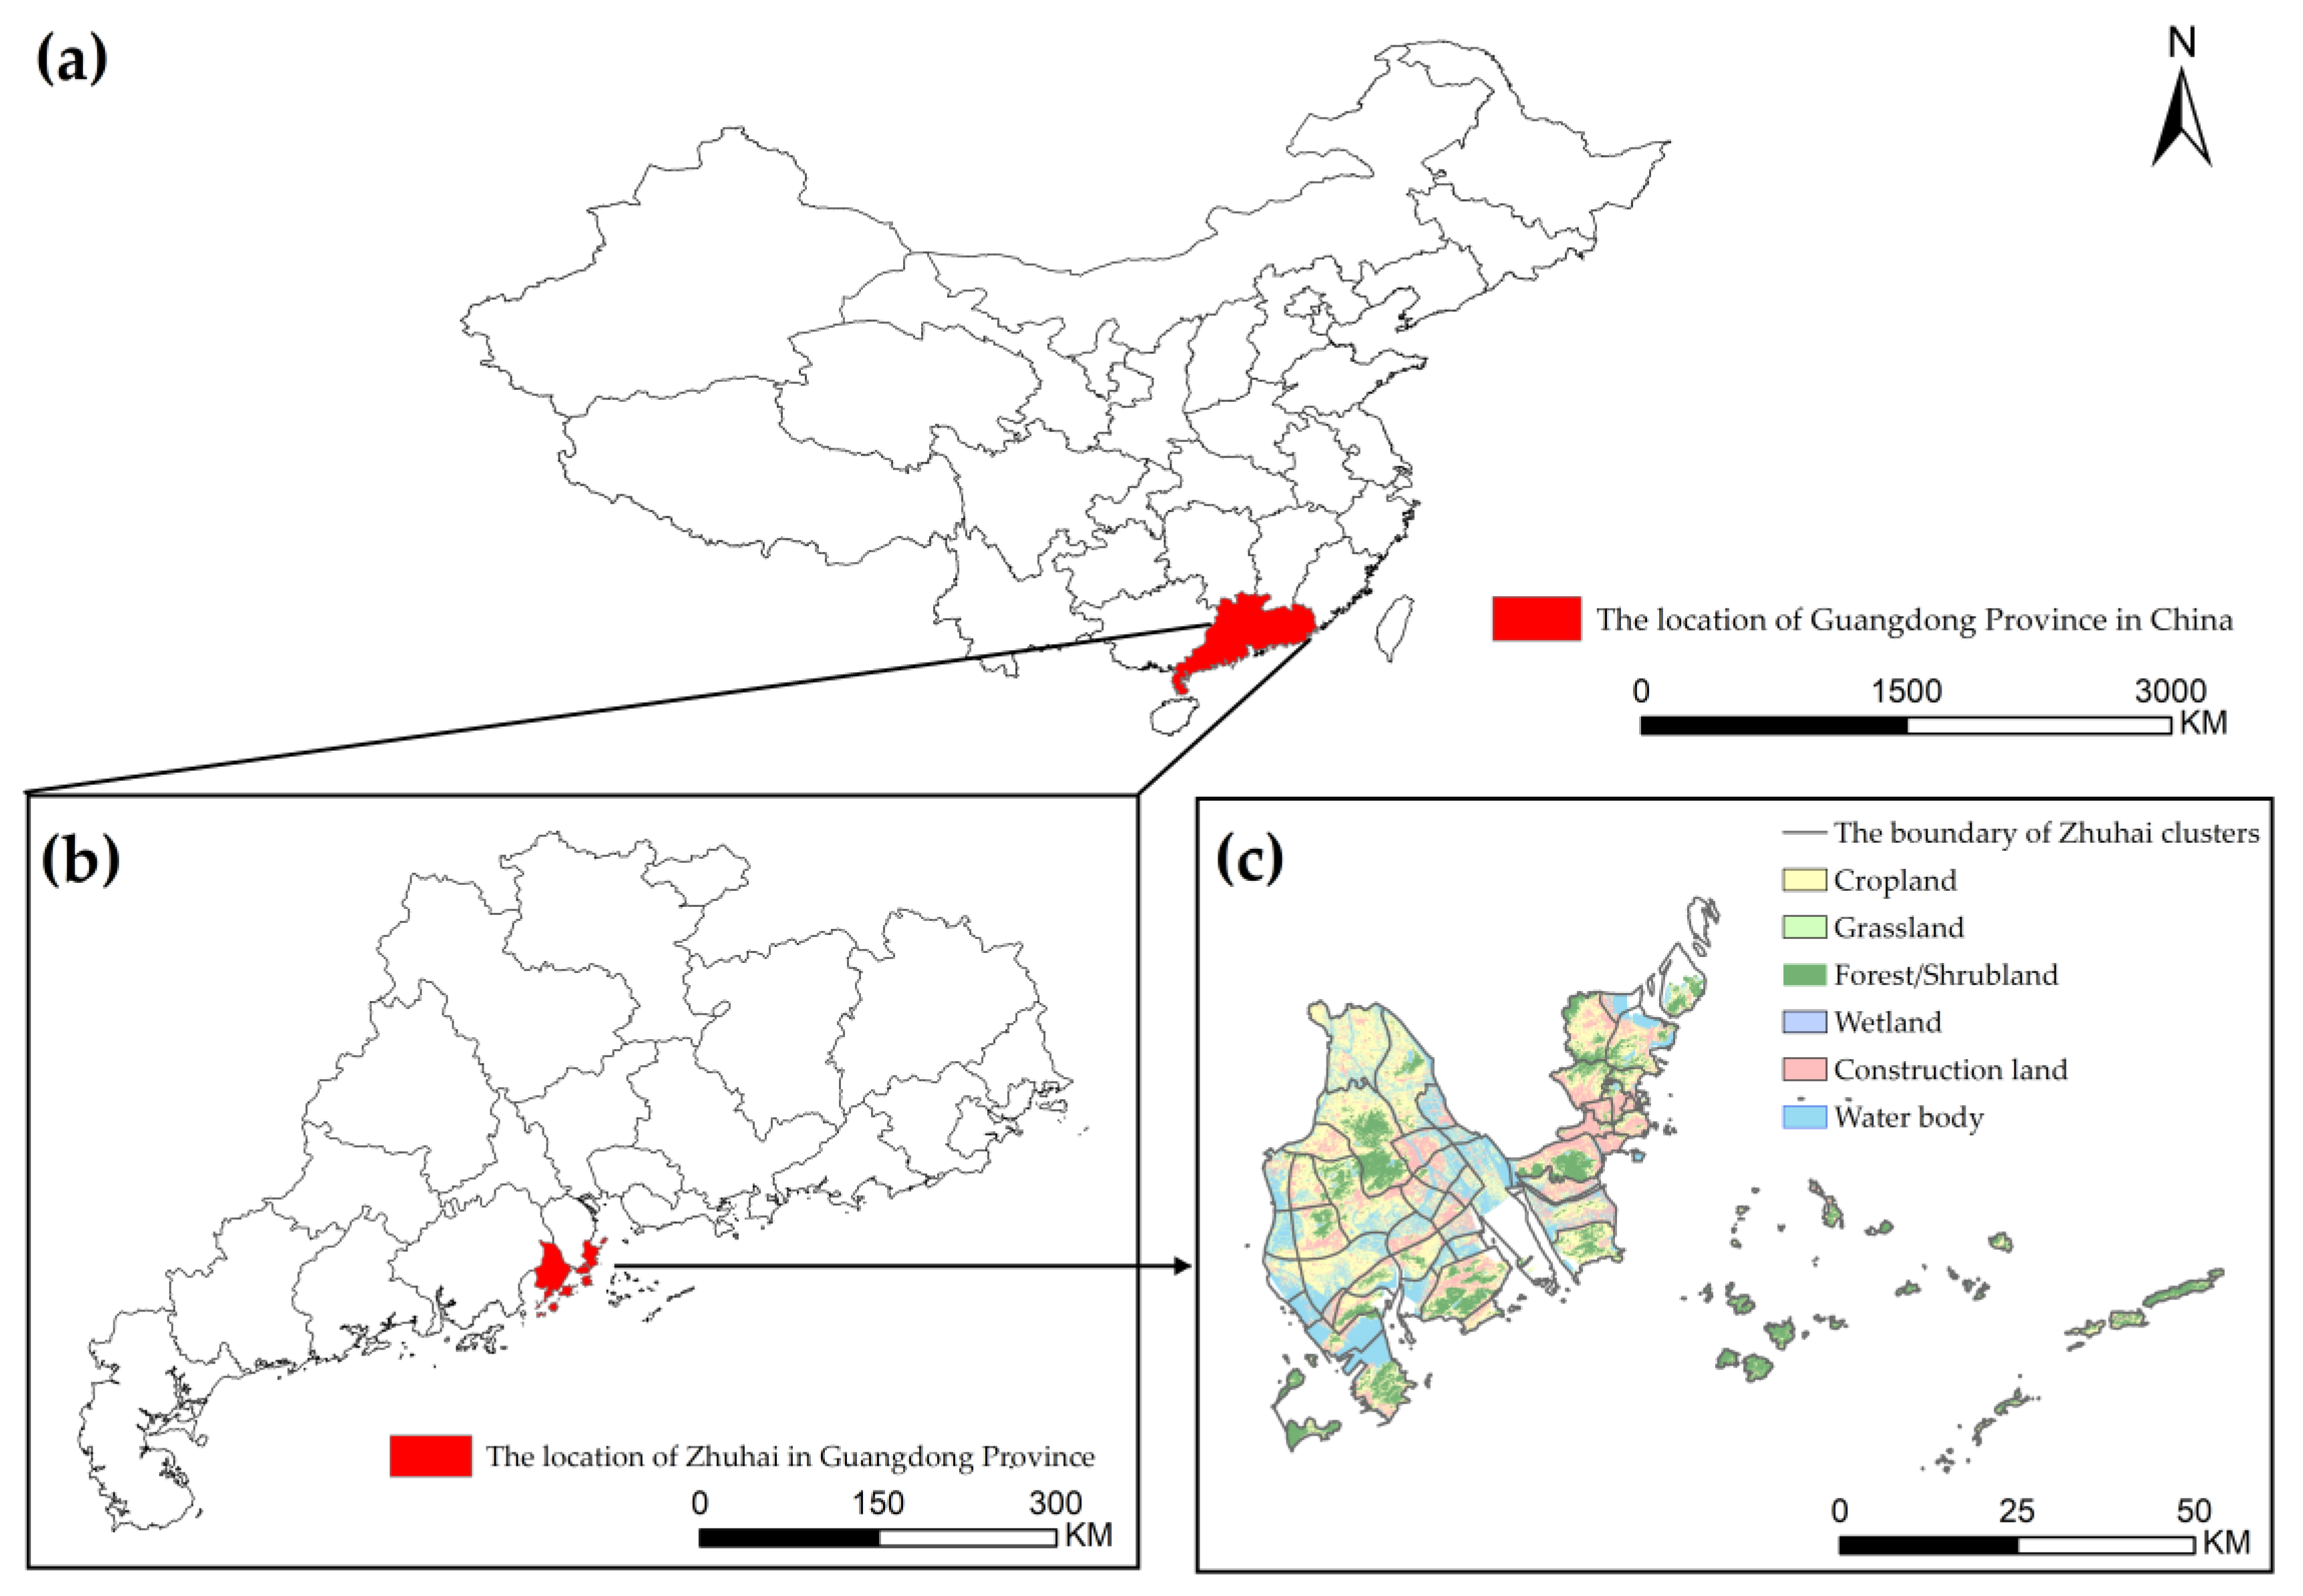
2.1. Study Area and Data Sources
2.2. Methods
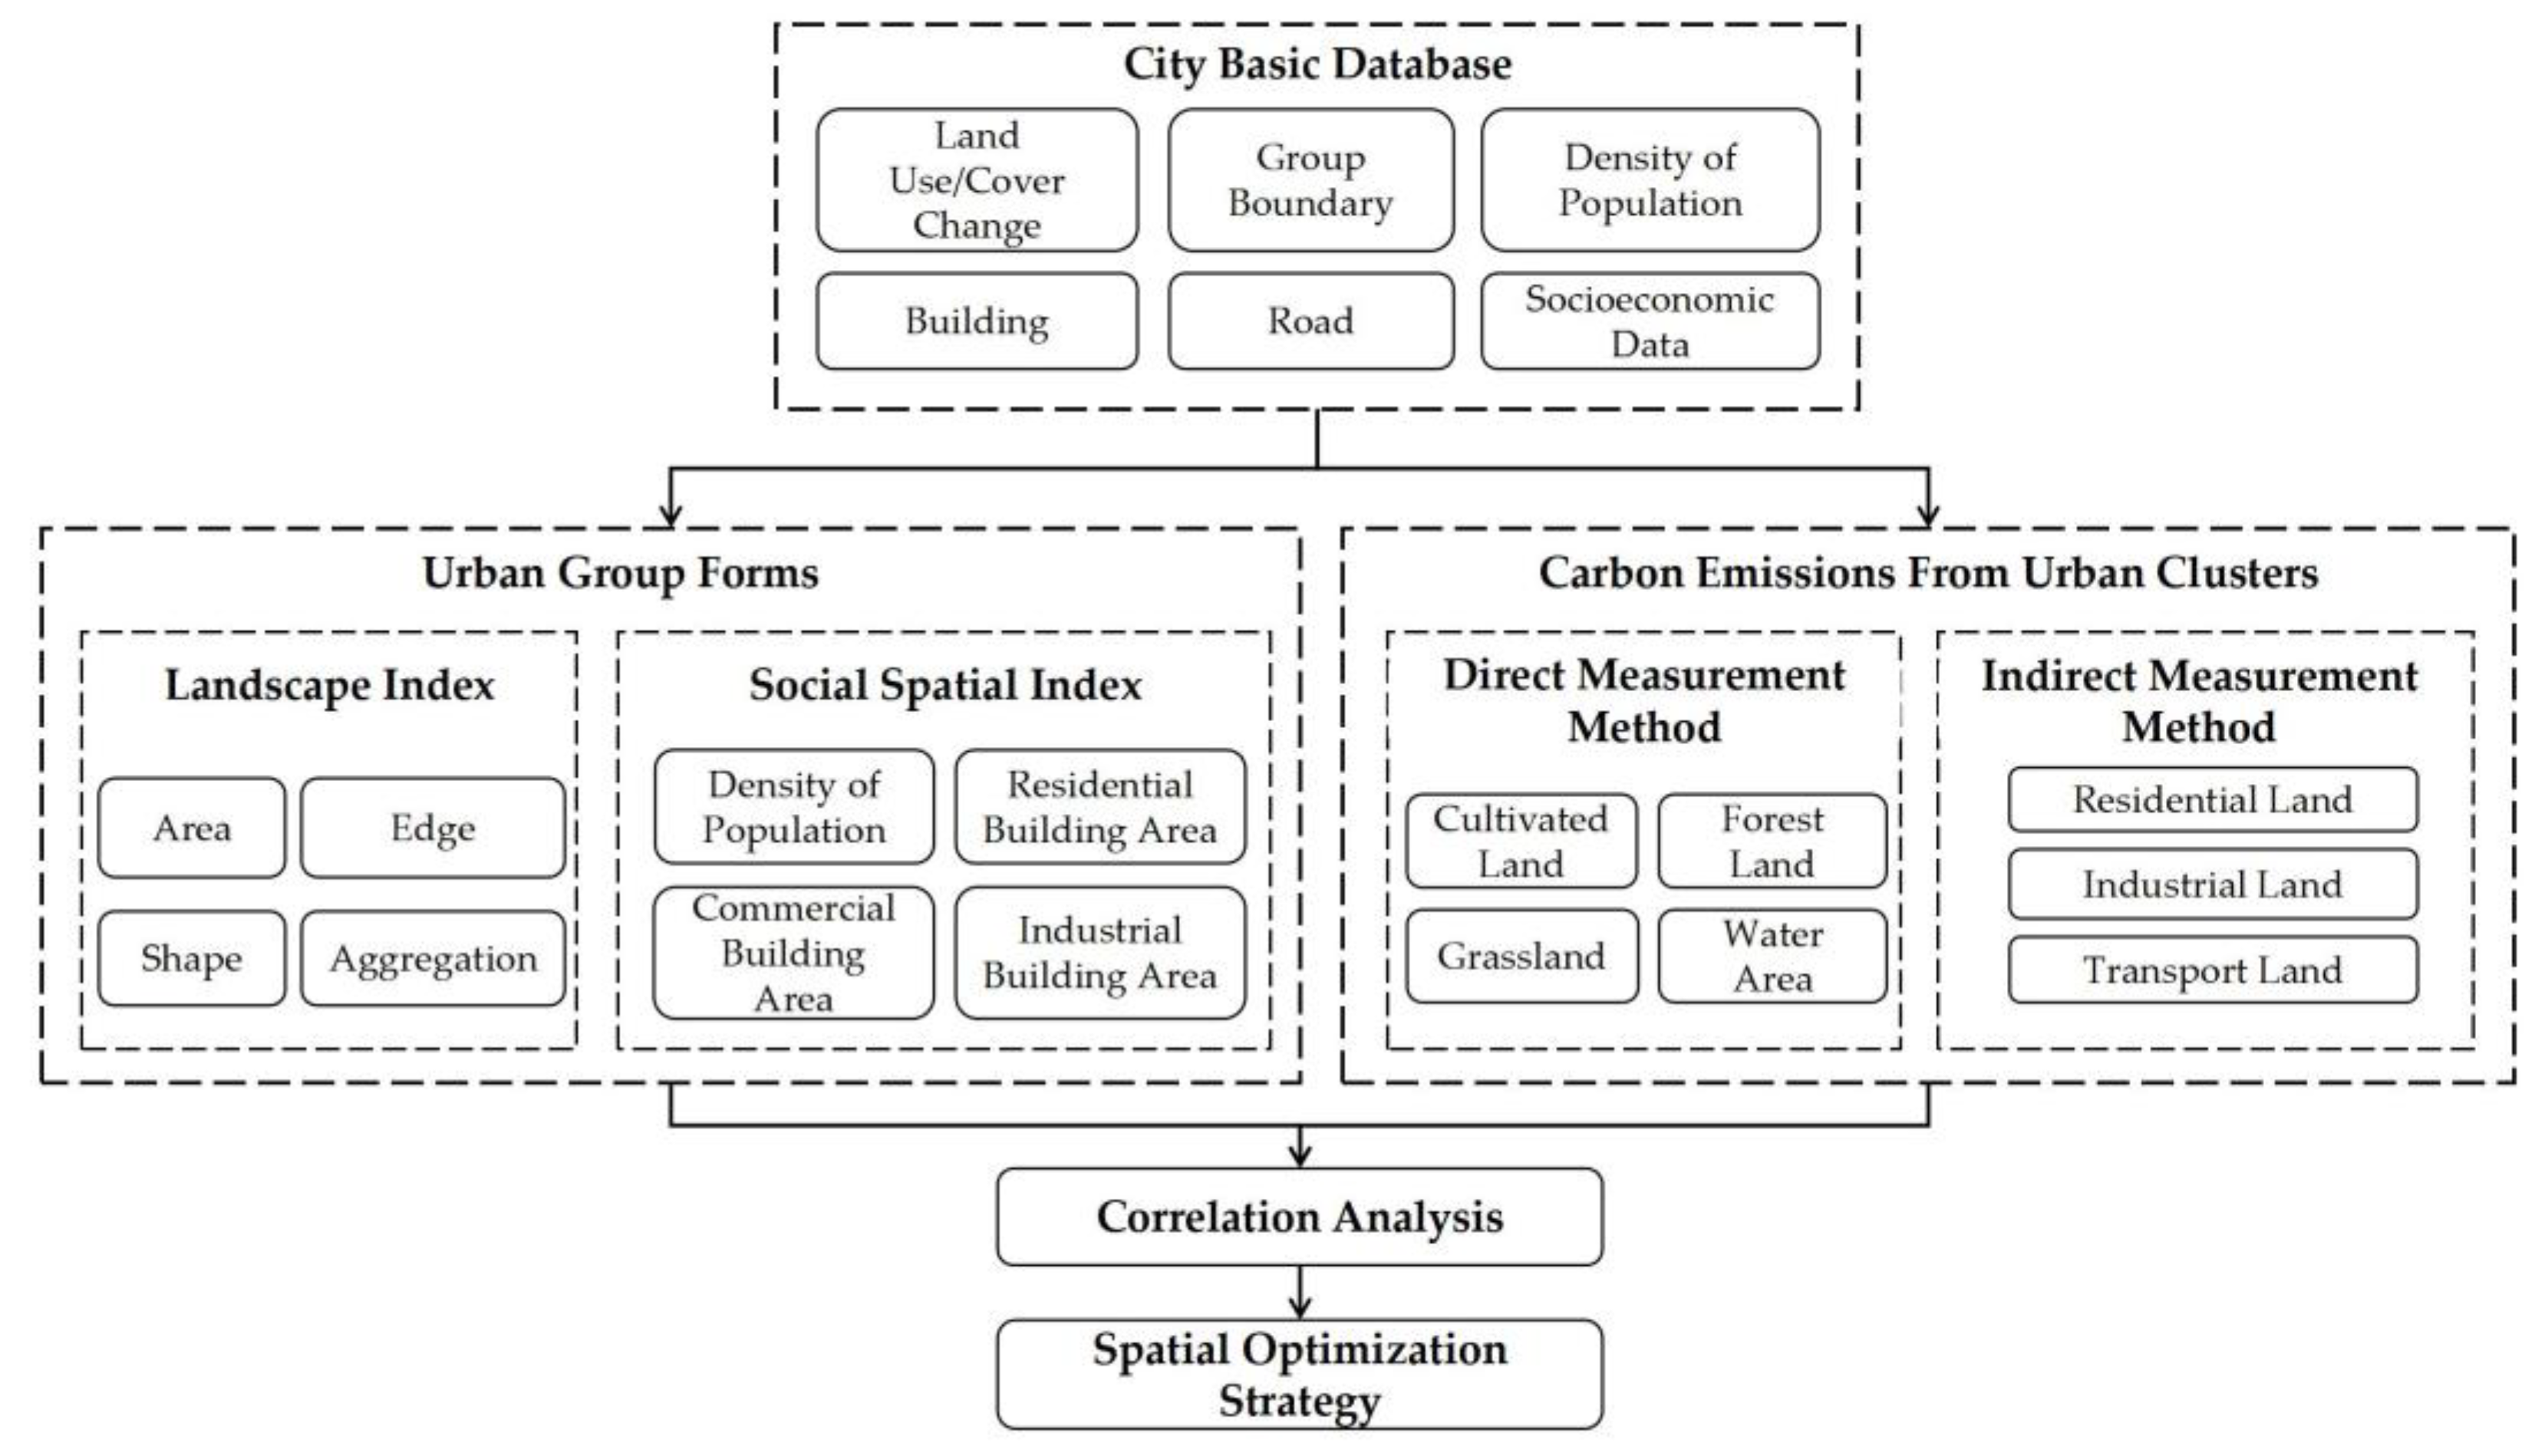
2.2.1. Construction of Urban Spatial Form Index System
Construction and Calculation of Landscape Spatial Index
Construction and Calculation of Social Spatial Index
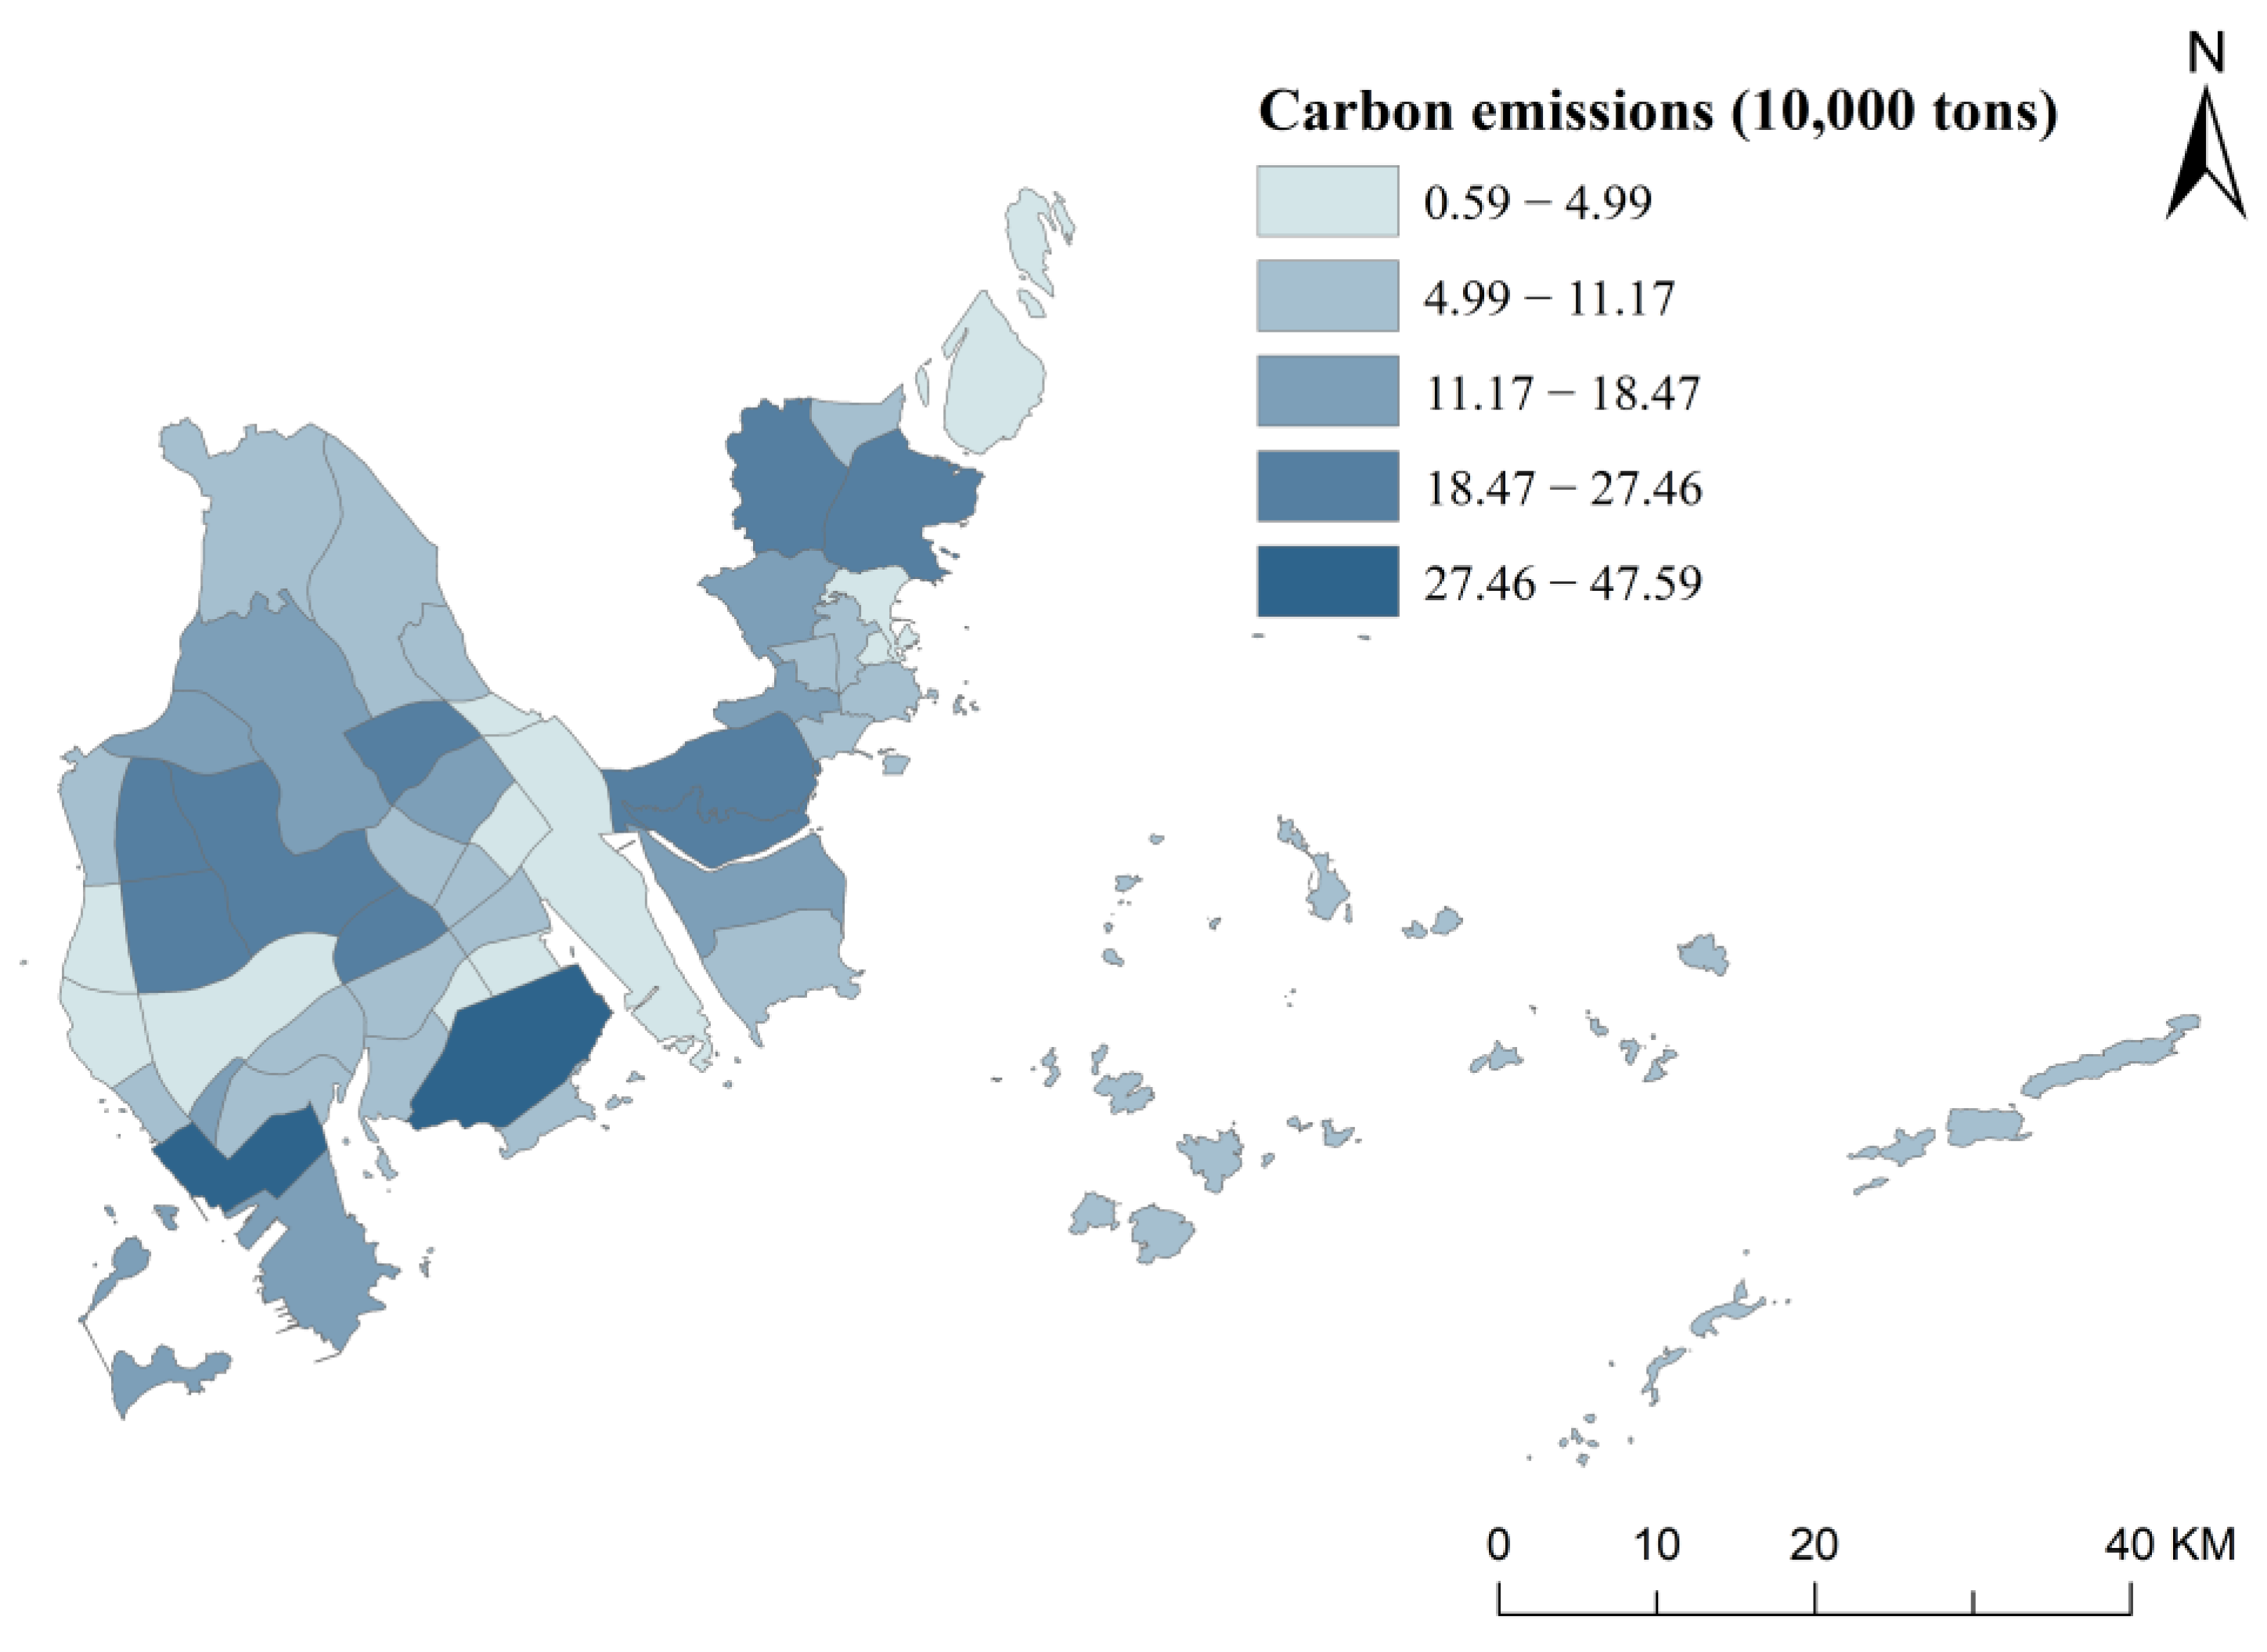
2.2.2. Measurement of Carbon Emission Index
2.2.3. Ecological Network Connectivity Evaluation
3. Results
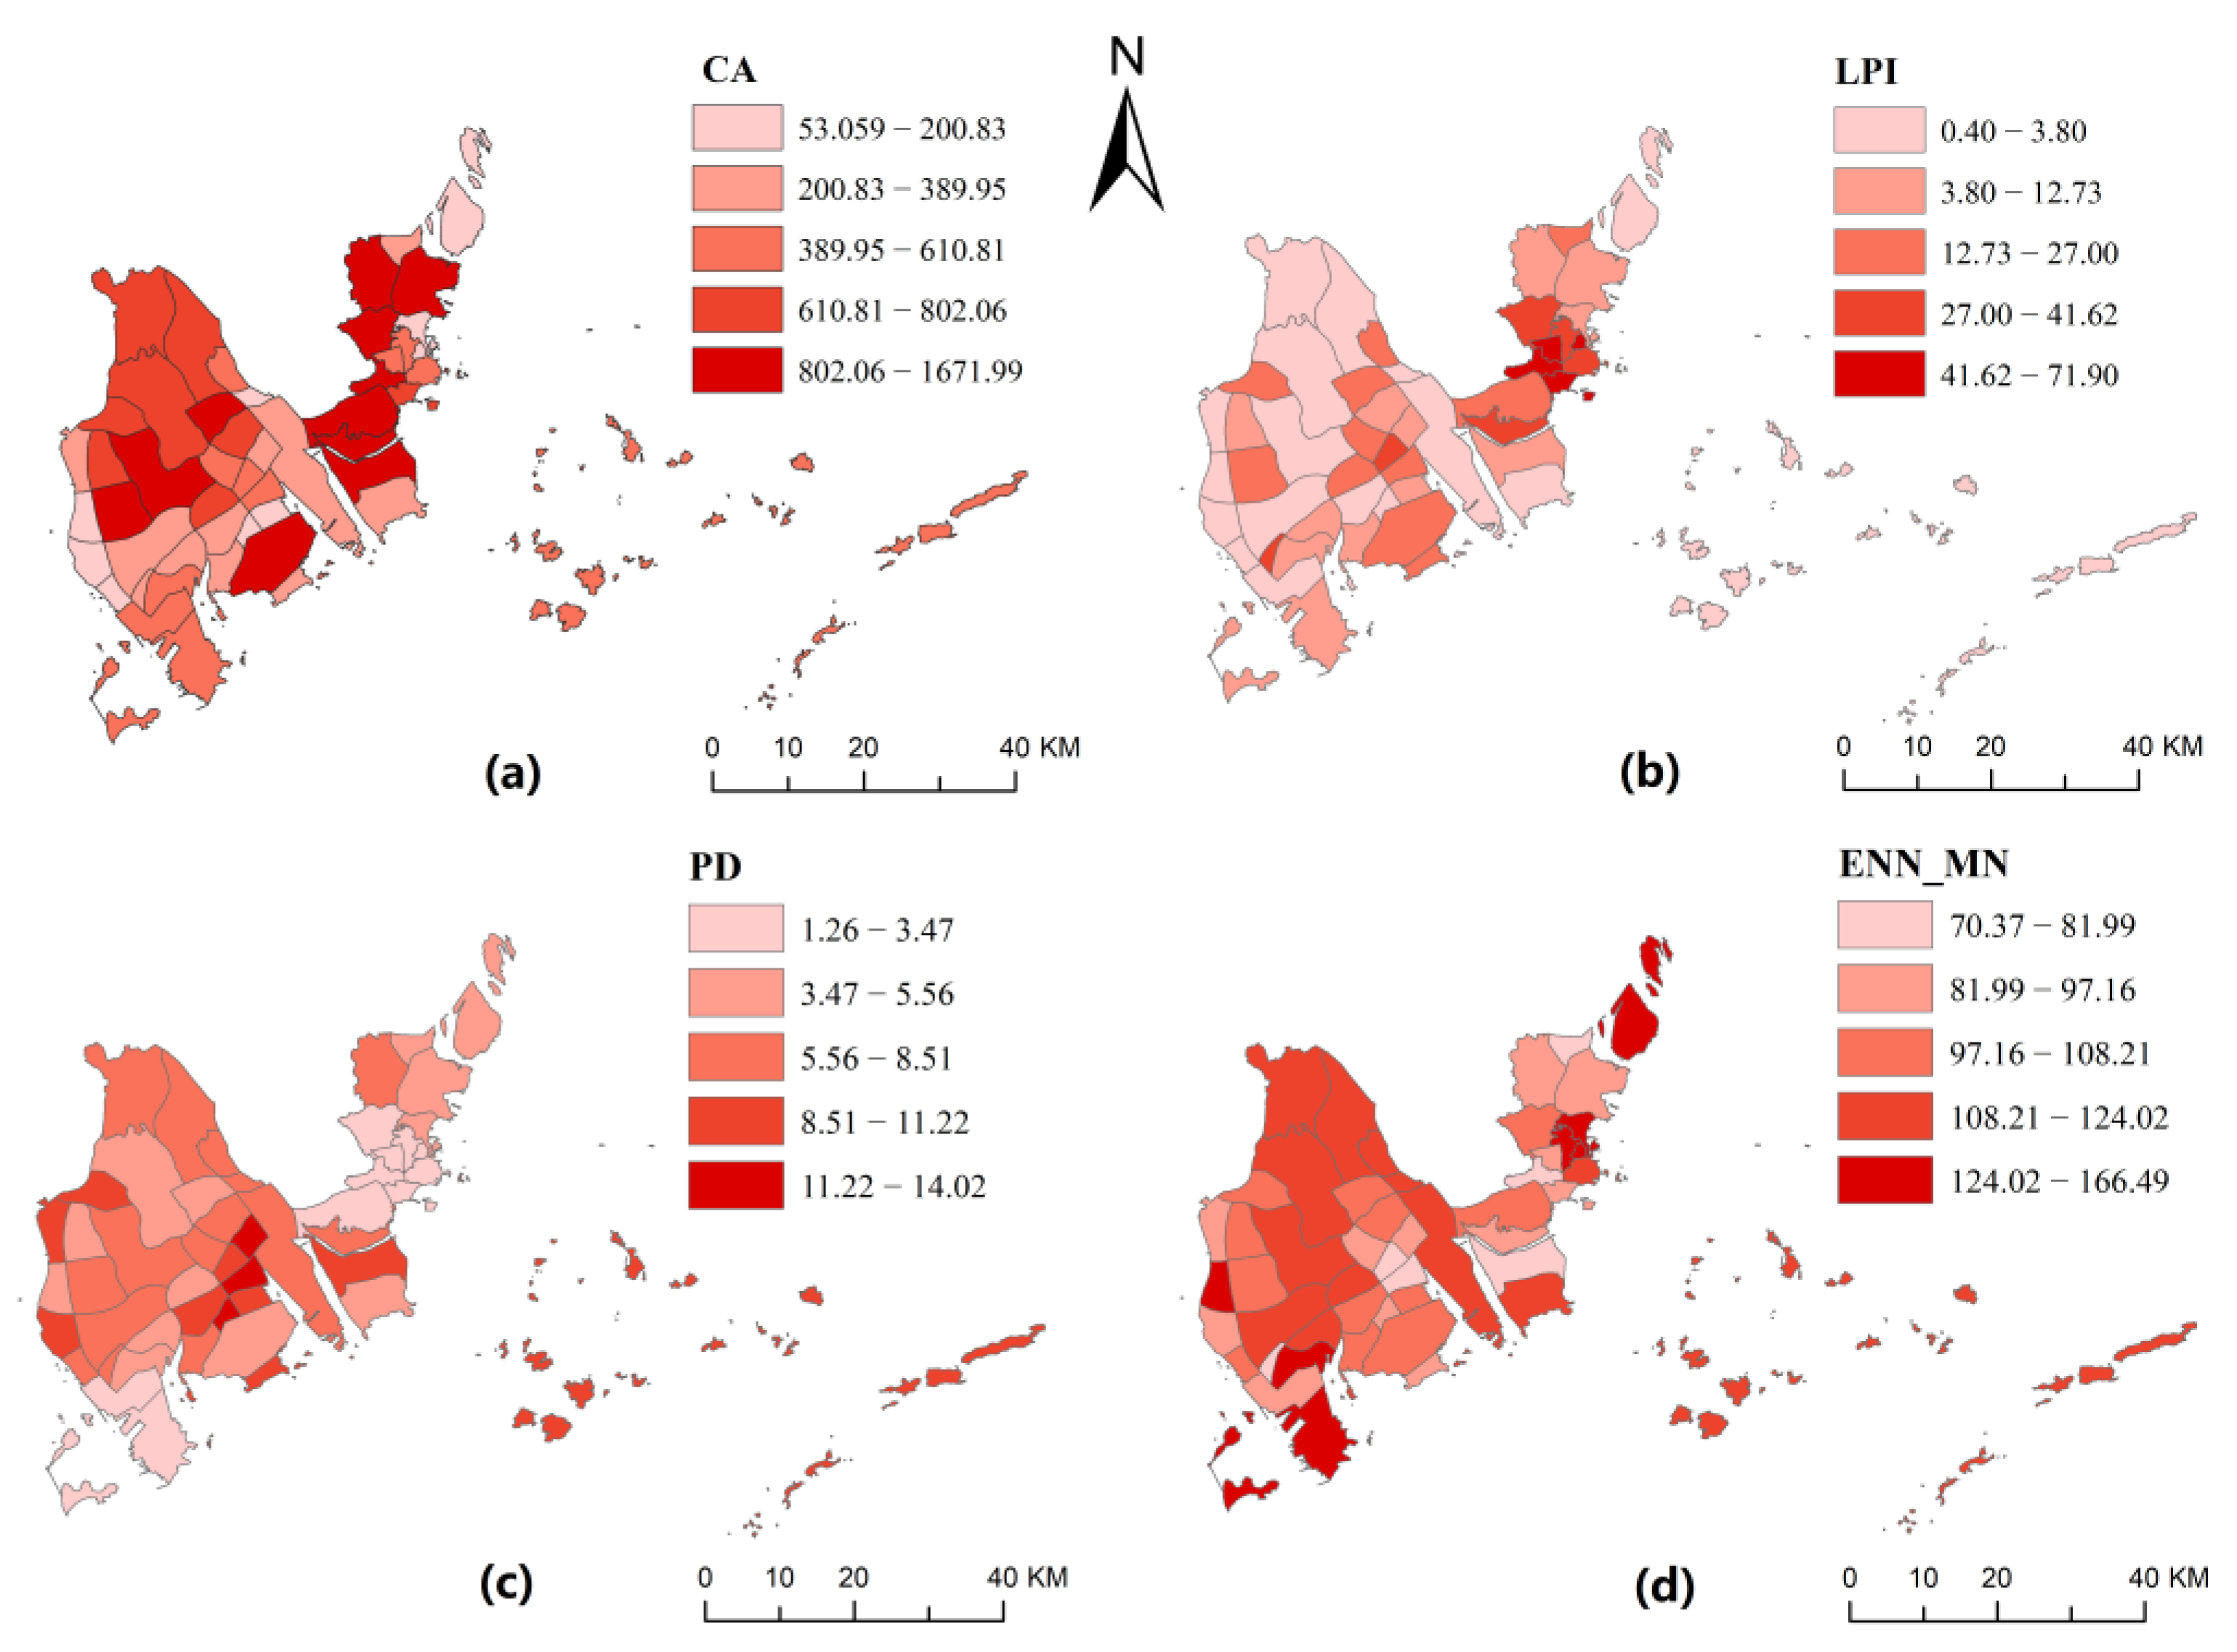
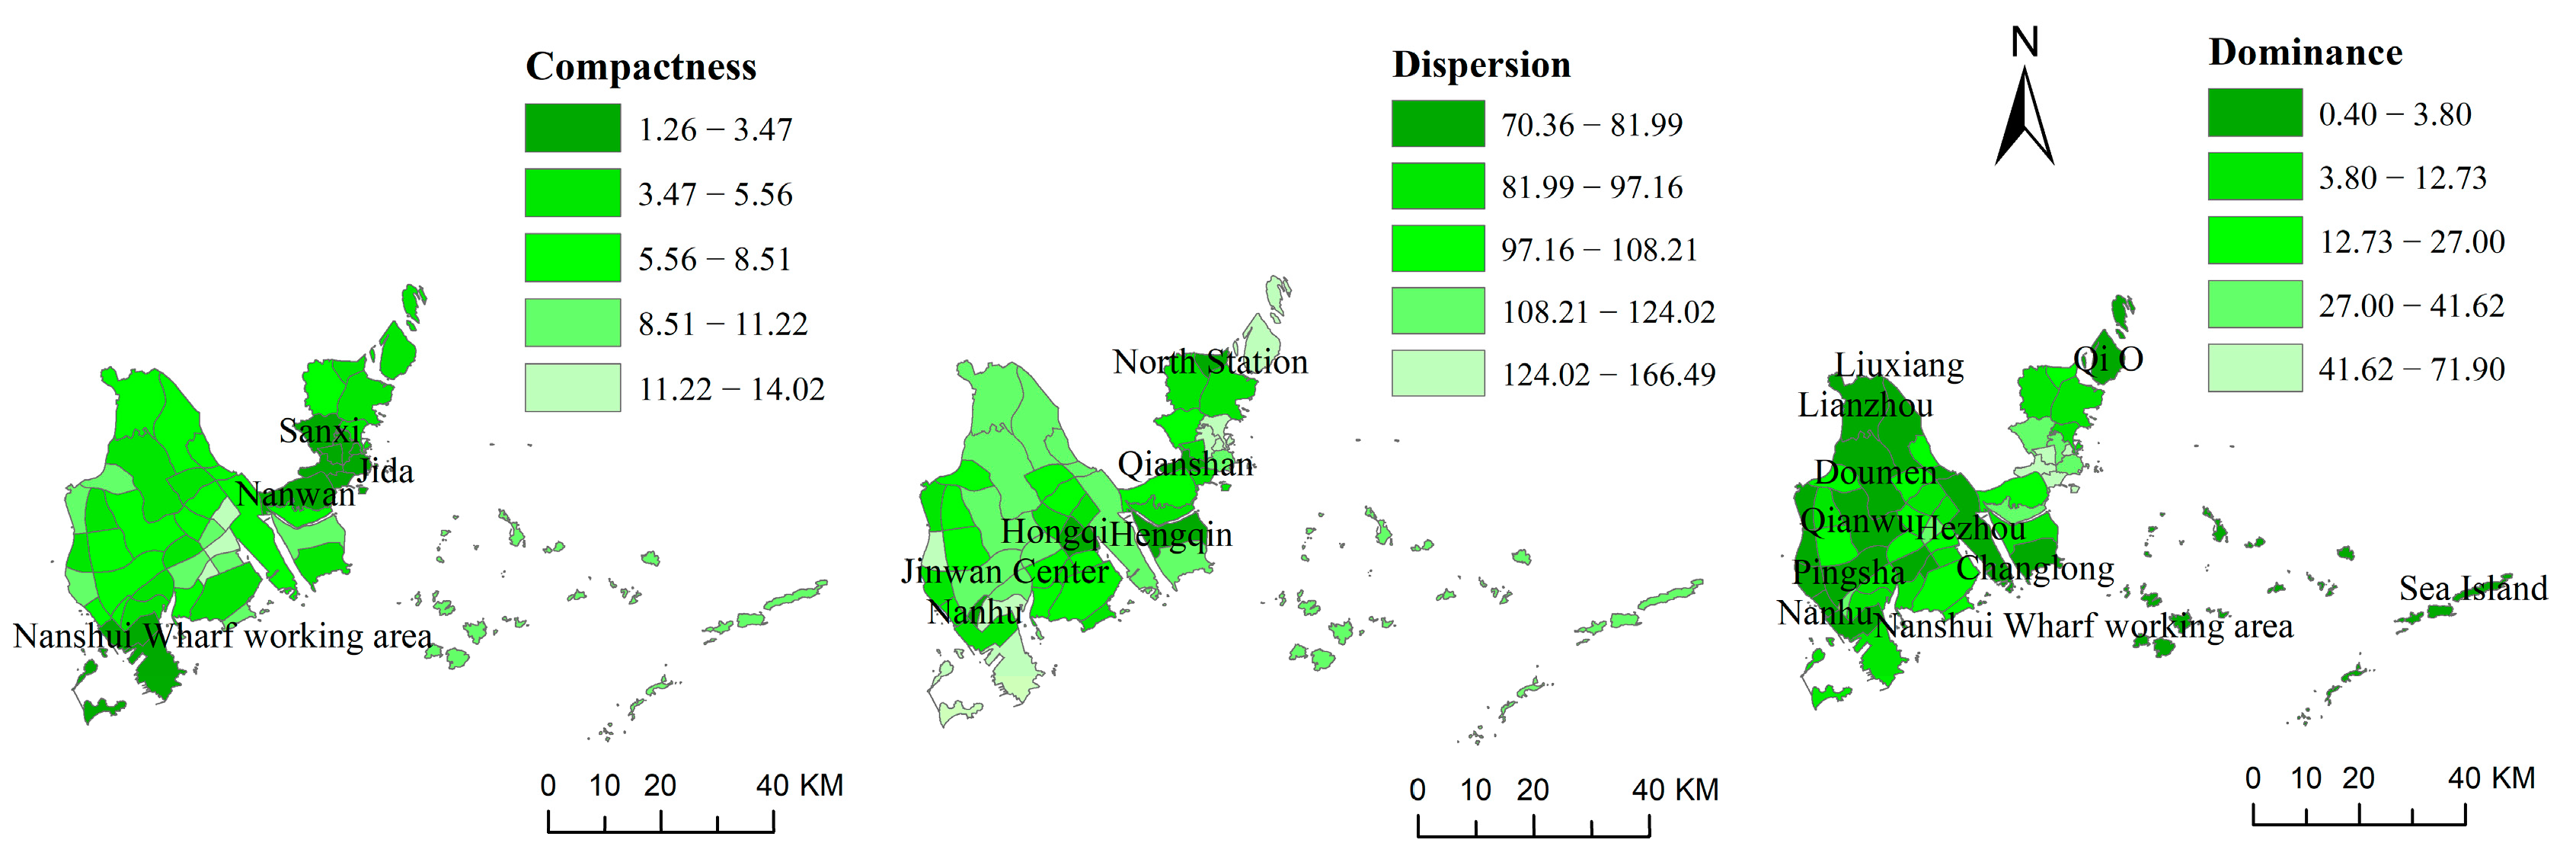
3.1. Measurement and Screening of Landscape Spatial Structure Index
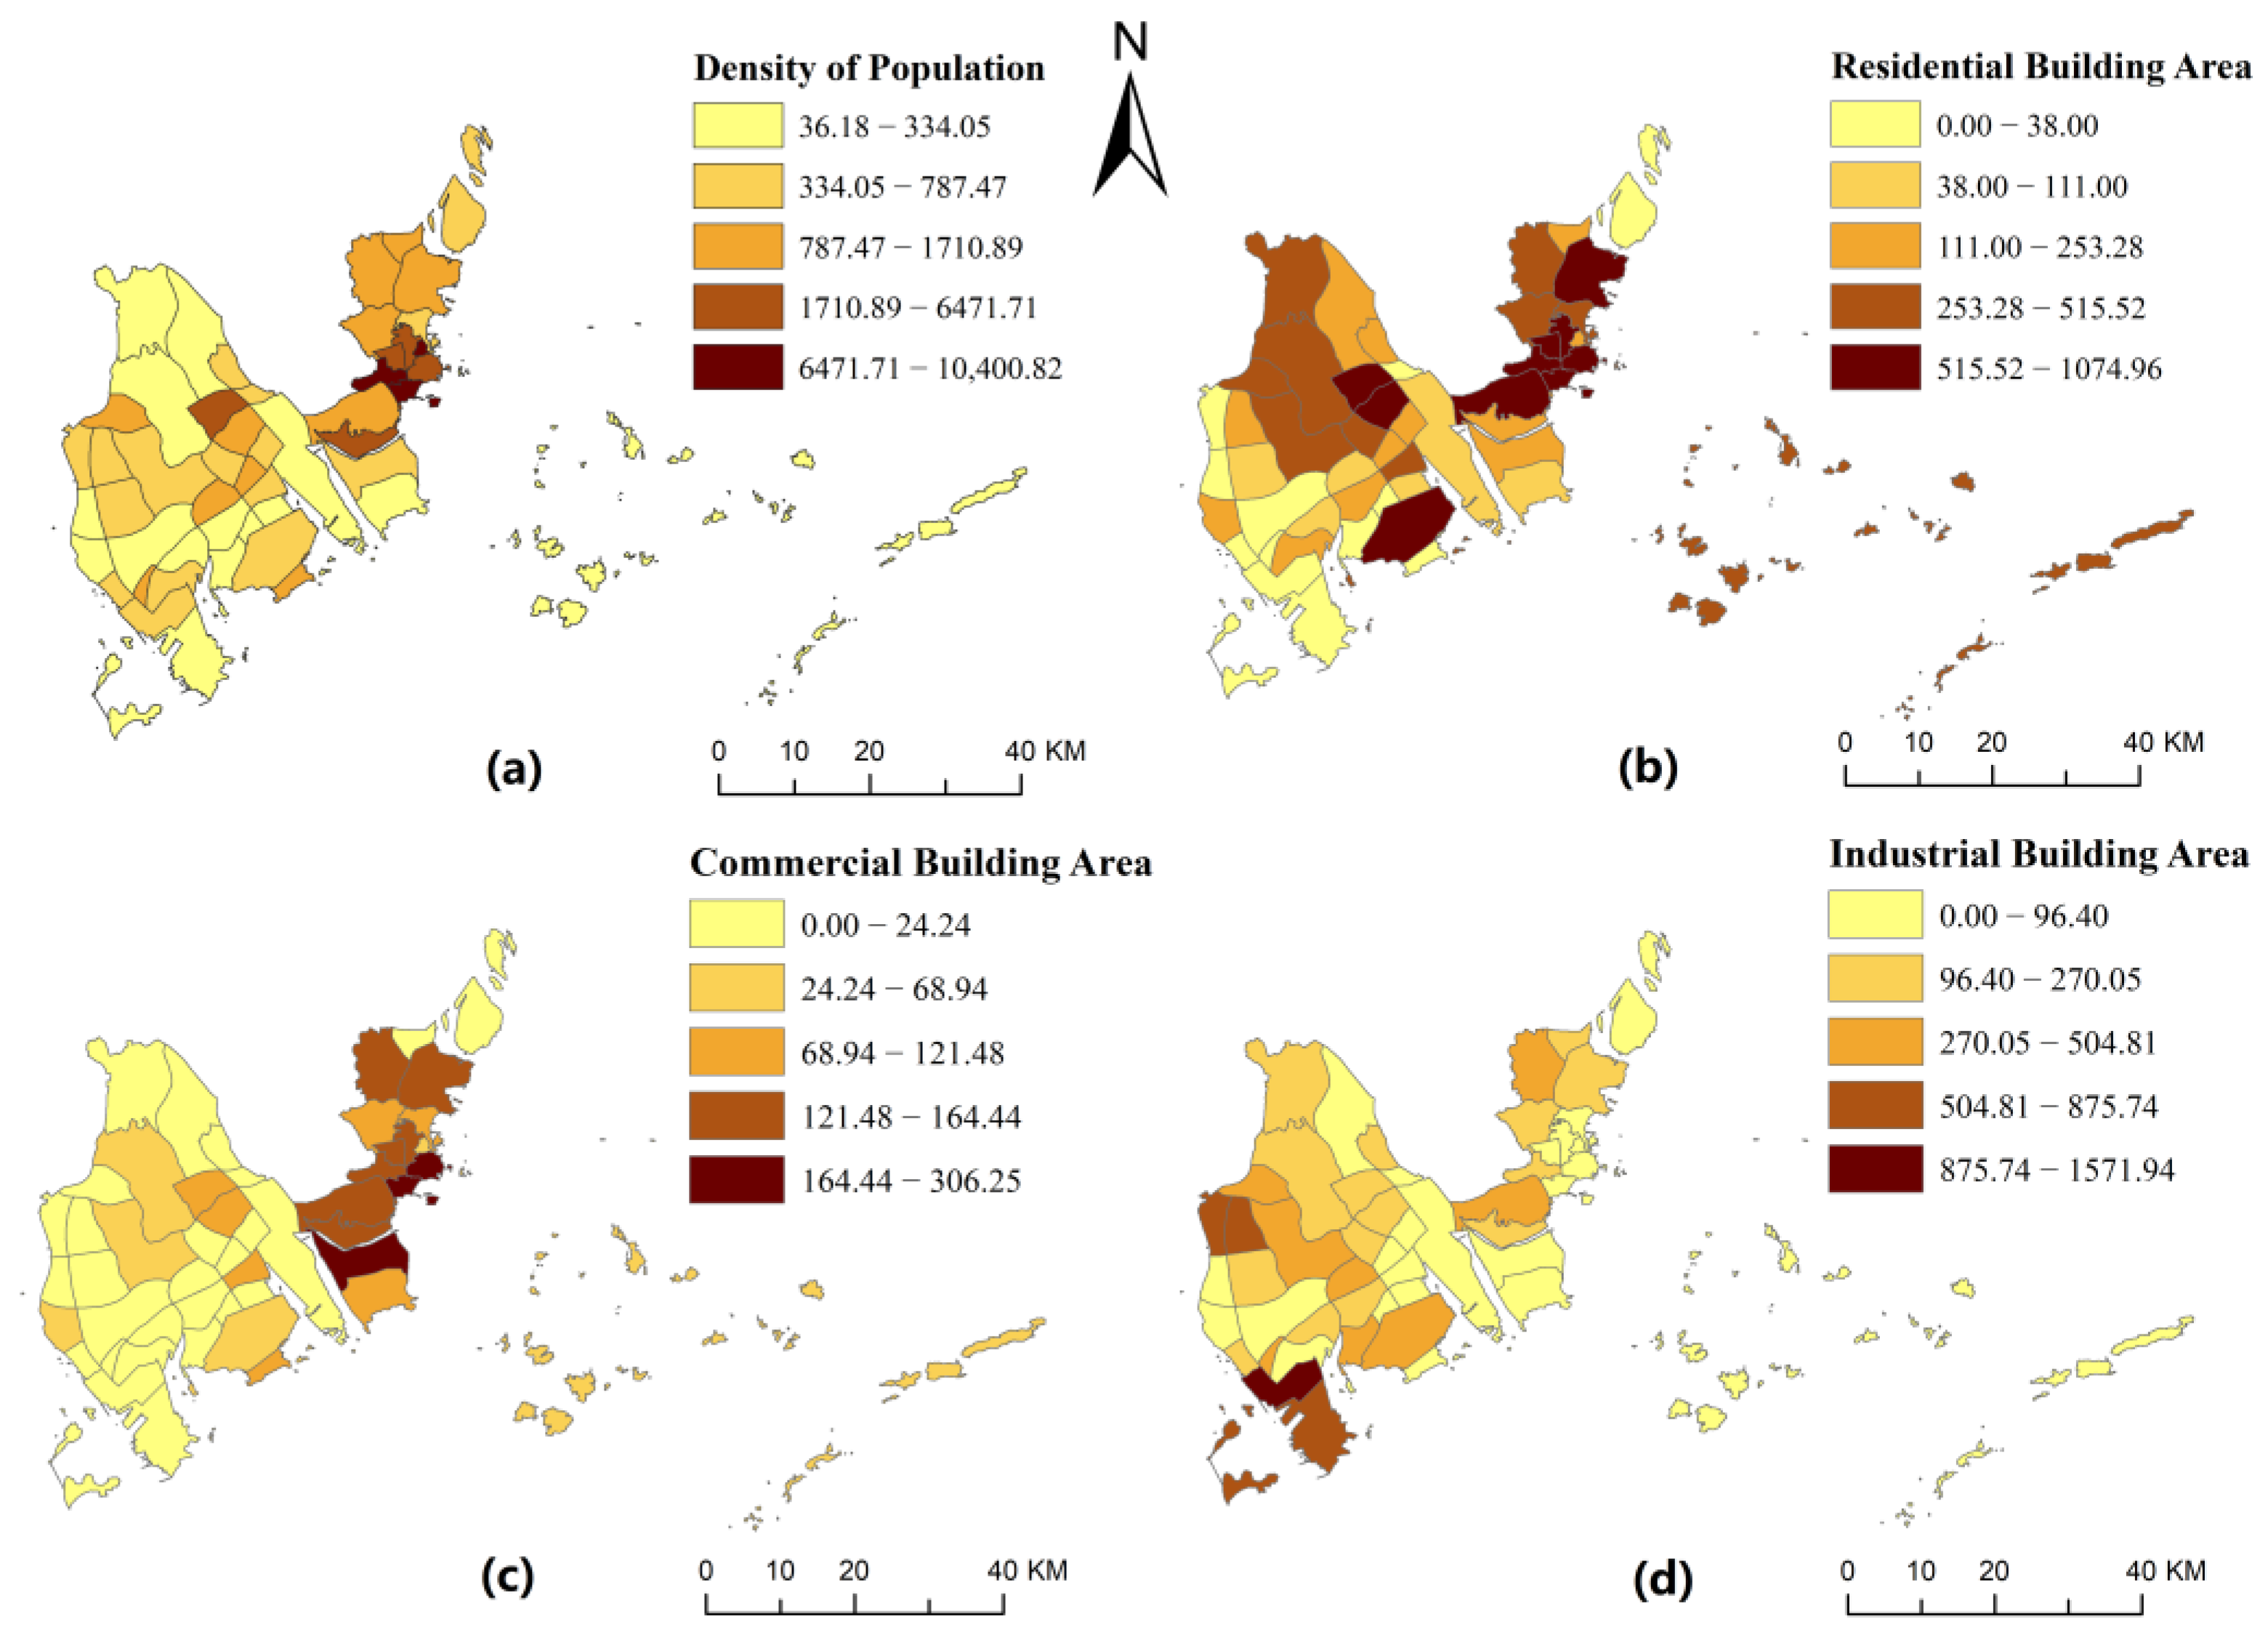
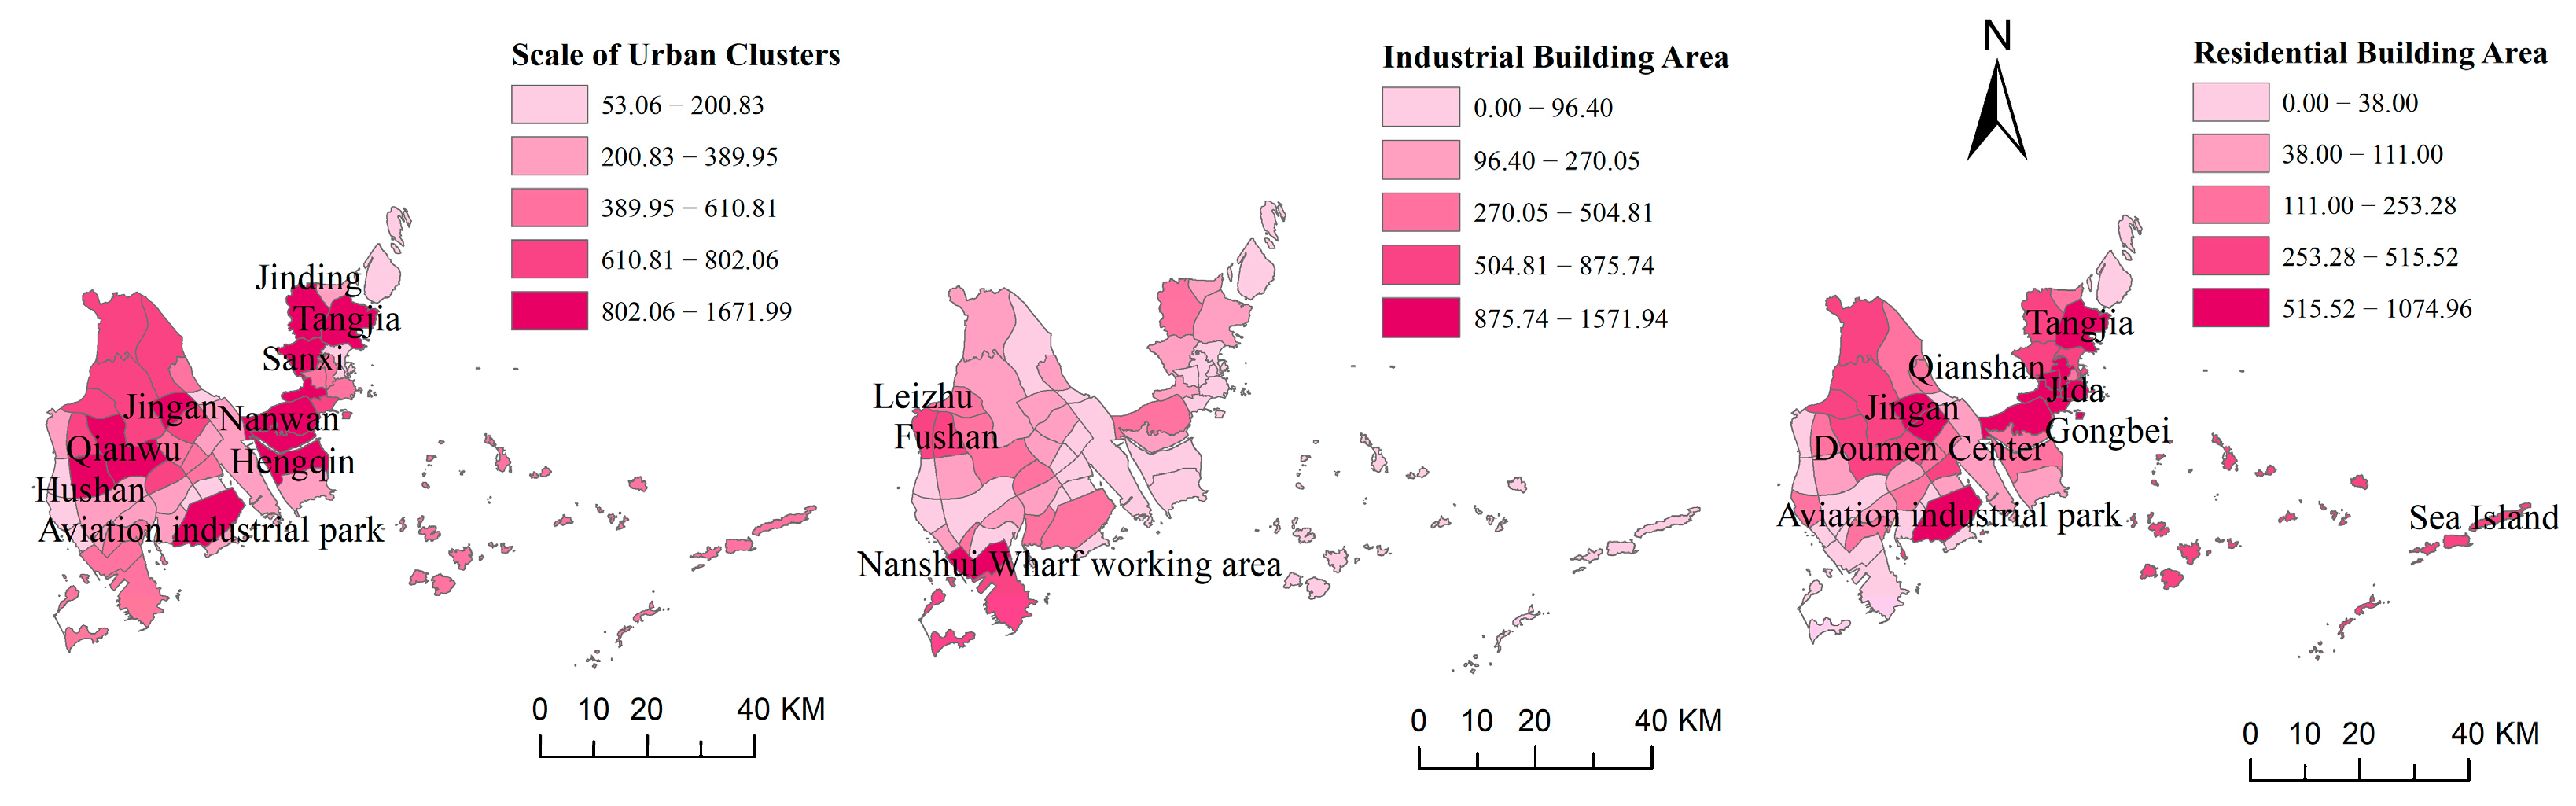
3.2. The Results of Social Spatial Structure Measurement
3.3. The Influence of Urban Spatial Form on Carbon Emission
4. Discussion
5. Conclusions
Author Contributions
Funding
Institutional Review Board Statement
Informed Consent Statement
Data Availability Statement
Acknowledgments
Conflicts of Interest
Appendix A

| Cluster Number | CA | NP | PD | LPI | ED | LSI | PARA_MN | PROX_MN | ENN_MN | CLUMPY | PLADJ | COHESION | AI |
|---|---|---|---|---|---|---|---|---|---|---|---|---|---|
| BB-01 | 782.03 | 687.00 | 8.02 | 1.41 | 39.48 | 30.20 | 998.15 | 15.92 | 124.02 | 0.62 | 64.62 | 91.26 | 65.38 |
| BB-02 | 802.06 | 580.00 | 5.37 | 1.32 | 25.96 | 25.76 | 984.19 | 11.99 | 121.14 | 0.69 | 70.23 | 90.67 | 71.05 |
| BB-03 | 644.69 | 664.00 | 8.51 | 1.06 | 38.37 | 29.80 | 991.14 | 9.07 | 112.01 | 0.59 | 61.58 | 86.84 | 62.39 |
| DM-01 | 428.73 | 124.00 | 6.66 | 15.14 | 67.78 | 15.56 | 1028.01 | 114.76 | 111.87 | 0.70 | 75.45 | 97.30 | 76.66 |
| FS-01 | 750.81 | 248.00 | 8.88 | 14.84 | 71.89 | 18.62 | 930.93 | 127.45 | 102.95 | 0.71 | 77.81 | 96.91 | 78.74 |
| FS-02 | 718.00 | 150.00 | 5.08 | 11.69 | 58.00 | 16.47 | 944.03 | 114.51 | 103.61 | 0.75 | 79.84 | 97.39 | 80.83 |
| FS-03 | 301.94 | 233.00 | 10.31 | 2.49 | 60.13 | 20.41 | 964.58 | 21.97 | 89.04 | 0.57 | 61.47 | 90.49 | 62.65 |
| GL-01 | 609.00 | 195.00 | 2.66 | 6.01 | 24.31 | 18.94 | 994.61 | 118.27 | 148.22 | 0.74 | 74.82 | 97.92 | 75.82 |
| GL-02 | 427.35 | 120.00 | 3.32 | 2.26 | 38.57 | 17.28 | 932.08 | 47.40 | 88.37 | 0.70 | 72.64 | 94.57 | 73.81 |
| GL-03 | 66.70 | 85.00 | 7.87 | 2.18 | 33.02 | 11.10 | 1064.60 | 9.31 | 103.51 | 0.54 | 54.79 | 86.11 | 57.12 |
| GL-04 | 317.82 | 44.00 | 6.80 | 41.62 | 137.11 | 12.70 | 963.92 | 296.28 | 70.36 | 0.57 | 76.58 | 98.59 | 78.02 |
| GL-05 | 429.26 | 104.00 | 5.03 | 6.82 | 46.21 | 12.17 | 948.20 | 59.81 | 134.59 | 0.77 | 80.81 | 96.22 | 82.11 |
| GL-06 | 287.24 | 82.00 | 4.14 | 5.01 | 38.58 | 11.92 | 914.97 | 33.02 | 117.08 | 0.75 | 77.00 | 95.45 | 78.52 |
| GL-07 | 195.29 | 228.00 | 10.73 | 1.52 | 49.19 | 19.21 | 984.92 | 8.37 | 95.98 | 0.52 | 54.94 | 84.32 | 56.26 |
| HQ-01 | 1210.87 | 505.00 | 11.22 | 10.23 | 113.30 | 36.94 | 1000.48 | 186.96 | 77.11 | 0.53 | 65.22 | 96.93 | 65.84 |
| HQ-02 | 312.28 | 208.00 | 5.54 | 2.71 | 31.01 | 16.87 | 983.44 | 25.96 | 118.70 | 0.67 | 68.63 | 92.60 | 69.93 |
| HZ-01 | 1012.27 | 178.00 | 7.53 | 34.86 | 109.55 | 21.04 | 990.68 | 703.45 | 89.13 | 0.64 | 78.41 | 99.05 | 79.23 |
| HZ-02, HZ-03, HZ-04, HZ-05, HZ-06, HZ-07 | 275.31 | 362.00 | 7.81 | 1.75 | 32.44 | 23.10 | 1049.46 | 10.43 | 120.62 | 0.53 | 54.41 | 88.25 | 55.51 |
| HZ-08, JW-09, XZ-09 | 530.91 | 859.00 | 11.08 | 0.64 | 33.38 | 34.24 | 1014.73 | 3.70 | 116.74 | 0.48 | 51.21 | 79.40 | 51.95 |
| JW-01 | 701.70 | 127.00 | 5.56 | 27.00 | 65.37 | 14.34 | 1064.20 | 356.07 | 122.16 | 0.76 | 82.26 | 98.84 | 83.29 |
| JW-02 | 389.95 | 227.00 | 9.32 | 2.77 | 52.89 | 17.46 | 949.22 | 13.07 | 107.93 | 0.67 | 71.13 | 91.78 | 72.33 |
| JW-03 | 471.67 | 183.00 | 14.02 | 23.03 | 149.68 | 23.22 | 1005.62 | 161.72 | 75.26 | 0.47 | 64.85 | 97.56 | 65.85 |
| JW-04 | 215.86 | 108.00 | 7.27 | 4.95 | 58.73 | 15.24 | 973.46 | 33.90 | 105.33 | 0.62 | 65.77 | 92.66 | 67.28 |
| JW-05 | 69.47 | 93.00 | 12.96 | 1.32 | 53.90 | 13.50 | 973.90 | 5.64 | 86.75 | 0.43 | 46.17 | 78.09 | 48.08 |
| JW-06 | 143.09 | 118.00 | 10.05 | 7.74 | 47.30 | 12.51 | 1016.14 | 19.53 | 104.93 | 0.63 | 65.52 | 93.24 | 67.38 |
| JW-07 | 1671.99 | 316.00 | 4.74 | 15.34 | 60.22 | 25.13 | 966.56 | 435.78 | 98.05 | 0.74 | 79.90 | 98.58 | 80.55 |
| JW-08 | 286.60 | 90.00 | 9.91 | 23.23 | 101.75 | 14.58 | 943.67 | 85.40 | 86.74 | 0.61 | 71.82 | 97.39 | 73.24 |
| SB-01 | 736.85 | 196.00 | 7.49 | 12.73 | 89.50 | 22.20 | 1030.96 | 106.43 | 103.04 | 0.64 | 73.19 | 97.55 | 74.09 |
| SB-02 | 73.41 | 68.00 | 8.25 | 3.76 | 41.97 | 10.45 | 1065.61 | 11.48 | 122.87 | 0.58 | 59.80 | 88.59 | 62.19 |
| SB-03 | 1382.93 | 129.00 | 4.70 | 24.94 | 70.34 | 13.61 | 1003.94 | 357.30 | 103.54 | 0.77 | 88.04 | 98.99 | 88.82 |
| SB-04 | 288.63 | 195.00 | 13.20 | 10.71 | 81.96 | 18.58 | 970.17 | 34.64 | 91.22 | 0.57 | 63.99 | 94.21 | 65.26 |
| SB-05 | 576.51 | 169.00 | 8.40 | 19.10 | 79.26 | 16.97 | 974.80 | 174.63 | 94.04 | 0.69 | 76.80 | 97.65 | 77.86 |
| SB-06 | 53.06 | 88.00 | 4.27 | 0.88 | 11.79 | 9.78 | 984.59 | 2.77 | 160.58 | 0.57 | 55.82 | 77.57 | 58.46 |
| SB-07 | 998.21 | 566.00 | 7.06 | 3.80 | 38.79 | 25.26 | 986.37 | 49.71 | 120.71 | 0.71 | 73.85 | 94.80 | 74.62 |
| SB-08 | 373.43 | 528.00 | 8.28 | 0.40 | 30.00 | 25.71 | 981.71 | 3.70 | 116.90 | 0.55 | 56.35 | 78.56 | 57.32 |
| SB-09 | 1039.65 | 286.00 | 6.37 | 14.74 | 54.45 | 19.52 | 956.13 | 237.06 | 102.51 | 0.75 | 80.20 | 97.96 | 81.02 |
| SB-10 | 571.18 | 111.00 | 9.22 | 38.93 | 109.91 | 14.30 | 1022.40 | 250.01 | 78.32 | 0.65 | 80.40 | 98.58 | 81.51 |
| TJ-01, TJ-02 | 87.47 | 72.00 | 3.92 | 2.36 | 18.44 | 9.34 | 931.67 | 8.27 | 136.56 | 0.68 | 66.99 | 87.74 | 69.44 |
| TJ-03 | 269.87 | 50.00 | 4.92 | 14.43 | 80.72 | 13.08 | 1023.41 | 214.32 | 70.84 | 0.67 | 73.92 | 97.61 | 75.43 |
| TJ-04 | 1112.31 | 340.00 | 6.83 | 6.28 | 58.92 | 22.49 | 940.39 | 96.29 | 97.16 | 0.73 | 77.92 | 96.02 | 78.69 |
| TJ-05 | 1007.58 | 223.00 | 4.37 | 6.36 | 57.11 | 23.48 | 921.96 | 181.66 | 96.69 | 0.71 | 75.80 | 97.14 | 76.59 |
| XZ-01 | 1086.32 | 114.00 | 3.47 | 31.18 | 52.13 | 14.25 | 989.44 | 556.92 | 106.83 | 0.80 | 85.89 | 99.29 | 86.75 |
| XZ-02 | 196.79 | 52.00 | 4.18 | 6.54 | 43.10 | 10.44 | 938.78 | 34.57 | 137.84 | 0.73 | 75.69 | 94.15 | 77.49 |
| XZ-03 | 547.10 | 40.00 | 3.12 | 40.96 | 88.37 | 12.41 | 957.01 | 481.96 | 112.88 | 0.72 | 82.60 | 99.30 | 83.77 |
| XZ-04 | 493.83 | 22.00 | 1.94 | 40.26 | 56.40 | 8.17 | 960.62 | 162.16 | 166.49 | 0.81 | 87.93 | 99.22 | 89.25 |
| XZ-05 | 200.83 | 5.00 | 1.71 | 67.95 | 69.99 | 4.54 | 795.21 | 97.33 | 145.20 | 0.73 | 89.52 | 99.46 | 91.64 |
| XZ-06 | 610.81 | 30.00 | 3.36 | 66.36 | 88.37 | 9.05 | 987.56 | 663.84 | 85.57 | 0.66 | 88.01 | 99.58 | 89.19 |
| XZ-07 | 1040.82 | 34.00 | 2.39 | 71.90 | 65.32 | 8.24 | 886.05 | 921.63 | 81.99 | 0.72 | 91.65 | 99.73 | 92.59 |
| XZ-08 | 626.69 | 13.00 | 1.26 | 60.59 | 64.29 | 7.38 | 997.04 | 450.84 | 94.15 | 0.78 | 90.33 | 99.66 | 91.53 |
| XZ-10 | 1479.25 | 151.00 | 2.79 | 24.40 | 53.15 | 19.22 | 974.24 | 1053.45 | 108.21 | 0.79 | 83.66 | 99.26 | 84.38 |
References
- Zhou, S.; Tong, Q.; Pan, X.; Cao, M.; Wang, H.; Gao, J.; Ou, X. Research on low-carbon energy transformation of China necessary to achieve the Paris agreement goals: A global perspective. Energy Econ. 2021, 95, 105137. [Google Scholar] [CrossRef]
- Liang, X.; Jin, X.; He, J.; Wang, X.; Xu, C.; Qiao, G.; Zhang, X.; Zhou, Y. Impacts of land management practice strategy on regional ecosystems: Enlightenment from ecological redline adjustment in Jiangsu, China. Land Use Policy 2022, 119, 106137. [Google Scholar] [CrossRef]
- Notice of the People’s Government of Guangdong Province on the Issuance of the 14th Five-Year Plan for National Economic and Social Development of Guangdong Province and the Outline of Long-Range Goals for 2035; Guangdong Provincial Government [2021] No. 28; Bulletin of Guangdong Provincial People’s Government: Guangzhou, China, 2021; Volume 2.
- Christen, A.; Coops, N.; Crawford, B.; Kellett, R.; Liss, K.; Olchovski, I.; Tooke, T.; Laan, M.; Voogt, J. Validation of Modeled Carbon-Dioxide Emissions from an Urban Neighborhood with Direct Eddy-Covariance Measurements. Atmos. Environ. 2011, 45, 6057–6069. [Google Scholar] [CrossRef]
- Zhang, J.; Jia, R.; Yang, H.; Dong, K. Does electric vehicle promotion in the public sector contribute to urban transport carbon emissions reduction? Transp. Policy 2022, 125, 151–163. [Google Scholar] [CrossRef]
- Hankey, S.; Marshall, J. Impacts of Urban Form on Future US PassengerVehicle Greenhouse Gas Emissions. Energy Policy 2010, 38, 4880–4887. [Google Scholar] [CrossRef]
- Ye, H.; He, X.; Song, Y.; Li, X.; Zhang, G.; Lin, T.; Xiao, L. A Sustainable Urban Form: The Challenges of Compactness from the Viewpoint of Energy Consumption and Carbon Emission. Energy Build. 2015, 93, 90–98. [Google Scholar] [CrossRef]
- Ewing, R.; Rong, F. The Impact of Urban Form on, U.S. Residential Energy Use. Hous. Policy Debate 2008, 19, 1–30. [Google Scholar] [CrossRef]
- Ishii, S.; Tabushi, S.; Aramaki, T.; Hanaki, K. Impact of Future Urban Form on the Potential to Reduce Greenhouse Gas Emissions from Residential, Commercial and Public Buildings in Utsunomiya, Japan. Energy Policy 2010, 38, 4888–4896. [Google Scholar] [CrossRef]
- Ratti, C.; Baker, N.; Steemers, K. Energy Consumption and Urban Texture. Energy Build. 2005, 37, 762–776. [Google Scholar] [CrossRef]
- Chai, Y.; Xiao, Z.; Liu, Z. Comparative analysis on CO2 emission per household in daily travel based on spatial behavior constraints. Sci. Geogr. Sin. 2011, 31, 843–849. [Google Scholar]
- Ma, J.; Liu, Z.; Chai, Y. The Impact of Urban Form on CO2 Emission from Work and Non-Work Trips: The Case of Beijing, China. Habitat Int. 2015, 47, 1–10. [Google Scholar] [CrossRef]
- Falahatkar, S.; Rezaei, F. Towards Low Carbon Cities: Spatio-Temporal Dynamics of Urban Form and Carbon Dioxide Emissions. Remote Sens. Appl. Soc. Environ. 2020, 18, 100317. [Google Scholar] [CrossRef]
- Makido, Y.; Dhakal, S.; Yamagata, Y. Relationship between Urban Form and CO2 Emissions: Evidence from Fifty Japanese Cities. Urban Clim. 2012, 2, 55–67. [Google Scholar] [CrossRef]
- Hong, S.; Hui, E.C.; Lin, Y. Relationship between urban spatial structure and carbon emissions: A literature review. Ecol. Indic. 2022, 144, 109456. [Google Scholar] [CrossRef]
- Palme, M.; Inostroza, L.; Villacreses, G.; Lobato-Cordero, A.; Carrasco, C. From Urban Climate to Energy Consumption. Enhancing Building Performance Simulation by Including the Urban Heat Island Effect. Energy Build. 2017, 145, 107–120. [Google Scholar] [CrossRef]
- Wei, G.; Bi, M.; Liu, X.; Zhang, Z.; He, B. Investigating the impact of multi-dimensional urbanization and FDI on carbon emissions in the belt and road initiative region: Direct and spillover effects. J. Clean. Prod. 2023, 384, 135608. [Google Scholar] [CrossRef]
- Zhou, Y.; Yu, Y.; Wang, Y.; He, B.; Yang, L. Mode substitution and carbon emission impacts of electric bike sharing systems. Sustain. Cities Soc. 2023, 89, 104312. [Google Scholar] [CrossRef]
- Niu, Y.; Zhao, X.; Hu, Y. Spatial variation of carbon emissions from county land use in Chang-Zhu-Tan area based on NPP-VIIRS night light. Acta. Sci. Circumst. 2021, 41, 3847–3856. [Google Scholar]
- Zhu, E.; Deng, J.; Zhou, M.; Gan, M.; Jiang, R.; Wang, K.; Shahtahmassebi, A. Carbon emissions induced by land-use and land-cover change from 1970 to 2010 in Zhejiang, China. Sci. Total Environ. 2019, 646, 930–939. [Google Scholar] [CrossRef]
- Yang, Y.; Li, H. Spatiotemporal dynamic decoupling states of eco-environmental quality and land-use carbon emissions: A case study of Qingdao City, China. Ecol. Inform. 2023, 75, 101992. [Google Scholar] [CrossRef]
- Zhang, X.; Liu, L.; Chen, X.; Gao, Y.; Xie, S.; Mi, J. GLC_FCS30, global land-cover product with fine classification system at 30 m using time-series Landsat imagery. Earth Syst. Sci. Data 2021, 13, 2753–2776. [Google Scholar] [CrossRef]
- Fang, J.; Guo, Z.; Piao, S.; Chen, A. Terrestrial vegetation carbon sinks in China, 1981–2000. Sci. China Ser. D Earth Sci. 2007, 50, 1341–1350. [Google Scholar] [CrossRef]
- Zhao, R.; Huang, X.; Zhong, T. Research on carbon emission intensity and carbon footprint of different industrial spaces in China. Acta Geogr. Sin. 2010, 65, 1048–1057. [Google Scholar]
- Jiang, J. An evaluation and decomposition analysis of carbon emissions in China. Resour. Sci. 2011, 33, 597–604. [Google Scholar]
- Alphan, H. Analysis of Landscape Changes as an Indicator for Environmental Monitoring. Environ. Monit. Assess. 2017, 189, 24. [Google Scholar] [CrossRef]
- Roozbeh, M.; Babaie-Kafaki, S.; Sadigh, A. A Heuristic Approach to Combat Multicollinearity in Least Trimmed Squares Regression Analysis. Appl. Math. Model. 2018, 57, 105–120. [Google Scholar] [CrossRef]
- Jasiński, T. Modeling electricity consumption using nighttime light images and artificial neural networks. Energy 2019, 179, 831–842. [Google Scholar] [CrossRef]
- Jia, Y.; Tang, L.; Xu, M.; Yang, X. Landscape Pattern Indices for Evaluating Urban Spatial Morphology–A Case Study of Chinese Cities. Ecol. Indic. 2019, 99, 27–37. [Google Scholar] [CrossRef]
- Bibri, S.; Krogstie, J.; Kärrholm, M. Compact city planning and development: Emerging practices and strategies for achieving the goals of sustainability. Dev. Built Environ. 2020, 4, 100021. [Google Scholar] [CrossRef]
- Chen, J.; Gao, M.; Cheng, S.; Hou, W.; Song, M.; Liu, X.; Liu, Y.; Shan, Y. County-level CO2 emissions and sequestration in China 1997–2017. Sci. Data. 2020, 7, 391. Available online: https://www.nature.com/articles/s41597-020-00736-3 (accessed on 3 January 2023). [CrossRef]
- Lin, J.; Qiao, Z.; Ye, Z. Delimitation’ and ‘Implementation’ of urban growth boundary: Analysis and thoughts on the practice in 14 pilot cities in China. Urban Plan. Forum. 2017, 2, 37–43. [Google Scholar]
- Wang, W.; Jiao, L.; Zhang, W.; Jia, Q.; Su, F.; Xu, G.; Ma, S. Delineating urban growth boundaries under multi-objective and constraints. Sustain. Cities Soc. 2020, 61, 102279. [Google Scholar] [CrossRef]
- Qin, B.; Qi, B. The impact of urban form on household building carbon emission: A case study of Beijing. Urban Plan. Int. 2013, 28, 42–46. [Google Scholar]


| Data Name | Format and Resolution | Year | Data Source |
|---|---|---|---|
| Urban cluster boundary data | shp | 2020 | Master Plan of Zhuhai Territory Space (2021–2035), (accessed on 3 January 2023) |
| Land use data | 30 m tiff | 2020 | The Global 30-m land Cover Fine Classification product of CAS 2020 https://data.casearth.cn/sdo/detail/5fbc7904819aec1ea2dd7061, (accessed on 3 January 2023) |
| Road data | shp | 2020 | Data of desensitization of land use types in the third National Land Survey, Open Street Map (OSM), http://openstreetmap.org, (accessed on 3 January 2023) |
| Population density data | 1 km tiff | 2020 | Worldpop population density data set, https://www.worldpop.org/project/categories?id=18, (accessed on 3 January 2023) |
| Building data | shp | 2020 | Basic mapping and geographic information desensitization data of central city of Zhuhai, (accessed on 3 January 2023) |
| Socioeconomic data | 2020 | Zhuhai Statistics Bureau, http://tjj.zhuhai.gov.cn/tjsj/tjnj/content/post_3020527.html, (accessed on 3 January 2023) | |
| Carbon emission inventory data | xlsx | 2020 | China’s county-level carbon dioxide emission inventory, https://www.ceads.net/user/index.php?id=1057&lang=en, (accessed on 3 January 2023) |
| First-Order Index | Secondary Index | Meaning |
|---|---|---|
| Area | Patch Class Area (CA) | The total area of a certain type of landscape patch can measure the growth of urban cluster. |
| Number of Patches (NP) | The number of a certain kind of landscape patches can measure the degree of fragmentation of the city, and the larger the value, the more patches inside the city and the more dispersed the urban form. | |
| Largest Patch Index (LPI) | The area proportion of dominant patch types in the landscape can describe the extent to which an urban area is characterized by a single pattern of nuclear development. | |
| Edge | Edge Density (ED) | The length of landscape element boundary in a unit area of landscape can represent the spread and shape of different urban land edges and quantify the complexity of urban shape. |
| Shape | Mean Perimeter-Area Ratio (PARA-MN) | It represents the ratio of total urban patch perimeter to total area, which can describe the regularity of urban form. The smaller the value, the more regular the city shape. |
| Landscape Shape Index (LSI) | Measuring the perimeter area ratio of urban patches can reflect the regularity of urban interior. | |
| Aggregation | Clumpiness Index (CLUMPY) | Reflecting the degree of aggregation among urban patches, its value is 0 for random distribution of urban patches and 1 for maximum aggregation of urban patches. |
| Percentage of Like Adjacencies (PLADJ) | Represents the degree of connectivity within urban built-up areas, and the index is minimum if urban patches are dispersed to the greatest extent, and maximum if urban patches are coherent to the greatest extent. | |
| Patch Cohesion Index (COHESION) | It is possible to measure the physical connectivity of urban land, which increases as urban patches become more clustered in distribution. | |
| Aggregation Index (AI) | The number of similar adjacencies of the same type of pixels based on the single counting method. The more adjacencies of the same type of patches, the higher the degree of aggregation. When there were no adjacent pixels between patches of the same type, the degree of polymerization was the lowest. | |
| Mean Proximity Index (PROX-MN) | Refers to the ratio of “mean observed distance” to “mean expected distance”. All other things being equal, an adjacent patch with a corresponding type of patch distributed over a larger, more adjacent patch will also have a larger index value. Thus, the proximity index measures both the degree of isolation of a patch and the degree of fragmentation of the corresponding type of patch in a given neighborhood. | |
| Mean Euclidean Nearest Neighbor Distance (ENN-MN) | The average distance between the two closest urban patches is quantified, which can be interpreted as the spatial linkage value between urban patches. The larger the value, the higher the degree of urban growth and expansion. | |
| Patch Density (PD) | Represents the patch area per unit area, and the larger the value, the greater the patch density per unit area in the city. |
| Index | Collinear Statistics | |
|---|---|---|
| Tolerance | VIF | |
| CA | 0.105 | 9.545 |
| NP | 0.04 | 25.229 |
| PD | 0.123 | 8.11 |
| LPI | 0.049 | 20.594 |
| ED | 0.05 | 19.826 |
| LSI | 0.017 | 59.777 |
| PARA_MN | 0.553 | 1.807 |
| PROX_MN | 0.167 | 5.996 |
| ENN_MN | 0.326 | 3.072 |
| CLUMPY | 0.013 | 75.383 |
| PLADJ | 0 | 4752.656 |
| COHESION | 0.064 | 15.611 |
| AI | 0 | 5237.145 |
| CA | NP | PD | LPI | ED | LSI | PARA_MN | PROX_MN | ENN_MN | CLUMPY | PLADJ | COHESION | AI | |
|---|---|---|---|---|---|---|---|---|---|---|---|---|---|
| CA | 1 | ||||||||||||
| NP | 0.411 ** | 1 | |||||||||||
| PD | −0.205 | 0.521 ** | 1 | ||||||||||
| LPI | 0.375 ** | −0.533 ** | −0.391 ** | 1 | |||||||||
| ED | 0.285 * | −0.237 | 0.159 | 0.761 ** | 1 | ||||||||
| LSI | 0.460 ** | 0.947 ** | 0.507 ** | −0.425 ** | −0.07 | 1 | |||||||
| PARA_MN | −0.028 | 0.178 | 0.329 * | −0.107 | 0.014 | 0.19 | 1 | ||||||
| PROX_MN | 0.651 ** | −0.290 * | −0.437 ** | 0.893 ** | 0.681 ** | −0.155 | −0.055 | 1 | |||||
| ENN_MN | −0.174 | 0.034 | −0.346 * | −0.335 * | −0.681 ** | −0.118 | −0.012 | −0.400 ** | 1 | ||||
| CLUMPY | 0.490 ** | −0.259 | −0.758 ** | 0.498 ** | −0.001 | −0.310 * | −0.353 * | 0.564 ** | 0.311 * | 1 | |||
| PLADJ | 0.552 ** | −0.428 ** | −0.684 ** | 0.837 ** | 0.429 ** | −0.399 ** | −0.317 * | 0.837 ** | −0.05 | 0.844 ** | 1 | ||
| COHESION | 0.545 ** | −0.423 ** | −0.542 ** | 0.949 ** | 0.644 ** | −0.303 * | −0.111 | 0.949 ** | −0.264 | 0.631 ** | 0.901 ** | 1 | |
| AI | 0.530 ** | −0.447 ** | −0.687 ** | 0.844 ** | 0.428 ** | −0.419 ** | −0.319 * | 0.831 ** | −0.039 | 0.842 ** | 0.998 ** | 0.901 ** | 1 |
| Variable 1 | Variable 2 | Spearman Rank Correlation Coefficient between Variables |
|---|---|---|
| PLADJ | AI | 0.998 ** |
| LPI | COHESION | 0.949 ** |
| PROX_MN | COHESION | 0.949 ** |
| NP | LSI | 0.947 ** |
| PLADJ | COHESION | 0.901 ** |
| LPI | PROX_MN | 0.893 ** |
| CLUMPY | PLADJ | 0.844 ** |
| CLUMPY | AI | 0.842 ** |
| PROX_MN | PLADJ | 0.837 ** |
| PROX_MN | AI | 0.831 ** |
| LPI | ED | 0.761 ** |
| PD | CLUMPY | −0.758 ** |
| PD | AI | −0.687 ** |
| PD | PLADJ | −0.684 ** |
| ED | PROX_MN | −0.681 ** |
| ED | ENN_MN | −0.681 ** |
| CA | PROX_MN | 0.651 ** |
| ED | COHESION | 0.644 ** |
| CLUMPY | COHESION | 0.631 ** |
| CA | PLADJ | 0.552 ** |
| CA | COHESION | 0.545 ** |
| NP | LPI | −0.533 ** |
| NP | PD | 0.521 ** |
| PD | LSI | 0.507 ** |
| Model | Unstandardized Coefficient | Standardization Coefficient | t | Significance | Collinear Statistics | ||
|---|---|---|---|---|---|---|---|
| B | Standard Error | Beta | Tolerance | VIF | |||
| (Constant) | 0.475 | 0.096 | 4.935 | 0.000 | |||
| CA | 0.554 | 0.077 | 0.630 | 7.184 | 0.000 | 0.829 | 1.206 |
| LPI | −0.311 | 0.080 | −0.388 | −3.868 | 0.000 | 0.632 | 1.582 |
| PD | −0.433 | 0.099 | −0.498 | −4.353 | 0.000 | 0.486 | 2.059 |
| ENN_MN | −0.394 | 0.099 | −0.418 | −3.975 | 0.000 | 0.577 | 1.733 |
| Model | Unstandardized Coefficient | Standardization Coefficient | t | Significance | Collinear Statistics | ||
|---|---|---|---|---|---|---|---|
| B | Standard Error | Beta | Tolerance | VIF | |||
| (Constant) | 0.028 | 0.030 | 0.939 | 0.353 | |||
| Density of Population | −0.169 | 0.092 | −0.182 | −1.849 | 0.071 | 0.664 | 1.505 |
| Residential Building Area | 0.343 | 0.087 | 0.405 | 3.925 | 0.000 | 0.608 | 1.646 |
| Commercial Building Area | 0.175 | 0.094 | 0.209 | 1.858 | 0.070 | 0.509 | 1.964 |
| Industrial Building Area | 0.885 | 0.097 | 0.751 | 9.084 | 0.000 | 0.945 | 1.059 |
Disclaimer/Publisher’s Note: The statements, opinions and data contained in all publications are solely those of the individual author(s) and contributor(s) and not of MDPI and/or the editor(s). MDPI and/or the editor(s) disclaim responsibility for any injury to people or property resulting from any ideas, methods, instructions or products referred to in the content. |
© 2023 by the authors. Licensee MDPI, Basel, Switzerland. This article is an open access article distributed under the terms and conditions of the Creative Commons Attribution (CC BY) license (https://creativecommons.org/licenses/by/4.0/).
Share and Cite
Zhang, Y.; Zhang, S.; Gong, Y. The Association between Carbon Emission and Urban Spatial Form—A Study of Zhuhai, China. Land 2023, 12, 720. https://doi.org/10.3390/land12030720
Zhang Y, Zhang S, Gong Y. The Association between Carbon Emission and Urban Spatial Form—A Study of Zhuhai, China. Land. 2023; 12(3):720. https://doi.org/10.3390/land12030720
Chicago/Turabian StyleZhang, Yiheng, Shengyong Zhang, and Yabo Gong. 2023. "The Association between Carbon Emission and Urban Spatial Form—A Study of Zhuhai, China" Land 12, no. 3: 720. https://doi.org/10.3390/land12030720
APA StyleZhang, Y., Zhang, S., & Gong, Y. (2023). The Association between Carbon Emission and Urban Spatial Form—A Study of Zhuhai, China. Land, 12(3), 720. https://doi.org/10.3390/land12030720