Abstract
This paper shows the changes in soil properties in the fourth year after the application of two kinds of environmentally burdensome wastes. One of the wastes was mineral—carboniferous rock from a coal mine, and the other one was organic—post-fermentation sludge from an agricultural biogas plant. The wastes were applied once to a soil of poor quality—a Podzol. The hypothesis to be verified was that one-time application of waste carboniferous rock and/or post-fermentation sludge to a soil has a beneficial effect on the physical status of the soil, and the changes in the soil properties have a permanent character. Also, based on the experiment results, we suggested how these types of waste should be applied to soil. For that purpose, an assessment was performed of the durability, range, and character of changes in soil properties, inter alia: soil texture (PSD), total organic carbon content (TOC), particle density (PD), bulk density (BD), total porosity (TP), air capacity (FAC), air permeability (FAP), sampling moisture (SM), field water capacity (FC), available water (AWC), unavailable water (UWC), and hydraulic conductivity (Ks). Some soil properties have been improved by the use of post-fermentation sludge and the combined application of the two wastes. These were the following soil properties: PSD, TOC, BD, TP, and SM. However, changes to the soil air-water properties (FAC, FAP, FC, AWC, UWC, and Ks) were unfavorable. The effect of the waste’s application was permanent, as differences in soil properties were still visible in the fourth year after their addition. The observations made in the course of the experiment indicate that natural utilization of wastes requires a lot of consideration and should be focused on keeping the balance in the relations between the environmental functions of the soil.
1. Introduction
The soil is subject to the effect of a variety of factors which can, sometimes, cause its degradation [1,2]. One of the forms of soil degradation is physical degradation, consisting in excessive soil compaction. Studies by Reynolds et al., [3,4] and Pranagal et al., [5] indicate that strong compaction of soil in the root zone of crop plants determines their growth. With a considerable level of compaction in the soil mass, one should expect (i) problems with soil aeration, (ii) limited access of plants to usable water and nutrients, (iii) increased mechanical resistance during the movement of roots in the soil and disturbances in the development of plant root systems, and (iv) increased difficulty of soil tillage. These disturbances in the functioning of the soil–plant–atmosphere system lead to a lowering of yields.
Soil resources are accepted as non-renewable, and soil is a complex and dynamic medium [6,7,8]. Soil properties can be modified by introducing materials with mineral or organic character [9,10,11,12]. The area of soils with various forms of degradation is constantly growing [8,13]. For this reason, various soil amendment techniques are being tested. Apart from the application of fertilisers, such techniques consist also in the introduction of various additional materials to the soil. Those materials include wastes and products of their processing [5,11,12,14,15,16,17]. In Poland, such materials are most frequently the following: sewage sludge, compost produced from municipal waste, lignite, or waste mineral wool. The predicted increase in the number of agricultural biogas plants [18] also stimulates research on the possibility of post-fermentation sludge application to the soil [19,20,21]. In the case of agricultural utilization of wastes, the amount of wastes discharged to dumps will decrease. This way one can achieve two purposes: (i) disposal of the waste, and (ii) improvement of soil properties [5,11,19,22,23,24].
Current EU regulations [25] impose the obligation to constantly increase the amount of utilized wastes. An important aspect of the application of wastes to the soil, both mineral and organic, is the resultant change of its physical properties, as the physical status of the soil plays an important function in the soil-plant-atmosphere relation [3,17,26] and determines the conditions in which (i) all chemical reactions, (ii) biochemical transformations, and (iii) microbiological processes take place [11,27,28].
An example of an activity with pro-ecological character is the study presented herein, which combines two objectives: (i) to reduce the load on the environment through reducing the amount of wastes deposed in it, and (ii) to achieve an improvement of soil properties. The study that combined the application of wastes to the soil as a way of their utilization with a soil-amending effect of those wastes consisted of a field experiment in which two kinds of waste that normally constitute a burden on the environment were used. One of them was a mineral waste—carboniferous rock from a coal mine, and the other was an organic waste—post-fermentation sludge from an agricultural biogas plant. The wastes were applied to a sandy soil (loamy sand—LS) with a low utility value. According to WRB [29], it was a Podzol (PZ) developed from fluvioglacial sand. The objective of the study was to analyze the changes in the physical status of the soil in the fourth year after one-time application of the wastes. Based on such a study planned in that manner, it was decided to verify the following hypothesis: one-time application of waste carboniferous rock and/or post-fermentation sludge to soil causes an improvement in the physical status of the soil, and the effect of the change in the soil properties has a permanent character.
2. Materials and Methods
2.1. Study Area, Field Experiment and Sampling
The experiment was located in eastern Poland, in the area of the Experimental Station Bezek-51°12′ N; 23°17′ E (Figure 1). The field experiment was conducted under the climate conditions of east Poland. The study area is situated in the temperate cool climate (Dfb), transitional, with substantial influence of continental climate (https://pl.climate-data.org/info/sources; accessed on 30 November 2022). The average duration of the vegetation period in the analyzed area is 210–215 days, and the period most often starts in the second or third ten-day period of March and lasts until the end of October. During the periods of the study, the meteorological conditions varied considerably. In the third year of the experiment, when soil cultivation treatments were performed to prepare the soil for winter rye sowing (2nd ten-day period of September 2017), the annual precipitation total was 598.2 mm and the mean annual air temperature was 8.9 °C. The fourth year of the study, when winter rye matured and was harvested, was a notably warmer season compared to the preceding year (9.6 °C), and it was characterized by a considerably lower annual precipitation total—433.6 mm (Figure 2).
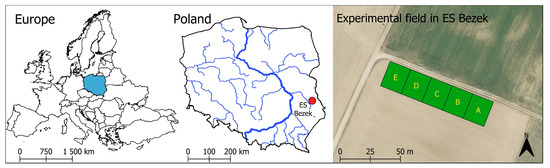
Figure 1.
Study area; ES Bezek—Experimental Station in Bezek, Poland.
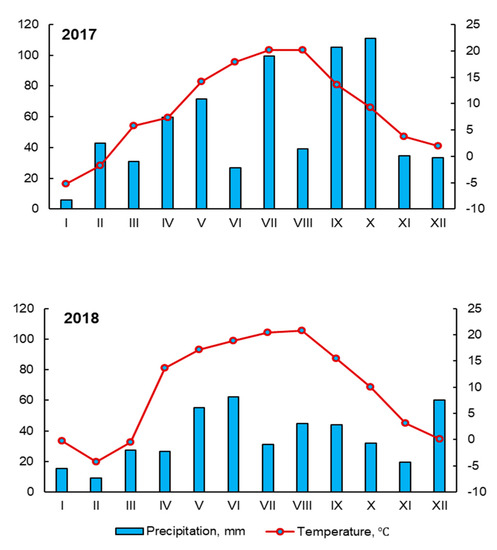
Figure 2.
Mean monthly temperature and precipitation.
The study area was situated in the mesoregion Pagóry Chełmskie, a part of the macroregion of Lublin Upland. The mesoregion is characterized by a strongly diversified soil cover, determined primarily by the effect of the continental glacier [30]. The soil of the experimental field was classified as a Podzol (PZ) developed from fluvioglacial sand [29]. The particle size distribution of the arable horizon Ap prior to the application of the wastes was that of loamy sand (LS).
The field experiment was set up in 2014 with the method of random blocs (in three replicates). The following crop rotation was used in the field experiment: winter wheat, winter rape, oat, and in the fourth year of the experiment—winter rye. Each experimental bloc was divided into 5 plots with an area of 37.5 m2. The plots were the individual experimental treatments (treatments A, B, C, D, and E; Figure 1). The following scheme of the experiment was adopted: treatment A—control soil without additives; treatment B—soil with N fertilization (autumn—40 kg ha−1 and spring—80 kg ha−1), P (100 kg ha−1), K (120 kg ha−1), Mg (40 kg ha−1), Ca (60 kg ha−1), and S (20 kg ha−1); treatment C—soil with carboniferous rock in a dose of 200 Mg ha−1; treatment D—soil with post-fermentation sediment in a dose of 60 m3 ha−1; and treatment E—soil with carboniferous rock (200 Mg ha-1) and post-fermentation sediment (60 m3 ha−1). Mineral fertilizers (N, P, K, Mg, Ca, and S) were applied (treatment B) each year of the experiment during field preparation for crop plant sowing.
In the summer of the first year of the experiment (2014), the test wastes—post-fermentation sludge and carboniferous rock—were introduced to the soil (treatments C, D, and E). The post-fermentation sludge was applied to the soil in liquid form. The sludge was acquired from the agricultural biogas plant of the company Wikana Bioenergia Sp. Z o.o. located in Siedliszczki, Lublin Province. The substrates used in the biogas plant were maize silage (70%), sugar beet silage (15%), fruit pomace (5%), dairy waste (5%), and FYM (5%). Those materials were subjected to mesophilic fermentation conducted at temperatures of 32–42 °C. The post-fermentation sludge was strongly hydrated; dry matter content of the substrates used in the experiment was 8% (Table 1).

Table 1.
Some properties of soil and applied wastes (by [5,19]).
Mining waste constituting the carboniferous rock came from the exploitation layers of the coal deposits of a coal mine of the company Lubelski Węgiel “Bogdanka” S.A. It was a mix of loams, mudstones, and claystones (PD = 2.72–2.84 Mg m−3). Their mineral composition was dominated by SiO2—470 g kg−1 and Al2O3—220 g kg−1 [19] (Table 1). The carboniferous rock applied to the soil had the form of a solid with the character of non-fragmented and non-averaged rock with equivalent diameters of 5–100 mm. Both of the wastes, at doses adopted in the experiment, were initially spread over the surface of the soil. Next, to mix them with the soil, ploughing to the depth of ca. 20 cm was performed. Then the soil surface was evened using an active harrow. After the soil rested, 20 days after the application of the waste, the soil was prepared for crop plant sowing. The primary soil tillage system applied was the conventional plough tillage system. As a method of soil cultivation, conventional tillage was applied: moldboard ploughing (18–20 cm) + harrowing, and sowing + harrowing.
Soil samples with undisturbed structure were collected into metal cylinders with a volume of 100 cm3. Soil sampling was performed in spring, in the phase of winter rye heading (2nd ten-day period of May 2018), in the fourth year of the waste’s utilization. Soil samples were collected from two soil layers, 0–10 and 10–20 cm, in 6 replicates.
2.2. Analysis
Physical soil properties, such as size particle distribution (PSD), particle density (PD), bulk density (BD), total porosity (TP), air capacity (at −15.5 kPa) (FAC), air permeability (at −15.5 kPa) (FAP), soil moisture at sampling (SM), field water capacity (FC), available water content (AWC), unavailable water content—permanent wilting point (UWC), saturated hydraulic conductivity (Ks), and FC/TP ratio were studied. The soil water retention curve was determined with the use of a pressure plate apparatus (Soil-moisture Equipment Corp., Goleta, CA, USA). The level of field soil saturation with water was calculated for soil moisture level at a potential value of −15.5 kPa and permanent wilting point (UWC) of −1550.0 kPa. The content of organic carbon (TOC) was measured with the use of a Shimadzu TOC-VCSH analyzer with an SSM-5000A adapter for solid sample combustion.
The soil physical properties were determined according to the following procedures [31]:
- -
- soil texture—particle size distributions (PSD)—with Casagrande method modified by Prószyński [32],
- -
- particle density (PD)—with the pycnometric method [33] (Mg m−3),
- -
- bulk density (BD)—with the gravimetric method, from the ratio of the mass of soil dried at 105 °C to the initial soil volume of 100 cm3 [34] (Mg m−3),
- -
- total porosity (TP) was calculated from the results of particle density (PD) and bulk density (BD), TP = 1 − BD/PD [35] (m3 m−3),
- -
- air capacity at the potential of −15.5 kPa (FAC) was derived from the results of total porosity (TP) and field water capacity (FC) (−15.5 kPa), FAC = TP − FC [35] (m3 m−3),
- -
- air permeability at the potential of −15.5 kPa (FAP) was measured using an apparatus for the measurement of permeability of molding sand, LPiR-2e. The measurements were conducted at vertical (upward) airflow through the soil sample. The pressure head in the measurement chamber was 0.981 kPa (100 mm H2O), and the ambient temperature was stabilized (20 ± 1.0 °C). The relative air humidity was 40 ± 5%. The dynamic air viscosity (10−8 m2 Pa−1s−1) was not taken into account in the measurement results. The apparatus was produced by MULTISERW-Morek (Poland),
- -
- water content at sampling (SM) was calculated from the ratio of the mass of water contained in the soil during the sampling to the dry matter of soil dried at 105 °C [36] (kg kg−1),
- -
- field water capacity (FC) was calculated from the ratio of the volume of water contained in the soil at the potential of −15.5 kPa to the soil volume [37,38] (m3 m−3),
- -
- available water content (AWC) was obtained from FC (−15.5 kPa) and unavailable water content (−1550.0 kPa)—permanent wilting point (UWC), AWC = FC − UWC [37,38] (m3 m−3),
- -
- unavailable water content (UWC) was calculated from the ratio of the volume of water contained in the soil at the potential of −1550.0 kPa to the soil volume [37,38] (m3 m−3),
- -
- saturated hydraulic conductivity (Ks) was measured with the Wite method, using an Eijkelkamp apparatus in an open system [39,40] (m d−1).
Air-water relations of the soil were analyzed by determining the values of the FC/TP ratio [4,41,42].
2.3. Statistical Analysis
The results were statistically evaluated with analysis of variance (ANOVA). All pairs of means between treatments were compared with Tukey’s test and the lowest significant difference test (LSD). The analysis (one-way ANOVA—soil from treatments A, B, C, D, and E) was performed for the results concerning the soil from the layer 0–20 cm. In that manner, mean values for each soil property under analysis were compared (Figure 3 and Figure 4). An estimation was also made of the statistical variation of the results obtained in the experiment, calculating the coefficients of variation CVs = SD (standard deviation)/(arithmetic mean) (Table 2, Table 3 and Table 5) and the coefficients of correlation (r) for the soil properties studied (Table 4). The statistical evaluation (ANOVA-LSD) and the correlation (n = 60) estimation (r) were conducted assuming the significance level of α = 0.05. Statistica 11 by Statsoft and ARSTAT by University of Life Sciences in Lublin were used for statistical analyses.
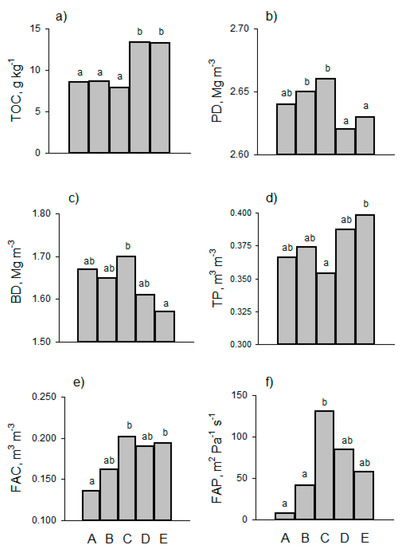
Figure 3.
Mean values (0–20 cm layer) of soil properties: (a) total organic carbon content (TOC), (b) particle density (PD), (c) bulk density (BD), (d) total porosity (TP), (e) air capacity at the potential of −15.5 kPa (FAC), and (f) air permeability at the potential of −15.5 kPa (FAP). Explanations: treatment A—control soil without additives; treatment B—soil with N, P, K, Mg, Ca, and S fertilization; treatment C—soil with carboniferous rock; treatment D—soil with post-fermentation sediment; treatment E—soil with carboniferous rock and post-fermentation sediment. Different letters (a, b, ab, …c) mean significant differences (between treatments) according to the Tukey’s lowest significant difference (LSD).
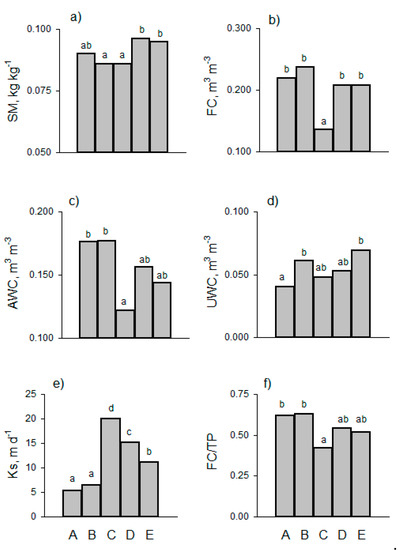
Figure 4.
Mean values (0–20 cm layer) of soil properties: (a) water content at sampling (SM), (b) field water capacity at the potential of −15.5 kPa (FC), (c) available water content (AWC), (d) unavailable water content (UWC), (e) saturated hydraulic conductivity (Ks), and (f) FC/TP ratio. Explanations as for Figure 3. Different letters (a, b, ab, c, d) mean significant differences (between treatments) according to the Tukey’s lowest significant difference (LSD).
Table 2.
Soil particle size distribution—PSD, %, w/w.
Table 3.
Variability (CVs) and range value of soil properties: TOC, PD, BD, TP, FAC, and FAP.
Table 4.
Correlation coefficients for studied soil properties (significance value |r| > 0.4329).
3. Results and Discussion
3.1. Soil Texture (PSD), Total Organic Carbon (TOC) and Density (PD and BD)
The texture of soil from treatments A and B, without applied waste, was stabilized in term of particle size distribution (PSD). Based on the results of PSD analysis, it was concluded that it was a loamy sand (LS) [43]. The content of the individual fractions varied within narrow ranges. In the case of sand content, it was 75–76%, in the case of silt, 20–22%, and in the case of clay, 3–4% (Table 2). After the application of the wastes, both the mineral and the organic, to the soil, changes in the PSD values took place. The changes attained the level of several percent. In treatment C, where non-fragmented carboniferous rock was applied (dimensions 5–100 mm), analysis of the earthy parts revealed an increase in the content of sand fraction to 77–78%, a decrease in the content of silt to 18%, and an increase in the content of clay to 4–5% (Table 2).
The greatest changes of PSD were noted in the soil from treatment D, amended with the post-fermentation sludge. Although that waste was applied in liquid form (~90% hydration), its presence in the soil had a strong impact on the values of PSD. The content of sand decreased to 68–69%, that of silt increased to 26%, and the content of clay increased to 5–6%. In consequence, there took place a change in the soil texture classification. Such a change is often characteristic, especially in the case of soil with so-called boundary granularity [32,44]. Consequently, the soil from treatment D was classified as a sandy loam (SL) [43]. Similar changes, though less extensive than in the case of soil from treatment D, applied also to the soil from treatment E. That soil was amended with the wastes in a combined manner—the carboniferous rock and the post-fermentation sludge were applied to the soil together. The soil from treatment E was also classified as a sandy loam (SL) [43]. In that soil, compared to the soil from treatments A and B, sand content decreased to 70–71%, silt content increased to 24%, and clay content increased to 5–6% (Table 2). Based on the calculated coefficients of statistical variation (CVs), it can be concluded that the addition of the wastes to the soil did not cause significant changes. In the case of the sand fraction CVs = 0.06, silt fraction CVs = 0.13, and clay fraction CVs = 0.28 (Table 2).
Taking into account the fact that the carboniferous rock is composed of a mixture of loams, mudstones, and claystones, one could have expected a different direction of changes in PSD. The application of such a mixture to the soil should have caused greater changes in the content of the silt and clay fractions, but the form in which that waste was applied, i.e., non-fragmented carboniferous rock, caused a different effect than expected. It can be supposed that greater changes in PSD will probably take place after a longer period of time, when the carboniferous rock will undergo physical weathering. Then, the skeleton elements of the rock will disintegrate into elementary particles with a considerable content of silt and clay. The changes in PSD of the soil from treatments C, D, and E observed in the experiment undoubtedly had an impact on the soil properties, and especially on those that describe its physical status. Covaleda et al., [45], Mikheeva [44], Pranagal [28], and Ligęza [46] indicated an effect of natural and anthropogenic factors causing a change in PSD and of other soil properties. As emphasized by Razafimbelo et al., [47], Carter and Bentley [48], and Ligęza [46], every change in PSD, consisting in an increase of the share of the silt and clay fractions, causes an increase of the accumulation of organic carbon in the soil.
The total organic carbon content in the soil (TOC) was characterized by medium variation (CVs = 0.27). The mean values of that parameter fell within the range from 7.23 g kg−1 (treatment C—10–20 cm layer) to 15.69 g kg−1 (treatment D—0–10 cm layer) (Table 3). The application of the mineral waste, carboniferous rock, to the soil caused only a slight decrease in the content of that component, relative to the soil from treatments A and B, whereas the application of the organic waste, the post-fermentation sludge (treatments D and E), caused a distinct increase of TOC (Table 3). Compared to treatments A, B, and C, the increase of the average TOC in treatments D and E was statistically significant (ANOVA-LSD) (Figure 3a).
Every significant change in the content of TOC leads most frequently to numerous modifications of the physical properties of soil [3,5,6,11,15,17,23,28,49,50,51]. In consequence, it affects the degree of difficulty of performing tillage treatments and the openness of soil pores [6,28,52,53,54,55]. In the case of a decrease in the soil content of TOC, there can take place a deterioration of the storage of valuable categories of water in the soil. There can also take place a deterioration of the conditions for gas exchange between the soil and the atmosphere. An increase of the content of TOC always improves the physical status of the soil [28,51,56,57,58]. Soil organic carbon plays also an important role in the formation of a stable aggregate structure, as humus stabilizes and maintains bonds between elementary soil particles. This determines the resistance of soil aggregates to the destructive effect of water, and thus reduces the susceptibility of soil to water erosion [26,59,60,61].
Analysis of correlation confirmed significant correlations between the physical properties of soil and its content of TOC (Table 4), e.g., with particle density—PD (r = −0.586), adsorption water—UWC (r = 0.510), and content of water at sampling—SM (r = 0.851). It should be emphasized that the significant differences in the content of TOC observed in the fourth year of the experiment between the soil from treatments A, B, C, D, and E indicate long-lasting effects of the application of the wastes to the soil. The addition of the post-fermentation sludge to the soil—separately (treatment D) or in combination with the carboniferous rock (treatment E)—was a treatment that caused a beneficial increase of the content of TOC (Table 3; Figure 3a).
Particle size distribution (PSD), particle density (PD), and bulk density (BD) are important parameters characterizing the physical status of soil. PSD and PD are basic soil properties which are characterized by highly stable values. They can be modified through the application of various additives, mineral or organic, to the soil, whereas BD is a functional property which is subject to dynamic changes [61,62,63,64]. In the case of the presented study, the situation was similar. The value of PD was characterized by very low variation—CVs = 0.01. The mean values of PD varied from in a narrow range, from 2.61 Mg m−3 (treatment D; 0–10 cm layer) to 2.66 Mg m−3 (treatment B; 0–10 cm layer and treatment C; 0–10 and 10–20 cm layers) (Table 3). Soil amendment with the carboniferous rock (treatment C) caused only a small change of PD relative to the soil from treatments A and B, whereas, as a result of the increase of TOC, the post-fermentation sludge applied to the soil (treatments D and E) caused a significant (ANOVA-LSD) lowering of the PD of that soil (Table 3; Figure 3a,b). The correlations of PD and BD with TOC are well-researched and have been described in detail, e.g., Blake and Hartge [33,34], Wojtasik [65], Ball et al., [66], and Carter and Bentley [48]. The analysis of correlation confirmed those relationships, as every increase of TOC was accompanied by a decrease of PD (r = −0.586). An increase of PD caused an increase of BD (r = 0.741) and a decrease of total porosity—TP (r = −0.680).
Similar changes in the value of PD can be found in the results of studies by Githinji [56] and Pranagal et al., [11]. Those authors added to soil large doses (from 25 to 100%, v/v) of biochar produced from biomass. In effect, they observed an even 40% decrease in the value of PD. Based on the distribution of results obtained in the presented study, one can note that the changes in the value of PD persisted even in the fourth year after the application of the wastes (Table 3; Figure 3b).
Bulk density (BD) and total porosity (TP) are accepted as measures of soil compaction. The values of BD and TP are subject to rapid changes in time. The results of soil density (BD) obtained in this study had a low statistical variation—CVs = 0.05. The mean values of BD varied from 1.51 Mg m−3 (treatment E; 0–10 cm layer) to 1.79 Mg m−3 (treatment C; 10–20 cm layer) (Table 3). The gradient of BD is usually directed vertically down the pedon—bulk density increases with depth. It was the same in this study. The density of the top soil layer (0–10 cm) was, in every case, lower than the density in the deeper soil layer (10–20 cm). The one-time amendment of the soil with the waste materials caused significant changes in its bulk density. Compared to the mean values calculated for the arable horizon of 0–20 cm, it was observed that the lowest BD of the soil occurred in treatment E—1.56 Mg m−3, and the highest in treatment C—1.70 Mg m−3. The difference was considered to be statistically significant (ANOVA-LSD) (Figure 3c).
The changes noted in the value of BD were in conformance with the results obtained by other authors [4,5,11,17,21,49,67]. Those authors indicated that the arable horizon of soils with particle size distribution of loamy sands and loams is characterized by the fact that the values of bulk density vary in the range from 1.50 Mg m−3 to 1.70 Mg m−3. Arshad and Martin [68] expressed the opinion that to maintain physical soil status favorably for crop plants, the value of BD should not be higher than 1.60 Mg m−3.
According to Paluszek [51], the analyzed soil was characterized by bulk density typical for soils with such PSD. In Poland, arable soils with PSD of loamy sands and loams attain bulk density in the range from 1.39 Mg m−3 to 1.79 Mg m−3. Based on plentiful data, Paluszek [51] proposed the classification of soil into quality classes in relation to BD values as follows: ≤1.40 Mg m−3—“very low”, 1.41–1.50 Mg m−3—“low”, 1.51–1.60 Mg m−3—“medium”, 1.61–1.70 Mg m−3—“high”, and ≥1.70 Mg m−3—“very high”. According to that proposal, the analyzed soil from treatments A, B, C, and D was classified in class “high”, and the soil from treatment E—in class “medium”.
Researchers specializing in studies on the physical status of soil (e.g., [3,4,5,21,23,28,49,69,70]) suggested that with such a level of soil compaction, one should expect disturbances in the soil–plant–atmosphere relations. This can lead to a deterioration of productivity of agricultural cultivations. Analysis of correlation (Table 4) revealed a significant positive correlation between BD and PD (r = 0.741). Soil density was negatively correlated with air content—FAC (r = −0.752) and air permeability at the potential of −15.5 kPa—FAP (r = −0.482). In the case of the analyzed correlation of soil bulk density (BD) with its total porosity (TP), their antagonistic relationship was confirmed (r = −0.996) [34,35,48]. It should also be stressed that the change of soil density as an effect of application of the wastes was distinctly observable still in the fourth year from the application (Table 3; Figure 3c).
3.2. Total Porosity (TP) and Soil Air Properties (FAC and FAP)
The results of total porosity (TP) displayed a similar variation as in the case of BD. The coefficient of statistical variation also attained a low value—CVs = 0.08. The smallest volume of free spaces was noted in the soil from treatment C in the layer of 10–20 cm—TP = 0.327 m3 m−3. The largest volume of all soil pores was noted in the soil from treatment E in the layer of 0–10 cm—TP = 0.424 m3 m−3 (Table 3). The value of TP in the layer of 0–10 cm in all compared pairs was higher than in the layer of 10–20 cm. Comparative analysis of mean values of TP determined for the arable horizon (0–20 cm) demonstrated that the combined application of two wastes, mineral and organic, produced the strongest effect of soil compaction change. In the soil from treatment E, the mean value of TP = 0.402 m3 m−3, and in treatment C, TP = 0.361 m3 m−3.
Statistical analysis (ANOVA-LSD) conducted for those mean values confirmed a significant increase in total porosity after the combined application of the wastes (Figure 3d). TP, as a parameter correlated with soil bulk density (r= −0.996), displayed similar to BD tendencies of changes caused by the application of the wastes to the soil. Thompson and Troeh [71] and Kowda [72] claimed that for correct soil–plant–atmosphere relations, the value of TP should not be less than 0.500 m3 m−3. The results obtained in this study never met this criterion, and most often, the value of TP was <0.400 m3 m−3 (Table 3).
According to the classification proposed by Paluszek [51], the analyzed soil was classified primarily in TP classes “very low” and “low”. On the other hand, Cockroft and Olsson [73], Olness et al., [41], Reynolds et al., [4,21], Pranagal and Podstawka-Chmielewska [15], and Pranagal et al., [5,11,23] indicated that for the correct air-water conditions in the soil, a high TP value is not enough. A favorable distribution and openness of soil pores are also important. In the presented study, the analysis of correlation confirmed such relationships. Total porosity correlated significantly positively with the air properties, FAC − r = 0.771 and FAP − r = 0.479. As in the case of PSD, TOC, PD, and BD, the changes in the value of TP as an effect of soil amendment with the wastes were distinct and long-lasting (Table 3; Figure 3d).
The field air capacity (FAC) was calculated at the state of field water capacity, i.e., at the potential of −15.5 kPa. It is then equivalent to the content of soil macropores with dimensions >20.0 µm. Those pores are mainly involved in gas exchange between the soil and the atmosphere, and hence they are often referred to as aeration pores. The results of FAC were moderately varied—CVs = 0.19. The mean values of FAC varied from 0.093 m3 m−3 (treatment B; 10–20 cm layer) to 0.246 m3 m−3 (treatment E; 0–10 cm layer) (Table 3). As in the case of the values of BD and TP, the air capacity was higher in the surface layers of the soil. Comparison of the mean values of FAC calculated for the layer of 0–20 cm allowed to note that the amendment of the soil with the wastes had a significant impact on the value of that parameter. The mean value of FAC in the soil from treatment B was the lowest, at 0.140 m3 m−3, and in the case of treatment E it attained the highest value of 0.194 m3 m−3.
Analysis of variance (ANOVA-LSD) revealed that some of the differences were significant (Figure 3e). Grable and Siemer [74], Danielson and Sutherland [35], Mayers and Barrs [75], Cockroft and Olsson [73], Reynolds et al., [4,21], and Castellini et al., [69,70] indicated that too low an air content in soil can inhibit the growth of certain plant species. Numerous authors believe that the value of FAC = 0.100 m3 m−3 is the minimum threshold value. Walczak et al., [76] claimed that disturbances in soil aeration occur when the air capacity is <0.120 m3 m−3, whereas Drewry [77], Drewry et al., [49], and Mueller et al., [67] indicated that air deficit in loamy soils appears when FAC < 0.140 m3 m−3. Reynolds et al., [4,21] and Castellini et al., [69,70] accepted FAC values in the range of 0.110–0.260 m3 m−3 to be the reference interval, and the optimum value in the opinion of those authors is FAC = 0.180 m3 m−3. It should be noted, however, that the values of FAC indicated by numerous authors relate to soil saturated with water at a potential of −15.5 kPa. Such a level of soil moisture, i.e., field water capacity—FC [37,38], occurs only sporadically in the vegetation season, usually several times, and it is a state that rapidly passes away. Most frequently, soil is characterized by moisture levels lower than FC. This causes an increase in the value of FAC [11,28,51,69,70,76,78]. In each of the treatments, the analyzed soil was characterized by FAC values that were higher than the minimum threshold (>0.100 m3 m−3). In these considerations, however, one should keep in mind that in the case of soils with PSD of loamy sands (LS) and sandy loams (SL), excessive soil aeration can be a bigger problem. Such a situation leads then to a reduction of soil water resources.
Analysis of correlation revealed antagonistic relationships between the content of air and/or water in the soil. FAC correlated negatively with the field water capacity—FC (r = −0.749), with the content of water available for plants—AWC (r = −0.732), and with BD (r = −0.752). It was also directly proportionally correlated with the value of TP (r = 0.771). An increase of FAC caused an increase of air permeability—FAP (r = 0.641) and saturated hydraulic conductivity—Ks (r = 0.643) (Table 4). Analysis of the results of FAC indicates also a long-term character of the changes in the soil environment resulting from the application of the wastes (Table 3; Figure 3e).
Air permeability at the potential of −15.5 kPa—FAP—is an important parameter and a sensitive indicator describing changes in the soil environment in terms of physical properties. It provides information on the openness of soil pores, characterizes the transport of gases, and their exchange between the soil and the atmosphere [28,53,54,55,79]. Among the analyzed properties of the soil, the results of FAP were the most varied—CVs > 1.0. The lowest air permeability was obtained in soil from treatment A (0–10 cm layer)–5.6 × 10⁻⁸ m2 Pa −1 s−1, and the highest in treatment C (0–10 cm)—234.4 × 10⁻⁸ m2 Pa −1 s−1 (Table 3). Based on the mean values calculated for both soil layers (0–10 and 10–20 cm), in all the treatments, better conditions for air movement were noted in the surface horizons. Comparative analysis of mean values for the soil layer of 0–20 cm demonstrated that the soil from treatment C had the highest air permeability—FAP = 131.2 × 10⁻⁸ m2 Pa −1 s−1. Compared to the soil from treatments A and B, the FAP value of the soil from treatment C was significantly higher (ANOVA-LSD) (Figure 3f).
The application of non-fragmented carboniferous rock to the soil caused significant changes in the transport of soil air. In response to the modification of the composition of the soil, FAP rapidly changed its value, thus confirming its sensitivity. Kuncoro et al., [57], Wang et. al. [54], and Pranagal et al., [11,23] also indicated differentiation of the aeration properties of soil as an effect of changes of the individual components, or of variation of soil moisture and density. Paluszek [51] and Pranagal [28] demonstrated in their studies that the condition for correct gas exchange in soil is met when FAP ≥ 35 × 10−8 m2 Pa -1 s-1. Based on abundant numerical data (n = 4200) from his own research, Pranagal (2011) proposed the classification of FAP into five quality classes: <2.5 × 10⁻⁸ m2 Pa −1 s−1—“very low”; 2.5–15.0 × 10⁻⁸ m2 Pa −1 s−1—“low”; 15.0–75.0 × 10⁻⁸ m2 Pa −1 s−1—“medium”; 75.0–150.0 × 10⁻⁸ m2 Pa −1 s−1—“high”; and >150.0 × 10⁻⁸ m2 Pa −1 s−1—“very high”. According to the above classification, the analyzed soil was classified primarily in the classes “medium” and “high” (treatments B, C, D, and E). The exception was the soil from treatment A, which was classified in class “low”. While the value of FAP of the soil from treatments A and B was usually too low for correct aeration, the soil after the amendment with the carboniferous rock and/or post-fermentation sludge (treatments C, D, and E) was characterized by too-high values of FAP (Table 3).
Similar changes and threats resulting from excessive increase of FAP were also indicated by authors of other studies [11,23,54,55]. Those authors reported that the consequence of high FAP is an excessive level of “soil ventilation”, and ultimately, the drying of the soil. Such negative effects relate to soils with the PSD of loamy sands and sandy loams, and thus they applied also to the analyzed soil. The distribution of FAP results indicated a long-lasting effect of the application of the waste materials to the soil (Figure 3f). The estimation of correlation supported the relationships between the individual air-water properties reported by other authors [11,23,48,54,55]. The air permeability of the soil (at −15.5 kPa potential) correlated positively with TP (r = 0.479), FAC (r = 0.641), and with saturated hydraulic conductivity—Ks (r = 0.655), and negatively with BD (r = −0.482) (Table 5).
Table 5.
Variability (CVs) and range value of soil properties: SM, FC, AWC, UWC, Ks, and FC/TP.
3.3. Soil Water Properties (SM, FC, AWC, UWC and Ks) and FC/TP Ratio
Soil moisture at sampling (SM) was characterized by small variation (CVs = 0.06). SM values varied from 0.081 kg kg-1 (treatment C; 0–10 cm layer) to 0.101 kg kg−1 (treatment D; 0–10 cm layer) (Table 4). In spite of the small statistical variation of the results, in the comparison of mean values of SM for the soil layer of 0–20 cm, there were observable differences between treatments. That was undoubtedly an effect of the application of the waste materials to the soil. The lowest value of SM was noted in treatment C (0.086 kg kg-1), and the highest in treatment D (0.097 kg kg−1) (Figure 4a). Statistical analysis (ANOVA-LSD) demonstrated that the differences in the results of SM between treatments D and E and treatment C were significant. One can assume that soil amendment with the post-fermentation sludge (treatment D) or post-fermentation sludge combined with the carboniferous rock (treatment E) was beneficial, while the addition of the carboniferous rock alone caused a deterioration of the properties of the soil (Figure 4a).
This is understandable, as every change in the composition, structure, and/or compaction of soil implies a modification of its water-air properties [9,10,11,17,23]. When estimating differences in SM results, one should take into account the meteorological conditions during the study (Figure 2) and the type of water management prevalent in the given area [80,81,82,83]. The cited authors indicated also the dynamic character of soil moisture (SM), similarly to Usowicz and Usowicz [84], Iqbal et al., [85], Pranagal [28], and Ligęza [46], who emphasized that variation of SM applies to even small measurement areas. Taking into account the specific character of the parameter in question, any inference relating to the durability of effects of the application of post-fermentation sludge and carboniferous rock to soil can only be uncertain and difficult. Analysis of correlation confirmed the reports of Ojeda et al., [9], Ojeda et al., [10], and Pranagal et al., [11], and demonstrated a strong positive correlation between SM and TOC − r = 0.851 (Table 4).
Another important parameter in the estimation of the physical condition of soil is the field water capacity—FC [37,38,76]. FC values varied from 0.158 m3 m−3 (treatment C; 0–10 cm layer) to 0.258 m3 m−3 (treatment B; 10–20 cm layer), and the statistical variation of the results was small—CVs = 0.13 (Table 5). Analyzing the value of FC on the basis of means for the arable horizon (0–20 cm), it was noted that according to numerous authors [4,21,28,51,69,70,76], the analyzed soil was characterized by low values. The mean values for that layer (0–20 cm) for the treatments were as follows: A—0.219 m3 m−3; B—0.237 m3 m−3; C—0.169 m3 m−3; D—0.208 m3 m−3; E—0.208 m3 m−3 (Figure 4b). The addition of the waste materials—post-fermentation sludge and/or carboniferous rock—did not cause any increase of FC (treatments D and E). However, the application of the carboniferous rock alone (treatment C) caused a considerable decrease in the value of that parameter.
Analysis of variance demonstrated that the decrease of field water capacity of the soil in treatment C, compared to the remaining treatments (treatments A, B, D, and E), was statistically significant (Figure 4b). Estimation of simple correlation confirmed the antagonistic relationship between water and soil air [11,23,48,54,55], as FC correlated negatively with FAC − r = −0.749 and with saturated hydraulic conductivity Ks − r = −0.730, whereas an increase of FC causes an increase in the content of water available for plants AWC − r = 0.911 and in the value of FC/TP − r = 0.884 (Table 4). The results of FC demonstrated that the effect of one-time application of the wastes to soil had a long-lasting character, and that the amendment of the sandy soil with the mineral waste, i.e., non-fragmented carboniferous rock, led to a deterioration of the hydraulic properties of the soil. Threats resulting from soil amendment with various materials have been also pointed out by authors of certain studies, e.g., Paluszek [51], Carter and Bentley [48], Mentges et al., [55], Pranagal et al., [5,11,23], Meena et al., [12], and Reynolds et al., [17].
The content of water available for plants (AWC) is also an important parameter describing soil physical condition [11,15,23,28,41,51,58]. In this study, the value of AWC was clearly determined by changes of FC. The results of AWC were subject to statistical variation similar to that of FC − CVs = 0.17. Its values varied from 0.111 m3 m−3 (treatment C; 0–10 cm layer) to 0.195 m3 m−3 (treatment B; 10–20 cm layer) (Table 5). The consequence of the addition of the wastes to the soil was a distinct differentiation of the values of AWC among the treatments. In the comparative analysis of mean values of AWC for the arable horizon (0–20 cm), the largest amounts of water available for plants were noted in the soil from treatments A and B, at 0.179 m3 m−3 and 0.176 m3 m−3, respectively. The lowest AWC was noted in the soil from treatment C—0.121 m3 m−3. Analysis of variance (ANOVA-LSD) showed that the differences between the treatments were significant (Figure 4c).
According to some authors [4,17,21,69,70], AWC of soil in treatments A and B was “good”, and according to other authors [28,51,76], it was “medium”. The soil in treatments C, D, and E was characterized by insufficient value of AWC for correct “soil-plant” relations. In conformance with the optimal ranges adopted by Reynolds et al., [4,17,21] and Castellini et al., [69,70], AWC in treatments C, D, and E was classified as “limited”, while according to the classifications of Walczak et al., [76], Paluszek [51], and Pranagal [28], it was classified in the class “low”. The calculated coefficients of correlation confirmed a close and positive correlation of AWC with FC—r = 0.911 and FC/TP—r = 0.837, and an antagonistic and negative correlation with FAC—r = −0.732; FAP—r = −0.468; and Ks—r = −0.754 (Table 4). Analysis of AWC results demonstrated that the use of the wastes chosen for the experiment had a definitely negative effect on the hydraulic properties of the analyzed soil, and that the effect was permanent. The values of FC and AWC obtained in the study prove that the yields of the crop plants cultivated in the experiment are under a treat of reduction.
The content of water unavailable for plants, UWC, was characteristic of a soil with the particle size distribution (PSD) of loamy sand (LS) and sandy loam (SL) with a low content of TOC [32,37,38,51,76]. UWC was characterized by medium variability–CVs = 0.21. During the measurements, the value of UWC varied from 0.031 m3 m−3 (treatment A; 0–10 cm layer) to 0.077 m3 m−3 (treatment E; 10–20 cm layer) (Table 5). On the basis of comparison of mean UWC values for the layer of 0–20 cm, it is difficult to univocally evaluate the effect of the application of the wastes on that parameter of the soil. The lowest UWC was noted in the control soil without additives—treatment A – 0.040 m3 m−3. The fertilized soil (N, P, K, Mg, Ca, and S)—treatment B (0.061 m3 m−3) and the soil amended with both wastes—treatment E (0.069 m3 m−3) were characterized by the highest values of UWC. Analysis of variance (ANOVA-LSD) showed that the differences in UWC results between the soil from treatment A and from treatments B and E were significant. UWC of soil from treatments C and D assumed intermediate values of 0.046 m3 m−3 and 0.053 m3 m−3, respectively (Figure 4d). It should be emphasized that the fertilizers (treatment B) and wastes (treatments C, D, and E) applied to the soil contributed to the unfavorable level of UWC in FC. That resulted in a decrease of the content of water available for plants, AWC. The share of UWC in FC for the treatments was as follows: A—18.3%, B—25.7%, C—27.2%, D—25.5%, and E—33.2%.
The relations between FC, AWC, and UWC were described also by other authors [11,15,23,28,51,76]. Those authors indicated that within a specific range of FC, the relations FC-AWC-UWC can be compared to “communicating vessels”. Analysis of correlation demonstrated that the content of water unavailable for plants (UWC) is positively affected by the content of organic carbon in soil (TOC)—r = 0.510 (Table 5). The presented differentiation of the value of UWC may indicate long-lasting unfavorable effects of the application of the wastes to soil.
Measurements of saturated hydraulic conductivity (Ks) permit the estimation of the possibility of transport of solutions in soil. It is a basic parameter used in the design of anti-erosion and/or melioration structures and treatments. Ks in the saturated zone depends on soil texture, compaction, content of soil organic carbon, calcium carbonate, and iron oxides [28,40,51,86]. The results of Ks measurements displayed a notable variation (CVs = 0.48). A high variation of that parameter, both in space and in time, has been indicated also by authors of other studies, e.g., Walczak et al., [87], Aimrun et al., [88], and Paluszek [51]. The lowest Ks was measured in the layer of 0–10 cm in treatment A—4.17 m d−1, and the highest in the layer of 10–20 cm in treatment C—21.34 m d−1 (Table 4). The mean values for the arable horizon of 0–20 cm in the treatments were as follows: A—5.36 m d−1, B—6.44 m d−1, C—19.93 m d−1, D—15.12 m d−1, and E—11.16 m d−1 (Figure 4e).
Comparison of those mean values showed that the application of the wastes to the soil increased the possibility of transport of the soil solution. The strongest impact on the value of Ks was that of the addition of the carboniferous rock (treatment C). In a 20-year study, Meena et al., [12] observed that the addition of 20 Mg ha−1 yr−1 of organic compost to soil (clay loam) did not cause any significant changes in hydraulic conductivity (Ks). In our study, conducted on a sandy soil (loamy sand), Ks values differed significantly between treatments A and B and treatments C, D, and E. This was confirmed by the analysis of variance (ANOVA–LSD) (Figure 4e).
According to the classification of Walczak et al., [76,87], Ks of the soil in treatments A and B was classified in the hydraulic conductivity class “medium”, and the soil in treatments C, D, and E in the class “high”. Such changes in the saturated hydraulic conductivity should be termed a deterioration of the soil quality. An increase of Ks in sandy soils is highly unfavorable. It causes (i) rapid leaching of plant nutrients from the soil, (ii) an increased susceptibility of the soil to water erosion, and (iii) it intensifies the eutrophication of waters [51,88,89]. Estimation of correlation (Table 4) confirmed the correlations of saturated hydraulic conductivity with other soil properties indicated in cited studies [12,28,40,51,86,89]. Ks correlated with soil air-water properties as follows: positively with FAC—r = 0.643 and FAP—r = 0.655, and negatively with FC—r = −0.730, AWC—r = −0.754, and FC/TP—r = −0.527. It should be emphasized that the unfavorable changes of Ks observed in the experiment persisted for four years after the application of the wastes.
The scope of the experiment included also the estimation of the air-water conditions in the soil. For that purpose, the ration of field water capacity to total porosity—FC/TP—was calculated [4,21,42,52]. The value of that index varied from 0.41 (treatment C; 0–10 cm layer) to 0.73 (treatment B; 10–20 cm layer), with a small statistical variation (CVs = 0.15) (Table 5). The arithmetic means calculated for the layer of 0–20 cm for the treatments were as follows: A—0.60, B—0.63, C—0.47, D—0.55, and E—0.53. Comparative analysis of the means revealed a deterioration of the air-water conditions in the soil as a result of its amendment with the waste materials. A statistically significant (ANOVA—LSD) unfavorable effect of the wastes was noted in the case of treatment C compared to treatments A and B (Figure 4f).
According to certain studies, e.g., Skopp et al., [42], Olness et al., [52], Reynolds et al., [4,21], and Castellini et al., [69,70], optimal relations between soil moisture and soil aeration are observed when FC/TP falls within the range of 0.60–0.70. In the case of our study, the value of FC/TP was usually below 0.60. As reported by the authors of numerous studies [4,11,21,23,51,69,70,78], FC/TP < 0.60 indicates an excessive oxygenation of the surface horizon of soil, and thus a deficit of water content in the arable horizon. If such a state persists, it can cause a number of unfavorable phenomena: (i) reduced uptake of nutrients by plants, (ii) acceleration of mineralization of soil organic matter, (iii) weakening of water-stability of soil aggregates, (iv) increase of soil compaction, etc. In consequence, it can lead to (i) a considerable reduction of yields, (ii) disturbance of balance in the agroecosytem, and (iii) degradation of the soil environment.
The determined coefficients of correlation (Table 4) confirmed the correlations of the physical soil properties indicated by e.g., Canarache et al., [38], Paluszek [51], Carter and Bentley [48], Pranagal et al., [11,23], Pranagal and Woźniak [78]. The FC/TP ratio correlated significantly positively with bulk density (BD)—r = 0.570 and available water content (AWC)—r = 0.837, and negatively with air capacity (FAC)—r = −0.968 and saturated hydraulic conductivity (Ks)—r = −0.527. Analysis of correlation demonstrated that the FC/TP ratio is a useful parameter which allows for the estimation of the air–soil–water relations. The results of FC/TP indicate a negative reaction of the soil environment to the application of both the carboniferous rock and the post-fermentation sludge.
In recent years, waste management has become especially important task. The human population grows, and so does the amount of produced waste. It is extremely important to move toward zero waste approaches and use waste potential through proper management instead of landfilling [90,91]. Moreover, in the face of recent soaring fertilizer prices, farmers are looking for alternative ways of improving soil properties [92]. Our study shows that application of carboniferous rock and post-fermentation sludge had positive permanent effects on soil physical properties. However, not only physical properties could be positively changed. Application of mineral mining waste and biogas residue could neutralize infertile alkaline agricultural soils [91], increase soil fertility and crop yield [93,94,95], as well as increase microbial activity and bacterial diversity [96,97].
4. Conclusions and Recommendations
Analysis of the results obtained allowed the verification of the hypothesis that one-time application of waste carboniferous rock and/or post-fermentation sludge to soil has a beneficial effect on the physical status of soil, and that the effect of the changes in the soil properties has a long-lasting character. Compared to the soil in treatments A and B, without any addition of the wastes, the soil in treatment D with the application of the post-fermentation sludge, and treatment E with the combined application of carboniferous rock and post-fermentation sludge, an improvement was observed in the basic soil properties: particle size distribution (PSD), total organic carbon (TOC), and particle density (PD). The PSD expanded by the contribution of the fractions of silt and clay, the content of TOC increased, and PD decreased. The changes of PSD, TOC, and PD had a beneficial effect on the reduction of soil compaction. The water content at sampling (SM) was also higher. The positive changes of PSD, TOC, PD, BD, TP, and SM, however, did not cause any improvement in the air-water properties of the soil. The results of the air-water properties in the soil in treatments D and E were usually similar to those obtained for the soil in treatments A and B, and occasionally even worse. The application of non-fragmented carboniferous rock (treatment C) resulted in a deterioration of all of the analyzed soil properties. One could suppose that the deterioration of soil properties, resulting from the application of non-fragmented form of carboniferous rock, is a temporary and transient state, and that with the passage of time, due to weathering, the skeleton parts of the soil will disintegrate into elementary particles, i.e., silt and clay. At that point, there should appear a favorable change in the soil texture, and consequently, the physical quality of the soil should also improve. The presented results indicate that natural utilization of wastes requires a lot of care and consideration. When applying wastes to soil, one should make an effort not to disturb the balance in the relations between the environmental functions of the soil, i.e., those of the “reservoir” and the “filter”. In the case of sandy soils, one should avoid applying mineral wastes without prior fragmentation. To achieve better effects, organic wastes should be applied to soil at a state of low moisture. The changes in the soil properties, both the positive and the negative ones, can be considered to be long-lasting. In the fourth year of the experiment, the effects of the application of the wastes were still visible, and the differences between the treatments were often statistically significant (ANOVA–LSD). In relation with the long-term character of the changes in the soil properties, soil monitoring should be conducted in consecutive years to determine the time of the next agricultural and safe utilization of wastes.
Author Contributions
Conceptualization, J.P.; methodology, J.P.; validation, H.S.; formal analysis, S.L. and J.G.-I.; investigation, J.P.; resources, H.S. and J.P.; data curation, J.P. and H.S.; writing—original draft preparation, J.P.; writing—review and editing, S.L., H.S. and J.G.-I.; visualization, J.P., J.G.-I. and S.L.; supervision, H.S. and J.P.; project administration, S.L.; funding acquisition, J.P. and H.S. All authors have read and agreed to the published version of the manuscript.
Funding
The research was financed from the budget of the Ministry of Science and Higher Education for science in Poland 2016–2020.
Data Availability Statement
The data that support the findings of this study are available from the corresponding authors, [S.L.; J.G.-I.], upon request.
Conflicts of Interest
The authors declare no conflict of interest.
References
- Lal, R. Soil quality and sustainability. In Methods for Assessment of Soil Degradation; CRC Press: Boca Raton, FL, USA; New York, NY, USA, 1998; pp. 17–30. [Google Scholar]
- Pranagal, J. Intensity of agricultural land use and soil degradation processes. Adv. Agric. Sc. Prob. Issues 2009, 535, 321–329. [Google Scholar]
- Reynolds, W.D.; Elrick, D.E.; Youngs, E.G.; Amoozegar, A.; Booltink, H.W.G. Saturated and field-saturated water flow parameters. In Methods of Soil Analysis, Part 4, Physical Methods; Dane, J., Topp, C., Eds.; Soil Science Society of America: Madison, WI, USA, 2002; pp. 797–878. [Google Scholar]
- Reynolds, W.; Drury, C.; Yang, X.; Tan, C. Optimal soil physical quality inferred through structural regression and parameter interactions. Geoderma 2008, 146, 466–474. [Google Scholar] [CrossRef]
- Pranagal, J.J.; Tomaszewska-Krojańska, D.; Smal, H.; Ligęza, S. Impact of selected waste applications on soil compaction. Agron. Sci. 2019, 74, 19–32. [Google Scholar] [CrossRef]
- Angers, D.A.; Eriksen-Hamel, N.S. Full-Inversion Tillage and Organic Carbon Distribution in Soil Profiles: A Meta-Analysis. Soil Sci. Soc. Am. J. 2008, 72, 1370–1374. [Google Scholar] [CrossRef]
- Hillel, D.; Rosenzweig, C. Conclusion: Agricultural solutions for climate change at global and regional scales. In Handbook of Climate Change and Agroecosystems: Global and Regional Aspects and Implications; Hillel, D., Rosenzweig, C., Eds.; ICP Series on Climate Change Impacts, Adaptation, and Mitigation 2; Imperial College Press: London, UK, 2012; pp. 281–292. [Google Scholar]
- Lal, R. Restoring Soil Quality to Mitigate Soil Degradation. Sustainability 2015, 7, 5875–5895. [Google Scholar] [CrossRef]
- Ojeda, G.; Mattana, S.; Bonmatí, M.; Woche, S.K.; Bachmann, J. Soil wetting-drying and water-retention properties in a mine-soil treated with composted and thermally-dried sludges. Eur. J. Soil Sci. 2011, 62, 696–708. [Google Scholar] [CrossRef]
- Ojeda, G.; Mattana, S.; Àvila, A.; Alcañiz, J.M.; Volkmann, M.; Bachmann, J. Are soil–water functions affected by biochar application? Geoderma 2015, 249–250, 1–11. [Google Scholar] [CrossRef]
- Pranagal, J.; Oleszczuk, P.; Tomaszewska-Krojańska, D.; Kraska, P.; Różyło, K. Effect of biochar application on the physical properties of Haplic Podzol. Soil Tillage Res. 2017, 174, 92–103. [Google Scholar] [CrossRef]
- Meena, R.S.; Lal, R.; Yadav, G.S. Long-term impacts of topsoil depth and amendments on soil physical and hydrological properties of an Alfisol in central Ohio, USA. Geoderma 2020, 363, 114164. [Google Scholar] [CrossRef]
- Lal, R. Soils and sustainable agriculture. A review. Agron. Sustain. Dev. 2008, 28, 57–64. [Google Scholar] [CrossRef]
- Ajayi, A.; Holthusen, D.; Horn, R. Changes in microstructural behaviour and hydraulic functions of biochar amended soils. Soil Tillage Res. 2016, 155, 166–175. [Google Scholar] [CrossRef]
- Pranagal, J.; Podstawka-Chmielewska, E. Physical properties of a Rendzic Phaeozem during a ten-year period of fallowing under the conditions of south-eastern Poland. Geoderma 2012, 189–190, 262–267. [Google Scholar] [CrossRef]
- Pranagal, J.; Podstawka-Chmielewska, E.; Słowińska-Jurkiewicz, A. Influence on selected physical properties of a Haplic Podzol during a ten-year fallow period. Pol. J. Environ. Stud. 2007, 16, 875–880. [Google Scholar]
- Reynolds, W.; Nurse, R.; Phillips, L.; Drury, C.; Yang, X.M.; Page, E.R. Characterizing mass–volume–density–porosity relationships in a sandy loam soil amended with compost. Can. J. Soil Sci. 2020, 100, 289–301. [Google Scholar] [CrossRef]
- Kowalczyk-Juśko, A.; Szymańska, M. Post-Fermentation Sludge–Fertilizer for Agriculture; FDPA: Warsaw, Poland, 2015; pp. 1–64. ISBN 978-83-937363-6-2. [Google Scholar]
- Różyło, K.; Oleszczuk, P.; Jośko, I.; Kraska, P.; Kwiecińska-Poppe, E.; Andruszczak, S. An ecotoxicological evaluation of soil fertilized with biogas residues or mining waste. Environ. Sci. Pollut. Res. 2015, 22, 7833–7842. [Google Scholar] [CrossRef]
- Stefaniuk, M.; Bartmiński, P.; Różyło, K.; Dębicki, R.; Oleszczuk, P. Ecotoxicological assessment of residues from different biogas production plants used as fertilizer for soil. J. Hazard. Mater. 2015, 298, 195–202. [Google Scholar] [CrossRef]
- Głowacka, A.; Szostak, B.; Klebaniuk, R. Effect of Biogas Digestate and Mineral Fertilisation on the Soil Properties and Yield and Nutritional Value of Switchgrass Forage. Agronomy 2020, 10, 490. [Google Scholar] [CrossRef]
- Różyło, K.; Gawlik-Dziki, U.; Świeca, M.; Różyło, R.; Pałys, E. Winter wheat fertilized with biogas residue and mining waste: Yielding and the quality of grain. J. Sci. Food Agric. 2016, 96, 3454–3461. [Google Scholar] [CrossRef] [PubMed]
- Pranagal, J.; Ligęza, S.; Smal, H. Impact of Effective Microorganisms (EM) Application on the Physical Condition of Haplic Luvisol. Agronomy 2020, 10, 1049. [Google Scholar] [CrossRef]
- Pranagal, J.; Kraska, P. 10-Years Studies of the Soil Physical Condition after One-Time Biochar Application. Agronomy 2020, 10, 1589. [Google Scholar] [CrossRef]
- Council Directive EC. 31/EC Directive on the Landfill of Waste. Official Journal, L 182, 16/07/1999, P. 0001–0019. Special Edition in Polish: Chapter 15. 1999, Volume 004, pp. 228–246. Available online: https://eur-lex.europa.eu/legal-content/EN/TXT/?uri=celex%3A31999L0031 (accessed on 30 November 2022).
- Bronick, C.J.; Lal, R. Soil structure and management: A review. Geoderma 2005, 124, 3–22. [Google Scholar] [CrossRef]
- Weber, J.; Karczewska, A.; Drozd, J.; Licznar, M.; Licznar, S.; Jamroz, E.; Kocowicz, A. Agricultural and ecological aspects of a sandy soil as affected by the application of municipal solid waste composts. Soil Biol. Biochem. 2007, 39, 1294–1302. [Google Scholar] [CrossRef]
- Pranagal, J. The Physical State of Selected Silty Soils of on the Lublin Region. Ph.D. Thesis, University of Life Sciences, Lublin, Poland, 2011. Volume 353. pp. 1–129. [Google Scholar]
- IUSS Working Group WRB. World Reference Base for Soil Resources 2014, Update 2015. International Soil Classification System for Naming Soils and Creating Legends for Soil Maps. In World Soil Resources Reports No. 106; FAO: Rome, Italy, 2015. [Google Scholar]
- Kondracki, J.A. Regional Geography of Poland; PWN Press: Warsaw, Poland, 2009; p. 441. ISBN 978-83-01-16022-7. [Google Scholar]
- Klute, A. Methods of Soil Analysis. 1. In Physical and Mineralogical Methods; ASA-SSSA Inc.: Madison, WI, USA, 1986. [Google Scholar]
- Blott, S.J.; Pye, K. Particle size scales and classification of sediment types based on particle size distributions: Review and recommended procedures. Sedimentology 2012, 59, 2071–2096. [Google Scholar] [CrossRef]
- Blake, G.R.; Hartge, K.H. Particle density. In Methods of Soil Analysis. Agronomy No. 9, 2nd ed.; Klute, A., Ed.; American Society of Agronomy: Madison, WI, USA, 1986; pp. 377–382. [Google Scholar]
- Blake, G.R.; Hartge, K.H. Bulk density. In Methods of Soil Analysis. Agronomy No. 9, 2nd ed.; Klute, A., Ed.; American Society of Agronomy: Madison, WI, USA, 1986; pp. 365–375. [Google Scholar]
- Danielson, R.E.; Sutherland, P.L. Porosity. In Methods of Soil Analysis. Agronomy No. 9, 2nd ed.; Klute, A., Ed.; American Society of Agronomy: Madison, WI, USA, 1986; pp. 443–461. [Google Scholar]
- Gardner, W.H. Water content. In Methods of Soil Analysis. Agronomy No. 9, 2nd ed.; Klute, A., Ed.; American Society of Agronomy: Madison, WI, USA, 1986; pp. 493–544. [Google Scholar]
- Cassel, D.K.; Nielsen, D.R. Field Capacity and Available Water Capacity. In Methods of Soil Analysis. Agronomy No. 9, 2nd ed.; Klute, A., Ed.; American Society of Agronomy: Madison, WI, USA, 1986; pp. 901–924. [Google Scholar]
- Canarache, A.; Vintila, I.; Munteanu, I. Elsevier’s dictionary of soil science. In Definitions in English with French, German, and Spanish Word Translations; Elsevier, BV: Amsterdam, The Netherlands, 2006. [Google Scholar]
- Eijkelkamp. Laboratory Permeameter. Operating Instructions. 2008. Available online: http://www.eijkelkamp.com/Portals/2/Eijkelkamp/Files/Manals/M10902e%20Laboratory%20permeameters.pdf (accessed on 30 November 2022).
- Iwanek, M. A Method for Measuring Saturated Hydraulic Conductivity in Anisotropic Soils. Soil Sci. Soc. Am. J. 2008, 72, 1527–1531. [Google Scholar] [CrossRef]
- Olness, A.; Clapp, C.E.; Liu, R.; Palazzo, A.J. Biosoilds and their effect on soil properties. In Handbook of Soil Conditioners; Wallace, A., Terry, R.E., Eds.; Marcel Dekker: New York, NY, USA, 1998; pp. 141–165. [Google Scholar]
- Skopp, J.; Jawson, M.D.; Doran, J.W. Steady-State Aerobic Microbial Activity as a Function of Soil Water Content. Soil Sci. Soc. Am. J. 1990, 54, 1619–1625. [Google Scholar] [CrossRef]
- PSSS. Particle size distribution and textural classes of soils and mineral materials—Classification of Polish Society of Soil Science 2008. Soil Sc. Ann. 2009, 60, 5–16. [Google Scholar]
- Mikheeva, I.V. Changes in the probability distributions of particle size fractions in chestnut soils of the Kulunda Steppe under the effect of natural and anthropogenic factors. Eurasian Soil Sci. 2010, 43, 1351–1361. [Google Scholar] [CrossRef]
- Covaleda, S.; Pajares, S.; Gallardo, J.F.; Etchevers, J.D. Short-term changes in C and N distribution in soil particle size fractions induced by agricultural practices in a cultivated volcanic soil from Mexico. Org. Geochem. 2006, 37, 1943–1948. [Google Scholar] [CrossRef]
- Ligęza, S. Variability of the Contemporary Fluvisols of the Vistula River near Puławy. Ph.D. Thesis, University of Life Sciences, Lublin, Poland, 2016. Volume 385. pp. 1–131. [Google Scholar]
- Razafimbelo, T.M.; Chevallier, T.; Albrecht, A.; Chapuis-Lardy, L.; Rakotondrasolo, F.N.; Michellon, R.; Rabeharisoa, L.; Bernoux, M. Texture and organic carbon contents do not impact amount of carbon protected in Malagasy soils. Sci. Agricola 2013, 70, 204–208. [Google Scholar] [CrossRef]
- Carter, M.; Bentley, S.P. Soil Properties and Their Correlations, 2nd ed.; Wiley: Hoboken, NJ, USA, 2016. [Google Scholar]
- Drewry, J.J.; Cameron, K.C.; Buchan, G.D. Pasture yield and soil physical property responses to soil compaction from treading and grazing—A review. Soil Res. 2008, 46, 237–256. [Google Scholar] [CrossRef]
- Du, Z.; Liu, S.; Li, K.; Ren, T. Soil organic carbon and physical quality as influenced by long-term application of residue and mineral fertiliser in the North China Plain. Soil Res. 2009, 47, 585–591. [Google Scholar] [CrossRef]
- Paluszek, J. Criteria of evaluation of physical quality of Polish arable soils. Acta Agroph. 2011, 191, 1–139. [Google Scholar]
- Olness, A.; Archer, D.W. Effect of organic carbon on available water in soil. Soil Sci. 2005, 170, 90–101. [Google Scholar] [CrossRef]
- Shukla, M.K.; Lal, R. Air permeability of soil. In Encyclopedia of Soil Science; Lal, R., Ed.; Marcel Dekker: New York, NY, USA, 2006; pp. 60–63. [Google Scholar]
- Wang, W.; Li, J.; Su, L.; Wang, Q. Soil air permeability model based on soil physical basic parameters. Nongye Jixie Xuebao/Trans. Chin. Soc. Agric. Mach. 2015, 46, 125–130. [Google Scholar] [CrossRef]
- Mentges, M.I.; Reichert, J.M.; Rodrigues, M.F.; Awe, G.O.; Mentges, L.R. Capacity and intensity soil aeration properties affected by granulometry, moisture, and structure in no-tillage soils. Geoderma 2016, 263, 47–59. [Google Scholar] [CrossRef]
- Githinji, L. Effect of biochar application rate on soil physical and hydraulic properties of a sandy loam. Arch. Agron. Soil Sci. 2014, 60, 457–470. [Google Scholar] [CrossRef]
- Kuncoro, P.; Koga, K.; Satta, N.; Muto, Y. A study on the effect of compaction on transport properties of soil gas and water I: Relative gas diffusivity, air permeability, and saturated hydraulic conductivity. Soil Tillage Res. 2014, 143, 172–179. [Google Scholar] [CrossRef]
- Asgarzadeh, H.; Mosaddeghi, M.R.; Dexter, A.R.; Mahboubi, A.A.; Neyshabouri, M.R. Determination of soil available water for plants: Consistency between laboratory and field measurements. Geoderma 2014, 226–227, 8–20. [Google Scholar] [CrossRef]
- Le Bissonnais, Y. Aggregate stability and assessment of soil crustability and erodibility: I. Theory and methodology. Eur. J. Soil Sci. 1996, 47, 425–437. [Google Scholar] [CrossRef]
- Darboux, F.; Le Bissonnais, Y. Changes in structural stability with soil surface crusting: Consequences for erodibility estimation. Eur. J. Soil Sci. 2007, 58, 1107–1114. [Google Scholar] [CrossRef]
- Czyż, E.A.; Dexter, A.R. Estimation of the density of the clay-organic complex in soil. Int. Agrophysics 2016, 30, 19–23. [Google Scholar] [CrossRef]
- Di Giuseppe, D.; Melchiorre, M.; Tessari, U.; Faccini, B. Relationship between particle density and soil bulk chemical composition. J. Soils Sediments 2016, 16, 909–915. [Google Scholar] [CrossRef]
- Keller, T.; Håkansson, I. Estimation of reference bulk density from soil particle size distribution and soil organic matter content. Geoderma 2010, 154, 398–406. [Google Scholar] [CrossRef]
- McBride, R.A.; Slessor, R.L.; Joosse, P.J. Estimating the Particle Density of Clay-rich Soils with Diverse Mineralogy. Soil Sci. Soc. Am. J. 2012, 76, 398–406. [Google Scholar] [CrossRef]
- Wojtasik, M. Impact of humus on soil bulk density. Soil Sci. Ann. 1989, 40, 21–27. [Google Scholar]
- Ball, B.; Campbell, D.; Hunter, E. Soil compactibility in relation to physical and organic properties at 156 sites in UK. Soil Tillage Res. 2000, 57, 83–91. [Google Scholar] [CrossRef]
- Mueller, L.; Kay, B.D.; Been, B.; Hu, C.; Zhang, Y.; Wolff, M.; Eulenstein, F.; Schindler, U. Visual assessment of soil structure: Part II. Implications of tillage, rotation and traffic on sites in Canada, China and Germany. Soil Till. Res. 2008, 103, 188–196. [Google Scholar] [CrossRef]
- Arshad, M.A.; Martin, S. Identifying critical limits for soil quality indicators in agro ecosystems. Agric. Ecosys. Environ. 2002, 88, 153–160. [Google Scholar] [CrossRef]
- Castellini, M.; Fornaro, F.; Garofalo, P.; Giglio, L.; Rinaldi, M.; Ventrella, D.; Vitti, C.; Vonella, A.V. Effects of No-Tillage and Conventional Tillage on Physical and Hydraulic Properties of Fine Textured Soils under Winter Wheat. Water 2019, 11, 484. [Google Scholar] [CrossRef]
- Castellini, M.; Stellacci, A.M.; Barca, E.; Iovino, M. Application of Multivariate Analysis Techniques for Selecting Soil Physical Quality Indicators: A Case Study in Long-Term Field Experiments in Apulia (Southern Italy). Soil Sci. Soc. Am. J. 2019, 83, 707–720. [Google Scholar] [CrossRef]
- Thompson, L.M.; Troeh, F.R. Soils and Soil Fertility; McGraw-Hill, Inc.: Irvine, CA, USA, 1978. [Google Scholar]
- Kowda, W.A. Basics of Soil Science; PWRiL: Warsaw, Poland, 1984. [Google Scholar]
- Cockroft, B.; Olsson, K.A. Case study of soil quality in south-eastern Australia: Management of structure for roots in duplex soils. In Soil Quality for Crop Production and Ecosystem Health; Gregorich, E.G., Carter, M.R., Eds.; Developments in Soil Science, 25; Elsevier: New York, NY, USA, 1997; pp. 339–350. [Google Scholar]
- Grable, A.R.; Siemer, E.G. Effects of bulk density, aggregate size, and soil water suction on oxygen diffusion, redox potentials and elongation of corn roots. Soil Sci. Soc. Am. Proc. 1968, 32, 180–186. [Google Scholar] [CrossRef]
- Mayers, W.S.; Barrs, H.D. Roots in irrigated clay soil: Measurement techniques and responses to root zone conditions. Irrigation Sci. 1991, 12, 125–134. [Google Scholar]
- Walczak, R.; Ostrowski, J.; Witkowska-Walczak, B.; Sławiński, C. Spatial characteristic of water conductivity in the surface level of Polish arable soils. Int. Agrophysics 2002, 16, 239–247. [Google Scholar]
- Drewry, J. Natural recovery of soil physical properties from treading damage of pastoral soils in New Zealand and Australia: A review. Agric. Ecosyst. Environ. 2006, 114, 159–169. [Google Scholar] [CrossRef]
- Pranagal, J.; Woźniak, A. 30 years of wheat monoculture and reduced tillage and physical condition of Rendzic Phaeozem. Agric. Water Manag. 2021, 243, 106408. [Google Scholar] [CrossRef]
- Iversen, B.V.; Schjønning, P.; Poulsen, T.G.; Moldrup, P. In-situ, on-situ and laboratory measurements of soil air permeability: Boundary conditions a measurement scale. Soil Sci. 2001, 166, 97–106. [Google Scholar] [CrossRef]
- Kutílek, M. Soil hydraulic properties as related to soil structure. Soil Tillage Res. 2004, 79, 175–184. [Google Scholar] [CrossRef]
- Petrosyants, M.A.; Kislov, A.V.; Semenov, E.K. Principal Concepts in Meteorology and Climatology; Vestnik Moskovskogo Universiteta, S 5; Geografiya: Moscow, Russia, 2005; Volume 1, pp. 83–91. [Google Scholar]
- White, R.E. Principles and Practice of Soil Science, 4th ed.; Blackwell Publishing: Oxford, UK, 2006. [Google Scholar]
- Leśny, J. Meteorology and Climatology Research. Acta Agroph. 2010, 184, 1–263. [Google Scholar]
- Usowicz, B.; Usowicz, Ł. Point measurements of soil water content and its spatial distribution in cultivated fields. Acta Agroph. 2004, 4, 573–588. [Google Scholar]
- Iqbal, J.; Thomasson, J.A.; Jenkins, J.N.; Owens, P.R.; Whisler, F.D. Spatial Variability Analysis of Soil Physical Properties of Alluvial Soils. Soil Sci. Soc. Am. J. 2005, 69, 1338–1350. [Google Scholar] [CrossRef]
- Nemes, A.; Rawls, W.J.; Pachepsky, Y.A. Influence of Organic Matter on the Estimation of Saturated Hydraulic Conductivity. Soil Sci. Soc. Am. J. 2005, 69, 1330–1337. [Google Scholar] [CrossRef]
- Walczak, R.; Ostrowski, J.; Witkowska-Walczak, B.; Sławiński, C. Hydrophysical characteristics of Polish mineral arable soils. Acta Agroph. 2002, 79, 1–64. [Google Scholar]
- Aimrun, W.; Amin, M.; Eltaib, S. Effective porosity of paddy soils as an estimation of its saturated hydraulic conductivity. Geoderma 2004, 121, 197–203. [Google Scholar] [CrossRef]
- Niedźwiecki, J.; Czyż, E.A.; Dexter, A.R. Hydraulic conductivity of the topsoil depending on the parameters of the solid phase. Puławy Diary 2006, 142, 297–307. [Google Scholar]
- Aznar-Sánchez, J.A.; García-Gómez, J.J.; Velasco-Muñoz, J.F.; Carretero-Gómez, A. Mining Waste and Its Sustainable Management: Advances in Worldwide Research. Minerals 2018, 8, 284. [Google Scholar] [CrossRef]
- Tayebi-Khorami, M.; Edraki, M.; Corder, G.; Golev, A. Re-Thinking Mining Waste through an Integrative Approach Led by Circular Economy Aspirations. Minerals 2019, 9, 286. [Google Scholar] [CrossRef]
- Eisa, M.; Ragauskaitė, D.; Adhikari, S.; Bella, F.; Baltrusaitis, J. Role and Responsibility of Sustainable Chemistry and Engineering in Providing Safe and Sufficient Nitrogen Fertilizer Supply at Turbulent Times. ACS Sustain. Chem. Eng. 2022, 10, 8997–9001. [Google Scholar] [CrossRef]
- Abubaker, J.; Risberg, K.; Pell, M. Biogas residues as fertilisers—Effects on wheat growth and soil microbial activities. Appl. Energy 2012, 99, 126–134. [Google Scholar] [CrossRef]
- Różyło, K.; Andruszczak, S.; Kwiecińska-Poppe, E.; Różyło, R.; Kraska, P. Effect of Three Years’ Application of Biogas Digestate and Mineral Waste to Soil on Phytochemical Quality of Rapeseed. Pol. J. Environ. Stud. 2019, 28, 833–843. [Google Scholar] [CrossRef]
- Dalmora, A.C.; Ramos, C.G.; Plata, L.G.; da Costa, M.L.; Kautzmann, R.M.; Oliveira, L.F.S. Understanding the mobility of potential nutrients in rock mining by-products: An opportunity for more sustainable agriculture and mining. Sci. Total. Environ. 2020, 710, 136240. [Google Scholar] [CrossRef]
- Xu, M.; Xian, Y.; Wu, J.; Gu, Y.; Yang, G.; Zhang, X.; Peng, H.; Yu, X.; Xiao, Y.; Li, L. Effect of biogas slurry addition on soil properties, yields, and bacterial composition in the rice-rape rotation ecosystem over 3 years. J. Soils Sediments 2019, 19, 2534–2542. [Google Scholar] [CrossRef]
- Różyło, K.; Bohacz, J. Microbial and enzyme analysis of soil after the agricultural utilization of biogas digestate and mineral mining waste. Int. J. Environ. Sci. Technol. 2020, 17, 1051–1062. [Google Scholar] [CrossRef]


Disclaimer/Publisher’s Note: The statements, opinions and data contained in all publications are solely those of the individual author(s) and contributor(s) and not of MDPI and/or the editor(s). MDPI and/or the editor(s) disclaim responsibility for any injury to people or property resulting from any ideas, methods, instructions or products referred to in the content. |
© 2023 by the authors. Licensee MDPI, Basel, Switzerland. This article is an open access article distributed under the terms and conditions of the Creative Commons Attribution (CC BY) license (https://creativecommons.org/licenses/by/4.0/).