Abstract
The rainfall kinetic energy, which affects soil erosion processes, can be calculated by the drop-size distribution (DSD) and falling velocity. This study presents the outcomes derived by the DSDs recorded with the same optical disdrometer in two experimental areas, located in Sicily (southern Italy). Specifically, the DSDs were recorded from March 2017 to December 2019 at Sparacia and from June 2006 to April 2014 at Palermo. The aims of this paper are both to compare the DSDs for the two sites and to evaluate the applicability of Gamma theoretical distribution. Moreover, the relations of rainfall kinetic power vs. rainfall intensity are assessed. Differences in DSDs, especially for rainfall intensity I lower than 100 mm h−1, are detected, while they are less evident for the highest I values. The kinetic power per unit volume of rainfall varies between the two sites and can be considered roughly coincident only for I higher than 100 mm h−1. The observed kinetic power-rainfall intensity relations are not well described by the equations by Wischmeier and Smith and Brown and Foster. Finally, the reliability of a theoretical relationship for estimating the kinetic power by I and the median volume diameter D0 is positively tested for the Palermo dataset, while it is found to be reliable only for D0 greater than 0.17 cm for the Sparacia dataset.
1. Introduction
Anthropogenic acceleration of soil erosion processes, due to tillage, nonconservative agricultural practices, overgrazing, and deforestation, has a strong impact on the soil ecosystem, and it affects the environmental quality [1].
Soil erosion due to rainfall is a process characterized by the detachment of soil particles attributable to rainfall impact on the soil surface and the transport of the detached particles by rainfall and runoff.
Rainfall erosivity, which is defined as the capability of rainfall to determine soil particle detachment, is the variable used to characterize the erosive agent; it is necessary for quantifying soil erosion processes and can be expressed by the kinetic energy per unit time, called kinetic power Pn [2,3,4,5]. The kinetic power of a given rainfall can be obtained by adding the contribution of each raindrop constituting the precipitation [6], and it varies with the size, falling velocity, and number of impacting drops on soil surface area in unit time. In other words, the rainfall kinetic power is calculated by relating the drop-size distribution (DSD) to rainfall intensity and raindrop terminal velocity [7,8].
Several empirical equations estimating kinetic power by rainfall intensity, I (mm h−1), characterized by different mathematical shapes were proposed by different authors [9,10,11,12]. The most common empirical equation for the estimate of Pn (J m−2 h−1) that considers its dependence on only rainfall intensity I is the one presented by Wischmeier and Smith [11] and applied in the Universal Soil Loss Equation (USLE):
where It is the intensity threshold that Wischmeier and Smith [11] assumed equal to 76 mm h−1. Equation (1) demonstrates that the ratio Pn/I (J m−2 mm−1), which is the kinetic energy per unit volume of rainfall, grows for rainfall intensities ≤ It and becomes constant for rainfall intensities > It. Wischmeier and Smith [11] explained this threshold by considering that the median volume diameter, D0, which is the diameter dividing the DSD into two parts of the same volume, does not grow with rainfall intensities > 76 mm h−1.
Kinnell [13] described the Pn-I relationship as follows:
in which a, b, and c are parameters to be estimated.
Kinnell [14] reported an a value of 29 J m−2 mm−1 and considered b and c as site-specific parameters [15]. As suggested by Brown and Foster [16], Equation (2) is used in the RUSLE (Revised Universal Soil Loss Equation) model with a = 29 J m−2 mm−1, b = 0.72, and c = 0.05 h mm−1. For the RUSLE2 equation, Foster [17] used Equation (2) with a = 29 J m−2 mm−1, b = 0.72, and c = 0.082 h mm−1 [18].
Instead of using an empirical Pn-I relationship, the kinetic power of the precipitation can be obtained by adding the contribution of each raindrop constituting precipitation, if its DSD and the relationship between raindrop terminal velocity and drop diameter are known. The DSD establishing the number of drops N(D) dD, having a drop diameter between D and D + dD, that hit a unit horizontal area in the unit time is useful to develop hydrological studies [6,19]. Ulbrich [20] proposed, as DSD, a Gamma distribution that is characterized by wide applicability in several climatic conditions. This theoretical DSD is a generalization of the exponential distribution by Marshall and Palmer [21], and it has the following form [8]:
In which μ (−), Λ (cm−1), and No (m−2 s−1 cm−1−μ) are the three parameters of the Gamma distribution and N(D) dD is expressed as m−2 s−1.
Using the available experimental measurements of raindrop terminal velocity V(D) (m s−1), Ferro [22] deduced the following equation:
in which Vn = 9.5 m s−1, an = 6 cm−1, and D is the drop diameter expressed as cm. Equation (4) was obtained using experimental measurements of raindrop terminal velocity carried out by Laws [23], Gunn and Kinzer [24], Blanchard [25], Beard [26], Epema and Riezebos [27], and Jayawardena and Rezaur [28] using drop diameters in the range 0.01–0.6 cm; it is characterized by a good agreement with the available measurements [8,22]. As the velocity V(D) increases for D < 0.56 cm until it becomes constant, Equation (4) is also able to follow the physical boundary for D greater than 0.55 cm (the drops are unstable and break up) [8].
If both the DSD and the terminal velocity V(D) are known, the kinetic power Pn (J s−1 m−2) can be obtained as follows [15]:
where ρ is the water density (kg m−3), and V(D) is expressed as m s−1 and D as cm.
Carollo and Ferro [6], coupling Equations (3)–(5), obtained the following expression of the kinetic power Pn (J s−1 m−2):
in which I (mm h−1) is the rainfall intensity expressed as [5,15]
in which Γ is the gamma function.
Carollo et al. [3] proved that, if the exponential distribution by Marshall and Palmer [21] is referred to the unit area and time, then it becomes coincident with a Gamma distribution [20] with μ = 0.67 [19], and Equation (6) can be rewritten as
The following relationship between the median volume diameter D0 (cm) and the Λ parameter [4,19,20],
can be introduced into Equation (8) for deducing the following equation for estimating the kinetic power Pn (J s−1 m−2):
>Equation (10) shows that Pn/I depends only on D0. Hence, Equation (10) establishes that the whole DSD can be represented by D0 when the rainfall kinetic power is calculated. According to Carollo et al. [3,5] and Serio et al. [8], when the rainfall intensity I > It, D0 and, according to Equation (10), the Pn/I ratio are constant. Thereby, Equation (10) theoretically confirms the hypothesis by Wischmeier and Smith [11] that, for I > It, the Pn/I ratio becomes constant because D0 has a constant value.
Firstly, in this paper, the DSDs recorded by the same optical disdrometer at the Sparacia experimental area from March 2017 to December 2019 and the Palermo experimental area from June 2006 to March 2014 are presented. The DSDs, aggregated into rainfall intensity classes characterized by different amplitudes, are used to test the reliability of Ulbrich’s distribution (Equation (3)) and to estimate its parameters μ and Λ. Then, the measured kinetic power values are used to assess the applicability of Equations (1), (2) and (10). The comparison between the observed relations of rainfall kinetic power vs. rainfall intensity allows for assessing if the well-known literature result, concerning the variation with the location of this type of relationship, is also valid for two sites located within the same region at such a short distance of about 100 km. The use of the same disdrometer in two different sites and the prolonged investigation period (11 years) make the developed analysis very robust and lend originality to the present investigation relative to previous studies on rainfall kinetic power performed elsewhere.
2. Materials and Methods
The DSDs were recorded using optical disdrometers (model ODM 70 made by Eigenbrodt) placed in two experimental Sicilian sites (Palermo and Sparacia) (Figure 1).
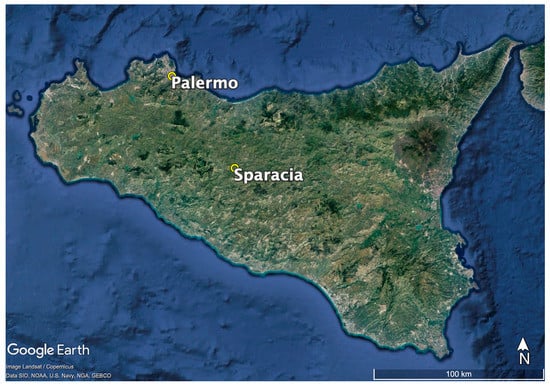
Figure 1.
Location of the experimental areas.
The Sparacia experimental area (37.637300° N, 13.760671° E) is situated in western Sicily (in the Sicilian hinterland, away from the coast), southern Italy, approximately 100 km south of Palermo (Figure 2a) at 415 m a.s.l. The climate is of Mediterranean semiarid type and is characterized by a 700-mm mean annual rainfall. The Palermo (northwestern Sicily, on the coast) experimental station is situated at the Department of Agricultural, Food and Forest Sciences of the University of Palermo (38.108171° N, 13.351861° E), at 40 m a.s.l. (Figure 2b). The climate is Mediterranean temperate, with dry and hot summers and mild and rainy winters. The mean temperatures vary between 15°C and 22°C. Rainfalls mainly occur in autumn and winter and have a mean annual value equal to 654 mm.
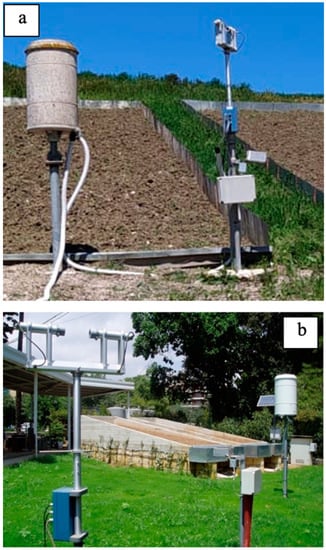
Figure 2.
Sparacia (a) and Palermo (b) experimental installations.
For each minute of the rainfall event, the disdrometer (Figure 3) measures the drop diameter in the range 0.035–0.6 cm. Every drop is separately measured and included in classes having about a 0.005-cm width. The disdrometer shares the diameter range into 128 classes and detects the number of drops that belong to a given class for every raining minute. The passage of the drop in the control volume between two diodes causes a light damping, which allows for measuring the drop diameter (Figure 3). Further details are reported in Carollo et al. [3,4].
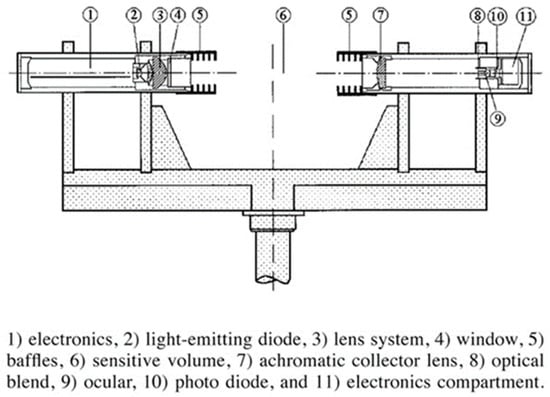
Figure 3.
Sketch of the used ODM 70 optical disdrometer.
The disdrometer recorded 544 rainy days from June 2006 to April 2014 at the Palermo experimental area, and 318 rainy days at Sparacia from March 2017 to December 2019. For each registered DSD, rainfall intensity was calculated by summing the volumes of the single droplets under the hypothesis of a spherical shape.
3. Results
3.1. Testing the Applicability of Ulbrich’s Distribution by Aggregated DSDs
For each rainfall event, the analysis was developed considering only DSDs characterized by rainfall intensity > 0.5 mm h−1 and at least 20 measured diameter classes. This characterization allows for excluding both rainfalls characterized by low erosive power and DSDs with small sample size and gives 45,802 DSDs for Palermo and 25,928 DSDs for Sparacia with a sampling time of 1 min (defined single DSDs) characterized by I ≤ 203.4 mm h−1 and I ≤ 503.8 mm h−1, respectively.
To better show the effect of rainfall intensity on rainfall energetic characteristics, the single DSDs obtained at Palermo and Sparacia were aggregated into intensity classes having different sizes. In particular, for both sites, the intensity classes of the weakest rain intensities I < 30 mm h−1 are divided into intervals of 1 mm h−1, while the 2-, 5-, and 10-mm h−1 divisions were chosen for stronger intensities 30 mm h−1 ≤ I < 50 mm h−1, 50 mm h−1 ≤ I < 100 mm h−1, and I ≥ 100 mm h−1, respectively. For every class, the rainfall intensity was obtained by averaging the intensities of the single DSDs belonging to the class. This procedure gave 59 DSDs for Palermo and 71 for Sparacia. These aggregated DSDs are characterized by intensity values in the range 0.8–203.4 mm h−1 for the Palermo site and 0.8– 503.8 mm h−1 for the Sparacia site.
Figure 4 shows that the number of single DSDs within each class decreases as rainfall intensity increases. For the Palermo experimental site (Figure 4a) and I > 85 mm h−1 less than 10, DSDs fall into each class, while for the Sparacia area (Figure 4b), this occurs for I > 125 mm h−1.
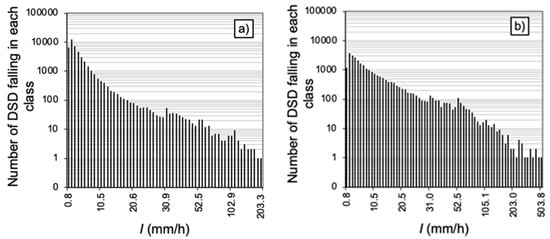
Figure 4.
Number of DSDs falling in each class for the Palermo (a) and Sparacia (b) experimental sites.
Figure 5 shows the drop diameter Dxx which corresponds to a known percentile xx (25, 50, 75) of the aggregated DSDs related to rainfall intensity. For a given rainfall intensity, the rainfalls detected at Palermo and Sparacia present DSDs characterized by values of D25 and D50 that can be considered overlapped. For the diameter D75 and I < 50 mm h−1, Figure 5 shows that the DSDs registered at Sparacia are characterized by lower values of the characteristic drop diameter compared to Palermo DSDs, while for intensity values higher than about 50 mm h−1, this is less evident.
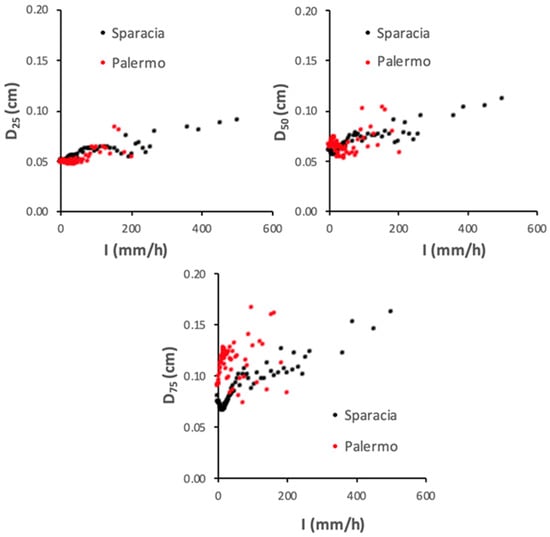
Figure 5.
Comparison between the pairs (I, Dxx) for the 25th (D25), 50th (D50), 75th (D75) percentiles of the aggregated DSDs detected at Palermo and Sparacia.
Figure 6 presents the comparison between the pairs (I, D0) measured in the two experimental sites. At the Sparacia experimental area, the median volume diameter shows a decreasing relationship with I for I < 17 mm h−1. Above this value, the relation D0-I is similar to that registered for the Palermo dataset, and for I > 100 mm h−1, the D0 values measured in the two sites can be considered overlapped.
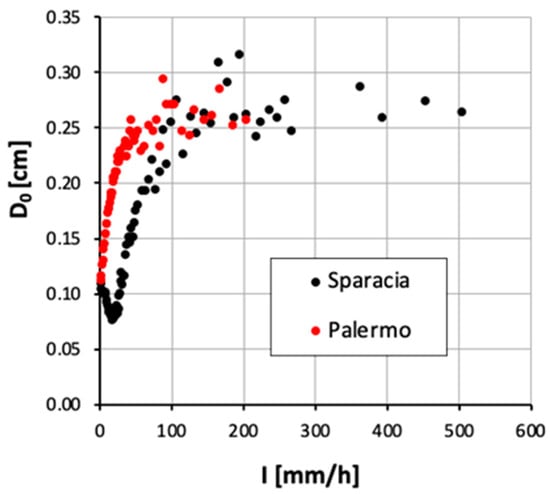
Figure 6.
Comparison between the measured values of the median volume diameter D0 and rainfall intensities of the aggregated DSDs detected at Palermo and Sparacia.
Ulbrich’s distribution was fitted to each aggregated DSD by the momentum method. In particular, the two parameters μ and Λ were deduced by the measurements of the median drop diameter D50 and the median volume drop diameter D0 as follows [3]:
Figure 7 plots the obtained estimates of the μ and Λ parameters of Ulbrich’s distribution. The two parameters are evidently correlated with each other according to the same relation for the two sites. For both sites, some pairs (μ, Λ), characterized by Λ < 20, deviate from the above relation, but, also in this case, the two series are overlapped.
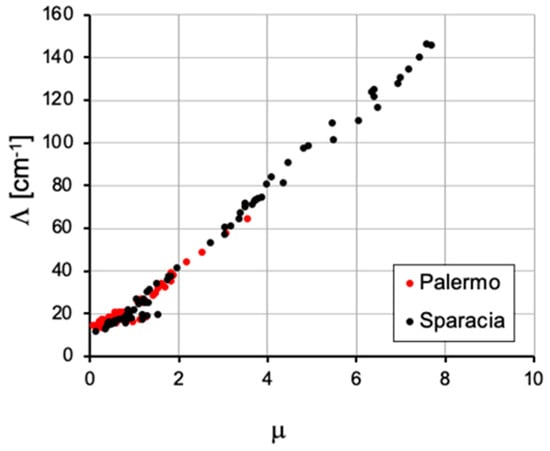
Figure 7.
Comparison between μ and Λ parameters of Ulbrich’s distribution obtained by the momentum method.
3.2. Kinetic Power Relationships
The comparison between the pairs (I, Pn/I) detected at Palermo and Sparacia, plotted in Figure 8, highlights that they are almost overlapped for I > 100 mm h−1, while for I less than 100 mm h−1, the Palermo Pn/I values are higher than the Sparacia ones.
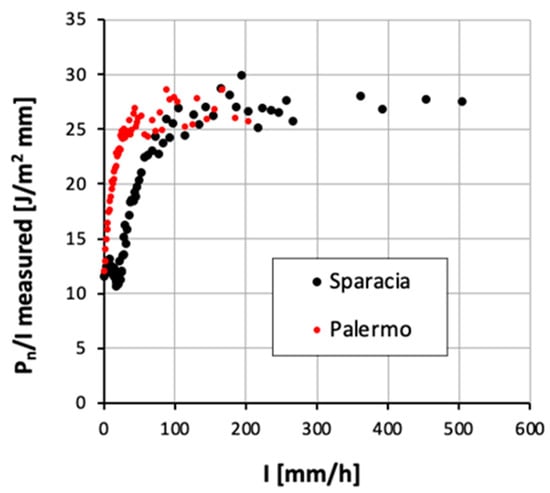
Figure 8.
Comparison between (I, Pn/I) pairs for the aggregated DSDs detected at Palermo and Sparacia.
Moreover, for I > 17 mm h−1, the pairs (I, Pn/I) of the two datasets show the same relationship with rainfall intensity. For both datasets, in fact, a threshold value It can be identified above which, according to Equation (1), Pn/I becomes constant. For Sparacia, It is equal to 100 mm h−1, while for Palermo, It is equal to 40 mm h−1.
Figure 9 demonstrates that a relationship such as Equation (1) or (2), where rainfall intensity is the only predictive variable, is not applicable everywhere. In particular, for the Sparacia site, both Equations (1) and (2) generally overestimate the kinetic power.
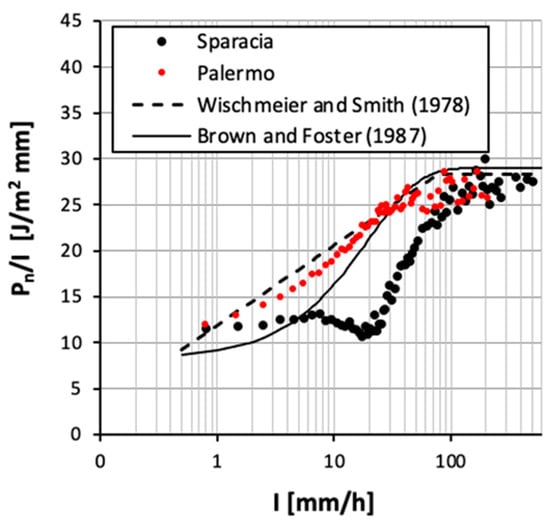
Figure 9.
Comparison between the pairs (I, Pn/I) measured at the Palermo and Sparacia sites and Equations (1) and (2).
The comparison between the pairs (D0, Pn/I) detected at Palermo and Sparacia is plotted in Figure 10. The pairs (D0, Pn/I) of the two datasets are overlapped for D0 > 0.17 cm and are close to the curve of Equation (10). For D0 < 0.17 cm, Pn/I values measured at the Sparacia site are higher than those measured at Palermo. In other words, for the Sparacia dataset and D0 < 0.17 cm, the application of Equation (10) implies an appreciable systematic underestimation of Pn/I.
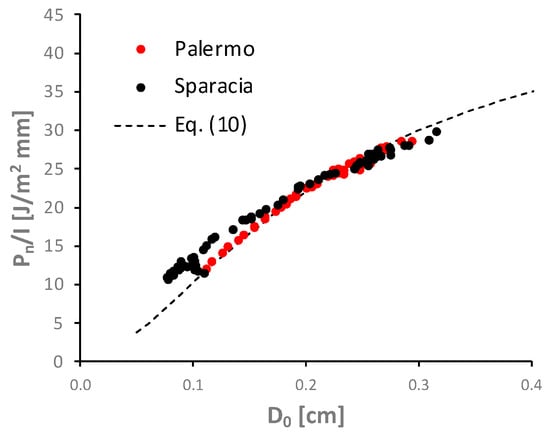
Figure 10.
Measured Pn/I values versus median volume diameter D0 for the Palermo and Sparacia datasets and their comparison with Pn/I values obtained by Equation (10).
4. Discussion
For a given rainfall intensity, Figure 5 and Figure 6 demonstrate that the two sites are characterized by similar values of D25 and D50 and, especially for I < 100 mm h−1, very different values of the characteristic diameters D75 and D0 that, according to Serio et al. [29], correspond to even higher percentiles. Accordingly, these figures demonstrate that different DSDs, especially for smaller rainfall intensities, are registered in the two sites. For the highest values of I, the differences between the DSDs registered in the two sites are less evident.
In particular, Figure 6, confirming the similarity among the DSDs at the two locations for the highest rainfall intensity values, shows comparable values of the D0 diameters for I > 100 mm h−1. In other words, the spatial variability within the Sicilian region affects the DSD up to a threshold intensity value of 100 mm h−1, while for the highest I values, this spatial variability of DSD is not clearly detected.
As detected for the relationship D0-I, Figure 8 highlights that, in both sites, the kinetic energy per unit volume of rainfall, Pn/I, increases with rainfall intensity until a threshold value of rainfall intensity, It, is reached. This threshold It is equal to 40 mm h−1 for the Palermo site, while it becomes 100 mm h−1 for Sparacia. The comparison between Figure 6 and Figure 8 highlights that above the threshold It, the median volume diameter D0 assumes a constant value that can be considered very close for both sites. This result agrees with that obtained by Carollo et al. [3,5] and Serio et al. [8], which established that when the rainfall intensity I > It, D0 and, according to Equation (10), the Pn/I ratio are constant. This result also confirms the hypothesis of Wischmeier and Smith [11] that Pn/I does not continue to increase for the highest intensity values (>It) since D0 is constant, too. According to Carollo et al. [4], this result can be justified by considering that the unstable large drops break into small drops (disaggregation), and this circumstance, determining an increase of the number of drops, favors an effect of the collapse of drops. For low rainfall intensities (I < It), the drop collapse effect prevails on the disaggregation phenomenon, and the rainfall kinetic power increases more rapidly than rainfall intensity. Conversely, for high intensity (I > It), an equilibrium condition between disaggregation and collapse is reached; as a consequence, the DSD and D0 become almost invariable, and the kinetic power is proportional to I.
For rainfall intensity values I > It, Pn/I assumes a quasi constant value (27 J m−2 mm−1), which is very close to the asymptotic value obtained by Equation (1) (28.3 J m−2 mm−1) or Equation (2) (29 J m−2 mm−1). In any case, Figure 8 clearly demonstrates that the relation Pn/I-I is site specific.
For I < It and I > It, Figure 11 shows the comparison between the parameters of Ulbrich’s distribution obtained by the momentum method using Equations (11) and (12). It is evident that, for both cases, the two parameters are related to each other even if this relation is described by different equations for I < It and I > It. According to Equation (6), this circumstance implies that the kinetic power per unit volume of rainfall can be determined by a single parameter, and this parameter could be the median volume diameter as established by Equation (10) and suggested by Figure 10. Moreover, from a statistical point of view, Figure 11 suggests that the DSDs can be described by two parameters alone, estimated, for example, by I and D0, but these estimating relationships differ between I < It and I > It. This result does not agree with that by Chandrasekar and Bringi [30], who did not find any explanation concerning the relation between μ and Λ.
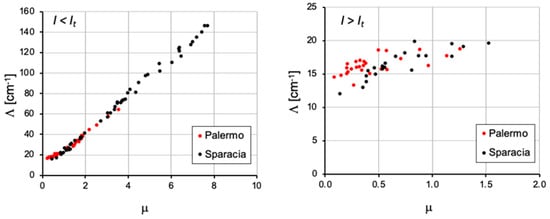
Figure 11.
Comparison between μ and Λ parameters of Ulbrich’s distribution obtained by the momentum method for I < It and I > It.
Figure 10 allows us to state that the hypotheses on which Equation (10) is based hold for the Palermo dataset, while for Sparacia measurements, Equation (10) can be applied only for D0 > 0.17 cm, which, according to Figure 6, corresponds to I > 50 mm h−1. However, for the Sparacia dataset, the (D0, Pn/I) pairs are well aligned along a single curve whose equation is different from Equation (10). In other words, for the Sparacia site, a relationship between Pn/I and the only predictive variable D0 can be identified, but the hypotheses adopted for deducing Equation (10) are no longer valid. In particular, the applicability of the Marshall and Palmer [21] distribution is no longer verified, especially for the lower values of D0.
Finally, all the above considerations highlight that the disdrometric characteristics of rainfall are site specific, especially for rainfall intensities less than 100 mm h−1. The knowledge of rainfall intensity alone does not allow one to determine these characteristics or, consequently, to accurately estimate its erosivity, as clearly highlighted by Figure 9.
5. Conclusions
Rainfall erosivity, which can be represented by its kinetic power, is a very important variable for defining erosion processes. In this investigation, the DSDs measured by the same optical disdrometer in two Sicilian experimental sites (Palermo and Sparacia) were compared. For a given value of rainfall intensity, the DSDs registered at Palermo are different from the DSDs measured at Sparacia even if the two sites are located in a similar geographical context.
The measured DSDs were used to deduce the kinetic power by coupling them with falling velocity estimated by the relationship proposed by Ferro [22]. For a given value of rainfall intensity, the kinetic power per unit volume of rainfall registered in the two sites is very different and can be considered roughly coincident only for rainfall intensity higher than 100 mm h−1.
This investigation clearly showed that the relation Pn/I-I is site specific, and a relationship such as Equation (1) or (2), which uses the rainfall intensity as a single predictive variable, is not applicable everywhere. In other words, the knowledge of rainfall intensity does not allow us to accurately estimate erosivity.
Finally, the relationship proposed by Carollo et al. [3] (Equation (10)) is reliable for the Palermo dataset, while for the Sparacia dataset, it is reliable only for D0 greater than 0.17 cm. For D0 < 0.17 cm, the use of Equation (10) implies an appreciable systematic underestimation of Pn/I. This result suggests that the hypotheses on which Equation (10) is based are valid for the Palermo dataset, while they are valid only for D0 > 0.17 cm for the Sparacia dataset.
Further investigations are necessary to verify the presented results in other climatic contexts.
Author Contributions
Conceptualization, F.G.C., A.N., V.P. (Vincenzo Palmeri), V.P. (Vincenzo Pampalone), M.A.S. and V.F.; formal analysis, F.G.C., A.N., V.P. (Vincenzo Palmeri), V.P. (Vincenzo Pampalone), M.A.S. and V.F.; investigation, F.G.C., A.N., V.P. (Vincenzo Palmeri), V.P. (Vincenzo Pampalone), M.A.S. and V.F.; methodology, F.G.C., A.N., V.P. (Vincenzo Palmeri), V.P. (Vincenzo Pampalone), M.A.S. and V.F.; project administration, V.F.; software, F.G.C., A.N., V.P. (Vincenzo Palmeri), V.P. (Vincenzo Pampalone), M.A.S. and V.F.; supervision, V.F.; writing—original draft, F.G.C., A.N., V.P. (Vincenzo Palmeri), V.P. (Vincenzo Pampalone), M.A.S. and V.F.; writing—review and editing, F.G.C., A.N., V.P. (Vincenzo Palmeri), V.P. (Vincenzo Pampalone), M.A.S. and V.F. All authors have read and agreed to the published version of the manuscript.
Funding
This research received no external funding.
Data Availability Statement
The data presented in this study are available on reasonable request from the corresponding author.
Conflicts of Interest
The authors declare no conflict of interest.
References
- Borrelli, P.; Robinson, D.A.; Fleischer, L.R.; Lugato, E.; Ballabio, C.; Alewell, C.; Meusburger, K.; Modugno, S.; Schütt, B.; Ferro, V.; et al. An assessment of the global impact of 21st century land use change on soil erosion. Nat. Commun. 2017, 8, 2013. [Google Scholar] [CrossRef] [PubMed]
- Van Dijk, A.I.J.M.; Bruijnzeel, L.A.; Rosewell, C.J. Rainfall intensity-kinetic energy relationships, a critical literature appraisal-Review. J. Hydrol. 2002, 261, 1–23. [Google Scholar] [CrossRef]
- Carollo, F.; Ferro, V.; Serio, M.A. Estimating rainfall erosivity by aggregated drop size distributions. Hydrol. Process. 2016, 30, 2119–2128. [Google Scholar] [CrossRef]
- Carollo, F.; Ferro, V.; Serio, M.A. Reliability of rainfall kinetic power-intensity relationships. Hydrol. Process. 2017, 31, 1293–1300. [Google Scholar] [CrossRef]
- Carollo, F.; Ferro, V.; Serio, M.A. Predicting rainfall erosivity by momentum and kinetic energy in Mediterranean environment. J. Hydrol. 2018, 560, 173–183. [Google Scholar] [CrossRef]
- Carollo, F.G.; Ferro, V. Modeling Rainfall Erosivity by Measured Drop-Size Distributions. J. Hydrol. Eng. 2015, 20, C4014006-1-7. [Google Scholar] [CrossRef]
- Assouline, S. Drop size distributions and kinetic energy rates in variable intensity rainfall. Water Resour. Res. 2009, 45, W11501. [Google Scholar] [CrossRef]
- Serio, M.A.; Carollo, F.G.; Ferro, V. Raindrop size distribution and terminal velocity for rainfall erosivity studies. A review. J. Hydrol. 2019, 576, 210–228. [Google Scholar] [CrossRef]
- Kinnell, P.I.A. The problem of assessing the erosive power of rainfall from meteorological observations. Soil Sci. Soc. Am. Proc. 1973, 37, 617–621. [Google Scholar] [CrossRef]
- McGregor, K.C.; Mutchler, C.K. Status of the R factor in northern Mississippi. Soil Eros. Predict. Control 1976, 135–142. [Google Scholar]
- Wischmeier, W.H.; Smith, D.D. Predicting Rainfall Erosion Losses-A guide to conservation planning. In Agriculture Handbook; United States Department of Agricolture: Washington, DC, USA, 1978; p. 537. [Google Scholar]
- Renard, K.G.; Foster, G.R.; Weesies, G.A.; McCool, D.K.; Yoder, D.C. Predicting Soil Erosion by Water, A Guide to Conservation Planning with the Revised Universal Soil Loss Equation (RUSLE); USDA: Washington, DC, USA, 1997; p. 404.
- Kinnell, P.I.A. Rainfall intensity-kinetic energy relationship for soil loss prediction. Soil Sci. Soc. Am. Proc. 1981, 45, 153–155. [Google Scholar] [CrossRef]
- Kinnell, P.I.A. Rainfall energy in Eastern Australia: Intensity-kinetic energy relationships for Canberra, A.C.T. Aust. J. Soil Res. 1987, 25, 547–553. [Google Scholar] [CrossRef]
- Salles, C.; Poesen, J.; Sempere-Torres, D. Kinetic energy of rain and its functional relationship with intensity. J. Hydrol. 2002, 257, 256–270. [Google Scholar] [CrossRef]
- Brown, L.C.; Foster, G.R. Storm erosivity using idealized intensity distribution. Trans. ASAE 1987, 30, 379–386. [Google Scholar] [CrossRef]
- Foster, G.R. User’s Reference Guide, Revised Universal Soil Loss Equation (RUSLE2); USDA: Washington, DC, USA, 2004.
- McGregor, K.C.; Bingner, R.L.; Bowie, A.J.; Foster, G.R. Erosivity index values for northern Mississippi. Trans. Am. Soc. Agric. Eng. 1995, 38, 1039–1047. [Google Scholar] [CrossRef]
- Uijlenhoet, R.; Stricker, J.N.M. Dependence of rainfall interception on drop size-a comment. J. Hydrol. 1999, 217, 157–163. [Google Scholar] [CrossRef]
- Ulbrich, C.W. Natural variations in the Analytical form of the Raindrop Size Distribution. J. Clim. Appl. Meteorol. 1983, 22, 1764–1775. [Google Scholar] [CrossRef]
- Marshall, J.S.; Palmer, W.M. The distribution of raindrops with size. J. Meteorol. 1948, 5, 165–166. [Google Scholar] [CrossRef]
- Ferro, V. Tecniche di misura e monitoraggio dei processi erosivi. Quad. Idronomia Mont. 2001, 21, 63–128. (In Italian) [Google Scholar]
- Laws Laws, J.O. Measurements of the fall-velocity of water-drops and raindrops. Am. Geophys. Union Trans. 1941, 22, 709–721. [Google Scholar] [CrossRef]
- Gunn, R.; Kinzer, G.D. The terminal velocity of fall for water droplets in stagnant air. J. Meteorol. 1949, 6, 243–248. [Google Scholar] [CrossRef]
- Blanchard, D.C. Behavior of water drops at terminal velocity. Trans. Am. Geoph. Union. 1950, 31, 836–842. [Google Scholar] [CrossRef]
- Beard, K.V. Terminal velocity of cloud and precipitation drops aloft. J. Atmos. Sci. 1976, 33, 851–864. [Google Scholar] [CrossRef]
- Epema, G.F.; Riezebos, H.T. Fall velocity of water drops at different heights as a factor influencing erosivity of simulated rain. In Rainfall Simulation, Runoff and Soil Erosion; DePloy, J., Ed.; Catena Supplement; Catena Verlag: Cremlingen, Germany, 1983; Volume 4, pp. 1–18. [Google Scholar]
- Jayawardena, A.W.; Rezaur, R.B. Drop size distribution and kinetic energy load of rainstorms in Hong Kong. Hydrol. Process. 2000, 14, 1069–1082. [Google Scholar] [CrossRef]
- Serio, M.A.; Carollo, F.G.; Ferro, V. A method for evaluating rainfall kinetic power by a characteristic drop diameter. J. Hydrol. 2019, 577, 123996. [Google Scholar] [CrossRef]
- Chandrasekar, V.; Bringi, V.N. Simulation of Radar Reflectivity and Surface Measurements of Rainfall. J. Atmos. Ocean. Technol. 1987, 4, 464–478. [Google Scholar] [CrossRef]
Disclaimer/Publisher’s Note: The statements, opinions and data contained in all publications are solely those of the individual author(s) and contributor(s) and not of MDPI and/or the editor(s). MDPI and/or the editor(s) disclaim responsibility for any injury to people or property resulting from any ideas, methods, instructions or products referred to in the content. |
© 2023 by the authors. Licensee MDPI, Basel, Switzerland. This article is an open access article distributed under the terms and conditions of the Creative Commons Attribution (CC BY) license (https://creativecommons.org/licenses/by/4.0/).