Abstract
Virtual reality (VR) helps to visualize the spatial relationships between the different elements of the landscape in landscape architecture, allowing the user to feel the designed environment and navigate through it interactively. VR can be used to navigate spaces designed both indoors (inside a building) and outdoors (landscape). In the present research, the perception of the 3D environment during navigation was compared between indoor and outdoor virtual reality environments. The value of the user experience was measured with the Questionnaire on User eXperience in Immersive Virtual Environments, analyzing the presence, engagement, immersion, flow, skill, emotion, usability, technology adoption, judgment and experience consequence subscales. In overall self-reported user experience, results showed that the perception of the environment during navigation was higher in open VR environments than in closed ones. Regarding subscales, the existence of obstacles limits the freedom of movement, which causes a lesser sense of presence. A more fluid VR navigation also generates positive effects on the flow subscale. In outdoor environments, lighting generates shadows, which help in spatial perception and orientation tasks during navigation, which facilitates and increases the perception of immersion. In closed environments, light plays a less important role during navigation.
1. Introduction
Landscape design covers regional planning and architectural space design as well as modifications of buildings and their landscape environment [1]. Landscape design deals with the description, understanding and visualization of spaces (open spaces, surfaces, buildings, volumes, vegetation…) in the landscape or in urban areas [2]. Within landscape design, landscape architecture can be considered as a professional branch focused on the spatial configuration of land and buildings at different scales (from the interior design of small spaces to the design and planning of large urban areas). Due to its professional nature, landscape architecture needs tools to visualize and evaluate the spatial relationships between the different elements of the landscape [3,4].
For the visualization of the landscape, manual and digital systems are used. Manual systems include sketches, schematic diagrams, maps and technical drawings such as section plans [5,6,7]. Since the advent of digital technologies, digital landscape representations have been incorporated such as photomontages, computer models and 2D renders as well as augmented reality (AR) and virtual reality (VR) environments [8,9,10,11].
These last two technologies, augmented and virtual reality, share some common elements. Both have to create digital elements of the landscape, but while in the first one the digital elements are superimposed on reality, in the second the digital elements are the entire environment that we are visualizing. Although the differences between the two are clear, some authors use the terms in such a way that it is not clear whether they refer to AR or VR technologies [12,13]. As a clarification, in this research work, when we talk about virtual reality, we refer specifically to completely digital environments, in which the digital elements are the entire environment that we are visualizing.
Virtual reality is one of the tools that is being used more in landscape architecture [14], and its use in landscape design teaching can improve teaching efficiency [15]. This technology allows the user to visualize the designed environment and navigate through it interactively [16]. In addition, VR can be used to navigate spaces designed both indoors (inside a building) and outdoors (landscape).
Virtual reality is frequently used in the final phases of landscape architecture projects, to visualize their final result. Although the use of VR in the first stages of design is not so common [17,18], virtual reality, which helps understand the spatial concepts of landscape design, can improve the abilities of professionals to find solutions from the early phases of the project [19]. The immersive nature of virtual reality improves the ability to understand complex relationships and gives the designer a great tool to work with in the early stages of the landscape architecture design process, both in large and small projects. In turn, authors such as Gao, Liang and Ling Qiu [20] say that it is necessary to research, in the field of landscape perception studies, whether VR offers a sufficient level of immersion to be an alternative to the experience of a real scene. Another aspect to consider is to study whether virtual reality has specific aspects that can be considered superior or inferior to reality itself for certain uses (entertainment, visualization of inaccessible places, inspiration, critical evaluation, measurement…). Although the physical immersion in the landscape remains one of the key moments in the design of landscape, VR can be an alternative.
In any case, virtual reality, to be effective as a communication element in a landscape design project, must be accepted by the user. This means that the user of this technology must be comfortable with the interface used and feel that the landscape they visualize is valid for the design purpose.
Although virtual environments are considered a powerful tool for learning and communication [21,22], for quite some time now, some authors have proposed that more research in this field (the perception of the VR user) is necessary [22,23,24,25,26,27]. And while virtual reality technologies have come a long way in recent years, it is still an emerging field for research.
In this sense, one of the ways to evaluate the acceptance of this technology is user experience surveys. The User eXperience (UX) definition by the ISO 9241-210 norm is “The user’s perceptions and responses resulting from the use of a system or a service”. Evaluations of VR user experience are based on several factors or components such as presence, engagement, immersion, flow, skill, emotion, motivation, usability, technology adoption, judgment and experience consequence [28].
From the research on user experience of VR in the field of landscape, we highlight some recent research that has worked with some of these components. Sayyad [29] performed a virtual reality experience with head mounted display (HDM) where natural movement was compared with physical movements against the possibility of teleporting around the stage. The presence and preference of the user was measured. The results showed that users preferred natural movements and that teleportation, where the user’s avatar is instantly translated to the destination (discontinuous translation), induced dizziness. The presence value was higher in natural displacements. Regarding dizziness, this effect can appear when the user navigates in a virtual environment. In this sense, authors in the field of VR highlighted the need to study the impact on the health of the user of VR technology [30,31,32]. In another experience, carried out in the Coyoacan area (Mexico City), a desktop VR environment was compared with physical reality [33]. In this work, they displayed Google Street View on a PC screen and compared to the actual visit to the chosen site. Three User eXperience components were analyzed: sense of presence, immersion and flow, which were measured with a specific questionnaire for each of them. The study concluded that the virtual one, even in the case of only needing to obtain relevant information from the environment, could not replace the real experience. Another work on the use of Google Street View with virtual reality through HDM devices confirmed the improvement in user motivation for learning [34].
User experiences of different virtual reality interfaces have also been compared. For example, Kim and Rhiu [35] designed a flat terrain that was explored through three different interfaces for navigation in virtual environments: natural movements (walking-in-place), joystick and teleportation. Sense of presence, engagement, usability and motion sickness were measured, among other variables. It was considered that natural movement can produce cognitive dissonance and that its safety must be increased. The joystick had advantages because it was a familiar interface to the participants and teleportation was considered appropriate only when the task to be performed is not important. The study was performed in a VR flat terrain environment, an issue that appears as a limitation of the study in the conclusions. Therefore, as future work, they proposed the need to work while navigating in different environments, both outdoors (areas with relief, hills, etc.) and indoors (where there are doors, stairs, etc.). The present research is related to this proposal, since it explores the user experience in different navigation environments (outdoor and indoor), comparing the user experience in both outdoor and indoor virtual environments.
Indoor landscapes usually include elements such as enclosed rooms, stairs and doorways while outdoor landscapes include different geographical features such as mountains, hills, lakes and open spaces that can modify the user experience when using virtual reality. Different authors have studied this indoor/outdoor environments approach, although with augmented reality instead of virtual reality. For example, Livingston [36] studied the sensation of depth of an augmented reality application in indoor and outdoor environments. Other studies with augmented and virtual reality only take into account outdoor landscapes [12] or indoor landscapes used to improve the aesthetic design of homes [37] or analyze the response to a fire evacuation in buildings [38].
However, no references to comparative studies of user experience in indoor/outdoor environments using virtual reality have been found. That is why it is considered an interesting field of study and we propose in this work to obtain some preliminary results of this comparison. To do this, the Dehaes research group https://portalciencia.ull.es/grupos/6472/detalle (accessed on 5 January 2023) from the University of La Laguna, which covers the areas of engineering and architecture, has taken advantage of the fact that different desktop VR environments have been carried out in previous studies for landscape design teaching. The objectives of these works were to measure the motivation and development of the spatial skills of the participants, in addition to determining the user experience in these environments. The use of graphic engineering tools together with the use of game engines, such as Unity3D or Unreal, allows the visualization of landscapes through virtual reality [39,40,41,42]. This way of working allows the generation of virtual environments that serve as the basis for the first stages of a landscape design project.
In two of the previous studies carried out by the Dehaes research group, work has been done with both indoor and outdoor virtual reality environments. In the indoor environment, a navigation experience was carried out in a building of the Universidad de la Laguna [43] while, in the outdoor environment, the experience was carried out in an open space, the beach of Las Teresitas, from Tenerife [44]. In the indoor VR environment, the impact of navigation in an indoor environment on the spatial orientation skill of the participants was studied. In the outdoor VR environment, the user’s response and the impact on students’ motivation were analyzed. That is, although indoor and outdoor VR environments were studied, the same measurement tools were not used to determine the user’s response. Therefore, it is necessary to carry out research that studies if there are differences in the user’s perception in indoor and outdoor virtual environments, using the same measurement tool, in order to compare the results.
Thus, in the present research, a user experience comparison between indoor and outdoor virtual reality environments was performed. For this purpose, two workshops were carried out with the same group of participants. The value of the user experience (the perception of the 3D environment during navigation) was measured with the same measurement tool in both workshops, the Questionnaire on User eXperience in Immersive Virtual Environments (QUXiVE) [45,46].
Therefore, the objective of this work is to study the differences in VR user experience in indoor/outdoor environments. The findings and implications resulting from this work may help to optimize the designs of indoor and outdoor environments to improve the user experience.
2. VR and Game Engines for Landscape Design
As mentioned, one of the traditional tools for landscape design is maps. When visualizing a map, it is necessary for the professional to have technical knowledge to perceive the three-dimensional reality of the topographic relief in the two-dimensional environment. Punia and Kundu stated that “not everyone can read maps or mentally reconstruct a 3D landscape from a 2D map image” [47]. In addition, maps, widely used to visualize 2D terrain [48], can also combine geospatial information in multiple views (profile views, elevations, thematic data, etc.). However, the use of maps requires an additional effort to associate it with reality [49].
Currently, the appearance of three-dimensional representation technologies can facilitate the visualization tasks of the landscape environment. In particular, technologies such as virtual reality (VR) can help landscape design professionals visualize their projects. Virtual reality allows 3D geometric representations that do not require the use of multiple views, since the user can see plan, elevation or even geospatial information at the same time, and therefore facilitates the interpretation of said representation. Virtual reality offers different degrees of immersion depending on the technology chosen for its visualization. It can be high immersive using virtual reality glasses (head mounted display, HMD VR) or low immersive using a conventional computer with a monitor (desktop VR). However, virtual reality is a digital technology that requires several technological requirements for its correct operation. Among these requirements is the degree of realism of the digital representations of the landscape. There are different methodologies to measure the degree of realism. For example, in CAD environments (Revit) the parameter “level of detail (LOD)” is used. In 3D animation, a determining factor is the number of polygons in the 3D mesh. In the field of video games, the use of textures, lighting and shadows determines the level of realism of the product, as in the case study carried out in this research, in which the workshops have been carried out with a game engine type tool.
Some authors reflect on the degree of realism of the 3D simulation. Griffon [50] indicates that it is important to define the appropriate degree of realism, since photorealism can be negative when it does not fit the real world. On the other hand, Portman [51] questions the degree of realism and indicates that totally real representations are not essential for landscape design. Shin et al. [52] highlight the effect that the realistic 3D visualization of terrains has on the user’s immersion in the virtual environment. From a practical point of view, there is no consensus on how much degree of realism is adequate. In addition to the visual or material aspects, it would be interesting to incorporate landscape elements such as wind, atmosphere, changes in light, ground texture and smells. These elements are fundamental to landscape design although with current VR desktop technology they are complex to implement since they need specific hardware. For example, to perceive non-material elements, such as tactile textures or vibrations, haptic devices such as gloves or vests are used.
Regarding the creation of virtual environments, in recent years, research into technological tools for geovisualization, navigation and 3D landscape modeling has increased [53,54]. For these purposes, 3D engineering systems, such as Geographic Information Systems/Computer-Aided-Design/Building Information Modeling (GIS/CAD/BIM), have been frequently used. However, authors such as Purnia and Kundu [47] considered that these visualization and 3D representation techniques required expensive software and specific learning, and highlighted the need to find a faster and easier method. Because of this, game engine technology can be an alternative tool for the creation of applications in virtual environments, as they are cheap and easy to use [55]. A game engine is “a computer game software that contains a 3D graphical representation and representations of physical laws”. There are several game engines such as Unity 3D https://unity.com/es (accessed on 10 November 2022), which is the one used in this investigation, Unreal Engine https://www.unrealengine.com/en-US/, (accessed on 10 November 2022), Godot Engine https://godotengine.org/, (accessed on 10 November 2022) or Roblox Studio https://www.roblox.com/create (accessed on 10 November 2022), to name the most popular.
The visual appearance of a landscape is defined by, among other components, the terrain, vegetation, water, light and built structures [9]. All of these items can be created using game engines. The realistic geographical representation of the environment created by video game engines can be used for more serious purposes, such as research and decision-making in landscape planning. As previously mentioned, one of the factors that affect the virtual representation is the degree of realism. Some authors have affirmed that it is important to define the appropriate degree of realism since photorealism can become negative [50]. Williams [56] highlighted the need to measure realism in video game environments. On the other hand, Portman [51] said that a real representation is not essential for landscape design. In this sense, Shiratuddin and Thabet [57] highlighted the possibilities offered by game engines regarding degree of realism in factors such as simulation of different lighting conditions, interaction, rain creation and collision detection, among others. Given their versatility for creating indoor and outdoor VR environments with different levels of realism, game engines are considered as an alternative for interactive 3D geovisualization and navigation tasks [58], which are frequently used in landscape projects.
In virtual reality, users can feel the space by adjusting their perspective and movement (navigation) in the virtual environment. In virtual reality, the visual design is important, but it is also important that the user can move freely through the designed landscape [59,60]. Authors such as Santos et al. [61] stated that navigation is one of the central tasks in virtual environments. In landscape design, it is common to walk through the virtual reality environment to visualize an environment from different orientations, in which the user must have a great sense of presence and immersion. Getting the feeling of presence and immersion is one of the challenges of designing virtual reality environments. Although presence and immersion may seem synonymous, they are not. The sense of presence is a characteristic of virtual reality technology. Presence is defined as the feeling of belonging in the VR world or, in other words, it is related to how much the user feels that the VR is real [62,63]. Presence creates in the participant a sense of immersion (“the perception of being involved, included, and interacting with an environment that provides a continuous flow of stimuli and experiences”) [64]. When people using the VR system can “feel” the virtual environment as “real”, the experience will be positive and therefore the designed environment will be valid to visualize the shape of a landscape. When using different VR technology systems, it is possible to obtain different levels of immersion. The result will depend on the level of realism of the environment and the interface used to manage the system. In this sense, haptic devices can increase the sensation of presence and immersion, by including not only visual aspects but also tactile, smell and vibrations, among others. In this way, VR environments can be classified into high immersion environments and low immersion desktop environments. On the other hand, there are authors who include another category: semi-immersion. This category is very similar to low immersion systems, but works through high resolution projections or larger screens [65]. In this research, semi-immersive systems are not considered.
To obtain highly immersive VR systems, hardware such as HMDs are commonly used, since they completely occupy the field of vision of the person participating in the experience. In addition to the visual aspects, other elements such as sounds, vibrations or tactile textures can be added to the environment in such a way that the user can interact with the system through the use of specific interfaces (gloves with sensors, joystick with vibration or suits with pressure levels). However, low-immersion desktop VR systems only require a conventional computer (consisting of a keyboard, mouse and monitor) to interact with the landscape rendered on the screen. In conclusion, highly immersive environments are perceived as part of the person, since by moving the body or turning the head, the digital environment reacts in the same way as a real environment. On the other hand, low immersion environments are not connected to the user’s body [65,66,67].
3. Materials and Methods
In the present research, we have used the Unity 3D game engine for two workshops (outdoor and indoor) in a low-immersive VR environment (2D screen desktop visualization). The reason for choosing a desktop VR environment was to avoid the risk of possible contagion when sharing virtual reality glasses during the Covid19 pandemic, since these workshops were held in the beginning of the 2021–2022 academic year. In addition, in the initial phases of a landscape project, the use of VR desktop environments is more frequent, while VR environments with virtual reality glasses are more suitable for the final phases, to visualize the final result.
The outdoor workshop was carried out taking Las Teresitas beach, in Santa Cruz de Tenerife, as the geographical area. The height map used in the outdoor workshop has been obtained from the Geoportal of the National Geographic Institute of Spain. The indoor workshop was the Building Engineering Faculty of the University of La Laguna, created from an AutoCAD model provided by the Technical Office of the University.
The tool to measure user experience in an immersive virtual environment was the Questionnaire on User eXperience in Immersive Virtual Environments (QUXiVE) [45,46] in a 10-point Likert-type scale.
3.1. Unity 3D Game Engine
Unity 3D under a free personal license has been used in this paper. This software is a cross-platform game engine (Windows, Mac and Linux) for creating 2D and 3D games, but it can also be used for other purposes, such as simulations, designs of landscapes, and landscape assessment and planning [68,69]. Unity 3D allows applications to be generated for different visualization modes such as virtual reality and/or augmented reality.
Unity 3D allows you to graphically represent landscapes in real time, offering, among other options, a first-person perspective that favors the feeling of presence, that is, similar to being there. In game engines, this perspective is called FPC (first person controller). The user walks the terrain in a natural way, advancing, going back, and going up and down it. Unity 3D also allows the incorporation of different sunlight conditions, different landscape textures, architectural constructions, vegetation, trees, rivers, lakes, etc., as well as phenomena such as rain or wind, to name a few. It is important to note that Unity 3D also allows the generation of different sunlight conditions and shading. Recent studies on outdoor VR environments have studied the utility of sunlight conditions and shading, which help the orientation and perception of the environment by the user [44]. All these features, if added, result in a representation of a landscape environment in a very realistic way. Other elements that would contribute to realism, such as wind, atmosphere, changes in light, ground texture and smells, are complex to implement.
However, it is also possible to create a basic environment without as many textures or effects, which can be very appropriate for a conceptual design in the early stages of a landscape design project. Regarding textures, Azarby and Rice [70] concluded in a recent study that the textures had a positive and significant impact on spatial design decisions when using desktop VR environments, but did not have a significant impact in VR environments with head mounted display.
Unity 3D system requirements are Windows 7 or higher and 64-bit versions only; macOS 10.12+; and Linux fixed on Ubuntu 16.04, 18.04 and CentOS 7. Regarding the GPU (graphics processing unit): graphics card with DX10 capabilities or higher (shader model 4.0). The participants used their own computers to conduct the two workshops. If any computer did not meet the requirements, the instructor provided a university computer to the student, although this did not occur in this case.
3.2. Data Sources and Instructions for Indoor–Outdoor Workshop Design
The Geoportal of the National Geographic Information Center of Spain was used as a data source to obtain topographic information (height map) for the outdoor workshop http://centrodedescargas.cnig.es/CentroDescargas/locale?request_locale=es (accessed on 21 October 2022). In this geoportal, terrain height maps with a 5m grid can be downloaded for further processing with Unity 3D. The geographic reference system is REGCAN95 (Canary Islands), compatible with WGS84.
Unity 3D includes the “terrain” menu with which the user can design terrains starting from flat geometric shapes. It has tools to raise or lower terrain, paint texture, set height, smooth height, and stamp terrain, among other options. However, in landscape design, it is common to start working with an existing real terrain; therefore, the program must allow real terrain to be imported. To do this, the Unity terrain configuration menu is used, which allows the import of height maps. There are open-source websites where you can download these height maps in PNG format, albeit with low resolution. To achieve better resolutions, the geoportal of the National Geographic Information Center of Spain was used, where it is possible to obtain height maps with a 5 m mesh resolution. This height map is a digital file with an ASC extension. Using free web applications like “Heightmap Maker” or QGIS, we convert the ASC format of the heightmap to RAW format for import from Unity 3D (Figure 1).
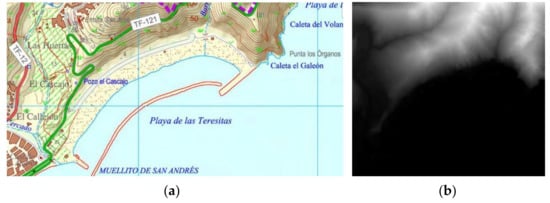
Figure 1.
Original contour lines map of Las Teresitas beach (a) and height map (b).
Once the Las Teresitas beach terrain file has been imported into Unity 3D, it is possible through the “paint texture” editing option to assign different textures to the terrain. The user, using the Asset Store, has access to multiple textures and objects typical of landscape design, for example, textures of rocky soils, grassy soils, muddy soils, etc.… or 3D models of trees, palm trees, bushes, etc. In addition, the figure of a policeman who goes to the position in which the user is located has been added to the environment. In this way, a fun touch is added and, furthermore, it could be interesting to detect the possible effect in the user VR experience caused by its presence. This virtual landscape environment is freely available at http://playa.joseluissaorin.com (accessed on 10 November 2022) (Figure 2).
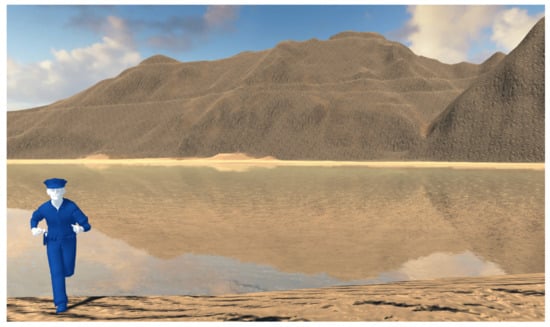
Figure 2.
Las Teresitas beach landscape environment created with Unity 3D: http://playa.joseluissaorin.com accessed on 18 November 2022.
On the other hand, for the creation of the virtual environment in the indoor workshop, we had 2D engineering drawings in AutoCAD from the Faculty of Building Engineering of the University of La Laguna, provided by the Technical Office of the University. From these 2D floor drawings (Figure 3a) in AutoCAD, 3D models (Figure 3b) were created using the Autodesk REVIT 2022 Building Information Modeling (BIM) application (free educational license). The BIM model was made including the plot, a fence to delimit its limits and the basic furniture of some of the building’s rooms. Textures were included on the walls and on the window panes (Figure 4). BIM designs can be exported to game engines such as Unity 3D for real-time walkthroughs. In this way, the design of an architectural space can be visualized in a faster and more realistic way than with conventional 2D floor drawings [34,46,71,72,73,74,75].
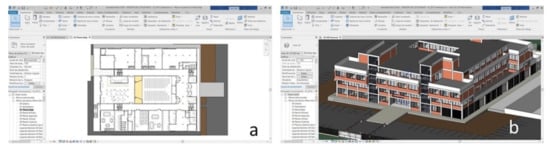
Figure 3.
Building Engineering Faculty of the University of La Laguna 2D (a) and 3D (b) models, performed with Autodesk REVIT by the authors.
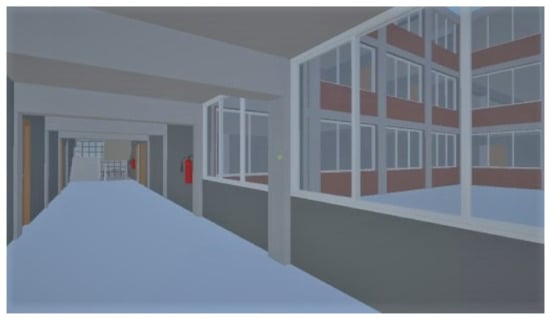
Figure 4.
Building Engineering Faculty of the University of La Laguna created with Unity 3D: http://playa.joseluissaorin.com accessed on 18 November 2022.
The procedure to export a BIM file to Unity 3D is as follows. First, the Vision WorkPlace “FBX Converter for Autodesk REVIT” 2022 software was used, which can be downloaded from the Autodesk App Store. This software is used to maintain the textures of the materials of the BIM model (in order, for example, to maintain the transparency of the windows of the created model). Second, the created FBX file was directly imported into Unity 3D. In this way, the 3D model organized by components (walls, doors, windows, floors, etc.) is accessed in Unity. We can easily select the components that we want to respond to collisions in order to use a first person controller (FPS) that allows us to digitally walk through the entire environment. All the interior doors of the building were placed without colliders to simplify the routes. The created VR building engineering environment Figure 4 is freely available at http://aparejadores.joseluissaorin.com (accessed on 18 November 2022). This video shows a brief tour of the virtual environment: https://acortar.link/e7kYt (accessed on 18 November 2022).
The created VR model was made with the intention of using it with Oculus Quest 2 virtual reality glasses. This device, due to its mobile design, has limitations regarding the sizes of the 3D models that it can handle. Therefore, many details and realistic effects such as different textures, colors or lighting, among others, were not included to facilitate its visualization. In addition, by using the model made with an architectural design CAD program (Autodesk REVIT 2022) as a starting point, not many textures or lights were used, beyond the definition of basic materials for windows, walls and floors that are included in this CAD application. The objective was not to make a realistic 3D model of the building, but rather an operational 3D model that, taking the architectural design as a starting point, would allow its interior to be explored. In order to carry out the workshops with a high number of participants (only three Oculus Quest (VR-HMD) were available), and to avoid contagion as we have previously commented, the use of these devices was ruled out and finally the workshop was carried out in a VR desktop environment consisting of a computer, keyboard and mouse.
3.3. Questionnaire on User eXperience in Immersive Virtual Environments
The tool used to determine user experience in a virtual environment is the Questionnaire on User Experience in Immersive Virtual Environments (QUXiVE). According to ISO 9241-210, User eXperience (UX) is defined as “User perceptions and responses resulting from the use of a system or service”. This standardized questionnaire has been validated by Tcha-Tokey et al. [45,46] and includes 10 components/subscales such as presence, engagement, immersion, etc. The User eXperience Questionnaire in Immersive Virtual Environments (QUXiVE) has been developed using a selection of components from different existing standardized tests to measure each of the ten subscales of the test. The authors indicate that it should be adapted to each practical case. For this research, we have selected 9 of the 10 subscales of the original questionnaire (Table 1).

Table 1.
Items of the Questionnaire on User eXperience in Immersive Virtual Environments considered in the present research.
The component not considered in this study is skill, which is defined as the knowledge the user gains in mastering his activity in the virtual environment. It is used to evaluate students’ computer skills. Our study is more focused on user perception than on measuring students’ computer skills. For this reason, it has not been considered in the present research.
Therefore, the questionnaire used in this research, adapted from the original QUXiVE, is made up of 79 items on a Likert-type scale of 10 and three open questions in which the user is asked about their experience in the virtual environment.
3.4. Participants
A total of 35 first-year students of the engineering degree of La Laguna University carried out the two workshops. Participants were asked if they had any previous experience with immersive technologies. None of the students had prior experience with these types of 3D viewing environments.
3.5. Procedure
The outdoor and indoor workshops were conducted with low-immersive VR desktop environments, in which each participant used their own personal computer. Participants were given an instruction document detailing the specific task for taking a tour within each environment. In this way, it is intended that all participants take similar tours in virtual reality environments, in such a way that their experiences are comparable.
The two workshops were performed over a period of three weeks (Table 2). They were divided into three phases: instruction, navigation tasks and questionnaire.
Table 2.
Workshop structure.
Phase 1. Instruction. 2 h.
There are two main parts of this phase. In the first one (1 h), the participants were taught how to get the data sources and how to create the outdoor/indoor 3D environments from the data obtained and Unity 3D. The objective was not to learn the complete operation of the game engine but to understand the process of designing outdoor and indoor 3D environments with this tool. The participants received introductory training on the terrain options, as well as the use of standard assets and the Unity Asset Store to incorporate design elements.
The second part (1 h) of this phase was basic training on how to operate with the FPS to navigate and interact with the 3D environment. The FPS controller is handled as follows: A key to move to the left, W key to go forward, D key to the right, S key to go back. Pressing the shift key with any of the previous movement keys increases the speed of the environment display. The movement of the mouse reproduces the movement of the head, thus allowing us to obtain a 360° image of the environment.
For the outdoor workshop, the second and third phases were as follows:
Phase 2. Outdoor workshop: Navigation Tasks. 2 h.
Once inside the landscape environment, the students had to perform specific tasks following the instructions document. For this objective, seven tasks were proposed to the participants. These tasks are described in detail in the research carried out by Carbonell-Carrera et al. [44] and include, among other things, moving around the environment, moving the head to see the 360° landscape, going to the jetty, walking towards the mountains, etc. Users are also told that, as landscapers, they have to project an intervention on Las Teresitas beach, for which they can plant trees, use different types of textures, install urban furniture, paths for bathers, etc.
Phase 3: Questionnaire. 1 h 30 min.
Students responded to the Questionnaire on User eXperience in Immersive Virtual Environments [45,46]. This questionnaire was answered within the virtual teaching environment (virtual classroom).
For the indoor workshop, the second and third phases were as follows:
Phase 2. Indoor workshop: Navigation Tasks. 2 h.
Once inside the indoor environment, students were required to perform specific tasks by following the instruction document. For this objective, 6 tasks were proposed. These tasks are described in detail in the research carried out by Carbonell-Carrera et al. [43]. To achieve these objectives, they had to follow different proposed routes (visit the auditorium, the cafeteria, etc.) and visualize certain details of the virtual environment (glass blocks, buttons on the keyboard of the vending machine, number of steps of the staircase, etc.) which allowed the instructors to verify if the participant reached the proposed places.
Phase 3: Questionnaire. 1 h 30 min.
Students responded to the Questionnaire on User eXperience in Immersive Virtual Environments [45,46]. This questionnaire was answered within the virtual teaching environment (virtual classroom).
4. Results
The results obtained in the Questionnaire on User eXperience in Immersive Virtual Environments are presented in the following tables.
Results of the Questionnaire on User eXperience in Immersive Virtual Environments
The reliability of the Questionnaire on User eXperience in Immersive Virtual Environments has been verified with Cronbach’s alpha. The scale for the interpretation of Cronbach’s alpha values, according to George and Mallery [83] are: >0.9 excellent; >0.8 good; 0.7 acceptable; 0.6 questionable; and >0.5 poor. The reliability of the result obtained in the present research is excellent for Indoor workshop (0.91) and good for Outdoor workshop (0.86), according to this scale.
Regarding overall differences between the indoor and outdoor workshops on the entire QUXiVE scale, participants in the outdoor workshop gave a mean value of 5.98 (SD = 0.64) and in the indoor workshop a mean value of 5.58 (SD = 0.80). The difference in overall ratings between the two workshops was statistically significant t(34) = 3.70, p < 0.001, d = 0.63.
Regarding each of the nine subscales of the QUXiVE, differences between the two workshops were examined. In cases where there were overall subscale differences between the two workshops, follow-up item level analyses were conducted. The results were:
Subscale Presence. Outdoor workshop: (M = 7.86, SD = 1.08). Indoor workshop: (M = 7.47, SD = 1.43) (Table 3).
Table 3.
Questionnaire on User eXperience in Immersive Virtual Environments: presence subscale.
Subscale Engagement. Outdoor workshop: (M = 7.75, SD = 1.39). Indoor workshop: (M = 7.34, SD = 1.97) (Table 4).
Table 4.
Questionnaire on User eXperience in Immersive Virtual Environments: Engagement subscale.
Subscale Immersion. Outdoor workshop: (M = 5.62, SD = 1.97). Indoor workshop: (M = 4.59, SD = 1.62) (Table 5).
Table 5.
Questionnaire on User eXperience in Immersive Virtual Environments: immersion subscale.
Subscale Flow. Outdoor workshop: (M = 6.37, SD = 1.24). Indoor workshop: (M = 5.54, SD = 1.50) (Table 6).
Table 6.
Questionnaire on User eXperience in Immersive Virtual Environments: flow subscale.
Subscale Usability. Outdoor workshop: (M = 5.19, SD = 1.33). Indoor workshop: (M = 5.36, SD = 1.38) (Table 7).
Table 7.
Questionnaire on User experience in Immersive Virtual Environments: usability subscale.
Subscale Emotion. Outdoor workshop: (M = 4.37, SD = 1.29). Indoor workshop: (M = 3.93, SD = 1.36) (Table 8).
Table 8.
Questionnaire on User experience in Immersive Virtual Environments: emotion subscale.
Subscale Judgment. Outdoor workshop: (M = 6.92, SD = 1.07). Indoor workshop: (M = 6.92, SD = 1.39) (Table 9).
Table 9.
Questionnaire on User experience in Immersive Virtual Environments: judgment subscale.
Subscale Experience Consequence. Outdoor workshop: (M = 2.23, SD = 2.08). Indoor workshop: (M = 2.14, SD = 2.05) (Table 10).
Table 10.
Questionnaire on User experience in Immersive Virtual Environments: experience consequence subscale.
Subscale Technology Adoption: Outdoor workshop: (M = 6.87, SD = 1.00). Indoor workshop: (M = 6.67, SD = 1.00) (Table 11).
Table 11.
Questionnaire on User experience in Immersive Virtual Environments: technology adoption subscale.
5. Discussion
A paired samples t-test indicated that there was a significant difference in overall self-reported user experience between the two workshops with participants reporting greater levels of user experience in the outdoor workshop (M = 5.98, SD = 0.64) than the indoor workshop (M = 5.58, SD = 0.80), t(34) = 3.70, p < 0.001, d = 0.63. The difference between the two environments was statistically significant, but it was necessary to interpret the result, not from a global perspective, but by analyzing the results of each subscale. In this way, the conclusions will be less general and will make it possible to focus the perception of the user in each environment with greater precision, by having results that analyze nine subscales for each environment.
A discussion of the results follows, focusing on those subscales in which statistically significant differences have appeared. Analyzing by subscale, after the completion of the two workshops, there were statistically significant differences in the presence, immersion, flow and emotion subscales. No statically significant differences were found in engagement, usability, judgment, experience consequence and technology adoption subscales.
Subscale Presence. The presence subscale assessed the user’s ‘sense of being there’ in the virtual environment. A paired samples t-test indicated that participants reported higher levels of presence in the outdoor workshop (M = 7.86, SD = 1.08) than the indoor workshop (M = 7.36, SD = 1.43), t(34) = 2.37, p < 0.03, d = 0.40. That is, the sense of being there is greater in the virtual environment outside than inside.
Because there were overall differences on the sub-scale, item-level analyses were also conducted. As shown in Table 3, participants gave significantly higher presence ratings in the outdoor workshop compared to the indoor workshop on items 4, 5 and 7. That is, the participants were able to actively inspect the outdoor environment better than the indoor one (item 4), and were also able to examine objects up close (item 5), and moved and interacted (item 7), better in the external environment than in the internal.
These items of the presence subscale are related to the user’s perception of movement within the virtual environment, which users perceive by adjusting their perspective while navigating. The results showed that the sensation of presence was greater in outdoor environments than in indoor environments. In the indoor environment, the user encountered obstacles (doors, stairs…) that made navigation somewhat difficult. In the outdoor environment the movement occurs in an uninterrupted, more natural way. In this sense, previous works already highlighted that, in virtual reality, the visual design is important but it is also important that the user can move freely through the designed landscape [59,60].
Subscale Engagement. The engagement subscale assessed users’ “…energy in action, the connection between a person and its activity consisting of a behavioral, emotional, and cognitive form.” A paired samples t-test indicated that there was no difference in self-reported engagement between the outdoor (M = 7.75, SD = 1.39) and indoor workshops (M = 7.34, SD = 1.97), t(34) = 1.40, p = 0.17, d = 0.24. Further, there were no differences between the two workshops on any engagement subscale item (Table 4).
Subscale Immersion. The immersion subscale assessed users’ “…illusion that the virtual environment technology replaces the user’s sensory stimuli by the virtual sensory stimuli.” In other words, the immersion component analyzes the extent to which VR technology is capable of offering an inclusive, enveloping and vivid illusion of reality to the user’s senses [84]. A paired samples t-test showed that participants reported higher levels of immersion in the outdoor workshop (M = 5.62, SD = 1.97) than the indoor workshop (M = 4.59, SD = 1.62), t(34) = 3,54, p < 0.001, d = 0.60. Because there were overall differences on the sub-scale, item-level analyses were also conducted. As shown in Table 5, participants gave significantly higher immersion ratings in the outdoor workshop compared to the indoor workshop on items 1, 4, 6 and 7.
Items 1, 4 and 7 study the level of immersion from the point of being involved in the virtual environment. Participants felt more immersed in the VR outdoor environment than in the indoor virtual environment. The VR outdoor environment was a beach, and the indoor was the interior of a building. That is to say, the exterior VR represented a terrain, and the participants felt more immersed in the terrain than inside a building. Closed environments tend to feel more labyrinthine. This is in line with what was stated previously by Shin et al. [52], who studied the positive effect that the realistic 3D visualization of terrains has on the user’s immersion in the virtual environment.
Studying the differences between the two workshops we observed the different lighting and textures of each of them, which are related with the degree of realism. A determining factor in the realistic effect of a virtual environment is lighting [57]. In the workshops carried out in this research, the outdoor VR environment was a beach where the lighting was sunlight (daylight), and the user could see shadows while navigating the environment. Also, in the mountains, shadows appeared due to the effect of the position of the sun. The indoor VR environment graphically represented the interior of a building and the light was the one that entered through the windows. The shadows that occur in an indoor environment do not help the perception of space as much as those that occur in an outdoor environment. Recent studies have shown the positive influence of shadows on the perception of space in desktop VR outdoor environments, as they guide the user within that environment and help them perceive the space around them while navigating [44]. Users experienced a greater sense of immersion in an open space, which is consistent with findings by Hegazy, Tasufuku and Abe [85], who found greater user acceptance of VR in areas with ample daylight. Another difference between the two workshops was the textures. The textures of the materials that appeared in outdoor VR were water, beach sand and mountains. On the other hand, in indoor VR, the textures of the walls, stairs, etc. were flat colors and there were no textures. In this field, in recent research, the impacts of VR in spatial design decisions were studied from the point of view of the immersion of the user [70]. They concluded that the presence of textures impacted on spatial perceptions and, also, on spatial design decisions.
In item 6 “I got scared by something happening in the virtual environment” there was a significant difference between the two environments. This is because in the outdoor VR environment, as described above, there was a policeman chasing the user, and in the indoor one there was not. This may have generated this difference with such a high level of significance (p < 0.001), having scared the participant at some point. In this sense, given the level of immersion generated by VR technology, it is necessary to carry out studies on the impact on the user’s health [30,31,32]. In addition to dizziness, in this case, for example, the user can suddenly be frightened by seeing a policeman always chasing her or him.
Subscale Flow. The flow subscale assessed users’ feelings of “a pleasant psychological state of sense of control, fun and joy” when interacting with the virtual environment. A paired samples t-test indicated that participants reported higher levels of flow in the outdoor workshop (M = 6.37, SD = 1.24) than the indoor workshop (M = 5.54, SD = 1.50), t(34) = 3.78, p < 0.001, d = 0.64. Because there were overall differences on the sub-scale, item-level analyses were also conducted. As shown in Table 6, participants gave significantly higher flow ratings in the outdoor workshop compared to the indoor workshop on items 2, 3, 4, 6, 8, 10 and 11.
Recent studies on VR have highlighted the importance of knowing what produces flow experience and how it can be amplified [35]. Students reported higher levels of flow in the outdoor workshop than the indoor workshop. Based on these results, the participants felt a greater sense of control, fun and joy in the outdoor than in an indoor VR environment. Movement during navigation in outdoor VR was more fluid. As we have previously commented, navigating in the outdoor environment was more natural than in the indoor environment, since the participants did not run into obstacles such as walls, doors or furniture. Again, it is necessary to highlight what was stated by [59,60] on the importance of movement within the virtual environment. The more similar the navigation in a virtual environment is to real movement (as happened in the outdoor VR environment), the greater the sensation of flow will be.
Subscale Usability. The usability subscale assessed participants’ feeling of ease of learning (learnability and memorizing) and the ease of using (efficiency, effectiveness and satisfaction) the virtual environment. A paired samples t-test indicated that there was no difference in self-reported usability between the outdoor (M = 5.19, SD = 1.33) and indoor workshops (M = 5.36, SD = 1.38), t(34) = 0.56, p = 0.58, d = −0.09. Further, there were no differences between the two workshops on any usability subscale item (Table 7).
Subscale Emotion. The emotion subscale assessed participants feelings (of joy, pleasure, satisfaction, frustration, disappointment, anxiety, etc.) in the virtual environment. A paired samples t-test indicated that participants reported higher levels of emotion in the outdoor workshop (M = 4.37, SD = 1.29) than the indoor workshop (M = 3.93, SD = 1.36), t(34) = 2.84, p < 0.01, d = 0.48. Because there were overall differences on the sub-scale, item-level analyses were also conducted. As shown in Table 8, participants gave significantly higher emotion ratings in the outdoor workshop compared to the indoor workshop on items 6 and 12.
In this subscale they only found significant differences in two of the 15 items that comprise it. In item 6 (6. “I got scared that I might do something wrong”), the result is like item 6 of the engagement subscale (“I got scared by something happening in the virtual environment”), where there were statistically significant differences as well. The two items are very similar and there is a higher score in both cases in the outdoor VR environment than in the indoor VR environment, in which we remember that there was a policeman always following the participant’s movements. On the other hand, it seems that the participants’ perception of the passage of time is that it was slower in the outdoor VR environment than in the indoor VR environment.
Subscale Judgment. The judgment subscale assessed participants’ overall judgment of the experience in the virtual environment. A paired samples t-test indicated that there was no difference in self-reported judgment between the outdoor (M = 6.92, SD = 1.07) and indoor workshops (M = 6.92, SD = 1.39), t(34) = 0.00, ns (Table 9).
Subscale Experience Consequence. The experience consequence subscale assessed the level to which participants experienced symptoms (e.g., “simulator sickness”, stress, dizziness, headache, etc.) while in the virtual environment. A paired samples t-test indicated that there was no difference in self-reported experience consequences between the outdoor (M = 2.23, SD = 2.08) and indoor workshops (M = 2.14, SD = 2.05), t(34) = 0.69, p = 0.49, d = 0.11. Further, there were no differences between the two workshops on any experience consequence subscale item (Table 10).
Subscale Technology Adoption: The technology adoption subscale assessed participants’ actions and decisions regarding future use or the intention to use the virtual environment. A paired samples t-test indicated that there was no difference in self-reported technology adoption intentions between the outdoor (M = 6.87, SD = 1.00) and indoor workshops (M = 6.67, SD = 1.00), t(34) = 1.22, p = 0.23, d = 0.21. Further, there were no differences between the two workshops on any technology adoption subscale item (Table 11).
6. Conclusions
A total of 35 first-year students of an engineering degree program from La Laguna University carried out two workshops using two desktop VR environments. The first one was an outdoor environment located on a beach, in Las Teresitas beach, in Santa Cruz de Tenerife. The second one was an interior architectural environment, the Building Engineering Faculty of the University of La Laguna. In each workshop, the participants performed navigation tasks in each of the environments. Navigation tasks are among the most common tasks in the design and project fields. The perception of the students during navigation in each VR desktop environment (indoor and outdoor) was measured with the User eXperience in Immersive Virtual Environments (QUXiVE) [45,46].
A paired samples t-test showed that there was a significant difference in overall self-reported user experience between the two workshops with participants reporting greater levels of user experience in the outdoor workshop than the indoor workshop. That is to say, the perception of the environment during navigation was higher in open desktop VR environments than in closed ones. To further interpret this result, it has been studied in which of the nine subscales of the User eXperience in Immersive Virtual Environments (QUXiVE) statistically significant differences were found. Differences have been found in the presence, immersion, flow and emotion subscales. In these subscales, in the workshops carried out in this research, there were significantly higher scores in open VR environments than in indoor ones.
Regarding the presence subscale (user’s perception of movement within the virtual environment, which users perceive by adjusting their perspective while navigating), the smoother the navigation within the VR environment, the better a sense of presence is generated. The existence of obstacles limits the freedom of movement, and this causes a lesser sense of presence. Open environments (landscape environments) therefore offer a greater sense of presence. Closed environments (such as the interior of a building), due to their very nature, have numerous obstacles (stairs, partitions, doors) that make navigation somewhat difficult and, therefore, diminish the sensation of presence. A more fluid and natural navigation within the virtual environment also generates positive effects on the flow component.
The feeling of immersion is a determining factor when it comes to virtual environments. Previous research has shown the positive immersive effect of open environments (terrains, landscapes) are greater than in closed environments [52]. Factors such as lighting play an important role in navigation tasks within the environment. In outdoor environments, lighting (daylight) generates shadows, which help in space perception and orientation tasks within the VR environment during navigation [44], which facilitates and increases the perception of immersion. In closed environments, light does not have such a fundamental role for navigation within the environment.
The scores obtained within the immersion subscale on the generation of anguish, fright or fear in the user was low (below 4 on the 1–10 Likert scale in both workshops). But within this low score, in one of the workshops carried out the results showed that this happened more than in the other, since something that happened in the VR environment scared the users. Something similar occurred in the emotion subscale, since the participants responded in the same way to two items related to the feeling of fear within the virtual environment. There are also other factors related to the health of the user of virtual environments, such as dizziness, caused by the sensation of immersion. It is necessary, as future work, to deepen the study of immersion in VR environments to minimize the possible harmful effects that it could cause.
Once this comparative study has been completed, the question arises as to what would have happened in high-immersive VR indoor and outdoor environments. In the present research, the reason for choosing a desktop VR environment was to avoid the risk of possible contagion when sharing virtual reality glasses during the Covid19 pandemic, since these workshops were held in the beginning of the 2021–2022 academic year. Although, in the initial phases of a landscape project, the use of VR desktop environments is more frequent than high-immersive environments, to visualize the impact of a landscape project it may be more suitable to use the latter. In these high-immersive VR systems, the use of head mounted displays can be combined with auditory and tactile sensations. In this way, the user can interact with the system using a joystick, hand-held sensors, gloves or a bodysuit. It would be interesting to know the user response using high-immersive VR systems comparing indoor and outdoor environments.
In summary, according with our research, the following findings from this work may help to design indoor and outdoor environments to improve the user experience:
- Greater levels of user experience were reported in the outdoor workshop than the indoor workshop.
- The differences were found in the presence, immersion, flow and emotion subscales. In these subscales, there were significantly higher scores in open VR environments than in indoor ones.
- Regarding the presence subscale, the existence of obstacles limits the freedom of movement and this causes a lesser sense of presence.
- A more fluid and natural navigation within the virtual environment also generates positive effects on the flow component.
- Regarding immersion, in closed environments, light does not have such a fundamental role for navigation within the environment.
- It is necessary to study the impact on the user’s health (dizziness, fear…) working with VR technology
- Even though the results obtained with both desktop VR environments are higher than 5 (Likert 1–10), it would be interesting to know the user response using high-immersive VR systems.
Author Contributions
Conceptualization, C.C.-C. and J.L.S.; methodology, C.C.-C., A.J.J. and J.L.S.; software, J.L.S.; validation, J.L.S., D.M.D. and A.J.J.; formal analysis, A.J.J.; investigation, C.C.-C., D.M.D. and J.L.S.; resources, J.L.S.; data curation, C.C.-C., D.M.D., A.J.J. and J.L.S.; writing—original draft preparation, C.C.-C., D.M.D. and J.L.S.; writing—review and editing, C.C.-C. and J.L.S.; visualization, D.M.D. and J.L.S.; supervision, C.C.-C. and A.J.J.; project administration, J.L.S.; funding acquisition, J.L.S. All authors have read and agreed to the published version of the manuscript.
Funding
This research was partially funded by the 2020-1-ES01-KA203-082244 Project (Extended reality in biomedical settings) belonging to the European Erasmus + program.
Conflicts of Interest
The authors declare no conflict of interest.
References
- Xie, H.; Wei, L.; Li, P. Application of Computer Virtual Reality Technology in Design. J. Phys. Conf. Ser. 2020, 1575, 012123. [Google Scholar] [CrossRef]
- Motloch, J.L. Introduction to Landscape Design; John Wiley & Sons: Hoboken, NJ, USA, 2000. [Google Scholar]
- Liu, M.; Nijhuis, S. Mapping landscape spaces: Methods for understanding spatial-visual characteristics in landscape design. Environ. Impact Assess. Rev. 2020, 82, 106376. [Google Scholar] [CrossRef]
- Kara, B. Landscape design and cognitive psychology. Procedia-Soc. Behav. Sci. 2013, 82, 288–291. [Google Scholar] [CrossRef]
- Denerel, S.B.; Birişçi, T. A Research on Landscape Architecture Student Use of Traditional and Computer-Aided Drawing Tools. Amazon. Investig. 2019, 8, 373–385. [Google Scholar]
- Simonds, J.O. Landscape Architecture: A Manual of Site Planning and Design; McGraw-Hill: New York, NY, USA, 1997. [Google Scholar]
- Dee, C. Form and Fabric in Landscape Architecture: A Visual Introduction; Taylor & Francis: Oxfordshire, UK, 2004. [Google Scholar]
- Jiao, J.; Liu, H.; Zhang, N. Research on the urban landscape design based on digital multimedia technology and virtual simulation. Int. J. Smart Home 2016, 10, 133–144. [Google Scholar] [CrossRef]
- Ervin, S.M. Digital landscape modeling and visualization: A research agenda. Landsc. Urban Plan. 2001, 54, 49–62. [Google Scholar] [CrossRef]
- Dinkov, D.; Vatseva, R. 3D modelling and visualization for landscape simulation. In Proceedings of the 6th International Conference on Cartography and GIS, Albena, Bulgaria, 13–17 June 2016. [Google Scholar]
- Bruns, C.R.; Chamberlain, B.C. The influence of landmarks and urban form on cognitive maps using virtual reality. Landsc. Urban Plan. 2019, 189, 296–306. [Google Scholar] [CrossRef]
- Thomas, B.H.; Piekarski, W. Outdoor virtual reality. ISICT 2003, 3, 226–231. [Google Scholar]
- Lacoche, J.; Villain, E.; Foulonneau, A. Evaluating Usability and User Experience of AR applications in VR Simulation. Front. Virtual Real. 2022, 87, 881318. [Google Scholar] [CrossRef]
- George, B.H.; Summerlin, P.R. The Current State of Software Amongst Landscape Architecture Practitioners; Education and Practice Professional Practice Network of the American Society of Land-Scape Architects: Philadelphia, PA, USA, 2018. [Google Scholar]
- Li, Z.; Cheng, Y.; Yuan, Y. Research on the application of virtual reality technology in landscape design teaching. Educ. Sci. Theory Pract. 2018, 18, 1400–1410. [Google Scholar] [CrossRef]
- Zheng, L. Exploring the Application Scenario Test of 3D Software Virtual Reality Technology in Indoor and Outdoor Design. In Proceedings of the 6th International Conference on Computing Methodologies and Communication (ICCMC), Erode, India, 29–31 March 2022; pp. 1509–1512. [Google Scholar]
- Hill, D.M. How Virtual Reality Impacts the Landscape Architecture Design Process at Various Scales. Ph.D. Thesis, Utah State University, Logan, UT, USA, 2019. [Google Scholar]
- George, B.H.; Sleipness, O.R.; Quebbeman, A. Using virtual reality as a design input: Impacts on collaboration in a university design studio setting. J. Digit. Landsc. Archit. 2017, 2, 252–259. [Google Scholar]
- Gao Chamberlain, B.C. Crash course or course crash: Gaming, VR and a pedagogical approach. J. Digit. Landsc. Archit. 2015, 2015, 354–361. [Google Scholar]
- Gao, T.; Liang, H.; Chen, Y.; Qiu, L. Comparisons of Landscape Preferences through Three Different Perceptual Approaches. Int. J. Environ. Res. Public Health 2019, 16, 4754. [Google Scholar] [CrossRef]
- Dede, C. Immersive interfaces for engagement and learning. Science 2009, 323, 66–69. [Google Scholar] [CrossRef]
- Mikropoulos, T.A.; Natsis, A. Educational virtual environments: A ten-year review of empirical research (1999–2009). Comput. Educ. 2011, 56, 769–780. [Google Scholar] [CrossRef]
- Webster, R. Declarative knowledge acquisition in immersive virtual learning environments. Interact. Learn. Environ. 2016, 24, 1319–1333. [Google Scholar] [CrossRef]
- Lee, E.A.L.; Wong, K.W. A review of using virtual reality for learning. In Transactions on Edutainment I; Springer: Berlin/Heidelberg, Germany, 2008; pp. 231–241. [Google Scholar] [CrossRef]
- Mikropoulos, T.A.; Bellou, J. The unique features of educational virtual environments. In Teaching and Learning with Technology; Routledge: Oxfordshire, UK, 2010; pp. 269–278. [Google Scholar]
- Ragan, E.D.; Bowman, D.A.; Huber, K.J. Supporting cognitive processing with spatial information presentations in virtual environments. Virtual Real. 2012, 16, 301–314. [Google Scholar] [CrossRef]
- Roussou, M.; Oliver, M.; Slater, M. The virtual playground: An educational virtual reality environment for evaluating interactivity and conceptual learning. Virtual Real. 2006, 10, 227–240. [Google Scholar] [CrossRef]
- Jia, D.; Bhatti, A.; Nahavandi, S. The impact of self-efficacy and perceived system efficacy on effectiveness of virtual training systems. Behav. Inf. Technol. 2014, 33, 16–35. [Google Scholar] [CrossRef]
- Sayyad, E.; Sra, M.; Höllerer, T. Walking and teleportation in wide-area virtual reality experiences. In Proceedings of the IEEE International Symposium on Mixed and Augmented Reality (ISMAR), Porto de Galinhas, Brazil, 9–13 November 2020; pp. 608–617. [Google Scholar]
- Halik, Ł. Challenges in converting the Polish topographic database of built-up areas into 3D virtual reality geovisualization. Cartogr. J. 2018, 55, 391–399. [Google Scholar] [CrossRef]
- Griffin, A.L.; Robinson, A.C.; Roth, R.E. Envisioning the future of cartographic research. Int. J. Cartogr. 2017, 3, 1–8. [Google Scholar] [CrossRef]
- Kent, A. Trust me, I’ma cartographer: Post-truth and the problem of acritical cartography. Cartogr. J. 2017, 54, 193–195. [Google Scholar] [CrossRef]
- Hernández, H.H.H.; González, V.M. Comparative analysis of user experience in virtual photographic-based presence platform. In Proceedings of the Latin American Conference on Human Computer Interaction, Córdoba, Argentina, 18–21 November 2015; pp. 1–7. [Google Scholar]
- Carbonell-Carrera, C.; Saorín, J.L. Geospatial Google Street View with virtual reality: A motivational approach for spatial training education. ISPRS Int. J. Geo-Inf. 2017, 6, 261. [Google Scholar] [CrossRef]
- Kim, Y.M.; Rhiu, I. A comparative study of navigation interfaces in virtual reality environments: A mixed-method approach. Appl. Ergon. 2021, 96, 103482. [Google Scholar] [CrossRef]
- Livingston, M.A.; Ai, Z.; Swan, J.E.; Smallman, H.S. Indoor vs. outdoor depth perception for mobile augmented reality. In Proceedings of the 2009 IEEE Virtual Reality Conference, Lafayette, LA, USA, 14–18 March 2009; pp. 55–62. [Google Scholar]
- Yu, D. Interior landscape design and research based on virtual reality technology. J. Phys. Conf. Series. 2020, 1533, 032038. [Google Scholar] [CrossRef]
- Cao, L.; Lin, J.; Li, N. A virtual reality based study of indoor fire evacuation after active or passive spatial exploration. Comput. Hum. Behav. 2019, 90, 37–45. [Google Scholar] [CrossRef]
- Natephra, W.; Motamedi, A.; Fukuda, T.; Yabuki, N. Integrating building information modeling and virtual reality development engines for building indoor lighting design. Vis. Eng. 2017, 5, 19. [Google Scholar] [CrossRef]
- Sharkawi, K.H.; Ujang, M.U.; Abdul-Rahman, A. 3D navigation system for virtual reality based on 3D game engine. In Proceedings of the The International Archives of the Photogrammetry, Remote Sensing and Spatial Information Sciences, Beijing, China, 3–11 July 2008; Volume 37. [Google Scholar]
- Fox, N.; Serrano-Vergel, R.; Van Berkel, D.; Lindquist, M. Towards Gamified Decision Support Systems: In-game 3D Representation of Real-word Landscapes from GIS Datasets. J. Digit. Landsc. Archit. 2022, 7, 356–364. [Google Scholar] [CrossRef]
- Suyu, W.; Xiaogang, C. The Application of Building Information Modeling (BIM) in landscape Architecture Engineering. J. Landsc. Res. 2018, 10, 5. [Google Scholar]
- Carbonell-Carrera, C.; Saorin, J.L.; Jaeger, A.J. Navigation Tasks in Desktop VR Environments to Improve the Spatial Orientation Skill of Building Engineers. Buildings 2021, 11, 492. [Google Scholar] [CrossRef]
- Carbonell-Carrera, C.; Saorin, J.L.; Melián Díaz, D. User VR experience and motivation study in an immersive 3D geovisualization environment using a game engine for landscape design teaching. Land 2021, 10, 492. [Google Scholar] [CrossRef]
- Tcha-Tokey, K.; Loup-Escande, E.; Christmann, O.; Richir, S. A questionnaire to measure the user experience in im-mersive virtual environments. In Proceedings of the 2016 Virtual Reality International Conference, Laval, France, 1–5 March 2016. [Google Scholar]
- Tcha-Tokey, K.; Christmann, O.; Loup-Escande, E.; Richir, S. Proposition and Validation of a Questionnaire to Measure the User Experience in Immersive Virtual Environments. Int. J. Virtual Real. 2016, 16, 33–48. [Google Scholar] [CrossRef]
- Punia, M.; Kundu, A. Three dimensional modelling and rural landscape geo-visualization using geo-spatial science and technology. Neo Geogr. 2014, 3, 1–19. [Google Scholar]
- Koua, E.L.; MacEachren, A.; Kraak, M.J. Evaluating the usability of visualization methods in an exploratory geovisualization environment. Int. J. Geogr. Inf. Sci. 2006, 20, 425–448. [Google Scholar] [CrossRef]
- Golebiowska, I.; Opach, T.; Rød, J.K. Breaking the Eyes: How Do Users Get Started with a Coordinated and Multiple View Geovisualization Tool? Cartogr. J. 2020, 57, 235–248. [Google Scholar] [CrossRef]
- Griffon, S.; Nespoulous, A.; Cheylan, J.P.; Marty, P.; Auclair, D. Virtual reality for cultural landscape visualization. Virtual Real. 2011, 15, 279–294. [Google Scholar] [CrossRef]
- Portman, M.E.; Natapov, A.; Fisher-Gewirtzman, D. To go where no man has gone before: Virtual reality in architecture, landscape architecture and environmental planning. Comput. Environ. Urban Syst. 2015, 54, 376–384. [Google Scholar] [CrossRef]
- Shin, I.S.; Beirami, M.; Cho, S.J.; Yu, Y.H. Development of 3D terrain visualization for navigation simulation using a Unity 3D development tool. J. Adv. Mar. Eng. Technol. 2015, 39, 570–576. [Google Scholar] [CrossRef]
- Herwig, A.; Paar, P. Game engines: Tools for landscape visualization and planning. Trends GIS Virtualiz. Environ. Plan. Des. 2002, 161, 172. [Google Scholar]
- Lange, E.; Hehl-Lange, S.; Brewer, M.J. Scenario-visualization for the assessment of perceived green space qualities at the urban–rural fringe. J. Environ. Manag. 2008, 89, 245–256. [Google Scholar] [CrossRef]
- Mól, A.C.A.; Jorge, C.A.F.; Couto, P.M. Using a game engine for VR simulations in evacuation planning. IEEE Comput. Graph. Appl. 2008, 28, 6–12. [Google Scholar] [CrossRef] [PubMed]
- Williams, K.D. The effects of dissociation, game controllers, and 3D versus 2D on presence and enjoyment. Comput. Hum. Behav. 2014, 38, 142–150. [Google Scholar] [CrossRef]
- Shiratuddin, M.F.; Thabet, W. Utilizing a 3D game engine to develop a virtual design review system. Electron. J. Inf. Technol. Constr. 2011, 16, 39–68. [Google Scholar]
- Laksono, D.; Aditya, T. Utilizing a game engine for interactive 3D topographic data visualization. ISPRS Int. J. Geo-Inf. 2019, 8, 361. [Google Scholar] [CrossRef]
- Regenbrecht, H.; Schubert, T. Real and illusory interactions enhance presence in virtual environments. Presence Teleoper. Virtual Environ. 2002, 11, 425–434. [Google Scholar] [CrossRef]
- Kalisperis, L.N.; Muramoto, K.; Balakrishnan, B.; Nikolic, D.; Zikic, N. Evaluating relative impact of virtual reality system variables on architectural design comprehension and presence-A variable-centered approach using fractional factorial experiment. In Proceedings of the 24th International Conference on Education and Research in Computer Aided Architectural Design in Europe (eCAADe), Volos, Greece, 6–9 September 2006. [Google Scholar]
- Santos, B.S.; Dias, P.; Pimentel, A.; Baggerman, J.W.; Ferreira, C.; Silva, S.; Madeira, J. Head-mounted display versus desktop for 3D navigation in virtual reality: A user study. Multimed. Tools Appl. 2009, 41, 161–181. [Google Scholar] [CrossRef]
- Fonseca, D.; Cavalcanti, J.; Peña, E.; Valls, V.; Sanchez-Sepúlveda, M.; Moreira, F.; Navarro, I.; Redondo, E. Mixed assessment of virtual serious games applied in architectural and urban design education. Sensors 2021, 21, 3102. [Google Scholar] [CrossRef]
- Botella, C.; García-Palacios, A.; Quero, S.; Baños, R.M.; Bretón-López, J.M. Realidad virtual y tratamientos psicológicos: Una revisión. Psicol. Conduct. 2006, 14, 491–509. [Google Scholar]
- McCall, R.; O’Neil, S.; Carroll, F. Measuring Presence in Virtual Environments; MIT Press: Cambridge, MA, USA, 2004. [Google Scholar]
- Strand, I. Virtual Reality in Design Processes: A literature review of benefits, challenges, and potentials. FormAkademisk 2020, 13, 3874. [Google Scholar] [CrossRef]
- Tussyadiah, I.P.; Jung, T.H.; Tom Dieck, M.C. Embodiment of wearable augmented reality technology in tourism experiences. J. Travel Res. 2018, 57, 597–611. [Google Scholar] [CrossRef]
- Zhao, J.; Sensibaugh, T.; Bodenheimer, B.; McNamara, T.P.; Nazareth, A.; Newcombe, N.; Klippel, A. Desktop versus immersive virtual environments: Effects on spatial learning. Spat. Cogn. Comput. 2020, 20, 328–363. [Google Scholar] [CrossRef]
- Petridis, P.; Dunwell, I.; Panzoli, D.; Arnab, S.; Protopsaltis, A.; Hendrix, M.; de Freitas, S. Game engines selection framework for high-fidelity serious applications. Int. J. Interact. Worlds 2012, 2012, 418638. [Google Scholar] [CrossRef]
- Carbonell-Carrera, C.; Gunalp, P.; Saorin, J.L.; Hess-Medler, S. Think Spatially With Game Engine. ISPRS Int. J. Geo Inf. 2020, 9, 159. [Google Scholar] [CrossRef]
- Azarby, S.; Rice, A. Understanding the Effects of Virtual Reality System Usage on Spatial Perception: The Potential Impacts of Immersive Virtual Reality on Spatial Design Decisions. Sustainability 2022, 14, 10326. [Google Scholar] [CrossRef]
- Holmes, C.A.; Marchette, S.A.; Newcombe, N.S. Multiple views of space: Continuous visual flow enhances small-scale spatial learning. J. Exp. Psychol. Learn. Mem. Cogn. 2017, 43, 851–861. [Google Scholar] [CrossRef]
- Kozhevnikov, M.; Motes, M.A.; Rasch, B.; Blajenkova, O. Perspective-taking vs. mental rotation transformations and how they predict spatial navigation performance. Appl. Cogn. Psychol. 2006, 20, 397–417. [Google Scholar] [CrossRef]
- Weisberg, S.M.; Schinazi, V.R.; Newcombe, N.S.; Shipley, T.F.; Epstein, R.A. Variations in cognitive maps: Understanding individual differences in navigation. J. Exp. Psychol. Learn. Mem. Cogn. 2014, 40, 669–682. [Google Scholar] [CrossRef]
- Friedman, A.; Kohler, B.; Gunalp, P.; Boone, A.P.; Hegarty, M. A computerized spatial orientation test. Behav. Res. Methods 2020, 52, 799–812. [Google Scholar] [CrossRef]
- Jaalama, K.; Fagerholm, N.; Julin, A.; Virtanen, J.-P.; Maksimainen, M.; Hyyppä, H. Sense of presence and sense of place in perceiving a 3D geovisualization for communication in urban planning–Differences introduced by prior familiarity with the place. Landsc. Urban Plan. 2021, 207, 103996. [Google Scholar] [CrossRef]
- Witmer, B.G.; Singer, M.J. Measuring presence in virtual environments: A presence questionnaire. Presence 1998, 7, 225–240. [Google Scholar] [CrossRef]
- Heutte, J. La Part du Collectif Dans la Motivation ET Son Impact Sur Le Bien-êTre Comme Médiateur de la Réussite Des éTudiants: Complémentarités ET Contributions Entre L’Autodétermination, L’Auto-Efficacité ET L’Autotélisme. Ph.D. Thesis, Université Paris-Nanterre, Nanterre, France, 2011. [Google Scholar]
- Pekrun, R.; Goetz, T.; Frenzel, A.C.; Barchfeld, P.; Perry, R.P. Measuring emotions in students’ learning and performance: The Achievement Emotions Questionnaire (AEQ). Contemp. Educ. Psychol. 2011, 36, 36–48. [Google Scholar] [CrossRef]
- Brooke, J. SUS-A quick and dirty usability scale. Usability Eval. Ind. 1996, 189, 4–7. [Google Scholar]
- Venkatesh, V.; Morris, M.G.; Davis, G.B.; Davis, F.D. User acceptance of information technology: Toward a unified view. MIS Q. 2003, 27, 425–478. [Google Scholar] [CrossRef]
- Hassenzahl, M.; Burmester, M.; Koller, F. AttrakDiff: Ein Fragebogen zur Messung wahrgenommener hedonischer und pragmatischer Qualität. In Mensch & Computer 2003; Springer: Berlin/Heidelberg, Germany, 2003; pp. 187–196. [Google Scholar]
- Kennedy, R.S.; Lane, N.E.; Berbaum, K.S.; Lilienthal, M.G. Simulator sickness questionnaire: An enhanced method for quantifying simulator sickness. Int. J. Aviat. Psychol. 1993, 3, 203–220. [Google Scholar] [CrossRef]
- George, D.; Mallery, M. SPSS for Windows Step by Step: A Simple Guide and Reference; Allyn & Bacon: Boston, MA, USA, 2003. [Google Scholar]
- Hruby, F.; Ressl, R.; de la Borbolla Del Valle, G. Geovisualization with immersive virtual environments in theory and practice. Int. J. Digit. Earth 2019, 12, 123–136. [Google Scholar] [CrossRef]
- Hegazy, M.; Yasufuku, K.; Abe, H. Evaluating and visualizing perceptual impressions of daylighting in immersive virtual environments. J. Asian Archit. Build. Eng. 2021, 20, 768–784. [Google Scholar] [CrossRef]


Disclaimer/Publisher’s Note: The statements, opinions and data contained in all publications are solely those of the individual author(s) and contributor(s) and not of MDPI and/or the editor(s). MDPI and/or the editor(s) disclaim responsibility for any injury to people or property resulting from any ideas, methods, instructions or products referred to in the content. |
© 2023 by the authors. Licensee MDPI, Basel, Switzerland. This article is an open access article distributed under the terms and conditions of the Creative Commons Attribution (CC BY) license (https://creativecommons.org/licenses/by/4.0/).