Article

Spatial Pattern of Large-Scale Agricultural Land and Spatial Heterogeneity of Influencing Factors in the Mountainous Areas of Western China—Wuling Mountains as an Example

1
Department of Land Resource Management, School of Public Administration, South-Central Minzu University, Wuhan 430074, China
2
Research Center of Hubei Ethnic Minority Areas Economic and Social Development, South-Central Minzu University, Wuhan 430074, China
3
Experimental Teaching Centre, Hubei University of Economics, Wuhan 430205, China
4
Collaborative Innovation Center for Emissions Trading System Co-Constructed by the Province and Ministry, Wuhan 430205, China
5
Department of Land Resource Management, School of Public Administration, China University of Geosciences, Wuhan 430074, China
*
Author to whom correspondence should be addressed.
Land 2023, 12(11), 2074; https://doi.org/10.3390/land12112074
Submission received: 12 October 2023 / Revised: 13 November 2023 / Accepted: 16 November 2023 / Published: 18 November 2023

Abstract

:
The scaling of agricultural land is a trend in land use transformation and is important for modernizing agriculture. Therefore, the reasons for large-scale agricultural land formation should be explored. The spatial distribution of large-scale agricultural land and the factors for its formation vary between different regions. Currently, the exploration of the formation mechanism of large-scale agricultural land from the perspective of heterogeneity is not yet sufficient. Therefore, the main objectives of this article are as follows: first, analyze the spatial pattern characteristics of large-scale agricultural land; second, explore the spatial heterogeneity characteristics of influencing factors from both global and local perspectives; third, explore the mechanism of the formation of large-scale agricultural land from the perspective of heterogeneity. The results indicate the following: (1) The large-scale agricultural land distribution pattern in the Wuling Mountains area was high in the east and low in the west. (2) Natural conditions, production factors, and location conditions all significantly impacted large-scale agricultural land, but with differences in their degree of influence. From a local perspective, the influences of various factors in different regions also exhibited spatial heterogeneity. These two types of heterogeneity can be attributed to the differences in regional development stages. (3) Natural conditions, location conditions, and production factors had negative, positive, and positive effects on the agricultural land scale, respectively, but the influence of the first two decreased with the improvement in the regional development stages. The influence of different factors on production factors was related to the regional development stage, and production factors that were suitable for the regional development stage had a greater impact. The conclusion can provide differentiated policy support for regional land use in practice.

1. Introduction

Land use transformation is a turning point that occurs in the long-term change process of land use types in a certain region with the socioeconomic development, including single types of land use, such as cultivated land, forest land, and urban land, and the overall land use forms in the region [1]. With the development of human society, land has undergone a transformation from prehistoric natural ecosystems, such as forests, to stages of land reclamation, livelihood agriculture, gradual scaling, and intensive utilization [2]. The trend of land use transformation is not entirely consistent. Owing to differences in development stages, different countries or regions may be undergoing certain types of transformation, and the final direction of their transformation also significantly differs. There are three typical models of land use transformation in developed country regions [3]. The first is large-scale farms with a mechanized agricultural management model, as observed in the United States [3,4]. The second type includes small-scale, organic, and green agricultural land use models, represented by the Rhine River Basin region in Europe [5]. The third type is typical of the East Asian region, represented by Japan, where agricultural land is assigned a multifunctional utilization model of agriculture, ecological landscape, and tourism [6]. With the market-oriented reform of land property rights in the early stages of this century, China has also entered a stage of large-scale transformation of agricultural land [7]. In the early 21st century, owing to the advantages of geographical conditions, the expansion of agricultural land began in the plains of the central and eastern regions. In recent years, agricultural land has gradually expanded in western China [8]. As the western region is mostly mountainous, large-scale agricultural land is planted with economic crops more suitable for mountainous areas. There are significant differences in the spatial forms of large-scale agricultural land compared with those in plain areas. The connectivity and scale of mountainous regions are not as suitable as those in plain areas. A spatial pattern of large-scale agricultural land unique to mountainous areas can be formed due to the unique terrain. Large-scale agricultural land presents different spatial patterns in different regions [9]. Therefore, it is necessary to explore the spatial patterns and reasons for the formation of agricultural land of different regional scales, which can provide scientific policy support for the healthy development of agricultural land transformation.
Previous studies have explored patterns of large-scale agricultural land transformation using different research methods and data sources. A study used statistical data from 2007 to 2015 and found that the land transfer rate in China increased from 5.2% to 33.3% [10]. However, there were significant regional differences in the degree of land transfer, with slower and smaller-scale transfer in the southern and western regions and faster and larger-scale transfer in plain areas. More research has utilized field survey data to indirectly reflect the status of agricultural land scale management by investigating the land transfer behavior of farmers in certain regions and comparing the differences in agricultural land management between different regions [8,11,12,13,14]. These studies have explored the process and reasons for scaling up from the perspective of the “implicit” functional transformation of agricultural land. However, owing to the limitations of the data, both statistical and household survey data can only be used to explore the differences in the distribution of large-scale agricultural land between different regions at the administrative scale, making it difficult to accurately reflect the spatial pattern of large-scale agricultural land from the plot scale.
This requires further refinement using spatial remote sensing data. Traditional research on land use change using spatial remote sensing data of land use, although precise to the scale of land parcels, mainly focuses on “explicit” attribute changes such as land area, concentration, and spatial form [15,16,17]. In contrast, limited attention has been paid to “implicit” attributes (which are imperceptible and require analysis, testing, and investigation to obtain land use forms that are dependent on explicit forms, such as quality, property rights, management methods, and inherent input and output capabilities of the intensification of the internal management pattern of agricultural land). Therefore, it is necessary to explore a research path that combines the explicit and implicit attributes of the large-scale transformation of agricultural land. A few studies have explored this topic. Such studies have analyzed the spatial pattern and influencing factors of large-scale agricultural land in the Three Gorges Reservoir area at the township [18] and county scales [9,18] but have been limited by relatively small research scales. This study mainly focuses on the analysis of the large-scale agricultural land formation mechanism from a global perspective, lacking heterogeneity (In our article, ’heterogeneity’ mainly refers to the differences in influencing factors in different regions) analysis from a local perspective. Heterogeneity analysis is important for comprehensively understanding the large-scale agricultural land formation mechanism.
Previous studies have extensively explored the factors influencing large-scale agricultural land from different perspectives, such as natural conditions, production factors, and location conditions. Such studies have indicated that the formation of large-scale agricultural land is comprehensively influenced by multiple factors [19,20,21,22,23,24]. Meanwhile, the comparison of different research conclusions has revealed heterogeneity in the degree of influence of these influencing factors in different research regions [8,25]. Natural conditions are the limiting factors affecting the scale of agricultural land, and large-scale agricultural land requires a certain foundation of natural conditions. In terms of spatial pattern, the scale of agricultural land in plain areas is higher than that in mountainous areas [10,26]. However, in recent years, with continuous societal development, the influence of natural conditions has gradually weakened [11]. For example, in research on some urban areas, it has been found that the impact of natural conditions on agricultural land transfer is not significant [13]. In some research on mountainous areas, owing to the suitability of cash crops for the local environment, their dependence on natural conditions is not as strong [18]. Excellent location conditions have a positive impact on the scale of agricultural land, but some studies have also reported that, with the gradual improvement in transportation infrastructure in recent years, the impact of location factors has also weakened [14,27]. Production factors are important factors influencing the scale of agricultural land, but the influence of different production factors varies between different regions. For example, research conducted across the country has also observed significant differences in the main factors limiting the development of land transfer in different provinces [10]. In a study conducted in Hubei Province, there were differences in the correlation between land transfer in key development zones, main agricultural production areas, and ecological functional zones based on various production factors [12]. In county-level research, the factors driving large-scale agricultural land have also had varying degrees of impact in different townships [9]. Therefore, although rich analyses of various factors influencing large-scale agricultural land have been conducted and the characteristics of the spatial heterogeneity in the influencing factors have been determined, in-depth analyses of the reasons for this heterogeneity are lacking, which limits our understanding of the large-scale agricultural land formation mechanism. Therefore, we need to explore the large-scale agricultural land formation mechanism from the perspective of spatial heterogeneity. In practice, understanding this heterogeneity effect can also help us to provide differentiated and local policy support for the large-scale transformation of agricultural land in different regions.
Based on the above practical needs and the shortcomings of theoretical research, this article sets the following research objectives: analyze the spatial pattern characteristics of large-scale agricultural land, explore the spatial heterogeneity characteristics of influencing factors from both global and local perspectives, and elucidate the formation mechanism of large-scale agricultural land in the context of heterogeneity. For this reason, the remaining part of this article is arranged as follows: first, a theoretical framework is constructed for the mechanism of each factor’s impact on the spatial pattern of large-scale agricultural land. Second, research methods are introduced, and empirical analysis is conducted. Then, based on the research results and relevant literature analysis, the mechanism of the formation of large-scale agricultural land is discussed and revealed. Finally, corresponding policy implications, future directions, and research conclusions are provided.

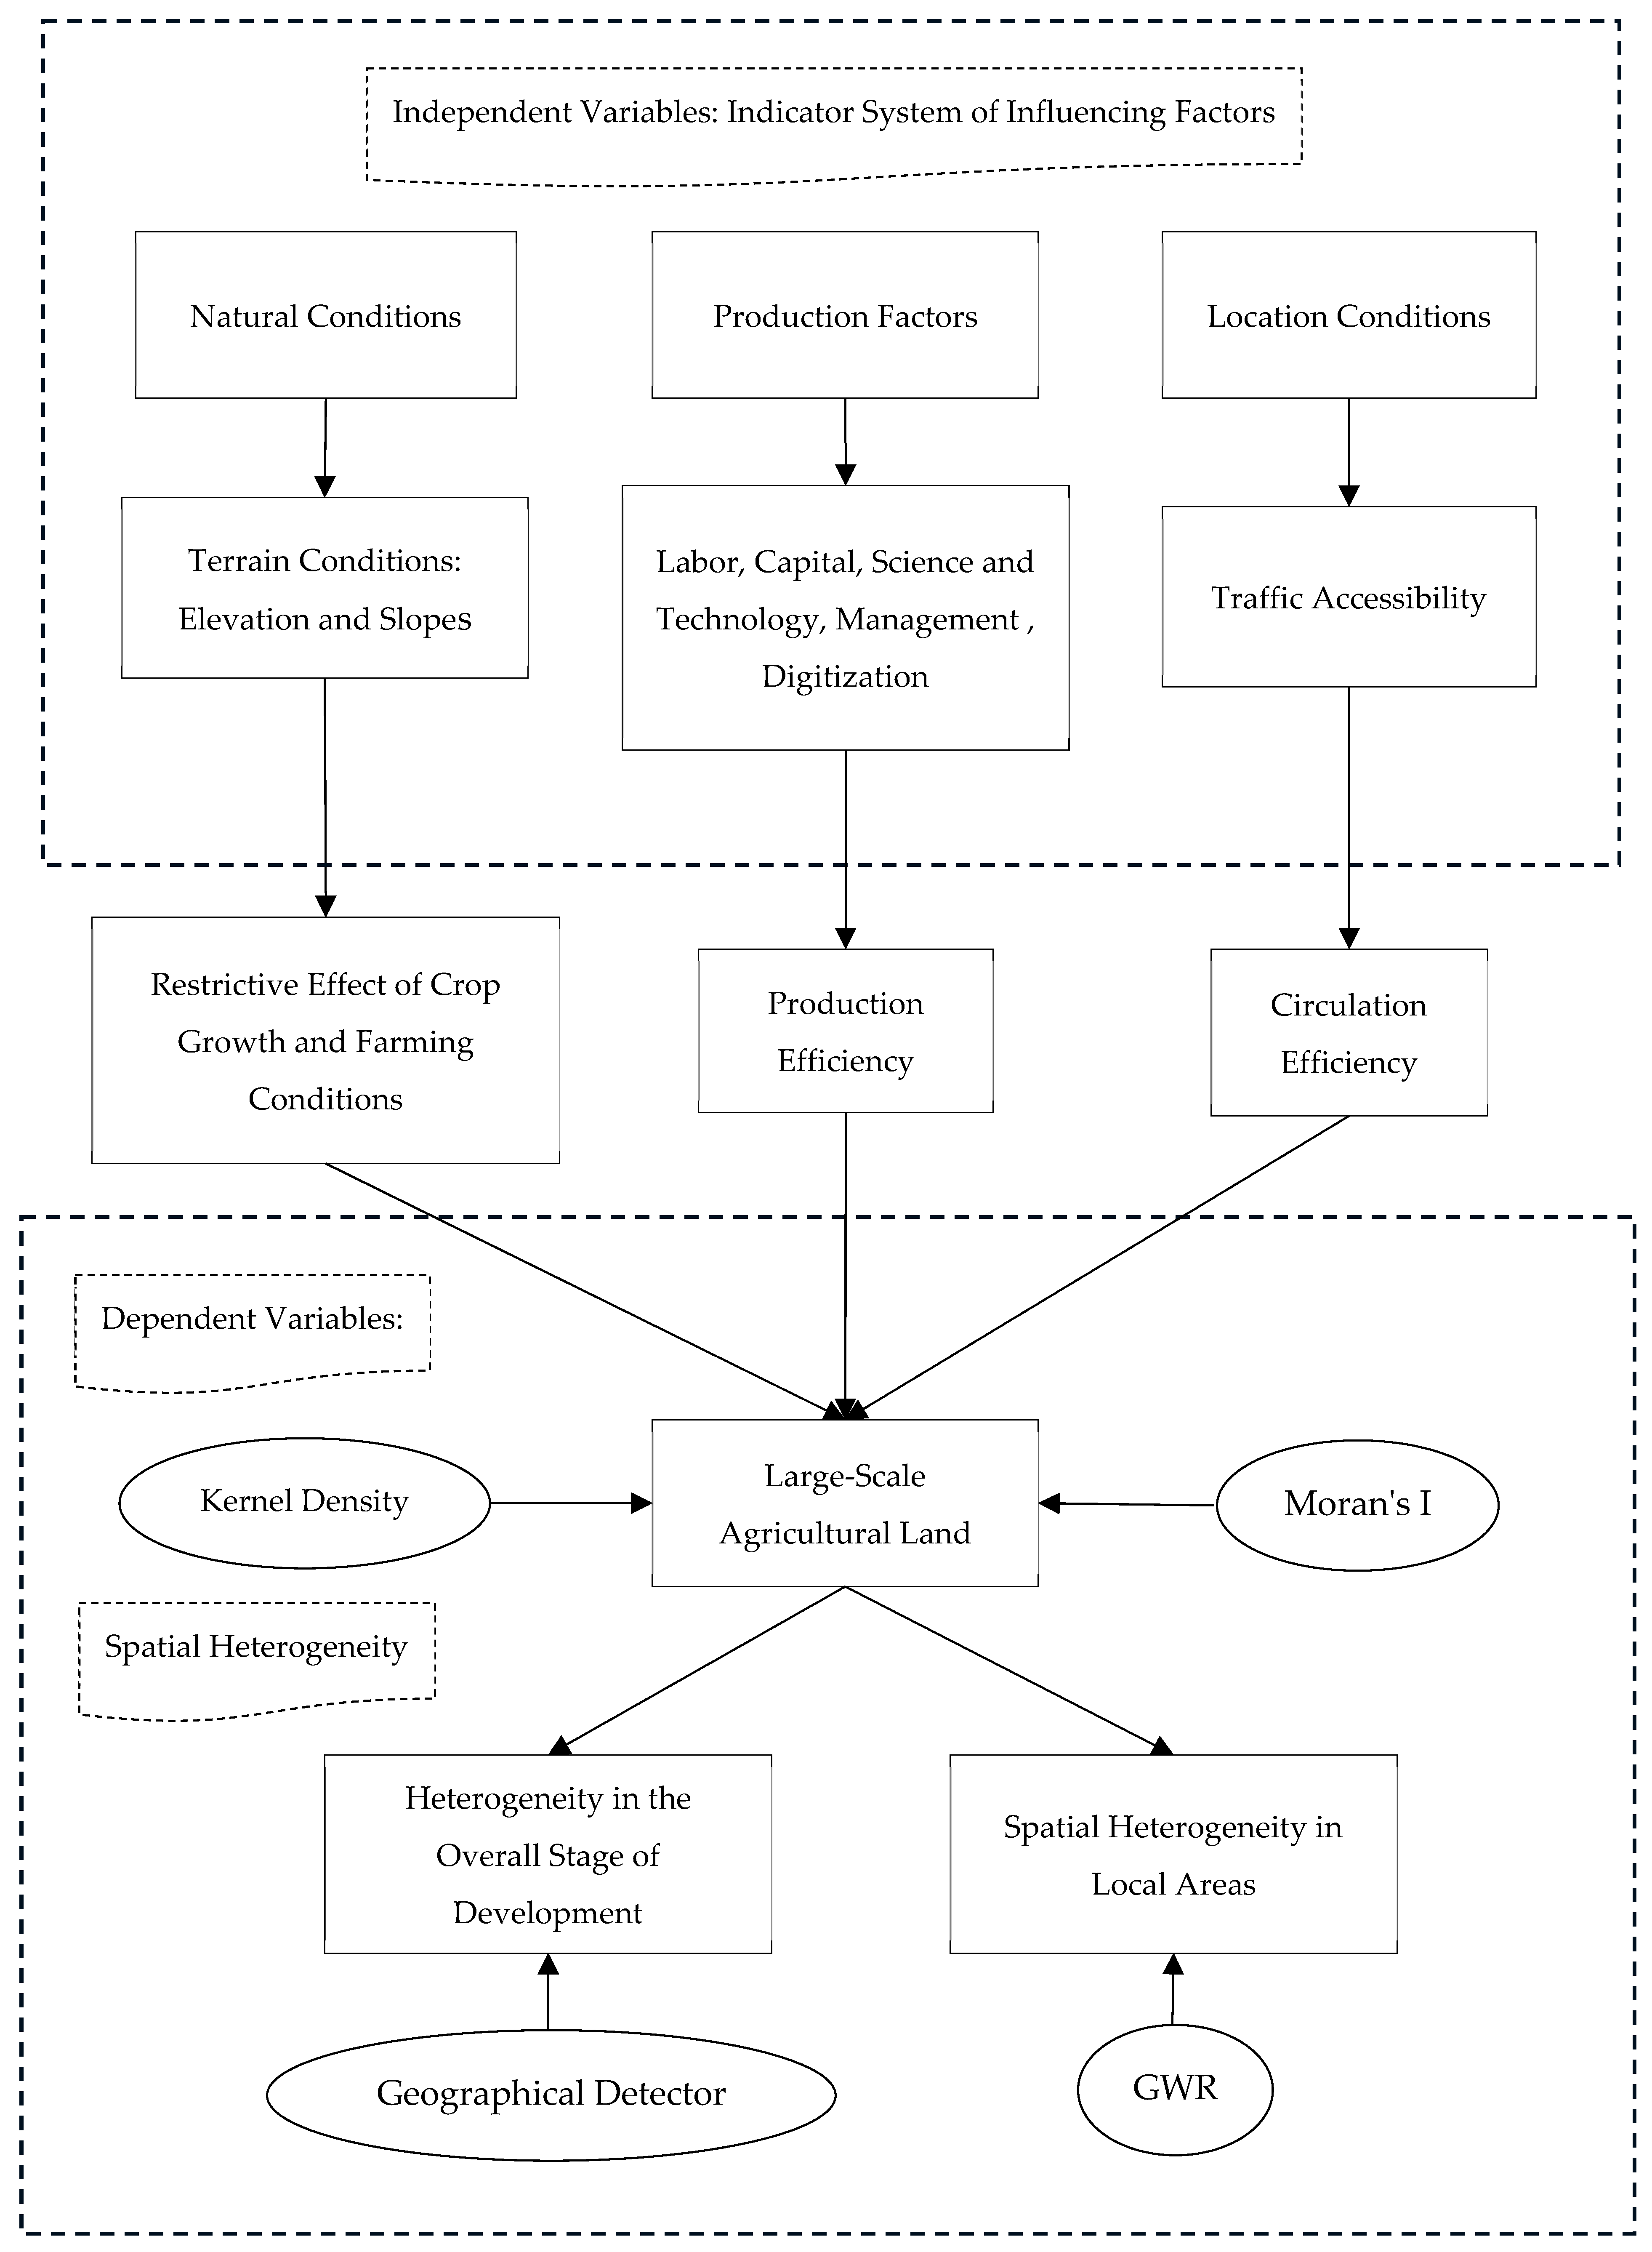
2. Theoretical Framework

The large-scale transformation of agricultural land is a result of social and economic development to a certain stage, and a variety of influencing factors act on agricultural land. This transformation is spatially manifested as large-scale agricultural land. This paper holds that these influencing factors include the background conditions of physical geography, various production factors, and location conditions. The influences of these factors on the spatial pattern of large-scale agricultural land differ with development stage and spatial heterogeneity.
Natural conditions are the basic factors that affect the distribution of large-scale agricultural land. Agricultural activity is first and foremost limited by geographical conditions, and topography is an important factor affecting large-scale agricultural land [8]. China’s agricultural land scale transformation began in the central and eastern plains [7]. In this region, the large-scale agricultural land is mainly planted with bulk grain crops with large areas, strong concentrations, and a high degree of mechanization. Conversely, the large-scale agricultural land in mountainous areas is characterized by diverse planting structures dominated by cash crops with local characteristics, relatively moderate area, low concentration, and relatively dispersed spatial form [9].
Although natural conditions are the basic conditions affecting the distribution of large-scale agricultural land, their influence gradually weakens with the development of productivity and the diversification of land use functions following large-scale transformation. Each production factor of economic development plays an important role in the influence of agricultural land scale. Labor is the most basic factor of production. At the peasant household scale, the employment structure of the population is the key variable affecting land transfer, and non-agricultural employment provides opportunities for expanding the scale of management of agricultural land [28]. However, at the larger township scale, the total number of the labor force is the key factor affecting the spatial pattern of large-scale agricultural land [9]. Labor is still an important source of productivity in areas without extensive mechanization and even in regions with a high degree of mechanization, although labor can be replaced to a certain extent in the production link at the front end of the industrial chain, from the perspective of the whole industrial chain, labor still plays an important role in the circulation and consumption link at the back end [11]. Thus, the size of the labor force still plays an important role in the spatial pattern of large-scale agricultural land, and it has a more significant impact on economically backward regions.
Capital is an indispensable element in the formation of large-scale agriculture. Capital can enter agricultural activities through both government-led and civilian-led channels [14]. In recent years, under the guidance of targeted poverty alleviation policies, large amounts of capital have been invested in rural area infrastructure through government finance transfer payments, which provides a foundation for scale transformation of agricultural land in rural areas. Private capital completes the initial accumulation in this process. Urban industrial and commercial capital, rural endogenous capital, and urban–rural mixed capital inject funds into rural areas and complete the cycle of capital through the concentration of land and the scale of agriculture [13].
Large-scale agricultural land cannot be separated from the support of technical elements. The use of mechanization can significantly reduce the labor force required for a unit of land and replace heavy manual labor in some production links. The use of mechanization can also incentivize farmers to expand their farms until they can take full advantage of the scale advantages associated with the existing level of mechanization [19,29].
Management elements are important factors for realizing scale management of agricultural land. The stability of land rights can promote farmers’ land transfer and expand the management scale of agricultural land [22]. In recent years, China has completed the work of determining the right of land management, the right of land transfer has been determined by law, and the land management system has completed a market-oriented reform. Under this background, new agricultural business entities have emerged in large numbers, which has promoted land transfer and expanded the scale of management through market-oriented management [20,23].
Digital data are the most recent factor of production and also one of the most important. China’s rural areas are entering a phase of digital transformation. The extensive use of the Internet in rural areas has improved the opportunities for non-agricultural employment of the labor force and promoted land transfer [30]. Moreover, the digital economy has changed traditional sales channels, expanded the sales market of agricultural products through the Internet platform, and promoted the expansion of the scale of local agricultural operations [31,32].
If the natural condition is the background and the factors of production reflect the transformation of the natural background by human activities, then the location condition is the expression of the transformation of the natural activity by humans under the influence of spatial factors. The cost and time required for human production activities can be reduced through the development of transportation capacity [33]. The natural environment was poor in the past, but due to the construction of modern transportation, areas far from the central city benefited from greatly reduced logistics costs, and their location conditions were greatly improved. Several studies have demonstrated that suitable traffic and road conditions save transportation costs. Through the process of “time eliminating space,” the time cost from production land to sales markets is reduced, which is an important factor in promoting the circulation of agricultural land and affecting the distribution of large-scale agricultural land [6,27,34].
Based on the above arguments, this study constructed a theoretical framework to analyze the causal relationships and heterogeneity among natural conditions, production factors, location conditions, and large-scale agricultural land, as shown in Figure 1.
Natural conditions, production factors, and location conditions all impact the spatial pattern of large-scale agricultural land through the restrictive effects of crop growth and cultivation conditions, as well as the improvement in production and circulation efficiency. However, this impact will generate heterogeneity due to differences in spatial regions, which can be reflected in the correlation between global and local spaces, respectively.
First, overall, there is heterogeneity in the degree of correlation among different factors. This is because, although various factors have an impact on the scale of agricultural land, their importance varies during different stages of economic development. Therefore, the differences in the overall stages of regional economic development determine the heterogeneity of the degree of correlation among influencing factors.
Second, from a local perspective, there is also heterogeneity in the degree of correlation among various factors in local regions. This is because the spatial pattern of large-scale agricultural land, as a geographical object, is formed by the influence of various factors in different regions, and the degree of this effect is heterogeneous due to the differences in local regions. Therefore, the differences in local regions result in spatial heterogeneity in influencing factors.
These two types of heterogeneity essentially originate from differences in regional development stages. Therefore, this article proposes a hypothesis of the formation mechanism of large-scale agricultural land: natural conditions, location conditions, and production factors have negative, positive, and positive impacts on large-scale agricultural land, respectively. The impacts of natural and location conditions weaken with an improvement in the regional development stage, while production factors strengthen with an improvement in the regional development stage. The specific influencing factors among the production factors are related to the regional development stage, and the influencing factors suitable for the regional development stage have a greater impact.

3. Materials and Methods
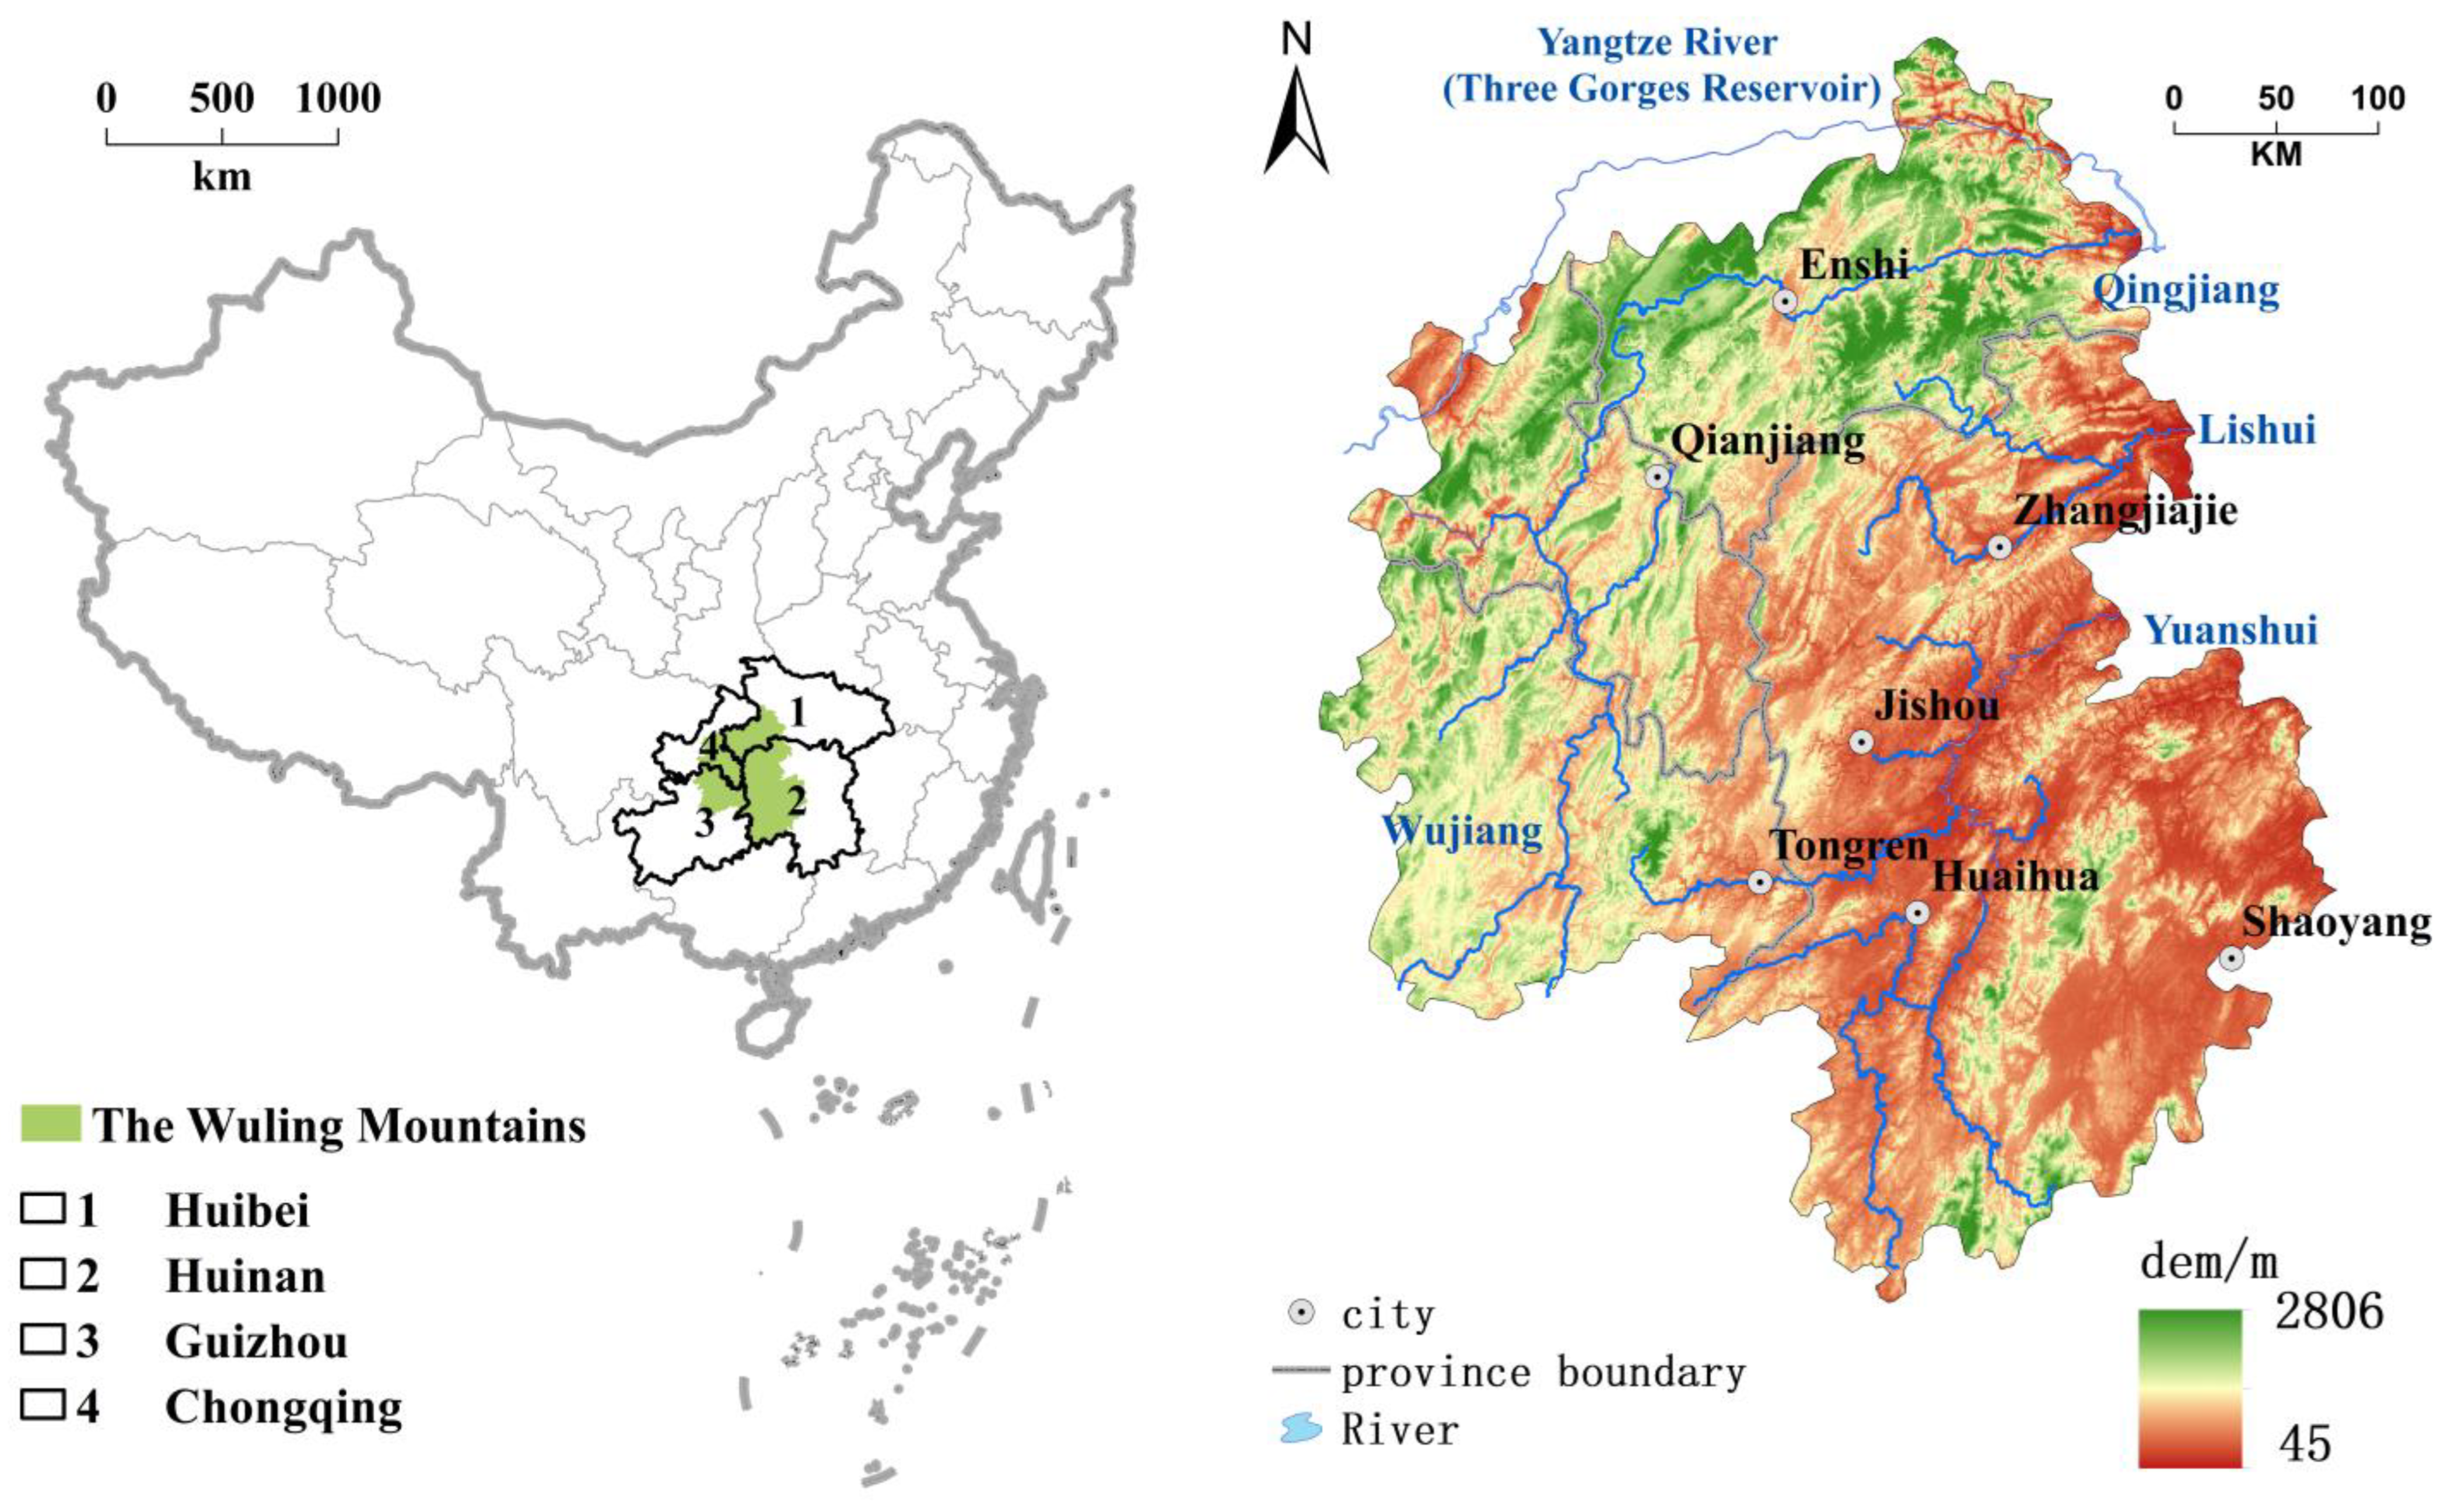
3.1. Study Area

The Wuling Mountains area is located at the junction of the Hubei, Hunan, Guizhou, and Chongqing Provinces (or municipalities), 26–30° north latitude, 107–111° east longitude. It is a transitional zone from the central plains of China to the western mountainous areas, with an area of 17,162 Square kilometers (km²). This area falls in the middle and upper reaches of the Yangtze River basin, which passes through the northernmost regions of Hubei and Chongqing in the Wuling Mountains. This section (the northernmost part of the research area) belongs to the Three Gorges Reservoir area of the Yangtze River, with the Three Gorges Dam being located in this region. Four tributaries of the Yangtze River mainly pass through the territory of the Wuling Mountains, namely the Qingjiang River in Hubei Province, the Lishui and Yuanshui Rivers in Hunan Province, and the Wujiang River in Chongqing and Guizhou. Overall, the elevation of the western region is higher than that of the eastern region, with the Yuanshui River Basin in Hunan Province having a relatively flat terrain and numerous river valleys; thus, it has been a major transportation hub in this region since ancient times. However, the Hubei, Chongqing, and Guizhou regions have higher elevations and larger slopes, making transportation more difficult (Figure 2).
Although transportation in the Wuling Mountains area has been inconvenient since ancient times, it still serves as an important passage from the Central Plains region to southwestern regions, such as Sichuan and Yunnan, forming east–west and north–south corridors based on the Qingjiang and Yuanjiang rivers, respectively. In ancient China, these two corridors and their surrounding areas became the first areas of social and economic development in the Wuling Mountains [35]. In contemporary China, the early constructed national roads were the first to run through these two ancient corridors in the Wuling Mountains region. After the 21st century, highways and high-speed railways along these two corridors were also the first to enter the Wuling Mountains. Therefore, the socioeconomic development level of the Hunan and Hubei parts of the Wuling Mountains, where these two corridors are located, has always been higher compared with that of other regions [36]. The main cities in the Wuling Mountains are also mostly located around these two corridors, namely Enshi in Hubei Province, Qianjiang in Chongqing, Tongren in Guizhou, Zhangjiajie in Hunan, Jishou, Huaihua, and Shaoyang.

3.2. Data Sources and Data Processing

3.2.1. Data Sources

Demographic, economic, and technical indicators of the impact factor index system were obtained from the China County Statistical Yearbook (2020). The number of agricultural market entities was queried using the Tian-eye search application by qualifying the region, relevant industry, and other conditions. The digital index was obtained from the County Digital Countryside Index (2018), published by the Institute of New Rural Development, Peking University, in collaboration with the Ali Research Institute. Traffic and road data were obtained from the Open Street Map, accessed on 1 August 2020 (https://www.openstreetmap.org/).
Owing to the large scope of the research area, the sources of land use remote sensing data are relatively diverse. Part of the county data was obtained from remote sensing data from the Third National Land Survey, belonging to a series of satellite data from GF-2 (Level 1A; B1, B2, B3, Natural Color for Object Recognition, panchromatic band for Data fusion) or ZY-3 (Level 1A; B1, B2, B3, Natural Color for Object Recognition, panchromatic band for Data fusion), with a resolution of approximately 1 m. In some areas without such data, Sentinel-2 (Level 2A; B4, B3, B2, Natural Color for Object Recognition) or Landsat-8 (Level 3; B4, B3, B2, Natural Color for Object Recognition; B8 for Data fusion) were used, with resolutions of 10 or 15 m. The data for Hubei Province were mostly GF-2 or ZY-3, whereas data for other provinces were mostly Sentinel-2 or Landsat-8. The data were all recorded from 2019 to 2020.

3.2.2. Data Processing

(1) Large-scale agricultural land identification
Under the background of land use transformation, the important feature of agricultural land transformation in western mountainous areas of China is the process of transformation from a dispersed food crop system with farmers as the unit to a large-scale, intensive, and diversified planting ecosystem [37,38,39]. The result of this process in geographical space is large-scale agricultural land [9]. Therefore, the large-scale agricultural land in this study mainly refers to the agricultural land with multiple management subjects with a large scale, diversified planting structure, concentrated distribution, and intensive use. To visualize the results of scale farming land spatially, we refer to the definitions of land use spatial transformation [29], agricultural system transformation [1], scale farming land [9], and other concepts of several scholars. This study defines the scale of agricultural land from two aspects: internal form and external form.
(1) Internal management pattern perspective. This involves identifying the types of typical-scale agricultural land in the Wuling Mountains area (such as farmland, vegetable fields, orchards, tea gardens, etc.). The management pattern of large-scale agricultural land mainly reflects characteristics of intensification. In general, large-scale agricultural land is consolidated and has better infrastructure and planting conditions. In remote sensing image interpretation, the geometric features are obvious, and the boundary rules are blocky and neatly arranged; some are distributed in strips, with clear and delicate imaging stripe patterns, which meet the appearance conditions of large-scale agricultural land defined in this article. Human–machine interactive interpretation should be performed on the ArcGIS to obtain vector maps of large-scale agricultural land in the study area (Table 1). Data from numerous field investigations conducted by the authors in the Wuling Mountains were used as evidence for comparisons with the interpreted patterns for verification. The interpretation accuracy is 94.5%. For cases where the results of image interpretation and on-site evidence do not match, image interpretation results were corrected based on on-site investigation results.
(2) Landscape pattern perspective of external form. According to the minimum area requirement in the definition of large-scale agricultural land, the area was comprehensively judged by referring to the appropriate management scale of agricultural land in mountainous areas and the standard of large-scale agricultural land in similar areas (the Three Gorges Reservoir area) in existing studies [9]. Also, considering the field investigation of this study, 2 hm² was taken as the basic standard of large-scale agricultural land in this study.
In addition, from the perspective of landscape pattern, considering that the Wuling Mountains area has a relatively low level of agricultural mechanization due to its complex terrain conditions and that it is difficult to integrate agricultural land, the aggregation degree of the large-scale agricultural land landscape is relatively low. Therefore, in actual field investigation, the area of some agricultural land is found to be small, and the land is relatively close to neighboring land; however, this type of agricultural land is still a part of the large-scale agricultural land. Therefore, considering existing studies [40,41] on the farming radius in mountainous areas and the average nearest distance (992 m) of the scale agricultural map patches in this study, polygons with nearest distance <992 m and area <2 hm2 of the map patches were excluded, and the remaining part was used as the final data of the scale agricultural land in the Wuling Mountains region.
In addition, the statistical data of each factor in the indicator system were summarized on a county-level basis, and in ArcGIS, spatial connectivity tools are used to connect these data to county vector files, thereby spatializing the data.
(2) Independent variables: indicator system of influencing factors of large-scale agricultural land
According to the theoretical analysis above, this study selected natural conditions, production factors, and location conditions as the first-level indicators.
Among them, natural conditions are the basic limiting factors of agricultural land distribution. The terrain conditions in the Wuling Mountains area are very complex, and this factor is the main factor affecting the distribution of large-scale agricultural land. Therefore, the terrain was chosen as the secondary index reflecting the natural conditions, and the elevation and slope were taken as the tertiary index.
In terms of production factors, the five factors of labor, capital, science and technology, management, and digitization were selected as secondary indicators. The selection of the three indexes is as follows: the size of the rural population reflects the size of the rural labor force, which is the basic factor of productivity and the basis for the formation of large-scale agricultural land [9].
In terms of capital factors, the sustainable operation of large-scale agricultural land requires the support of the overall economic environment of the region, the direct or indirect investment of government financial funds, or the investment of private funds [14]. Therefore, three indicators, GDP, government fiscal revenue, and household savings level, were selected to reflect the situation of these three aspects, respectively. The level of agricultural technology is an important symbol of agricultural modernization and an important factor in the formation of large-scale agricultural land. Mechanized sowing, planting, harvesting, laser weeding, drone pesticide spraying, and other technologies have improved agricultural production efficiency and reduced the production cost of large-scale agricultural land [19]. Therefore, the total power of agricultural machinery was selected as a specific indicator. In terms of management factors, the influence of market factors was mainly considered. With the opening and activity of the rural land transfer market, a large number of new types of agricultural management entities have emerged, driving the development of the rural economy and promoting the expansion of large-scale agricultural land [23]. Therefore, the number of agricultural market players was chosen as the representative of market factors. In addition, digitization was included as one of the new productivity factors. In recent years, the rapid development of the rural digital economy has produced an important supplement to traditional sales channels. It has expanded the market scale of agricultural products, resulting in a broader market for the high-quality agricultural products previously hidden in the mountains [31]. Therefore, the rural digitalization index was specially added to reflect the impact of the digital economy on large-scale agricultural land.
Finally, because traffic is the most important factor for improving location conditions, traffic accessibility was selected as a secondary index to reflect the location conditions, and specific traffic density, trunk impact degree, and location advantage degree were selected for comprehensive calculation [6].
Based on the analysis above, an index system of influencing factors of large-scale agricultural land distribution patterns in the Wuling Mountains area was established (Table 2).

3.3. Methodology

This study first analyzed the spatial pattern of large-scale agricultural land. Firstly, kernel density analysis was used to analyze the overall spatial distribution of large-scale agricultural land. Then, using spatial autocorrelation, the distribution of global (global autocorrelation) and local (local autocorrelation) clustering characteristics in the large-scale agricultural land was determined.
Secondly, the factors affecting the scale of the agricultural land pattern were analyzed from a global perspective using geographic detectors. Geographic detectors are more suitable for exploring causal relationships in spatial data, especially when both the dependent variable Y and independent variable X are numerical quantities. After discretizing X into type quantities, the relationship between Y and X established using geographic detectors becomes more reliable than using classical regression. This is because having consistent distributions of the two variables is much more difficult in a two-dimensional space than in one-dimensional curves.
Finally, the spatial heterogeneity of factor influence was analyzed from a local perspective. A geographically weighted regression model, which is a local spatial regression model, was used because it can return a regression coefficient for each spatial object, thereby clearly demonstrating the spatial differentiation of the influence of various factors.

3.3.1. Kernel Density Analysis Method

The kernel density analysis method is a non-parametric estimation spatial analysis method used to calculate the density of elements in their surrounding areas and the density of point elements around each output grid pixel [42]. The surface value was the highest at the location of the point and decreased gradually with an increase in the distance from the point. Kernel density analysis can intuitively represent the degree of concentration of the spatial distribution of each land use type change.
f x = 1 n h i = 1 n K n ( x x i h )
where f(x) is the kernel density calculation function at the space position x. In this study, x represents the area of each scale of agricultural land. n is the number of points within the analysis range; in this study, it represents agricultural land patches of other scales within a certain threshold range around each planned calculated-scale agricultural land patch. h is the range threshold, k is the default weight kernel function, and xxi is the distance from point x to point xi.
Based on a comprehensive analysis of the existing research results of large-scale agricultural land and the actual data of this study area, a classification analysis was conducted in the map spot areas of large-scale agricultural land in the Wuling Mountains area. With 12 hm2 (median), 45 hm2 (average), and 100 hm2 as the interruption values, the large-scale agricultural land was divided into small-scale (<12 hm2) and medium-scale (12–45 hm2) areas. Furthermore, large-scale (45–100 hm2) and super-large-scale (>100 hm2) areas were used to observe the distribution characteristics of agricultural land with different scale types. At the county scale, the area of large-scale agricultural land was summarized by county, and the total area was divided into five levels using the natural breakpoint method in ArcGIS.

3.3.2. Spatial Autocorrelation Analysis

Spatial autocorrelation analysis can be used to measure the pattern of the spatial distribution of research objects; that is, to measure whether the spatial distribution of factor objects is a cluster mode, discrete mode, or random mode according to the location and value of the factor [43]. The tool evaluates the significance of the Moran’s I index by calculating its value, z-score, and p-value. Global spatial autocorrelation was used to verify the clustering status of attribute values in the spatial distribution of an entire region. The equation used is as follows:
I = n i = 1 n j = 1 n W i j × i = 1 n j = 1 n w i j ( x i x ¯ ) ( x j x ¯ ) i = 1 n ( x i x ¯ ) 2
where xi and xj are observed values; X is the average value of the observed attribute. In this study, it represents the area of each scale’s agricultural map spot; Wij is the spatial weight adjacency matrix of the space elements of i and j (i, j = 1,2,3…, n), the global Moran’s I value generally ranges from −1 to 1. If it is greater than 0, it means that there is a positive spatial autocorrelation. If it is less than zero, it indicates negative spatial autocorrelation. If its value is close to zero, the distribution is random.
Anselin Local Moran’s I statistics provide a set of weighted elements used to identify hotspots (high-high-value clusters), cold spots (low-low-value clusters), and spatial outliers (low-high or high-low-value clusters) that are statistically significant and can be mapped spatially.
The Moran’s I index was used to analyze the spatial autocorrelation characteristics of large-scale agricultural land. Considering the scale effect, two scales were selected for comparative analysis. The grid was selected as the small-scale analysis unit. In the spatial analysis, the side length of the appropriate grid pixel size was considered the maximum range divided by 100 pixels. Considering the maximum range of the study area and its actual situation, a 5 km grid was selected as the research scale for the analysis of the spatial autocorrelation characteristics of large-scale agricultural land. Additionally, counties were selected as analysis units for larger research scales.

3.3.3. Geographic Detector

Geographic detectors are a group of statistical methods used to detect spatial differentiation and reveal the driving forces behind it. Its core idea is based on the assumption that if an independent variable has a significant influence on a dependent variable, the spatial distributions of the independent and dependent variables should be similar [44]. This study mainly uses differentiation and factor detection to detect the spatial differentiation of Y and to what extent factor X explains the spatial differentiation of attribute Y, measured by the q value, expressed as
q = 1 h = 1 L N h σ h 2 N σ 2 = 1 S S W S S T S S W = h = 1 L N h σ h 2 S S T = N σ 2
where h = 1…, L is the Strata of variable Y or factor X, namely classification or partitioning. In this article, Y represents the area of large-scale agricultural land, X represents various factors in the influencing factor indicator system, and Nh and N are the number of units in layer h and the entire region, respectively. σ2h and σ2 are the variances in the Y values of layer h and the entire region, respectively. SSW and SST are Within Sum of Squares and Total Sum of Squares, respectively. The range of q is [0,1], and the larger the value, the more obvious the spatial differentiation of Y. If the stratification is generated by argument X, a greater value of q indicates that argument X has more explanatory power for attribute Y and vice versa. In the extreme case, a q value of 1 indicates that factor X completely controls the spatial distribution of Y, and a q value of 0 indicates that factor X has nothing to do with Y, indicating that X explains 100 × q% of Y.

3.3.4. Geographical Weighted Regression Model

Geospatial objects have spatial heterogeneity, that is, a change in the relationship or structure of variables caused by a change in geographical location. A geographically weighted regression model, as a local spatial regression model, can reflect this spatial heterogeneity [45]. In this study, GWR was used to analyze the spatial heterogeneity of each influencing factor on the distribution of large-scale agricultural land. A characteristic of GWR is that its regression coefficient has a separate value for each sample point object, so the model can reflect the degree of influence of each variable in different geographical locations in the region and thus understand the spatial differentiation characteristics of the influence of various factors in the study region on explanatory variables. The regression model is as follows:
y i = β 0 u i , v i + k β k ( u i , v i ) x i k + i
where (ui, vi) is the spatial coordinates of the ith sample point, xik is the value of the KTH independent variable at the ith sample point, k is the number of independent variables, and i is the number of sample points. εi is the residual; βk (ui, vi) is the value of the continuous function βk(u, v) at point i. In this article, Y represents the area of large-scale agricultural land, and X represents various factors in the influencing factor indicator system.

3.3.5. Traffic Accessibility Calculation

Traffic accessibility (TA) is an index used to comprehensively characterize regional traffic location conditions. This study refers to the traffic accessibility calculation model constructed by Feng Zhiming et al. [46]. and combines the road data of railways, highways, national highways, trunk airports, etc., to measure the density of traffic networks (MD), traffic trunk impacts (BD), and location advantages (YD). The density of the traffic network was measured from the density of the highway, that is, the ratio of highway length (L) to county area (S). The impact level of the traffic trunk was measured from three perspectives: distance from the highway (RL), distance from the railway (TL), and distance from the airport (AL). The degree of location advantage is measured by the distance between the county center and the central city (UL) to reflect the location conditions and advantages of each county. To eliminate the impact of the dimensions, this study carried out normalization, which was performed for each index [47].
T A = 1 3 × ( M D + B D + Y D ) M D = L ÷ S B D = 1 3 × ( R L + T L + A L ) Y D = U L

4. Result

4.1. Spatial Pattern Characteristics of Large-Scale Agricultural Land in the Wuling Mountains

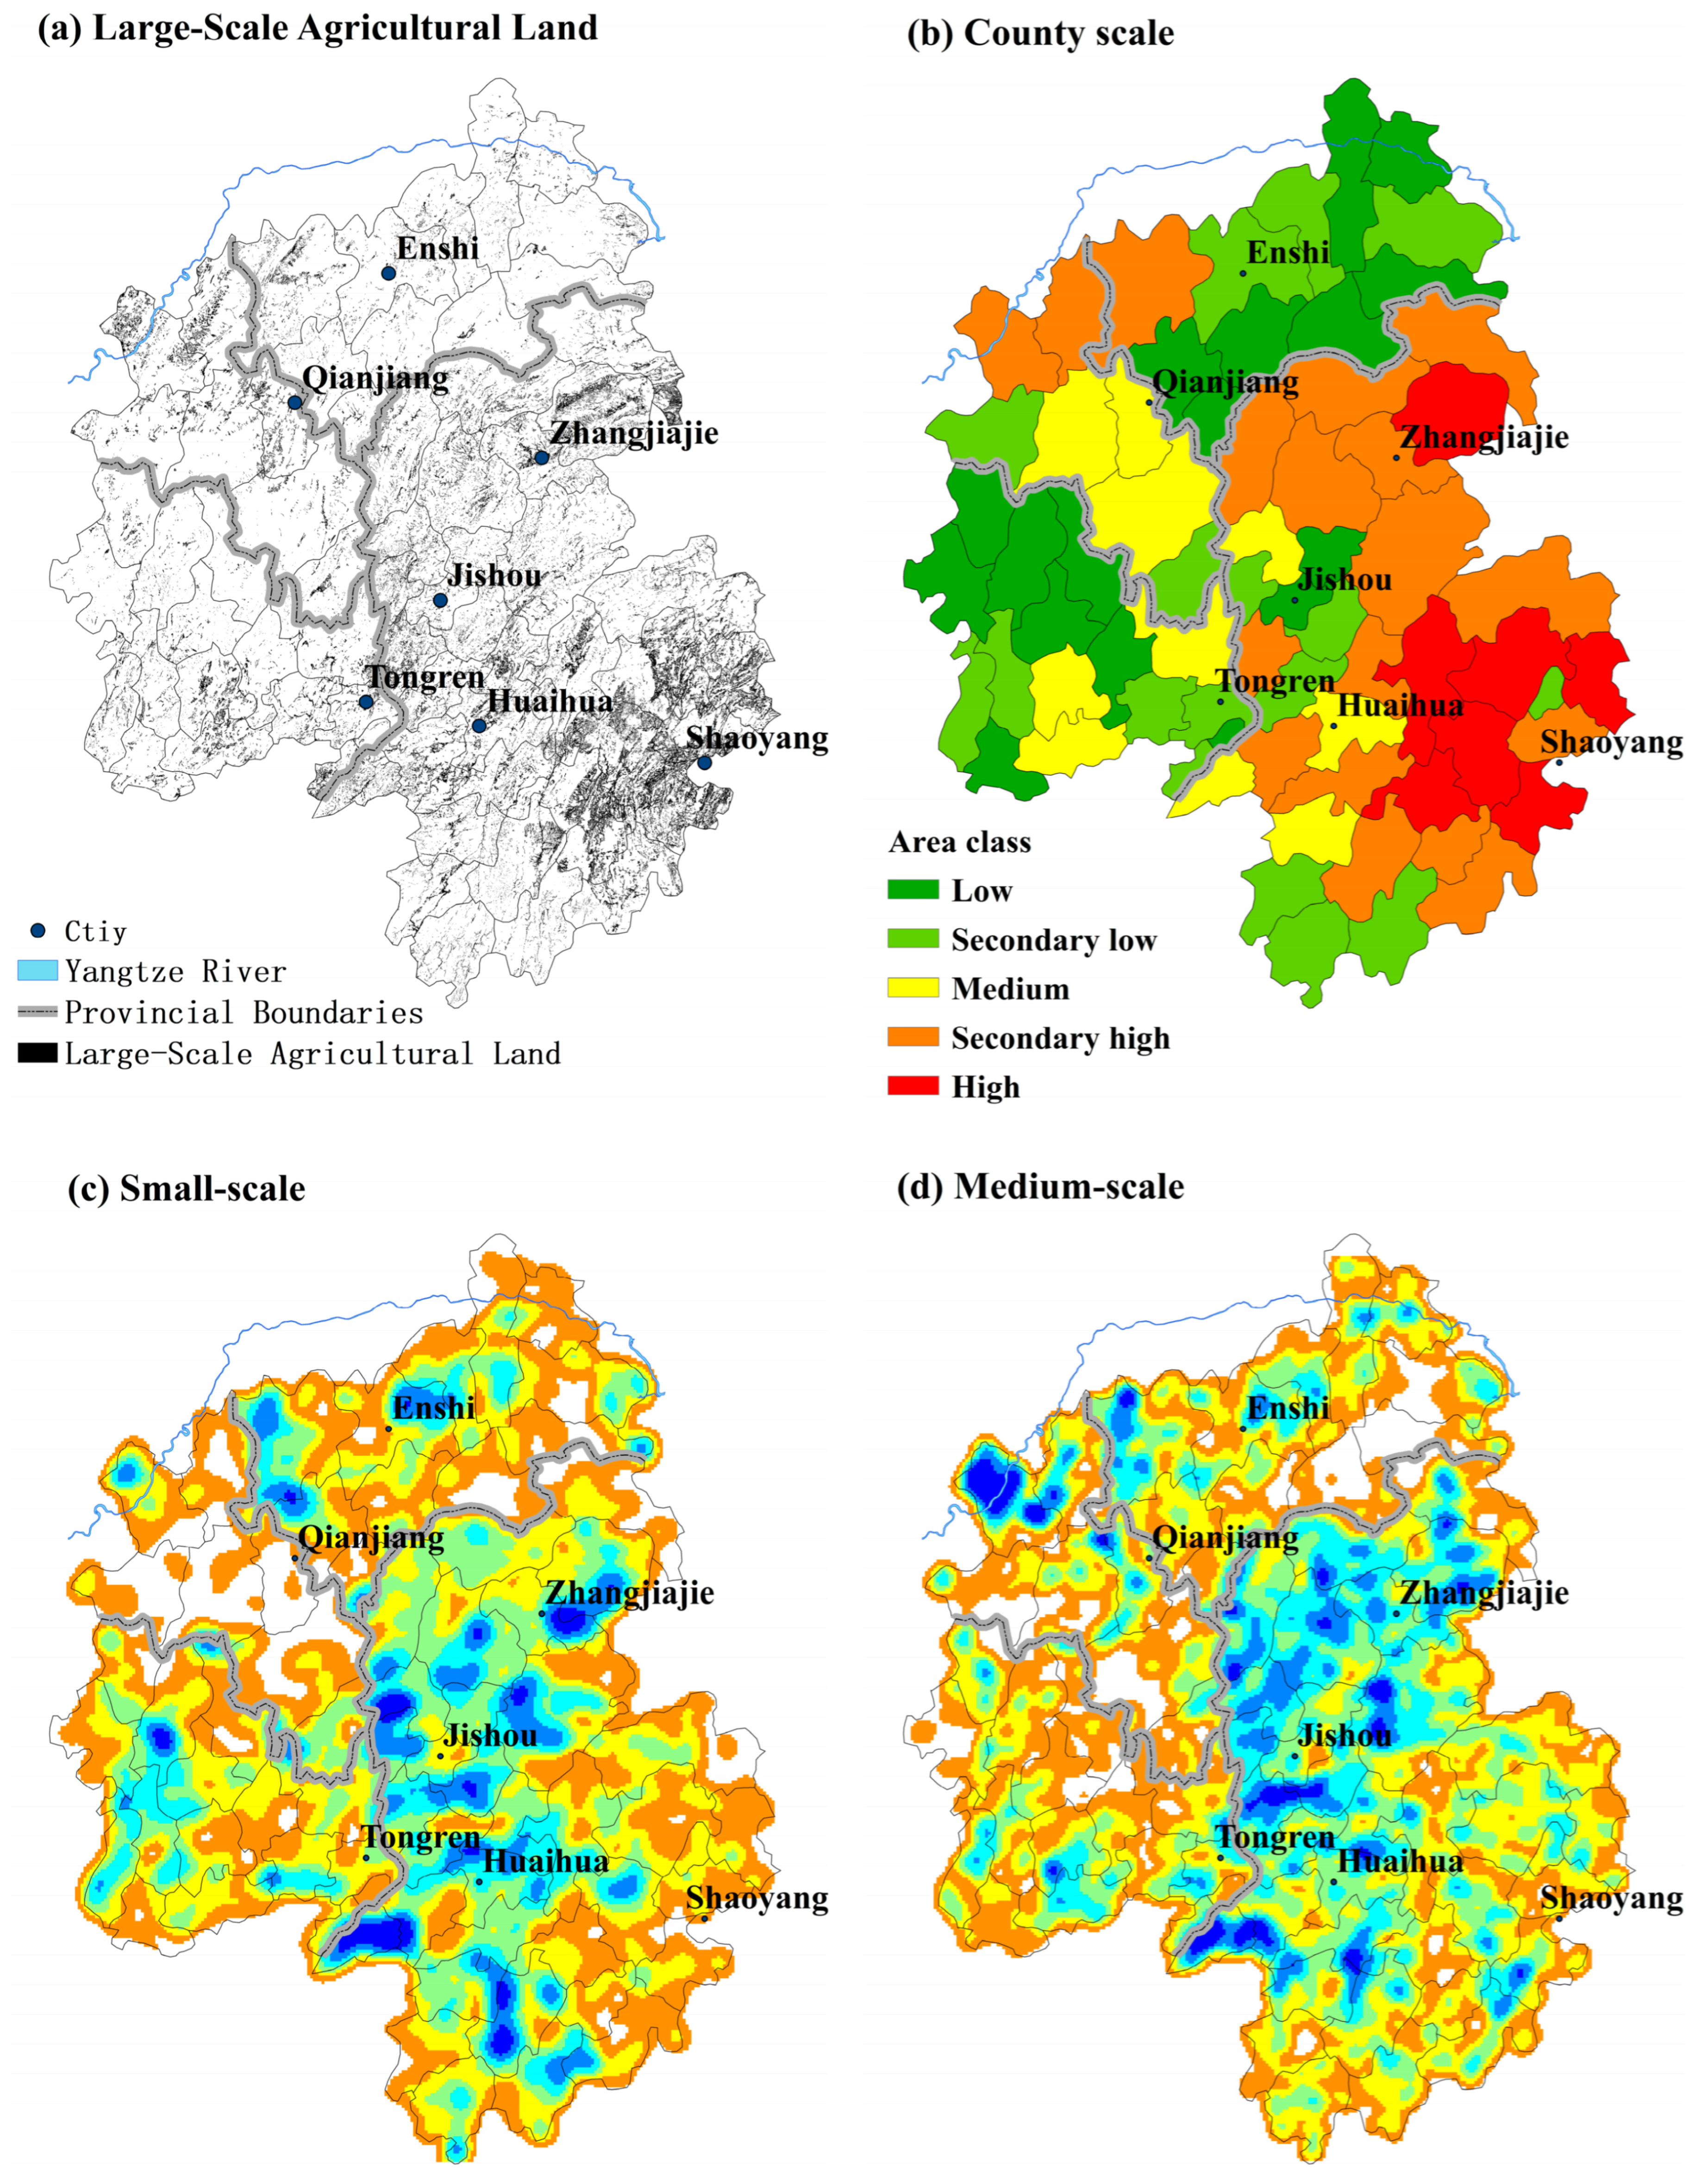
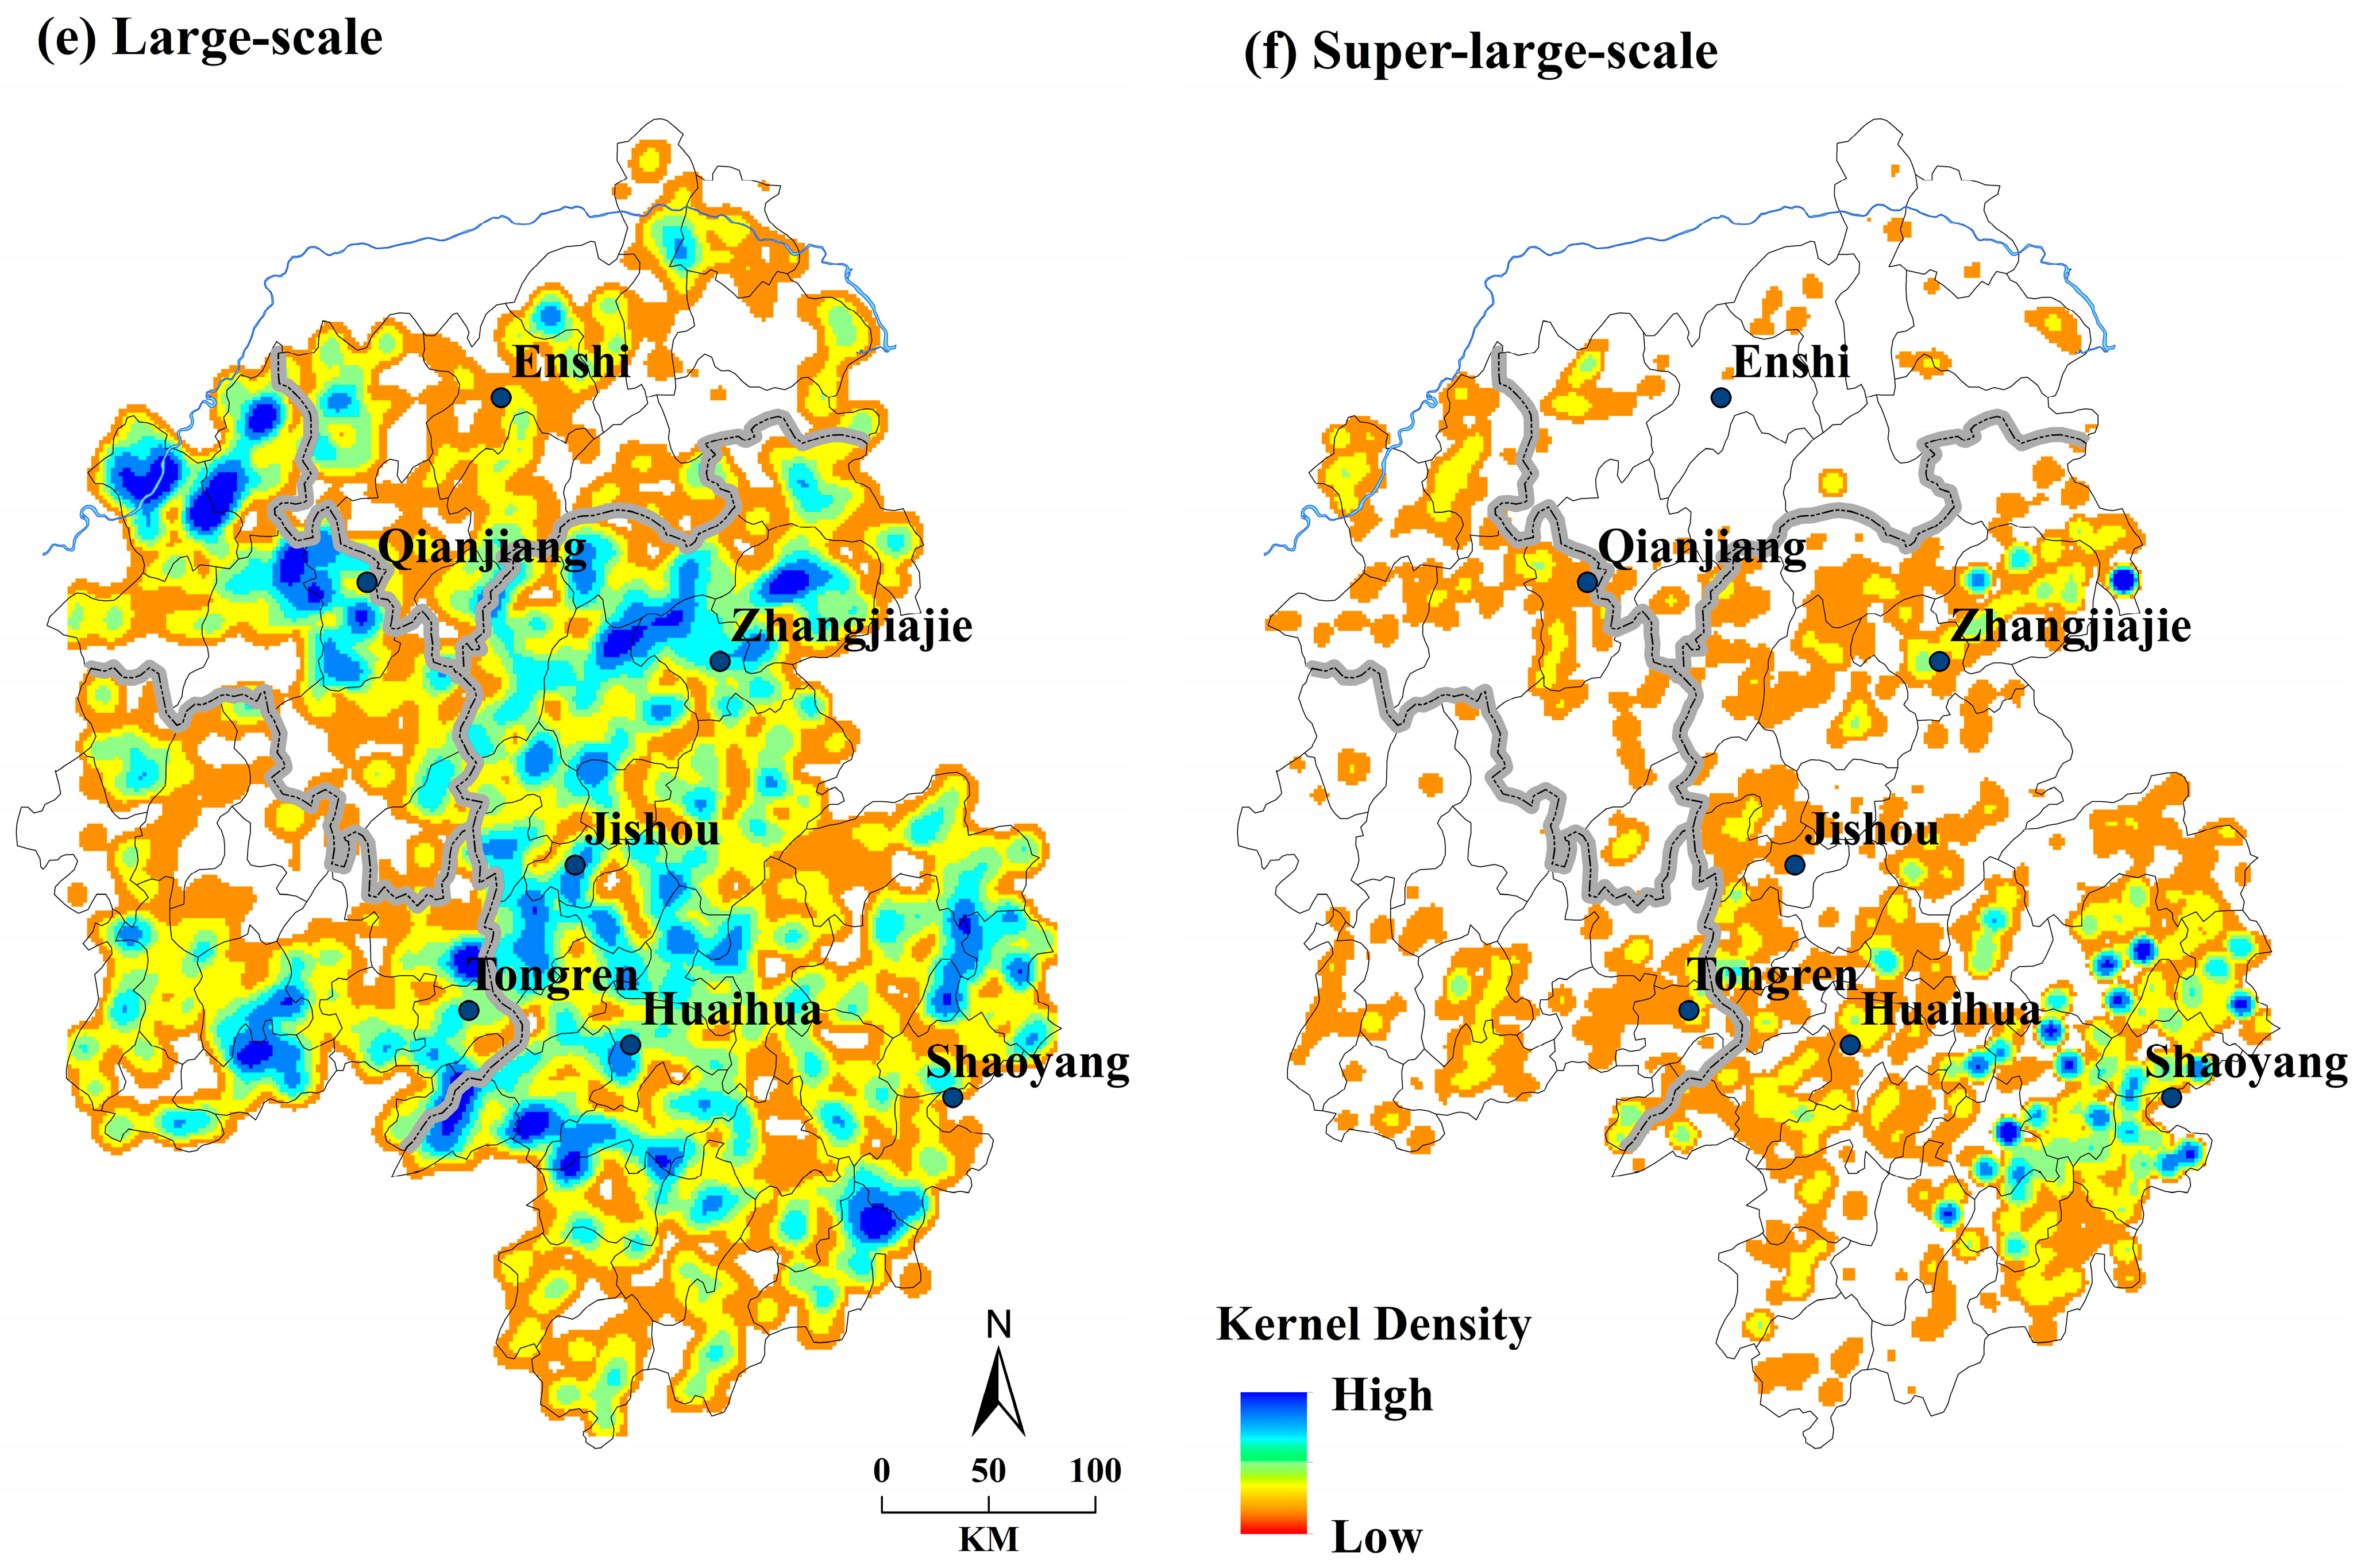
4.1.1. Spatial Distribution Pattern of Agricultural Land of Different Types and Scales

Kernel density analysis based on the map patch area showed that the number of small-scale farmers’ map patches was 17103, which was large and widely distributed throughout the Wuling Mountains area (Figure 3c). In general, areas with relatively concentrated densities are located in Hunan Province. Other provinces also showed similar distributions. The number of map spots of medium-scale farmers was 11,932, which was also widely distributed across the entire area of the Wuling Mountains (Figure 3d). In general, compared with small-scale agricultural land, the high-density area of medium-scale agricultural land was more concentrated in the middle of the Wuling Mountains. The number of map spots of large-scale agricultural land was 3123, which is relatively small and distributed evenly across the entire area of the Wuling Mountains (Figure 3e). Compared with the previous two, high-density areas were more evenly distributed in all provinces. The number of spots on the super-scale farm map was 2357, which was relatively small (Figure 3f). Hunan Province had the largest distribution, followed by Chongqing, Hubei, and Guizhou. The high-density area is mainly in the easternmost area of the Wuling Mountains, Hunan Province. Finally, an overall analysis of the area kernel density of all-scale farming map patches showed that the high-density area was mainly distributed in the southeastern region of the Wuling Mountains, the middle region was mainly distributed in the medium-density area, and the low-density area was mainly distributed in the northern and southwestern regions.

4.1.2. Spatial Distribution Characteristics of Large-Scale Agricultural Land at County Scale

The results showed that the overall pattern was high in the east, low in the west, and moderate in the central region. The high-grade areas are mainly located in the southeastern counties of the Wuling Mountains, whereas most of the counties and cities in neighboring Hunan Province belong to middle- and high-grade areas, and a few counties and cities near Guizhou Province belong to middle- and low-grade areas. Most counties and cities in Chongqing also belong to the middle and high levels, whereas most counties and cities in Guizhou and Hubei are in the middle and low levels (Figure 3b).

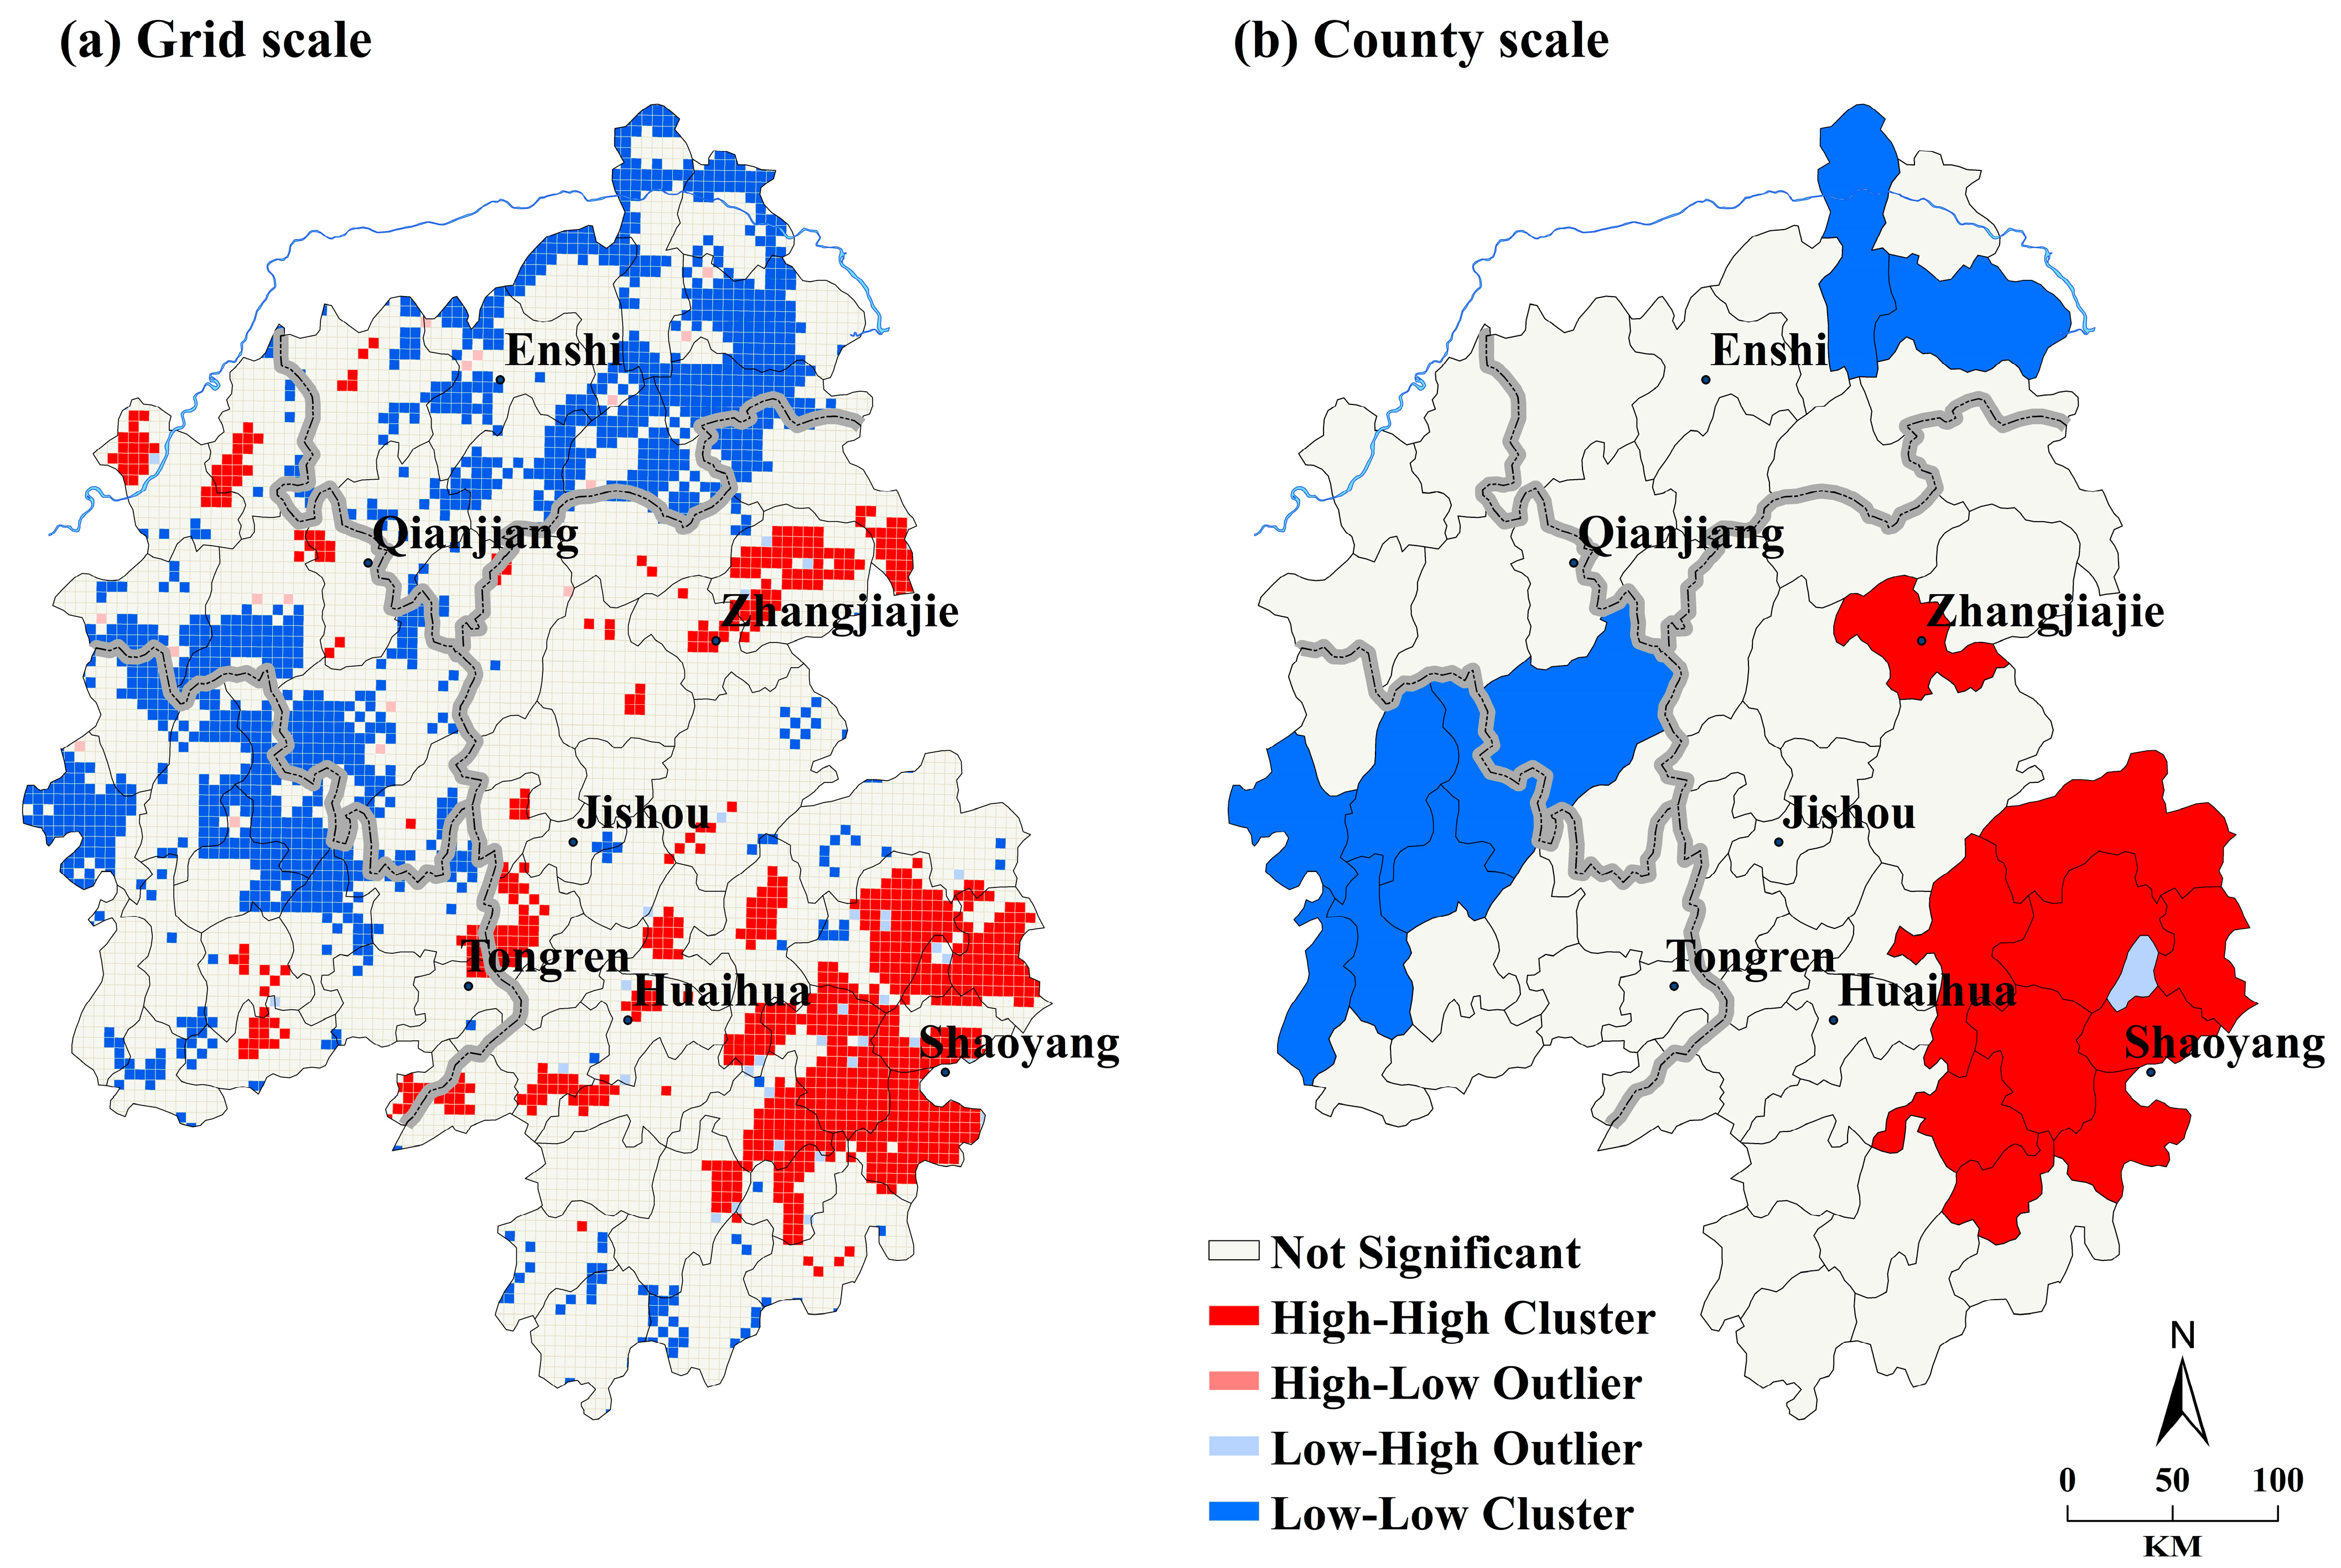
4.1.3. Spatial Autocorrelation Analysis of Large-Scale Agricultural Land

The results of global autocorrelation analysis showed that the Moran I values at grid and county scales were 0.631 and 0.541, Z values were 106.06 and 63.2104, and P-values were 0.001 and 0.001, respectively. This indicates that large-scale agricultural land in the Wuling Mountains presents a positive spatial autocorrelation on the grid or county scale; that is, the spatial distribution of large-scale agricultural land tends to cluster overall. The autocorrelation was more pronounced at smaller scales.
At the county scale, the high-value accumulation area (H-H) was mainly located around Shaoyang southeast of the Wuling Mountains, and the H-L anomaly was located in Lengshuijiang City. Another relatively small H-H agglomeration area is located in Zhangjiajie. Low-value accumulation areas (L-L) were mainly located southwest of the Wuling Mountains and included six counties in Guizhou and one county in Chongqing. The other area is located in the two northernmost counties of the Wuling Mountains, and its scope is relatively small (Figure 4b). The spatial autocorrelation characteristics on the grid scale can reflect more details: the high-value accumulation area (H-H) is mainly distributed in Hunan, except for Shaoyang and Zhangjiajie; there are a small number of distributions in Huaihua and Tongren and a small distribution in Chongqing along the Yangtze River. Low-value cluster areas (L-L) were mainly concentrated in most parts of Hubei Province and the border areas between Chongqing and Guizhou. Generally, it has a high distribution in the east and a low distribution in the west (Figure 4a).

4.2. Analysis of Influencing Factors of Spatial Pattern of Large-Scale Agricultural Land in the Wuling Mountains Area

4.2.1. Geographical Exploration of Influencing Factors of Scaling Agricultural Land

The degree of effect and statistical significance of each influencing factor on the agricultural land scale were calculated using a geographic detector. The results showed that the P-values of all other factors were less than 5%, except for the digital economy index. This shows that the digital economy has no obvious influence on the scale of the agricultural economy in the Wuling Mountains area at present; that is, the digital economy has not effectively promoted the scale economic effect of agriculture in the Wuling Mountains area. The q statistics of other factors with statistical significance were sorted, and the results were as follows: Agricultural Labor Force > Balance of Savings Deposits > Index Total Power of Agricultural Machinery > number of agricultural companies > general public budget revenue > altitude > GDP > Traffic Accessibility > slope (Table 3).
This result shows that the rural labor force remains the primary factor affecting the distribution of large-scale agricultural land. Second, economic factors are also important factors that affect agricultural land scale. Among the economic factors, savings deposit balance > general public budget revenue > GDP, which further reveals that the importance of private capital level to large-scale agricultural land in the Wuling Mountains area is the primary economic factor. The second is government investment, which shows that the government’s financial support and even direct investment still have a certain impact on regional agricultural economies. However, GDP has a relatively small impact, which also indicates that large-scale agricultural land is not very strongly dependent on the overall economic environment of the region. Third, the influence of total mechanical power on large-scale agricultural land is also important, which means that the application level of regional science and technology has a significant impact on large-scale agricultural land. Fourth, the number of agricultural companies had a relatively high impact on large-scale agricultural land, indicating that market mechanisms had a certain impact on the scale of agricultural land. In combination with the above economic factors, the level of private capital and active market mechanisms are important factors that affect the scale of agricultural land in the Wuling Mountains area. Fifth, among the natural factors, altitude had a relatively greater impact, indicating that various crops planted in the Wuling Mountains area were affected by altitude. In contrast, the slope had a relatively low impact. Finally, the influence of the transportation advantage on large-scale agricultural land is relatively small, which may be related to the fact that the Wuling Mountains area already has universal and convenient transportation. The rapid development of transportation in the Wuling Mountains area in recent decades has made transportation no longer the main factor restricting regional development. Agricultural products in all regions can be transported rapidly, relying on perfect transportation. Therefore, the effect of location on the scale of agricultural land was relatively low.

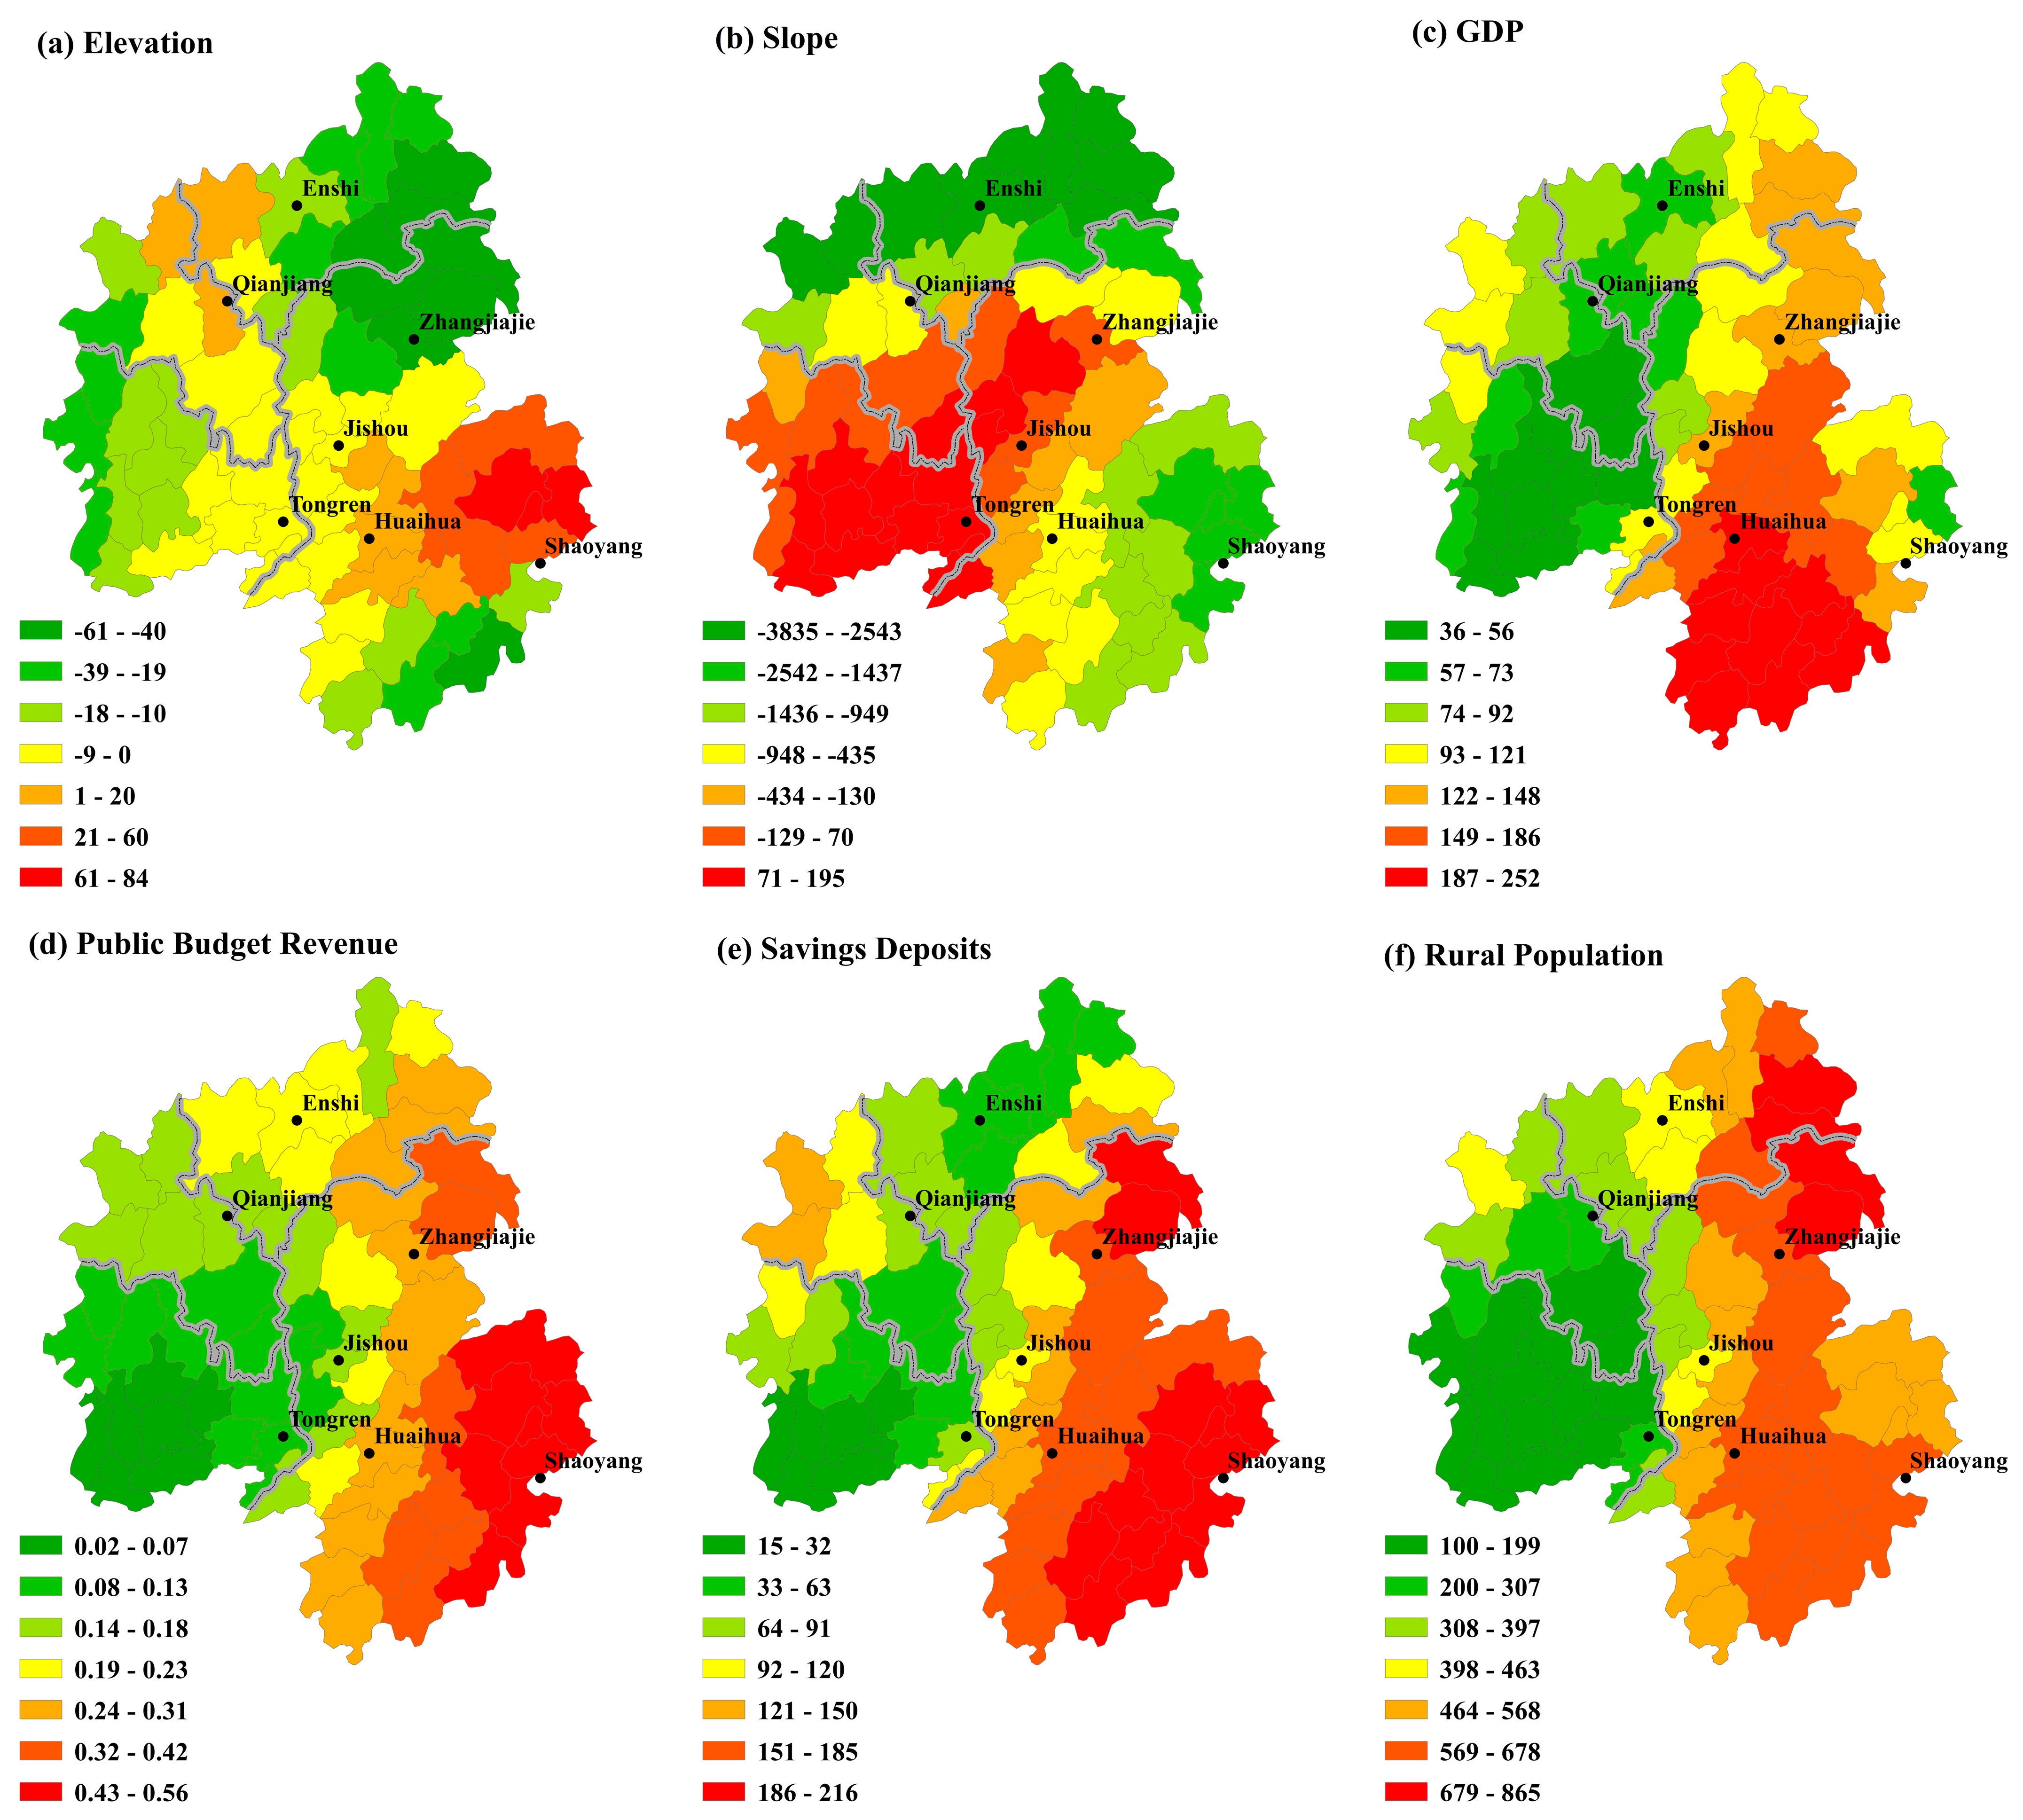
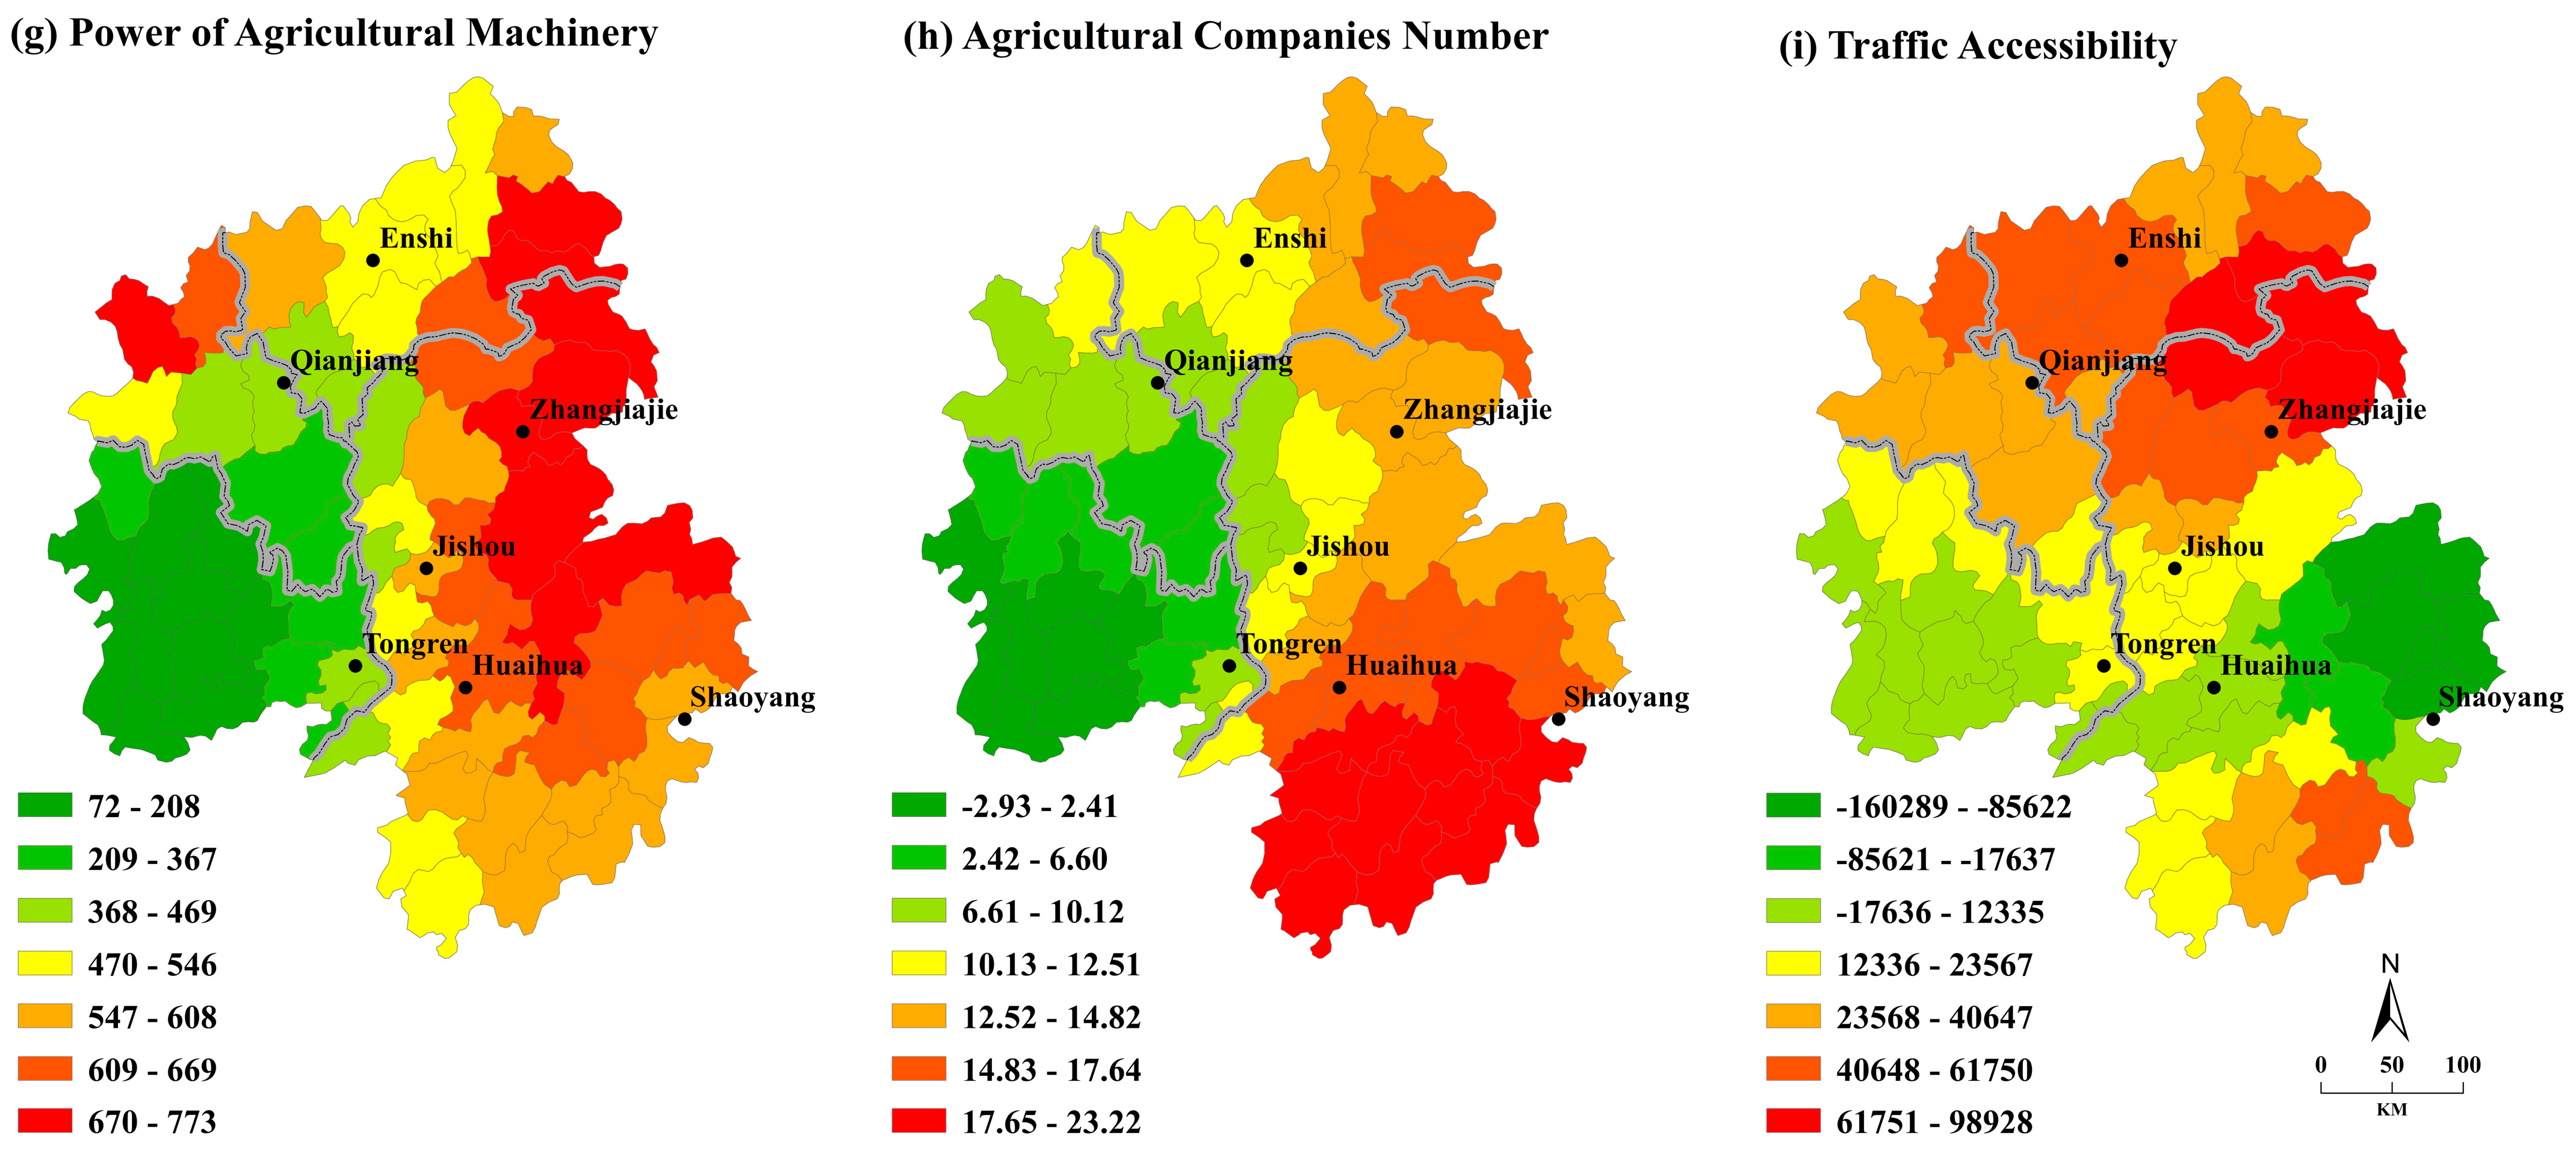
4.2.2. Spatial Heterogeneity Analysis of Influencing Factors of Large-scale Agricultural Land

The numerical factors that were not significant in the geographical detector results mentioned above were removed, the other nine factors were used as independent variables, the scale of agricultural land area was used as the dependent variable, and the GWR model was used for modeling.
The R2 and R2 adjusted values of the model indicate that the GWR model has better fitting results compared with the OLS model (Table 4). The variance inflation factor (VIF) of each parameter was well below 7.5, and there was no multicollinearity problem with each factor (Table 5). Since GWR returns a regression coefficient and standard error for all spatial units, we use the average t-statistic of all spatial units to test the significance level (Table 5). Overall, all factors exhibit statistical significance.
The regression coefficient exhibited spatial heterogeneity in different regions, and the results were analyzed as follows:
(1) Geographic factors. Elevation was negatively correlated with most areas and positively correlated with a few counties and cities with low altitudes (Figure 5a). This indicates that crops planted on large-scale agricultural land in the Wuling Mountains area generally need to be located at a certain altitude, but not too high. The slopes present similar characteristics: most are negatively correlated, while a few are positively correlated (Figure 5b). Therefore, the spatial heterogeneity of physical geographical factors indicates that because the crops grown in the Wuling Mountains area are mainly cash crops cultivated in dry farming, large-scale agricultural land usually requires a certain elevation and slope, but it should not be too high or too steep.
(2) Economic factors. The regression coefficients of the three economic factors showed similar spatial differentiation characteristics; the general trend was higher in the east and lower in the west. In terms of provinces, the regression coefficient for Hunan was generally the highest, followed by Hubei, Chongqing, and Guizhou, which is generally low. This indicates that economic factors, whether private capital (Figure 5e), government financing (Figure 5d), or the local economic level (Figure 5c), have a strong driving effect on the scale of agricultural land in Hunan, while Guizhou still has room for improvement.
(3) Population factor. The regression coefficients of population factors also showed a trend of being high in the east and low in the west, but the range of high values was larger than that of economic factors (Figure 5f). By province, several counties and cities east of Hunan and Hubei belonged to the high-value area, Chongqing belonged to the middle-value area, and Guizhou mostly belonged to the low-value area. This indicates that the influence of population factors on the scale of agricultural land showed a trend in Hunan, Hubei, Chongqing, and Guizhou.
(4) Scientific and technological factors. The regression coefficient of the total mechanical power index was also high in the east and low in the west, and the range of high-value areas moved upward relative to the population factor (Figure 5g). Although the high-value areas were also mainly located in Hubei and Hunan, the number of counties and cities in Hubei increased relatively, while those in Hunan decreased somewhat. In addition, several counties and cities along the Yangtze River in Chongqing are high-value areas. Most other counties and cities in Guizhou and Chongqing are low-value areas. However, in general, it still shows that the influence of science and technology levels on the scale of agricultural land also shows the trend of Hunan > Hubei > Chongqing > Guizhou.
(5) Institutional factors. The regression coefficient of the number of market players is also high in the east and low in the west overall, but the range of the high-value area is different from the previous indicators; the high-value area is mainly located in Shaoyang and Huaihua in the southern part of Hunan. Most counties and cities in Hubei and Hunan belong to the medium-high-value region, and most areas of Chongqing and Guizhou are low-value areas (Figure 5h). In general, the influence of market mechanisms on the scale of agricultural land followed the trend of Hunan, Hubei, Chongqing, and Guizhou.
(6) Traffic factors. Compared with the above indices, the spatial heterogeneity of the regression coefficient of traffic dominance showed a significant difference. The overall trend was high in the north and low in the south. The high-value areas were mainly located in Hubei and Chongqing, whereas the other areas were not obvious, and there was a negative correlation in some areas of Hunan and Guizhou. This indicates that transportation location factors have a significant impact on agricultural land scaling in Hubei and Chongqing but have no significant impact on other areas (Figure 5i).

5. Discussion

5.1. Analysis of the Mechanism of Factors Influencing Scale Agricultural Land from the Perspective of Spatial Heterogeneity

Natural and location conditions, as well as production factors, have significant impacts on the scale of the agricultural land pattern; however, their degree of impact varies significantly. Natural conditions can limit the scale of agricultural land, but their influence can weaken with improvements in productivity and technological capabilities. In early research, natural factors primarily determined the transfer of agricultural land, in which the transfer in plain areas was much greater than that in mountainous areas [7]. However, a recent study has shown that the speed of land transfer in mountainous areas has been accelerated [8]. With the influence of factors such as technological level, government investment, and market mechanisms, natural conditions are no longer the main factor limiting the development of regional-scale agricultural land [10]. This is also reflected in the location conditions, in which transportation plays an important role in the agricultural land transfer process. This is mainly because the large-scale operation of agricultural land transfer, especially that of agricultural enterprises, places higher requirements on the transportation of raw materials and agricultural products, leading to the dependence of large-scale agricultural land on transportation conditions. Location conditions were the main factor affecting large-scale agricultural land, and transportation conditions and land transfer were closely correlated [7,11]. However, although the impact of location conditions remains, transportation condition improvements in various regions have decreased their influence in some areas [27]. Recently, various production factors have become the main factors driving the development of large-scale agricultural land. In the early stages, government input factors were the main factors affecting large-scale agricultural land development in a region [7]. With the market-oriented land reform, the stability of new business entities and land property rights has become an important factor [13]. In areas with advanced digital transformation, digital factors, such as the Internet, have become important factors [20,31,32].
This study determined the heterogeneity of different influencing factors by integrating the three major factors of nature, location, and production. From the global perspective of geographical detectors, the overall performance was ranked as follows: production > location > natural factors. Specifically, in terms of production factors, technological and market factors ranked higher than other factors, while digital factors were not significant. This could be attributed to the transformation phase of the Wuling Mountains area in recent years, mainly relying on central poverty alleviation funds and local government investment in the early stages. This has greatly improved hardware conditions, such as regional infrastructure, and helped complete the original accumulation of capital and hardware for the scale of agricultural land. At present, the government-led investment stage has been completed and is shifting toward a stage where private funds are the main focus, with the goal of improving software conditions such as market system construction and technological support. Therefore, the heterogeneity of the influence of global factors indicates that market (number of agricultural companies and household savings) and technological (total mechanization) factors are currently dominant. Although the indicators representing government investment (government finance and GDP) and transportation location are still important, their influence has become second to market factors.
In addition, due to the relatively backward digital construction in the Wuling Mountains area, which has yet to enter the digital stage, the influence of digital indicators is not significant. Similarly, although natural conditions are also important factors, suitable infrastructure construction, diversified three-dimensional planting structures, and modern agricultural technology have already crossed the stage of being limited by natural conditions. Currently, the influence of natural conditions is relatively weak. Furthermore, the agricultural population remains the most important factor because even in the era of widespread mechanization, the special nature of mountainous terrain does not permit the replacement of manual labor on a large scale, such as that in plain areas. Population influences both the production and consumption sectors, and the consumption market formed by a large population is also an important reason for promoting the formation of large-scale agricultural land. Therefore, the degree of influence of different factors on the scale of agricultural land is determined by the stage of regional development. In its early stages, natural conditions had significant limitations. With the development of the region and improvement of transportation conditions, location conditions have become the dominant factor, and the limitations of natural conditions have weakened. As regional productivity further developed, production factors have become dominant. Specific production factors such as government, market, technology, and digitization also take turns dominating the different stages of development.
From a local perspective, the influence of various factors in different regions demonstrates spatial heterogeneity. Within the Three Gorges Reservoir area, human factors, such as labor force and agricultural population, play a more significant role in towns with relatively backward urban–rural development, whereas towns with faster urban–rural development are mainly driven by economic and social factors [9]. The driving force of natural factors depends on the orientation of regional industrial policies; that is, the natural influencing factors of different crops vary [18]. A study on the impact of market entities on land transfer determined that market entities had a greater impact on land transfer in villages located closer to cities than in villages far from cities [14]. In a study on digital factors, the positive impact of Internet use on land transfer was more significant in economically developed regions and higher-income farmers [31].
The spatial heterogeneity in the influence of these factors with the GWR model was further analyzed. From a local perspective, the influence of different factors also exhibited spatial heterogeneity. In the internal region of the Wuling Mountains, the regression coefficients of various production factors were generally high in the east and low in the west. The value of the location factor was high in the north and low in the south. Moreover, the high-value areas of natural factors are more consistent with moderately elevated areas. The natural geographical pattern of the Wuling Mountains region is characterized by many high mountains and relatively high terrain in the west and many river valleys and relatively flat terrain in the east. Because the scale of agricultural land in mountainous areas is used for more economic crops such as tea and fruit trees, it requires a certain elevation and slope that must not be too high or steep. Therefore, the regional factors of medium altitude and slope have a higher impact.
In terms of the transportation pattern, the area centered around Huaihua City in the southeast is the transportation center of the Wulingshan area, which is a hub for north–south high-speed railways and highways. Here, transportation facilities such as airports and ports are complete. Overall, transportation in the southern region is better than in the northern region because the Wuling Mountains area has reached a stage of development driven by transportation infrastructure. Therefore, location factors have a lower impact in areas with developed transportation and a greater impact in areas with underdeveloped transportation. The economic and geographical pattern reveals that the eastern region is more developed than the western region. Because the Wuling Mountains area is currently in a stage of regional development driven by various production factors, each production factor has a higher impact in economically developed regions. Therefore, the spatial heterogeneity of the influence of various factors in a local region is determined by its development stage. Factors that are in line with the development stage of the region have a greater impact; otherwise, their influence is smaller.
In summary, the mechanisms that affect the formation of large-scale agricultural land can be summarized from the perspective of heterogeneity. Natural conditions, location conditions, and production factors play a negative, positive, and positive role in the formation of large-scale agricultural land, respectively. Heterogeneity can also be observed in the influence of various factors. In particular, the stage of regional development is the fundamental reason for the heterogeneity of the influence of various factors, which first increases and then decreases as the regional development stage advances. The influence of factors suitable for the regional development stage reaches its peak.

5.2. Policy Implication

In recent years, the western mountainous areas of China, represented by the Wuling Mountains area, have gone through the stage dominated by government investment and entered the stage of rural economic development driven by market, science, and technology, represented by diversified management subjects. At present, they have not reached the stage of digital agriculture. In the Wuling Mountains area, after more than 10 years of large investment in poverty alleviation, the construction of infrastructure and government financial capacity are no longer the most important factors affecting the large-scale agricultural land. While strengthening appropriate investment, local governments should transfer more of the market to new business entities. At the same time, they should enhance the cultivation of a new rural collective economy and various market entities and also give preference to private market entities for various fiscal, tax, financial, and other specific policies for rural revitalization. Government should pay more attention to the fields of agricultural science and technology. Large-scale agricultural land requires the support of agricultural science and technology and equipment, which requires the input of the people and also the initiative of local governments to cultivate scientific and technological agricultural enterprises and protect the intellectual property rights of key technologies. In addition, the digital economy plays a weak role in the scale of agricultural land in the Wuling Mountains area. At present, China is accelerating the construction of the digital countryside, and the Wuling Mountains area should seize the opportunity to strengthen its digital infrastructure, guide local enterprises to develop smart agriculture, promote the upgrading of rural e-commerce, and cultivate and expand new rural business forms and models.
Coordinated development within and among regions must be promoted. The gap between different areas of the Wuling Mountains still exists. In the early stage, this gap was caused by location differences caused by natural geographical conditions. However, after subsequently entering the marketization stage, regions with location advantages tend to attract more investment from market factors. If this is not balanced, the gap may increase. Local governments should play the role of balancer in this area and can rebalance through regional territorial space planning. At present, the territorial spatial planning of the Wuling Mountains area is mostly based on administrative regions, which hinders cross-regional coordination. The Wuling Mountains area, as a whole region with common geographical conditions, economic development, and culture, can be considered for regional overall planning. Thus, the advantageous resources will be integrated, and a regional coordinated development pattern of advantageous regions driving disadvantaged regions will form. For example, modern transportation is an important means to narrow the regional gap. Although the major cities in the Wuling Mountains provinces are connected to the expressway and high-speed railway network, the road network density in Guizhou is still significantly lower than that in Hubei and Hunan provinces, which indicates a need for greater support for Guizhou in subsequent investment. As another example, the Wuling Mountains region itself has similar cultural and historical traditions and similar national cultural customs, so it can integrate corresponding superior resources through the overall planning of the region to form a path of all-encompassing coordinated development.

5.3. Limitations and Future Development Direction

In this study, cross-sectional data were used to quantitatively analyze the influencing factors of large-scale agricultural land, and the formation mechanism of the spatial pattern of large-scale agricultural land on the Wuling Mountains was discussed based on the conclusions of relevant references. A combination of qualitative and quantitative methods was used. Regarding the discussion of time series and stages in the formation mechanism, if the corresponding historical data can support the quantitative analysis of the time division of influencing factors in different historical stages, research on the formation mechanism of large-scale agricultural land can be conducted in more depth. In future studies, multi-period panel data can be used, combined with the corresponding time series regression models (GTWR, etc.), to quantitatively analyze the spatiotemporal differences of factors influencing the scale of agricultural land patterns and further analyze their formation mechanism. In addition, the expansion of large-scale agricultural land changes the original ecosystem of a region. Agriculture in mountainous areas has transitioned from the previous small-scale farming model to a large-scale and intensive model. This will inevitably bring about the impact of regional biodiversity and ecosystem services. Therefore, the next step should focus on the impact of large-scale agricultural land expansion on various ecosystem services.

6. Conclusions

Combining theoretical analysis, this study analyzed the spatial distribution characteristics of large-scale agricultural land in the Wuling Mountains area, evaluated the impact of various influencing factors on the pattern of large-scale agricultural land and the heterogeneity effects it produces, and explored the formation mechanism of the spatial pattern of large-scale agricultural land from the perspective of spatial heterogeneity. The main conclusions are as follows:
(1) The pattern of large-scale agricultural land in the Wuling Mountains has evident agglomeration and spatial differentiation. Overall, the area of large-scale agricultural land exhibits a high distribution pattern in the east and a low distribution pattern in the west.
(2) The influencing factors of large-scale agricultural land exhibit heterogeneity from a global perspective because the Wuling Mountains are currently in the market-oriented transformation stage. The degree of influence of different factors on the scale of agricultural land is determined by the stage of regional development. In the early stages of regional development, natural conditions have significant limitations. With the development of the region and the improvement of transportation conditions, location conditions have become the dominant factor, and the limitations of natural conditions have weakened. With the further development of regional productivity, production factors have become dominant.
(3) From a local perspective, the influence of different factors is determined by the natural, transportation, and economic geographies of the Wuling Mountains. The spatial pattern of nature, transportation, and economy affects the development level of a region, and the spatial heterogeneity of the influence of various factors in a local region is determined by the development stage of that region. The factors that conform to the development stage of that region have a greater impact. On the contrary, the smaller the influence.
(4) In terms of the formation mechanism of large-scale agricultural land patterns, natural conditions, location conditions, and production factors have varying levels of negative, positive, and positive influences on the scale of agricultural land, respectively, based on the stage of regional development. The stage of regional development is the fundamental reason for the heterogeneity of the influence of various factors. The influence of various factors will first increase and then decrease as the regional development stage advances, and the influence of factors that are suitable for the regional development stage will be greater.
This study explored a research path that combines the explicit and implicit attributes of large-scale agricultural land and delved deeper into their formation mechanism from the perspective of heterogeneity. This study can provide a new perspective for the improvement of theories related to land use transformation. In practice, it can provide decision makers in mountainous land management departments with differentiated policy recommendations for agricultural land scale management.

Author Contributions

Conceptualization, Y.C.; methodology, Y.C.; software, W.Z.; validation, S.Y.; formal analysis, C.L.; investigation, Y.L.; resources, Y.C.; data curation, W.Z.; writing—original draft preparation, Y.C.; writing—review and editing, Y.C.; visualization, W.L.; supervision, C.L.; project administration, Y.C.; funding acquisition, C.L. All authors have read and agreed to the published version of the manuscript.

Funding

This research was funded by the Humanities and Social Sciences Fund of the Ministry of Education (Grant No.BSQ17007), The National Social Science Fund of China (Grant No.GSQ20003), and a special fund project for basic scientific research business expenses of central universities (Grant No.CPT22011).

Data Availability Statement

The data presented in this study are available on request from the corresponding author.

Conflicts of Interest

The authors declare no conflict of interest.

References

  1. Song, X.Q. Discussion on land use transition research framework. Acta Geogr. Sin. 2017, 72, 471–487. [Google Scholar]
  2. Foley, J.A. Global Consequences of Land Use. Science 2005, 309, 570–574. [Google Scholar] [CrossRef] [PubMed]
  3. Wen, T.J.; Lau, K.; Cheng, C.W.; He, H.L.; Qiu, J.S. Ecological Civilization, Indigenous Culture, and Rural Reconstruction in China. Mon. Rev. 2012, 63, 29–35. [Google Scholar]
  4. Drummond, M.A.; Griffith, G.E.; Auch, R.F.; Stier, M.P.; Taylor, J.L.; Hester, D.J.; Riegle, J.L.; McBeth, J.L. Understanding recurrent land use processes and long-term transitions in the dynamic south-central United States, c. 1800 to 2006. Land Use Policy 2017, 68, 345–354. [Google Scholar] [CrossRef]
  5. Levers, C.; Muller, D.; Erb, K.; Haberl, H.; Jepsen, M.R.; Metzger, M.J.; Meyfroidt, P.; Plieninger, T.; Plutzar, C.; Sturck, J.; et al. Archetypical patterns and trajectories of land systems in Europe. Reg. Environ. Change 2018, 18, 715–732. [Google Scholar] [CrossRef]
  6. Karayalcin, C.; Pintea, M. The role of productivity, transportation costs, and barriers to intersectoral mobility in structural transformation. Econ. Model. 2022, 108, 105759. [Google Scholar] [CrossRef]
  7. Jianping, Y.; Lei, F.; Yan, J.; Prosterman, R.; Keliang, Z. Survey of rural land use rights in China in 2008—Survey results and policy recommendations in 17 provinces. Manag. World 2010, 64–73. [Google Scholar] [CrossRef]
  8. Wang, Y.; Li, X.; Xin, L.; Tan, M.; Jiang, M. Regional differences of land circulation in China and its drivers: Based on 2003–2013 rural fixed observation points data. J. Geogr. Sci. 2018, 28, 707–724. [Google Scholar] [CrossRef]
  9. Liang, X.Y.; Li, Y.B. Spatio-temporal features of scaling farmland and its corresponding driving mechanism in Three Gorges Reservoir Area. J. Geogr. Sci. 2019, 29, 563–580. [Google Scholar] [CrossRef]
  10. Wang, J.Y.; Li, X.; Xin, L. Spatial-temporal Variations and Influential Factors of Land Transfer in China. J. Nat. Resour. 2018, 33, 2067–2083. [Google Scholar]
  11. Zhang, L.; Feng, S.Y.; Qu, F.T. Regional Differences of Farmland Transfer and Its Influencing Factors: A Case Study of Jiangsu Province. China Land Sci. 2014, 28, 73–80. [Google Scholar] [CrossRef]
  12. Yayun, W.; Yinying, C.; Haiyan, L. The Status of Farmland Transfer in the Context of Spatial Heterogeneity and Its Influencing Factors: Case Studies in Wuhan, Jingmen and Huanggang. China Land Sci. 2015, 29, 18–25. [Google Scholar]
  13. Hongmei, X.; Yan, G.; Zhigang, L.; Sainan, L.; Juanqiong, L. Spatio-temporal characteristics of farmland circulation and influencing factors in metropolitan suburbs: A case study of Caidian District, Wuhan City. Sci. Geogr. Sin. 2020, 40, 2055–2063. [Google Scholar] [CrossRef]
  14. Hongmei, X.; Guo, Y.; Zhigang, L.; Ningning, Z.; Sainan, L. Spatial patterns of farmland transfer and the mechanisms from the perspective of capital cycle: A case study of Caidian, Wuhan city. Geogr. Res. 2021, 40, 994–1007. [Google Scholar]
  15. Hongyu, R. Cultivated land fragmentation in mountainous areas based on different resolution images and its scale effects. Geogr. Res. 2020, 39, 1283–1293. [Google Scholar]
  16. Xiaobin, L.J.J. Influence mechanism of cultivated land fragmentation on sustainable intensification and its governance framework. Acta Geogr. Sin. 2022, 77, 2703–2719. [Google Scholar]
  17. Yangbing, L.X.L. Traditional agroecosystem transition in mountainous area of Three Gorges Reservoir Area. Acta Geogr. Sin. 2019, 74, 1605–1621. [Google Scholar]
  18. Shuang, C.; Yangbing, L.; Mingzhen, L. Evolution pattern and driving mechanism in farmland of scale on town level: A case study of Fengjie County in Chongqing. Mt. Res. 2021, 39, 101–116. [Google Scholar] [CrossRef]
  19. Li, F.; Feng, S.Y.; Lu, H.L.; Qu, F.T.; D’Haese, M. How do non-farm employment and agricultural mechanization impact on large-scale farming? A spatial panel data analysis from Jiangsu Province, China. Land Use Policy 2021, 107, s0264837721002404. [Google Scholar] [CrossRef]
  20. Qiu, T.W.; Luo, B.L.; Geng, P.P.; Zhu, M.D. Market-oriented land rentals in the less-developed regions of China. Appl. Econ. Lett. 2021, 28, 945–948. [Google Scholar] [CrossRef]
  21. Qian, L.; Lu, H.; Gao, Q.; Lu, H.L. Household-owned farm machinery vs. outsourced machinery services: The impact of agricultural mechanization on the land leasing behavior of relatively large-scale farmers in China. Land Use Policy 2022, 115, 106008. [Google Scholar] [CrossRef]
  22. Qiu, T.W.; Ma, X.L.; Luo, B.L.; Choy, S.T.B.; He, Q.Y. Land defragmentation in China: Does rental transaction inside acquaintance networks matter? J. Appl. Econ. 2022, 25, 259–278. [Google Scholar] [CrossRef]
  23. Qiu, T.W.; Zhang, D.R.; Choy, S.T.B.; Luo, B.L. The interaction between informal and formal institutions: A case study of private land property rights in rural China. Econ. Anal. Policy 2021, 72, 578–591. [Google Scholar] [CrossRef]
  24. Yamauchi, F. Rising real wages, mechanization and growing advantage of large farms: Evidence from Indonesia. Food Policy 2016, 58, 62–69. [Google Scholar] [CrossRef]
  25. Lyu, L.G.; Gao, Z.B.; Long, H.L.; Wang, X.R.; Fan, Y.T. Farmland Use Transition in a Typical Farming Area: The Case of Sihong County in the Huang-Huai-Hai Plain of China. Land 2021, 10, 347. [Google Scholar] [CrossRef]
  26. Meng, B.; Wang, X.X.; Zhang, Z.F.; Huang, P. Spatio-Temporal Pattern and Driving Force Evolution of Cultivated Land Occupied by Urban Expansion in the Chengdu Metropolitan Area. Land 2022, 11, 1458. [Google Scholar] [CrossRef]
  27. Wang, W.W.; Gong, J.; Wang, Y.; Shen, Y. Exploring the effects of rural site conditions and household livelihood capitals on agricultural land transfers in China. Land Use Policy 2021, 108, 105523. [Google Scholar] [CrossRef]
  28. Wang, S.T.; Bai, X.M.; Zhang, X.L.; Reis, S.; Chen, D.L.; Xu, J.M.; Gu, B.J. Urbanization can benefit agricultural production with large-scale farming in China. Nat. Food 2021, 2, 183–191. [Google Scholar] [CrossRef]
  29. Long, H.L. Theorizing land use transitions: A human geography perspective. Habitat Int. 2022, 128, 102669. [Google Scholar] [CrossRef]
  30. Zhang, F.W.; Bao, X.L.; Deng, X.; Xu, D.D. Rural Land Transfer in the Information Age: Can Internet Use Affect Farmers’ Land Transfer-In? Land 2022, 11, 1761. [Google Scholar] [CrossRef]
  31. Zou, B.L.; Mishra, A.K. How internet use affects the farmland rental market: An empirical study from rural China. Comput. Electron. Agric. 2022, 198, 107075. [Google Scholar] [CrossRef]
  32. Yin, H.; Huo, P.; Wang, S. Agricultural and Rural Digital Transformation: Realistic Representation, Impact Mechanism and Promotion Strategy. Reform 2020, 12, 48–56. [Google Scholar]
  33. Berchoux, T.; Watmough, G.R.; Hutton, C.W.; Atkinson, P.M. Agricultural shocks and drivers of livelihood precariousness across Indian rural communities. Landsc. Urban Plan. 2019, 189, 307–319. [Google Scholar] [CrossRef]
  34. Branco, J.E.H.; Bartholomeu, D.B.; Alves, P.N.; Caixeta, J.V. Mutual analyses of agriculture land use and transportation networks: The future location of soybean and corn production in Brazil. Agric. Syst. 2021, 194, 103264. [Google Scholar] [CrossRef]
  35. Chen, Y. Revitalization and linkage planning of ethnic villages and towns from the perspective of “three exchanges”—Taking Wuling Mountain Area as an example. J. South Central Univ. Natl. (Humanit. Soc. Sci. Ed.) 2021, 41, 32–38. [Google Scholar] [CrossRef]
  36. Chen, Y.; Liu, Y.L.; Yang, S.F.; Liu, C.W. Impact of Land-Use Change on Ecosystem Services in the Wuling Mountains from a Transport Development Perspective. Int. J. Environ. Res. Public Health 2023, 20, 1323. [Google Scholar] [CrossRef]
  37. Li, M.Z.; Xie, Y.X.; Li, Y.B. Transition of rural landscape patterns in Southwest China’s mountainous area: A case study based on the Three Gorges Reservoir Area. Environ. Earth Sci. 2021, 80, 742. [Google Scholar] [CrossRef]
  38. Mengqin, H.; Yangbing, L.; Caihong, R. Dynamic changes and transformation of agricultural landscape pattern in mountainous areas. Acta Geogr. Sin. 2021, 76, 2749–2764. [Google Scholar]
  39. Yu, M.; Li, Y.B.; Luo, G.J.; Yu, L.M.; Chen, M. Agroecosystem composition and landscape ecological risk evolution of rice terraces in the southern mountains, China. Ecol. Indic. 2022, 145, 109625. [Google Scholar] [CrossRef]
  40. Jiao, Y.M. Spatial Pattern and Farming Radius of Hani’s Settlementsin Ailao Mountain Using GIS. Resour. Sci. 2006, 28, 66–72. [Google Scholar]
  41. Huang, M.Q.; Li, Y.B.; Ran, C.H.; Li, M.Z. Dynamic changes and transitions of agricultural landscape patterns in mountainous areas: A case study from the hinterland of the Three Gorges Reservoir Area. J. Geogr. Sci. 2022, 32, 1039–1058. [Google Scholar] [CrossRef]
  42. Anselin, L. Local Indicators of Spatial Association—LISA. Geogr. Anal. 1995, 27, 93–115. [Google Scholar] [CrossRef]
  43. Moran, P.A.P. Notes on Continuous Stochastic Phenomena. Biometrika 1950, 37, 17–23. [Google Scholar] [CrossRef] [PubMed]
  44. Chen, W.X.; Yang, L.Y.; Wu, J.H.; Wu, J.H.; Wang, G.Z.; Bian, J.J.; Zeng, J.; Liu, Z.L. Spatio-temporal characteristics and influencing factors of traditional villages in the Yangtze River Basin: A Geodetector model. Herit. Sci. 2023, 11, 111. [Google Scholar] [CrossRef]
  45. Griffith, D.A. Spatial-filtering-based contributions to a critique of geographically weighted regression (GWR). Environ. Plan. Econ. Space 2008, 40, 2751–2769. [Google Scholar] [CrossRef]
  46. Feng, Z.M.; Liu, D.; Yang, Y. Evaluation of transportation accessibility in China: From county to province. Geogr. Res. 2009, 28, 419–429. [Google Scholar]
  47. Chen, W.X.; Zeng, Y.Y.; Zeng, J. Impacts of traffic accessibility on ecosystem services: An integrated spatial approach. J. Geogr. Sci. 2021, 31, 1816–1836. [Google Scholar] [CrossRef]
Figure 1. Theoretical framework of the study.
Land 12 02074 g001
Figure 2. Location of the Wuling Mountains.
Land 12 02074 g002
Figure 3. Kernel density of large-scale agricultural land of different types and scales.
Land 12 02074 g003aLand 12 02074 g003b
Figure 4. Spatial autocorrelation of large-scale agricultural land at different scales.
Land 12 02074 g004
Figure 5. Spatial heterogeneity of regression coefficient of different influencing factors.
Land 12 02074 g005aLand 12 02074 g005b
Table 1. Identification criteria for large-scale agricultural land.
Type of Large-Scale Agricultural LandCriterion of IdentificationInterpretation Key
Cultivated landBlock or strip cascade distribution, there are obvious traces of artificial cultivation
Interpretation key location (109.03553, 29.708696)
Land 12 02074 i001
Vegetable landIt is blocky or banded, mostly distributed in river valley areas, mainly planted in greenhouses
Interpretation key location (108.975236, 29.624967)
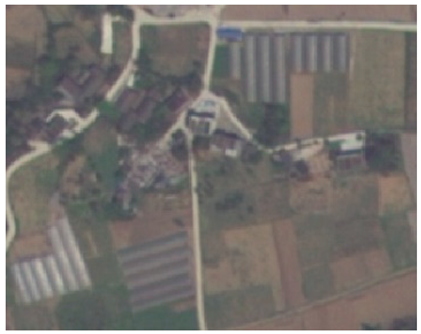
Land 12 02074 i002
Orchard landNeatly arranged, contiguous distribution, most of them have road transport facilities
Interpretation key location (111.420893, 30.631348)
Land 12 02074 i003
Tea garden landStrip distribution, along with the terrain in the form of steps, high canopy
Interpretation key location (109.533844, 30.078978)
Land 12 02074 i004
Table 2. Influencing factor indicators of large-scale agricultural land in the Wuling Mountains.
Primary IndicatorSecondary IndicatorThird Level Indicator
Natural ConditionsTerrain ConditionsElevation
Slope
Production FactorsLaborRural Population
CapitalBalance of Savings Deposits of Urban and Rural Residents
GDP
General Public Budget Revenue
Science and TechnologyTotal Power of Agricultural Machinery
ManagementAgricultural Companies Number
DigitizationRural Digital Infrastructure Index
Rural Economy Digitization Index
Digitization Index of Rural Governance
Digitization Index of Rural Life
Location ConditionsTraffic AccessibilityTraffic Density
Impact Degree of Trunk
Degree of Location Advantage
Table 3. Geographical detector results for various influencing factors.
IndexSlopeElevationBalance of Savings DepositsGDPGeneral Public Budget Revenue
q statistic0.20.30.420.260.34
p-value0.0490.0020.0010.0070.001
IndexRural PopulationPower of Agricultural MachineryAgricultural Companies NumberTraffic AccessibilityRural Digitization Index
q statistic0.60.420.370.220.12
p-value0.0010.0020.0030.0040.136
Table 4. Model parameters of GWR and OLS model.
Model ParameterR2R2 AdjustedR2(OLS)R2 Adjusted(OLS)BandwidthResidual SquaresSigmaAICc
Value0.78010.73170.1630.058485,0874,526,461,8469012.161469.66
Table 5. Parameters of GWR regression results.
IndexSlopeElevationBalance of Savings DepositsGDPGeneral Public Budget Revenue
VIF2.6202.4831.5283.4883.135
t-Statistic1.7951.7584.1442.6123.119
p-value<0.05<0.05<0.005<0.01<0.005
IndexRural PopulationPower of Agricultural MachineryAgricultural Companies NumberTraffic Accessibility
VIF2.7582.2542.4221.592
t-Statistic5.7123.4134.7361.763
p-value<0.005<0.005<0.005<0.05
Disclaimer/Publisher’s Note: The statements, opinions and data contained in all publications are solely those of the individual author(s) and contributor(s) and not of MDPI and/or the editor(s). MDPI and/or the editor(s) disclaim responsibility for any injury to people or property resulting from any ideas, methods, instructions or products referred to in the content.

