Abstract
The unequal distribution of territorial space resources stands out as a leading cause of the human–land contradictions and environmental degradation. These issues are especially pronounced in the Minjiang River Basin, which exhibits significant regional disparities. In pursuit of solutions to these pressing problems and the identification of sustainable developmental pathways, this study presents an innovative territorial space double optimization simulation model. This model integrates quantity structure optimization and distribution pattern optimization, in order to comprehensively consider the optimization of territorial space allocation and build a new territorial space pattern for the Minjiang River Basin in 2030. On this basis, we employed the Patch-generating Land Use Simulation (PLUS) model and scenario analysis method to design the double optimization scenario and natural development scenario. By comparing these two scenarios, and calculating the ecological benefits (EB), economic benefits (ECB), carbon storage (CS), and comprehensive benefits (CB) achieved in different scenarios, the validity of the double optimization model was fully verified. The results indicated that: ① the loss of sub-ecological space (PeS) under the natural development scenario was significantly larger than that under the double optimization scenario, and the loss should be mainly attributed to the large expansion of production space (PS) and living space (LS); ② the area of ecological space (ES) has reduced since 2020, but less area was lost and the retention rate was higher under the double optimization scenario; ③ the natural development scenario made the research region gain more ECB, but it also resulted in the loss of more EB and CS, whereas the Minjiang River Basin under the double optimization scenario was able to effectively balance the relationship among the three, thus achieving the best CB. The research findings provide strong scientific support for alleviating the human–land contradictions, protecting the ecological security in the basin, and promoting the sustainable development of the region.
1. Introduction
As a multifunctional compound system composed of ecological, living, and production spaces, territorial space is a precious resource that a country and nation relies on for survival and development. Since the 21st century, China’s urbanization and industrialization have achieved rapid development, accompanied by long-term resource development and utilization. On the one hand, the development has promoted improvement in people’s living standards and made substantial contributions to the social economy. On the other hand, due to urban expansion and increasingly frequent human activities, it has caused high levels of interference with the ecological environment [1], resulting in the continuous shrinkage of the natural ecological space, gradual disordered and dysfunctional ecosystems, an increasingly imbalanced proportion of territorial space patterns and structures, and continuously intensified conflicts between various types of functional spaces [2,3,4]. All types of territorial resource utilization problems similar to those mentioned above caused by the extensive mode of economic development in the past are dilemmas that all countries in the world are facing. Hence, in the last 10 years, the international community has gradually and widely recognized and applied the concept of Nbs (Nature-based Solutions) [5] to deal with the contradictions and conflicts, and the challenges and problems, between the environment and society. This concept originates from nature, and utilizes natural ecological processes to protect, restore, and sustainably manage biodiversity, along with its associated ecosystem functions and services, so as to enhance ecosystem stability, enabling a robust response to the multifaceted challenges posed by economic, societal, and environmental factors [6]. In China, the concept of ecological civilization, which is highly compatible with the Nbs, has also been emerged. The ultimate purpose of these concepts is to alleviate the ongoing pressures faced in regional development, thereby enhancing human well-being, bolstering developmental resilience [7], and maximizing environmental, economic, and social benefits. This fully indicates that harmonious coexistence between humans and nature is a development goal pursued by countries worldwide. It is worth noting that the realization of this goal cannot be achieved without the territorial space as the primary carrier and foundation. In other words, to achieve this goal, a sustainable utilization pattern of territorial space must take precedence, and continuously promote the improvement in the human–environment–infrastructure relationship from the perspective of building an environmentally friendly regional ecological security pattern [8].
Interestingly, the essence of national land space is a collection of multiple functional spaces, and the complicated relationship of competition, promotion, and coercion among the different functional spaces reflects the game and conflict between various functional uses and utilization goals within the territorial space. Simultaneously, these complicated relationships also have a significant impact on the development and evolution of territorial space in turn. The excessive development of one functional space will exert a certain impact on the formation and expansion of other functional spaces, and the spatiotemporal characteristics and distribution patterns presented are also different due to the differences in social and economic development status and geographical environment at different stages. As a result, predicting the future development direction of territorial space based on the current natural geographic data and socio-economic changes, constructing optimized allocations, and proposing reasonable suggestions are important means to protect the ecological environment, promote sustainable development, and realize the coupling and coordination of the “production-life-ecological” (PLE).
The simulation and prediction of territorial space originated from the simulation and prediction of LUCC (Land-Use and Land-Cover Change). In recent years, a great deal of research has been conducted regarding this topic; additionally, various simulation models, including the CLUE-S model [9], CA-Markov model [10], ANN-CA model [11], and FLUS model [12,13], have been developed. Nevertheless, it has been previously reported that these models failed to fully consider the internal drivers of territorial space changes, and could not simulate multiple spatial patches in a dynamic spatiotemporal manner, making it impossible for simulation results to be consistent with legal regulations in a timely manner [14,15]. In 2021, Liang et al. [16] proposed a more advanced Patch-generating Land Use Simulation (PLUS) model based on the FLUS model, which retained the advantages of adaptive inertial competition and a roulette wheel competition mechanism [17]. It can extensively uncover the potential driving factors that cause territorial space expansion, and can also simulate patch growth [16]. More importantly, compared with the FLUS model, the PLUS model is faster in data processing, and is more accurate in simulation results. Therefore, the PLUS model has been widely employed by a large number of scholars in the past two years [18,19,20,21,22], and has been well developed.
Nevertheless, it is worth noting that the current international case studies in the field, such as territorial space optimization [23,24,25,26,27] and territorial space simulation and prediction [28,29,30,31,32], most of them only consider either quantity structure or space layout optimization, resulting in the problem of considering one but neglecting the other, and failing to achieve an overall consideration. In addition, the application of the PLUS model is still in the initial stages, and most of the studies using the MOP (Multiple Objectives Programming) and PLUS coupled model have two main problems: first, only economic and ecological benefits are included when considering the objectives, and carbon stock is rarely considered; second, GM (1, 1) (Gray prediction Model) is not combined with the MOP model, which makes it impossible to accurately measure the value of the objective benefits in the future. In view of the above shortcomings, a double-optimization-based territorial space simulation and prediction model was established, i.e., it simulated the future territorial spatial through a two-step optimization process of “quantity structure” and “distribution pattern”. The optimization of quantity structure was accomplished by the gray multiple objectives programming (GMOP) model, and the obtained results were more in line with the future reality than that obtained by the MOP model alone. Moreover, the study relied on the double evaluation results of the multi-scale territorial space carrying-capacity evaluation and territorial space development and utilization effect evaluation. Then, these results were employed as the basis for classifying the conversion constraint area, so as to realize the distribution pattern optimization of territorial space. This is because we believe that if an area has a higher grade of production carrying capacity and is currently a production space (PS), it means that the various production resources contained in the area are relatively sufficient and can still meet the needs of human beings to carry out production activities and industrial construction for a long period of time in the future. It still has great potential for productivity, and thus, the development of the area into PS is appropriate, it can continue to be maintained as the space category in the future. Another example, if a certain area has produced a strong economic effect under the current mode of territorial space development and utilization, it means that on the one hand, the current economic situation of the area is developing well, and it can produce a large number of economic benefits in the local area; on the other hand, the strong economic effect can exert influences on the neighboring areas, and thereby can drive the continuous advancement of the economy in the whole region, realizing the radiation diffusion of the economic effect, and ultimately achieving the growth in economic benefits, so the current type of territorial space should be maintained without transformation. the social and ecological effects are also the same. From what has been stated above, the double optimization model proposed in this study can perfectly and organically combine the optimization process with the simulation process of the PLUS model, without the need to go through the old ways of simulation first and then optimization, making the simulation result become the optimization result. This indicates that the model can speed up the research efficiency and improve the precision of the results at the same time. In addition, the double optimization prediction model demonstrated high universality and can be widely applied to the simulation prediction and optimization exploration in other regions. Finally, the double optimization simulation results we obtained represented the optimal allocation of territorial space in the research area. The essence of this allocation was to point out a sustainable future development direction for the territorial space, which not only reflected the scientificity, but also has a strong feasibility.
This study focuses on the scientific question of “How can we optimize the allocation of territorial space by simultaneously addressing both quantity structure and distribution pattern?”. It aims to optimize and adjust the quantity and pattern of territorial space and effectively alleviate human–land contradictions on the basis of protecting the ecological red line and strictly observing the farmland red line, and also considering requirements of economic, low-carbon, and eco-friendly development. The research results not only achieve this goal, but also provide scientific and technological support for the optimization and reconstruction of the territorial space in the new era and the promotion of efficient utilization of territorial resources, which have important practical value and practical significance.
2. Study Area and Data Sources
2.1. Study Area
The Minjiang River, as the largest first-class tributary in the upper Changjiang River, originates from the southern foot of Minshan Mountain in Songpan County, and is divided into the inner and outer rivers in Dujiangyan, with the outer river being the main stream, passing through Xinjin, Penshan, Meishan City, and reaching Leshan City. Then, the Minjiang River converges together with the Dadu River and its tributary (the Qingyi River), and then flows into the Changjiang River in Yibin, with a total length of 711 km. The whole basin is located within the boundaries of Sichuan Province, and the area of the basin is about 5.89 × 10⁴ km2 (not including the Dadu River). The boundaries of the Minjiang River Basin in this study are referred to in previous studies regarding the Minjiang River Basin; therefore, to ensure the research area in the integrity of the administrative division, the spatial scope of the Minjiang River Basin was defined (Figure 1). The districts included are detailed in Table S1. The Minjiang River Basin exhibits obvious regional differences in aspects such as altitude, climate, and vegetation, thus showing distinctive characteristics in different areas. Among them, for the five counties in Aba with higher terrain, there are abundant hydroenergy, forestry, and mineral resources. The research region from Chengdu to the south consists of plains and hilly basins, with flat terrain, abundant resources, concentrated population and towns, convenient transportation, and rich farmland resources. It is an important grain and oil production area with developed industry and agriculture, continuously promoting the rapid development of social, economic, and cultural aspects in the cities within the basin, such as Chengdu, Leshan, and Yibin.

Figure 1.
Study area.
2.2. Data Sources
The data used in this study and their sources are shown in Table 1. We utilized ArcGIS 10.2 software to pre-process the data, such as projection transformation to make the coordinate system consistent, clipping regions, vector data to raster, resampling to adjust the spatial resolution (uniformly 30 m × 30 m), etc. Furthermore, the slope data were calculated from the DEM by the “Slope” tool in ArcGIS 10.2 software. The locational factor data, such as the distance from the river system, were calculated by the “Euclidean Distance” tool in ArcGIS.

Table 1.
Data and their sources.
3. Methodologies
With the purpose of promoting the sustainable utilization of territorial resources and building the territorial space distribution pattern of socio–economic–ecological–humanity coupling, and coordination, this study optimized the territorial space from two aspects: quantity structure and distribution pattern. That is, by proposing a territorial space simulation and prediction model based on double optimization, a double optimization scenario was set accordingly. Then, the simulation results of this scenario were compared with the results of the natural development scenario. Finally, the optimal allocation of territorial space in the Minjiang River Basin by 2030 can be conducted using scientific and reasonable methods. The reason for selecting the year 2030 is that the United Nations established the Sustainable Development Goals (SDGs) in 2015, with the aim of achieving global sustainability by the year 2030. The specific research framework is shown in Figure 2, in which the optimization of the quantity structure of the territorial space was accomplished by using the GMOP model. It should be noted that the optimization of the distribution pattern of the territorial space was achieved by setting the territorial space conversion constraint area and controlling the various types of territorial space transfer rules in the simulation prediction. The basis for classifying the conversion constraint area was based on two types of evaluations of the Minjiang River Basin in 2020, namely, territorial space carrying capacity evaluation and territorial space development and utilization effect evaluation. According to the evaluation results, the scope of the conversion constraint area was determined to achieve the purpose of simulating the future territorial space and optimizing its distribution pattern.
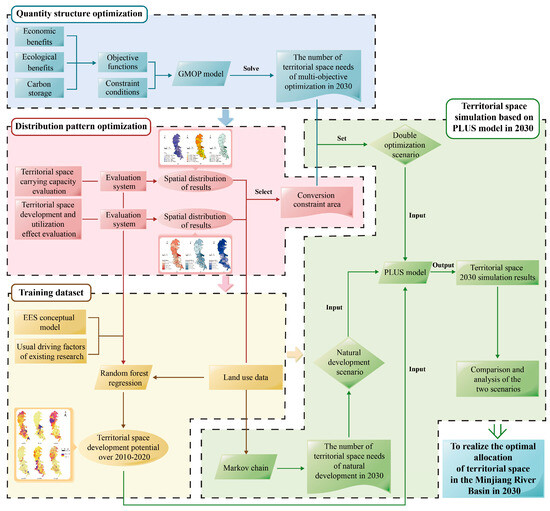
Figure 2.
Research framework.
3.1. Identification of Territorial Space
Territorial space is the carrier of human production, living activities, and the construction of ecological civilization. A study pointed out that the micro-geographical phenomena expressed by production, life, and ecology may exhibit scale integration in space, that is, a certain spatial evaluation unit may be composed of a single or multiple ecological, production, and living spaces mixed together [33]. Moreover, although each subspace of territory space carries corresponding production, living, and ecological functions, the relationship between space and function is not strictly a one-to-one relationship. For instance, agricultural space not only has a production function, but also belongs to the ecosystem of nature and therefore has an ecological function. With the accelerated pace of the construction of ecological civilization, there is an imminent demand to supplant the concept of traditional land with that of territorial space. This can assist in implementing the overall planning and coordinating the spatial resource allocation from a higher dimension. Simultaneously, both the deconstruction and reclassification of territorial space are required from the perspectives of PLE, with a particular emphasis on the impact and role of different functional spaces on the overall territorial space. Hence, from the perspective of PLE, this paper established a territorial space classification system (Table 2). The system is based on the LUCC data of the Minjiang River Basin and refers to the function characteristics of land use, thus completing the identification of territorial space in the study area.
Table 2.
Classification and identification of territorial space.
3.2. Evaluation System of Territorial Space Carrying Capacity
In view of the categorization and identification of the territorial space in this paper, the evaluation of the territorial space’s carrying capacity is also conducted from the perspectives of PLE. Therefore, the territorial space’s carrying capacity is divided into three categories: ecological carrying capacity (CCE), living carrying capacity (CCL), and production carrying capacity (CCp). Moreover, after reviewing the current related literature, we found that the construction and evaluation of any indicator system under different spatial scales were rarely included. In consequence, this article established a multi-scale evaluation system for the territorial space’s carrying capacity. The actual evaluation value was calculated through the multi-scale integration model (see Supplementary Section S2 for details).
3.3. Evaluation System of Territorial Space Development and Utilization Effect
The utilization and development of territorial space, as well as the evolution of patterns, will have an impact on various aspects that cannot be ignored, such as the ecological environment and social economy. In the present study, the effects of territorial space development and utilization were divided into three categories: social effects, economic effects, and ecological effects. Finally, we constructed a complete evaluation system of territorial space development and utilization effect (Table S2). The indicator weight was calculated by the entropy method, and the original data of all indicators were normalized to eliminate dimensional differences. The social effects in the evaluation system included indicators such as population situation, cultural education, and urban–rural construction. The economic effect can be explained from two aspects: the economic level and industrial development. The ecological effects can be evaluated from four aspects: the environmental level, resource state, consumption and utilization, and management. The evaluation results are presented in Supplementary Section S3.
3.4. GMOP Model
Multi-objective programming (MOP), as an open and flexible model algorithm, exhibits good applicability for solving conflicting goals of mergers, such as ecological and socio-economic policies [34]. The GMOP model is further developed on the basis of the MOP model. It is an optimization system derived from the intersection of grey prediction theory and multi-objective programming. The core idea is to define uncertain objective functions and constraint conditions in a certain range of satisfied regions. The purpose of this study is to obtain the optimal solution for the quantity demand of various types of territorial spaces in the Minjiang River Basin by 2030 through quantitative analysis; to determine a sustainable future territorial space composition structure; and thereby to reduce the antagonistic phenomenon between the ecological environment and socio-economic development, alleviating environmental injustice, and facilitating socio-economic development. The GMOP model can fully express this intention and provide us with an optimal configuration of territorial space quantity and structure. In the following sections, we provide a detailed description of the construction process of the GMOP model.
3.4.1. Decision Variables
The setting of decision variables is the key to construction of the GMOP model. The identified six types of territorial spaces were set as decision variables (Table 3).
Table 3.
Decision variables.
3.4.2. Objective Functions
In order to explore the demand for the territorial space allocation in a coordinated socio–economic–ecological–environmental manner, and to optimize the quantity structure of various types of space, the economic benefits (ECB), and ecological benefits (EB) were established first as the objective functions. Moreover, carbon plays a pivotal role in the material cycle of terrestrial ecosystems. Thus, increasing the carbon stock in terrestrial ecosystems can reduce the content of CO2 in the atmosphere in an economical and environmentally friendly way, thus alleviating the greenhouse effect and climate change [35,36]. Hence, we added carbon stock (CS) to the objective function and used the InVEST model to measure it. In summary, the expressions of the three objective functions are:
where , , and represent ECB, EB, and CS, respectively. Their calculation methods and the origin of the coefficients a1–a6 in Equations (1)–(3) are detailed in Supplementary Section S4.
3.4.3. Constraint Conditions
In order to ensure that the future development and change in the territorial space is in line with the laws of natural development and governmental planning expectations, we referred to the quantities of various types of spatial demands in the study region in 2030 under the natural development scenario obtained by using the Markov chain (Table S3). In addition, we included reference to the overall planning of the territorial space of each city and county within the study region (2021–2035) when constructing constraint conditions. A total of seven constraint conditions were set as follows:
- (1)
- Fundamental constraint: The fundamental constraint includes constraint of the total area and non-negative constraint. That is, the area of territorial space in 2030 must be consistent with that of 2020, always equal to the total area of the Minjiang River Basin, and all types of territorial space must not be less than 0:
- (2)
- Constraint on PS and LS: The distribution of PS and LS in the Minjiang River Basin is extremely uneven, especially with the rapid expansion of PS in recent years. Hence, attention should be paid to preventing the uncontrolled expansion of PS and LS. It can be foreseen that the areas of PS and LS will continue to grow in the future, but the growth rate will slow down. Therefore, the Markov chain’s predicted natural development of 120% of the area in 2030 was set as the upper limit, and the area in 2020 was set as the lower limit:
- (3)
- Constraint on ES: ES includes most forest lands and waters, as well as all the grasslands and unused lands. The related planning documents and policies clearly proposed that we should continue to implement the ideology of ecological civilization, strengthen ecological environment protection, strictly control the red line of ecological protection, and build an ecological safety barrier in the future. Meanwhile, the erosion of ES by other spaces has indeed existed in the past decade, and the area of ES has decreased by 0.02% since 2015. Therefore, the reduction in the ES area from 2020 to 2030 was set within the range of 0 to 0.02%:
- (4)
- Constraint on PES: The PES consists of other forest lands, and its area has been on a downward trend over the last 10 years. In consequence, the Markov chain estimation results were taken as the lower limit, and the area in 2020 as the upper limit:
- (5)
- Constraint on PeS: All farmlands in the study region have been identified as PeS. From 2015 to 2020, the area of PeS has decreased by 0.75%. Having sufficient farmland resources is a prerequisite for ensuring food security and maintaining the supply of important agricultural products. Hence, the reduction range of the PeS area from 2020 to 2030 should be controlled within the range of 0–0.75%:
- (6)
- Constraint on EpS: Rivers, canals, and reservoir pits were classified as EpS. The area variation in this type of space possessed a characteristic of stability with a rise during the research period. Therefore, the prediction results of the Markov chain were used as the upper limit, and the area in 2020 was taken as the lower limit:
3.5. PLUS Model
The procedure for using the PLUS model in this study was as follows. First, based on the territorial spatial data for 2010 and 2020, the spatial and temporal changes in the spatial pattern of the territorial space in this period were analyzed (see Supplementary Section S5 for details), and the expanded portions of the two periods were extracted for sampling. Second, driving factors were selected and input into the LEAS module, yielding the contribution of each driving factor to various territorial space types (Figure S1) and the development potential map set for various types of territorial space (Figure S2). Third, the territorial spatial data from 2010 were entered into the CARS module, the PLUS model was executed, and the simulated results for 2020 were obtained and compared to the actual situation in 2020 to evaluate the accuracy of the model simulation. Fourth, the 2020 territorial spatial data, the number of spaces required for 2030 as determined by the Markov chain, and other parameters were used to perform simulations based on natural development scenarios if the accuracy of the simulations met standards. Fifth, the results obtained from the GMOP model and the designated conversion constraint areas were entered, the model parameters were correctly set, and simulations under double optimization scenarios were completed. In conclusion, the simulation results under the two scenarios were compared and analyzed in detail to demonstrate the practical effectiveness and scientific validity of the double optimization prediction model proposed in this study and its outcomes.
The conversion constraint areas for territorial space during model prediction are detailed in Section 3.5.2, and other parameter-setting methods are provided in Supplementary Section S6.
3.5.1. Selection of Driving Factors
In this study, the selection of driving factors primarily references the indexes derived from the evaluation system established in Section 3.2 and Section 3.3. In reference to general studies, DEM, slope, and distance factors were also considered. Finally, 16 indicators were selected as the primary determinants of the development changes in the territorial space (Table S4 and Figure S3).
3.5.2. Conversion Constraint Areas of Territorial Space
In the PLUS V1.4 software, conversion constraint areas of territorial space are represented by a binary raster map, where 0 indicates that territorial spatial type change is not permitted and 1 indicates that it is permitted. Based on the evaluation results of Section 3.2 and Section 3.3 (see Supplementary Sections S2 and S3 for details) and the rules in Table 4, this study identified the conversion constraint areas. Using this method to carry out the simulation and prediction under the double optimization scenario is instrumental in ensuring the successful realization of the distribution pattern optimization of territorial space. Moreover, when simulating territorial spatial distribution under a natural development scenario for 2020 and 2030 and considering that the evolution of territorial space always follows natural laws and is subject to certain natural constraints, we restricted changes in areas where lakes, rivers, and reservoirs are located (Figure S4a).
Table 4.
Constrained conversion delimitation rules for double-optimization scenarios.
4. Results
4.1. Quantity Structure Optimization of Territorial Space
In the current study, the GMOP model was constructed based on Section 3.4 and the model was solved using LINGO 18.0 software to obtain the optimal solution (Table 5). This solution was taken as the quantity of territorial space demand under the double optimization scenario, i.e., the outcome of the quantity structure optimization of territorial space in the Minjiang River Basin in 2030.
Table 5.
Territorial space quantity structure of the Minjiang River Basin under double optimization scenario in 2030.
4.2. Distribution Pattern Optimization of Territorial Space
This study determined the optimized control area for the territorial space distribution pattern (Figure 3). After binary processing, the conversion restraint area of the territorial space under the double optimization scenario was obtained and inputted into the PLUS model (Figure S4b).

Figure 3.
Optimization control areas of territorial space.
4.3. Two Scenarios Simulation of Territorial Space
As is shown in Figure S5, we used the PLUS model to simulate the distribution pattern of territorial space in the Minjiang River Basin in 2020. Then, we compared the simulation results to the actual data for 2020. We selected three areas within the study area where significant changes in territorial space occurred from 2010 to 2020 and zoomed in on them as representative examples. It can be observed that both the overall study area and the zoomed-in details display a high degree of spatial consistency in their distribution. Further analysis using the FoM coefficient, kappa coefficient, and OA yielded the following results: the FoM coefficient was 0.14, the kappa coefficient was 0.977, and the OA was 98.8%. These results indicated that the PLUS model of this study has a high simulation accuracy and can effectively predict the development and changes in territorial space within the research area, and the simulation results are reliable and valid.
Figure 4b,c represents the simulation outcomes for two scenarios. In comparison to the year 2020 (Figure 4a), the areas of PS, LS, and EpS increased in both scenarios, whereas the areas of ES, PES, and PeS decreased. However, the comparison of the detailed maps in Figure 4 reveals that the same type of space exhibited different magnitudes of change under different scenarios, not only in terms of area but also in terms of distribution patterns. Therefore, it is necessary to clarify the transfer of territorial space from 2020 to 2030 in these two scenarios in order to comprehensively investigate the similarities and differences in quantity structure and distribution pattern of territorial space.
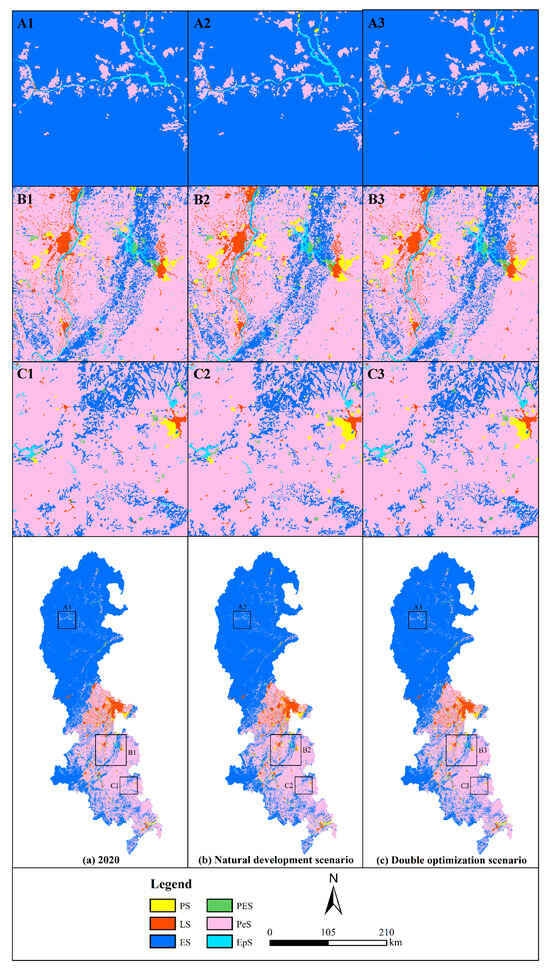
Figure 4.
The distribution of territorial space in 2020 and 2030 (under two scenarios).
Figure 5 and Tables S5 and S6 illustrate the specific space transfer information. PS and LS exhibited significant expansion in all simulation results, whereas PeS demonstrated the opposite trend. In the natural development scenario, the area of PS showed a net increase of 222.03 km2, that of LS by 136.72 km2, but the area of PeS showed a net reduction of 337.17 km2. In addition, PeS contributed 94.86% and 96.63%, respectively, to the expansion of PS and LS. In the double optimization scenario, PS and LS showed a net increase of 110.8 km2 and 22.51 km2, respectively, while PeS net showed a decrease of 134.57 km2. Based on these results, it is evident that the expansion in PS and LS was primarily the result of encroachment upon PeS, which is the leading cause of PeS loss. In addition, the loss of PeS was more severe under the natural development scenario. Moreover, we extracted the expansion areas of PS and LS under different scenarios (Figure 6 and Figure 7) and the transfer areas of PeS (Figure 8). The outcomes revealed that the locations of PS expansion were nearly identical across the various scenarios, but the quantities varied significantly. In Songpan (Figure 6(A1)) and Rongxian (Figure 8(C1)), for instance, under the natural development scenario, various types of spaces were transferred to PS. In contrast, under the double optimization scenario, PS expansion slowed considerably and no longer encroached upon other spaces in large quantities (Figure 6(B2,C2)). The expansion of LS varied greatly under the two scenarios: the natural development scenario experienced significant occupation of PeS by LS (Figure 7(B1,C1) and Figure 8(B1)), but the occupied area of PeS by LS decreased significantly in the double optimization scenario, and the occupied area of other spaces by LS was also significantly regulated.

Figure 5.
Sankey diagram of territorial space area from 2020 to 2030 under two scenarios.

Figure 6.
The expansion areas of PS under two scenarios.

Figure 7.
The expansion areas of LS under two scenarios.

Figure 8.
The transfer areas of PeS under two scenarios.
As described previously, the area of ES in the study area will decrease after 2020. However, the simulated area of ES under various scenarios varied by 22.13 km2. Due to the location of ES in the natural development scenario, a transformation of 57.99 km2 occurred. Nonetheless, the double optimization scenario had limitations in the quantity control and conversion area, so even though there was no supply from other areas, only 6.42 km2 was transferred out. The loss situation of ES was analyzed more intuitively by producing the spatial distribution of ES transitions under various scenarios (Figure 9). The conversion of ES to PS, LS, and PeS was the main reason for its area reduction. In the natural development scenario, encroachment of PS upon ES occurred in both the northern section (Figure 9(A1)) and the southern section of the basin (Figure 9(C1)). The transition in the central region (Figure 9(B1)) was predominantly from ES to LS. However, in comparison with the double optimization scenario, it is evident that the occupancy of ES by the other five types of spaces was significantly reduced, with the phenomenon of PeS encroaching on ES completely eliminated (Figure 9(A2,C2)).

Figure 9.
The transfer areas of ES under two scenarios.
The development trend of PES was the most stable. PES primarily transferred to PS and LS (Figure 5). In the natural development scenario, the transition to PS occurred primarily in Maoxian (Figure 10(A1)) and Xuzhou (Figure 10(C1)). The transition to LS appeared predominantly in the Chengdu urban area and Xuzhou. In the double optimization scenario, all transition types were drastically reduced. Moreover, simulation results of the double optimization scenario revealed no PES transition phenomenon in Chengdu urban area (Figure 10(B2)).
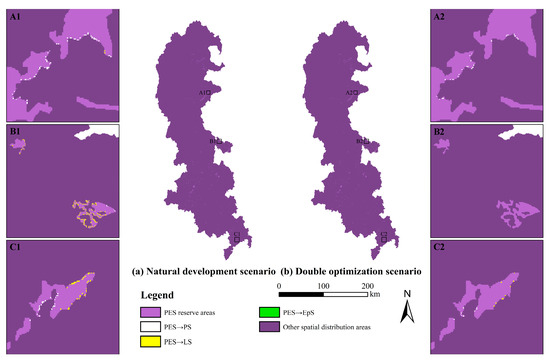
Figure 10.
The transfer areas of PES under two scenarios.
In any scenario, the growth rate of EpS was 1.48%. Nevertheless, the transfer and expansion of EpS under different scenarios exhibited significant differences. In the natural development scenario, EpS exhibited solely an expansion in size without a transfer out. Under this scenario (Figure 11), the expansion space of EpS originated from ES, PeS, and PES: the transition from ES to EpS primarily occurred in Heishui (Figure 11(A1)) and Emeishan City (Figure 11(C1)); the transition from PeS to EpS can be observed in Dongpo (Figure 11(B1)) and Emeishan City; and the transition from PES to EpS appeared only in Emeishan City. Compared to another scenario, the double optimization scenario included the transition from PS to EpS, and the area supplied by PeS to EpS grew by 4.12 km2, whereas the areas supplied by ES and PES both decreased.
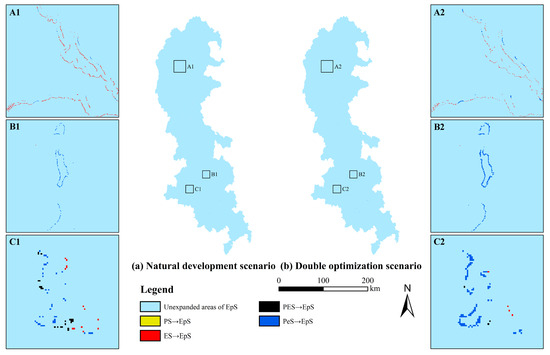
Figure 11.
The expansion areas of EpS under two scenarios.
4.4. ECB, EB, CS, and Their Comprehensive Benefits (CB) under Two Scenarios
Based on the spatial allocation of territorial space under various scenarios, the ECB, EB, and CS of the Minjiang River Basin were calculated for each scenario. Considering that the utilization of territorial space must always adhere to the principle of sustainable development, the configuration of territorial space must strike a balance between economic, ecological, and low-carbon development. Consequently, we also calculated the comprehensive benefits (CB). The calculation method involved a weighted summation of the normalized ECB, EB, and CS data in order to evaluate the balance between these three factors under various spatial configuration conditions of territorial space. The AHP hierarchy analysis determined that ECB, EB, and CS have respective weights of 0.41, 0.22, and 0.37. Table 6 presents the measurement results. In conjunction with the distribution within the basin (Figure S6), we discovered that ECB showed a general spatial pattern of being low in the north and high in the south, low in the west and high in the east within the study area. Chengdu formed a significant high-ECB agglomeration area. ECB was the largest in the natural development scenario, amounting to 2.4 times the amount in 2020. In the double optimization scenario, ECB grew by 122.15% compared to 2020, but by CNY 331.008 billion less than in the other scenario.
Table 6.
ECB, EB, CS, and CB under 2020 and two scenarios of 2030.
The distribution of EB values varied significantly across space, with high values mainly concentrated in Aba, northwest Chengdu, southwest Meishan, and northwest Leshan. In the natural development scenario, the Minjiang River Basin is projected to incur an economic loss of up to 10.389 billion CNY in EB by the year 2030. However, after the double optimization, the loss could be controlled at 10.141 billion CNY, thereby reducing the total loss by 248 million CNY.
CS had a similar spatial distribution pattern to EB. In the natural development scenario, the basin’s total CS decreased by 6.51 Tg between 2020 and 2030. However, the double optimization scenario would be only 0.04% less than 2020.
The regions with relatively high CB were largely congruent with the regions with relatively high EB and CS, but the distinction was mainly in regions with relatively high ECB, such as Chengdu urban area. These regions typically had lower EB and CS, but their ECB far surpassed other regions, so their CB was not low but rather high. The overall CB of the study area was 0.59 in 2020, fell to 0.41 under the natural development scenario, and reached a maximum of 0.61 under the double optimization scenario.
In the double optimization scenario, the study area could have higher EB, CS, and CB, while only ECB was lower than that in the natural development scenario. Comparing the increase and decrease in ECB, EB, CS, and CB in different scenarios and their distribution rules, this study further investigated the optimized areas of various benefits after double optimization of territorial space (Figure 12). As for ECB, the optimized areas were dispersed and few in number, and only a small amount of distribution is visible in Figure 12(B1,C1). The distributions of optimized areas for EB, CS, and CB were similar, with the majority of these areas concentrated in the central region of the watershed, some of the remainder dispersed in the south, and a very small quantity distributed in the north.
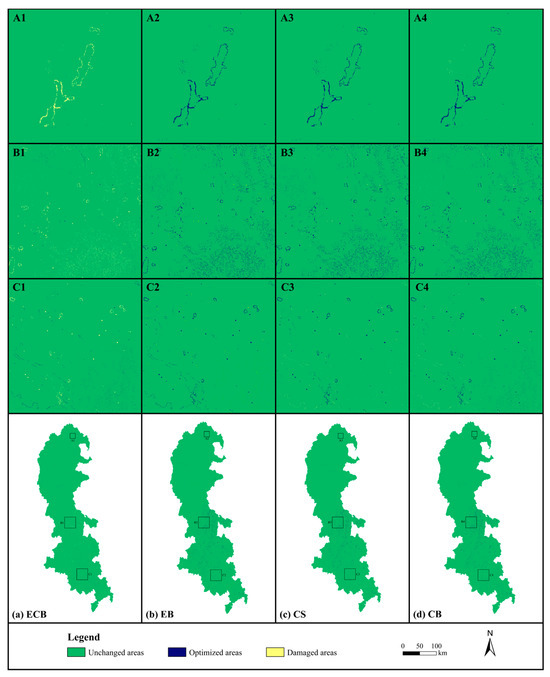
Figure 12.
The optimized areas of ECB, EB, CS, and CB.
5. Discussion
5.1. Dynamic Change in Territorial Space during 2020–2030
The analysis of simulation results revealed that various types of territorial space were not evenly distributed across the basin. Distributions for PS, LS, ES, and PeS varied significantly. This could be primarily attributed to natural factors, such as topography. In the study area, except for the Aba, the remainder had a generally lower altitude. Taking Chengdu Plain in the middle of the basin as an example, as this region is flat, open, and densely urbanized, with excellent transportation infrastructure and dense traffic networks, it is ideally suited for industrial and agricultural growth, as well as residential living. Concurrently, this indicated that the region has a high carrying capacity to meet the needs of production and life, resulting in greater social and economic effects, promoting the growth of PS and LS in this area. This was most evident in the spatial agglomeration of PS and LS in the Chengdu area, and the two were frequently closely distributed. Aba is located in the northern portion of the basin, where the terrain is steep and the topography is complex, making it difficult to develop and utilize a large portion of the territorial space. On the basis of the current infrastructure, the challenges of large-scale expansion are formidable. However, this also allows the original ecological features of the territorial space to be preserved. Therefore, ES is primarily concentrated in this region, which is also the reason why the region’s CCE can maintain a high level for a long time and always has significant ecological effects. In addition, due to the development difficulties and limited conditions of the mountainous regions, the territorial space composition of Aba will fail to see significant changes for some time in the future. This will limit regional economic development and constitute the primary cause for the poor CCP and weak economic effects in this region.
Numerous studies have demonstrated that economic growth and urbanization will result in the expansion of PS and LS on a large scale [37,38,39]; our research corroborates these findings. Moreover, we observed that the size of PS and LS also determines the increase and decrease in ECB, and there is a significant positive correlation between them. However, blindly pursuing the economic returns generated by the expansion of PS and LS is not recommended. It should also be thoroughly examined for its negative effects. Under the natural development scenario, all types of territorial space will expand and transfer according to historical trends. Consequently, the ECB under this scenario will surge by 142.26% on the basis of 2020, but at the same time, it is also accompanied by the loss of 10.389 billion yuan in EB and 6.51 Tg in CS. After entering the 21st century, urbanization and economic globalization swept through the economic, social, and spatial structure of urban and rural areas [40,41]. With humans continuously advancing the development of territorial space, environmentally hostile behaviors such as frequent construction, transformation, and reconstruction have propelled socioeconomic development to new heights while also aggravating the human–land conflicts. In the natural development scenario, territorial space evolves in accordance with the natural rules, unaffected by policy intervention and planning. With the development in urbanization, PS and LS will continue to expand. Throughout this process, PeS will continue to erode, ultimately leading to uncoordinated urban growth. However, following the double optimization model allocation, the territorial space has achieved significant quantitative constraints on both PS and LS. These constraints effectively control their expansion rates and scales, while affording more comprehensive bottom line guarantee and spatial location protection for ES and PeS. Therefore, under the dual optimization scenario, the study area will greatly alleviate the human–land contradictions, fostering a more harmonious and balanced relationship between urban expansion and environmental conservation.
Notably, both PeS and ES are expected to decline after 2020. On the one hand, the continuous rise in costs caused by factors such as labor input or difficulty in reclamation in PeS originally situated on undulating terrain leads to declining profits year after year [42], resulting in the majority of such PeS being abandoned. According to the literature, 91.24% of farmland in China is marginalized due to its distribution in mountainous and hilly areas above 25° [39]. The Minjiang River Basin is an important agricultural production region in Sichuan Province; however, the plain within the basin is not widely distributed. While meeting the needs of secondary and tertiary industries, the space available for agricultural production is limited, and PeS in mountainous regions is relatively fragmented. Thus, it is imperative to strengthen the protection of basic farmland, promote the construction of high-quality farmland, and actively carry out related work such as land consolidation for agricultural purposes. On the other hand, scholars have demonstrated a significant correlation between rapid socioeconomic development and urbanization and the loss of ES, a decline in biodiversity, and the destruction of natural habitats [21,43]. Rapid urbanization inevitably leads to a decrease in surrounding ES [44] and an increase in environmental issues such as soil erosion and land degradation [45]. Consequently, the Chinese government has enacted a series of stringent laws and regulations regarding ecological protection, as well as setting ecological protection redlines. This has substantial practical implications for ecological restoration in fragile areas [46]. In the optimal allocation of territorial space provided by this study, the ES was comprehensively protected in terms of quantity and space by establishing limits on their number and designating ES non-convertible areas based on the redline boundaries and the location of nature reserves established by relevant government agencies. It further verifies the reliability and practical significance of this double optimization model.
In addition, the majority of water bodies in the study area are classified as EpS, and EpS has expanded slightly in both 2030 scenarios. This is because, in recent years, glaciers have melted faster as a result of global warming, leading to an increase in water resources introduced into rivers and lakes and causing a rise in the area of water bodies [47].
5.2. Suggestions for Future Development in the Study Area
Based on the above analysis and discussion of the research results, as well as previous studies, this paper makes the following recommendations starting from the actual situation of the Minjiang River Basin:
- (1)
- The scale of urban expansion should be strictly regulated, together with a rational and scientific expansion of PS and LS, and promotion of the rational flow of industries and populations. Governments of cities, districts, and counties in the basin should conduct a comprehensive assessment of the spatial requirements for high-quality urban development based on specific local socioeconomic development conditions and then implement reasonable territorial space development after having a clear understanding of the actual development requirements. In addition, it is necessary to simultaneously increase the comprehensive carrying capacity of cities, strengthen the development of advantageous and distinctive industries, enhance urban infrastructure construction and the level of public services, coordinate to refine the urban system structure, and ultimately create a well-planned and efficient urban space.
- (2)
- The encroachment of basic farmland should be strictly prevented, and the “three-in-one” protection of farmland quantity, quality, and ecology should be fully implemented. The implementation of protection goals for farmland and permanent basic farmland should be accelerated, with a prohibition on the illegal occupation of farmland, and limits on the encroachment of PS and LS on PeS. Meanwhile, the orderly recovery of existing farmland should be executed; thus, strengthening the ecological conservation of farmland, coordinating the comprehensive rectification of farmland throughout the region to reduce the fragmentation of PeS. Actions to improve the quality of farmland should be prioritized and ways such as improving soil conditions and cultivating conditions to effectively use farmland should be continuously explored, to promote the sustainable utilization of PeS.
- (3)
- The ecological protection red line should be strictly adhered to, thereby strengthening the protection of ecosystems and biodiversity with the goal of constructing a solid ecological security barrier in the upper reaches of the Yangtze River. There should be active engagement in ecological restoration for all types of territorial space, and an ecological protection spatial pattern should be developed. In addition, it is necessary to strictly implement “Shoreline Protection and Utilization Planning” for the Minjiang River, coordinating the use of shoreline resources, combining river regulation projects to promote shoreline restoration, deepening the construction of the Minjiang Green Ecological Corridor, and ensuring the ecological security of the Minjiang Basin.
6. Conclusions
The Minjiang Basin was used as an example in this study, employing a double optimization territorial space-simulation prediction model as a crucial tool for achieving the coordinated optimization of the quantity structure and distribution pattern. Economic benefits (ECB), ecological benefits (EB), carbon stock (CS), and comprehensive benefits (CB) served as the primary evaluation criteria. A multi-scale integration model, GMOP-PLUS coupled model, InVEST models, and other methodologies were applied. This study designed territorial space simulations for the year 2030 under both the natural development scenario and double optimization scenario, followed by a comparative analysis of their outcomes. This comprehensive and systematic investigation of the optimal allocation of territorial space for the Minjiang River Basin in 2030 offers valuable insights into sustainable development. In addition, it presents pertinent recommendations for the utilization and planning of territorial space. The specific conclusions include the following:
- (1)
- From 2010 to 2020, the size and location of each type of territorial space underwent varying degrees of change. The transfer of production and sub-ecological space (PeS) to production space (PS) had the largest area and scale, followed by the transfer to living space (LS). This is the primary obstacle to the sustainable development of territorial space in the Minjiang Basin. The scale of the transfer of production and ecological space (PES) to ecological and sub-production space (EpS) was the smallest. Ecological space (ES) had the smallest spatial pattern change range. PS had the most active spatial pattern change during this period.
- (2)
- In the natural development scenario, the unrestricted PS and LS occupied a large amount of PeS, resulting in a sharp decline in PeS, and ES was more disturbed compared to 2020. However, the territorial space allocation implemented in the double optimization scenario significantly slowed the expansion rate of PS and LS, thereby preventing further PeS and ES encroachment.
- (3)
- Through double optimization, the Minjiang Basin achieves the optimal balance of ECB, EB and CS, resulting in the highest CB value. The optimized allocation of territorial space not only abandons the development model that sacrifices food security and ecological security for economic benefits, but also effectively mitigates human–land conflicts within the basin. While addressing some development issues of territorial space, it lays a solid foundation for advancing the construction of “Beautiful China” and facilitating the achievement of carbon peaking and carbon neutrality objectives.
On the basis of meeting the national development needs and local planning requirements, the research results have obtained the greatest benefits. At the same time, the results offer technical assistance and policy recommendations to various levels of government in the Minjiang Basin in order to formulate overall territorial space planning, explore management paths, and determine future development directions. In addition, the double optimization territorial space simulation prediction model we developed and the formulated thought framework are universal and can be reproduced in other regions, which is worth promoting.
Nonetheless, the current study has some limitations: first, the construction of GMOP model can be further improved, especially the establishment of constraint conditions. In the future, we will explore more scientific and reasonable methods for setting these constraints to enhance the accuracy of the quantity structure of territorial space; second, the selected factors driving territorial space changes lacked consideration of policy factors. Therefore, greater emphasis should be placed on assessing the impacts of policy changes on territorial space development in future research.
Supplementary Materials
The following supporting information can be downloaded at: https://www.mdpi.com/article/10.3390/land12111989/s1. References [48,49,50,51,52,53] are cited in the Supplementary Materials.
Author Contributions
Conceptualization, G.W. and Z.Z.; methodology, J.X.; software, G.W.; validation, G.W., Z.Z. and D.O.; formal analysis, G.W., D.O., J.F. and S.G.; investigation, G.W. and J.X.; resources, G.W., J.X., J.F. and Y.X.; data curation, G.W., Z.Z., D.O. and Y.X.; writing—original draft preparation, G.W.; writing—review and editing, G.W. and Z.Z.; visualization, G.W., Z.Z., D.O., J.F. and S.G.; supervision, J.X. and D.O.; project administration, J.X. and D.O.; funding acquisition, J.X. and J.F. All authors have read and agreed to the published version of the manuscript.
Funding
This research was funded by grants from the Science and Technology Project of Sichuan Province (Grant No. 2021YFS0279).
Data Availability Statement
Data available on request due to restrictions, e.g., privacy or ethical.
Acknowledgments
Many thanks go to the College of Resources, Sichuan Agricultural University, China, for support.
Conflicts of Interest
The authors declare no conflict of interest.
References
- Su, L.; Fu, L. Regional land planning based on BPNN and space mining technology. Neural Comput. Appl. 2021, 33, 5241–5255. [Google Scholar] [CrossRef]
- Zhou, D.; Xu, J.; Lin, Z. Conflict or coordination? Assessing land use multi-functionalization using production-living-ecology analysis. Sci. Total Environ. 2017, 577, 136–147. [Google Scholar] [CrossRef] [PubMed]
- Long, H.; Ge, D.; Zhang, Y.; Tu, S.; Qu, Y.; Ma, L. Changing man-land interrelations in China’s farming area under urbanization and its implications for food security. J. Environ. Manag. 2018, 209, 440–451. [Google Scholar] [CrossRef] [PubMed]
- Chen, W.; Zeng, J.; Li, N. Change in land-use structure due to urbanisation in China. J. Clean. Prod. 2021, 321, 128986. [Google Scholar] [CrossRef]
- Goličnik Marušić, B.; Dremel, M.; Ravnikar, Ž. A frame of understanding to better link nature-based solutions and urban planning. Environ. Sci. Policy 2023, 146, 47–56. [Google Scholar] [CrossRef]
- Frantzeskaki, N. Seven lessons for planning nature-based solutions in cities. Environ. Sci. Policy 2019, 93, 101–111. [Google Scholar] [CrossRef]
- Bush, J.; Doyon, A. Building urban resilience with nature-based solutions: How can urban planning contribute? Cities 2019, 95, 102483. [Google Scholar] [CrossRef]
- Yang, W. Ecological Civilization is a New State of Civilization Featuring the Harmony between Man and Nature. Chin. J. Urban Environ. Stud. 2020, 08, 2075004. [Google Scholar] [CrossRef]
- Luo, G.; Yin, C.; Chen, X.; Xu, W.; Lu, L. Combining system dynamic model and CLUE-S model to improve land use scenario analyses at regional scale: A case study of Sangong watershed in Xinjiang, China. Ecol. Complex. 2010, 7, 198–207. [Google Scholar] [CrossRef]
- Baqa, M.F.; Chen, F.; Lu, L.; Qureshi, S.; Tariq, A.; Wang, S.; Jing, L.; Hamza, S.; Li, Q. Monitoring and Modeling the Patterns and Trends of Urban Growth Using Urban Sprawl Matrix and CA-Markov Model: A Case Study of Karachi, Pakistan. Land 2021, 10, 700. [Google Scholar] [CrossRef]
- Yang, X.; Chen, R.; Zheng, X.Q. Simulating land use change by integrating ANN-CA model and landscape pattern indices. Geomat. Nat. Hazards Risk 2016, 7, 918–932. [Google Scholar] [CrossRef]
- Liu, X.; Liang, X.; Li, X.; Xu, X.; Ou, J.; Chen, Y.; Li, S.; Wang, S.; Pei, F. A future land use simulation model (FLUS) for simulating multiple land use scenarios by coupling human and natural effects. Landsc. Urban Plan. 2017, 168, 94–116. [Google Scholar] [CrossRef]
- Liu, P.; Hu, Y.; Jia, W. Land use optimization research based on FLUS model and ecosystem services–setting Jinan City as an example. Urban Clim. 2021, 40, 100984. [Google Scholar] [CrossRef]
- Li, X.; Fu, J.; Jiang, D.; Lin, G.; Cao, C. Land use optimization in Ningbo City with a coupled GA and PLUS model. J. Clean. Prod. 2022, 375, 134004. [Google Scholar] [CrossRef]
- Wang, Z.; Li, X.; Mao, Y.; Li, L.; Wang, X.; Lin, Q. Dynamic simulation of land use change and assessment of carbon storage based on climate change scenarios at the city level: A case study of Bortala, China. Ecol. Indic. 2022, 134, 108499. [Google Scholar] [CrossRef]
- Liang, X.; Guan, Q.; Clarke, K.C.; Liu, S.; Wang, B.; Yao, Y. Understanding the drivers of sustainable land expansion using a patch-generating land use simulation (PLUS) model: A case study in Wuhan, China. Comput. Environ. Urban Syst. 2021, 85, 101569. [Google Scholar] [CrossRef]
- Li, C.; Wu, Y.; Gao, B.; Zheng, K.; Wu, Y.; Li, C. Multi-scenario simulation of ecosystem service value for optimization of land use in the Sichuan-Yunnan ecological barrier, China. Ecol. Indic. 2021, 132, 108328. [Google Scholar] [CrossRef]
- Li, J.; Guldmann, J.-M.; Gong, J.; Su, H. Urban growth boundaries optimization under low-carbon development: Combining multi-objective programming and patch cellular automata models. J. Environ. Manag. 2023, 340, 117934. [Google Scholar] [CrossRef]
- Meimei, W.; Zizhen, J.; Tengbiao, L.; Yongchun, Y.; Zhuo, J. Analysis on absolute conflict and relative conflict of land use in Xining metropolitan area under different scenarios in 2030 by PLUS and PFCI. Cities 2023, 137, 104314. [Google Scholar] [CrossRef]
- Shi, Q.; Gu, C.-J.; Xiao, C. Multiple scenarios analysis on land use simulation by coupling socioeconomic and ecological sustainability in Shanghai, China. Sustain. Cities Soc. 2023, 95, 104578. [Google Scholar] [CrossRef]
- Wang, Q.; Guan, Q.; Sun, Y.; Du, Q.; Xiao, X.; Luo, H.; Zhang, J.; Mi, J. Simulation of future land use/cover change (LUCC) in typical watersheds of arid regions under multiple scenarios. J. Environ. Manag. 2023, 335, 117543. [Google Scholar] [CrossRef] [PubMed]
- Zhang, Z.; Wang, X.; Zhang, Y.; Gao, Y.; Liu, Y.; Sun, X.; Zhi, J.; Yin, S. Simulating land use change for sustainable land management in rapid urbanization regions: A case study of the Yangtze River Delta region. Landsc. Ecol. 2023, 38, 1807–1830. [Google Scholar] [CrossRef]
- Thilagavathr, N.; Amudha, T. A novel methodology for optimal land allocation for agricultural crops using Social Spider Algorithm. PeerJ 2019, 7, e7559. [Google Scholar] [CrossRef] [PubMed]
- Singh, A. Optimal allocation of water and land resources for maximizing the farm income and minimizing the irrigation-induced environmental problems. Stoch. Environ. Res. Risk Assess. 2017, 31, 1147–1154. [Google Scholar] [CrossRef]
- Ahamad, M.S.S. An Integrated Model for Land Use Allocation Planning: A Case Study of Residential Land Use in Malaysia. Ph.D. Thesis, The University of Nottingham, Nottingham, UK, 1998. [Google Scholar]
- Rahman, M.M.; Szabó, G. Sustainable Urban Land-Use Optimization Using GIS-Based Multicriteria Decision-Making (GIS-MCDM) Approach. ISPRS Int. J. Geo-Inf. 2022, 11, 313. [Google Scholar] [CrossRef]
- Sharmin, N.; Haque, A.; Islam, M.M. Generating Alternative Land-use Allocation for Mixed Use Areas: Multi-Objective Optimization Approach. Geogr. Anal. 2019, 51, 448–474. [Google Scholar] [CrossRef]
- Manonmani, R.; Vidhya, R.; Subramani, T. Role of multi- scale in land use/ land cover change simulation model -A study in Upper Kodaganar Basin, Tamil Nadu, India. Indian J. Geo-Mar. Sci. 2017, 46, 176–189. [Google Scholar]
- Sen, O.L.; Bozkurt, D.; Vogler, J.B.; Fox, J.; Giambelluca, T.W.; Ziegler, A.D. Hydro-climatic effects of future land-cover/land-use change in montane mainland southeast Asia. Clim. Chang. 2013, 118, 213–226. [Google Scholar] [CrossRef]
- Xu, X.C.; Zhang, D.C.; Liu, X.P.; Ou, J.P.; Wu, X.X. Simulating multiple urban land use changes by integrating transportation accessibility and a vector-based cellular automata: A case study on city of Toronto. Geo-Spat. Inf. Sci. 2022, 25, 439–456. [Google Scholar] [CrossRef]
- Lee, J.; Newman, G. Forecasting Urban Vacancy Dynamics in a Shrinking City: A Land Transformation Model. Isprs Int. J. Geo-Inf. 2017, 6, 124. [Google Scholar] [CrossRef]
- Cagliyan, A.; Dagli, D. Monitoring Land Use Land Cover Changes and Modelling of Urban Growth Using a Future Land Use Simulation Model (FLUS) in Diyarbakir, Turkey. Sustainability 2022, 14, 9180. [Google Scholar] [CrossRef]
- Dong, H.; Wang, H. Construction of Evaluation System for High-quality Development of Characteristic Towns from the Perspective of Production-Living-Ecology Integration. Asian Agric. Res. 2020, 12, 1–5. [Google Scholar] [CrossRef]
- Gardiner, L.R.; Steuer, R.E. Unified Interactive Multiple Objective Programming: An Open Architecture For Accommodating New Procedures. J. Oper. Res. Soc. 1994, 45, 1456–1466. [Google Scholar] [CrossRef]
- Molotoks, A.; Stehfest, E.; Doelman, J.; Albanito, F.; Fitton, N.; Dawson, T.P.; Smith, P. Global projections of future cropland expansion to 2050 and direct impacts on biodiversity and carbon storage. Glob. Chang. Biol. 2018, 24, 5895–5908. [Google Scholar] [CrossRef] [PubMed]
- Dybala, K.E.; Steger, K.; Walsh, R.G.; Smart, D.R.; Gardali, T.; Seavy, N.E. Optimizing carbon storage and biodiversity co-benefits in reforested riparian zones. J. Appl. Ecol. 2019, 56, 343–353. [Google Scholar] [CrossRef]
- Tan, M.; Li, X.; Xie, H.; Lu, C. Urban land expansion and arable land loss in China—A case study of Beijing–Tianjin–Hebei region. Land Use Policy 2005, 22, 187–196. [Google Scholar] [CrossRef]
- Zhang, Y.; Xie, H. Interactive Relationship among Urban Expansion, Economic Development, and Population Growth since the Reform and Opening up in China: An Analysis Based on a Vector Error Correction Model. Land 2019, 8, 153. [Google Scholar] [CrossRef]
- Tan, Y.; Chen, H.; Xiao, W.; Meng, F.; He, T. Influence of farmland marginalization in mountainous and hilly areas on land use changes at the county level. Sci. Total Environ. 2021, 794, 149576. [Google Scholar] [CrossRef]
- Bao, C.; Xu, M. Cause and effect of renewable energy consumption on urbanization and economic growth in China’s provinces and regions. J. Clean. Prod. 2019, 231, 483–493. [Google Scholar] [CrossRef]
- Zhuo, C.; Deng, F. How does China’s Western Development Strategy affect regional green economic efficiency? Sci. Total Environ. 2020, 707, 135939. [Google Scholar] [CrossRef]
- Wang, Y.; Li, X.; Xin, L.; Tan, M. Farmland marginalization and its drivers in mountainous areas of China. Sci. Total Environ. 2020, 719, 135132. [Google Scholar] [CrossRef] [PubMed]
- Feng, Y.; He, S.; Li, G. Interaction between urbanization and the eco-environment in the Pan-Third Pole region. Sci. Total Environ. 2021, 789, 148011. [Google Scholar] [CrossRef] [PubMed]
- Wang, Q.; Guan, Q.; Lin, J.; Luo, H.; Tan, Z.; Ma, Y. Simulating land use/land cover change in an arid region with the coupling models. Ecol. Indic. 2021, 122, 107231. [Google Scholar] [CrossRef]
- Chen, X.; Yu, L.; Du, Z.; Xu, Y.; Zhao, J.; Zhao, H.; Zhang, G.; Peng, D.; Gong, P. Distribution of ecological restoration projects associated with land use and land cover change in China and their ecological impacts. Sci. Total Environ. 2022, 825, 153938. [Google Scholar] [CrossRef]
- Mu, H.; Li, X.; Ma, H.; Du, X.; Huang, J.; Su, W.; Yu, Z.; Xu, C.; Liu, H.; Yin, D.; et al. Evaluation of the policy-driven ecological network in the Three-North Shelterbelt region of China. Landsc. Urban Plan. 2022, 218, 104305. [Google Scholar] [CrossRef]
- Li, Z.; Yuan, R.; Feng, Q.; Zhang, B.; Lv, Y.; Li, Y.; Wei, W.; Chen, W.; Ning, T.; Gui, J.; et al. Climate background, relative rate, and runoff effect of multiphase water transformation in Qilian Mountains, the third pole region. Sci. Total Environ. 2019, 663, 315–328. [Google Scholar] [CrossRef]
- Zheng, Q.; Wan, L.; Wang, S.; Wang, C.; Fang, W. Does ecological compensation have a spillover effect on industrial structure upgrading? Evidence from China based on a multi-stage dynamic DID approach. J. Environ. Manag. 2021, 294, 112934. [Google Scholar] [CrossRef]
- Xie, G.; Zhang, C.; Zhen, L.; Zhang, L. Dynamic changes in the value of China’s ecosystem services. Ecosyst. Serv. 2017, 26, 146–154. [Google Scholar] [CrossRef]
- Clerici, N.; Cote-Navarro, F.; Escobedo, F.J.; Rubiano, K.; Villegas, J.C. Spatio-temporal and cumulative effects of land use-land cover and climate change on two ecosystem services in the Colombian Andes. Sci. Total Environ. 2019, 685, 1181–1192. [Google Scholar] [CrossRef]
- Nie, X.; Lu, B.; Chen, Z.; Yang, Y.; Chen, S.; Chen, Z.; Wang, H. Increase or decrease? Integrating the CLUMondo and InVEST models to assess the impact of the implementation of the Major Function Oriented Zone planning on carbon storage. Ecol. Indic. 2020, 118, 106708. [Google Scholar] [CrossRef]
- Alam, S.A.; Starr, M.; Clark, B.J.F. Tree biomass and soil organic carbon densities across the Sudanese woodland savannah: A regional carbon sequestration study. J. Arid. Environ. 2013, 89, 67–76. [Google Scholar] [CrossRef]
- Zhu, W.; Zhang, J.; Cui, Y.; Zhu, L. Ecosystem carbon storage under different scenarios of land use change in Qihe catchment, China. J. Geogr. Sci. 2020, 30, 1507–1522. [Google Scholar] [CrossRef]
Disclaimer/Publisher’s Note: The statements, opinions and data contained in all publications are solely those of the individual author(s) and contributor(s) and not of MDPI and/or the editor(s). MDPI and/or the editor(s) disclaim responsibility for any injury to people or property resulting from any ideas, methods, instructions or products referred to in the content. |
© 2023 by the authors. Licensee MDPI, Basel, Switzerland. This article is an open access article distributed under the terms and conditions of the Creative Commons Attribution (CC BY) license (https://creativecommons.org/licenses/by/4.0/).