Article

Mid- and End-of-the-Century Estimation of Agricultural Suitability of California’s Specialty Crops

Department of Geography and Anthropology, California State Polytechnic University, Pomona, CA 91768, USA
*
Author to whom correspondence should be addressed.
Land 2023, 12(10), 1907; https://doi.org/10.3390/land12101907
Submission received: 10 July 2023 / Revised: 29 September 2023 / Accepted: 30 September 2023 / Published: 11 October 2023
(This article belongs to the Special Issue Sustainable Land Management, Climate Change and Food Security)

Abstract

:
Specialty crops with long economic life cycles have lower adaptability and flexibility to climate change, making long-term planning crucial. This study examines the impact of climate change on almond, citrus, pistachio, and walnut production in California, using a machine learning approach to estimate crop suitability under current and future environmental conditions. We used recent satellite-observed cropland data to generate an occurrence dataset for these crops. Ecological data including bioclimatic variables derived from global circulation models developed under the Coupled Model Intercomparison Project Phase 6 (CMIP6) and surface variables were used to model suitability. The bioclimatic variables relating to temperature and precipitation had the largest effect on each crop’s suitability estimation. The results indicate that suitable areas for almonds, citrus, and walnuts will change significantly within 20 years due to climatic change, and the change will be even greater by the end of the century, indicating a potential loss of 94% of the current suitable area. The results for pistachios indicate change in the spatial distribution of suitable area but the total area is predicted to remain near the current suitable area. Policymakers, researchers, and farmers must work together to develop proactive adaptation strategies to mitigate the negative effects of climate change on specialty crop production. The application of a species distribution model for agriculture suitability provides critical information for future work on adaptation to climate change, identifying areas to target for further analysis.

1. Introduction

Specialty crops are a growing agricultural activity as more consumers are attracted to food options that are healthy, less industrialized, and serve those allergic to gluten or lactose [1]. California produces 28 types of specialty crops (e.g., fruits and nuts) thanks to its advantageous Mediterranean climate and irrigation infrastructure that make the state one of the largest producers of specialty crops in the world [2]. Overall, California’s agricultural sector generated USD 50 billion in revenue in 2018–2019, and specialty crops were responsible for USD 21.7 billion [3]. From 2008 to 2018, specialty crops expanded from 2.5 to 3 million acres, almost doubling their revenue from USD 11.2 to USD 21.7 billion in 2018 [3]. However, extreme droughts, changes in temperatures, and other effects of climate change can challenge California’s advantage in specialty crop production while exacerbating the sector’s negative side such as intense water demand, and land allocation and concentration [4,5,6]. Climate change will impact food production worldwide and California’s specialty crops are not exceptions [7,8,9]. The current scientific understanding predicts that severe and prolonged droughts will become more frequent due to the changing climate [10,11]. Thus, there is a need to assess agricultural suitability under future climate conditions to inform stakeholders decisions on where to produce specialty crops, which is essential to support the specialty crop industry while seeking to minimize threatening climatic conditions.
Agricultural suitability is the aptness of the land and the environment for agricultural crop production. Suitability can be determined by the land’s natural conditions such as soil, moisture, precipitation, and temperature [12]. Agricultural suitability can also be measured in terms of human modification of the environment, such as irrigation, soil correction, and the use of agrochemicals and genetically modified organisms [13,14]. Moreover, agricultural suitability can be analyzed as a socio-ecological construct, where the land suitability for an agricultural production is shaped by interactions of human and natural systems. The human system includes the market forces that can lead to agricultural land expansion and the technological and management advancement of agricultural production. The natural system includes climatic conditions, soil, terrain, and the human-modified environment [9,15,16]. Although we cannot completely model agricultural suitability as a socio-ecological construct, we can examine where agricultural production is happening to detect locations of current suitability [17].
Satellite imagery revolutionized agricultural production observations and monitoring, which amplified science’s understanding of agricultural suitability. In fact, the satellite era brought new understanding of soil distribution, land cover and change in land use, water use, and of climate [18]. Currently, the usage of new platforms for remote sensing such as UAV and phenocams offer the opportunity for near-real-time observation of crop production and suitability assessment (for the use of UAV [19,20], and for phenocams [21]). In addition, the use of earth observation sensors and geographical information systems (GIS) for the environment and for agricultural production contribute to improving maps of agricultural suitability and zoning [22]. Suitability maps are created from existing knowledge of the crop requirements and local environmental conditions, and validated with field experiments, resulting in a complex and long period of assessment. These maps, in turn, can be useful planning tools for farmers and other stakeholders. Moreover, agricultural suitability maps inform crop insurance, access to credit, start/end of crop season, expected yield, and food availability. Pressed by climate change, researchers started exploring alternatives to accelerating the process of agricultural suitability mapping, and the use of models for species distribution range emerged as the leading alternative.
A species distribution range is defined by a complex interaction of biotic and abiotic factors that define areas of adequate conditions for the species. Species distribution models (SDMs), subsequently, attempt to recreate that range based on observation of the species (some also use absence of the species) and environmental conditions [23]. Traditionally, SDMs have been employed by ecologists through research on predicting areas of rare species occurrence [24], invasive species [25], and potential for invasive species [26]. More recently, land change scientists have used SDMs to predict agricultural production potential and expected crop response to climate change [27,28]. The two main advantages of SDMs for the study of specialty crops are the model ability to define suitable areas using machine learning to investigate multiple variables at once and the capacity to project the definition of suitable areas into the future using climate change scenarios. MaxEnt is the primer algorithm to solve SDMs and previous research applied it to estimate suitable areas for grapes [29], sugarcane [30], corn, and almonds [31], among several others.
California’s agricultural production has been optimizing crop choice and technology in the last decades to improve resource yield and efficiency, especially given the state’s constraints of water supply. California is the main producer of almonds, pistachios, and walnuts in the United States, and one of the largest producers of citrus. Among the conditions necessary for these specialty crops, it is possible to highlight that almond orchards have lower chilling requirements than other nuts but are known for water demand [4], while pistachios have a high chilling requirement [32], and citrus benefits from warmer conditions [33] while walnuts are not well suited for high annual temperatures [34]. Updated suitability mapping offers an invaluable contribution that can promote California’s specialty crops by bolstering farmers’ preparedness to climate change. Farmers must adapt to climate change to avoid yield losses, which are expected to be as large as 20% for strawberries or as small as 1% for grapes, while almonds’ yield are expected to gain 5% [35]. In terms of current yield and revenue, these estimates translate into losses of USD 622 million in the strawberries industry and USD 110 million in the grapes industry; however, these losses could be partially offset by a gain of USD 425 million in the almond industry. Other researchers have demonstrated that impacts at county-level differ by specialty crop and season of analysis [2].
The main objective of this paper is to estimate the agricultural suitability of selected specialty crops in California under current and future environmental conditions. We used 2018 satellite-observed cropland data to generate the occurrence dataset for specialty crops, and environmental data including bioclimatic variables derived from global circulation models developed under the CMIP6 and surface variables. Our results contribute to the literature by showing changes in the spatial distribution of suitable areas and which environmental variables had the greatest effect on each crop at the mid and end of the century. Suitability analysis looking into the end of century conditions are rare but increasingly important due to the long economic life cycle of specialty crops and the effects of climate change. This research contributes to a new applied framework to model agricultural suitability and provide farmers and industry stakeholders with suitability information to ultimately direct actions to improve crops’ climate resilience.

2. Material and Methods

2.1. Study Area

California is the main producer of specialty crops in the US, and the sole producer of almonds, pistachios, and walnuts. Due to its geography, California has multiple environments that allow for diverse and economically relevant agricultural production (Table 1). In this study, we focus on the current production areas for almonds, citrus, pistachios, and walnuts to define our suitability as a baseline, before expanding our study area to investigate potential suitable areas in California. The four crops are spread from north to south, with a higher concentration in the Central California Valley (Figure 1B,C). California almonds occupies close to 1.2 million acres, with the largest producing counties being Fresno, Kern, Stanislaus, and Kings [3,36]. California’s citrus production, around 260,000 acres, is concentrated in five counties: Tulare, Kern, Ventura, Fresno, and Riverside [3]. The California’s pistachio production area has expanded in the last 10 years and currently stands at 370,000 acres, mostly distributed among Kern, Fresno, Tulare, Madera, and Kings counties. Walnuts occupy 380,000 acres, and most of that area is within the Central California Valley, with the top five counties by value being San Joaquin, Butte, and Tulare, Glenn, and Stanislaus [3].

2.2. Cropland Data

Crop location data for 2018 are from the cropland data layer (CDL) of the National Agriculture Statistics Service of the US Department of Agriculture 2021 [37]. Data are presented in Figure 1. The CDL classifies 93 land uses in the contiguous U.S. with a 30 m resolution. From the 2018 CDL, we extracted individual rasters for almonds, citrus, pistachios, and walnuts. The areas used for the crop were converted into points using the centroid of each grid-cell; the points will later be used as presence points for the SDM [28]. These four crops are important cash crops and in 2018, we obtained 5,568,452 points for almond, 774,106 for citrus, 1,914,225 for walnuts, and 1,738,831 for pistachios. To limit the influence of spatial autocorrelation, we implemented a spatial rarefy procedure to keep one record in each 5 km. The remaining sample had 527 points for almonds, 452 for citrus, 476 for walnuts, and 1117 for pistachios. The spatial rarefied dataset also matches the resolution of our environmental data described below.

2.3. Bioclimatic and Surface Data

For specialty crops, bioclimatic variables add information that would not be captured by considering only the average mean temperature and precipitation (Table 2). Traditional suitability analysis and agricultural zoning relied on annual means to represent both the climatic condition of a region and the climatic requirements for crop production. A shortcoming of annual mean is the smoothing over of extreme events such as drought, flood, and heat wave. Planning for agricultural production can be improved by the incorporation of bioclimatic variables that capture seasonality—i.e., annual temperature range, temperature seasonality—and variables that capture extremes—i.e., mean temperature of the warmest quarter, precipitation for the driest quarter—as these variables inform climate variation and approximate climate information necessary to understand crops’ ecological demands [15,38].
For this study, bioclimatic variables were obtained from the WorldClim v2.1 database for three periods: near-historical (1970–2000), mid-of-the-century (2040–2061), and end-of-the-century (2081–2100) [39]. The future projections are from four global climate models (GCMs) participating in the sixth phase of the Climate Model Intercomparison Projects (CMIP6): CNRM-CM6-1, CNRM-ESM2-1, IPSL-CM6A-LR, and MRI-ESM2-0; all models developed under the shared socio-economic pathway SSP5-8.5. We opted for SSP5-8.5 as this scenario focuses on adaptation while having an elevated concentration of greenhouse gases and high global warming. The GCMs are downscaled to 2.5 min (or equivalent to 4.5 km at the equator) [39].
Surface factors account for the influence of relief for different crops (Table 2). The digital elevation model (DEM) at 2.5 min resolution was obtained from the WorldClim v2.1 database [39]. From the DEM, we derived slope (in degrees) and aspect using ArcGIS Pro 2.9. Slope refers to how steep an area is compared to its neighboring areas, and it can capture how accessible certain areas are for agricultural production including effects on irrigation and harvest processes. The aspect represents the orientation of the area and the exposure to sunlight. For specialty crops, the aspect can be related to how much sunlight and intensity can affect quality and yield. Another factor influencing specialty crops is competing land use. Specialty crops have lost areas to urban development and to other crops. We used land cover/land-use classes combined into urban, protected/undeveloped land, agricultural, and water, based on data from the National Land Cover Database 2019 [40]. To have an agreement between the spatial resolution of the different layers, we used a majority rule to resample all data to the bioclimatic dataset resolution.

2.4. Modeling Agricultural Suitability Distribution Range

To model agricultural suitability of selected specialty crops in California, we developed a series of species distribution models using MaxEnt. SDM is a presence-only, as we can only say where the land-use has been classified as the target crop. The use of an SDM in agricultural crops is unique, as the locations of the crops are influenced by climate but also by technology and capital. MaxEnt is the premier algorithm to solve SDMs. After estimating the current suitable area, MaxEnt can be used to project future suitability based on a new environmental dataset. While previous studies have used bioclimatic data from the CMIP5, we are analyzing the projections under the most recent climate models (CMIP6) and considering mid- and end-of-the-century periods.
We used SDMToolbox as the integration between GIS and MaxEnt [41]. For the MaxEnt set up, we used a 10-percentile training presence as the threshold, and the background bias was set to 20 km from the rarified specialty crops points. Our baseline was developed considering the near-historical bioclimatic variables from the WorldClim v2.1. MaxEnt outputs both a probability of presence for each area and a binary thresholder prediction area. We set MaxEnt to create the binary prediction using the 10-percentile training presence as the threshold [41]. The binary prediction layers were used as our prediction of suitability. Once we obtained our baseline for the spatial distribution of specialty crops suitability, we proceeded to estimate their future distribution.
To incorporate the difference in climate change models, we projected our crops SDM to four GCMs and considered the convergence of projections as our future suitability estimation. The process of projection to climate change scenarios consists of first identifying suitable areas under each GCM by running MaxEnt with the bioclimatic variables derived from each GCM. After we obtained the individual GCM results, we overlaid all the results for each time period, and calculated the areas (pixels) that were projected as suitable for >80% of the models [42]. The congruence of 80% shows that the area is predicted to be suitable in at least three GCM scenarios, and we consider it to be an area resilient to climate change. Areas with a lower congruence are considered as vulnerable to climate change and not identified as suitable.
The final analysis was the calculation of spatial distributional shift. In this analysis, we compared the original specialty crops 2018 CDL to the MaxEnt results. When compared to the baseline MaxEnt, we can identify areas that our model was under/overpredicting. By comparison, when considered the 2018 CDL with the 2041-60 MaxEnt (or 2081–2100 MaxEnt), we can identify areas that are either resilient, vulnerable, or developing suitability. Continued suitability areas were defined as areas currently under production and projected to continue to have suitability by our model. Areas identified as losing suitability were consider vulnerable areas, and were areas currently under production and projected to not have suitability in the future. The gaining suitability areas were areas currently not under production and projected to be suitable in the future.

3. Results

3.1. Baseline Specialty Crops Suitability Spatial Distribution

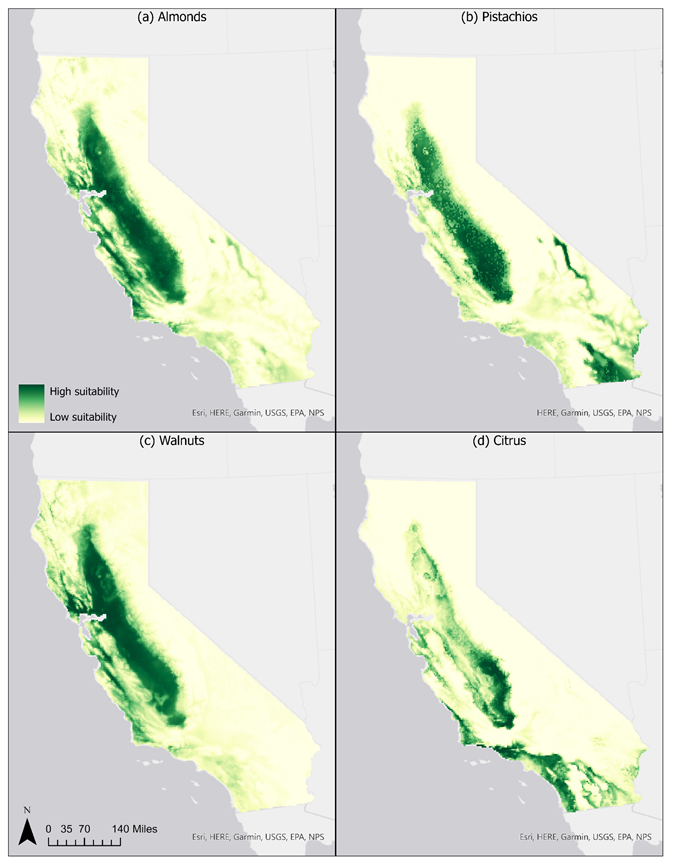
The MaxEnt results under near historical conditions show the probability of a suitable location for specialty crops in California (Figure 2). Through evaluation of the MaxEnt output maps by the receiver operation characteristic (ROC) curve and area under the curve (AUC) for each of the models, the model for citrus has the highest accuracy (AUC of 0.889) and the model for walnut has the lowest (AUC of 0.825). The accuracy is acceptable compared to the literature on the use of MaxEnt for agricultural suitability [28,43]. After applying the 10-percentile training threshold, we obtained the area estimated as suitable for each crop (Figure 2). MaxEnt estimated the largest area for walnuts at 91,775 km2, followed by pistachios, almonds, and citrus at 89,585 km2, 80,588 km2, and 69, 935 km2, respectively. It is important to note that these areas overlap and that these crops can, and will, compete for land. These results are unrestricted estimations as we did not remove urban areas or protected areas from the final model output. For the response curve of each environmental variable, please see Supplementary Materials.
The suitability estimation benefits from accurately reproducing areas in production while also capturing potential areas for production. We assessed the model’s representative capability of current production areas in Figure 3. On average, MaxEnt captured 93% of the 2018 spatial distribution of each crop (dark green color), the lowest being 90% for pistachios and the highest of 95.6% for walnuts. The MaxEnt also predicted areas that were not in production in 2018 but that are identified by the model as suitable (light green color). On average, the MaxEnt estimated 58% more suitable areas than the areas under production. Areas currently under production but not identified as suitable by the model account for close to 7% of the 2018 area. The bioclimatic variable with the highest gain varies among the crops. Overall, minimum temperature of coldest month (bio6) had the highest gain for almonds and citrus, while mean diurnal range (bio2) for walnuts, and bio14 for pistachios, had the more unique information. The bioclimatic variables that had the most unique information for citrus and walnuts were minimum temperature of coldest month, mean temperature of wettest quarter, and mean annual temperature (bio6, bio8, and bio1, respectively); for almonds and pistachios, they were precipitation of warmest quarter, precipitation of driest quarter, and precipitation of driest month (bio18, bio17, and, bio14 respectively). Surface variables elevation had the highest gain for all but citrus, which had slope with the highest gain.

3.2. Projections for Specialty Crops Suitability under Climate Change

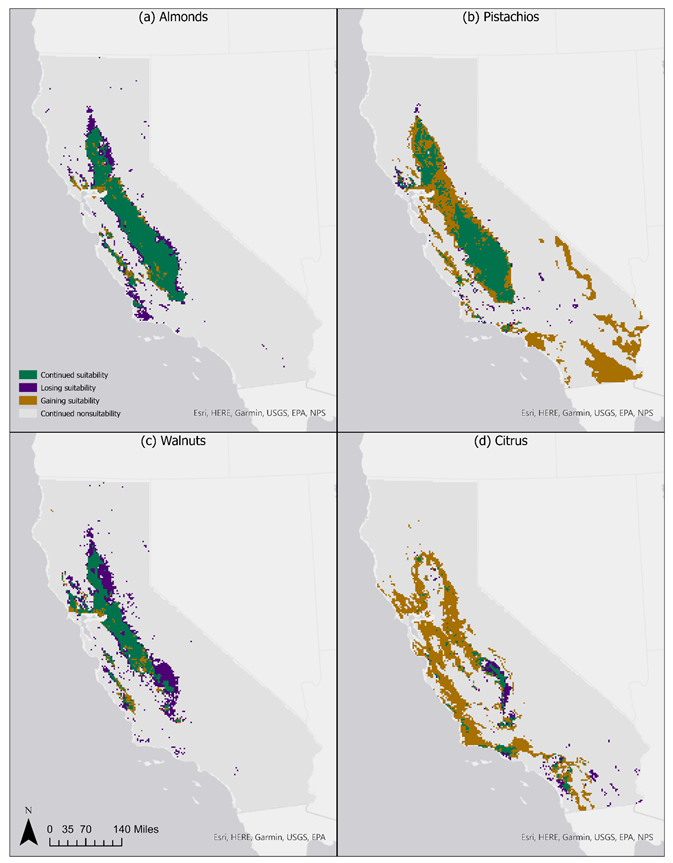
Figure 4 illustrates the MaxEnt projected to 2041–2060. We found a reduction in the areas estimated for suitability for all crops except for pistachios when compared to the baseline. The estimative for pistachios is a marginal increase of 2% in suitable area in contrast to the baseline (potential suitability). Among the areas with predicted reduction, citrus has the smallest reduction in suitability, and it is predicted to have 92% of the suitable area as in the baseline. Potential suitability for citrus offsets most of the vulnerability to climate change of the current production area. Almonds present a 56% reduction in the baseline suitable area. Walnuts have the strongest reduction in suitable area to 31%. Most of the suitable areas for almonds and walnuts are resilient areas with small addition of potential suitable areas. Considering how the projected suitability overlaps with the current production area, we observe from Figure 4 a loss of suitability. On average, the models predicted 68% of resilient suitability and 32% of vulnerable suitability of current production areas. Pistachios have 90% of their current area as suitable, followed by almonds (75%), citrus (53%), and walnuts (52%).
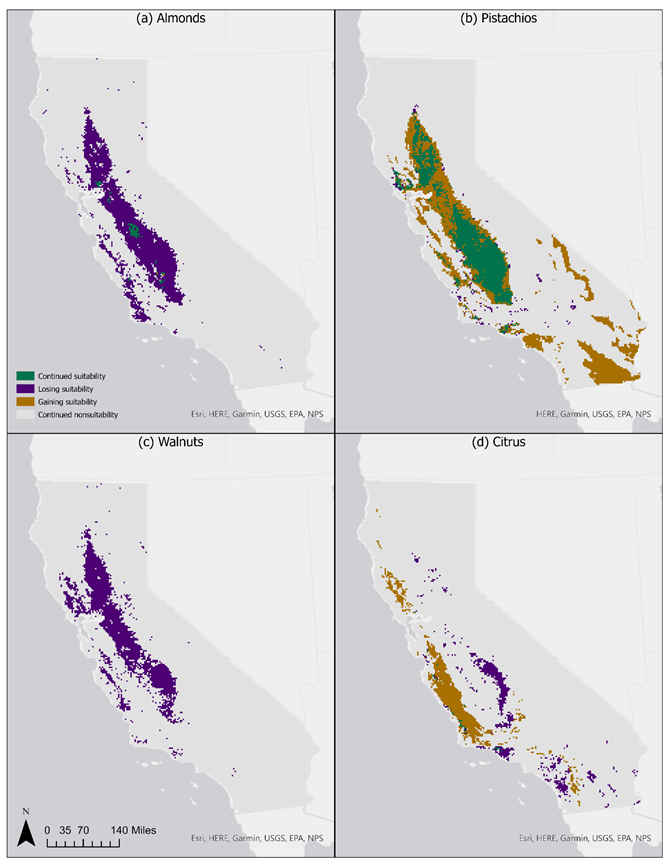
Figure 5 depicts the MaxEnt projection for 2081–2100. Our analysis indicates a decline in the estimated suitability for all crops, except for pistachios, when compared to the baseline. Pistachios exhibit a minor increase of 5% in the suitable area relative to the baseline. Citrus shows the least reduction in suitability, with only 31% of area remaining suitable. Almonds have just 2% of the original suitable area remaining, while walnuts experience the most significant reduction to 0%. By examining the overlap between the projected and current production area, we can pinpoint regions where suitability is expected to decrease. On average, the models predict that 24% of the current production area will remain suitable, primarily due to pistachios, which are estimated to retain 92% of their current suitable area. Without pistachio, the average potential suitable area drops to just 2% (citrus 4%, almonds 2%, and walnuts 0%) by the end of the century.

4. Discussion

4.1. Specialty Crops’ Suitability and Spatial Distribution Shift

Specialty crops have specific ecological requirements, which causes a diversified rate of response to climate change. Our findings point to a future with severe distribution shifts due to the loss of climatic suitability for specialty crop production in California. The main bioclimatic variable to explain the shift is the minimum temperature in the coldest month, as the crops analyzed have a period of dormancy in the winter, and the GCMs predicted warmer winters. As expected, the change in suitability areas is intensified by the end of the century due to the more severe effects of climate change under SSP5-8.5. This section is organized to contextualize the MaxEnt results (almonds, citrus, pistachios, walnuts) with the literature on suitability requirements for each crop and how those requirements can help us understand the possible shift in spatial suitability. We will first provide an overview of the findings, followed by a more detailed discussion of each specialty crop.
MaxEnt results agree with the literature on the suitability conditions for almonds. In the literature, almonds are described as having a moderate chill requirement [44], so the warmer winter can influence the chill accumulation necessary for almond development, thus, impacting yield [8,9,35]. Moreover, extreme heat or unseasonably warm temperatures can negatively affect almond orchards [2,32], a negative compounded heat effect if associated with water stress [32]. In the MaxEnt model, the variable minimum temperature of the coldest month (bio6) was the most critical bioclimatic variable to predict almond suitability. Variables related to precipitation, such as precipitation of warmest quarter, of driest quarter, and of driest month (bios 18, 17, 14), provided the most unique information for the model. We found these variables to be aligned with almonds, benefiting from reduced risk of frost due to warmer winters [45]. The crop benefits from warm, early, dry springs, while precipitation has a negative effect on yield [7]. Using this interpretation, we can understand almonds northward shift by mid-century [9] as a search for environments with colder winters and adequate precipitation patterns. The MaxEnt results for the end of the century are a new contribution to the literature and we cannot compare it to previous results. We can discuss the results in relation to the current literature for almond suitability. In this case, by 2100, winters will be warmer than are suitable for almond, thus, reducing the area predicted as suitable to only 2% of the current production area.
MaxEnt results for citrus are supported by the literature of citrus suitability requirements. The main bioclimatic variable for citrus was the minimum temperature of coldest month (bio6), followed by mean temperature of wettest month (bio8) and isothermality (bio3). In the literature, citrus is expected to benefit from smaller risk of freeze damage/freeze, and from summer maximum temperature [2]. Therefore, our results can be interpretated as capturing the influence of frost on the citrus suitability. Moreover, citrus has a very low chill requirement [44] and warmer winters are expected to reduce the risk of frost [45]. Considering precipitation, citrus has a positive response to precipitation in May (summer) [7], and MaxEnt gained unique information from the bioclimatic variable precipitation in the warmest quarter (bio18). For the spatial distribution shift, we could not find other studies examining the same period as our study. However, we found that citrus crops benefit from coastal locations due to cooler temperatures and fog [46], which can help explain the shift toward the coast that MaxEnt predicted (Figure 4c and Figure 5c). One element that we did not capture was the occurrence of flooding, which has caused damaged to citrus production in the past [8].
For pistachios, MaxEnt results are contradictory. Our MaxEnt considered heat as an important bioclimatic condition with precipitation of warmest quarter (bio18) and maximum temperature of warmest month (bio5) as meaningful variables to explain pistachio suitability. On the other hand, researchers demonstrated that pistachios suffer with extreme heat [32], especially during the winter months, which could lead to loss of suitability. Although the GCMs consider in this study predict warmer winters, MaxEnt did not learn as much from the bioclimatic variables’ minimum temperature of coldest month or quarter (bio6 and bio11). The model did learn from the variable precipitation in the coldest quarter (bio19). Therefore, our results might not capture the impact of extreme heat as proposed by Parker and colleagues (2020) due to the use of different variables. This divergence deserves a future work, as it has been noted that it is particularly difficult to model the effects of climate change on pistachio production in California [7].
MaxEnt results for walnuts show that climate change is a threat to walnuts. In general, walnuts are not well suited for climates with high annual temperatures [2,32,34], and in California, walnuts have been found to be negatively affected by warmer winters and positively affected by warmer summers [8,35,47]. The negative response to warmer winters is due to shortening dormancy [7,48]. For MaxEnt, the bioclimatic variables maximum temperature of warmest month (bio5) and minimum temperature of coldest month (bio6) are important variables in defining the suitability, thus, capturing the main temperature constraints in the literature. Considering the drastic reduction in the spatial distribution of walnuts suitability, a shorter (or shortened) dormancy can explain the completely loss of suitability as defined by current production standards identified in our MaxEnt model for the 2080–2100 period. Additionally, the literature indicates that walnuts in California may not be viable as soon as 2060 due to increased overlap with pests [49] affecting this crop, and the impact of extreme heat [32].

4.2. Effects of Specialty Crops’ Suitability Shift

Agricultural suitability shifts will impact crops and counties differently. Remarkably, the Central Valley should be seeing a strong change, as most of the specialty crops investigated are not predicted to have a large suitability niche in that region. For the areas that can benefit from suitability shift, we can point to the Central Coast (citrus) and the Imperial Valley (pistachios). In this extreme scenario, California may see a reduction of USD 7.8 billion due to loss of suitable land for almonds and walnuts. The MaxEnt assumes that a business will have its usual/current farming practices, thus no adaptation or new technology is considered in the production of any crops. Nonetheless, California agricultural production has been defined by the constant adoption of technology to promote efficiency. Therefore, the results are not a doomsday call, but they are windows to explore directions to develop technology to aid specialty crops.
Understanding the effects of climate change on agricultural suitability provides an opportunity to improve farmers’ preparedness for the future. From our results, stakeholders in the Central Valley should be especially aware of the potential impacts of climate change. Farmers in the Valley are aware of the need to improve water use and management [50]. They also participate in actions to mitigate air pollution related to crop production and harvest [51]. Other climate change adaptations suggested in the literature are selection of new varieties, rescheduling of farming practices (i.e., early blooming, moving harvest to earlier in the year), and relocation of production. In our study, relocation of production would not be viable, as no area has shown to gain suitability for almonds or walnuts in California. The introduction of new varieties with different climatic needs would modify the suitability niche. Based on our results, new varieties that could be suitable for future conditions in the current production regions would need to be more resistant to drier and warmer conditions.
Even though California is affected by climate change, it is important to highlight local variations within counties. The MaxEnt approach estimates suitability by pixels, or by 4.5 km × 4.5 km areas, which allows for the capture of variations within a county. Information on within-county variation is meaningful as counties in California are large and present bioclimatic variability. The preparedness and adaptation to climate change can be improved with explicit spatial information. For instance, almond growers in Tulare County could benefit from having access to the estimations that the few areas predicted as suitable for production in 2100 are in the southwest corner of the county, including a few new areas that are currently not under almond production.
Our findings can be used as an initial screening for suitability in face of climate change. In this manner, policymakers can use our results to target support to areas in the counties that are predicted to have vulnerable suitability and work together with stakeholders to improve their farming–climate resilience. Nonetheless, it is essential to understand the limitations of MaxEnt for almonds before engaging in action, and this work should not be used as a guide or to shape investments such as buying areas in the southwest corner of Tulare County.
Our results are limited by our assumption and data availability. For any model estimating the future of agricultural production using MaxEnt, one central assumption is that agricultural technologies remain constant. In our view, this is also a limitation of the model, as we are aware that agricultural technology is developing and affecting the environmental niche occupied by crops. The other limitation is that irrigation is not considered as a model variable. Although irrigation is not an analysis layer, our results are influenced by it because most of the areas indicated as predicted as suitable in the baseline are in areas with irrigation. Furthermore, for our climate change analysis, it is remarkable that most of the areas that show potential suitability are also in locations with existing irrigation. However, our result for pistachios illustrates the possibility of expansion to the southern portion of California, which does not share the same access to irrigation as other areas in California. In this case, further work is needed to identify the presence of irrigation and if that would be the desired use. Future work can expand on our process to evaluate the influence of the spatial resolution of the bioclimatic data on the performance of suitability analysis and the use of other GCMs. In addition, models of suitability distribution ranges can be tailored to specific crops including, but not limited to, factors such as growing degree days, chilling conditions, soil parameters, and evapotranspiration.

5. Conclusions

To enhance specialty crops stakeholders’ preparedness for climate change, our research objective was to investigate agricultural suitability using the latest climate data developed for CMIP6 under the SSP5-8.5 for mid-century (2041–2060) and end-of-century (2081–2100) timeframes. We conducted four case studies on perennial specialty crops in California using the MaxEnt machine learning approach. Our suitability maps demonstrate the potential impacts of climate change and the spatial shifts of suitability that could be predicted or reversed by examining bioclimatic variables that drive the change. We contribute new insights by using end-of-century data, which were not present in earlier studies and are crucial for understanding the long-term implications of climate change. The use of machine learning for agricultural suitability can inform future work on climate change adaptation by identifying areas that require further analysis, such as resilience, vulnerable, or potential suitable areas. Stakeholders can use this information to develop plans to address the costs of adaptation, management changes, or relocation to new regions. For example, California’s almond, citrus, and walnut crops are unlikely to relocate under current technology, so farmers should focus on adapting to new environmental conditions. Pistachios might face less challenges as the suitability area were predicted to remain close to the current extent. It is important to note that our suitability estimates are unrestricted and do not account for land-use competition or water accessibility, nor do they consider changes in agricultural technology. To improve our models, we must focus on increasing spatial resolution by adding microclimate data or further downscaling climate data. We should also reduce assumptions by incorporating land-use competition and crop-specific climate variables such as chill hours, drought risk, extreme heat, and soil characteristics.

Supplementary Materials

The following supporting information can be downloaded at: https://www.mdpi.com/article/10.3390/land12101907/s1, Figure S1. Marginal response curves for environmental variables (a–w) for the citrus MaxEnt model. The curves show how the predicted probability of presence estimated by MaxEnt responds as each environmental variable is varied, while maintaining all other environmental variables at their average sample value; Figure S2. Marginal response curves for environmental variables (a–w) for the almonds MaxEnt model. The curves show how the predicted probability of presence estimated by MaxEnt responds as each environmental variable is varied, while maintaining all other environmental variables at their average sample value; Figure S3. Marginal response curves for environmental variables (a–w) for the walnuts MaxEnt model. The curves show how the predicted probability of presence estimated by MaxEnt responds as each environmental variable is varied, while maintaining all other environmental variables at their average sample value; Figure S4. Marginal response curves for environmental variables (a–w) for the pistachios MaxEnt model. The curves show how the predicted probability of presence estimated by MaxEnt responds as each environmental variable is varied, while maintaining all other environmental variables at their average sample value; Table S1. Table with environmental variables from Table 2 and the corresponding variable name used for MaxEnt analysis.

Author Contributions

Conceptualization, G.G.; methodology, G.G.; software, G.G., H.H., B.L., J.V., A.R. and E.V.; validation, G.G., H.H., B.L., J.V., A.R. and E.V.; formal analysis, G.G., H.H., B.L., J.V., A.R. and E.V.; investigation, G.G., H.H., B.L., J.V., A.R. and E.V.; resources, G.G.; data curation, G.G., H.H., B.L., J.V., A.R. and E.V.; writing—original draft preparation, G.G., H.H., B.L., J.V., A.R. and E.V.; writing—review and editing, G.G.; visualization, G.G., H.H., B.L., J.V., A.R. and E.V.; supervision, G.G.; project administration, G.G.; funding acquisition, G.G. All authors have read and agreed to the published version of the manuscript.

Funding

This research was funded by the National Institute of Food and Agriculture/USDA, grant number 2022-67023-36150. The APC was funded by National Institute of Food and Agriculture/USDA, grant number 2022-67023-36150.

Data Availability Statement

No new data were created. The methods to reproduce our results are described in the main text.

Acknowledgments

We acknowledge the comments of reviewers and editors. We also acknowledge the support of Dylan Russell, Dani Savinon, Susana Rosales, Bianca Misa, Esteban Cisneros, and Jinka Kawasaki.

Conflicts of Interest

The authors declare no conflict of interest.

References

  1. Bakhtavoryan, R.; Cheng, G.C.; Capps, O.; Dharmasena, S. A household-level demand system analysis of nuts in the United States. Agric. Resour. Econ. Rev. 2022, 51, 283–310. [Google Scholar] [CrossRef]
  2. Kerr, A.; Dialesandro, J.; Steenwerth, K.; Lopez-Brody, N.; Elias, E. Vulnerability of California specialty crops to projected mid-century temperature changes. Clim. Chang. 2018, 148, 419–436. [Google Scholar] [CrossRef]
  3. CDFA. California Agricultural Production Statistics 2019–2020; CDFA: Sacramento, CA, USA, 2021. [Google Scholar]
  4. Schauer, M.; Senay, G.B. Characterizing Crop Water Use Dynamics in the Central Valley of California Using Landsat-Derived Evapotranspiration. Remote Sens. 2019, 11, 1782. [Google Scholar] [CrossRef]
  5. Reisman, E. The great almond debate: A subtle double movement in California water. Geoforum 2019, 104, 137–146. [Google Scholar] [CrossRef]
  6. Fulton, J.; Norton, M.; Shilling, F. Water-indexed benefits and impacts of California almonds. Ecol. Indic. 2019, 96, 711–717. [Google Scholar] [CrossRef]
  7. Lobell, D.B.; Cahill, K.N.; Field, C.B. Historical effects of temperature and precipitation on California crop yields. Clim. Chang. 2007, 81, 187–203. [Google Scholar] [CrossRef]
  8. Pathak, T.B.; Maskey, M.L.; Dahlberg, J.A.; Kearns, F.; Bali, K.M.; Zaccaria, D. Climate change trends and impacts on California Agriculture: A detailed review. Agronomy 2018, 8, 25. [Google Scholar] [CrossRef]
  9. Parker, L.E.; Abatzoglou, J.T. Shifts in the thermal niche of almond under climate change. Clim. Chang. 2018, 147, 211–224. [Google Scholar] [CrossRef]
  10. Cook, B.I.; Ault, T.R.; Smerdon, J.E. Unprecedented 21st century drought risk in the American Southwest and Central Plains. Sci. Adv. 2015, 1, e1400082. [Google Scholar] [CrossRef]
  11. Parker, L.E.; Abatzoglou, J.T. Warming Winters Reduce Chill Accumulation for Peach Production in the Southeastern United States. Climate 2019, 7, 94. [Google Scholar] [CrossRef]
  12. Peter, B.G.; Messina, J.P.; Lin, Z.; Snapp, S.S. Crop climate suitability mapping on the cloud: A geovisualization application for sustainable agriculture. Sci. Rep. 2020, 10, 15487. [Google Scholar] [CrossRef]
  13. Caetano, J.M.; Tessarolo, G.; de Oliveira, G.; Souza, K.; Diniz-Filho, J.A.F.; Nabout, J.C. Geographical patterns in climate and agricultural technology drive soybean productivity in Brazil. PLoS ONE 2018, 13, e0191273. [Google Scholar] [CrossRef]
  14. Akpoti, K.; Kabo-Bah, A.T.; Dossou-Yovo, E.R.; Groen, T.A.; Zwart, S.J. Mapping suitability for rice production in inland valley landscapes in Benin and Togo using environmental niche modeling. Sci. Total Environ. 2020, 709, 136165. [Google Scholar] [CrossRef]
  15. Hirabayashi, K.; Murch, S.J.; Erland, L.A.E. Predicted impacts of climate change on wild and commercial berry habitats will have food security, conservation and agricultural implications. Sci. Total Environ. 2022, 845, 157341. [Google Scholar] [CrossRef] [PubMed]
  16. Akpoti, K.; Kabo-Bah, A.T.; Zwart, S.J. Agricultural land suitability analysis: State-of-the-art and outlooks for integration of climate change analysis. Agric. Syst. 2019, 173, 172–208. [Google Scholar] [CrossRef]
  17. Ahmadi, H.; Ghalhari, G.F.; Baaghideh, M. Impacts of climate change on apple tree cultivation areas in Iran. Clim. Chang. 2019, 153, 91–103. [Google Scholar] [CrossRef]
  18. He, K.S.; Bradley, B.A.; Cord, A.F.; Rocchini, D.; Tuanmu, M.N.; Schmidtlein, S.; Turner, W.; Wegmann, M.; Pettorelli, N. Will remote sensing shape the next generation of species distribution models? Remote Sens. Ecol. Conserv. 2015, 1, 4–18. [Google Scholar] [CrossRef]
  19. Zhang, C.; Valente, J.; Kooistra, L.; Guo, L.; Wang, W. Orchard management with small unmanned aerial vehicles: A survey of sensing and analysis approaches. Precis. Agric. 2021, 22, 2007–2052. [Google Scholar] [CrossRef]
  20. Varela, S.; Pederson, T.; Bernacchi, C.J.; Leakey, A.D.B. Understanding Growth Dynamics and Yield Prediction of Sorghum Using High Temporal Resolution UAV Imagery Time Series and Machine Learning. Remote Sens. 2021, 13, 1763. [Google Scholar] [CrossRef]
  21. Moon, M.; Richardson, A.D.; Friedl, M.A. Multiscale assessment of land surface phenology from harmonized Landsat 8 and Sentinel-2, PlanetScope, and PhenoCam imagery. Remote Sens. Environ. 2021, 266, 112716. [Google Scholar] [CrossRef]
  22. Sharma, R.; Kamble, S.S.; Gunasekaran, A. Big GIS analytics framework for agriculture supply chains: A literature review identifying the current trends and future perspectives. Comput. Electron. Agric. 2018, 155, 103–120. [Google Scholar] [CrossRef]
  23. Elith, J.; Leathwick, J.R. Species Distribution Models: Ecological Explanation and Prediction Across Space and Time. Annu. Rev. Ecol. Evol. Syst. 2009, 40, 677–697. [Google Scholar] [CrossRef]
  24. Silva, D.P.; Spigoloni, Z.A.; Camargos, L.M.; de Andrade, A.F.A.; De Marco, P.; Engel, M.S. Distributional modeling of Mantophasmatodea (Insecta: Notoptera): A preliminary application and the need for future sampling. Org. Divers. Evol. 2015, 16, 259–268. [Google Scholar] [CrossRef]
  25. Faleiro, F.V.; Silva, D.P.; de Carvalho, R.A.; Särkinen, T.; De Marco, P. Ring out the bells, we are being invaded! Niche conservatism in exotic populations of the Yellow Bells, Tecoma stans (Bignoniaceae). Nat. Conserv. 2015, 13, 24–29. [Google Scholar] [CrossRef]
  26. Zeng, Y.; Low, B.W.; Yeo, D.C.J. Novel methods to select environmental variables in MaxEnt: A case study using invasive crayfish. Ecol. Model. 2016, 341, 5–13. [Google Scholar] [CrossRef]
  27. Barney, J.N.; DiTomaso, J.M. Bioclimatic predictions of habitat suitability for the biofuel switchgrass in North America under current and future climate scenarios. Biomass Bioenergy 2010, 34, 124–133. [Google Scholar] [CrossRef]
  28. Fitzgibbon, A.; Pisut, D.; Fleisher, D. Evaluation of Maximum Entropy (Maxent) Machine Learning Model to Assess Relationships between Climate and Corn Suitability. Land 2022, 11, 1382. [Google Scholar] [CrossRef]
  29. Hannah, L.; Roehrdanz, P.R.; Ikegami, M.; Shepard, A.V.; Shaw, M.R.; Tabor, G.; Zhi, L.; Marquet, P.A.; Hijmans, R.J. Climate change, wine, and conservation. Proc. Natl. Acad. Sci. USA 2013, 110, 6907–6912. [Google Scholar] [CrossRef]
  30. Granco, G.; Caldas, M.; De Marco, P. Potential effects of climate change on Brazil’s land use policy for renewable energy from sugarcane. Resour. Conserv. Recycl. 2019, 144, 158–168. [Google Scholar] [CrossRef]
  31. Parker, L.E.; Abatzoglou, J.T. Comparing mechanistic and empirical approaches to modeling the thermal niche of almond. Int. J. Biometeorol. 2017, 61, 1593–1606. [Google Scholar] [CrossRef]
  32. Parker, L.E.; McElrone, A.J.; Ostoja, S.M.; Forrestel, E.J. Extreme heat effects on perennial crops and strategies for sustaining future production. Plant Sci. 2020, 295, 110397. [Google Scholar] [CrossRef] [PubMed]
  33. Cabot, M.I.; Lado, J.; Clemente, G.; Sanjuán, N. Towards harmonised and regionalised life cycle assessment of fruits: A review on citrus fruit. Sustain. Prod. Consum. 2022, 33, 567–585. [Google Scholar] [CrossRef]
  34. Paz-Dyderska, S.; Jagodzinski, A.M.; Dyderski, M.K. Possible changes in spatial distribution of walnut (Juglans regia L.) in Europe under warming climate. Reg. Environ. Chang. 2021, 21, 18. [Google Scholar] [CrossRef]
  35. Lobell, D.B.; Field, C.B. California perennial crops in a changing climate. Clim. Chang. 2011, 109, 317–333. [Google Scholar] [CrossRef]
  36. CDFA. California Agricultural Statistics Review, 2017–2018; CDFA: Sacramento, CA, USA, 2018. [Google Scholar]
  37. United States Department of Agriculture-National Agricultural Statistics Service Cropland Data Layer (USDA-NASS CDL). USDA National Agricultural Statistics Service Cropland Data Layer. Publ. Crop-Specif. Data Layer 2022. Available online: https://www.usgs.gov/centers/fort-collins-science-center/science/usda-national-agricultural-statistics-service-cropland (accessed on 9 July 2023).
  38. Araújo, M.B.; Peterson, A.T. Uses and misuses of bioclimatic envelope modeling. Ecology 2012, 93, 1527–1539. [Google Scholar] [CrossRef]
  39. Fick, S.E.; Hijmans, R.J. WorldClim 2: New 1-km spatial resolution climate surfaces for global land areas. Int. J. Climatol. 2017, 37, 4302–4315. [Google Scholar] [CrossRef]
  40. Dewitz, J.; USGS. National Land Cover Database (NLCD) 2019 Products (Ver. 2.0, June 2021); U.S. Geological Survey: Reston, VA, USA, 2021. [Google Scholar] [CrossRef]
  41. Brown, J.L.; Bennett, J.R.; French, C.M. SDMtoolbox 2.0: The next generation Python-based GIS toolkit for landscape genetic, biogeographic and species distribution model analyses. PeerJ 2017, 5, e4095. [Google Scholar] [CrossRef] [PubMed]
  42. Rosenzweig, C.; Elliott, J.; Deryng, D.; Ruane, A.C.; Müller, C.; Arneth, A.; Boote, K.J.; Folberth, C.; Glotter, M.; Khabarov, N.; et al. Assessing agricultural risks of climate change in the 21st century in a global gridded crop model intercomparison. Proc. Natl. Acad. Sci. USA 2014, 111, 3268–3273. [Google Scholar] [CrossRef]
  43. Gomes, L.C.; Bianchi, F.J.J.A.; Cardoso, I.M.; Fernandes, R.B.A.; Filho, E.I.F.; Schulte, R.P.O. Agroforestry systems can mitigate the impacts of climate change on coffee production: A spatially explicit assessment in Brazil. Agric. Ecosyst. Environ. 2020, 294, 106858. [Google Scholar] [CrossRef]
  44. Santos, J.A.; Costa, R.; Fraga, H. Climate change impacts on thermal growing conditions of main fruit species in Portugal. Clim. Chang. 2017, 140, 273–286. [Google Scholar] [CrossRef]
  45. Parker, L.; Pathak, T.; Ostoja, S. Climate change reduces frost exposure for high-value California orchard crops. Sci. Total Environ. 2021, 762, 143971. [Google Scholar] [CrossRef] [PubMed]
  46. Elias, E.H.; Steele, C.M.; Havstad, K.; Steenwerth, K.; Chambers, J.C.; Deswood, H.; Kerr, A.; Rango, A.; Schwartz, M.W.; Stine, P.; et al. Southwest Regional Climate Hub and California Subsidiary Hub Assessment of Climate Change Vulnerability and Adaptation and Mitigation Strategies; United States Department of Agriculture: Washington, DC, USA, 2015; pp. 1–76. [Google Scholar]
  47. Luedeling, E.; Zhang, M.; Girvetz, E.H. Climatic changes lead to declining winter chill for fruit and nut trees in California during 1950-2099. PLoS ONE 2009, 4, e6166. [Google Scholar] [CrossRef] [PubMed]
  48. Zhang, N.; Pathak, T.B.; Parker, L.E.; Ostoja, S.M. Impacts of large-scale teleconnection indices on chill accumulation for specialty crops in California. Sci. Total Environ. 2021, 791, 148025. [Google Scholar] [CrossRef]
  49. Luedeling, E.; Gassner, A. Partial Least Squares Regression for analyzing walnut phenology in California. Agric. For. Meteorol. 2012, 158–159, 43–52. [Google Scholar] [CrossRef]
  50. Wilson, T.S.; Sleeter, B.M.; Richard Cameron, D. Future land-use related water demand in California. Environ. Res. Lett. 2016, 11, 054018. [Google Scholar] [CrossRef]
  51. Hong, C.; Mueller, N.D.; Burney, J.A.; Zhang, Y.; Aghakouchak, A.; Moore, F.C.; Qin, Y.; Tong, D.; Davis, S.J. Impacts of ozone and climate change on yields of perennial crops in California. Nat. Food 2020, 1, 166–172. [Google Scholar] [CrossRef]
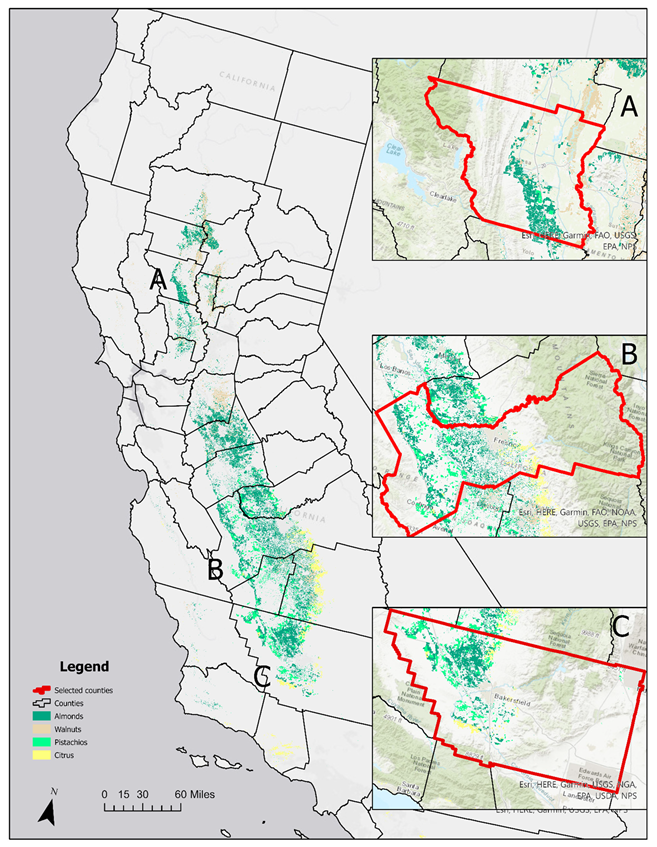
Figure 1. 2018 Land use for almonds, citrus, pistachios, and walnuts in California based on NASS CDL. (A) Inset map for Madero County. (B) Inset map for Fresno County. (C) Inset map for Bakersfield County.
Land 12 01907 g001
Figure 2. Specialty crops suitability probability as estimated using MaxEnt under near-historical bioclimatic and surface variables. High suitability probability is indicated by dark green colors, while low suitability probability is indicated by pale yellow colors. (a) Almonds. (b) Pistachios. (c) Walnuts. (d) Citrus.
Land 12 01907 g002
Figure 3. Comparison of modeled specialty crops suitability to observed specialty crop production area in 2018 (CDL). True suitability (dark green) indicates areas observed and predicted by the model. False unsuitability (brown) indicates areas observed but predicted as unsuitable by the model. Predicted suitability (light green) indicates areas not observed and predicted as suitable by the model. True unsuitability (light gray) indicates areas not observed and predicted as unsuitable by the model. (a) Almonds. (b) Pistachios. (c) Walnuts. (d) Citrus.
Land 12 01907 g003
Figure 4. Comparison of ensembled specialty crops suitability estimations to 2041–2060 to observed specialty crop production area in 2018 (CDL). Continued suitability (dark green) indicates areas observed and predicted by the model. Gaining suitability (brown) indicates areas not observed and predicted as suitable by the ensembled models. Losing suitability (purple) indicates areas observed and not predicted as suitable by the ensembled model. Continued unsuitability (light gray) indicates areas not observed and predicted as unsuitable by the ensembled model. (a) Almonds. (b) Pistachios. (c) Walnuts. (d) Citrus.
Land 12 01907 g004
Figure 5. Comparison of ensembled specialty crops suitability estimations to 2081–2100 to observed specialty crop production area in 2018 (CDL). Continued suitability (dark green) indicates areas observed and predicted by the model. Gaining suitability (brown) indicates areas not observed and predicted as suitable by the ensembled models. Losing suitability (purple) indicates areas observed and not predicted as suitable by the ensembled model. Continued unsuitability (light gray) indicates areas not observed and predicted as unsuitable by the ensembled model. (a) Almonds. (b) Pistachios. (c) Walnuts. (d) Citrus.
Land 12 01907 g005
Table 1. Production and cash receipt data for selected specialty crops in California for 2019 [3].
Specialty CropScientific NameTotal Value
(USD 1000)
Total Area (Square Kilometers)Average Value per Area (USD)
Almonds Prunus dulcis6,094,440 4775.3 1,276,242.3
PistachiosPistacia vera1,938,800 1169.5 1,657,802.5
WalnutsJuglans regia1,286,4101477.1 870,902.4
Oranges, AllCitrus x sinesus670,529 594.8 1,127,318.4
LemonsCitrus x limon644,002 198.3 3,247,614.7
Table 2. Bioclimatic and surface variables used as environmental layers for MaxEnt models. Variables bio1 to bio19 were obtained from WorldClim v2.1 [39]. Surface variables (elevation, slope, and aspect) were calculated from a digital elevation model (DEM) at 2.5 min resolution obtained from the WorldClim v2.1 database [39]. Land cover/land-use variable (land) is from the National Land Cover Database 2019 [40].
VariableDefinition and Unit
bio1Annual mean temperature, Celsius degrees
bio2Mean diurnal range as the mean of monthly difference between maximum and minimum temperature, Celsius degrees
bio3Isothermality (bio2/bio7) (×100), unitless
bio4Temperature seasonality as the variation over three months (using standard deviation ×100)
bio5Maximum temperature of warmest month, Celsius degrees
bio6Minimum temperature of coldest month, Celsius degrees
bio7Temperature annual range as bio5–bio6, Celsius degrees
bio8Mean temperature of wettest quarter, Celsius degrees
bio9Mean temperature of driest quarter, Celsius degrees
bio10Mean temperature of warmest quarter, Celsius degrees
bio11Mean temperature of coldest quarter, Celsius degrees
bio12Annual precipitation, millimeters
bio13Precipitation of wettest month, millimeters
bio14Precipitation of driest month, millimeters
bio15Precipitation seasonality as the variation over three months (using coefficient of variation)
bio16Precipitation of wettest quarter, millimeters
bio17Precipitation of driest quarter, millimeters
bio18Precipitation of warmest quarter, millimeters
bio19Precipitation of coldest quarter, millimeters
elevationElevation, meters
slopeGradient of land incline, degrees
aspectDirection of downhill slope
landLand cover/land-use for California
Disclaimer/Publisher’s Note: The statements, opinions and data contained in all publications are solely those of the individual author(s) and contributor(s) and not of MDPI and/or the editor(s). MDPI and/or the editor(s) disclaim responsibility for any injury to people or property resulting from any ideas, methods, instructions or products referred to in the content.