Abstract
In the field of urban design, current research has shifted towards resident preference perception and computer-aided design methods that rely on deep learning techniques. In this study, we aimed to provide a quantitative design method for urban space design that could take into account the preferences of different populations. Through empirical research, we collected real urban space and population data, which we then quantified using advanced intelligent recognition tools based on deep learning techniques. Our ensuing analysis illuminated the intricate interplay between constituent elements of urban spaces and the structural and emotional changes of residents. By taking into account the specific driving relationships between each element and residents, we proposed a new evaluation methodology for constructing an intelligent design evaluation model for urban spaces. This intelligent design evaluation model was subsequently used to evaluate the urban space both pre- and post-design. The standard deviation of the difference results demonstrated that the design option (SD value = 0.103) and the desired option for Space 1 were lower than the current option (SD value = 0.129) and the expected scheme. Our findings provide quantitative configuration strategies and program evaluation for urban space design, thus helping designers to design urban spaces that are more popular with residents.
1. Introduction
1.1. Transformation of Urban Design towards Resident Emotion Orientation
The concept of “scenario” originated in the 1980s, when Kahn introduced the notion of a narrative depicting the actions of individuals, with its first applications found in the realm of planning issues [1]. The discipline of urban scenario design is a convergence of two related disciplines, namely, urban design and scenario design. Scenario design is a distinct discipline that initially emerged within the context of film design. Prior research referred to the design of urban physical spaces as either urban design or urban space design, with urban design typically defined by the architectural community as design work focused on cities, occupying a space between urban planning, landscape architecture, and architectural design. Urban design is more concrete and graphical than the abstract and digitized features of urban planning. However, since the mid-20th century, practical urban design has primarily served as a guiding and reference framework for landscape design or architectural design. On the other hand, urban landscape or space design refers to the design of smaller spaces within an urban context. While urban scenario design may overlap with urban landscape or space design, the significant distinction between scenarios and spaces lies in the involvement of human participants within the scenario. Thus, urban scenario design integrates two aspects in its design objectives, namely, the urban physical space and the activities and behaviors of the populace.
In urban areas, small public spaces exist in the cracks of urban space, which is the format of courtyards, patios, atriums, building crevices, rooftop gardens, etc. These spaces form an important part of public open space and are regarded as an important symbol of the public realm because of their high utilization rate [2,3,4]. At the same time, human welfare and performance could be significantly influenced by the built environment and perception of a sense of space [5,6,7]. Urban spatial perception is vital for researchers, urban planners, and policymakers to improve the built environment and thus to further enhance the well-being of residents by accumulating holistic knowledge on the real experiences of people towards the urban surroundings. In furtherance, how to appraise the concept and connotation of small public space vitality effectively from the perspective of users and to improve residents’ sense of well-being have also been influential focuses of urbanists, sociologists, and urban planners [8,9,10]. In the past four decades, the pace of urbanization has accelerated, prompting a surge of interest in the effects of environmental factors on human health and well-being. Architects, biologists, and psychologists have pioneered research efforts to illuminate the intricate physiological and psychosocial connections between humans and their habitats. Notably, scholars such as Ulrich et al. (1991), Wilson (1984), and Kaplan & Kaplan (1989) have endeavored to explore the relationship among urbanization, environmental quality, stress recovery, and attentional capacity [11,12,13]. Likewise, Nutsford et al. (2013) have investigated the association between proximity to urban spaces and human psychological health [14], while Derkzen et al. (2015) have quantified and examined the link between human well-being and ecosystem services [15]. Green spaces, such as parks, gardens, forests, and fields, as well as blue spaces, including rivers, lakes, estuaries, and oceans, have been shown to aid in alleviating stress, attracting considerable scholarly attention due to their potential positive effect on urban systems and ease of incorporation into design. In recent times, mounting concerns have arisen regarding human emotions and mental health. Consequently, research at the intersection of human emotions and urban spaces has gained momentum. One such study is the Alnarp garden study, which combines emotional, health, and spatial design aspects to treat patients referred by health insurance companies for stress, anxiety, and fatigue. This research has revealed the potential of sensory gardens to alleviate stress-related issues in environments associated with general health [16].
It is readily apparent that subtle shifts in both the scale and design objectives of urban landscape design have transpired. Specifically, the research focus has transitioned from large-scale geographical environmental studies to garden studies, while the research methodology has shifted from preliminary qualitative explorations to more comprehensive quantitative investigations in biology and physiology. Furthermore, the design purpose and significance have evolved from addressing fundamental human survival issues to enhancing and restoring emotional and psychological well-being. However, throughout this process, a significant gap has emerged in the quantification and measurement of human emotions and their fluctuations. As such, people remain primarily reliant on genetics and subjective awareness to determine changes in human emotions, a method that may be limiting in practice. Although the Alnarp garden study effectively measures and assesses emotional changes based on their effect on biological organisms, this measurement method lacks the requisite temporal resolution necessary for accurate and continuous emotion monitoring.
1.2. Perspectives Brought by the Emergence of Deep Learning-Based Intelligent Technologies
The underlying principle of deep learning is to combine low-level features to create more abstract high-level representations, such as attributes, categories, or features, to discover the distributed feature representation of data [17,18]. Deep learning has been extensively applied in the field of computer vision as a potential way to have access to graphic information and to perform visual challenges [19]. Semantic segmentation is a fundamental computer vision tool that requires pixel-by-pixel prediction of a given image. Remarkable progress in semantic segmentation has been made in recent years with the development of deep neural networks (DNNs) [20,21,22,23]. For instance, Tencent AI lab has improved the Cityscapes [24] semantic segmentation mIoU by 56.3% and 53.0% by utilizing DeepLab-v2 network and ResNet-101 backbone, respectively [25]. In the meantime, face recognition, as one of the most common computer vision tasks, has been extensively studied for decades [26,27,28]. The primary procedure of face recognition is face verification and face feature discrimination [26]. In recently years, in an attempt to address the disadvantages of CNNs and traditional face recognition methods in terms of weak feature discrimination, some new methods have been introduced, such as ArcFace, SphereFace, and CosFace, and it has been demonstrated that the CosFace method has achieved state-of-the-art performance in face recognition [29]. Benefiting from the accelerated advancement and integration of intelligent technologies, human body information and 3D spatial composition can be identified more accurately. Accordingly, there is research on deep learning numerical processing functions based on image segmentation and face recognition to obtain hidden knowledge about the design from experimental and computational data to guide the design [30].
The rapid development and integration of intelligent technologies have enabled intelligent recognition systems based on deep learning to more accurately identify human information and three-dimensional spatial composition. Deep learning numerical processing function obtains hidden knowledge about the design from experimental and computational data to guide the design [30]. Concretely, Naik et al. utilized computer vision techniques to analyze street safety and gauge urban appearance quality and to probe urban physical transformation [31,32,33]. Seiferling et al. combined computer vision and images to quote and graph municipal trees [34]. Liu et al. presented a computer vision approach comprising three machine learning models to estimate the city’s environmental quality at a large scale from the building level [35]. Yao et al. developed a human–machine adversarial scoring framework that combines semantic segmentation and iterative feedback to learn human scoring features on images to recommend scores for urban perception [8,36]. Wang et al. surveyed streetscape quality with a comparison of spatial perception of crowds based on Baidu Street View Images (SVI) [37]. Nevertheless, these explorations have concentrated more on computer simulation of image technology and the interactions between people and the physical environment, while disregarding how the person–physical interactions direct the design of the physical environment. Alternatively, Deep Convolutional Neural Networks are used to manipulate video data to capture people’s behavior and facial profiles [38] and statistics on the amount of participants in a certain area [39], and to track the route of people streaming [40]. Digital visibility analysis methods can indeed better quantify human perception and observation of space in the environment [41]. Furthermore, these studies mentioned above did not take into account residents’ perceptions of utilizing small-scale public spaces from the perspective of the urban environment [4].
1.3. Problem Statement and the Overall Methodological Framework
In contemporary and future urban landscapes, incorporating residents’ inherent structural characteristics and emotions into urban scenario designs to enhance interactions between urban scenarios and residents presents a significant challenge. While fundamental design methodologies based on designers’ experience are essential for meeting functional requirements, upholding ecological bottom lines, and satisfying users’ aesthetic needs, there is a dearth of research on design methods for multi-objective urban scenario intelligent design evaluation. Despite numerous articles [42,43,44,45,46,47] that offer experimental methods, research approaches, and perspectives to facilitate the urban landscape spatial design process, there is a lack of intelligent design evaluation model frameworks that quantitatively analyze residents’ emotions through on-site research. This research seeks to address this gap in inquiry and systematically describe the inherent methods and logic necessary to construct an urban scenario intelligent design evaluation model. Employing quantitative research methods aided by intelligent tools, the study focuses on the Xueye Lakeside public scenario design in Jinan City and aims to provide design proposals and strategies for urban design.
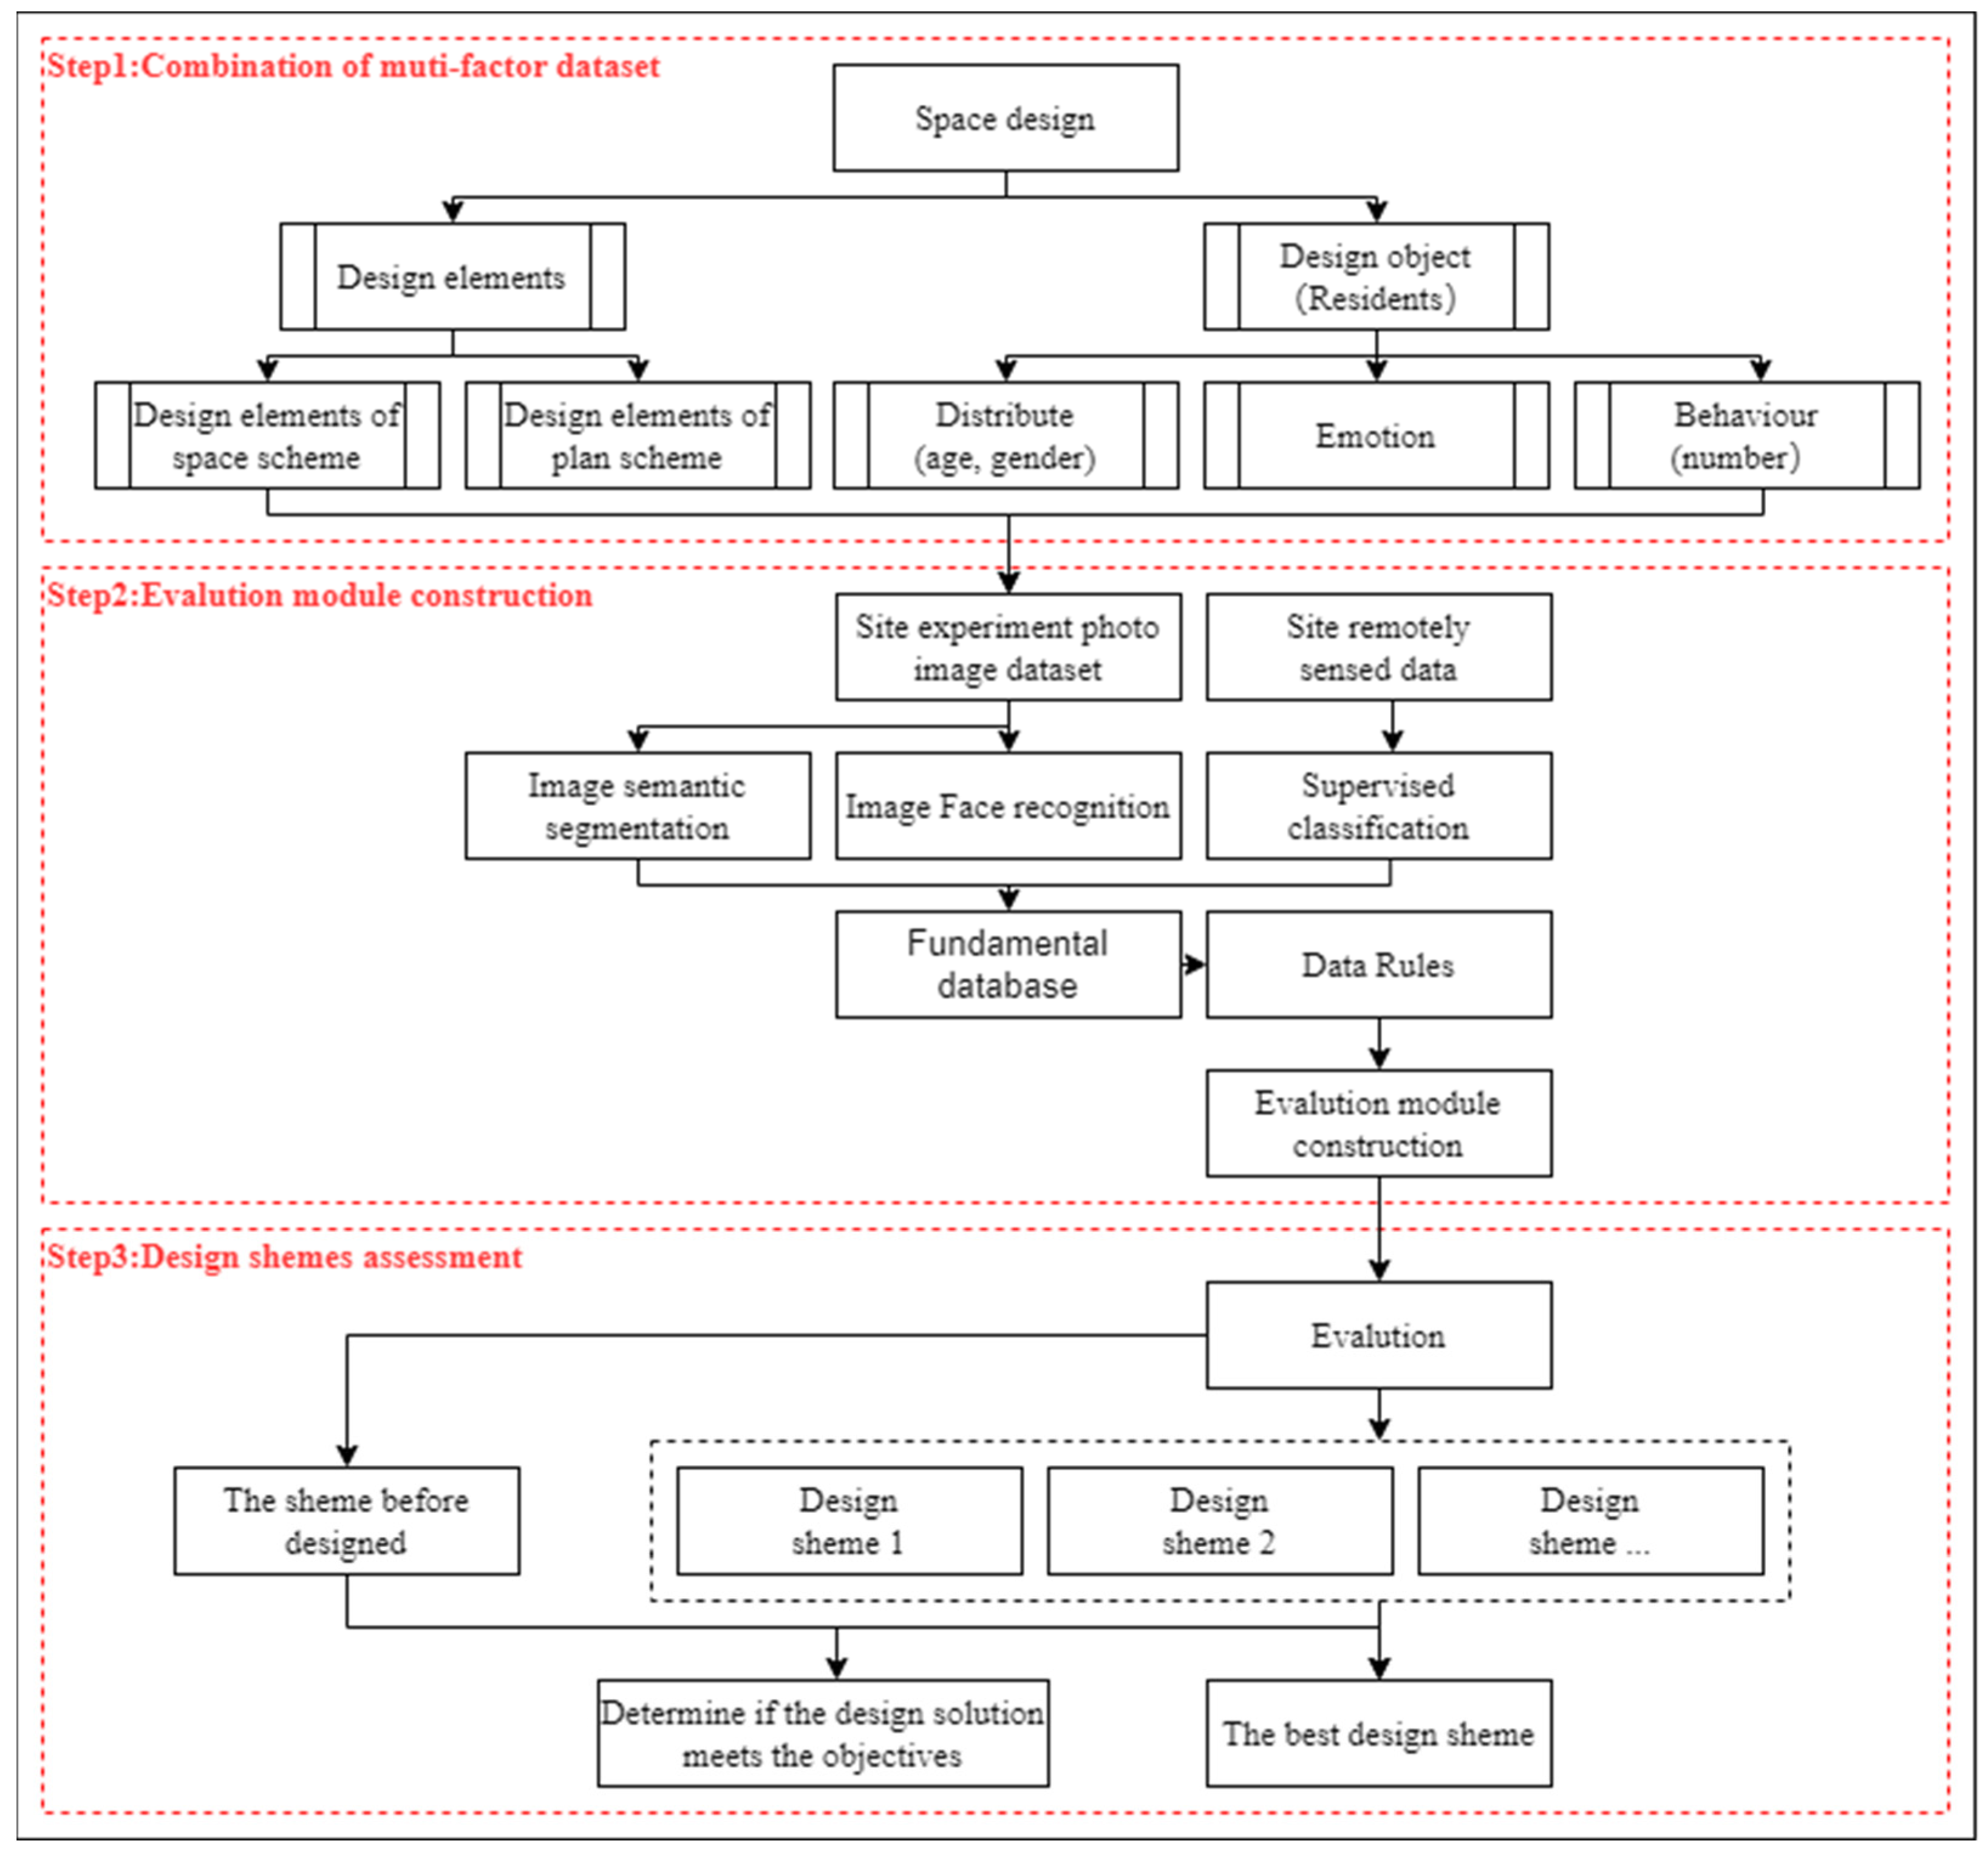
According to research findings, it appears that some of the benefits of exposure to nature do not solely arise from factors such as clean air or reduced auditory noise, but rather stem from the visual characteristics of the environment. Notably, even viewing images of natural spaces can lead to quantifiable enhancements [48]. Consequently, this empirical investigation aims to examine the “type and proportion of visual space elements,” which are the primary factors causing emotional effects in residents in external surroundings. The subjective assessment of residents’ emotions relates to their interaction with the space. First of all, in this paper, we constructed a cohort of dynamism-indicating parameters based on the vitality representation elements raised by classical investigations [2,49,50], as depicted in Figure 1, comprising crowd aggregation degree, crowd sentiments, and crowd type. Among them, crowd age structure and crowd gender structure are used to represent respective crowd categories. In practice, feature data for space elements and facial characteristics of residents who participate in the space are recorded through fixed-point and timed video recording. Deep learning approaches are then used to extract feature data from both the space elements and resident characteristics, and these two sets of data are analyzed to determine the effects of urban spaces on residents.
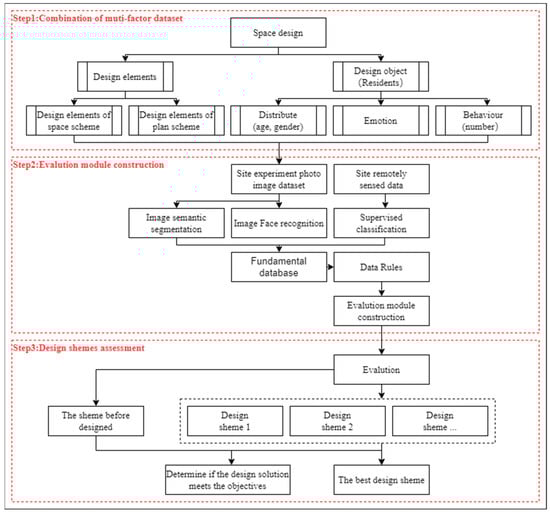
Figure 1.
Flowchart of this research.
In addition, the paths of acquisition datasets utilized in most studies in recent years have discarded field research methods and used a diversity of geospatial data and other multi-source big data [51,52], while such data are capable of a widespread urban area, the absence of urban building-crevices pedestrian space is poorly covered because the big data collection approaches are circumscribed to the motor vehicle collection patterns [31,53,54]. As a result, street imagery data do not effectively diagnose the visual elements and physical appearance of pedestrian spaces in urban building clusters [32,55,56].
In general, to tackle the foregoing research gaps, we proposed a new approach that combines traditional data collection methods and emerging technologies to quantify crowd use preferences for pedestrian public spaces in urban clusters. Further, based on the quantitative results, the Space, People, and Emotion (SPE) model was constructed with the aim of applying the interaction between residents’ emotions and spaces obtained in this study to the evaluation of urban design proposals, and providing novel design methods and concepts for urban space design. This study comprised three stages. The initial stage involved preparatory research, where the study area was examined qualitatively through literature and online resources. Subsequently, the space research plane scale was established and divided into modules for sequencing. The second stage entailed the quantitative study of the space, with data collected during the target period. Two databases were employed as data sources, namely, Google satellite map images and on-site research data. This stage involved cleaning, categorizing, and analyzing the collected data, and the effect map, emotional effect map, age-subdivided effect map, and space rules are obtained. Finally, the SPE model was applied to the evaluation of really urban design solutions (Figure 1). For urban planners, urban decision makers, and city administrators, it is critical that data analysis goals fall at the level of design strategy [57].
Given the above, the objectives of this study were:
- (1)
- To construct a multi-dimensional research system of 10 m × 10 m small-scale spatial units through combining field research and artificial intelligence analysis methods;
- (2)
- To examine emotional effects of space on age segmentation and gender segmentation based on analyzing data;
- (3)
- To evaluate the emotional effects of design solutions on specific groups of people based on the pattern of effects.
2. Methodology
This study applied a combination of field research and AI analysis to perform the methodology. Prior to the field study, we first downloaded a Google satellite plan of the site, divided the site into 10 × 10 m units, and labeled them with serial numbers. After entering the site, we acquired images of the space and participants based on field photography. Based on the images taken in the field, we applied image analysis methods to obtain spatial element information and participant characteristics, and supervised learning methods to obtain site plan element information. The data obtained from the above analysis served as the basis for the regularity study.
2.1. Experimental Design
In the context of computing the sample size, the study design endeavors to ensure that voluntary participation is not subject to any external interventions. To mitigate potential work or family-related emotional factors, each space included around ten participants, yielding a total of 470 participants. During the relaxed and unguided tour of the space, the participants were unaware of the study’s objective to maintain emotional response neutrality. It should be noted that the survey findings were solely for academic research purposes and that private data, such as participants’ facial features and media account IDs, would not be exposed or leveraged for commercial purposes.
2.2. Participants
This research delves into the dynamics of urban open spaces and deliberately adopts a non-restrictive approach towards the study population, with no fixed conditions, like age, being imposed. Utilizing contemporary age classifications in China, the participants are classified into five distinct categories, comprising children (aged 0–6 years), teenagers (aged 7–17 years), young adults (aged 18–40 years), middle-aged adults (aged 41–65 years), and elderly adults (aged 66 years and above). The discerning categorization of such diverse age groups underscores the study’s multifaceted approach, which seeks to holistically comprehend the intricate effect of urban open spaces on different age cohorts.
2.3. Experiment Site and Equipment
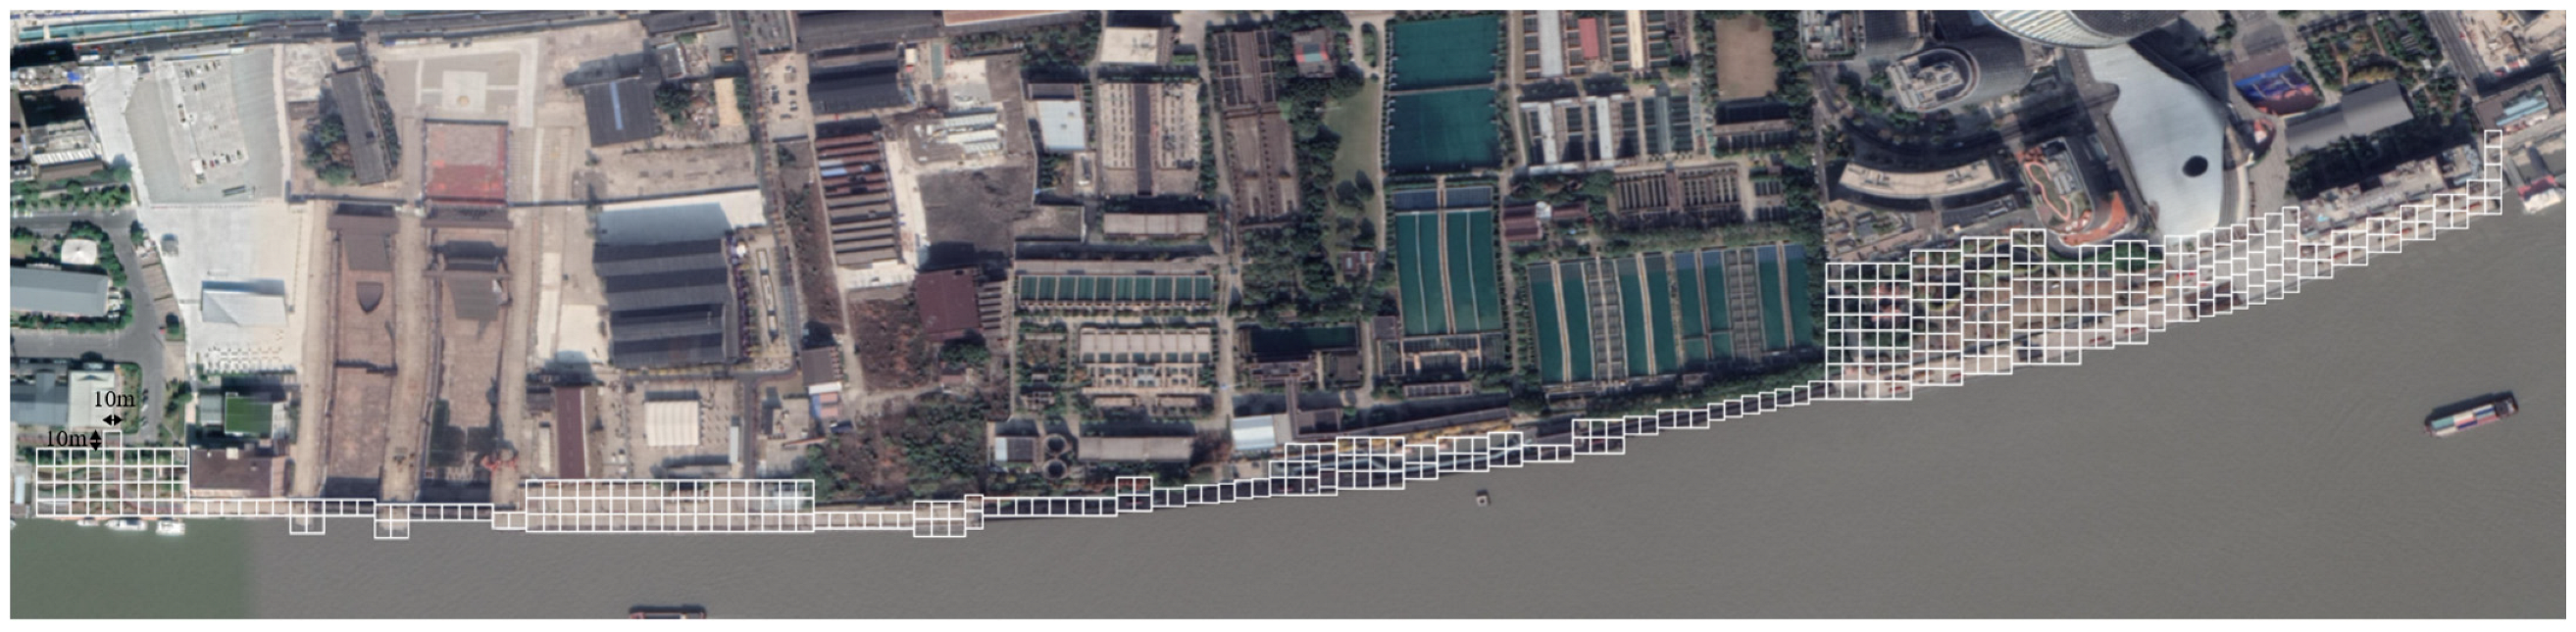
Yangpu Riverside Public Space is a strategic development area in the 14th Five-Year Plan for the development of “One River, One River” in Shanghai, China, and it is an “initial place” for the significant concept of the People’s City. The site of this study is the demonstration section of Yangpu Riverside Public Space, which plays an important role as a model for the whole Riverside Public Space and provides an effective reference significance. Space numbers were generated using a three-stage data processing approach. Initially, the Google satellite map of the area was downloaded from the internet and subsequently divided into 10 m × 10 m spatial units. Secondly, any duplicates were excluded, and finally, the left-to-right and top-to-bottom rules were applied to allocate the space numbers (Figure 2).

Figure 2.
The 10 m × 10 m spatial units of the site.
2.4. Procedure
Through extensive on-site investigations and observations, a wide range of space elements, spanning from the ethereal sky to the tangible plaza, have been curated and designated as the essential target elements for this spatial study. These elements encompass various architectural components, such as lamp post structures, buildings, pavilions, vending kiosks, roads, grass, trees, water bodies, towering skyscrapers, sweeping urban panoramas, bustling streets, dynamic clouds, renowned landmarks, comfortable seating, and even crowds of people, including girls, boys, and children in classrooms or parks [58] (In our study, these terms referred to different categories of spatial elements. Specifically, “boy” and “girl” referred to male and female children or adolescents, respectively, while “animal” refers to gulls at the research site.).
To discern the core principles of flat design elements for this space, a systematic clustering analysis approach has been employed, which combines satellite mapping with intrinsic feature identification. Through such rigorous analysis, a total of nine categories of flat design elements have been established, including the hard surfaces, glistening water bodies, lush green grasslands, sprawling woodlands, refined structures, meandering boats, elegant streetlights, comfortable seating arrangements, and wooden pavements. Each of these elements is selected and targeted for a comprehensive study on the principles of flat design for this space.
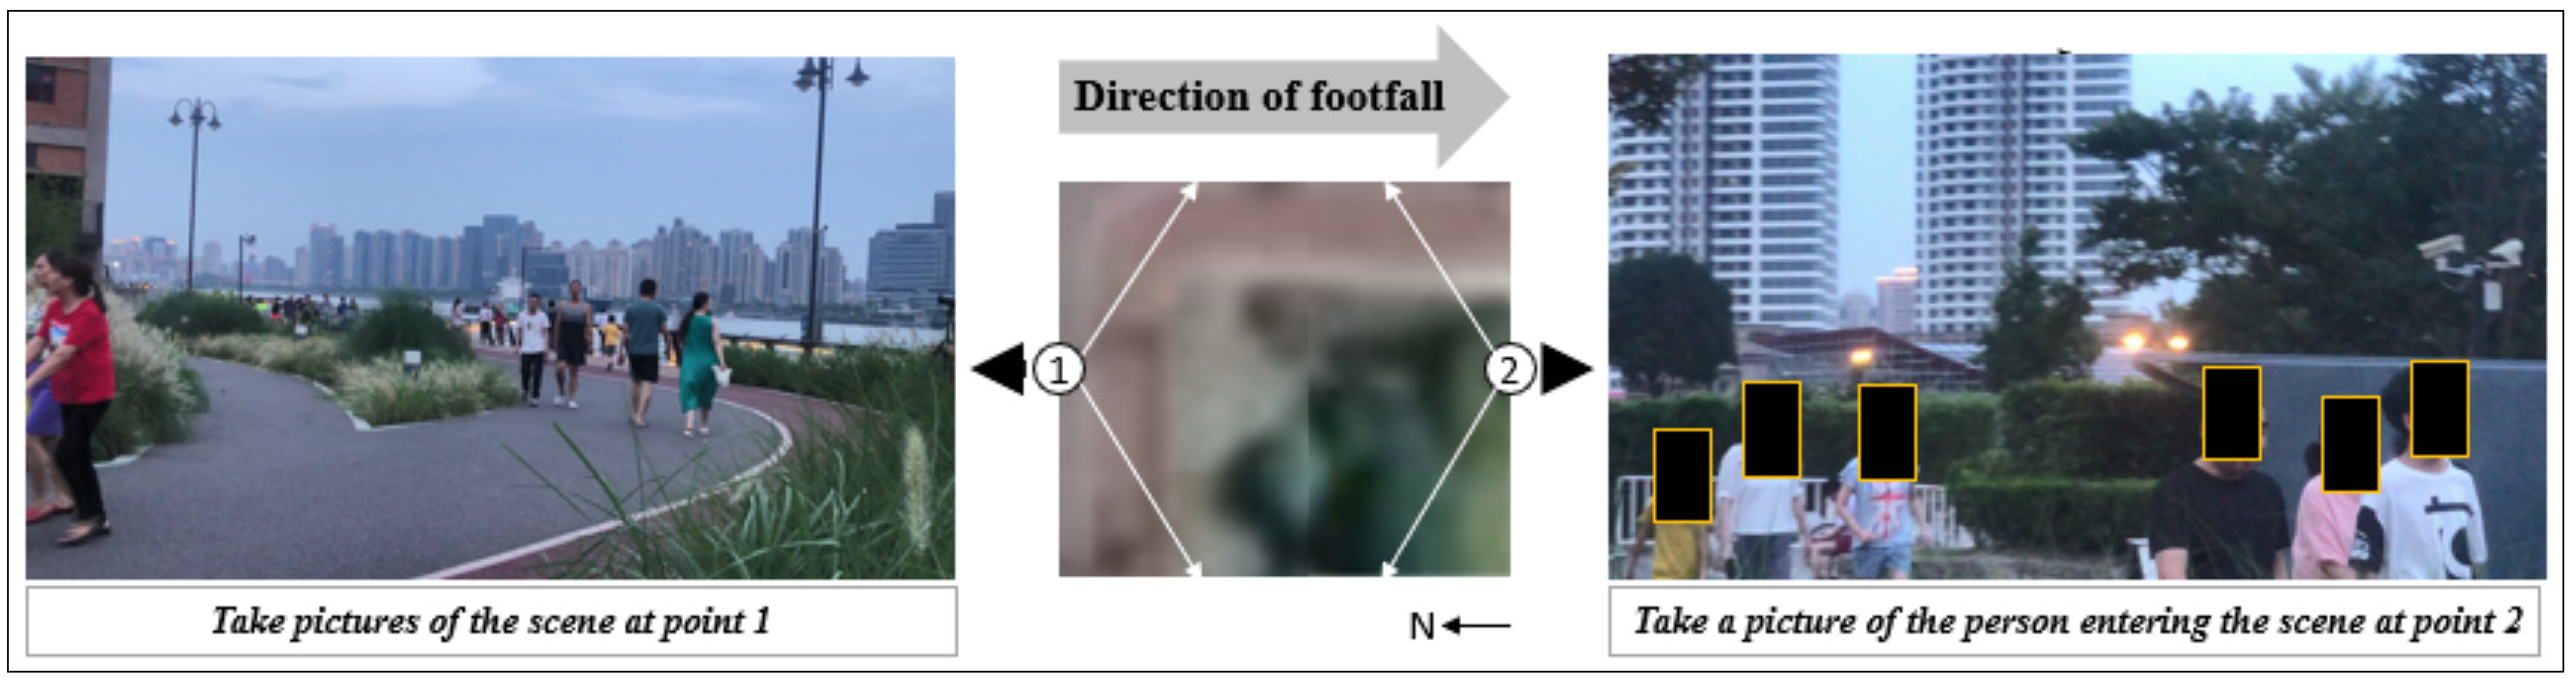
Upon arriving at the research site, the first step was to regulate the shooting position and direction, with the midpoint of the space’s edge serving as the shooting point in the opposite direction of the participant’s forward motion (Figure 3). The visual perception range was also regulated to take images close to the participant’s eye gaze range using mobile devices to minimize interference. Participants were not informed of the test during the shooting process, and the images were taken for at least one minute at a fixed time between 3:00 p.m. and 5:30 p.m., with at least ten participants captured in the image. After the shooting was complete, the images were systematically labeled and stored.

Figure 3.
Schematic diagram of the procedure.
2.5. Measures
The data analysis approach involves two dimensions: the first is the examination of the types of spatial elements present in the space and their probability distribution, and the second is the analysis of the types of design plan elements in the space and their probability distribution. Moreover, the participants’ emotional types and intensities, age and gender, and the number of people in the space were identified and analyzed. It is worth noting that any unrecognized participant data captured in the video footage using the Tencent Free Online Trial Platform 2015 would be considered invalid.
2.5.1. Spaces Recognition
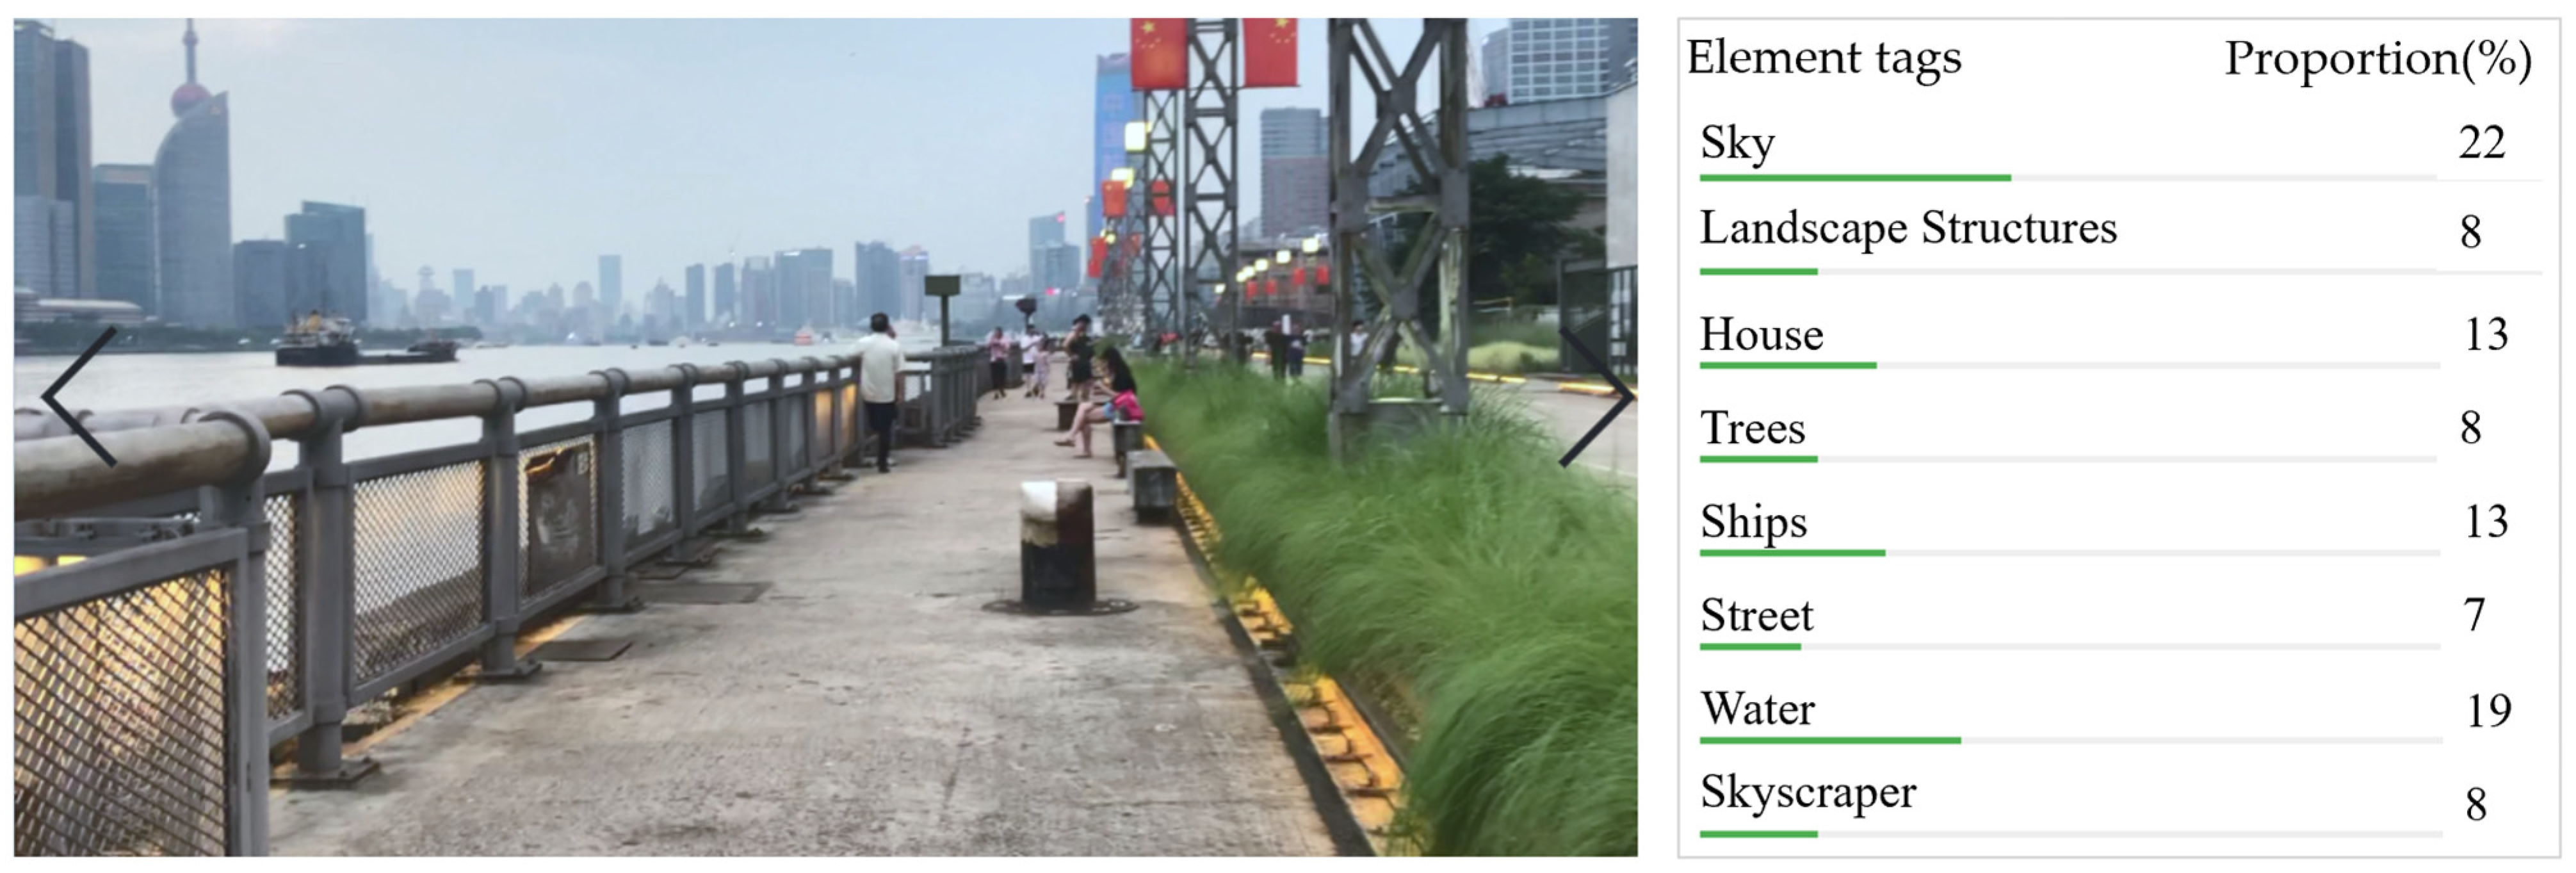
Semantic segmentation is effectively able to provide pixel-level category information. In this paper, we applied Semantic Segmentation to recognize spatial elements [59]. The methodology used in Tencent’s Semantic Segmentation technology achieved state-of-the-art performance on challenging benchmarks, significantly outperforming previous methods with Mean Intersection over Union (MioU) up to 55.1% [25]. Tencent Image Recognition Free Online Trial Platform 2015 was employed to facilitate batch recognition of a vast collection of space images, resulting in the identification of distinctive element tags and their corresponding image proportions (Figure 4). The judicious utilization of this technology underscores the study’s innovative approach and the researcher’s commitment to employing the most advanced and sophisticated tools available in their research endeavors.

Figure 4.
Schematic diagram of space element recognition results.
2.5.2. Identification of Element Type, Proportion, and Distribution of Flat Urban Space Design Planes
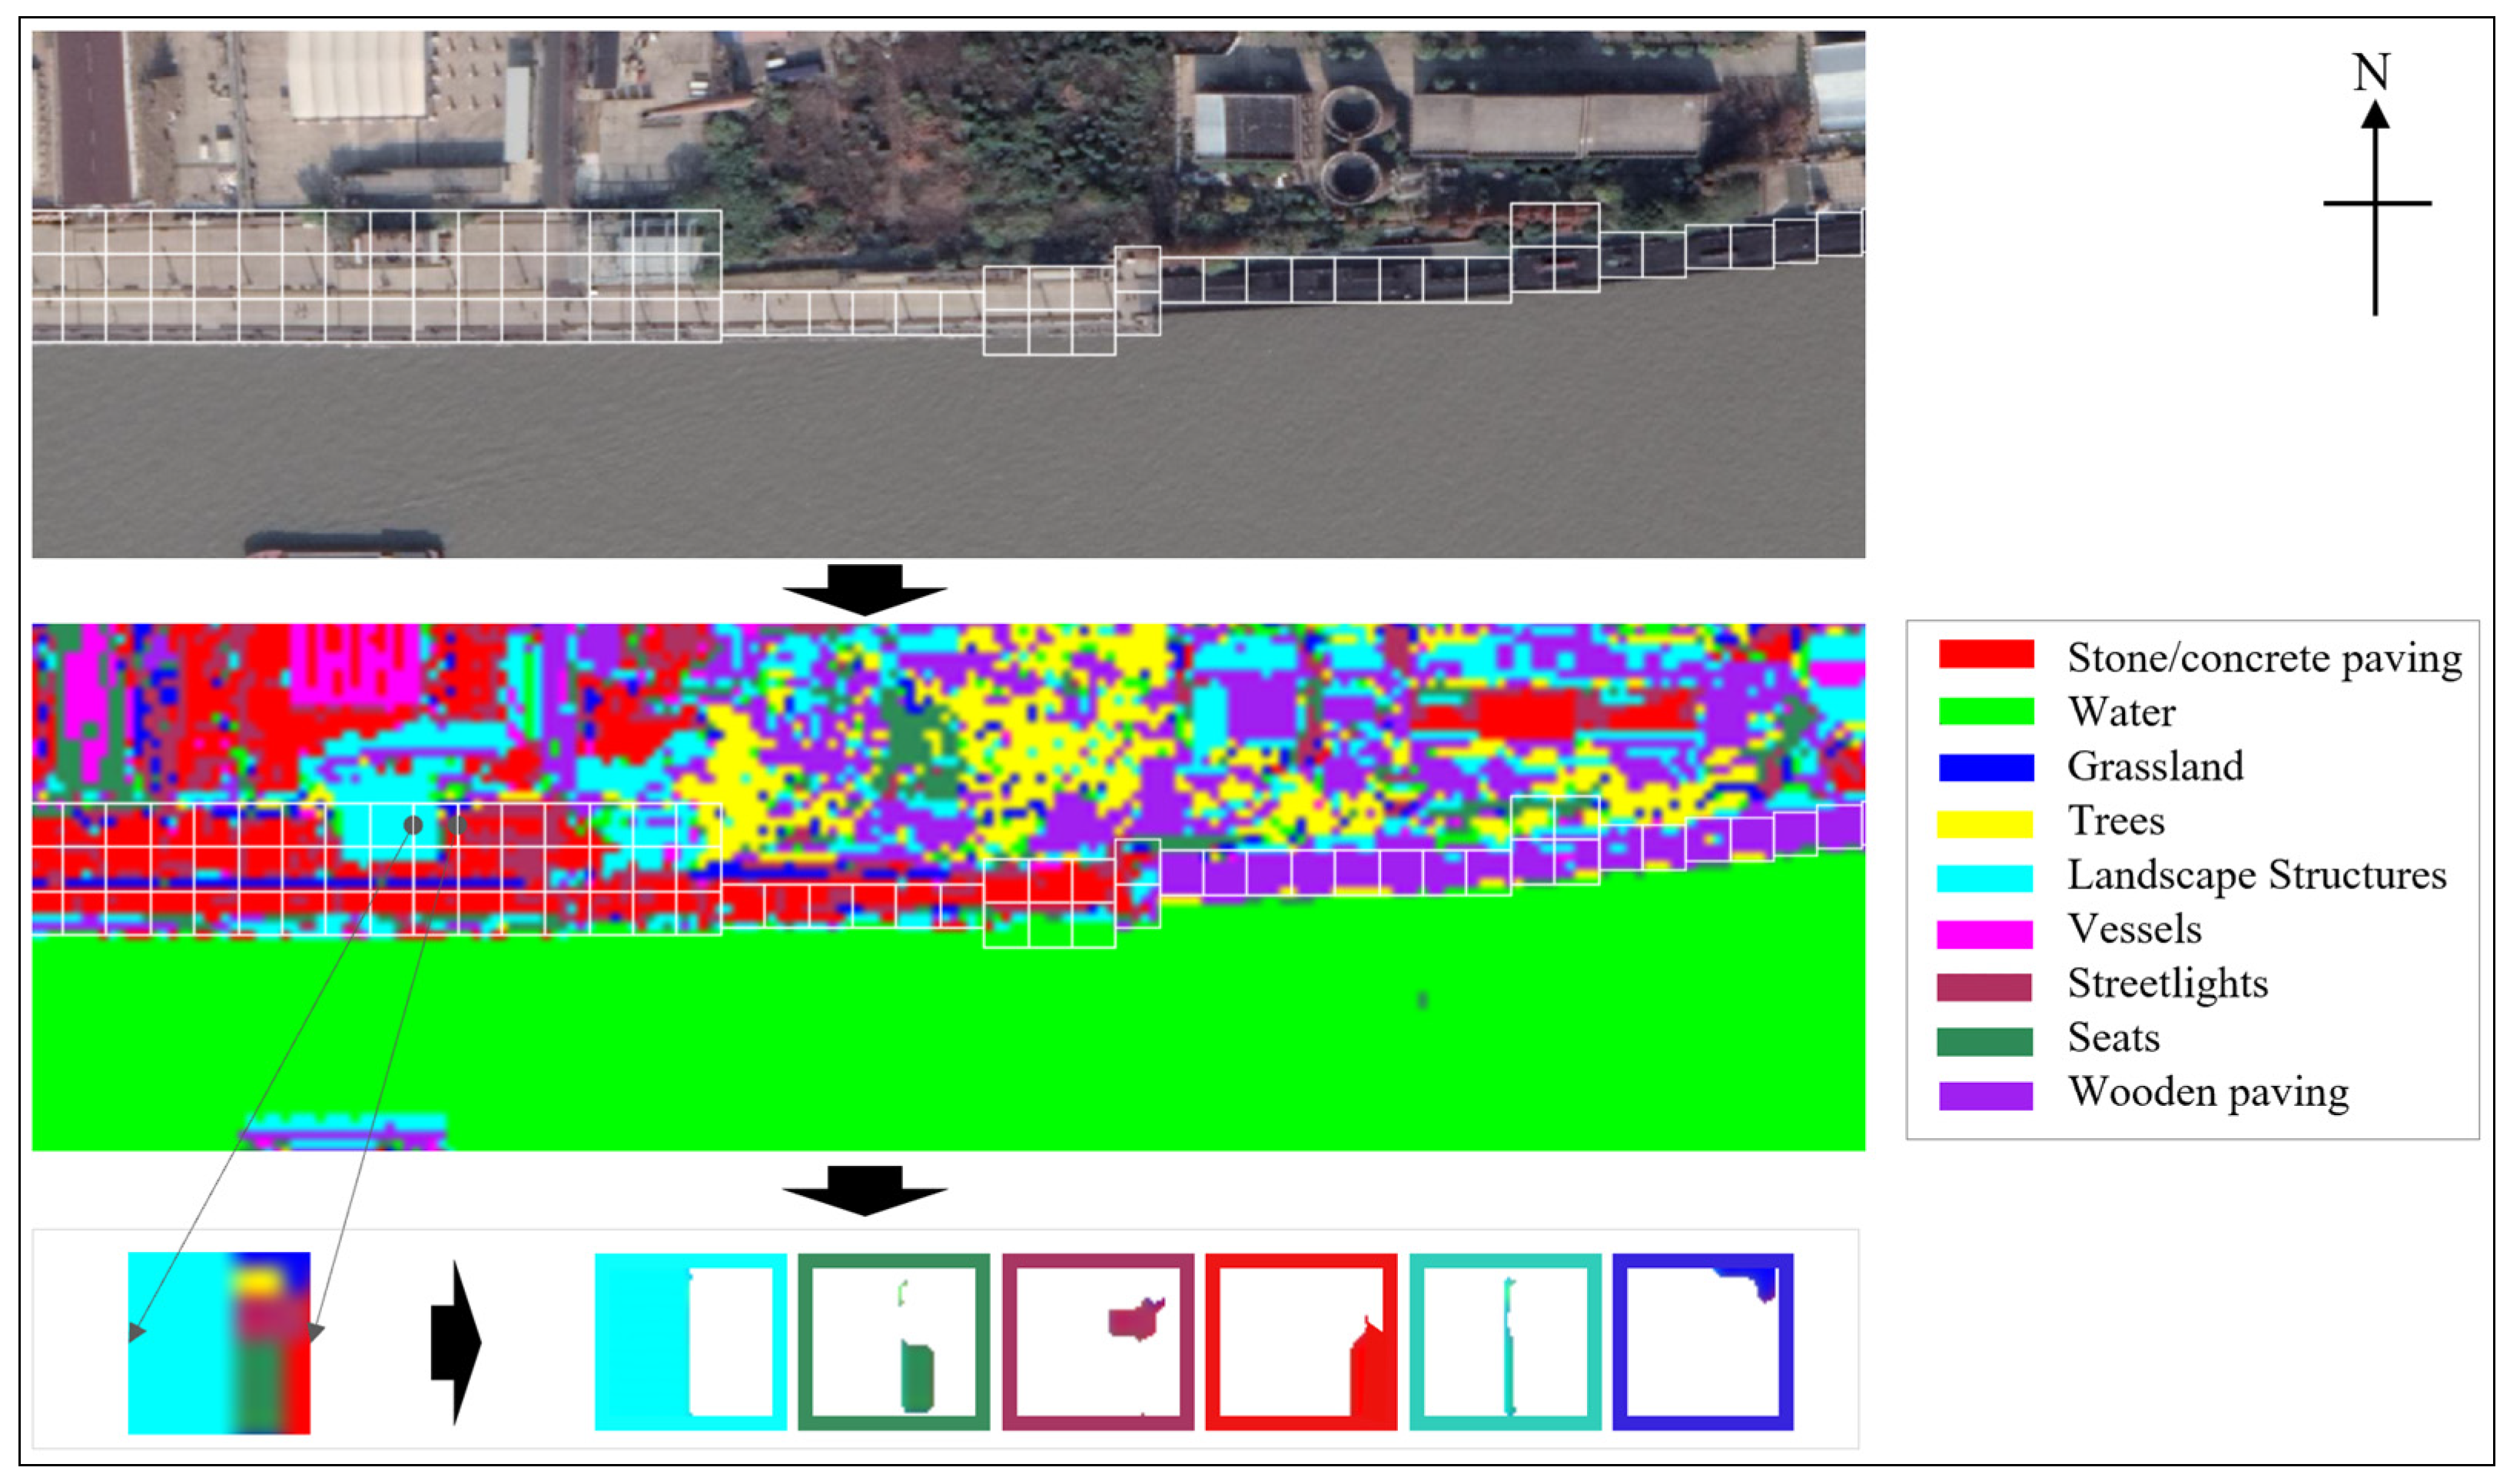
Supervised classification methods were considered to be relatively more precise in achieving quantitative categorization of remotely sensed data [60,61]. In this study, we applied supervised classification methods to classify the Google Earth satellite images of the site. ENVI software 5.3 Region of Interest (ROI) tools were employed for the comprehensive recognition and cluster analysis for supervised classification. We utilized the Support Vector Machine (SVM) algorithm within the ROI tool because it performed relatively better in extracting urban areas [62].
We created nine new ROI and selected multiple geometric sample ranges (geometry) for each land type ROI as training samples for supervised learning. This resulted in the identification of nine distinct planar elements, including hard surfaces, water bodies, grasslands, woodlands, constructions, vessels, streetlights, seating, and wooden pavements, alongside the generation of RGB color cluster analysis images. The resulting images were further analyzed using color clustering technology through the use of the proprietary IMAGE COLOR SUMMARIZER web online, which facilitated the derivation of space planar element proportion data and distribution data (Figure 5). Moreover, based on the results of spatial element identification, we summarized the distribution pattern characteristics of the elements, such as distribution in the form of points, lines, and surfaces (hereafter referred to as point-like distribution, ribbon distribution, and faceted distribution), as a variable for exploring the interaction between the elements and crowd preferences.
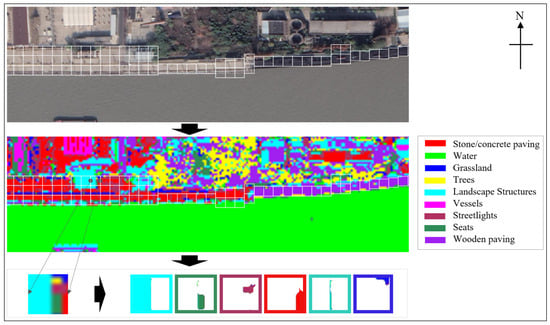
Figure 5.
Data type (base map source: Google Maps); Schematic diagram of the identification results of the type and distribution state of the elements; Model training process (generated by ENVI software 5.3).
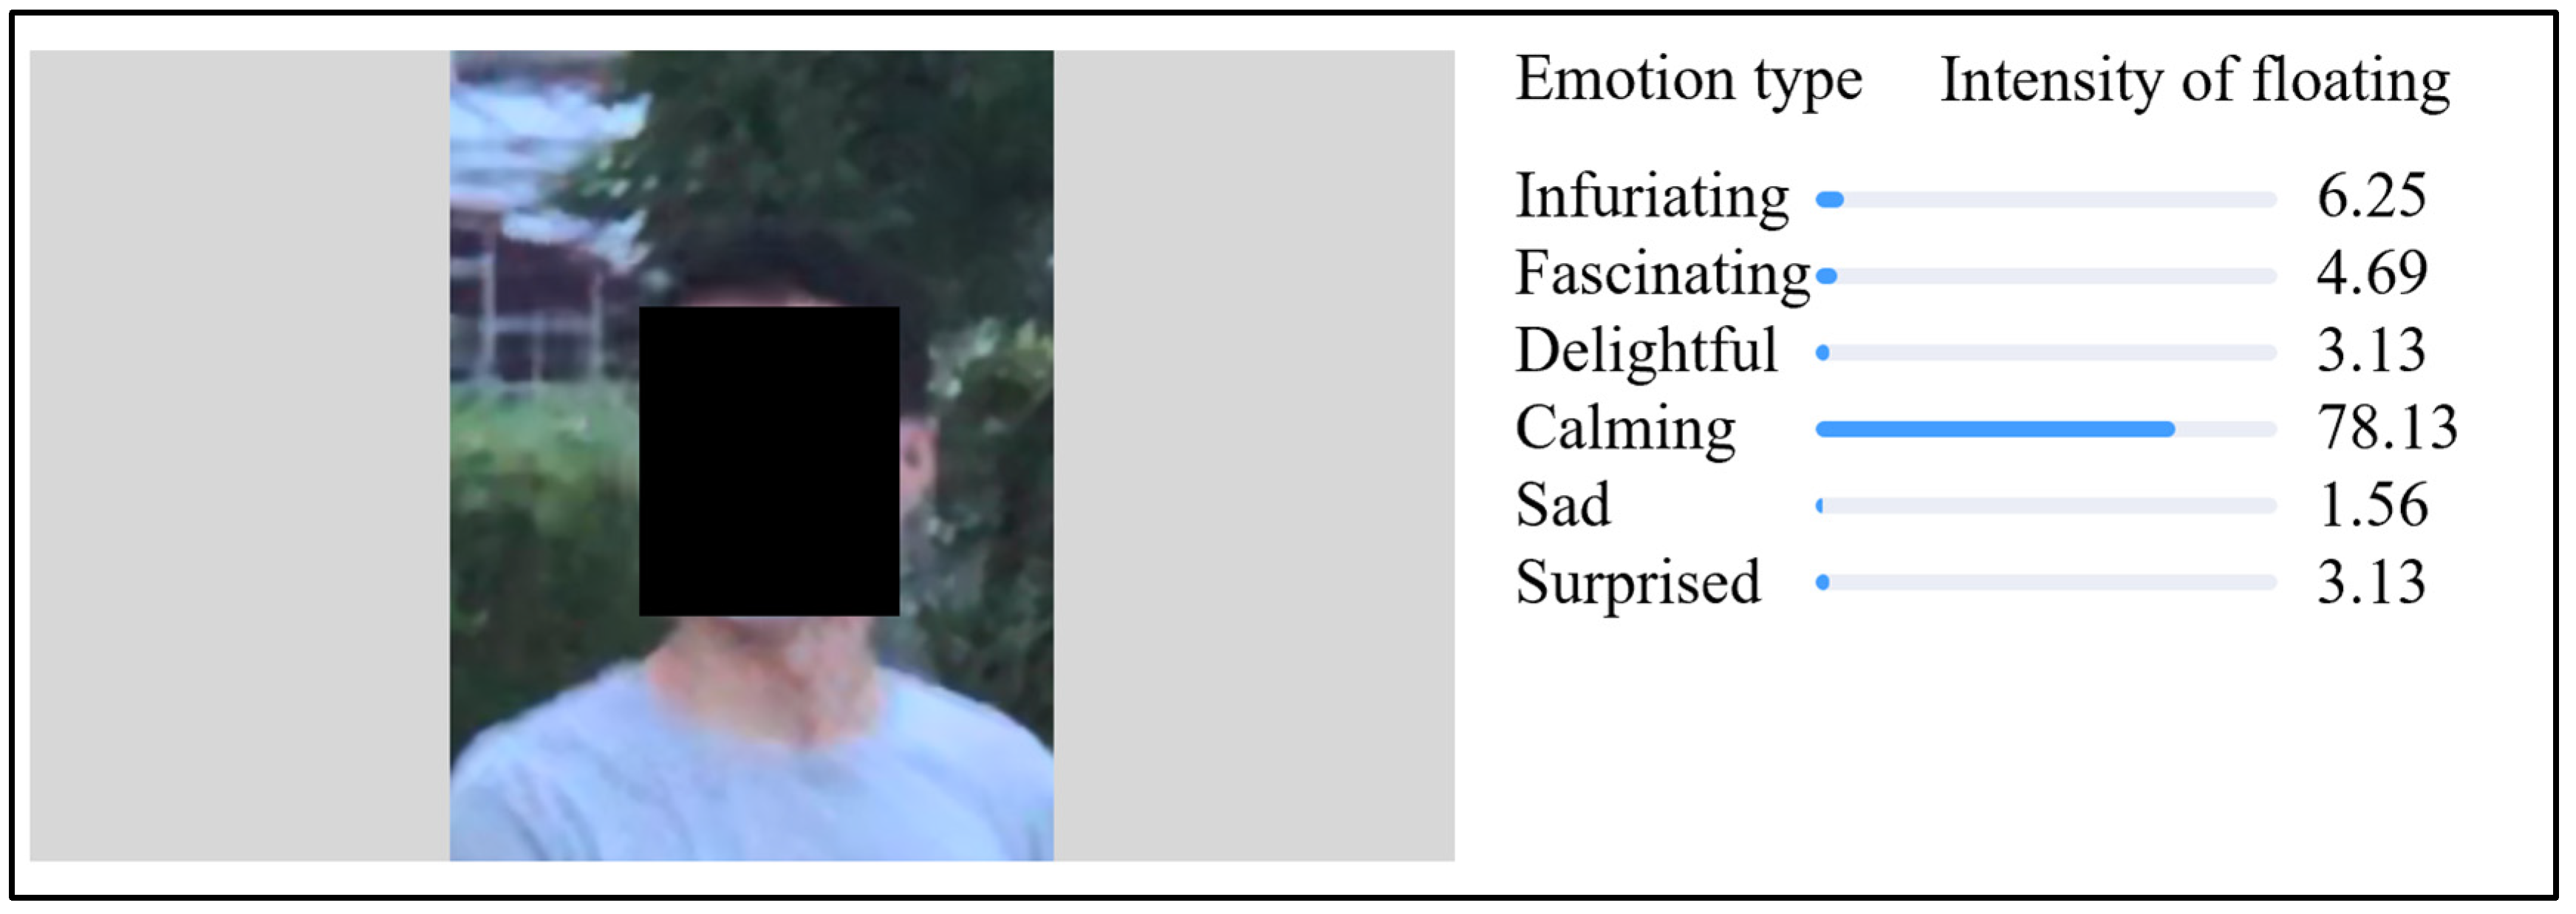
2.5.3. Emotion Recognition of the Population
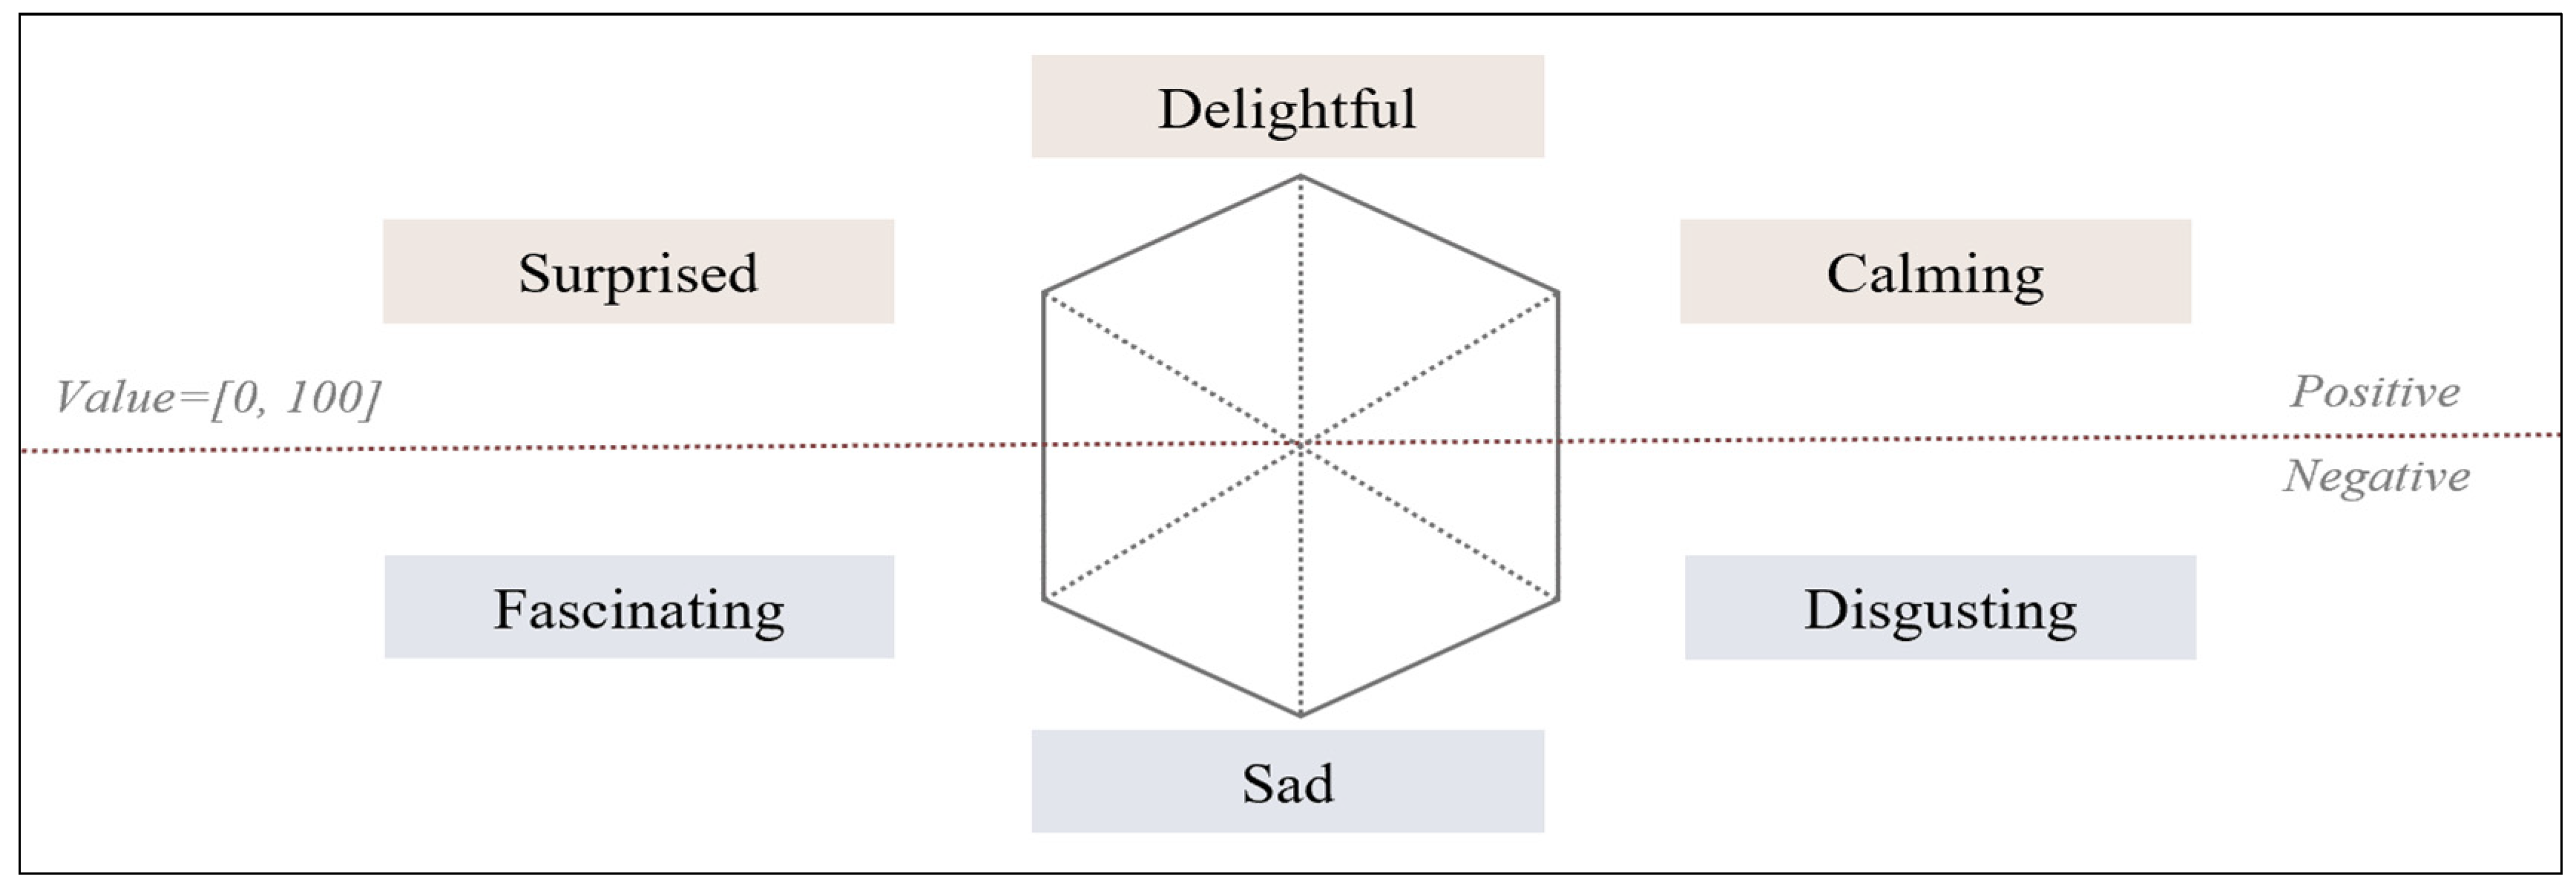
Studies have shown that [63,64,65] environmental comfort is closely related to human emotions. A comfortable environment produces positive emotions, and a poor environment leads to negative emotions. Studies have shown that expression recognition is the most effective method for estimating emotions [66,67,68,69]. In this study, face detection and emotion recognition were performed on the images captured in the research using the proprietary software Extreme Vision Free Web Trial Platform 2015 (Figure 6). The emotion recognition outputs the emotion categories of the population and likelihood data of all emotion types, and we represented the likelihood data of all emotion categories as the emotion fluctuations data of this study (Figure 6 and Figure 7). In our study, the EE value represented the emotional fluctuation data, which was derived from the likelihood data of all emotion categories outputted by the emotion recognition task. Emotion recognition in the paper involved categorizing a set of emotions and their likelihoods, and this output was used to calculate the EE value.

Figure 6.
Schematic diagram of emotion recognition results.

Figure 7.
Six-dimensional emotional analysis.
2.5.4. Number Recognition of the Population
Crowd size in a space is one of the critical factors in the space’s effect on crowd behavior. Therefore, crowd size data were used in this study as data on the effect of the design solution on crowd behavior, hereafter referred to as BE. Crowd size data were the number of results exported by face recognition software of Tencent Free Online Trial Platform 2015 (the method is shown in the following Section 2.5.5). The average value of the number of people in each space was then normalized based on the research data, resulting in the effect value of the space on individuals. Space 35 had the greatest influence on the crowd mixture, and its BE value was 1. Spaces 6, 7, 65, etc. have the least influence on the crowd mixture, and the difference between the maximum and minimum influence values was 1. Thus, it was evident that the spaces have a large influence on the crowd mixture.
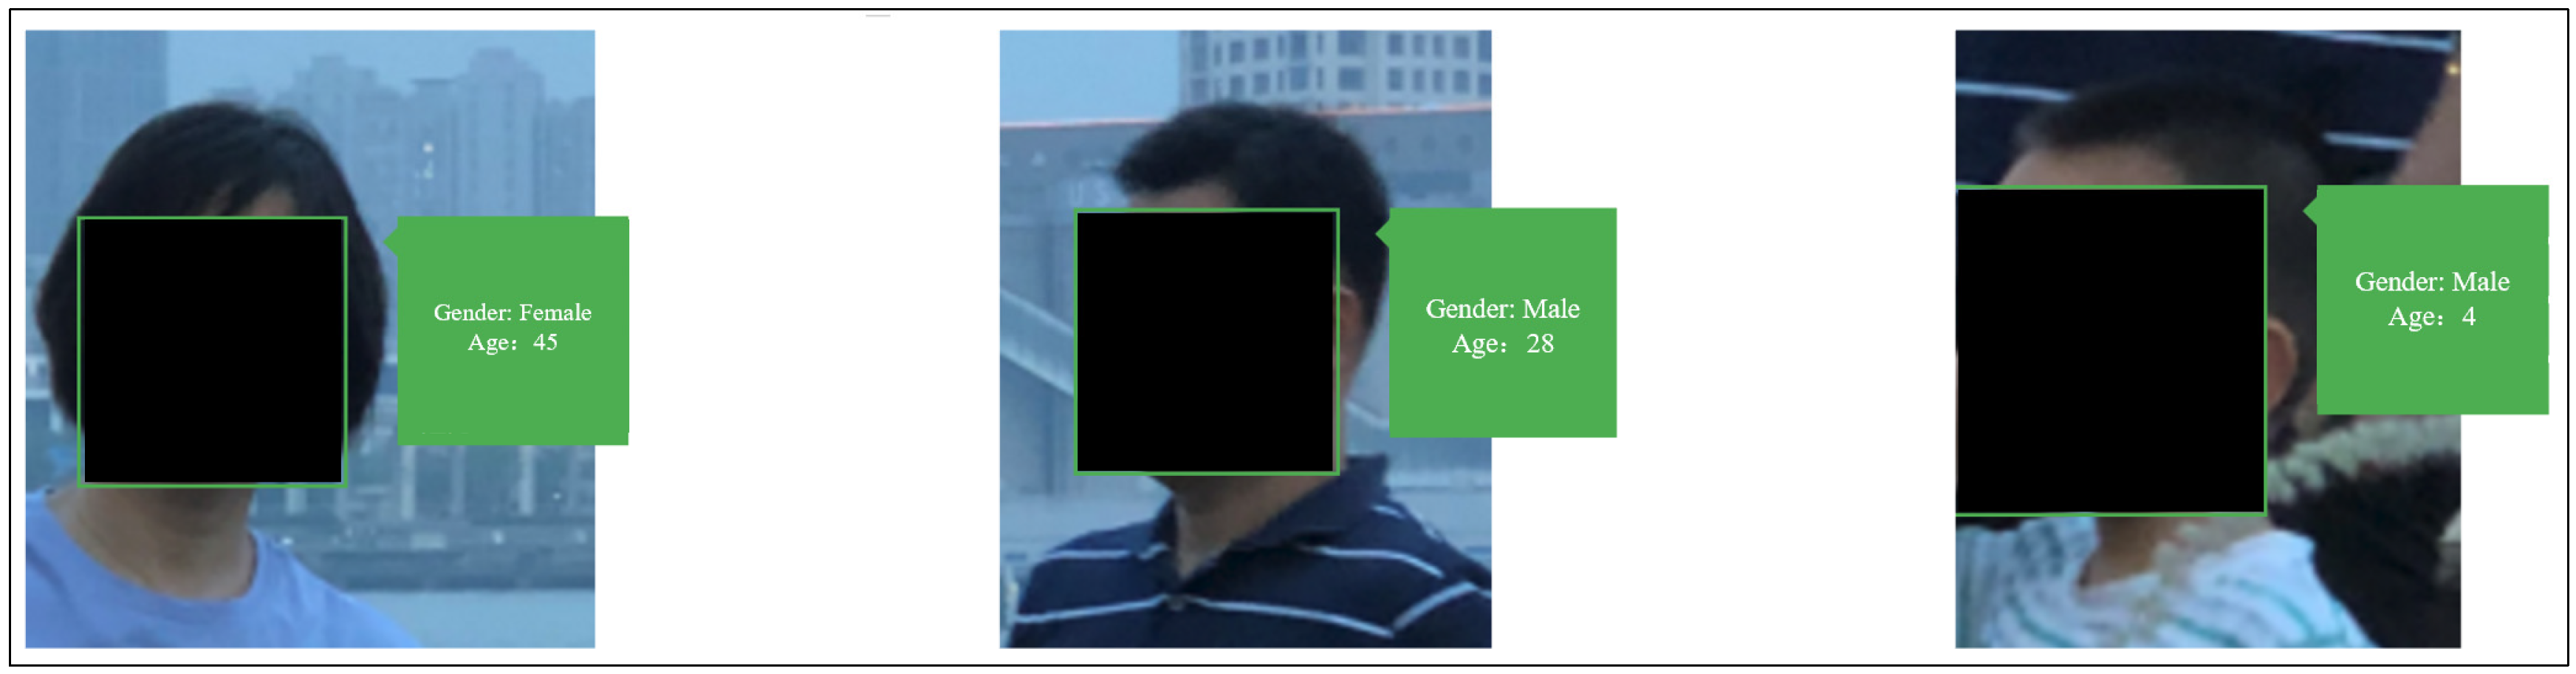
2.5.5. Age and Gender Recognition of the Population
For this study, the population age composition mixed degree and the population gender mixed degree were considered as the data of the effect of the design scheme on the age and gender of the population, respectively, hereafter referred to as AE and GE, respectively (Figure 8). The Tencent face recognition model was an effective face recognition tool, achieving 99.80% accuracy at LFW 2017 [29]. We first applied the face recognition model on the Tencent Free Online Trial Platform 2015 to recognize the character data in the filmed video, then manually cleaned the repetitive data, and finally obtained the age and gender data of the participants. The age structure effect data were computed as the difference between the number of individuals in each age group and the average number of individuals. Higher data values indicated a greater effect, signifying a more significant age structure imbalance in the space. A similar approach was employed to calculate the gender structure effect data, with the maximum value being 1 (Figure 8. Thus, AE and GE are defined by Equations (1) and (2), respectively:
where is the gender diversity model, and is the the value of the effect of the scheme on gender. is the number of different gender groups.
where is the gender diversity model, and is the the value of the effect of the scheme on gender. is the number of different gender groups.

Figure 8.
Schematic diagram of face recognition procedure (age and gender results).
2.6. Statistical Analysis
In this paper, to obtain the total effect value of the space on the participants (henceforth abbreviated as TE), the Emotional Effect Value, Number of People Effect Value, Gender Structure Effect Value, and Age Structure Effect Value were normalized using SPSSAU 20.0 and combined. We utilized the total impact values for an overall assessment of the positive or negative impacts of different spaces on participants and the extent of the impacts, as well as for further research on the relationship between the impacts of spatial elements and participants. The resultant comprehensive approach allowed for the identification of the overall effect pattern. TE is defined by Equation (3):
where is the total effect value calculation model, is the the value of the effect of the scheme on population gender, is the the value of the effect of the scheme on population age, is the the value of the effect of the scheme on population behavior, and is the the value of the effect of the scheme on population emotion.
3. Results
3.1. Emotional Effects of the Spaces on the Participants
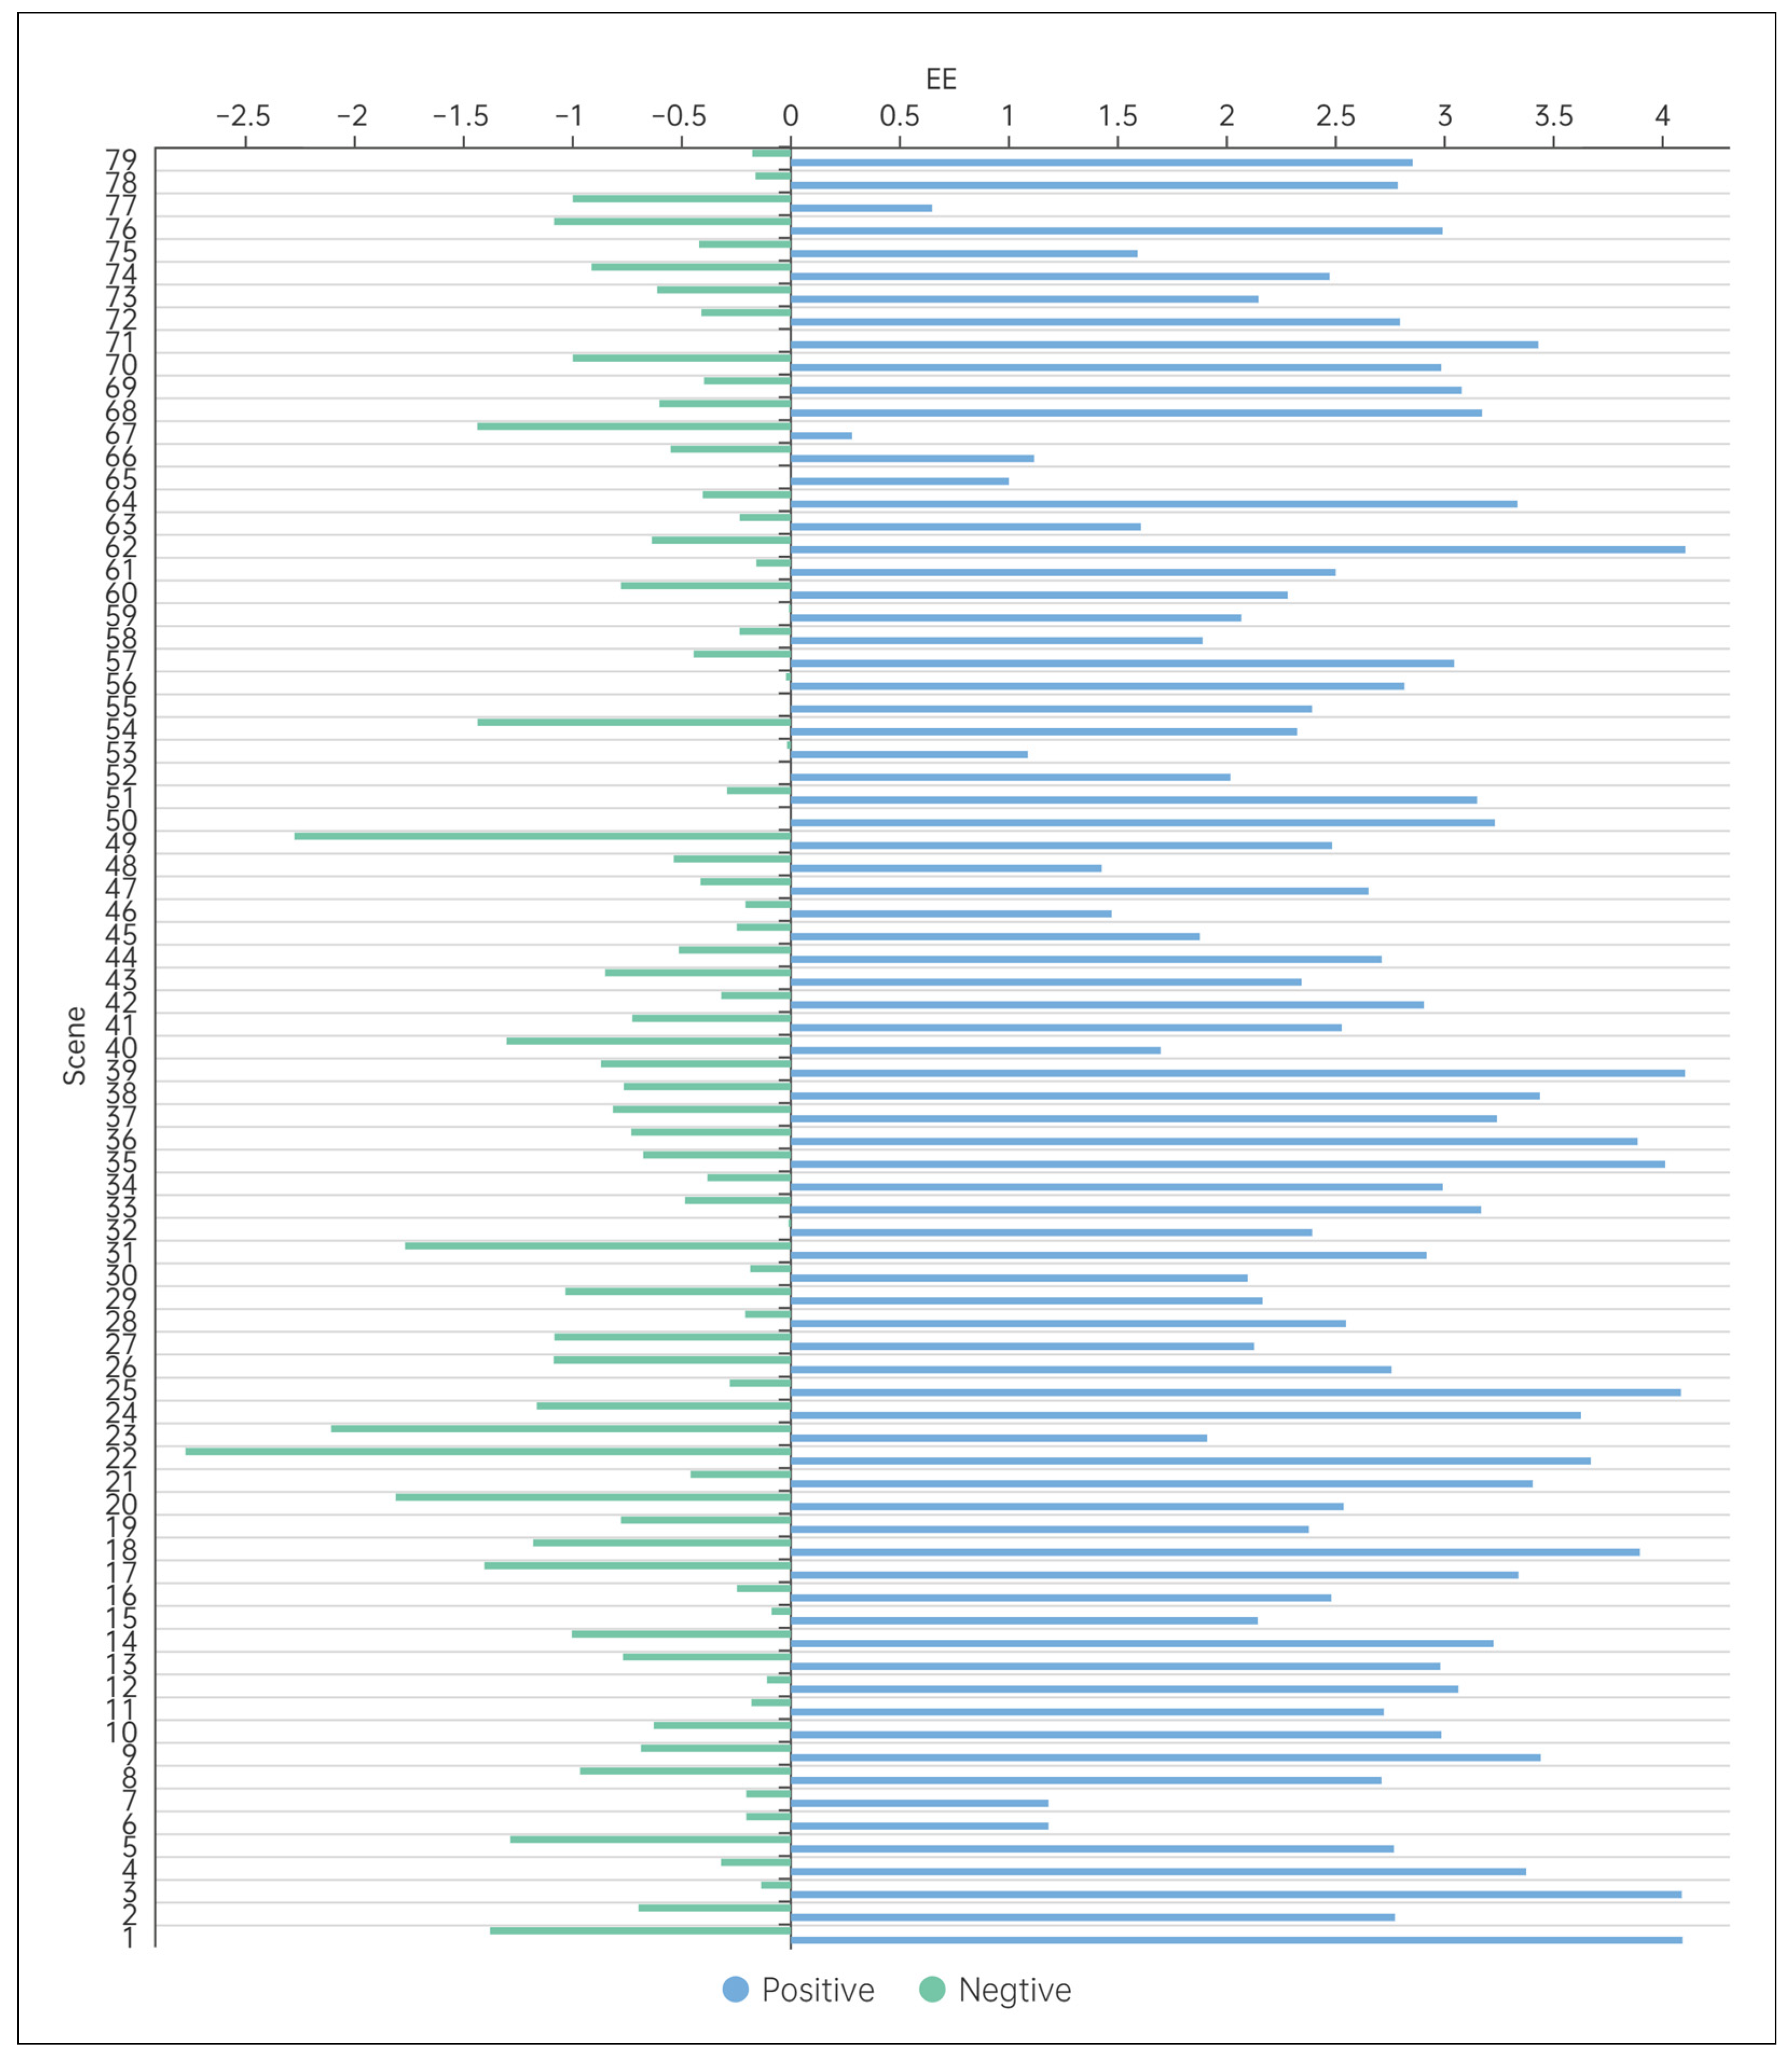
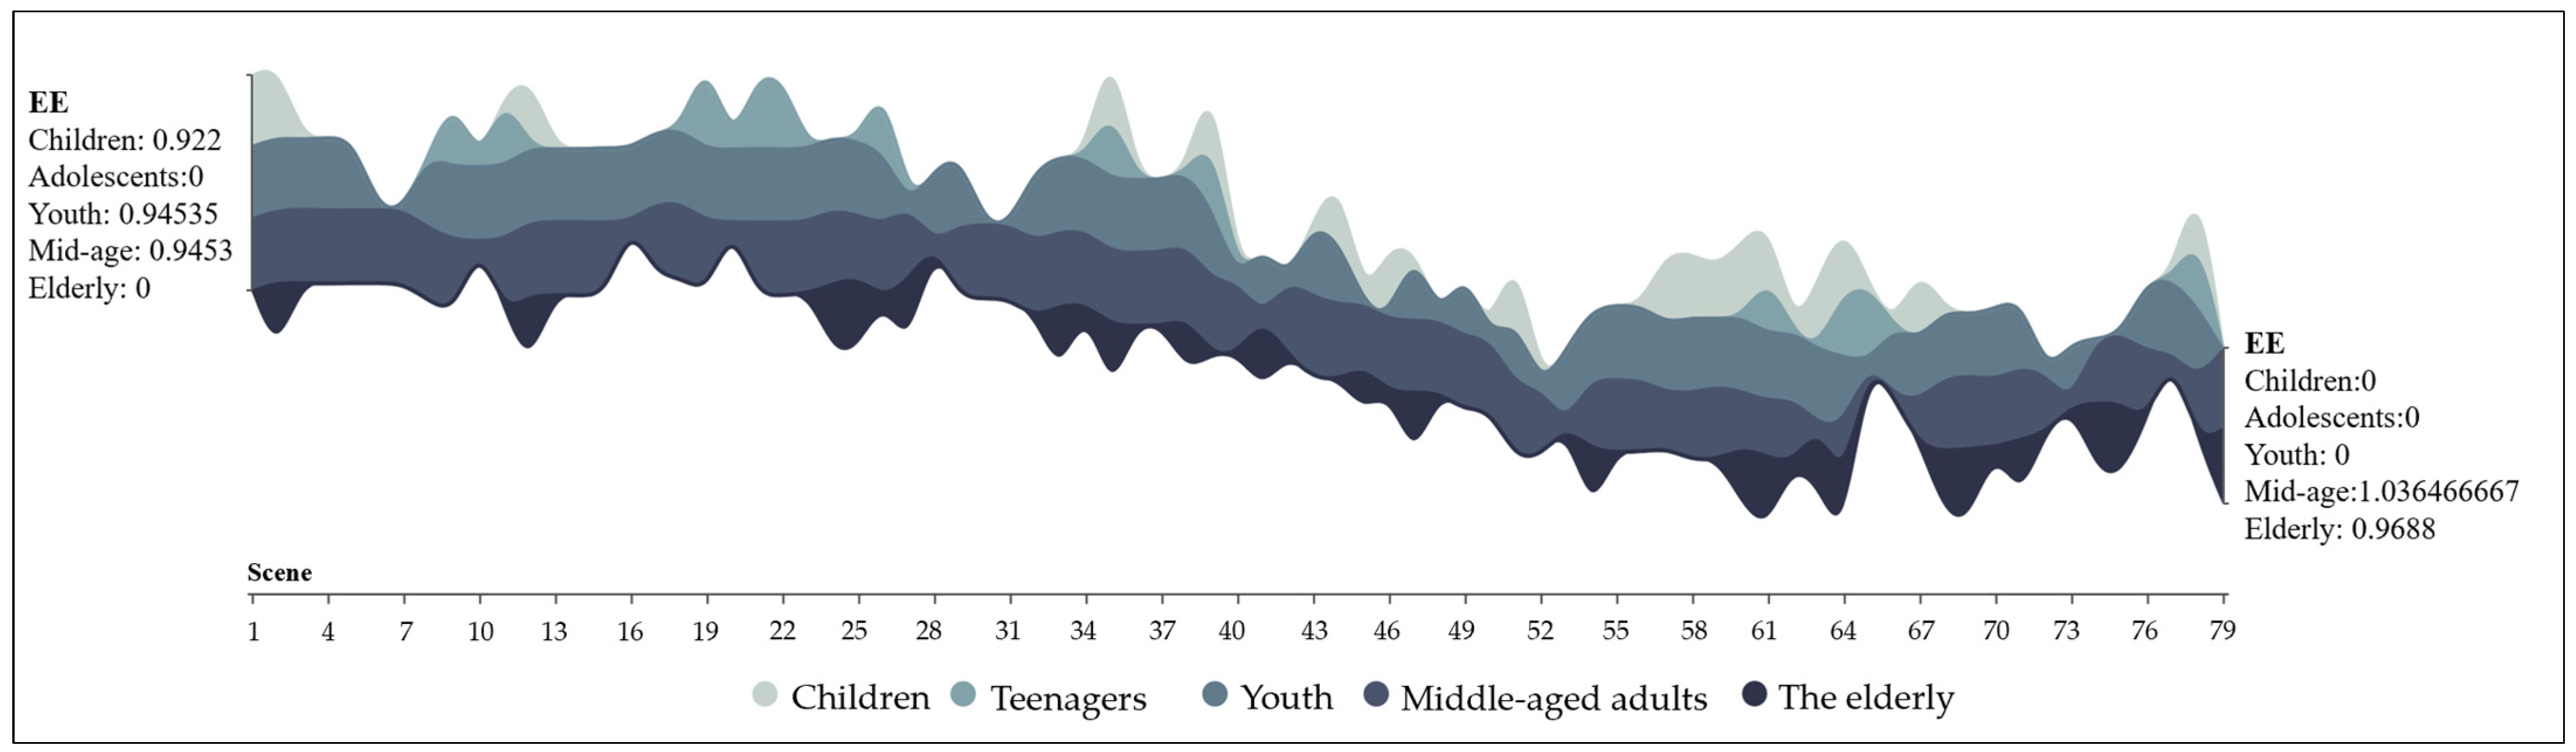
Based on the change in emotional effect values, demographic effect values (age and gender), and the effect of the number of individuals, a figure of the tourist effect was created. Overall, it appears that the study site has a strong positive impact on all populations, so the pattern of human impact for this site scheme can be considered as the basis for the positive scheme evaluation. Preliminary findings revealed that Space 35 exhibited the highest effect value, followed by Spaces 36, 38, and 39. An in-depth analysis of the visual and planar elements of the spaces with the highest effect value was performed. The results indicated that natural elements had a more profound effect on users in terms of visual perception, while paving, architecture, vessels, and seats had a greater effect on users in terms of artificial elements. Regarding planar elements, wooden surfaces had the greatest effect on users, followed by grass and water bodies (Figure 9).

Figure 9.
EE values of urban spaces on all people.
3.2. Total Effects and Emotional Effects of the Spaces on People of Different Ages
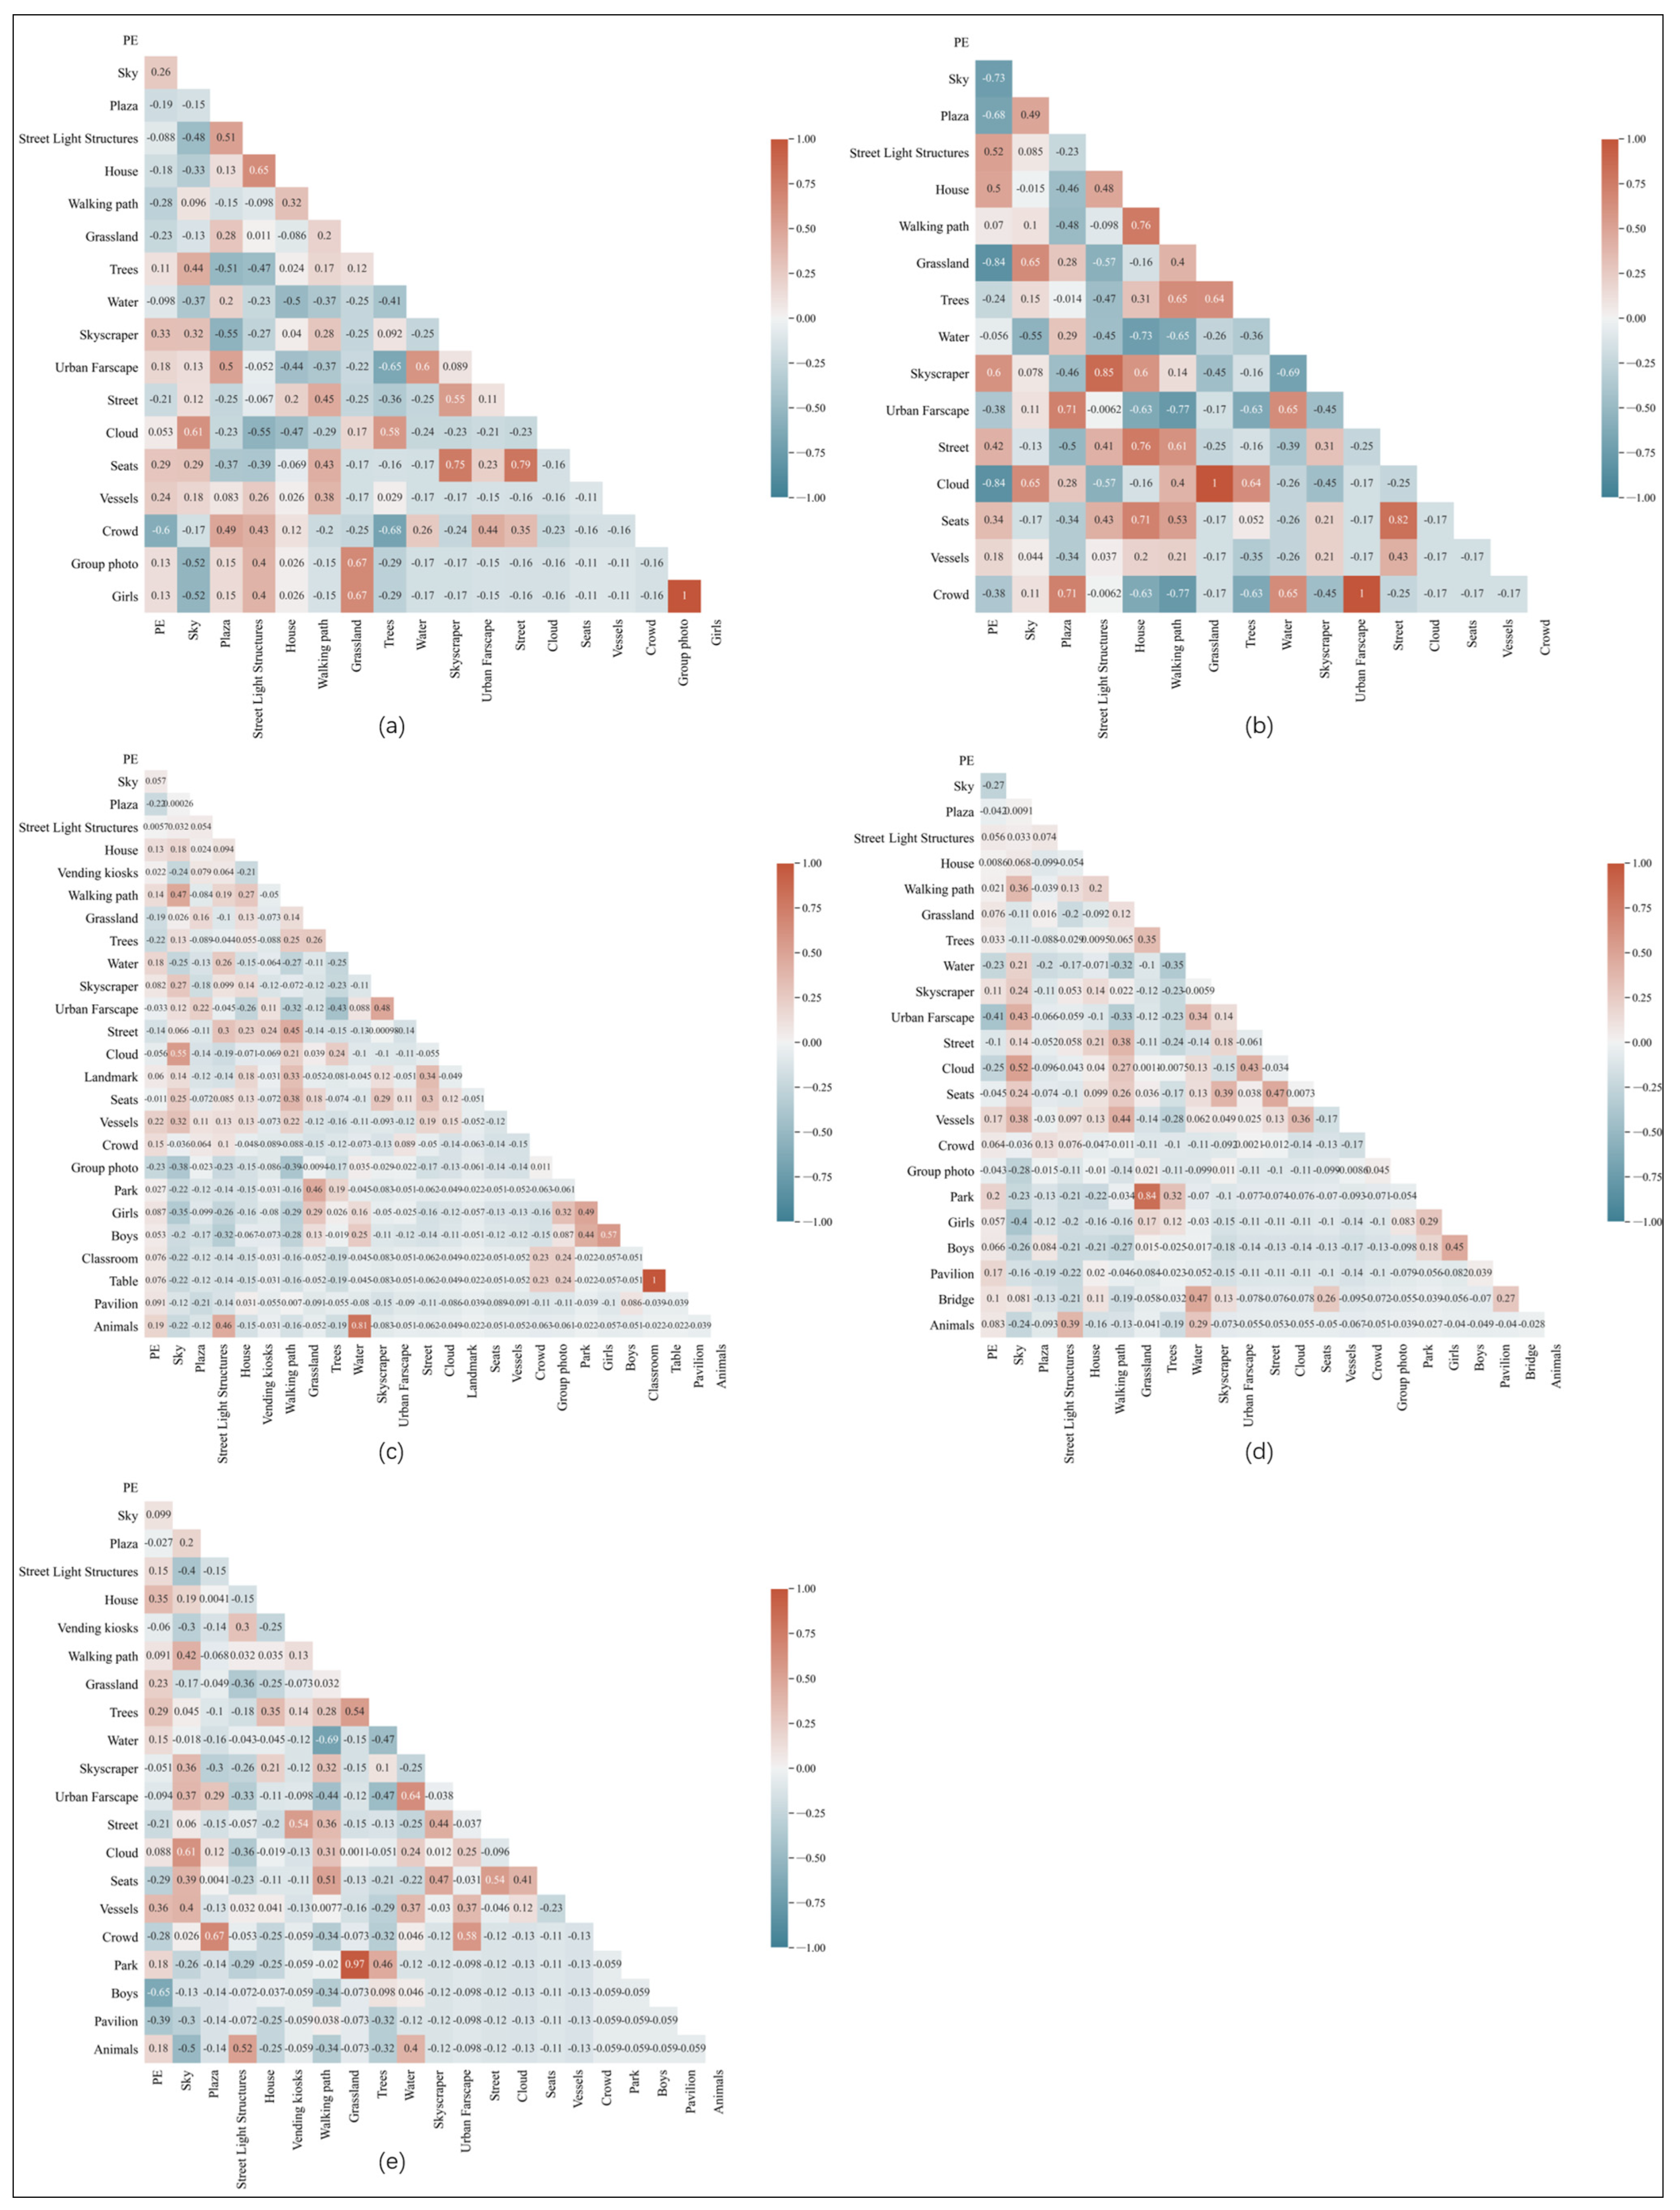
Upon analysis of the spaces in which participants of different age groups took part, it was discerned that Spaces 35 and 39 had the most significant effect on children (Figure 10). It is pertinent to mention that the factors that affected children differed from those of spaces that had the highest overall effect, with group photo (“group photo” referred to a space where people were arranged in rows, as if they were taking a photo in this study) and street having a greater positive effect on children (Figure 11a). Wooden pavement with richer elements was more popular with children (Table 1).

Figure 10.
Positive emotion effect values of urban spaces on all age groups.

Figure 11.
Correlation analysis of spatial elements and the influence of positive emotions on residents of different ages: (a) Children; (b) Teenagers; (c) Young adults; (d) Middle-aged adults; (e) The elderly. (PE: Positive Emotion).

Table 1.
The state of distribution of the elements of the design plane of the urban space of children.
In the case of teenagers, Space 35 emerged as the space with the highest effect (Figure 10). The factors that affected teenagers were also different from those of the spaces with the highest overall effect, with urban farscape (“urban farscape” is defined as the natural or built-up landscape outside the site in this paper), grassland, and streetlight structures having a more significant positive effect on teenagers (Figure 11b). Wooden decks with trees distributed in a dotted pattern in the space’s floor plan were more popular with teenagers (Table 2).
Table 2.
The state of distribution of the elements of the design plane of the urban space of teenagers.
In a similar vein, the analysis of spaces in which young adults took part revealed that Spaces 35 and 38 had the greatest effect on them (Figure 10). Furthermore, the factors that affected young adults differed from those of the spaces with the highest overall effect, with classroom (in our study, we used the term “classroom” to describe outdoor landscaped spaces of a certain scale with stepped tables and chairs neatly arranged, hereafter referred to as classrooms) and water having a more significant positive effect on them (Figure 11c). Wooden platforms with rich elements in the floor plan of the space were more attractive to young people, and young people preferred wooden platforms with more grassy areas to the floor plan favored by children (Table 3). An analysis of spaces in which middle-aged participants took part led to the conclusion that Spaces 19, 33, 35, 39, and 71 had the most significant effect on them (Figure 10). The factors that affected middle-aged people were different from those of the spaces with the highest overall effect, with grassland and sky having a more significant positive effect on them (Figure 11d). Relative to other groups, middle-aged people favor wooden platforms with more structures (Table 4).
Table 3.
The state of distribution of the elements of the design plane of the urban space of young adults.
Table 4.
The state of distribution of the elements of the design plane of the urban space of middle-aged adults.
Finally, based on the analysis of spaces in which elderly participants took part, it was found that Spaces 19, 33, 35, 39, and 71 had the most significant effect on them (Figure 10). The factors that affected elderly people differed from those of the spaces with the highest overall effect, with grassland and plaza having a more significant positive effect on them (Figure 11e). In comparison to other age groups, seniors appreciate floor plans that have both wood and stone paving and are plentiful in spatial elements (Table 5).
Table 5.
The state of distribution of the elements of the design plane of the urban space of the elderly.
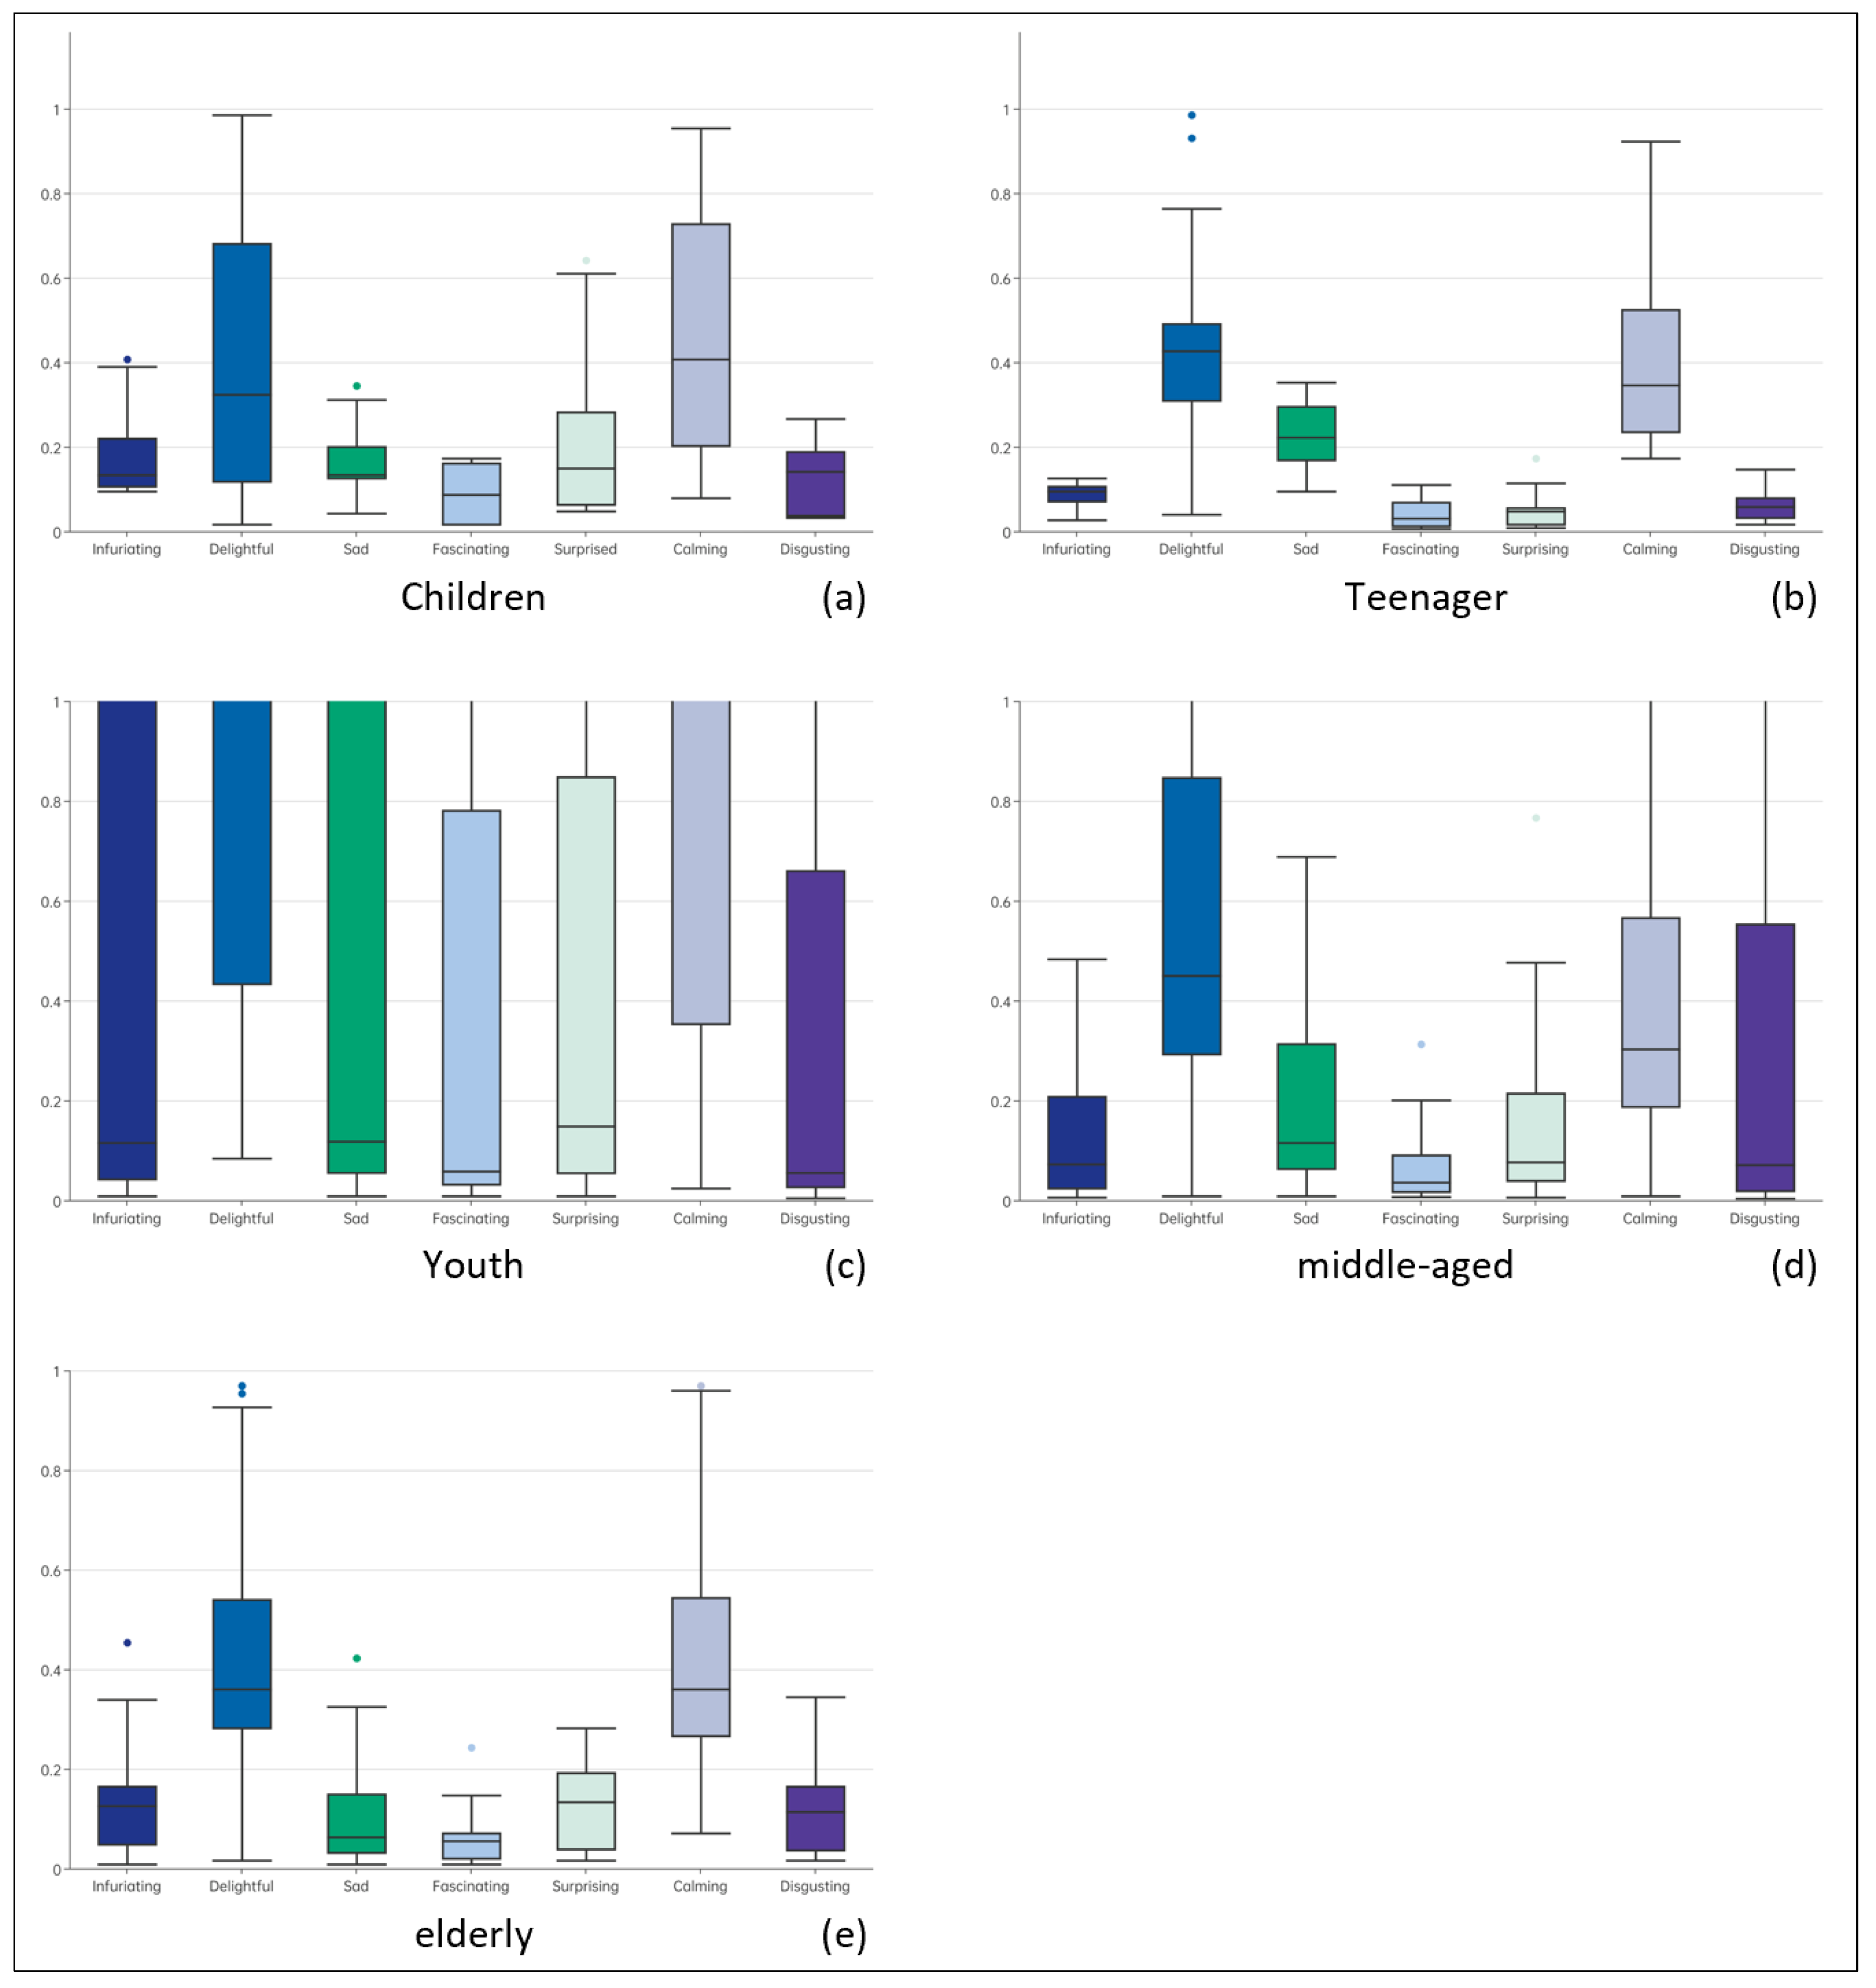
The boxplots are nonlinear visualization tools that help us explore the characteristic features of the data [70]. Comparing the different types of emotions produced by all age groups, the median of positive emotions was higher than the median of negative emotions. Comparing the different types of emotions produced by children, the median of calming emotions (calming = 0.41) was higher than the median of delightful emotions (delightful = 0.32). It came to light that the impact of the riverfront space scheme on children was concentrated in calming emotion. Comparing delightful emotion produced by children and teenagers, the median of delightful emotions arising in children (delightful = 0.32) was lower than the median of delightful emotions elicited by teenagers (delightful = 0.43) (Figure 12).

Figure 12.
Boxplots of AE values for urban spaces: (a) Children effect values; (b) Teenager effect values; (c) Youth effect values; (d) Middle-aged effect values; (e) Elderly effect values.
3.3. Effects of the Spaces on People of Different Genders
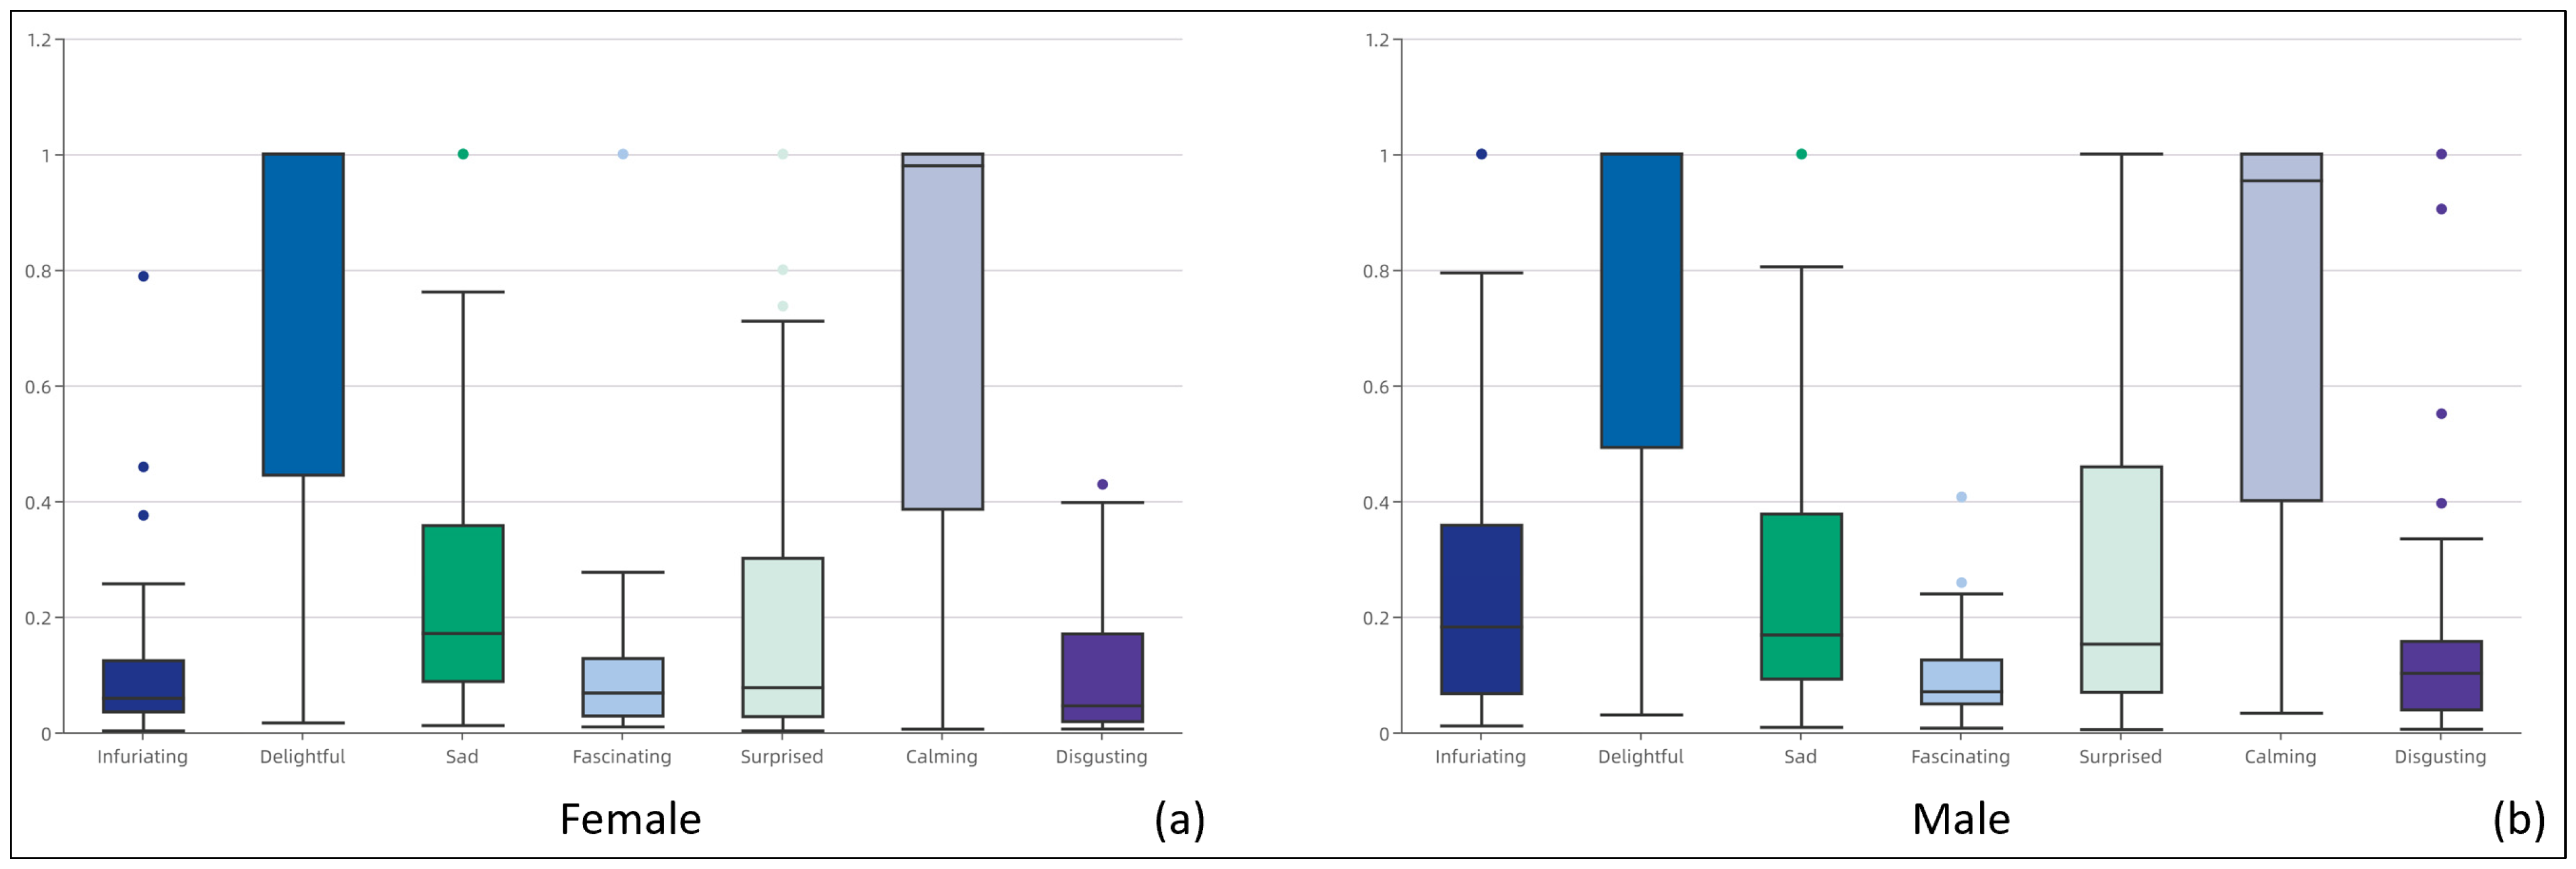
Comparing the different types of emotions produced by male and female groups, the median of female positive emotions (calming = 0.98) was higher than the median of male negative emotions (calming = 0.95) (Figure 13). Comparing the different types of emotions produced by males, the median of calming emotions (calming = 0.95) was higher than the median of other emotions (Figure 13b). Comparing the different types of emotions produced by females, the median of delightful and calming emotions (delightful = 1; calming = 0.98) was higher than the median of other emotions (e.g., sad = 0.17) (Figure 13a).

Figure 13.
Boxplots of different GE values for urban spaces: (a) Female effect values; (b) Male effect values (Data processed by MinMaxScaler).
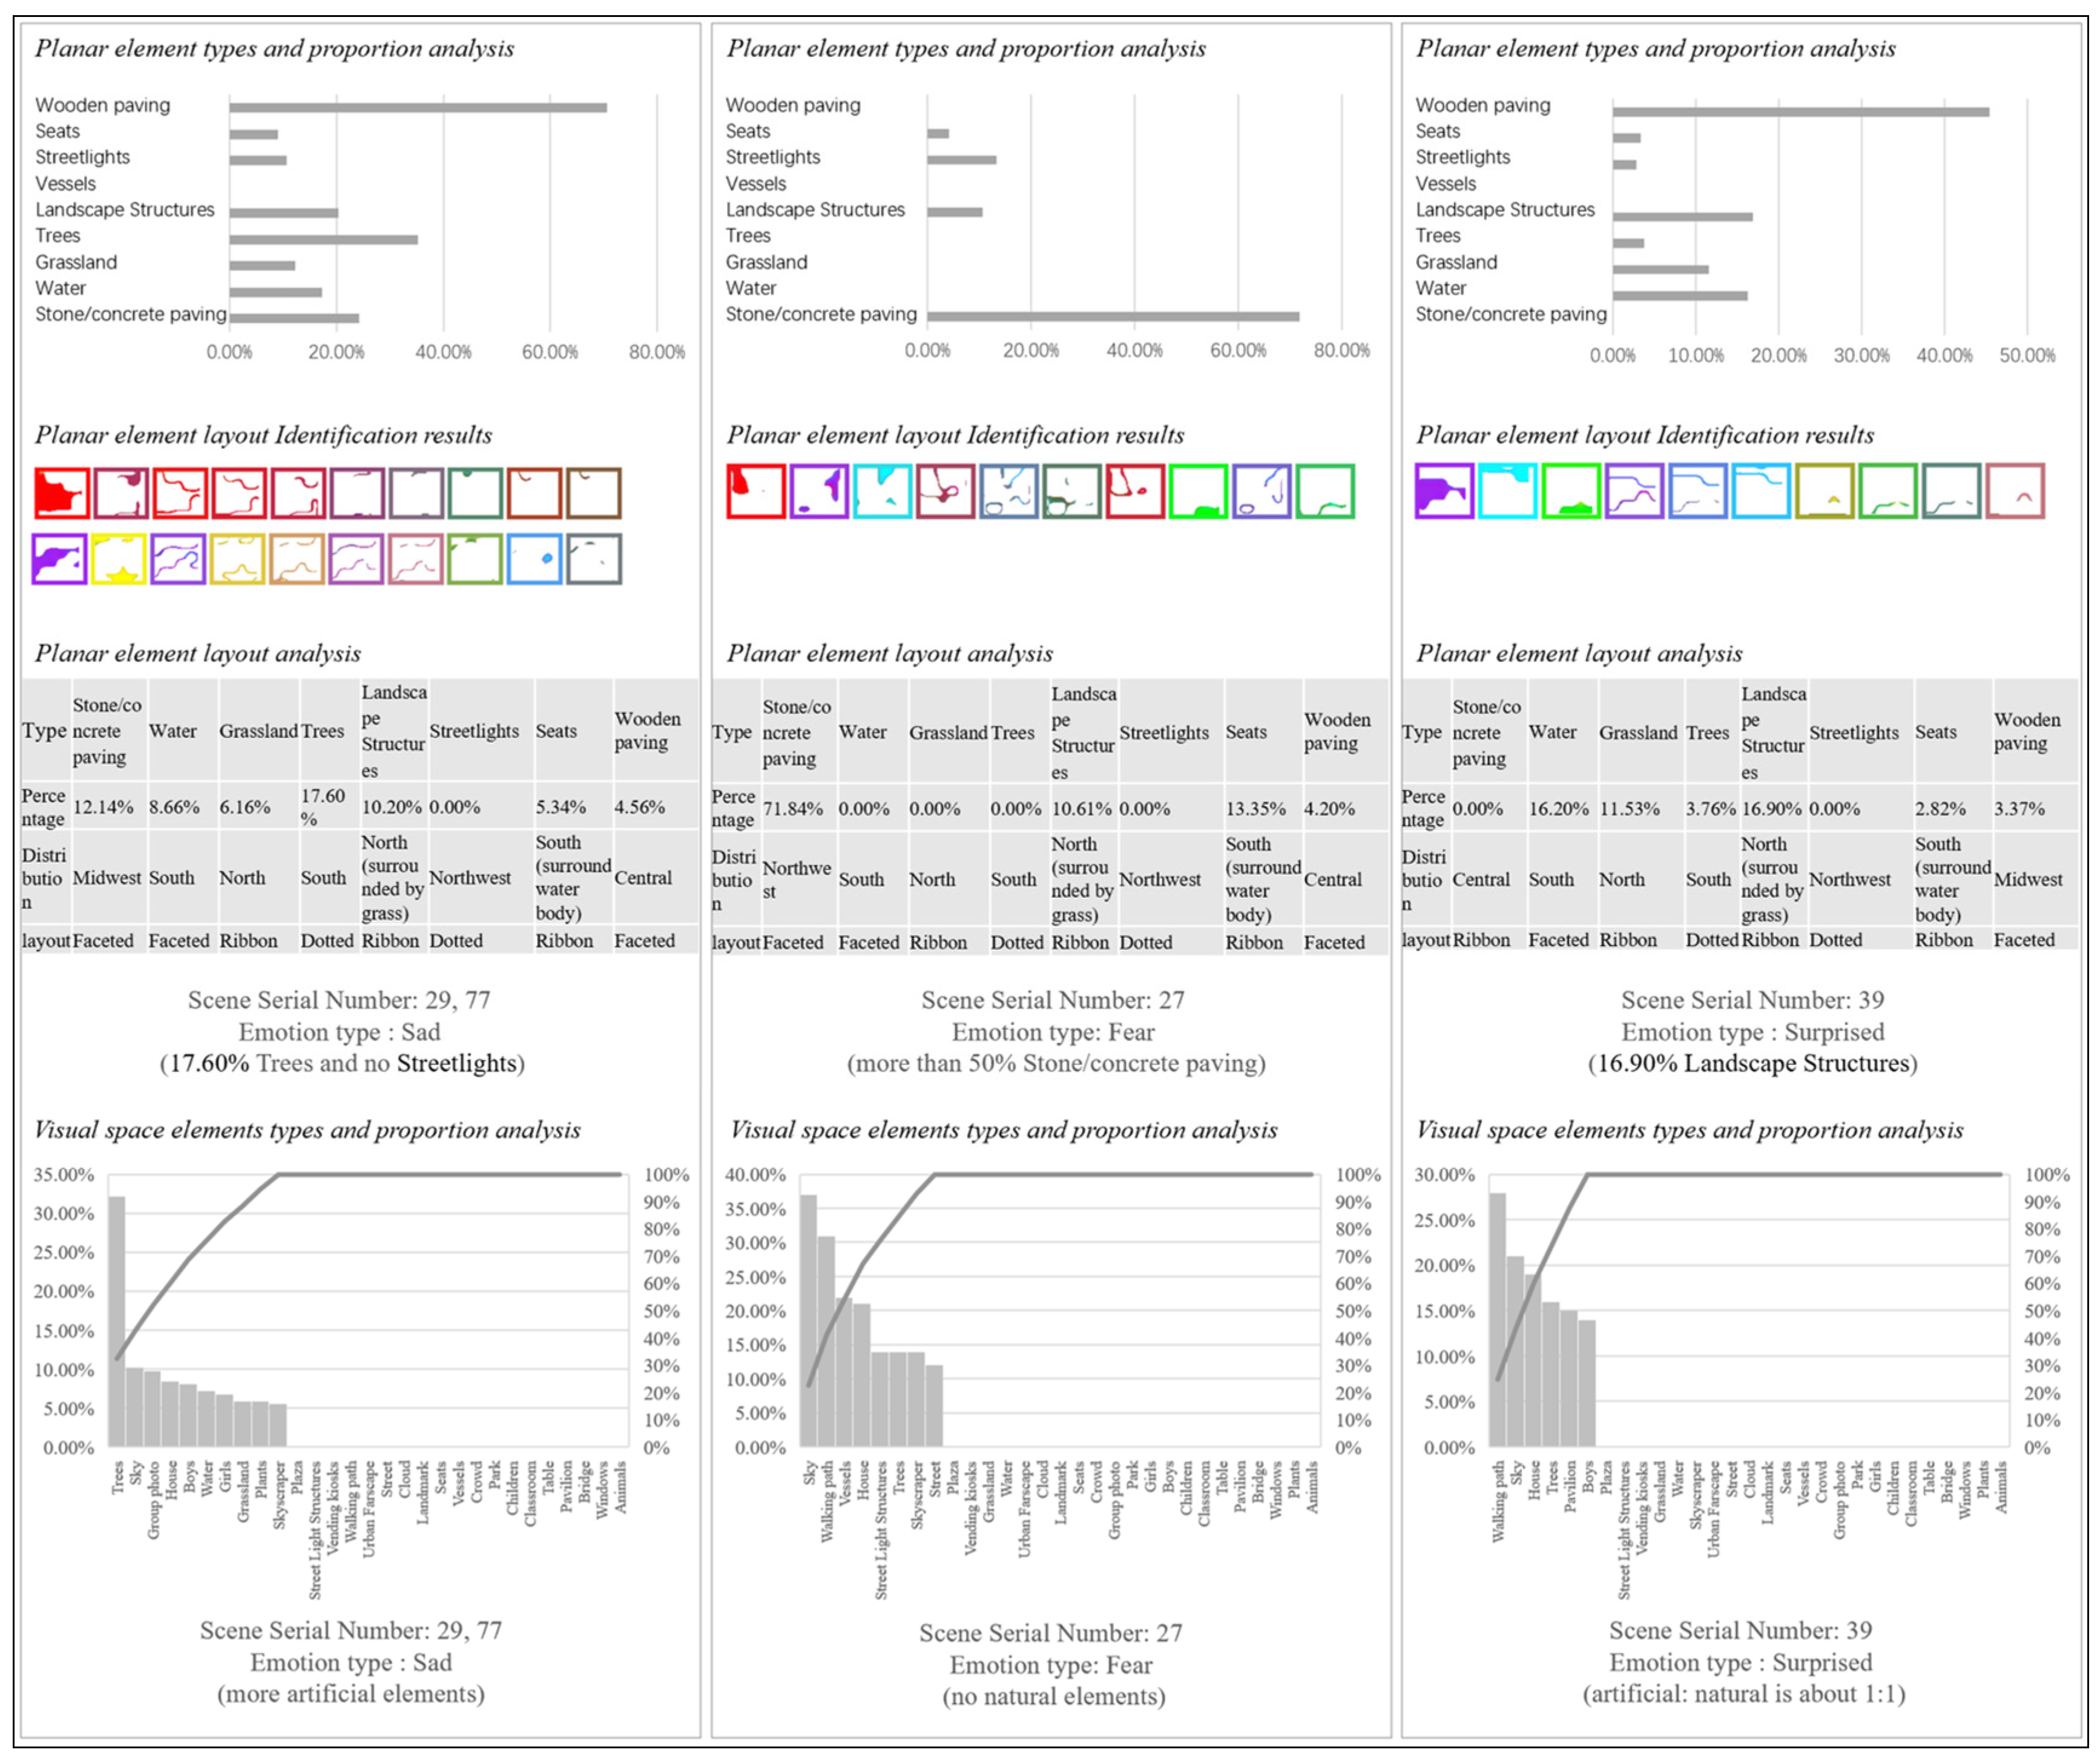
In the case of spaces where female participants experienced sadness, relatively more artificial elements were in the visual perception, along with the absence of streetlights elements in the plane. In addition, it was found that hard surfaces in the visual perception accounted for more than 50%, and there were no natural elements in the plane where female participants were fearful. Furthermore, when the visual perception contained construction elements, and the proportion of artificial and natural elements in the plane was 1:1, female participants were inclined to experience surprise (Figure 14).

Figure 14.
Analysis of the correlation between women’s emotions and urban space planes and the spatial correlation between women’s emotions and urban spaces. (Note: In this paper, artificial elements were defined as man-made or human-involved elements, such as Group photo, House, Boys, Girls, Skyscraper, Plaza, Street Light Structures, Vending kiosks, Walking path, Urban Farscape, Street, Landmark, Seats, Vessels, Crowd, Park, Children, Classroom, Table, Pavilion, Bridge, Windows, etc. Natural elements were defined as elements of nature, such as Trees, Sky, Water, Grassland, Plants, Cloud, Animals, etc., as in Figure 15).
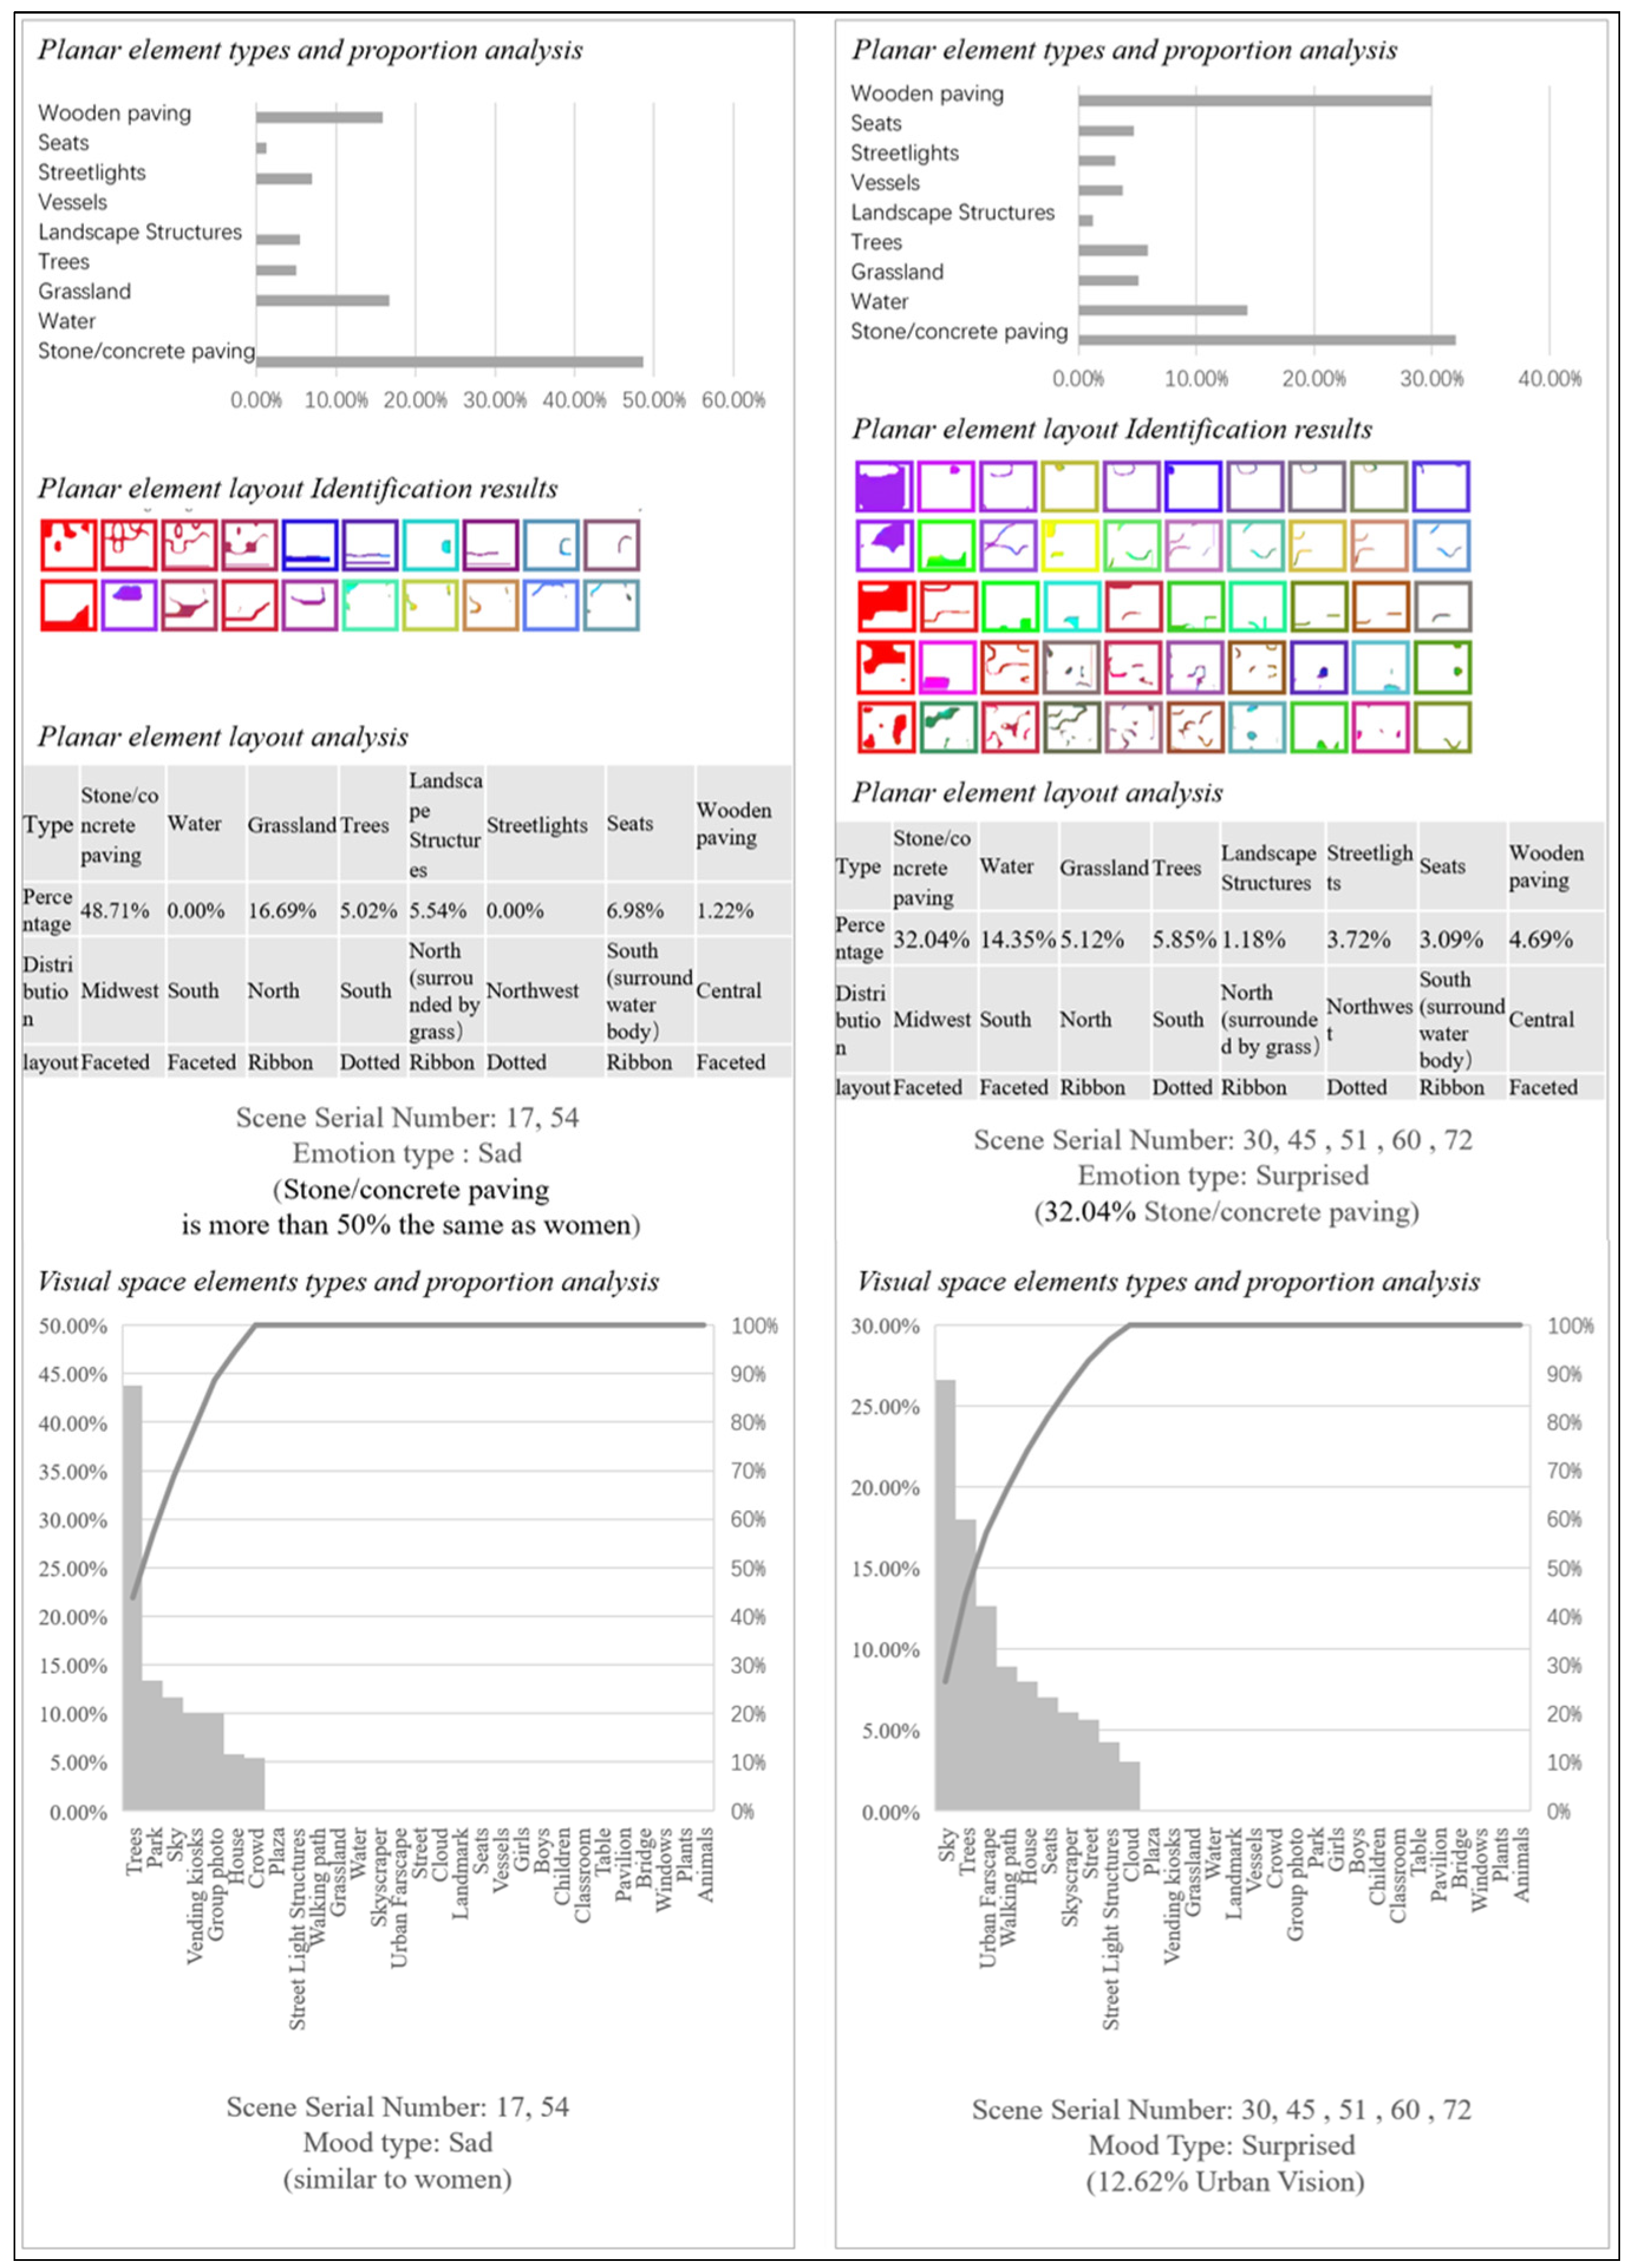
Likewise, based on the analysis of the visual perception and plane elements of spaces where male participants experienced sadness, the plane elements that led to male participants’ sadness were similar to those for females ((Figure 14 and Figure 15). Interestingly, the urban distant view in the visual perception elicited surprise among male participants (Figure 15).

Figure 15.
Analysis of the spatial correlation between men’s emotions and urban spaces plane and the spatial correlation between men’s emotions and urban spaces.
4. Discussion
This study constructed a framework for quantifying the spatial effects on residents and feeding the results back into the evaluation of spatial design solutions. The framework covered four dimensions of spatial effects on residents and clarified the emotions of multiple groups of people towards the space. Compared to questionnaires and interviews, the emotions recorded by photographing people in their natural state are more realistic. In the design process, compared with the purely qualitative approach of designers, adding quantitative data to support the basis of the design results will be more able to capture the hearts of residents. Furthermore, quantitative research results enable designers to design in a precise path and have clearer design goals in the design process, thus reducing time and labor costs.
The research site selected above in this study comprised waterfront space, commercial plaza space, park space, historical and cultural display space, and other space types, so the results of this research study could be extensively expanded to the spatial design of the city and evaluated for the spatial design results. In this paper, the Xueye Lake space design project in Jinan, which had a well-defined design strategy, was selected as a tested sample.
4.1. Evaluation of the Current Space and the Design of the Post-Design Space
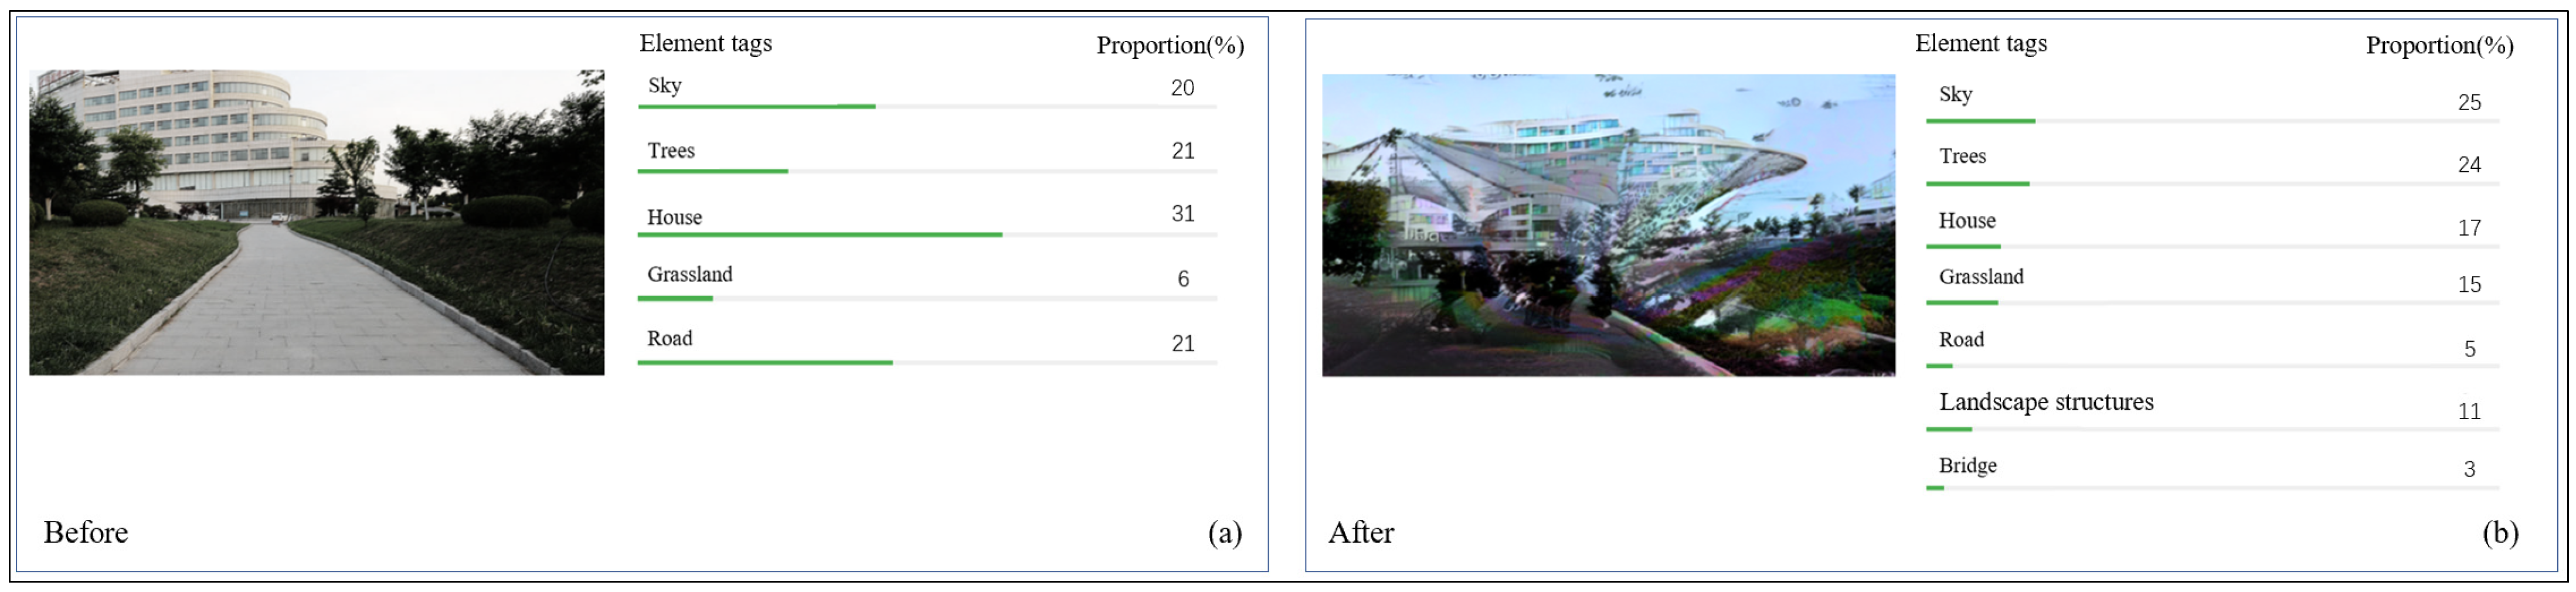
In an endeavor to exploit the urban space intelligent emotion evaluation model to its fullest potential in practical research, our investigation centered on Jinan’s Xueye Lake waterfront public space—a venue crafted to attract and engage young city inhabitants (Figure 16 and Figure 17). By assessing the model’s feasibility and applicability, we aimed to demonstrate its potency.

Figure 16.
(a) Analysis of the elements of Space 1 before design; (b) Analysis of the elements of Space 1 after design.
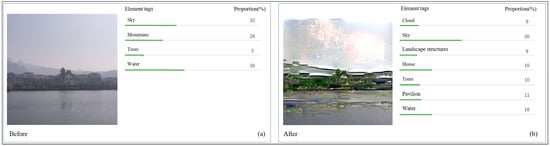
Figure 17.
(a) Analysis of the elements of Space 2 before design; (b) Analysis of the elements of Space 2 after design.
To compare the attraction of spaces to young people before and after the design, the nonparametric test and standard deviation of difference test were used to assess the value of the effect of spaces in this study. The nonparametric test of two independent samples is a method of analyzing two sets of independent samples to infer whether there is a significant difference between the distributions, etc., of the two aggregates from which the samples are drawn [71]. The most widely used measures of dispersion are the standard deviation (SD) [72,73]. In our study, the nonparametric test applied to calculate whether the pre- and post-design scenarios were characterized by significance with relation to the expected scenario. Subsequently, the difference standard deviation mean tests were utilized to test the difference between the before and after design scenarios and the expected scenario by using an online statistical tool (SPSSAU 23.0) [74].
The results of the nonparametric test indicate that the before (p = 0.255) and after (p = 0.441) design scenarios of Space 1 and the before (p = 0.255) and after (p = 0.427) design scenarios of Space 2 were significantly different from the expected scheme (Table 6 and Table 7). As shown in Table 6, the standard deviation of the difference between the design option (SD value = 0.103) and the desired option for Space 1 was lower than its current option (SD value = 0.129). Similarly, the standard deviation of the difference between the design option (SD value = 0.046) and the desired option for Space 2 was lower than its present scenario (SD value = 0.101) (Table 7). The results demonstrated that the design options for Space 1 and Space 2 had a higher likelihood of eliciting positive emotions of young people, implying that the reimagined urban environment garners a more affirmative reception from the youthful demographic, thereby validating the efficacy of our design approach.
Table 6.
The nonparametric test and standard deviation of difference test for pre- and post-design Space 1.
Table 7.
The nonparametric test and standard deviation of difference test for pre- and post-design Space 2.
Difference standard deviation tests were mainly utilized in this article to test the similarity between the types and proportions of spatial elements before and after the design and the types and proportions of spatial elements favored by the young people, so as to verify that the post-designed design is better matched to the types and proportions of spatial elements favored by the young people than the pre-designed space. In future optimization, designers are encouraged to add more spatial elements that the youth appreciate, such as waterfront space, seating, and walking paths in Space 1, and elements such as a water landscape in Space 2, which is attractive to a wider range of youth to the tour.
4.2. Limitations
Urban space design elements are manifold, and urban spaces exist within three-dimensional spaces. Some space elements, such as natural elements, are in constant flux. Design elements encompass inherent characteristics, like sound, dynamics, material, form, lines, textures, and colors, which are employed to transform spaces and generate unique experiences during the design process. We will expand on the multivariate relationships, such as more various elements of architectural forms, in future studies [57]. Emotions result from the integration of various cognitive levels, including perception, thinking, memory, judgment, and consciousness. Although this study employs facial expression emotion research methods, exploring emotions through physiological and biochemical measurements, as mentioned by C. Izard and M. Lewis in their emotion component models, would render the study model more valuable and accurate. Due to time and manpower constraints, we collected 470 residents samples as quantitative data for resident structure and emotions. A model generated from a more extensive dataset would possess greater reference value and stability, and the expansion of space application types awaits future exploration.
5. Conclusions
Urban spaces have a significant impact on enabling direct interactions between residents and their cities. As such, urban designers have increasingly turned their attention to urban space design, with a focus on meeting the needs of city dwellers and enhancing their quality of life. The present study employs empirical research methods to classify the types and elements of on-site shooting images, while also leveraging the SPE model to capture resident emotions and explore the relationship between residents and urban space elements. By doing so, the study lays the foundation for urban space design and the preliminary construction of an intelligent design evaluation model that can be widely applied, replicated, and iterated in actual urban space design and creation.
The findings of this study can be distinguished into five points. First, the study established the SPE model of residents, urban spaces, and emotions by employing on-site research, analysis, and mapping of the element composition and proportion rules of the Yangpu Riverside public space demonstration section. The study utilized space elements, type classification, and the capture of residents’ emotions to establish a foundation for future space design research. Second, it empirically explored the relationship among urban space elements and residents’ preferences and emotions. The results indicate that a well-defined urban space design strategy can assist governments in attracting specific groups and establishing better communication with residents. Third, this study investigated the gap in quantitative research on urban space elements and discovered that the eye-level visual range constitutes urban space elements through a literature review and the research conducted in the Yangpu area. The study applied this research to the design of urban spaces and found that the design of urban space elements based on the eye-level visual range is still in its infancy and has practical demand. Fourth, this study identified a gap in the quantitative research on emotion types and intensity changes based on facial recognition research and further explored the specific causes and touchpoints of emotional changes in existing urban spaces. The results indicate that facial recognition-based emotion quantification and design applications in actual urban space design are still in their infancy, and there is practical demand for further exploration. Fifth, this study developed a model that demonstrates the interaction among city space design and residents’ structures and emotional effect through the use of intelligent tools. The results reveal that the design platform can intelligently identify space element information in both the Yangpu Riverside and Xueye Lake public spaces, but their demands and tendencies differ. The study provides a valuable reference for future space design research.
Author Contributions
Conceptualization, Z.W.; methodology, Z.W. and Z.Z.; software, Z.Z.; data curation, W.D.; writing—original draft preparation, Z.Z. and S.Z.; writing—review and editing, S.Z. and M.W.; visualization, Y.Z.; supervision, Z.W. and S.Z.; project administration, Z.W. and W.G. All authors have read and agreed to the published version of the manuscript.
Funding
This research received no external funding.
Data Availability Statement
The data presented in this study are available on request from the corresponding author. The data are not publicly available due to privacy restrictions.
Acknowledgments
The authors would like to thank the associate editor and the anonymous reviewers for their valuable comments and constructive suggestions.
Conflicts of Interest
The authors declare no conflict of interest.
References
- Wang, D.; Hua, Q.; Dai, G. Research on user-centered scene design method. Chin. J. Comput. 2005, 28, 5. [Google Scholar]
- Gehl, J. Life between Buildings; Island Press: Washington, DC, USA, 2011. [Google Scholar]
- Sánchez-Vaquerizo, J.A.; Llach, D.C. The Social Life of Small Urban Spaces 2.0. In Proceedings of the International Conference on Computer-Aided Architectural Design Futures, Daejeon, Republic of Korea, 26–28 June 2019; pp. 295–310. [Google Scholar]
- Hou, J.; Chen, L.; Zhang, E.; Jia, H.; Long, Y. Quantifying the usage of small public spaces using deep convolutional neural network. PLoS ONE 2020, 15, e0239390. [Google Scholar] [CrossRef] [PubMed]
- Frank, L.D.; Engelke, P.O. The built environment and human activity patterns: Exploring the impacts of urban form on public health. J. Plan. Lit. 2001, 16, 202–218. [Google Scholar] [CrossRef]
- Hong, J.Y.; Jeon, J.Y. Influence of urban contexts on soundscape perceptions: A structural equation modeling approach. Landsc. Urban Plan. 2015, 141, 78–87. [Google Scholar] [CrossRef]
- Ulrich, R.S. Visual landscapes and psychological well-being. Landsc. Res. 1979, 4, 17–23. [Google Scholar] [CrossRef]
- Ji, H.; Qing, L.; Han, L.; Wang, Z.; Cheng, Y.; Peng, Y. A new data-enabled intelligence framework for evaluating urban space perception. ISPRS Int. J. Geo-Inf. 2021, 10, 400. [Google Scholar] [CrossRef]
- Paköz, M.Z.; Işık, M. Rethinking urban density, vitality and healthy environment in the post-pandemic city: The case of Istanbul. Cities 2022, 124, 103598. [Google Scholar] [CrossRef]
- Niu, T.; Qing, L.; Han, L.; Long, Y.; Hou, J.; Li, L.; Tang, W.; Teng, Q.J. Small public space vitality analysis and evaluation based on human trajectory modeling using video data. Build. Environ. 2022, 225, 109563. [Google Scholar] [CrossRef]
- Kellert, S.R.; Wilson, E.O. The Biophilia Hypothesis; Island Press: Washington, DC, USA, 1995. [Google Scholar]
- Rachel, K.; Stephen, K. The Experience of Nature: A Psychological Perspective; Cambridge University Press: Cambridge, MA, USA, 1989. [Google Scholar]
- Ulrich, R.S.; Simons, R.F.; Losito, B.D.; Fiorito, E.; Miles, M.A.; Zelson, M. Stress recovery during exposure to natural and urban environments. J. Environ. Psychol. 1991, 11, 201–230. [Google Scholar] [CrossRef]
- Nutsford, D.; Pearson, A.L.; Kingham, S.J. An ecological study investigating the association between access to urban green space and mental health. Public Health 2013, 127, 1005–1011. [Google Scholar] [CrossRef]
- Derkzen, M.L.; van Teeffelen, A.J.; Verburg, P.H. Quantifying urban ecosystem services based on high-resolution data of urban green space: An assessment for Rotterdam, the Netherlands. J. Appl. Ecol. 2015, 52, 1020–1032. [Google Scholar] [CrossRef]
- Souter-Brown, G.; Hinckson, E.; Duncan, S. Effects of a sensory garden on workplace wellbeing: A randomised control trial. Landsc. Urban Plan. 2021, 207, 103997. [Google Scholar] [CrossRef]
- Bengio, Y.; Delalleau, O. On the expressive power of deep architectures. In Proceedings of the Algorithmic Learning Theory: 22nd International Conference, ALT 2011, Espoo, Finland, 5–7 October 2011; pp. 18–36. [Google Scholar]
- Sun, Z.; Xue, L.; Xu, Y.; Wang, Z. Overview of deep learning research. Appl. Res. Comput. 2012, 29, 2806–2810. [Google Scholar]
- Wu, Q.; Liu, Y.; Li, Q.; Jin, S.; Li, F. The application of deep learning in computer vision. In Proceedings of the 2017 Chinese Automation Congress (CAC), Jinan, China, 20–22 October 2017; pp. 6522–6527. [Google Scholar]
- He, K.; Zhang, X.; Ren, S.; Sun, J. Deep residual learning for image recognition. In Proceedings of the Proceedings of the IEEE Conference on Computer Vision and Pattern Recognition, Las Vegas, NV, USA, 27–30 June 2016; pp. 770–778. [Google Scholar]
- Xu, Q.; Yao, L.; Jiang, Z.; Jiang, G.; Chu, W.; Han, W.; Zhang, W.; Wang, C.; Tai, Y. Dirl: Domain-invariant representation learning for generalizable semantic segmentation. Proc. AAAI Conf. Artif. Intell. 2022, 36, 2884–2892. [Google Scholar] [CrossRef]
- Jiang, Z.; Liu, Y.; Yang, C.; Liu, J.; Gao, P.; Zhang, Q.; Xiang, S.; Pan, C. Learning where to focus for efficient video object detection. In Proceedings of the Computer Vision–ECCV 2020: 16th European Conference, Glasgow, UK, 23–28 August 2020; Proceedings, Part XVI 16, 2020. pp. 18–34. [Google Scholar]
- Zhao, H.; Shi, J.; Qi, X.; Wang, X.; Jia, J. Pyramid scene parsing network. In Proceedings of the IEEE Conference on Computer Vision and Pattern Recognition, Honolulu, HI, USA, 21–26 July 2017; pp. 2881–2890. [Google Scholar]
- Cordts, M.; Omran, M.; Ramos, S.; Rehfeld, T.; Enzweiler, M.; Benenson, R.; Franke, U.; Roth, S.; Schiele, B. The cityscapes dataset for semantic urban scene understanding. In Proceedings of the IEEE Conference on Computer Vision and Pattern Recognition, Las Vegas, NV, USA, 27–30 June 2016; pp. 3213–3223. [Google Scholar]
- Jiang, Z.; Li, Y.; Yang, C.; Gao, P.; Wang, Y.; Tai, Y.; Wang, C. Prototypical contrast adaptation for domain adaptive semantic segmentation. In Proceedings of the European Conference on Computer Vision, Tel Aviv, Israel, 23–27 October 2022; pp. 36–54. [Google Scholar]
- Turk, M.A.; Pentland, A.P. Face recognition using eigenfaces. In Proceedings of the 1991 IEEE Computer Society Conference on Computer Vision and Pattern Recognition, Maui, HI, USA, 3–6 June 1991; pp. 586–591. [Google Scholar]
- Xiong, Y.; Liu, W.; Zhao, D.; Tang, X. Face recognition via archetype hull ranking. In Proceedings of the IEEE International Conference on Computer Vision, Sydney, Australia, 1–8 December 2013; pp. 585–592. [Google Scholar]
- Wang, Z.; Huang, B.; Wang, G.; Yi, P.; Jiang, K. Masked face recognition dataset and application. IEEE Trans. Biom. Behav. Identit Sci. 2023, 5, 298–304. [Google Scholar] [CrossRef]
- Wang, H.; Wang, Y.; Zhou, Z.; Ji, X.; Gong, D.; Zhou, J.; Li, Z.; Liu, W. Cosface: Large margin cosine loss for deep face recognition. In Proceedings of the IEEE Conference on Computer Vision and Pattern Recognition, Salt Lake City, UT, USA, 18–22 June 2018; pp. 5265–5274. [Google Scholar]
- Cross, N. Descriptive models of creative design: Application to an example. Des. Stud. 1997, 18, 427–440. [Google Scholar] [CrossRef]
- Naik, N.; Kominers, S.D.; Raskar, R.; Glaeser, E.L.; Hidalgo, C.A. Computer vision uncovers predictors of physical urban change. Proc. Natl. Acad. Sci. USA 2017, 114, 7571–7576. [Google Scholar] [CrossRef]
- Naik, N.; Philipoom, J.; Raskar, R.; Hidalgo, C. Streetscore-predicting the perceived safety of one million streetscapes. In Proceedings of the IEEE Conference on Computer Vision and Pattern Recognition Workshops, Columbus, OH, USA, 23–28 June 2014; pp. 779–785. [Google Scholar]
- Naik, N.; Raskar, R.; Hidalgo, C.A. Cities are physical too: Using computer vision to measure the quality and impact of urban appearance. Am. Econ. Rev. 2016, 106, 128–132. [Google Scholar] [CrossRef]
- Seiferling, I.; Naik, N.; Ratti, C.; Proulx, R.J. Green streets—Quantifying and mapping urban trees with street-level imagery and computer vision. Landsc. Urban Plan. 2017, 165, 93–101. [Google Scholar] [CrossRef]
- Liu, L.; Silva, E.A.; Wu, C.; Wang, H. A machine learning-based method for the large-scale evaluation of the qualities of the urban environment. Comput. Environ. Urban Syst. 2017, 65, 113–125. [Google Scholar] [CrossRef]
- Yao, Y.; Liang, Z.; Yuan, Z.; Liu, P.; Bie, Y.; Zhang, J.; Wang, R.; Wang, J.; Guan, Q. A human-machine adversarial scoring framework for urban perception assessment using street-view images. Int. J. Geogr. Inf. Sci. 2019, 33, 2363–2384. [Google Scholar] [CrossRef]
- Wang, Y.; Qiu, W.; Jiang, Q.; Li, W.; Ji, T.; Dong, L. Drivers or Pedestrians, Whose Dynamic Perceptions Are More Effective to Explain Street Vitality? A Case Study in Guangzhou. Remote Sens. 2023, 15, 568. [Google Scholar] [CrossRef]
- Huang, Y.; Li, J.; Wu, G.; Fei, T. Quantifying the bias in place emotion extracted from photos on social networking sites: A case study on a university campus. Cities 2020, 102, 102719. [Google Scholar] [CrossRef]
- Xing, J.; Ai, H.; Liu, L.; Lao, S. Robust crowd counting using detection flow. In Proceedings of the 2011 18th IEEE International Conference on Image Processing, Brussels, Belgium, 11–14 September 2011; pp. 2061–2064. [Google Scholar]
- Celik, H.; Hanjalic, A.; Hendriks, E.A. Towards a robust solution to people counting. In Proceedings of the 2006 International Conference on Image Processing, Las Vegas, NV, USA, 26–29 June 2006; pp. 2401–2404. [Google Scholar]
- Wu, Z.; Wang, Y.; Gan, W.; Zou, Y.; Dong, W.; Zhou, S.; Wang, M. A Survey of the Landscape Visibility Analysis Tools and Technical Improvements. Int. J. Environ. Res. Public Health 2023, 20, 1788. [Google Scholar] [CrossRef] [PubMed]
- Marin, J.; De Meulder, B. Urban landscape design exercises in urban metabolism: Reconnecting with Central Limburg’s regenerative resource landscape. J. Landsc. Archit. 2018, 13, 36–49. [Google Scholar] [CrossRef]
- Ingaramo, R.; Voghera, A. Topics and Methods for Urban and Landscape Design; Springer: Berlin/Heidelberg, Germany, 2016. [Google Scholar]
- Zou, M.; Zhang, H. Cooling strategies for thermal comfort in cities: A review of key methods in landscape design. Environ. Sci. Pollut. Res. 2021, 28, 62640–62650. [Google Scholar] [CrossRef]
- Liu, M.; Nijhuis, S. Mapping landscape spaces: Methods for understanding spatial-visual characteristics in landscape design. Environ. Impact Assess. Rev. 2020, 82, 106376. [Google Scholar] [CrossRef]
- Mahmoud, A.H.; Omar, R.H. Planting design for urban parks: Space syntax as a landscape design assessment tool. Front. Archit. Res. 2015, 4, 35–45. [Google Scholar] [CrossRef]
- He, M.; Wang, Y.; Wang, W.J.; Xie, Z. Therapeutic plant landscape design of urban forest parks based on the Five Senses Theory: A case study of Stanley Park in Canada. Int. J. Geoheritage Park. 2022, 10, 97–112. [Google Scholar] [CrossRef]
- Burtan, D.; Joyce, K.; Burn, J.; Handy, T.; Ho, S.; Leonards, U. The nature effect in motion: Visual exposure to environmental scenes impacts cognitive load and human gait kinematics. R. Soc. Open Sci. 2021, 8, 201100. [Google Scholar] [CrossRef]
- Jacobs, J. The Death and Life of Great American Cities; Vintage: New York, NY, USA, 2016. [Google Scholar]
- Montgomery, J. Editorial urban vitality and the culture of cities. Plan. Pract. Res. 1995, 10, 101–110. [Google Scholar] [CrossRef]
- Gebru, T.; Krause, J.; Wang, Y.; Chen, D.; Deng, J.; Aiden, E.L.; Li, F.-F. Using deep learning and Google Street View to estimate the demographic makeup of neighborhoods across the United States. Proc. Natl. Acad. Sci. USA 2017, 114, 13108–13113. [Google Scholar] [CrossRef] [PubMed]
- Li, X.; Ratti, C.; Seiferling, I. Quantifying the shade provision of street trees in urban landscape: A case study in Boston, USA, using Google Street View. Landsc. Urban Plan. 2018, 169, 81–91. [Google Scholar] [CrossRef]
- Dubey, A.; Naik, N.; Parikh, D.; Raskar, R.; Hidalgo, C.A. Deep learning the city: Quantifying urban perception at a global scale. In Proceedings of the Computer Vision–ECCV 2016: 14th European Conference, Amsterdam, The Netherlands, 11–14 October 2016; Proceedings, Part I 14, 2026. pp. 196–212. [Google Scholar]
- Zhang, F.; Hu, M.; Che, W.; Lin, H.; Fang, C. Framework for virtual cognitive experiment in virtual geographic environments. ISPRS Int. J. Geo-Inf. 2018, 7, 36. [Google Scholar] [CrossRef]
- Salesses, P.; Schechtner, K.; Hidalgo, C.A. The collaborative image of the city: Mapping the inequality of urban perception. PLoS ONE 2013, 8, e68400. [Google Scholar] [CrossRef]
- Zhang, F.; Zhou, B.; Liu, L.; Liu, Y.; Fung, H.H.; Lin, H.; Ratti, C. Measuring human perceptions of a large-scale urban region using machine learning. Landsc. Urban Plan. 2018, 180, 148–160. [Google Scholar] [CrossRef]
- Zhou, S.; Liu, Z.; Wang, M.; Gan, W.; Zhao, Z.; Wu, Z. Impacts of building configurations on urban stormwater management at a block scale using XGBoost. Cities Soc. 2022, 87, 104235. [Google Scholar] [CrossRef]
- Neto, O.A.; Jeong, S.; Munakata, J.; Yoshida, Y.; Ogawa, T.; Yamamura, S. Physical Element Effects in Public Space Attendance. J. Asian Archit. Build. Eng. 2016, 15, 479–485. [Google Scholar] [CrossRef]
- Hao, S.; Zhou, Y.; Guo, Y. A brief survey on semantic segmentation with deep learning. Neurocomputing 2020, 406, 302–321. [Google Scholar] [CrossRef]
- Rwanga, S.S.; Ndambuki, J.M. Accuracy assessment of land use/land cover classification using remote sensing and GIS. Int. J. Geosci. 2017, 8, 611. [Google Scholar] [CrossRef]
- Ullah, M.; Li, J.; Wadood, B. Analysis of urban expansion and its impacts on land surface temperature and vegetation using RS and GIS, a case study in Xi’an City, China. Earth Syst. Environ. 2020, 4, 583–597. [Google Scholar] [CrossRef]
- Zhang, Z.; Liu, F.; Zhao, X.; Wang, X.; Shi, L.; Xu, J.; Yu, S.; Wen, Q.; Zuo, L.; Yi, L. Urban expansion in China based on remote sensing technology: A review. Chin. Geogr. Sci. 2018, 28, 727–743. [Google Scholar] [CrossRef]
- Komuro, N.; Hashiguchi, T.; Hirai, K.; Ichikawa, M. Predicting individual emotion from perception-based non-contact sensor big data. Sci. Rep. 2021, 11, 2317. [Google Scholar] [CrossRef] [PubMed]
- Wang, W.-C. The effect of adaptive music playing system on emotion regulation. J. Acoust. Soc. Am. 2016, 140, 3380. [Google Scholar] [CrossRef]
- Aalbers, S.; Spreen, M.; Pattiselanno, K.; Verboon, P.; Vink, A.; van Hooren, S. Efficacy of emotion-regulating improvisational music therapy to reduce depressive symptoms in young adult students: A multiple-case study design. Arts Psychother. 2020, 71, 101720. [Google Scholar] [CrossRef]
- Okada, G.; Yonezawa, T.; Kurita, K.; Tsumura, N. Monitoring emotion by remote measurement of physiological signals using an RGB camera. ITE Trans. Media Technol. Appl. 2018, 6, 131–137. [Google Scholar] [CrossRef]
- Giannakakis, G.; Pediaditis, M.; Manousos, D.; Kazantzaki, E.; Chiarugi, F.; Simos, P.G.; Marias, K.; Tsiknakis, M. Stress and anxiety detection using facial cues from videos. Biomed. Signal Process. Control 2017, 31, 89–101. [Google Scholar] [CrossRef]
- De la Torre Frade, F.; Chu, W.-S.; Xiong, X.; Carrasco, F.V.; Ding, X.; Cohn, J. Intraface. In Proceedings of the Automatic Face and Gesture Recognition, Ljubljana, Slovenia, 4–8 May 2015. [Google Scholar]
- Hu, S.; Sun, J.; Zhang, J.; Liu, G.; Zhao, S. Thermoacoustic environment comfort evaluation method based on facial micro-expression recognition. Build. Environ. 2022, 221, 109263. [Google Scholar] [CrossRef]
- Mirzargar, M.; Whitaker, R.T.; Kirby, R.M. Curve Boxplot: Generalization of Boxplot for Ensembles of Curves. IEEE Trans. Vis. Comput. Graph. 2014, 20, 2654–2663. [Google Scholar] [CrossRef]
- Beran, R.; Bilodeau, M.; de Micheaux, P.L. Nonparametric tests of independence between random vectors. J. Multivar. Anal. 2007, 98, 1805–1824. [Google Scholar] [CrossRef]
- Livingston, E.H. The mean and standard deviation: What does it all mean? J. Surg. Res. 2004, 119, 117–123. [Google Scholar] [CrossRef] [PubMed]
- Kao, L.S.; Green, C.E. Analysis of variance: Is there a difference in means and what does it mean? J. Surg. Res. 2008, 144, 158–170. [Google Scholar] [CrossRef] [PubMed]
- Available online: https://www.spssau.com (accessed on 27 August 2023).

Disclaimer/Publisher’s Note: The statements, opinions and data contained in all publications are solely those of the individual author(s) and contributor(s) and not of MDPI and/or the editor(s). MDPI and/or the editor(s) disclaim responsibility for any injury to people or property resulting from any ideas, methods, instructions or products referred to in the content. |
© 2023 by the authors. Licensee MDPI, Basel, Switzerland. This article is an open access article distributed under the terms and conditions of the Creative Commons Attribution (CC BY) license (https://creativecommons.org/licenses/by/4.0/).