Article

Carbon Sink Trends in the Karst Regions of Southwest China: Impacts of Ecological Restoration and Climate Change

1
Nanjing Institute of Environmental Sciences, MEE, Nanjing 210042, China
2
School of Geography, Nanjing Normal University, Nanjing 210023, China
*
Authors to whom correspondence should be addressed.
These authors contributed equally to this work.
Land 2023, 12(10), 1906; https://doi.org/10.3390/land12101906
Submission received: 16 August 2023 / Revised: 24 September 2023 / Accepted: 4 October 2023 / Published: 10 October 2023
(This article belongs to the Topic Karst Environment and Global Change)

Abstract

:
Southwest China (SWC) holds the distinction of being the world’s largest rock desertification area. Nevertheless, the impacts of climate change and ecological restoration projects on the carbon sinks in the karst area of Southwest China have not been systematically evaluated. In this study, we calculated carbon sinks by utilizing the Carnegie–Ames–Stanford Approach (CASA) model, and the actual measurements, including the net primary productivity (NPP) data and soil respiration (Rs,) were calculated to obtain carbon sink data. Our findings suggest that the carbon sinks in the karst areas are displaying increasing trends or positive reversals, accounting for 58.47% of the area, which is larger than the overall average of 45.08% for Southwest China. This suggests that the karst areas have a greater carbon sequestration potential. However, approximately 10.42% of carbon sinks experience negative reversals. The regions with increasing and positive reversals are primarily located in the western parts of Guizhou and Guangxi, while negative reversals are observed in the eastern parts of Chongqing, Guangxi, and Guizhou. Ecological restoration projects are the main driving factors for the carbon sinks with increasing trends. Increased humidity and ecological restoration management are the main reasons for the positive reversals of carbon sinks. However, warming and drought shift the carbon sinks from increasing to decreasing in Chongqing, east of Guangxi and Guizhou. The findings of this study highlight the significant role of ecological restoration projects and reexamine the impact of climate change on carbon sequestration.

1. Introduction

Carbon sequestration refers to the process of taking measures, such as afforestation and vegetation restoration, to absorb atmospheric carbon dioxide (CO2), thereby reducing greenhouse gas concentrations [1,2,3,4,5]. Rocky desertification in the karst areas is an important factor for identifying missing carbon sinks [6,7]. Previous studies have estimated the carbon storage in the karst areas through biomass and soil carbon storage surveys, flux tower observations, and remote sensing models. They concluded that the dissolution of carbonate rocks prevents the stable absorption of atmospheric CO2, leading to carbon release into the water and turning the region into a carbon source [6,8,9,10]. Consequently, uncertainty persists in assessing carbon sinks in the karst regions, necessitating further research into estimation methods. Drawing on research findings in the fields of net primary productivity (NPP), soil respiration (Rs), and heterotrophic respiration (Rh) [10,11,12], this study estimated carbon sinks for the period 1982–2019, offering a reference for scientifically assessing China’s ecosystem carbon sequestration capacity and devising strategies to address climate change.
Research has shown that the terrestrial carbon sink dynamics primarily result from climate change and ecological restoration projects [13,14,15]. The interactions between climate change and anthropogenic factors (i.e., ecological restoration projects) complicate the evolution of the carbon sink in the karst ecosystems [3]. Ecological restoration projects, for instance, large-scale afforestation and the Grain to Green project, have a comprehensive management impact on combating rocky desertification. They can substantially enhance carbon sinks or even reverse the decreasing trend, leading to a positive reversal of carbon sinks [16]. Furthermore, urbanization and economic development relieve ecological pressure and facilitate natural vegetation restoration, thus enhancing carbon sinks [17]. However, extreme climate change (heat and drought), complex geomorphic types, special soluble carbonate geological backgrounds, and soil nutrient and water limitations, have shifted the carbon sink trend from increasing to decreasing (negative reversal) [18,19,20]. This poses a great challenge in achieving carbon neutralization [16,21,22]. Moreover, a precise and systematic evaluation of carbon sinks before and after breakpoints in the karst regions of Southwest China has yet to be undertaken [17,23]. The piecewise linear method (PLM) can detect a potential breakpoint of the terrestrial ecosystem [24,25,26].
In recent decades, rapid local urbanization and industrialization, coupled with climate change and other human activities, have exerted detrimental impacts on ecosystem function, such as natural resource depletion, landscape destruction, environmental pollution, and human property risks [6,27]. Local farmers engage in activities like steep slope reclamation, overgrazing, deforestation, fires, and firewood collection as a means of livelihood. These activities result in vegetation destruction and a decrease in carbon sinks [28]. Against this backdrop, a range of ecological restoration projects have been put into action, including forest closure, artificial afforestation, the Grain to Green Project, and soil and water conservation [1]. The vegetation restoration process is a dynamic and ascending carbon sink process, and long-term ecological restoration projects will undoubtedly yield a huge carbon sink effect [8]. Climate change and CO2 fertilization effects may affect carbon sinks [9,29,30]. There is compelling evidence demonstrating that the rise in atmospheric CO2 concentration has enhanced carbon sinks recently [30,31,32]. Additionally, both soil drought and atmospheric drought can reduce the uptake of carbon plants and carbon sinks [33,34,35]. However, the relative importance of the driving factors before and after the breakpoint in the carbon sinks in the karst areas of Southwest China is unclear. The residual trends method (RESTREND) has extensive application in elucidating the relative contributions of driving factors to carbon sinks. This method offers valuable scientific references for carbon sink enhancement and restoration in fragile ecosystems [36,37,38].
In this study, we calculated the carbon sink data and examined the nonlinear trends of the carbon sinks, along with their driving factors in both the karst regions and the entirety of Southwest China. This study aims to conduct a comprehensive assessment of how climate change and ecological restoration projects impact carbon sinks in the karst regions of Southwest China, with a primary focus on gaining insights into the nonlinear trends and driving factors involved.

2. Materials and Methods
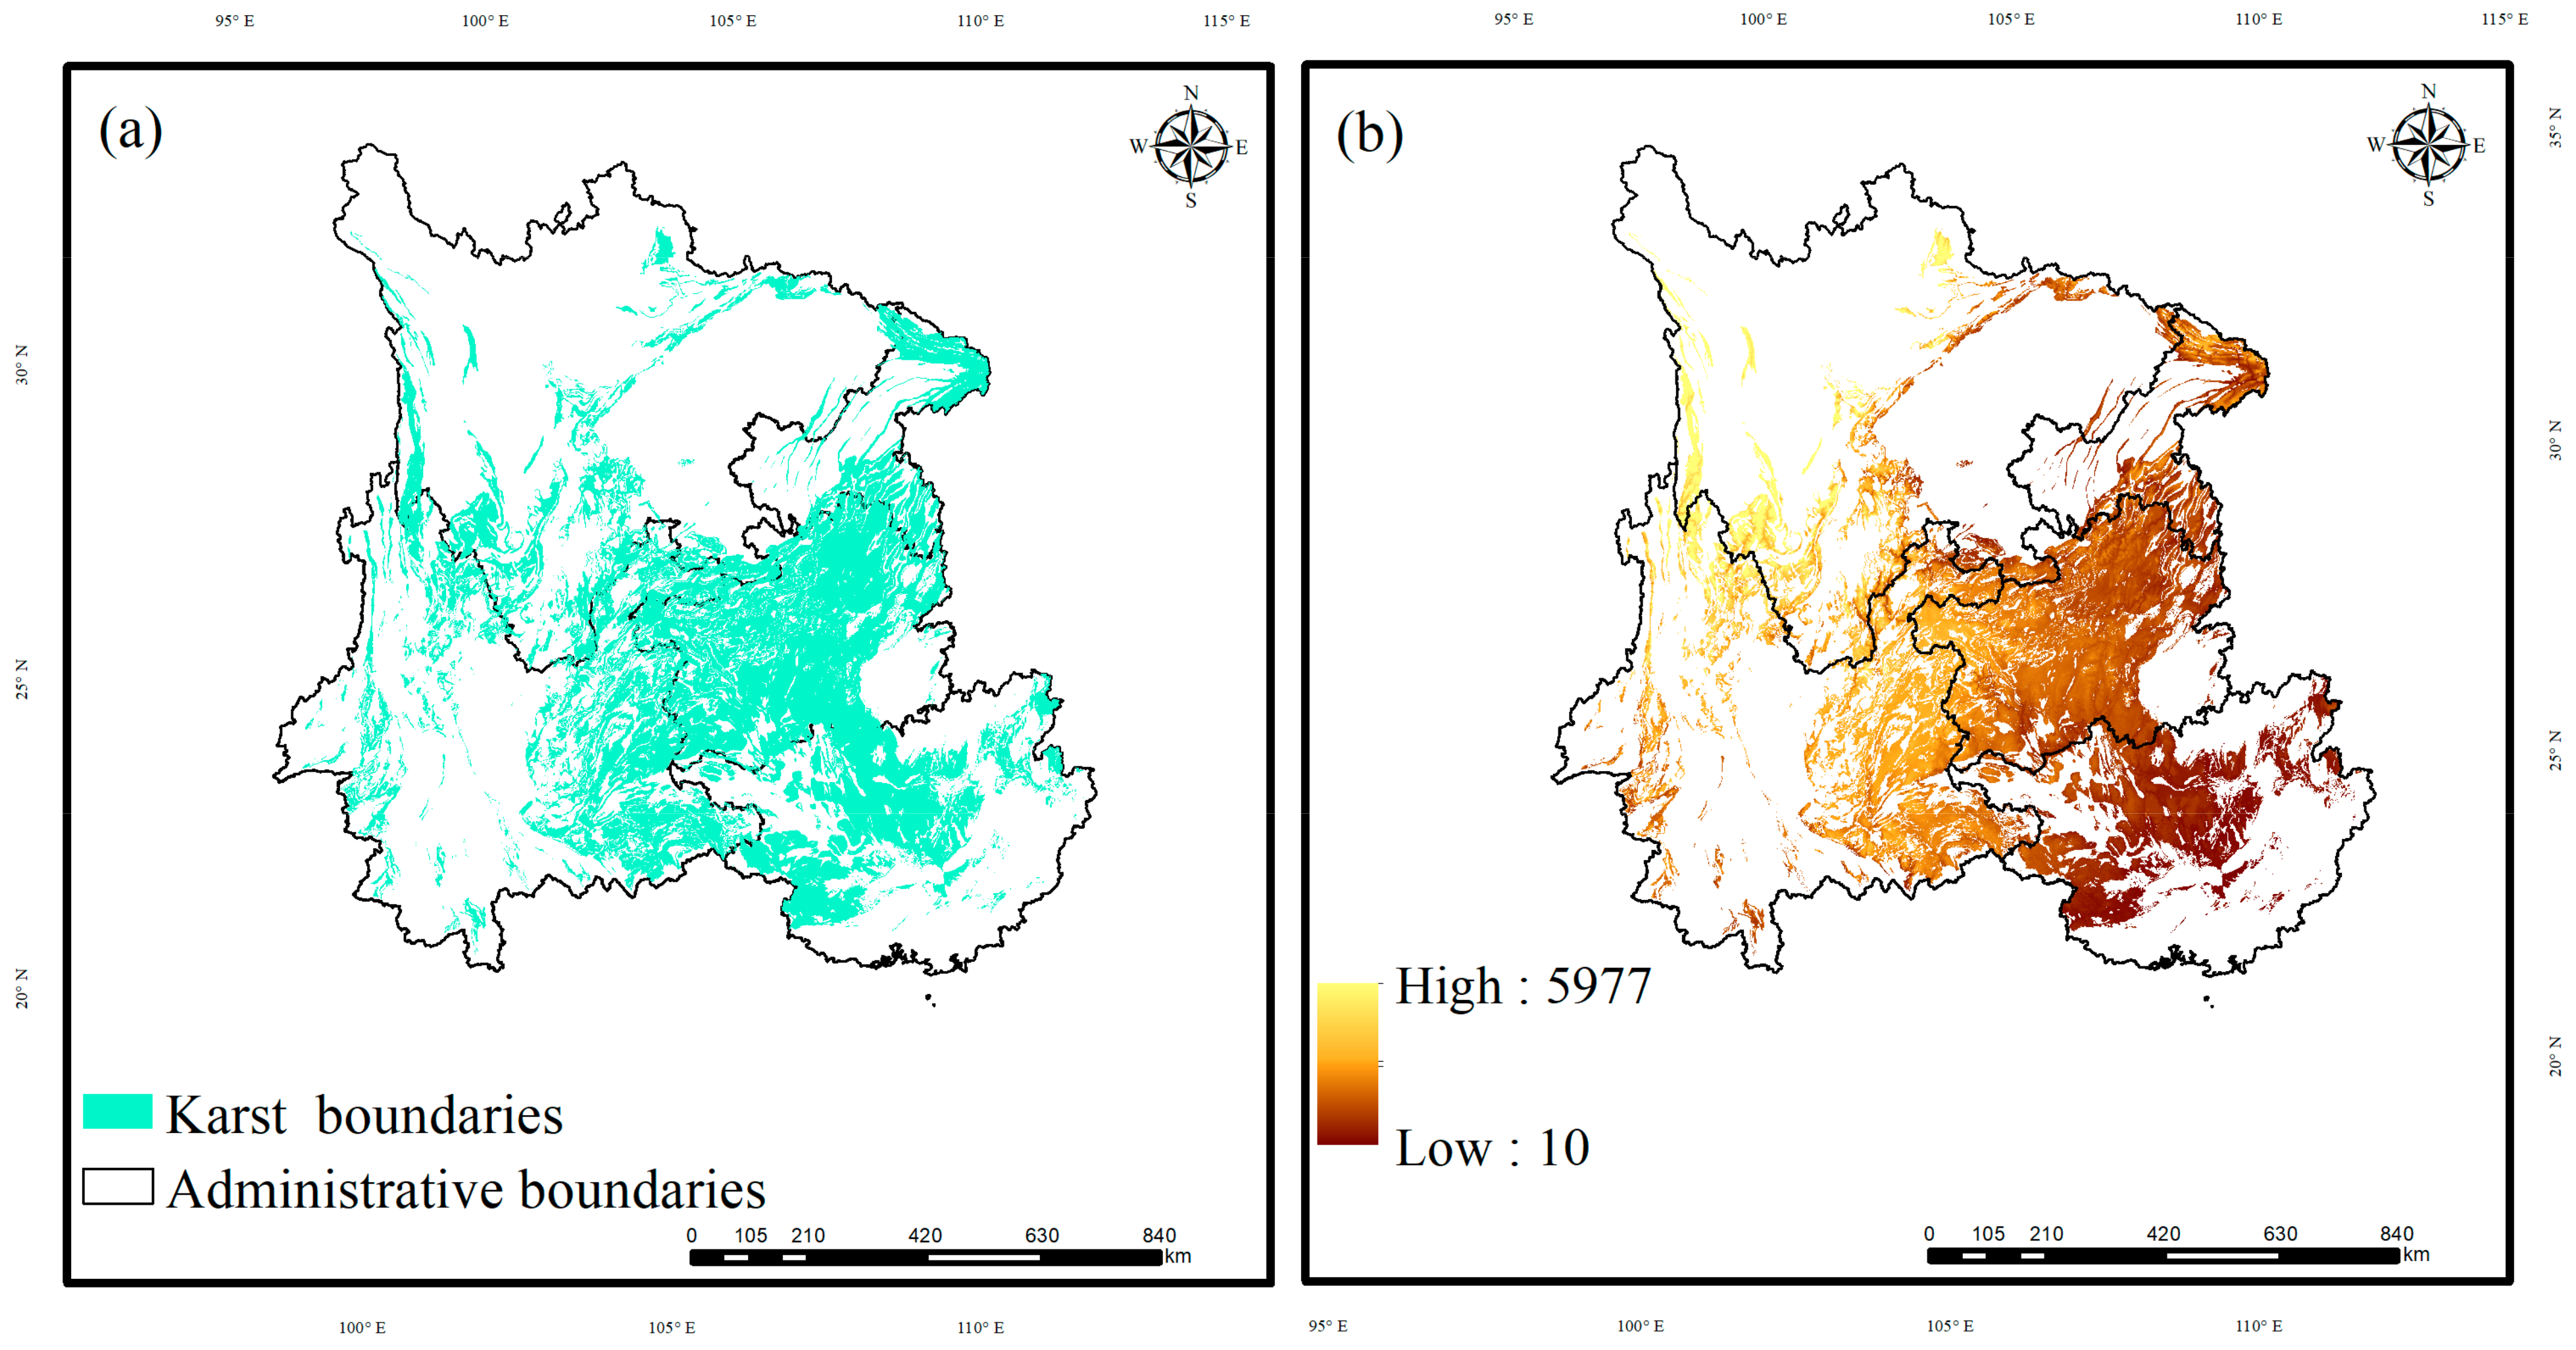
2.1. Study Area

Karst rocky desertification is mainly concentrated in Yunnan, Guizhou, Sichuan, Chongqing, and Guangxi in Southwest China (SWC) (Figure 1a). It is the region with the most concentrated karst distribution in China [27]. The distribution area of exposed carbonate rocks is about 55 × 104 km2, including 14 × 104 km2 of rocky desertification land and 13 × 104 km2 of potential rocky desertification land, both accounting for about 46.04% of the total exposed carbonate rock area [39]. The karst region in Southwest China (KRSWC) has a special geological background, strong landscape heterogeneity, strong karst effect, and a small ecological environmental capacity (Figure 1b). However, due to the large population, the sharp contradiction between humans and land has led to increasingly serious vegetation destruction and soil erosion, resulting in a very serious phenomenon of rocky desertification, which is constantly expanding, hindering the increase in carbon sinks and seriously restricting the sustainable development of the region [3]. Its unique geographical environment and human activities have caused difficulties and uncertainty in research on carbon sink trends and driving factors. The boundaries of the KRSWC can be obtained from the Karst Ecosystem Science Database (http://karst.isa.ac.cn:8081/home) (accessed on 16 June 2023).

2.2. Data Sources

The net ecosystem productivity (NEP) is net carbon sequestered by terrestrial ecosystems, an important indicator of ecosystem carbon sinks/sources [40]. When NEP > 0, the ecosystem serves as a carbon sink and absorbs CO2 from the atmosphere; when NEP < 0, the ecosystem serves as a carbon source and releases CO2 into the atmosphere [41]. The NEP is calculated as the remainder between net primary productivity (NPP) and heterotrophic respiration (Rh) [41]:
N E P ( x , t ) = N P P ( x , t ) R h ( x , t )
We first calculated NPP using the Carnegie–Ames–Stanford Approach (CASA) model as follows [42]:
N P P ( x , t ) = P A R ( x , t ) × ε ( x , t )
P A R ( x , t ) = R A D ( x , t ) × F P A R ( x , t ) × 0.5
F P A R ( x , t ) = N D V I ( x , t ) N D V I ( i , min ) N D V I ( i , max ) N D V I ( i , min ) × ( F P A R max F P A R min ) + F P A R min
ε ( x , t ) = ε m a x × T ε 1 ( x , t ) × T ε 2 ( x , t ) × W ε ( x , t )
where PAR is the photosynthetically active radiation (MJ·m−2); ε is the light use efficiency (gC·MJ−1); FPAR is the proportion of incident photosynthetically active radiation absorbed by plants; FPARmax and FPARmin are taken as 0.950 and 0.001, respectively; RAD is total solar radiation (MJ·m−2); TƐ1 and TƐ2 are the coefficients of temperature stress on ε at low and high temperatures, respectively; WƐ is the coefficient of water stress on ε; εmax is the theoretical maximum light use efficiency; x is the spatial location; t is the time; and NDVI(i, max) indicates the Normalized Difference Vegetation Index (NDVI) maximum among vegetation type i, which is the same as NDVI(i, min).
The Rh is related to soil respiration (Rs) and was estimated in the following equation [43]:
R h = 0.6163   R s 0.7198
According to the existing research results [44], Rs can be solved using the 0–20 cm soil carbon density, air temperature, and precipitation. We then estimated Rs as follows: [30].
R s = 1.55 e 0.031 T × P P + 0.68 × S O C S O C + 2.23
where T is the mean temperature (°C); P is the total precipitation (mm); and SOC is the soil carbon density (gC m−2 a−1) in the 0–20 cm surface layer.
After obtaining the NEP results, the values of the estimated NEP and the NEP fitting relationship of the non-participating training flux tower sites (https://fluxnet.org/) (accessed on 15 June 2022) were analyzed using the coefficient of determination (R2) and Root Mean Square Error (RMSE) as evaluation metrics to achieve a high degree of accuracy before being used. Finally, we obtained the long-time NEP series for 1981–2019 with a spatial resolution of 1/12°.
All datasets were remapped to a spatial resolution of 1/12°. Detailed information about the datasets is given in Table 1.

2.3. Piecewise Linear Method

We employed a piecewise linear method (PLM) to estimate the nonlinear trend of the carbon sinks, as follows [47]:
Y ( t ) = a 1 + b 1 t + ε , t T 1 a 2 + b 2 t + ε , t > T 1
where T1 is the breakpoint year and is estimated using the least residual sum-of-squares criterion; ε is the residual; a1 and a2 are the fitted intercept before and after the breakpoint, respectively; and b1 and b2 are the regression coefficients before and after the breakpoint, respectively. The significances of b1 and b2 are tested using the Mann–Kendall (M-K) test [47]. The significance of the breakpoint is confirmed via a two-tailed t-test. A p-value < 0.05 is regarded as significant.

2.4. Residual Trend Method

The residual trend method (RESTREND) was used to reveal the relative contributions of the driving factors to the carbon sinks [37]. The trends in the residual differences between the actual NEP (NEPact) and predicted NEP (NEPpre) were investigated using the multiple linear regression model [48]. In this study, we selected six driving factors (CO2, temperature (TEM), precipitation (PRE), soil moisture (SOIL), shortwave radiation (RAD), and vapor pressure deficit (VPD)) as the explanatory variables [37]. All the driving factors were determined and standardized before analysis. The RESTREND method is as follows:
N E P p r e = a C O 2 i , j + b T E M i , j + c P R E i , j + d R A D i , j + e S O I L i , j + f V P D i , j + g
where NEPpre indicates the predicted NEP induced by climate change, and CO2, TEM, PRE, RAD, SOIL, and VPD are the natural factors. a-f are the regression coefficients. The absolute value of the regression coefficient represents the relative importance of the driving factors, and g is a regression constant. In this study, the factor with the largest regression coefficient was the main driving factor on the carbon sinks.
Then, we can obtain the carbon sinks induced by human activities by subtracting the predicted NEP from the actual NEP:
N E P r e s = N E P a c t N E P p r e
where NEPres indicates the carbon sinks induced by human activities.
Then, we examined the change rate of the NEPact, NEPpre, and NEPres via Sen’s slope estimator [49]. Sen’s slope is calculated as follows:
β = M e d i a n x n x m n m , n > m
where β is Sen’s slope value. xn and xm are the NEP values at year n and m, respectively, and 1 ≤ m < nk, k is the length of the study period (k = 39). We calculated the slope of NEPact (βact), NEPprepre), and NEPres (βres) using Equation (11).
If the direction of βact is consistent with βpre, the NEP is driven by climate change; otherwise, it is driven by human activities.

3. Results

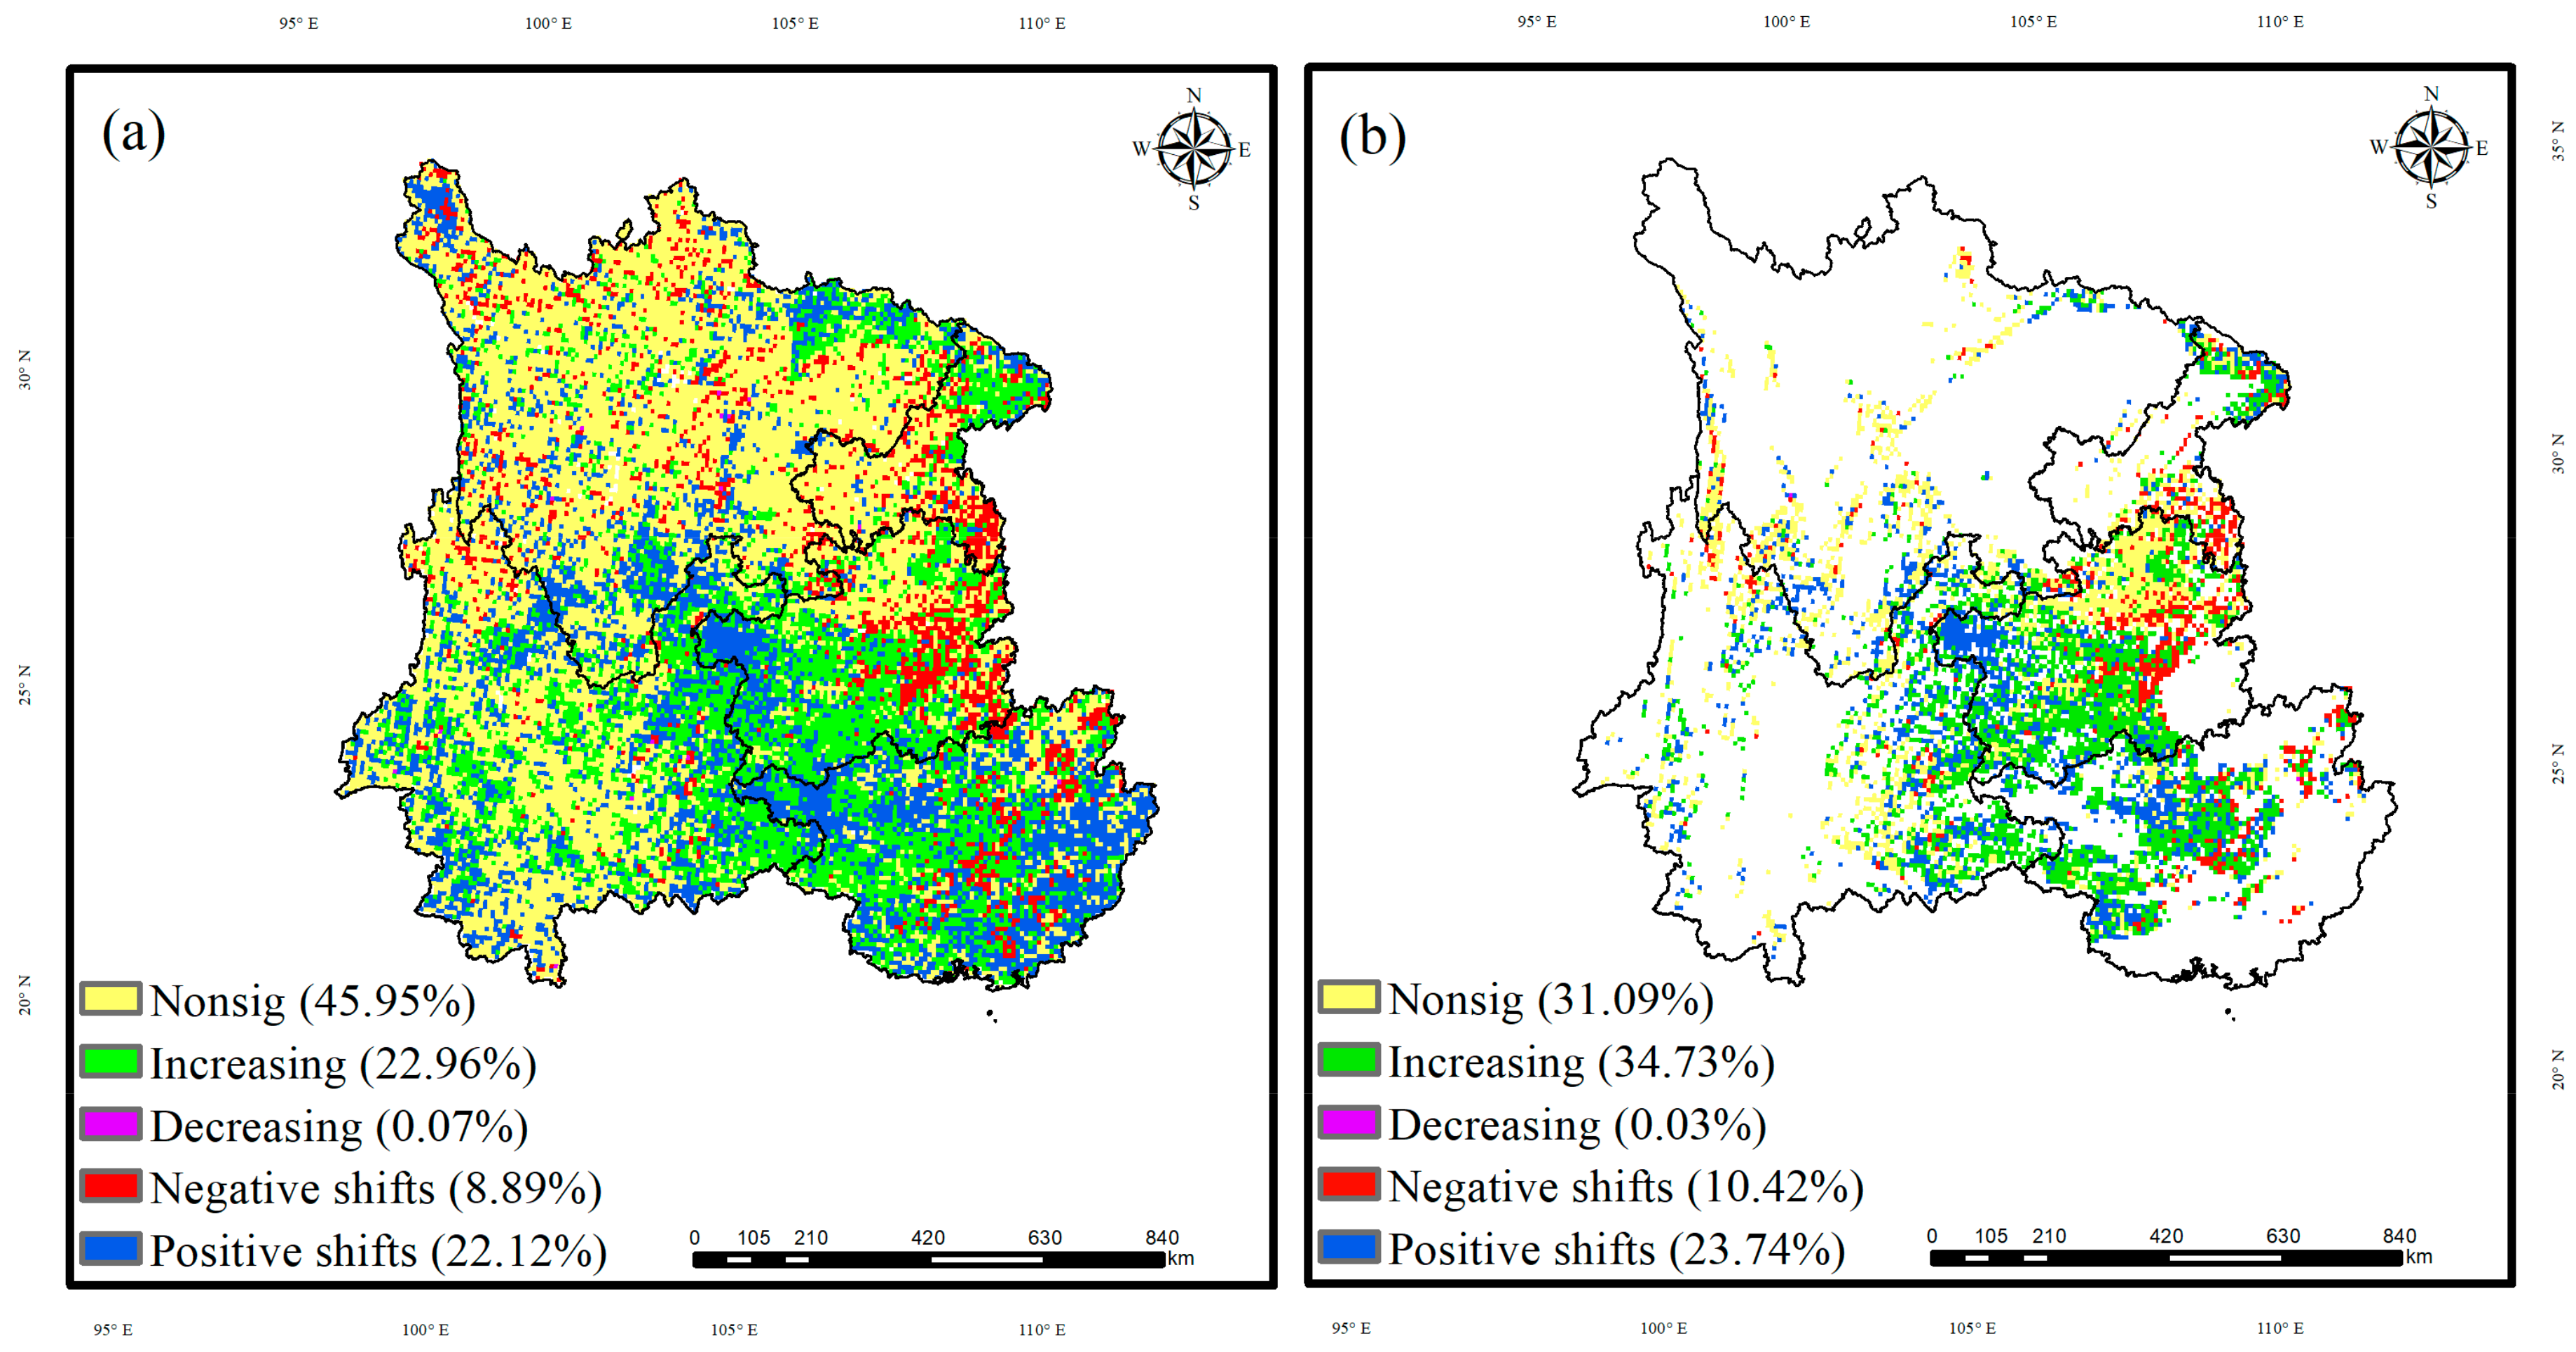
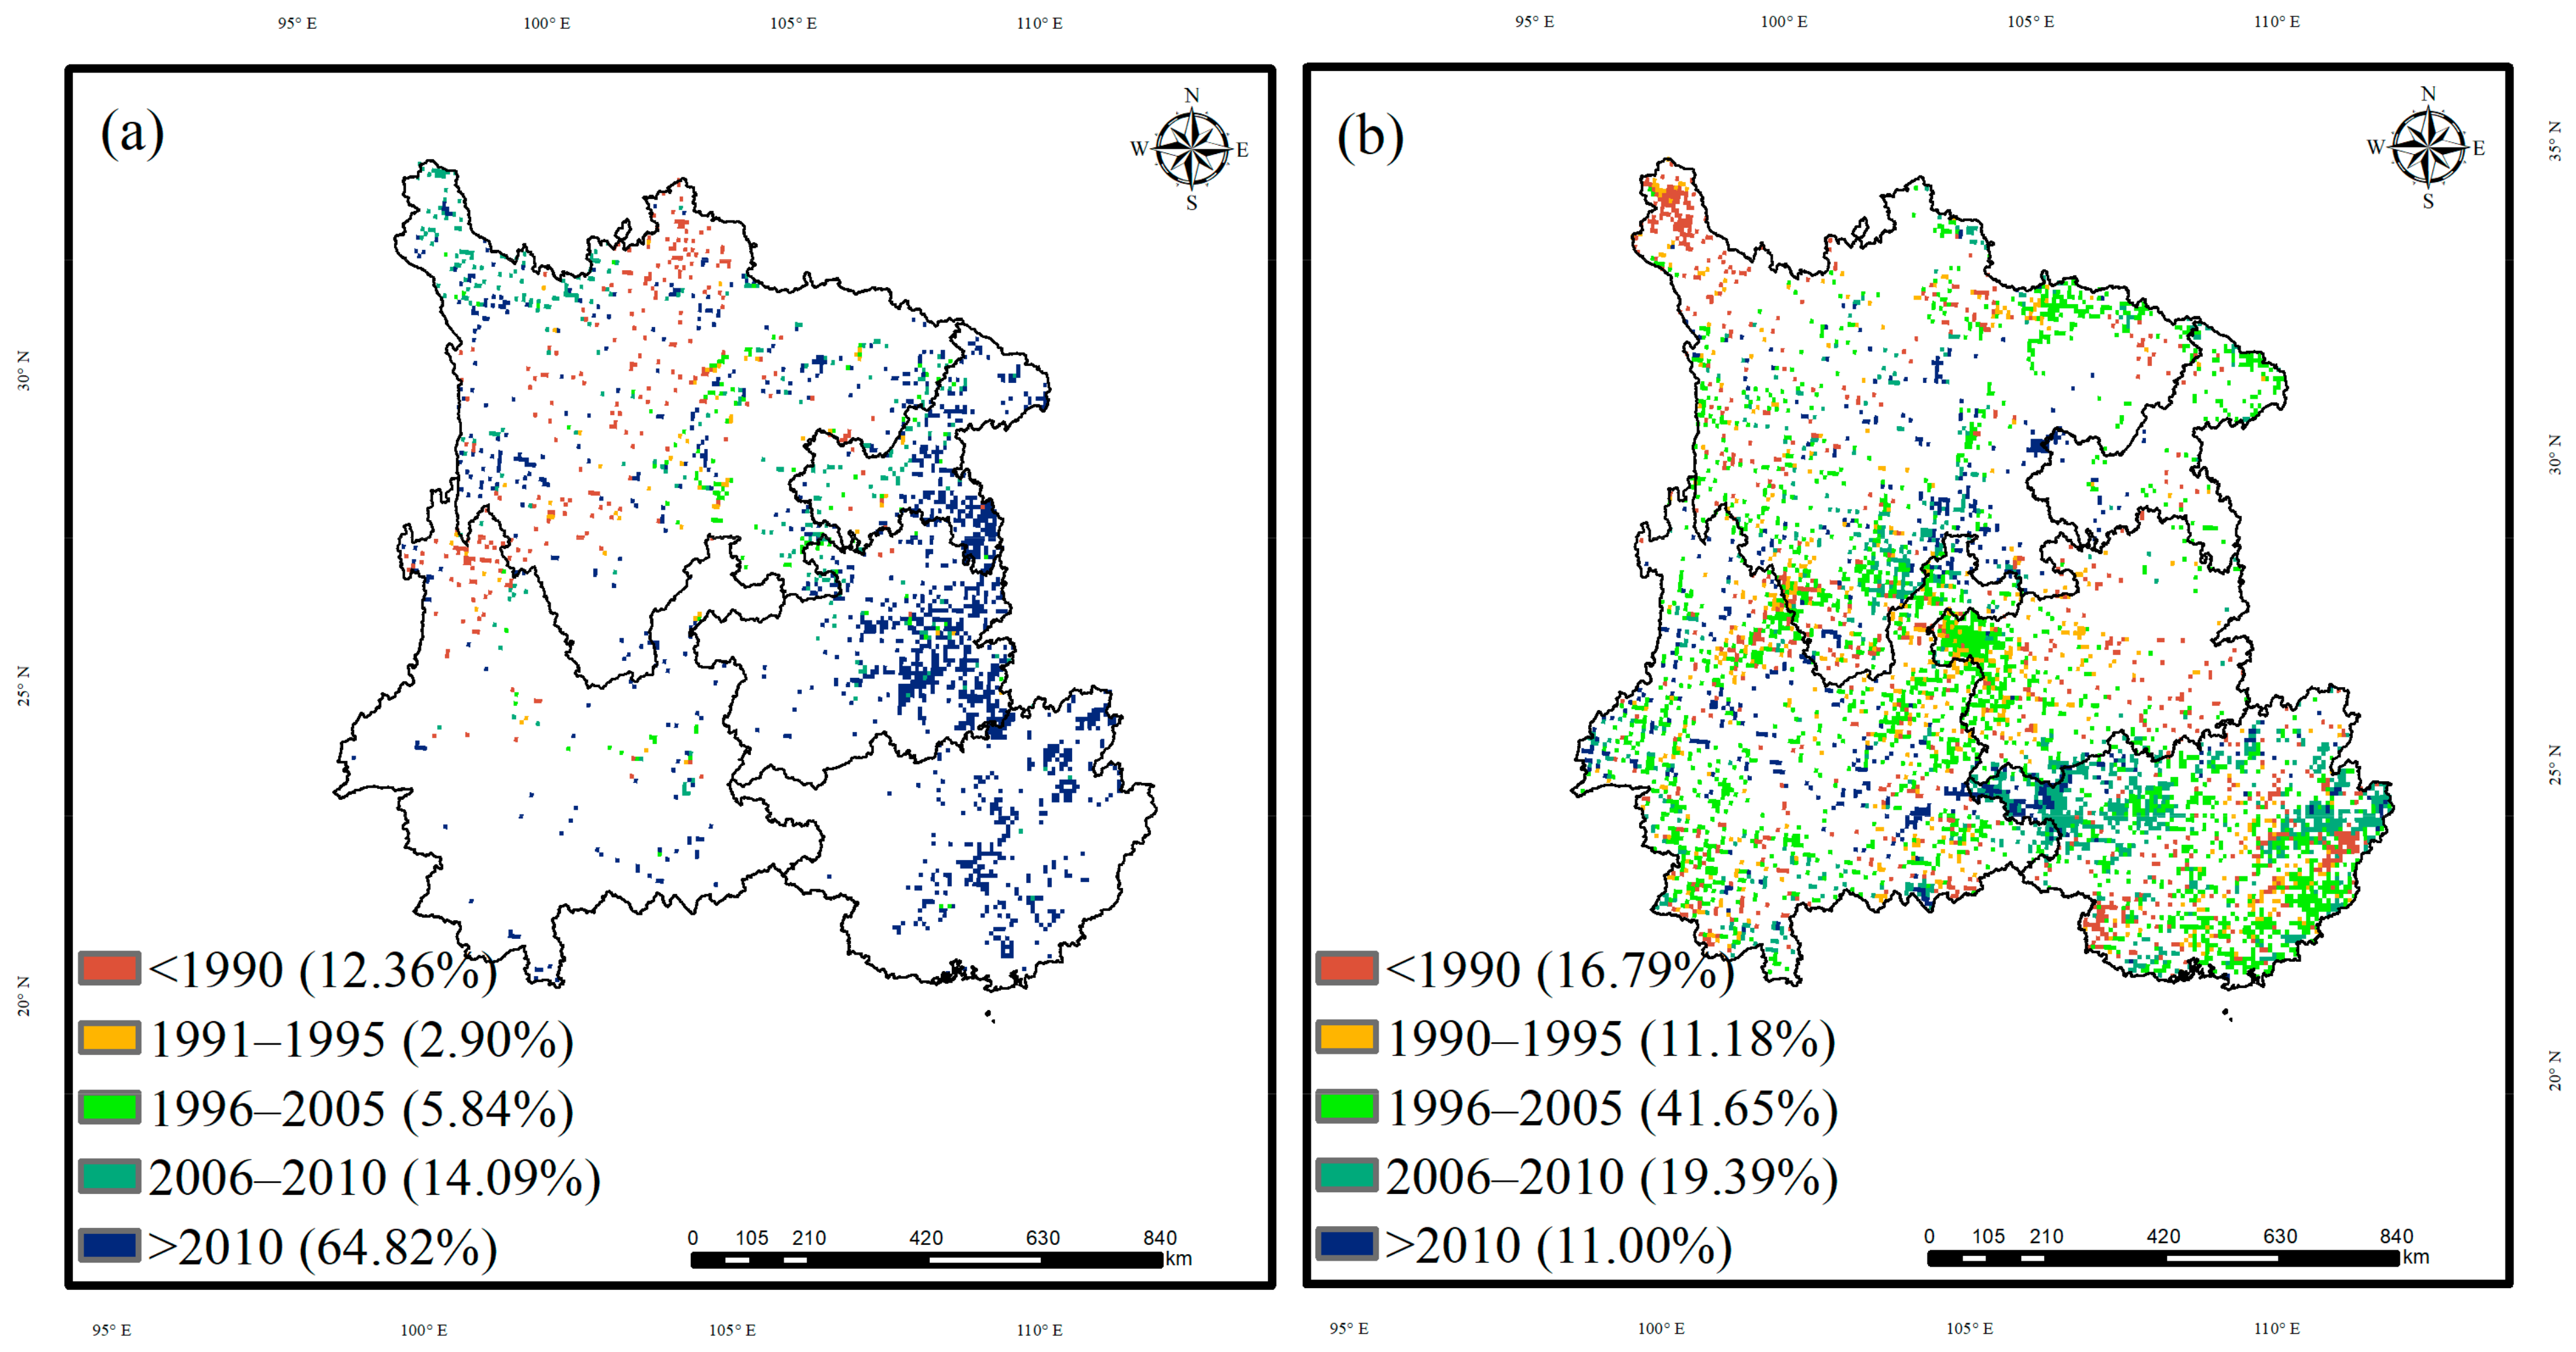
3.1. Nonlinear Trend and Breakpoints of the Carbon Sinks

The result of this study revealed that the carbon sinks in the karst areas exhibited increasing trends or positive reversals, accounting for 58.47% of the area, which was larger than the overall average of 45.08% for SWC (Figure 2a). This suggests that the karst areas had a greater carbon sequestration potential. Additionally, approximately 10.42% of the carbon sinks experienced negative reversals. Areas experiencing increasing and positive shifts were predominantly situated in the western regions of Guizhou and Guangxi. In contrast, negative shifts occurred in the eastern parts of Chongqing, Guangxi, and Guizhou.
The timings of the breakpoints in the positive and negative reversals of the carbon sinks differed (Figure 3a,b). Concerning carbon sinks displaying negative reversals (Figure 4a), a significant majority of the breakpoints (64.82%) occurred after 2010. Approximately 14.05% occurred during the period of 2006–2010, primarily in the eastern parts of Chongqing, Guizhou, and Guangxi. The remaining breakpoints (20.01%) mostly occurred prior to 2005 and were primarily located in Sichuan. However, in the case of carbon sinks with positive reversals (Figure 3b), the breakpoints were predominantly concentrated in the period of 1996–2010, accounting for 61.04%. Of this subset, around 41.65% took place specifically during the years 1996–2005.

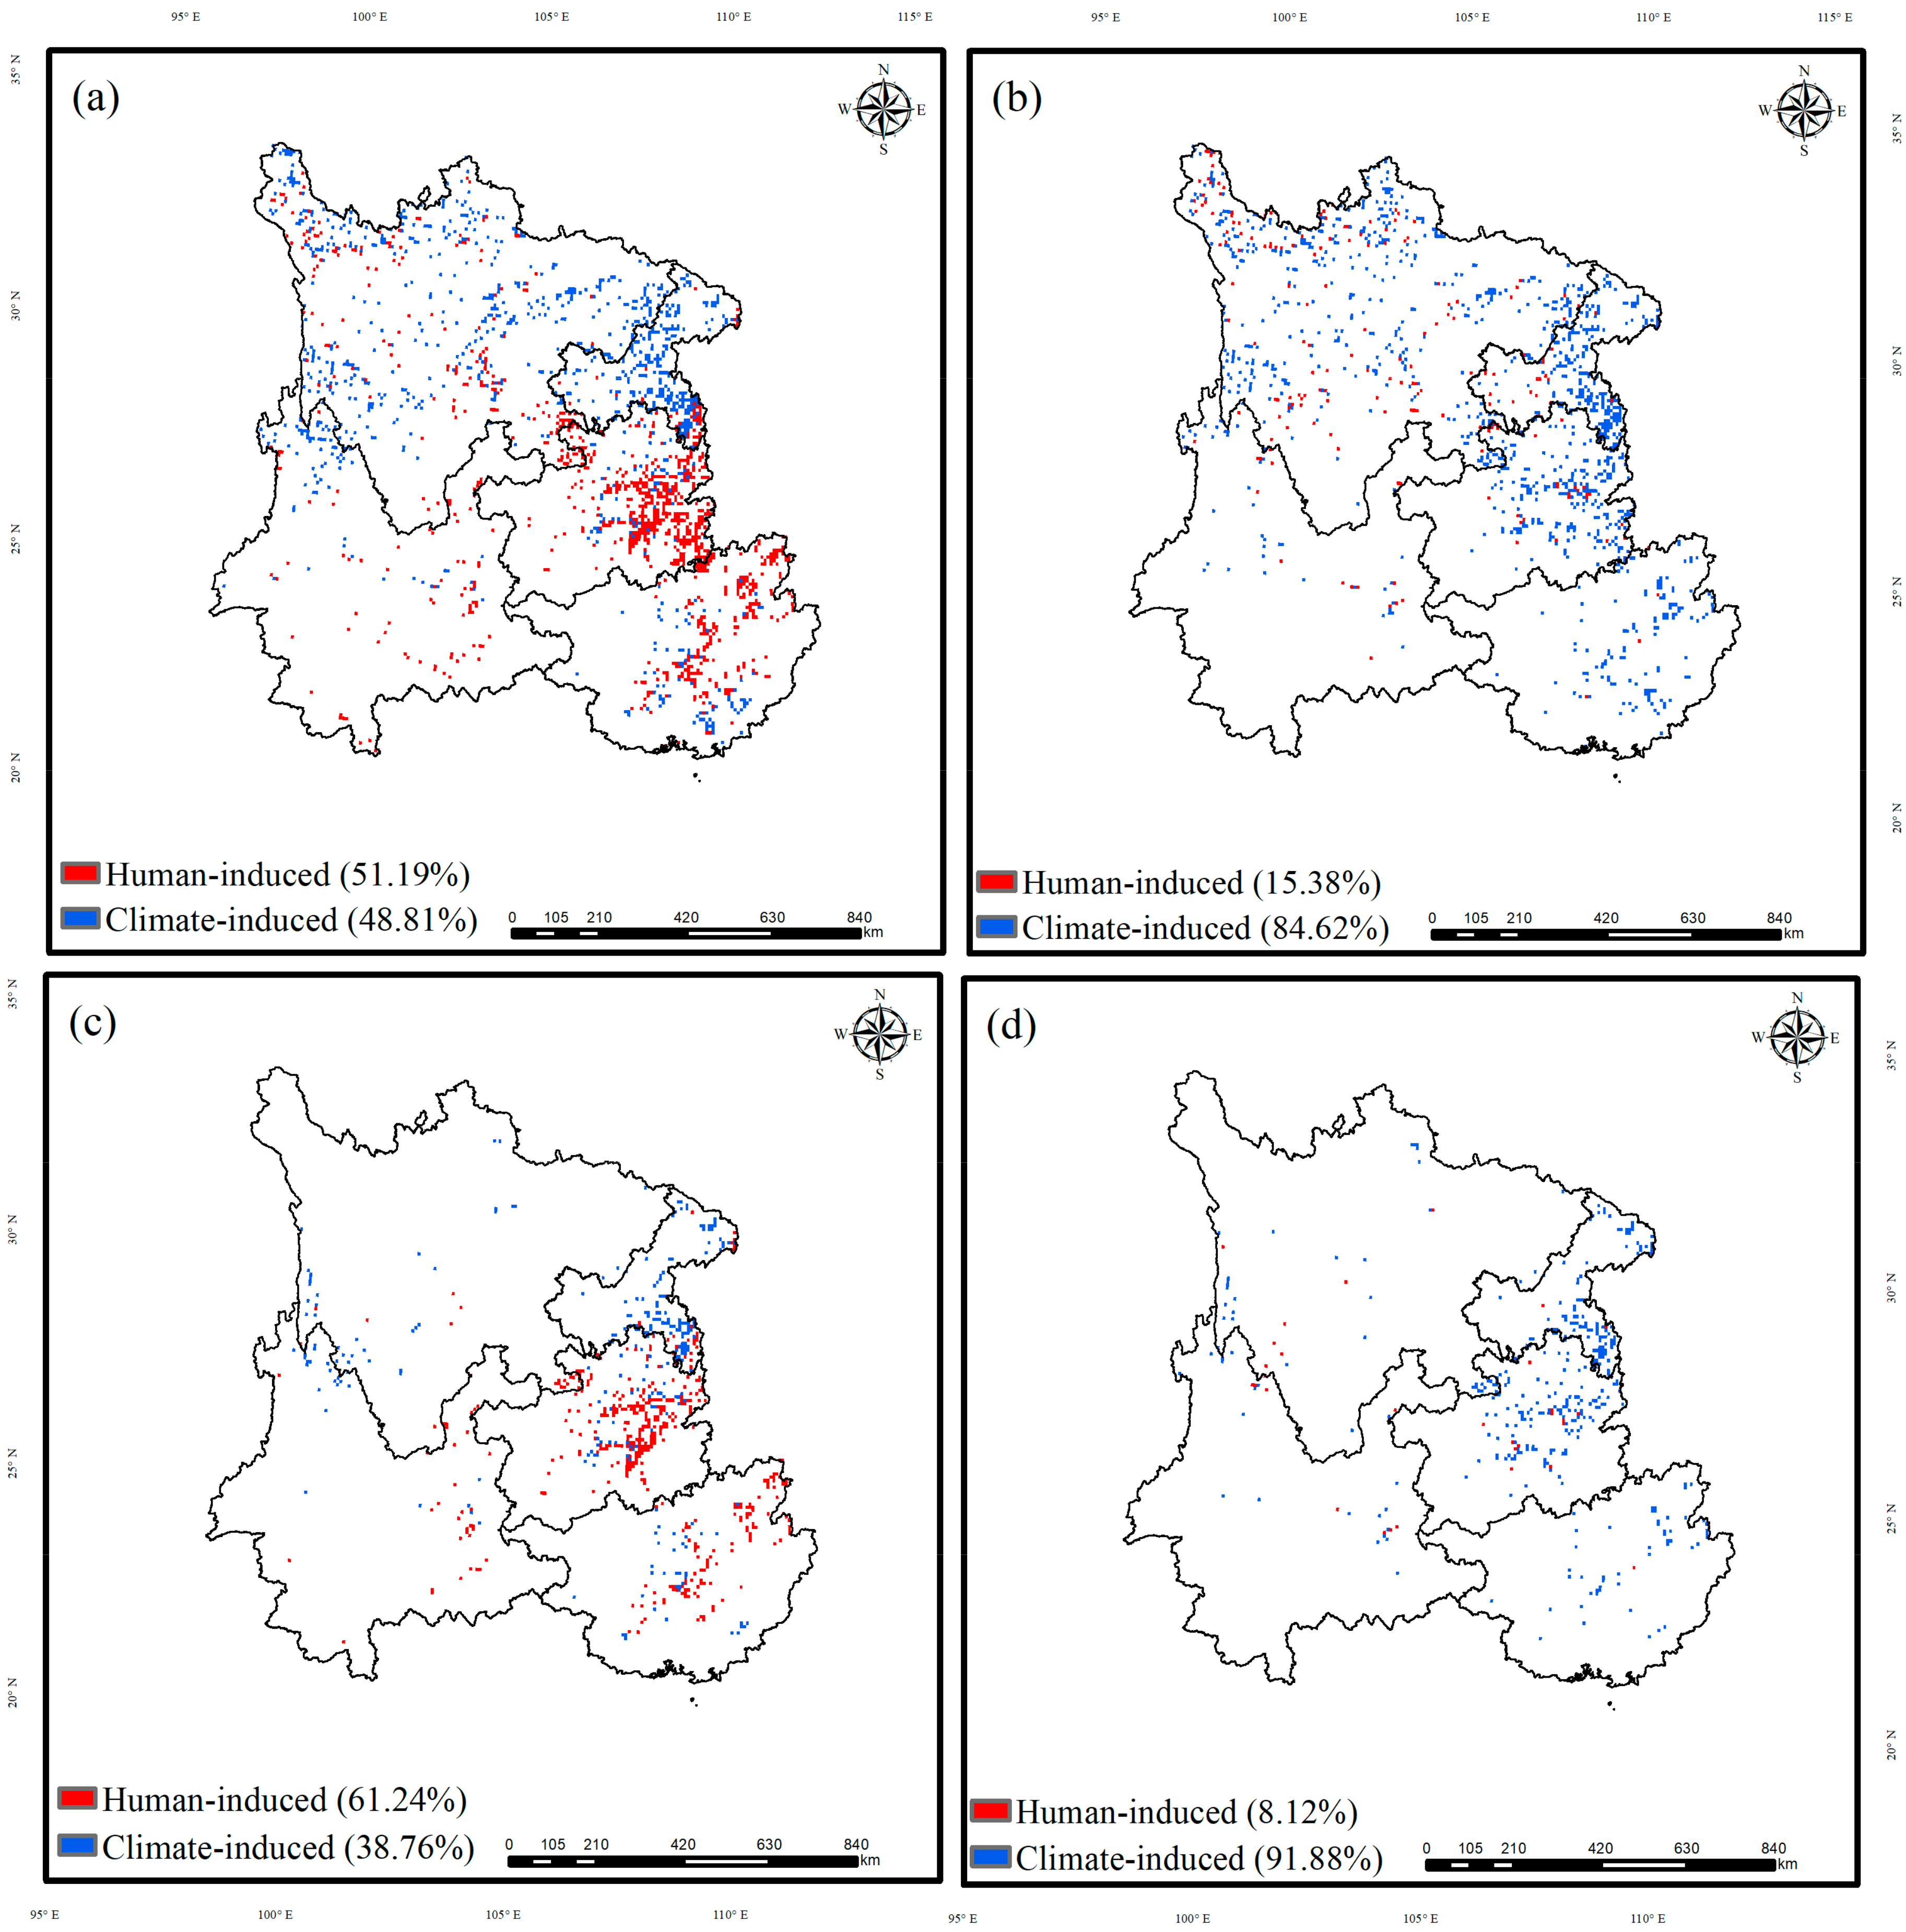
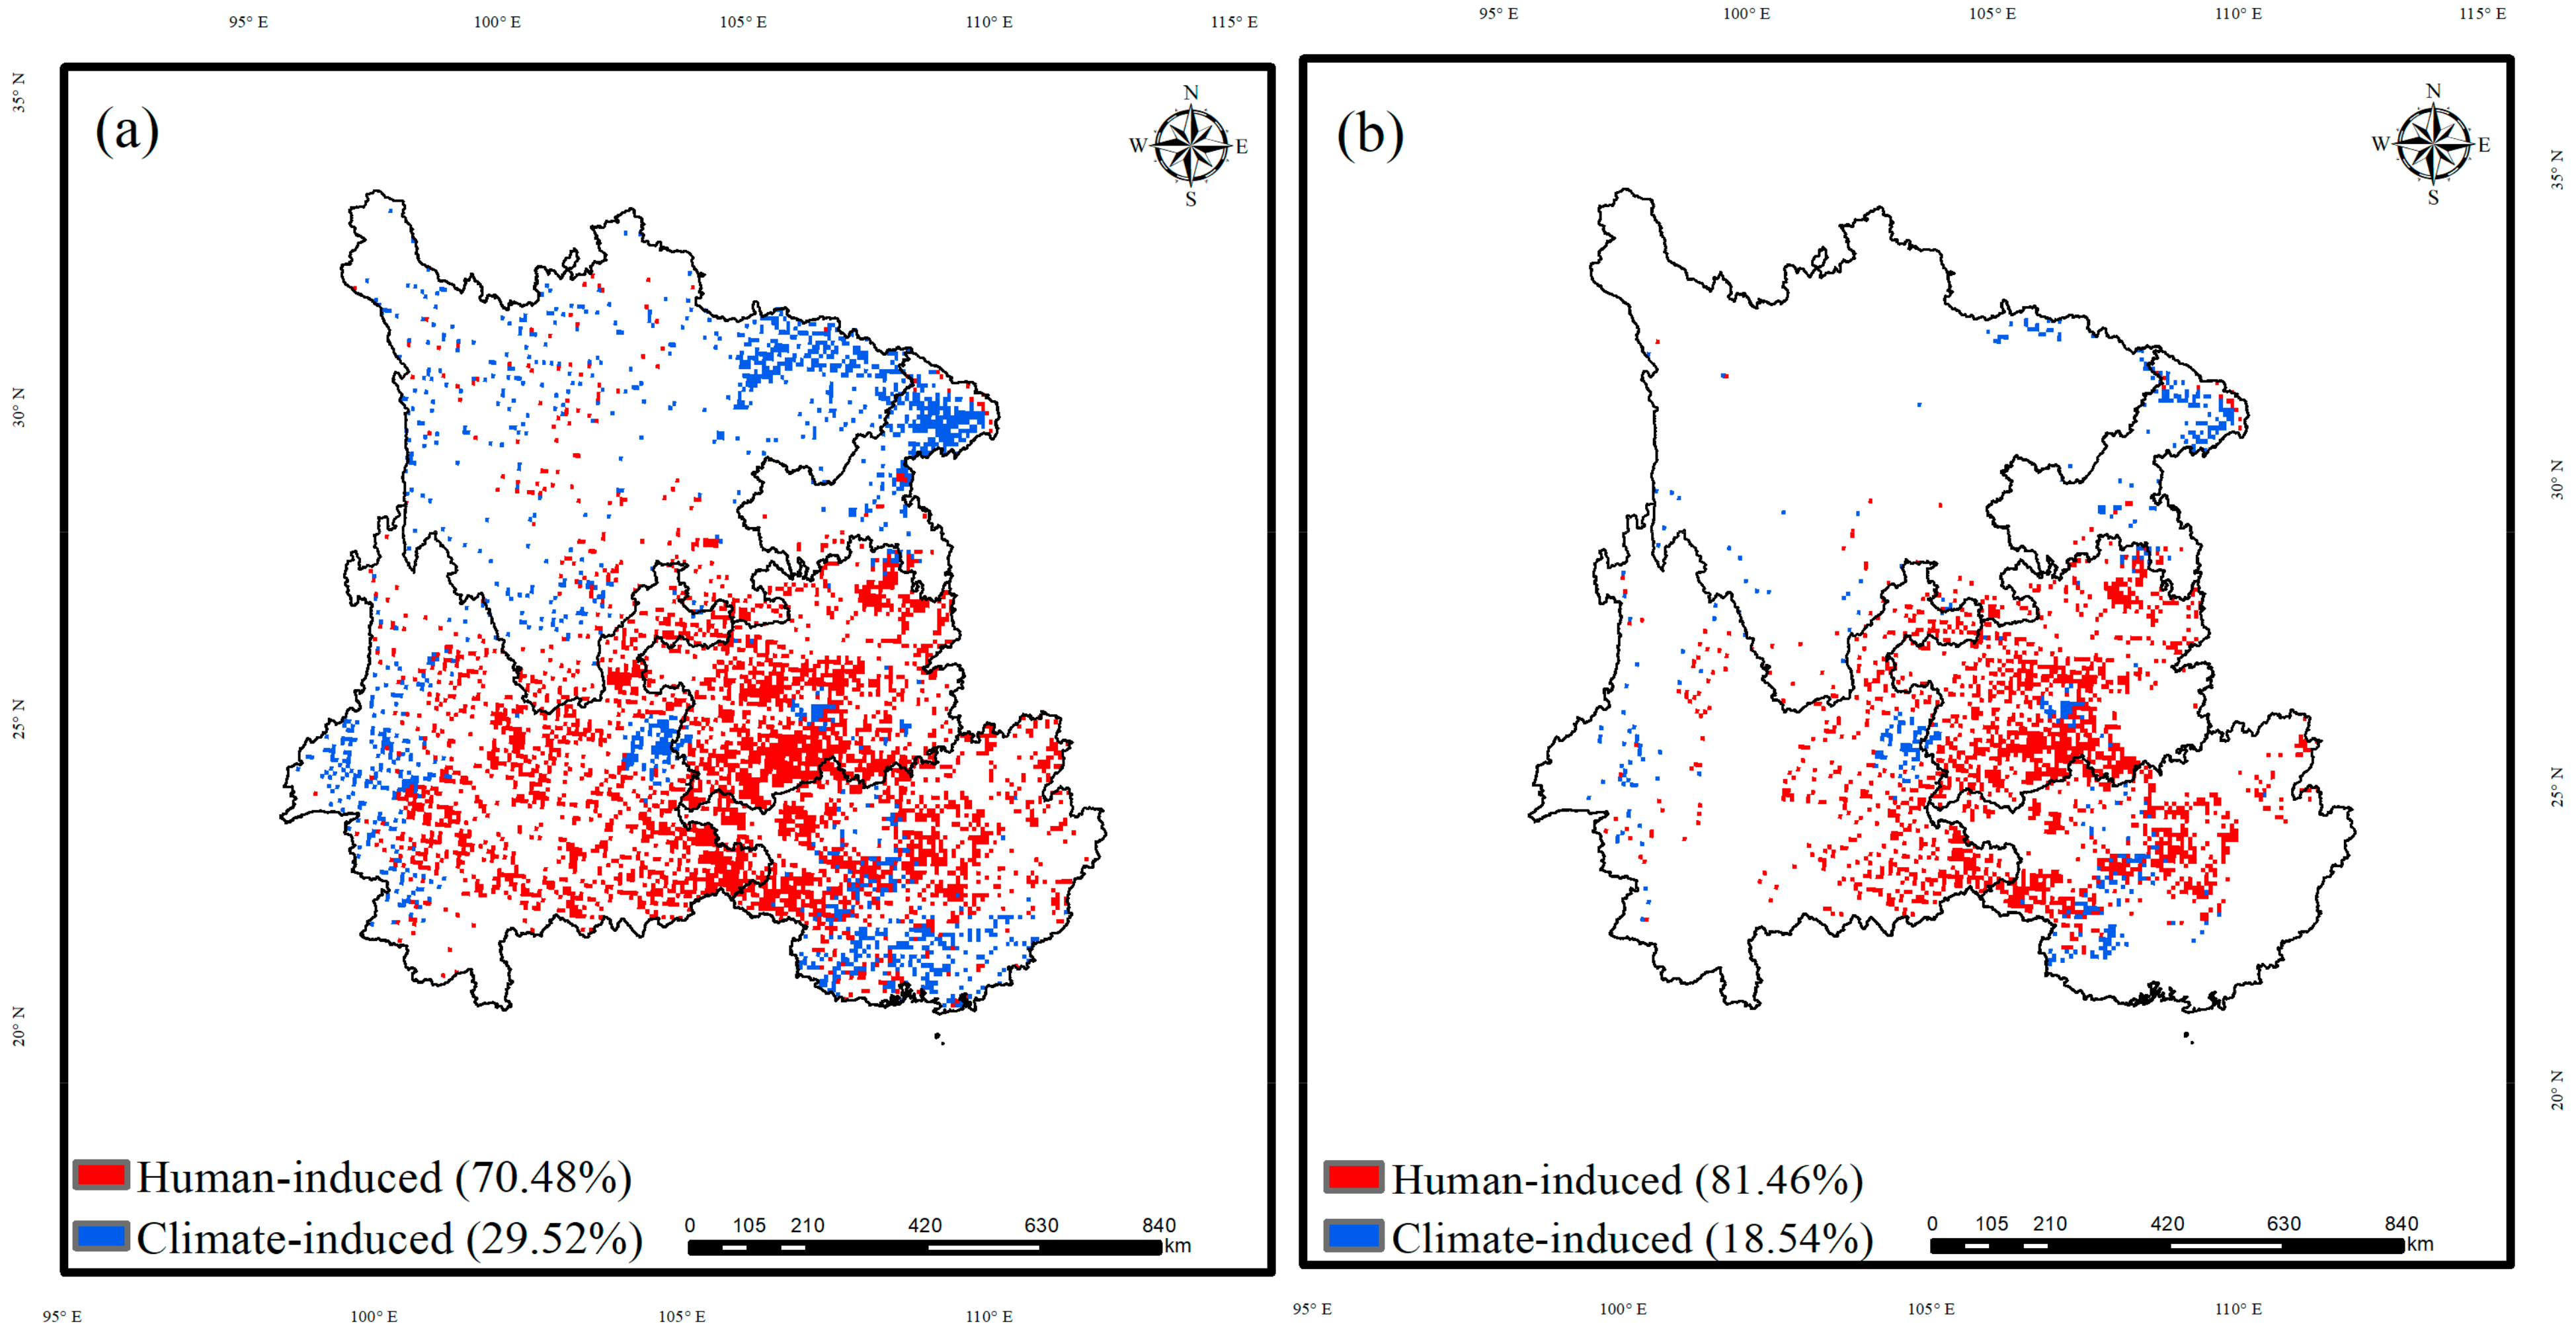
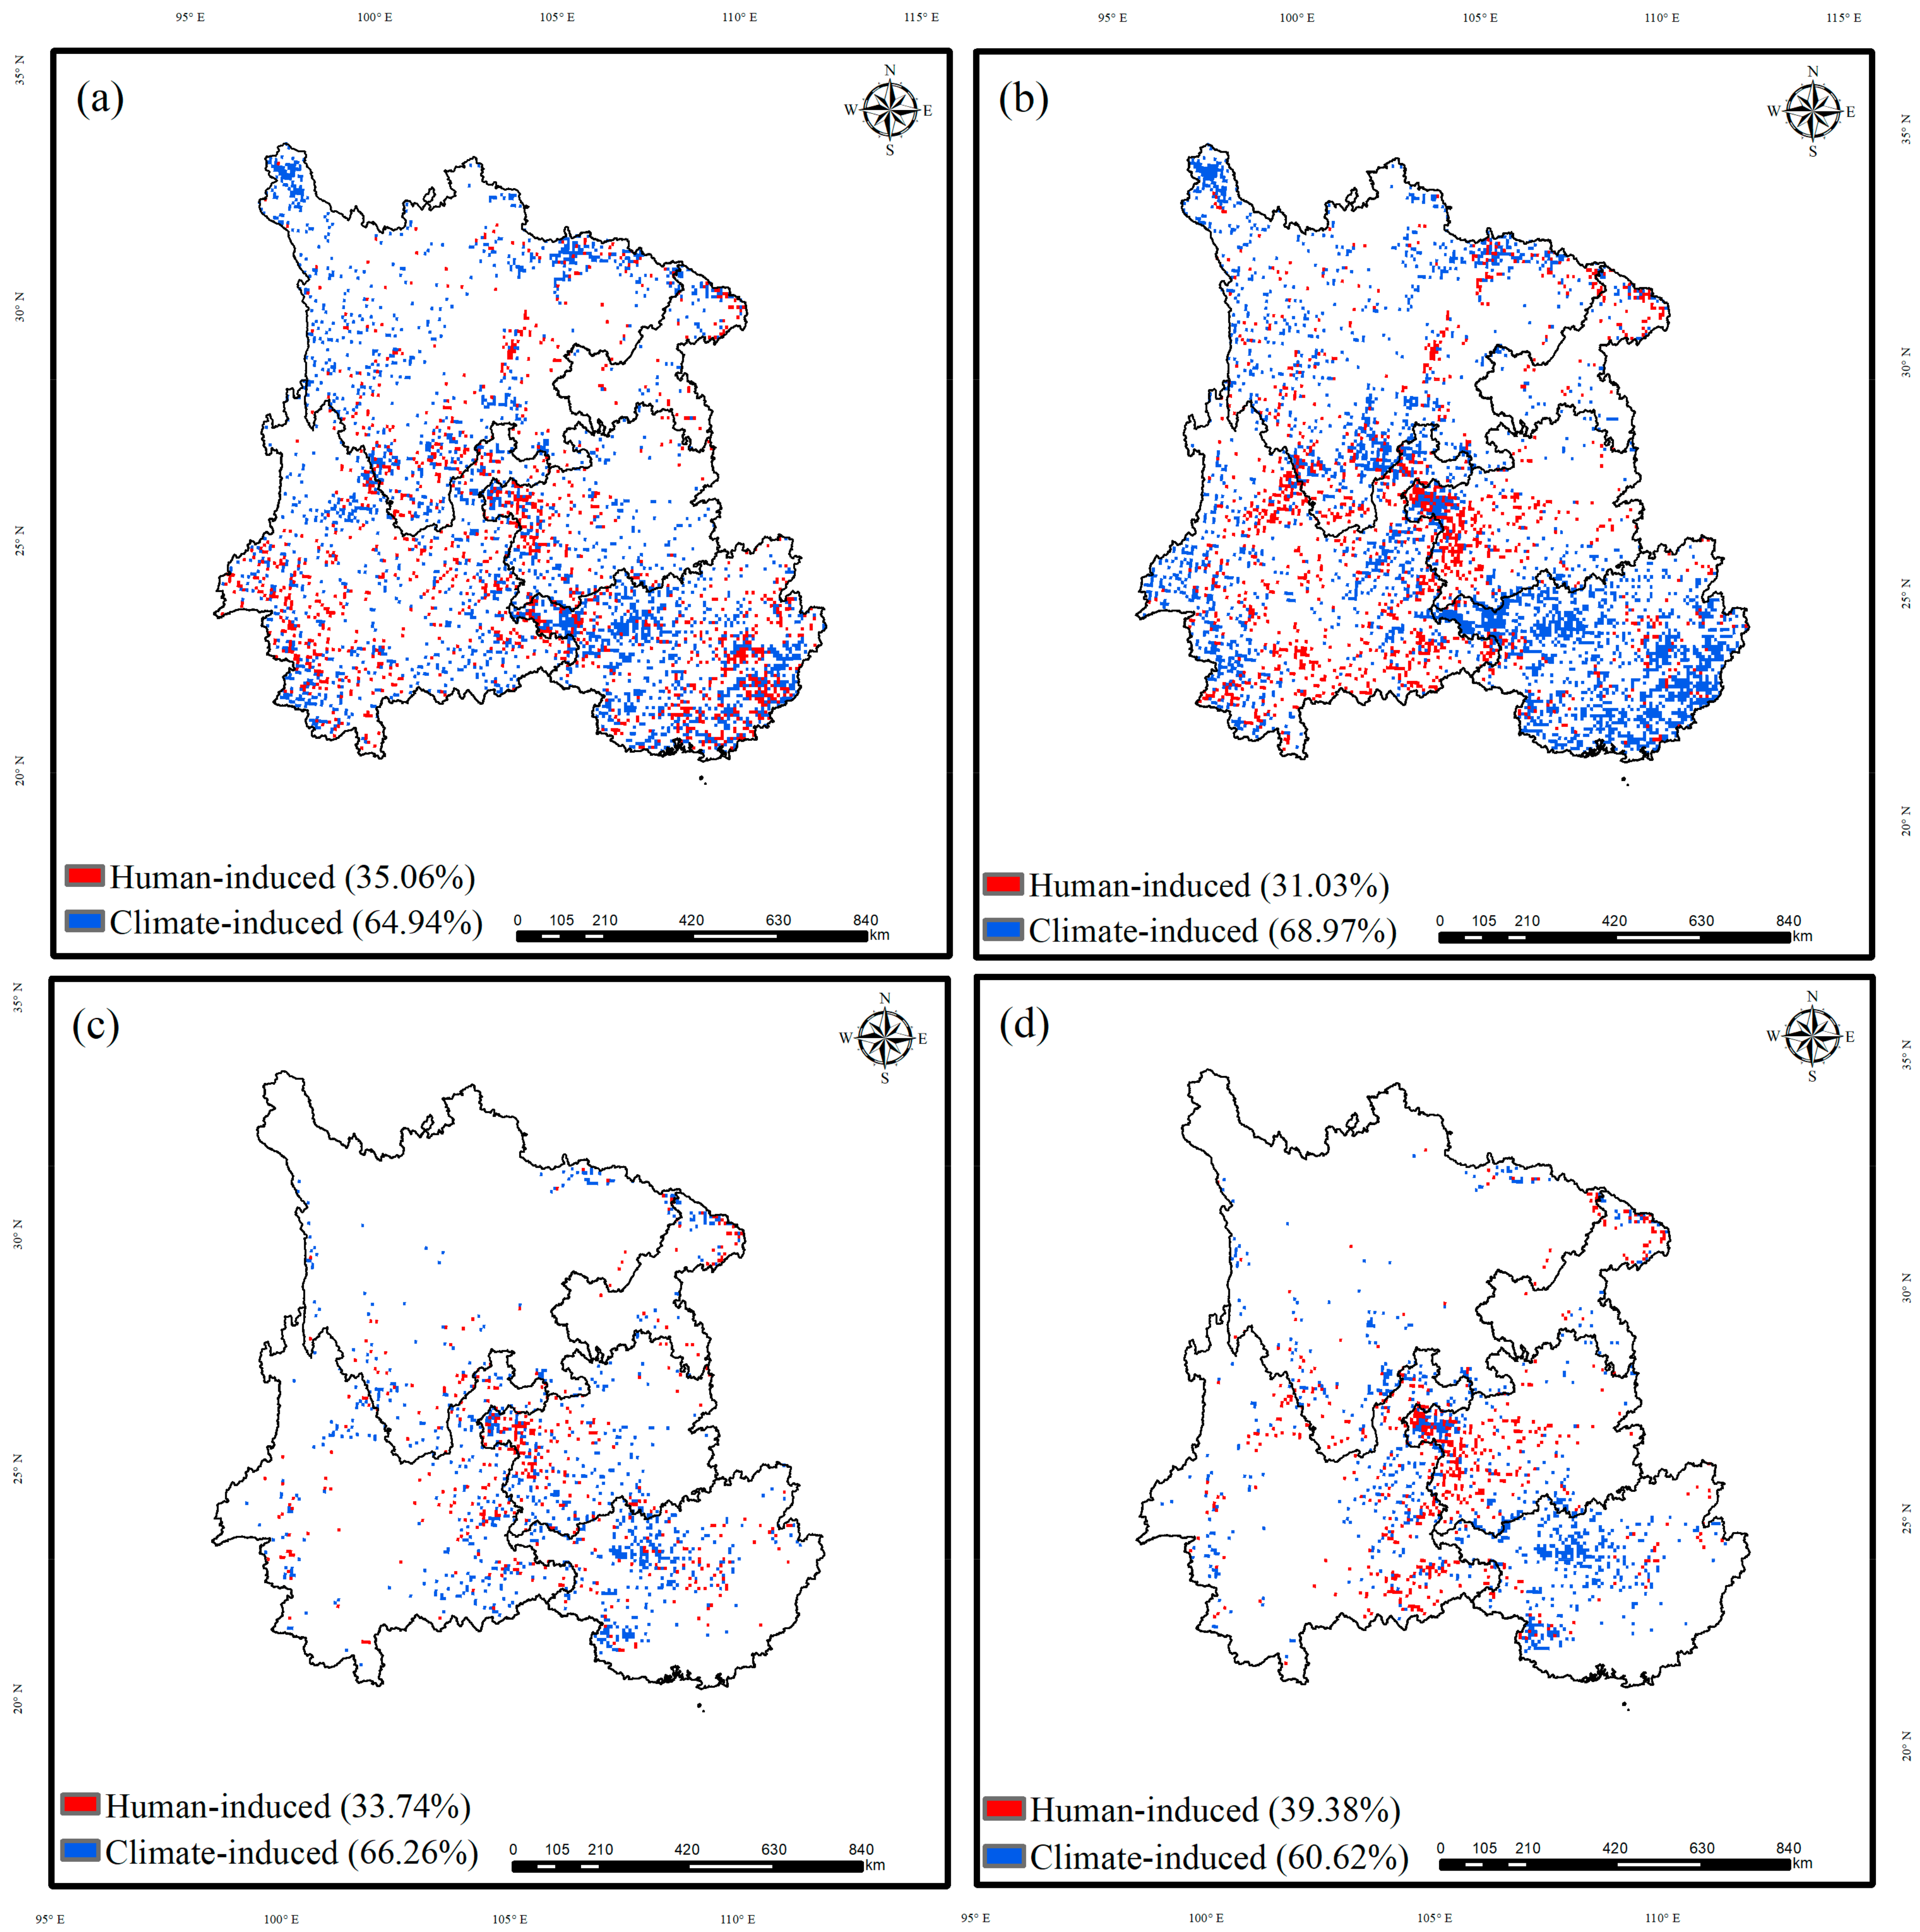
3.2. Domination of Climate Change and Human Activities in Carbon Sink Trends

In the case of carbon sinks exhibiting increasing trends, human activities served as the main driving factor in both the entire region and the karst regions of Southwest China (Figure 4). The proportion of human activity-driven areas was notably larger in the karst areas (81.46%) than in the entire region (70.48%). The human activity-induced areas were primarily in the junctions of Yunnan, Guangxi, and Guizhou.
Although carbon sinks with positive reversals were affected by climate change in both the karst regions and the entire Southwest China region, there was a discrepancy in the contribution of human activities after the breakpoints (Figure 5). Across the entire region, the proportion of human activities decreased from 35.06% to 31.03% following the breakpoints. Conversely, it rose from 33.74% to 39.38% in the karst areas. This suggests a gradual increase in the importance of human activities in carbon sequestration within the karst regions.
Regarding carbon sinks displaying negative reversals (Figure 6), the driving factors varied before and after the breakpoints. Prior to the breakpoints, human activities primarily contributed to the negative reversals of carbon sinks. In contrast, following the breakpoints, climate change became the driving force behind the negative reversals of carbon sinks. Additionally, the role of climate was more pronounced in the karst areas than in the entire region. This indicates that climate change caused a transition in the karst regions, shifting carbon sinks from increasing trends to decreasing trends.

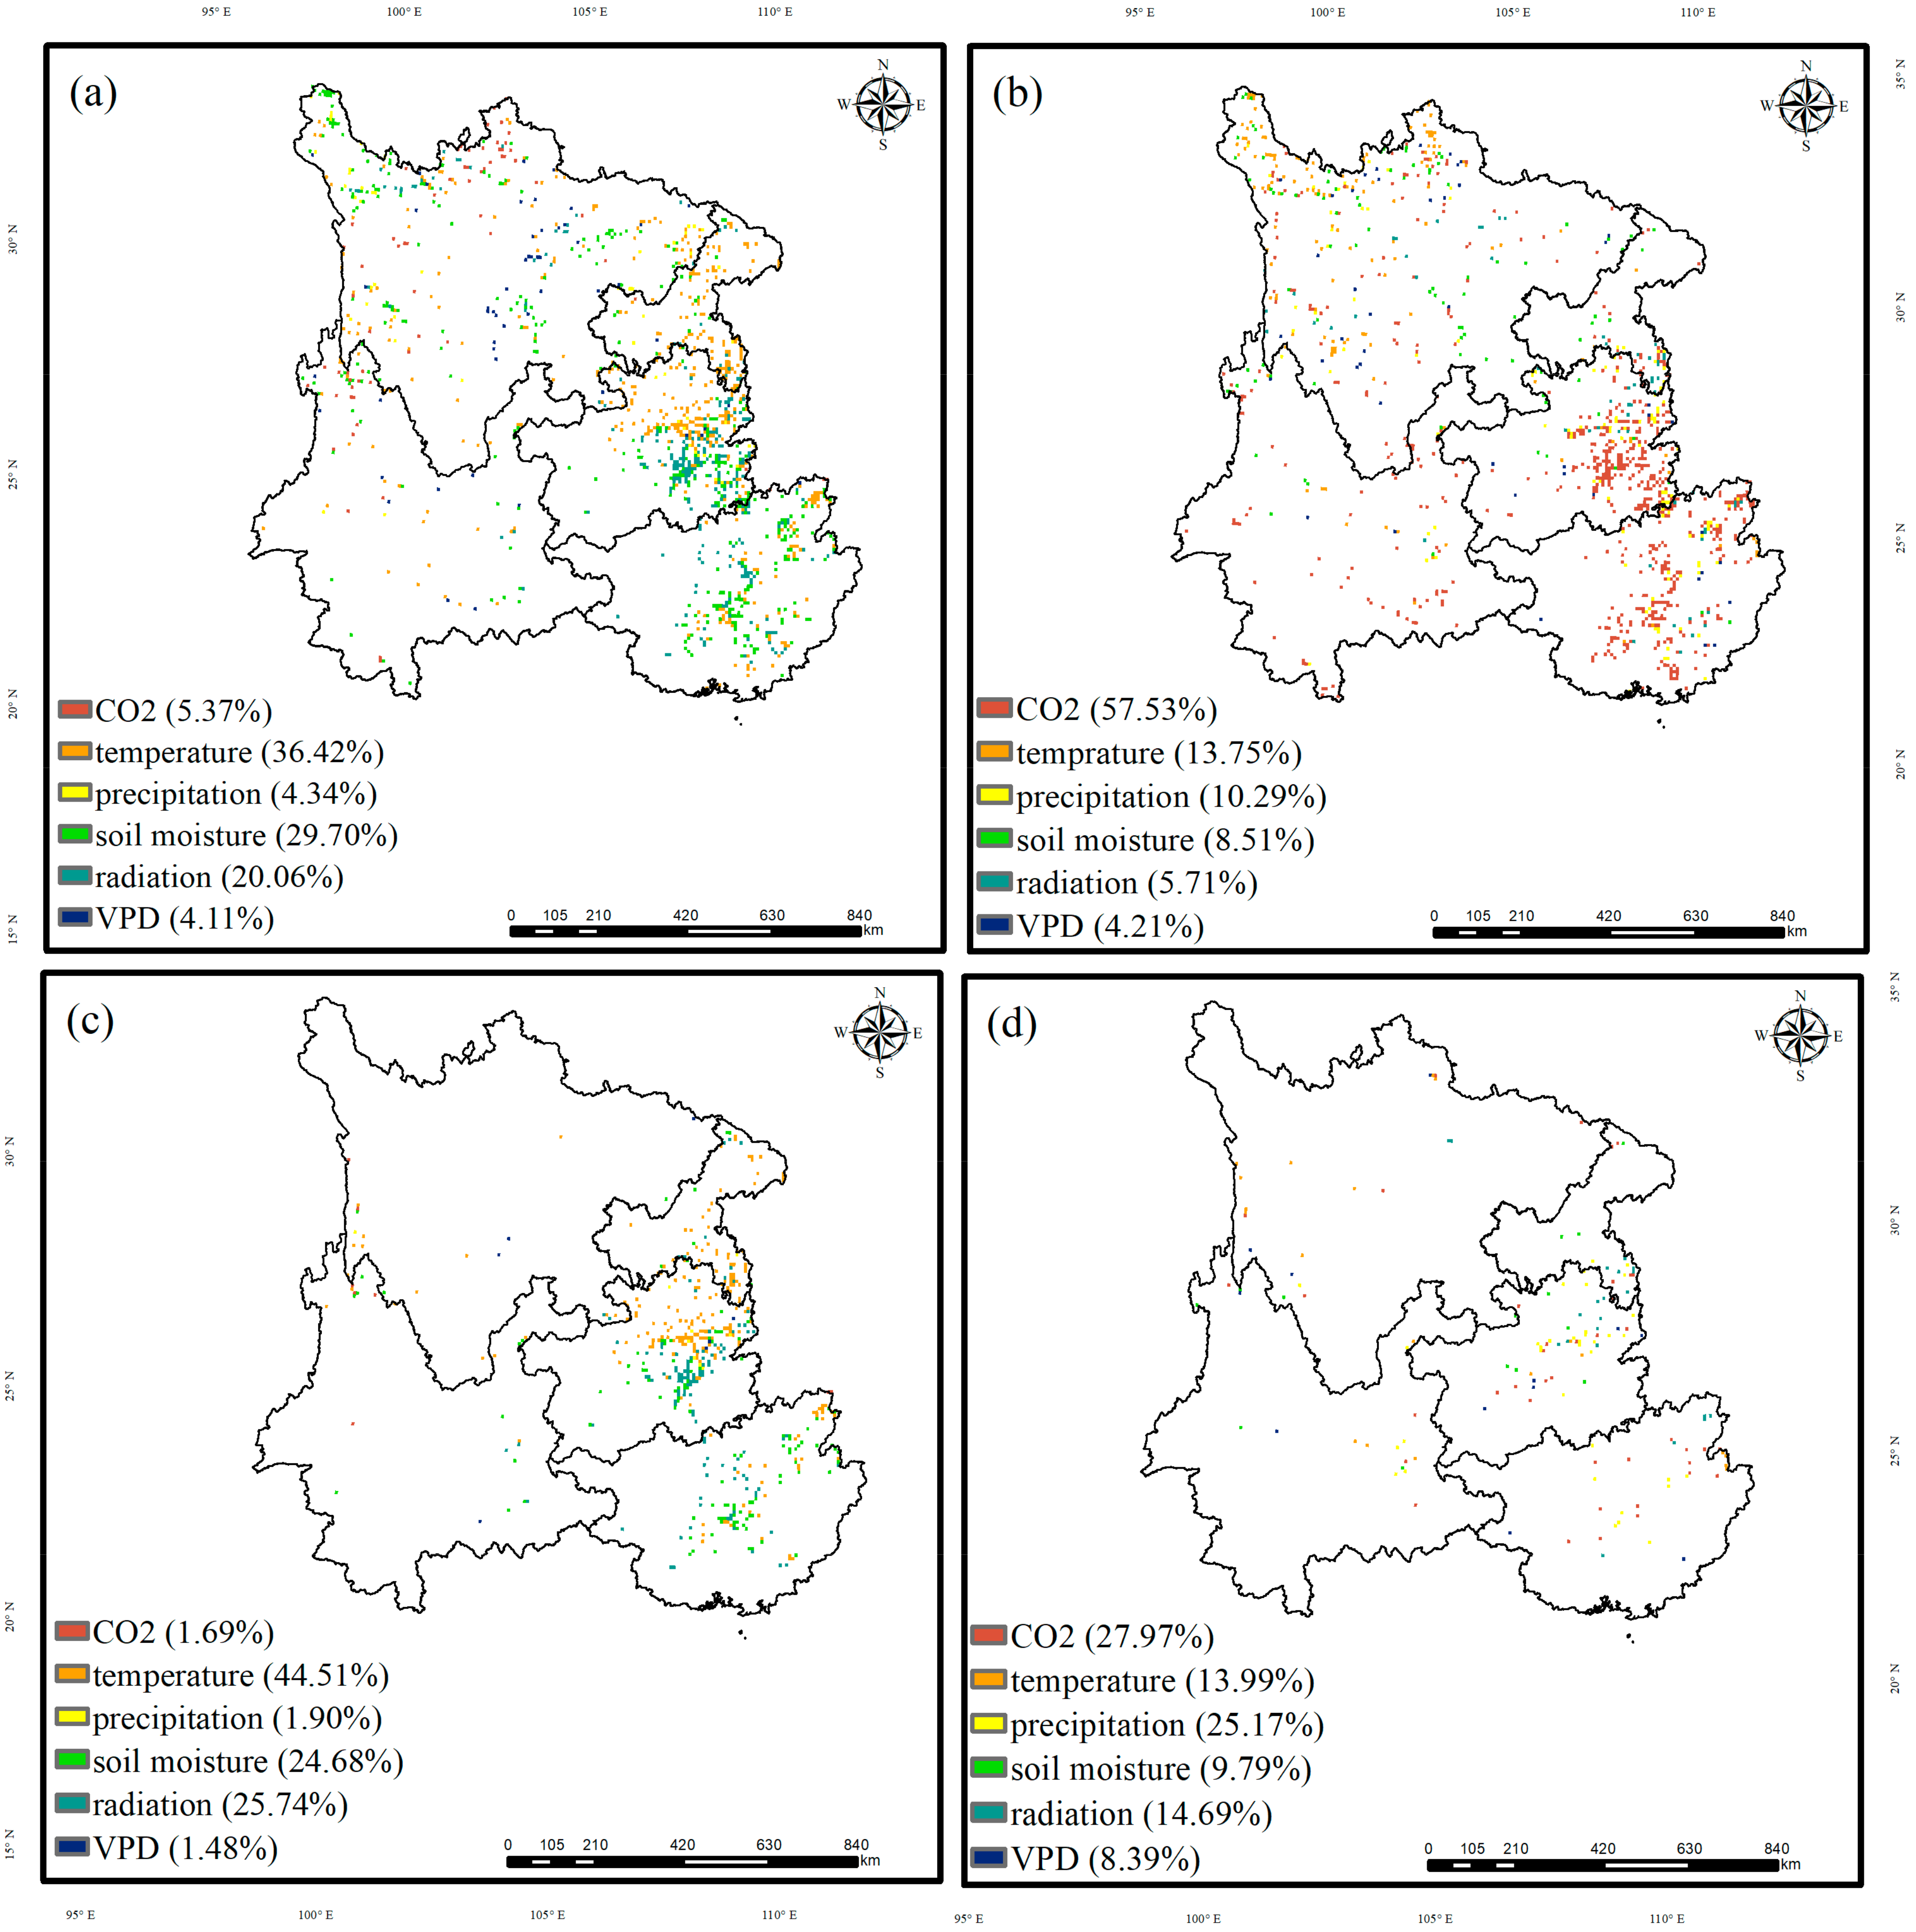
3.3. Main Driving Factors of the Carbon Sink Trend

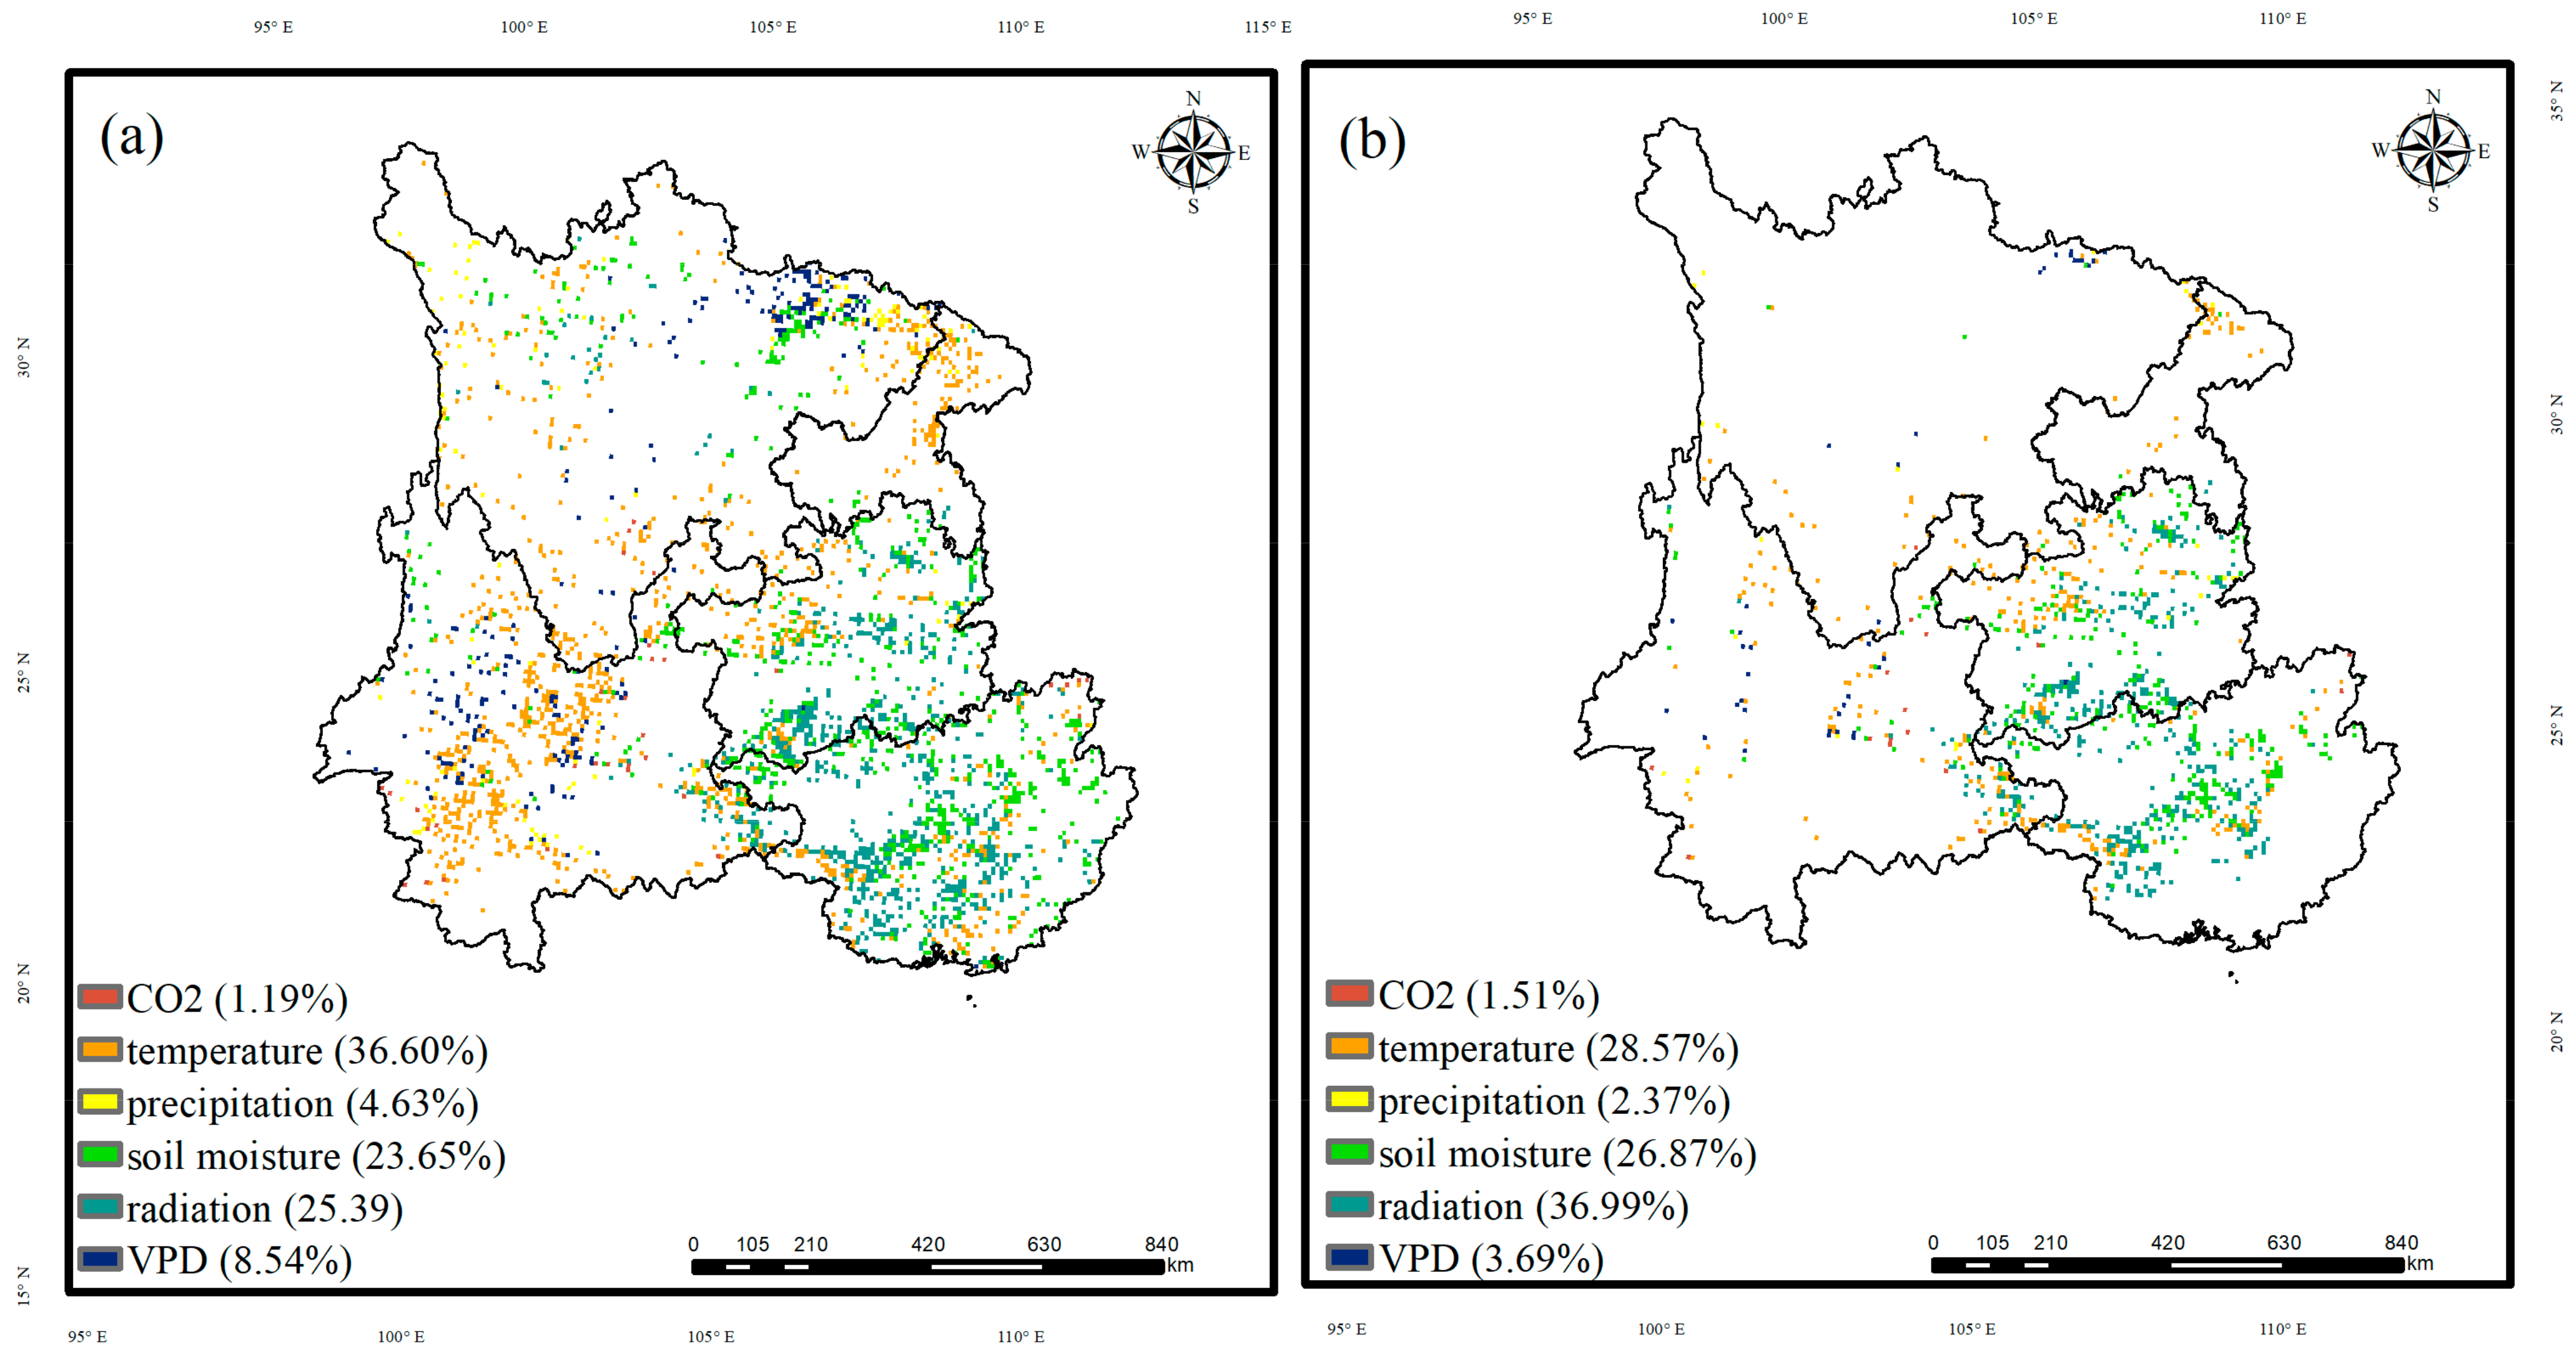
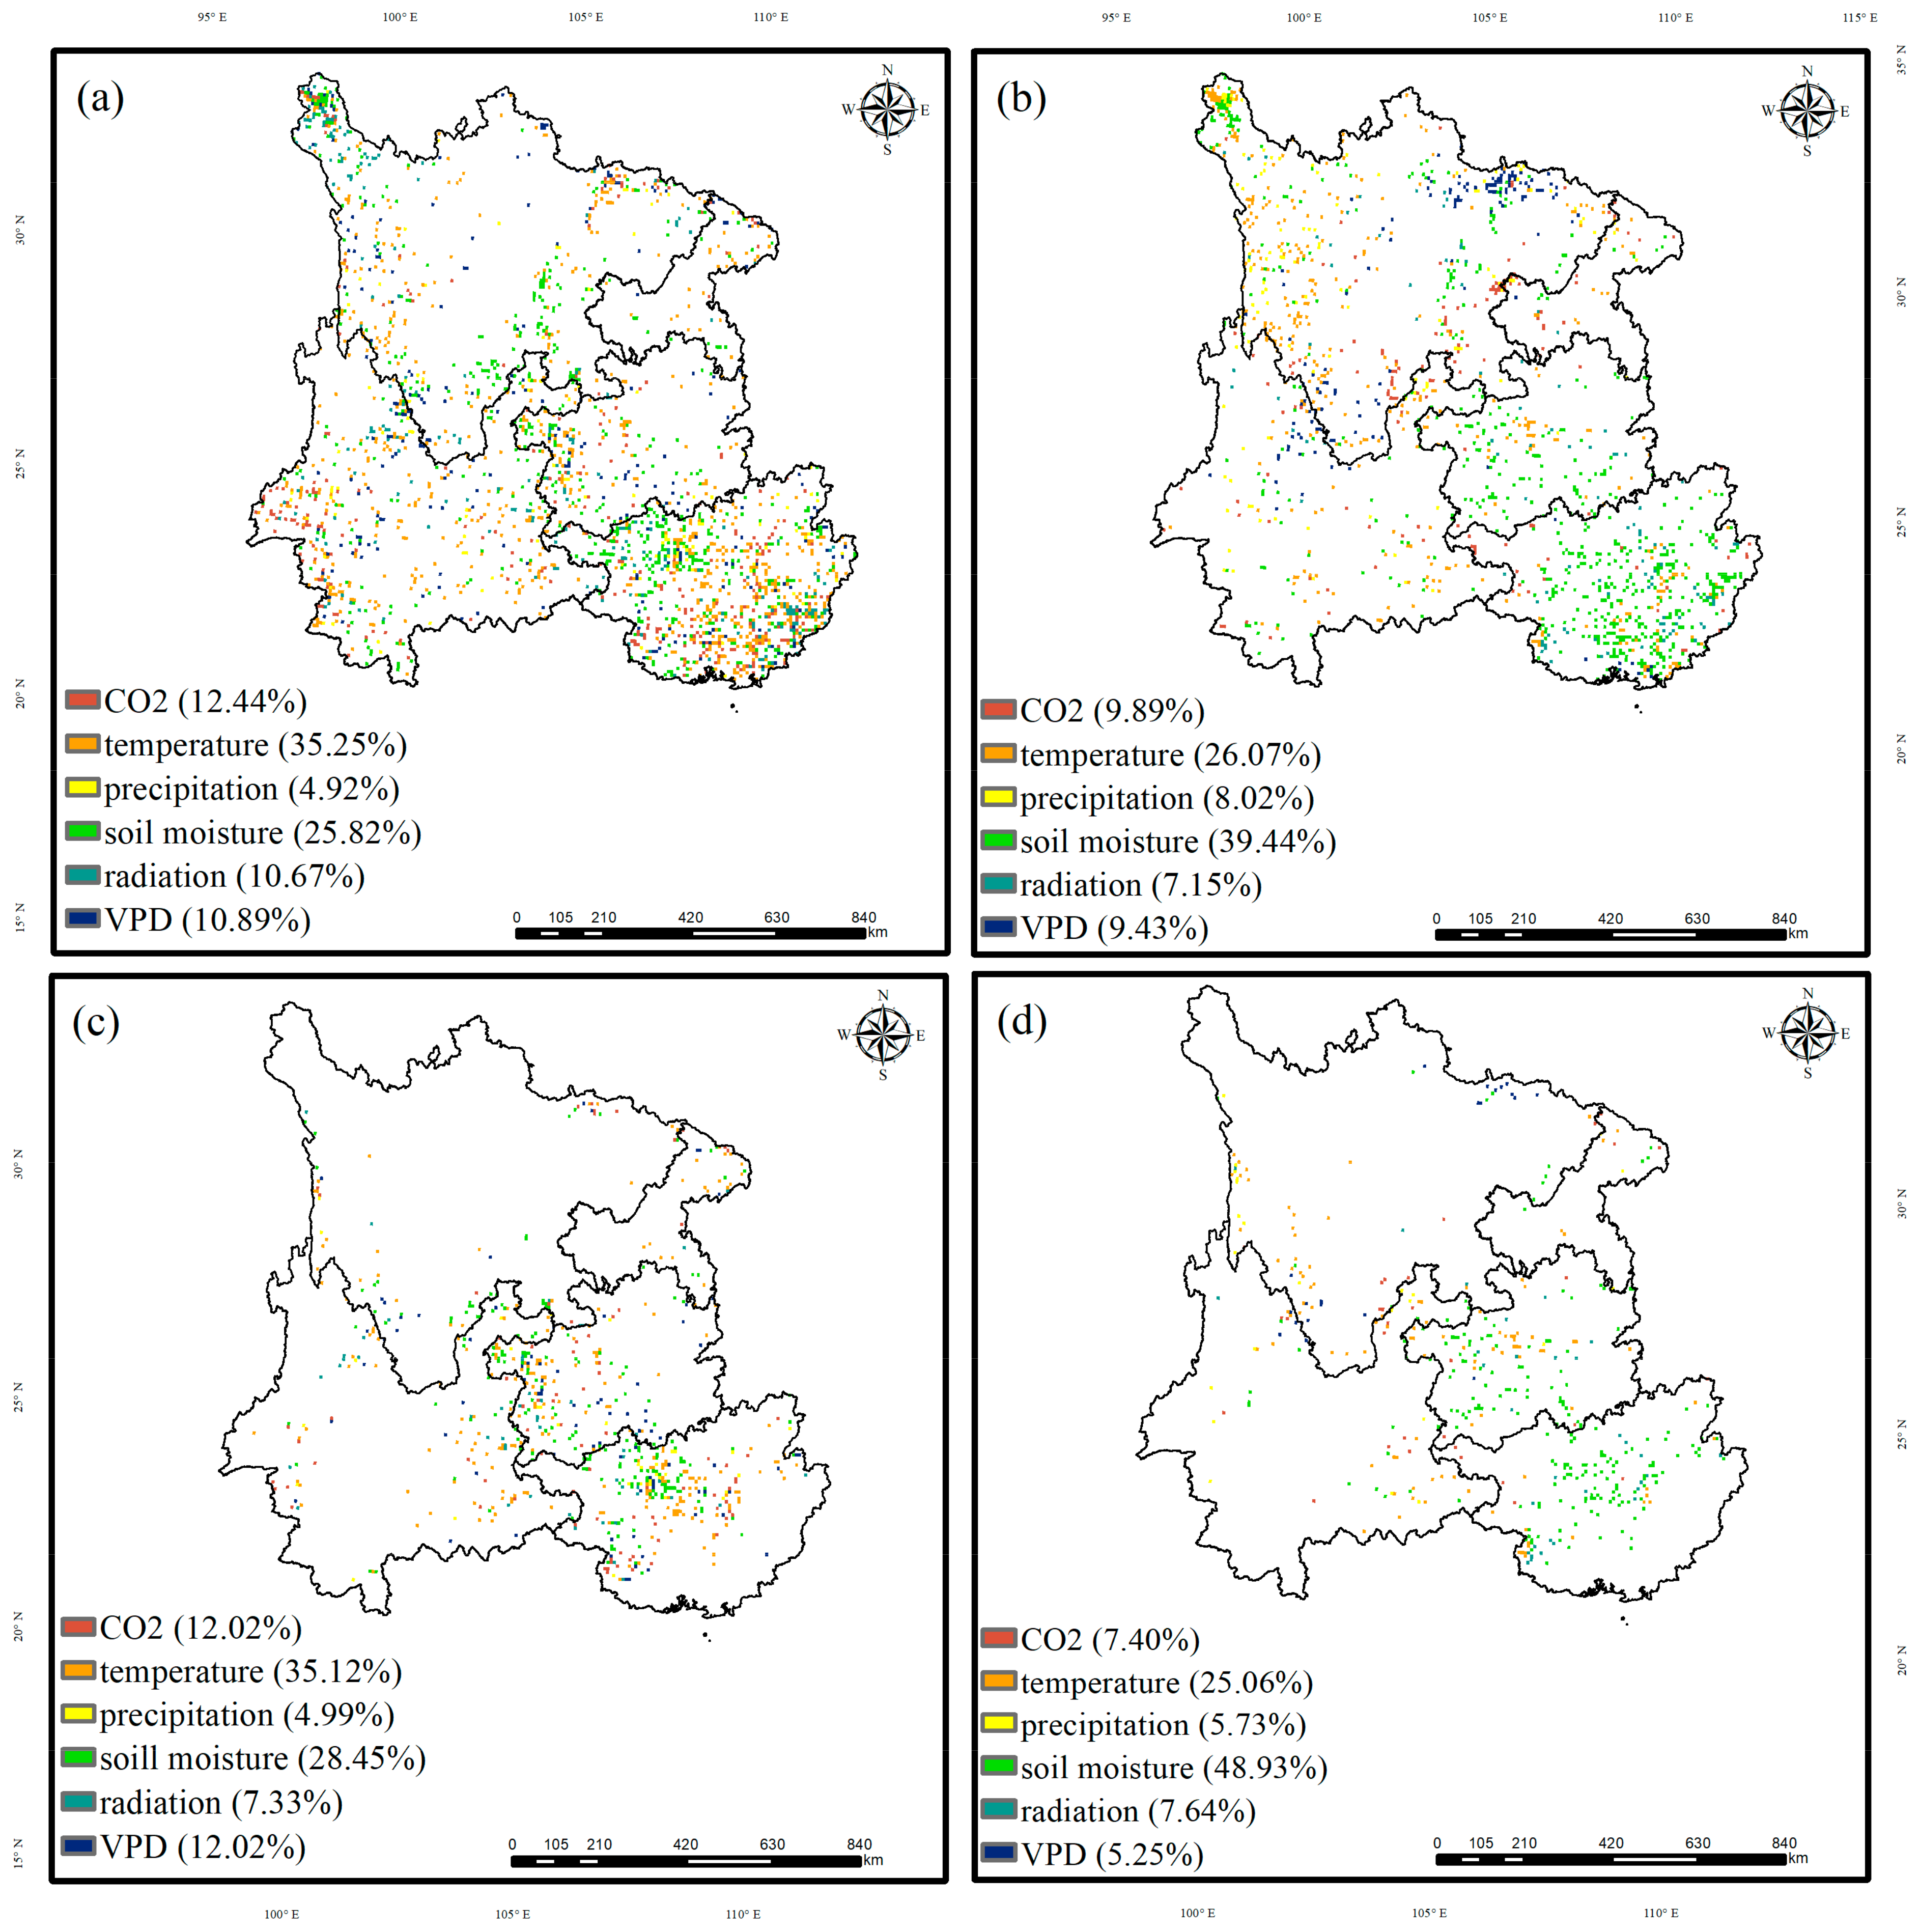
3.3.1. The Carbon Sinks Trends Driven by Climate Change

Temperature, radiation, and soil moisture were the three most influential climate factors affecting increasing trends of carbon sink in both the overall region and the karst areas (Figure 7). The increased carbon sink driven by radiation and soil moisture was mainly located in Guizhou and Guangxi, and increases driven by temperature were mainly located in Chongqing.
In the case of carbon sinks exhibiting positive reversals (Figure 8), temperature and soil moisture were the primary driving factors in both the entire region and the karst areas before the breakpoints. Following the breakpoints, the contribution of soil moisture rose to 39.44% in the entire region and 49.93% in the karst areas, respectively. These increases were observed in the western parts of Guizhou and Guangxi.
For the carbon sinks exhibiting negative reversals, temperature radiation and soil moisture were the primary driving factors in both the entire region and the karst areas before the breakpoints (Figure 9). However, following the breakpoints, the contribution of CO2 increased by 57.53% in the entire region and 27.97% in the karst areas, respectively. Additionally, precipitation showed a notable increase of 10.29% in the entire region and 25.17% in the karst areas.

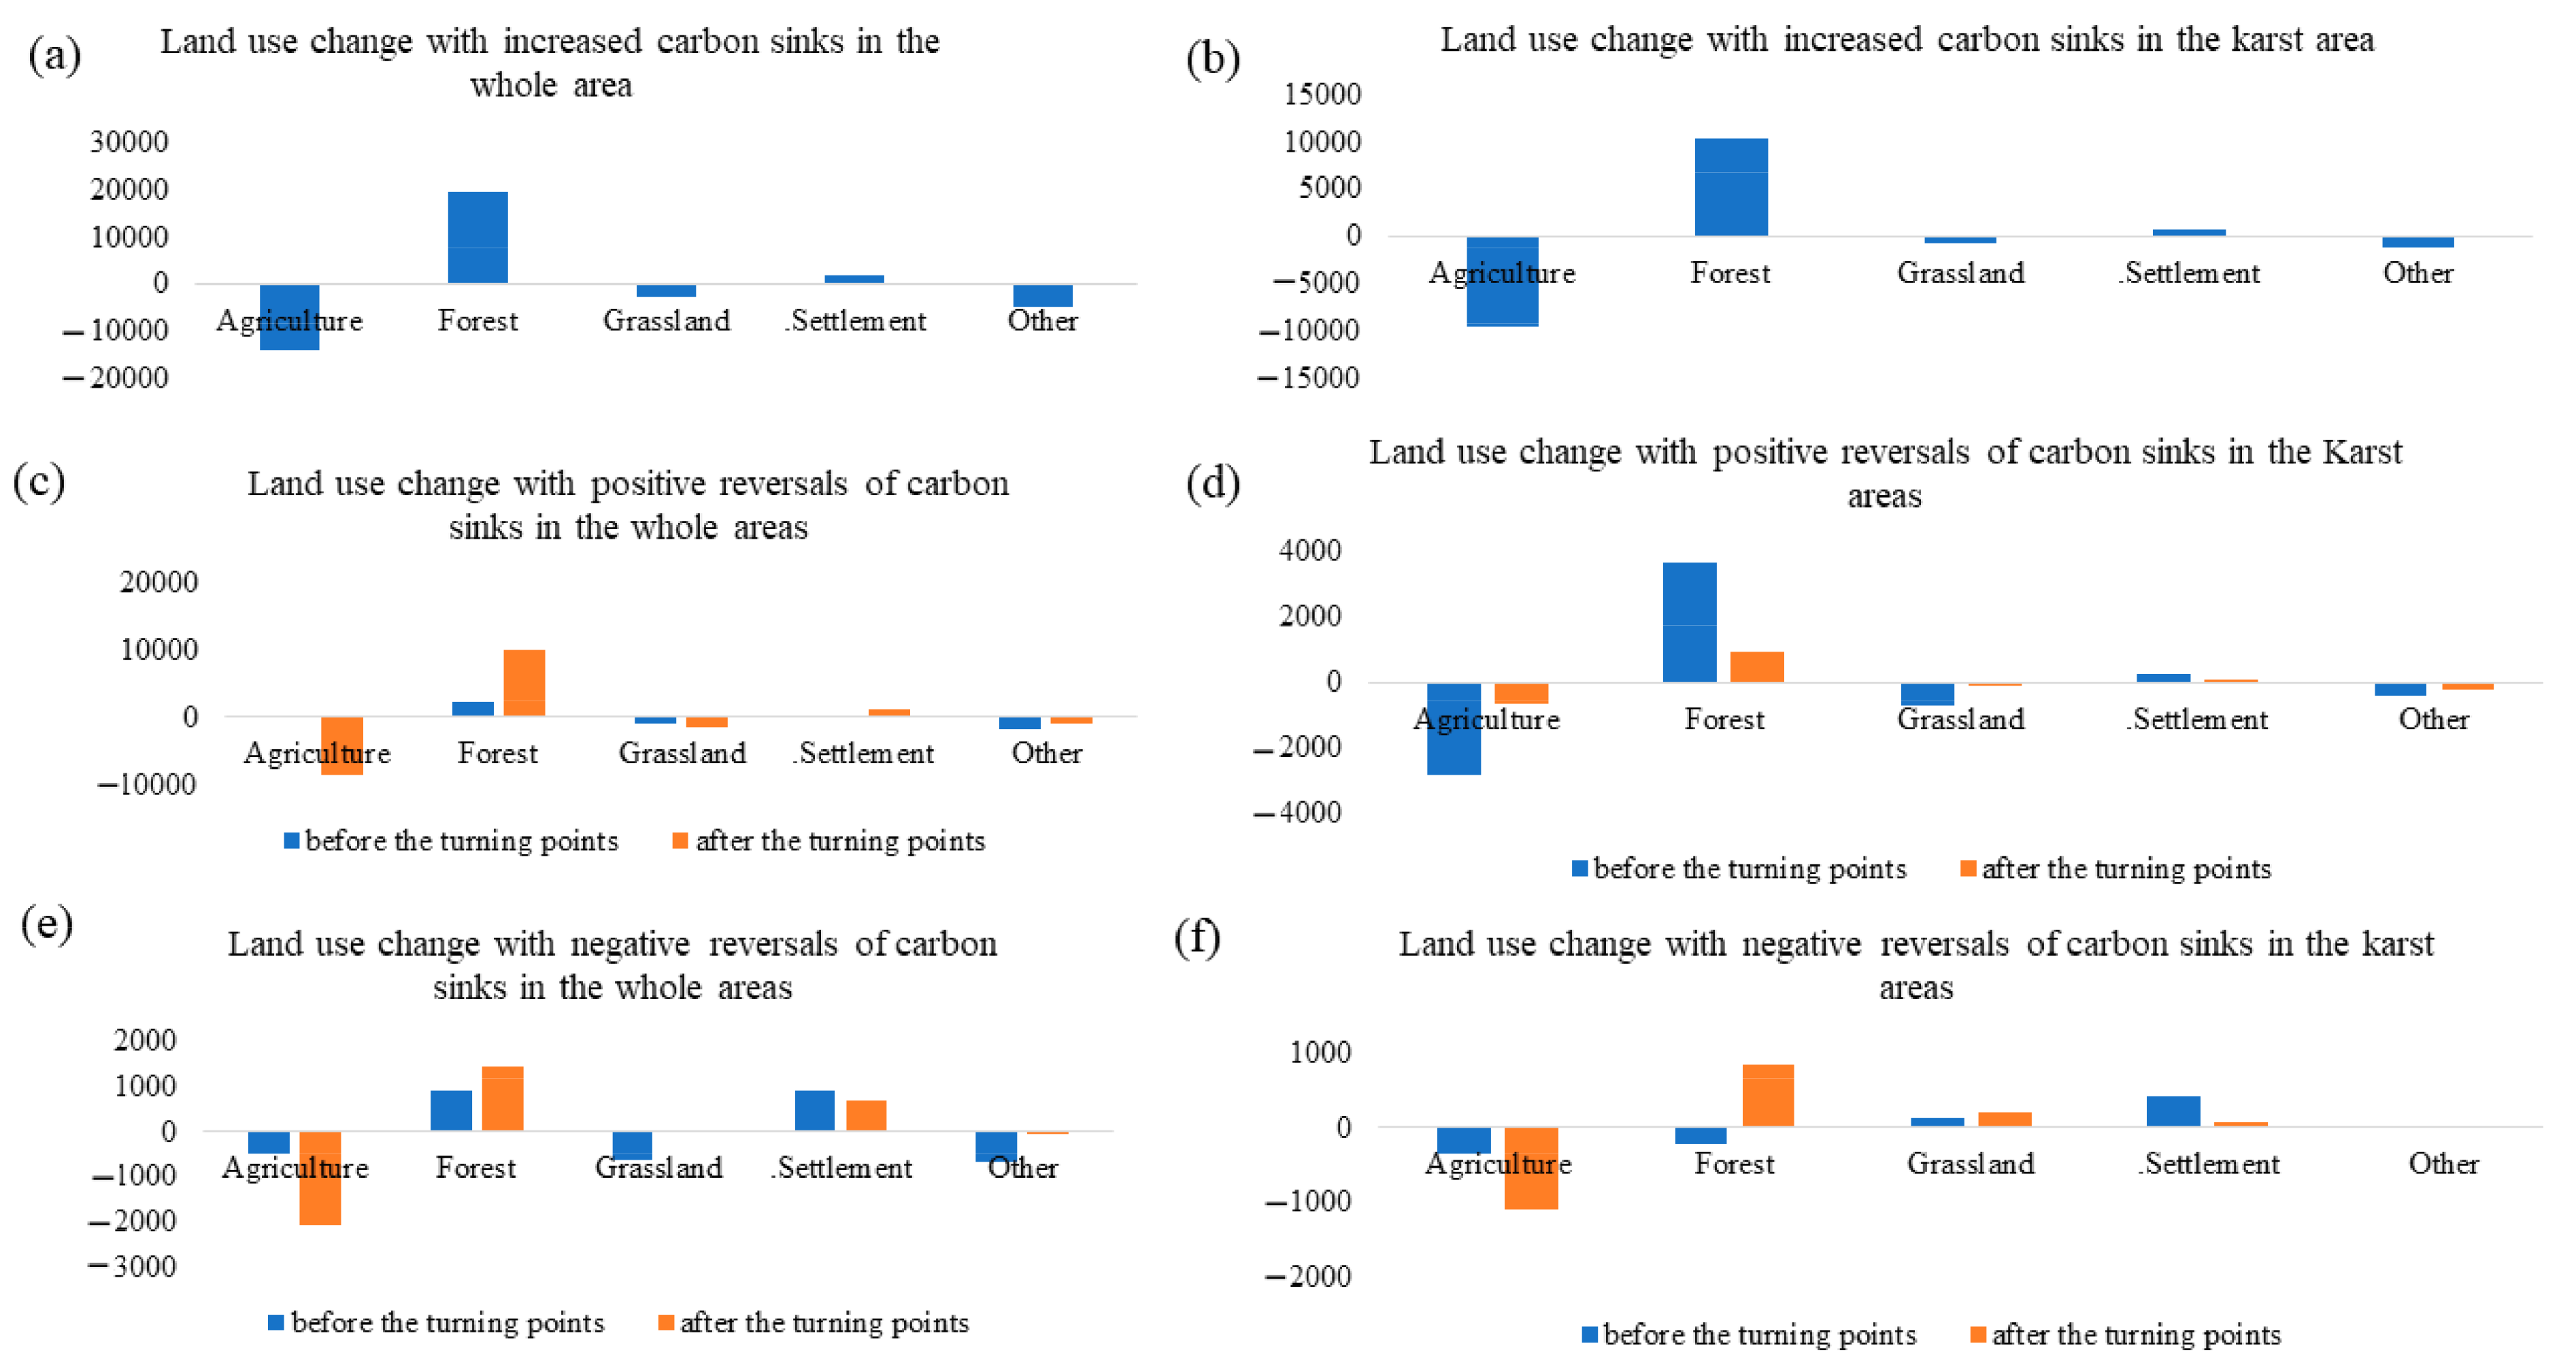
3.3.2. Carbon Sink Trends with Land Use Changes by Ecological Projects

Carbon sinks exhibiting increasing trends were associated with a decrease in the farmland area and an increase in the forestry area across both the entire region and the karst areas. In the entire region (Figure 10a), farmland area shrank by 1.4 × 10⁴ km2, while forestry area expanded by 2 × 10⁴ km2. The proportion of farmland converted into forests accounts for 6.70% of the total farmland area. In the karst areas (Figure 10b), the farmland area shrank by 0.9 × 10⁴ km2, while the forestry area expanded by 1 × 10⁴ km2. The proportion of farmland converted into forests accounts for 7.95% of the total farmland area. Half of the forestry expansion and 60% of the farmland contraction occurred in the karst regions. In addition, ~800 km2 of grassland was converted into forests. The conversion of both farmland and grassland into forests within the karst regions exhibited a notably higher proportion relative to the extent of the karst regions in the entire region. Therefore, carbon sink enhancement can be attributed to ecological engineering projects in Guizhou, Guangxi, and Yunnan, while warming contributed to the increased trends of carbon sinks in Chongqing.
In the case of carbon sinks displaying positive reversals, there was an initial increase in both the farmland and forested areas prior to the breakpoints. Subsequently, post-breakpoints, the farmland area experienced a decline, while the forested area exhibited a substantial increase. Additionally, it is worth noting that the expansion rate of the forestry area was more rapid in the karst regions compared to the entire region. In the entire region (Figure 10c), the farmland and the forests increased by 251.58 km2 and 2263.30 km2 before the breakpoints, respectively. Post-breakpoints, the farmland shrank by 0.8 × 10⁴ km2, while the forests expanded by 1 × 10⁴ km2. In the karst areas (Figure 10d), before the breakpoints, the farmland and the forests increased by 682.70 km2 and 943.05 km2 before the breakpoints, respectively. Post-breakpoints, the area of the farmland shrank by 2829.13 km2, and the forest areas expanded by 3646.44 km2, and 3269.22 km2 of farmland was converted to forest.
In the case of carbon sinks exhibiting negative reversals, before the breakpoints, there was an initial expansion in both the farmland and forested areas preceding the turning points. Subsequently, post-turning points, the farmland area experienced a significant decline, while the forested area continued to expand. In the entire region (Figure 10e), before the breakpoints, the farmland shrank by 480.53 km2, while the forests expanded by 892.48 km2. Following the breakpoints, the farmland shrank by 2059.42 km2, while the forests expanded by 1435.59 km2. In the karst areas (Figure 10f), before the breakpoints, the farmland shrank by 343.23 km2, while the forests expanded by 205.94 km2. After the breakpoints, the farmland area reduced by 1098.36 km2, and the forest area rose by 823.76 km2. Meanwhile, the grassland area rose by 205.94 km2. A total of 961.06 km2 of farmland was converted into forests. These findings underscore that ecological engineering is far from sufficient to mitigate the deterioration of carbon sinks attributed to climate change.

4. Discussion

4.1. Nonlinear Trends of Carbon Sinks

In this study, we assessed carbon sinks in the entire SWC and KRSWC during 1981–2019. Subsequently, we conducted a comprehensive evaluation of the influence of climate change and ecological restoration projects on the carbon sinks in the KRSWC, emphasizing an analysis of nonlinear trends and their driving factors. Our findings indicate that carbon sinks in the karst areas exhibited increasing trends or positive reversals, encompassing 58.47% of the area (Figure 2a). This proportion surpassed the regional average of 45.08% for the entire SWC. This suggests that the karst areas had a greater carbon sequestration potential. These increasing trends and positive reversals of carbon sinks were predominantly concentrated in the western parts of Guizhou and Guangxi. Earlier investigations have suggested that the proportion of notable vegetation greening was more pronounced in the karst regions (6.95%) than in the non-karst areas (3.82%) [3,50]. This aligns with the results of this study. Furthermore, the positive reversal of carbon sinks was predominantly observed during 1996–2005, coinciding with the implementation of the desertification control project and the Grain to Green conservation project [17]. China has actively improved ecosystem functioning through ecological restoration projects since 1998 [17,23]. By 2020, China annually afforested 6.77 million hectares, resulting in a cumulative total of 220 million hectares [51]. About 45% of these forests were planted in SWC, making this region a global hotspot for carbon sinks [27]. Previous studies have established that SWC functions as a significant carbon sink [8,23]. Nonetheless, our study uncovered that one-tenth of the area underwent negative reversals, primarily manifesting after 2010 in the eastern regions of Sichuan, Chongqing, and Guizhou. This highlights the risk of these regions shifting from a sink to a source, posing a challenge to achieving carbon neutrality.

4.2. Driving Mechanism of Carbon Sinks

Multiple lines of evidence support that carbon sinks are driven by climate change (such as rainfall, temperature, soil moisture, and VPD), as well as ecological engineering projects [35,52,53]. Concerning the carbon sinks in the KRSWC, the carbon sink enhancement was predominantly attributed to human activities (81.46%) and was mainly located in Yunnan, Guangxi, and Guizhou. Afforestation and ecological restoration projects play a crucial role in removing carbon from the atmosphere. They have transformed SWC, previously considered a carbon source, into a large carbon sink, aiding in the mitigation of climate change [54]. Ecological restoration projects have greatly enhanced the carbon sinks by converting farmland back to forests and grassland, promoting reforestation in mountainous areas, implementing sustainable harvesting and farming practices, and enhancing overall management [27,55,56]. The implementation of ecological restoration projects, including natural forest protection, land conversion, and karst rocky desertification restoration, has not only successfully mitigated the rocky desertification but also contributed to achieving a notable upsurge in the carbon sinks in the KRSWC [14,28].
Elevated humidity levels and extensive ecological restoration projects constituted the primary drivers behind the positive reversals of carbon sinks across both the entire SWC and KRSWC. Before the breakpoints, SWC experienced high agricultural activity levels, exacerbated conflicts between human activities and the natural landscape, and a significant prevalence of rocky desertification [38]. Consequently, carbon sinks exhibited declining trends during this period. Subsequently, the implementation of ecological restoration projects led to ecosystem rehabilitation within the karst areas. This resulted in a substantial enhancement of carbon sequestration capacity compared to the entire region [14,27,38,57]. Additionally, previous studies have shown that temperature, rather than precipitation, emerged as the primary factor impeding soil carbon sequestration in SWC [58,59]. Contrarily, in our investigation, both drought and warming emerged as the principal drivers behind carbon sink reduction in Guangxi before the breakpoints. Subsequently, heightened humidity levels prompted a shift from declining to ascending carbon sink trends after the breakpoints.
In the karst areas of Chongqing and Guizhou, carbon sinks exhibited negative reversals. Before the breakpoints, these reversals were predominantly fueled by human activities, marked by a 343.23 km2 reduction in farmland and a 205.94 km2 expansion of forested areas. Following the breakpoints, despite the adoption of ecological engineering measures, the influence of these efforts on carbon sink enhancement was offset by rising temperatures and drought conditions. This led to a transition from increasing to declining carbon sink trends [60]. Within the diverse karst landscapes of SWC, susceptible to water scarcity, ecosystem carbon sinks exhibited a more pronounced sensitivity to drought compared to the non-karst areas [60]. The reduction in precipitation and the escalation of temperatures resulted in a notable intensification of drying conditions, particularly in the case of severe and extreme droughts, in Chongqing and Guizhou provinces after the breakpoints [61]. Previous research has indicated a forthcoming increase in the severity, frequency, and duration of drought in the KRSWC [62,63,64]. Nevertheless, the intricate geomorphic characteristics and the presence of extreme climate fluctuations pose constraints on the effectiveness of ecological engineering, particularly in Chongqing and eastern Guizhou. This complexity hinders efforts to amplify carbon sinks and shift them from declining to ascending trends.

5. Conclusions

The ecological environment of the karst areas is fragile, but the trend of carbon sink change is not clear. Here, we used the CASA model and soil respiration data to estimate the carbon sinks across SWC and quantified the effects of ecological engineering and climate change on the trend of carbon sinks via RESTREND. Our results show that the carbon sinks in the karst areas show an increasing trend or positive reversals, with the carbon sinks accounting for 58.47% of the KRSWC, while only 45.08% of the entire SWC showed the same trends during the same period. However, about 10.42% of the carbon sinks showed a negative reversal. Ecological restoration projects contributed to the carbon sink enhancement. Increased humidity and ecological restoration management were the main reasons for the positive reversal of carbon sinks. Climate change (warming and droughts) shifted the carbon sinks from increasing to decreasing. The results of this study highlight the important role of ecological restoration projects in carbon sink enhancement and revisit the offsetting effects of climate change on carbon sink enhancement. However, this study still has certain limitations and uncertainties. Climate change can introduce significant uncertainty regarding potential carbon sink increases in karst regions. Additionally, the interplay between climatic factors and human activities could diminish the potential carbon sink increase. Further investigation should focus on the long-term impacts of human activities as well as climatic feedback to more accurately predict future carbon sink increases in the karst regions. Furthermore, due to limited current data availability, certain driving factors, including pests, diseases, extreme weather, urban green infrastructure management, animal husbandry, and other greenhouse gases, were not thoroughly examined in this study. Therefore, future research should comprehensively assess additional driving factors to uncover their interactions within the carbon cycle and predict the sustainability of carbon sinks.

Author Contributions

Conceptualization, X.X.; methodology, X.X., F.J., D.L., R.Y. and J.L.; software, F.J., D.L. and J.L.; validation, X.X., R.Y., K.Z. and J.L.; formal analysis, X.X. and J.L.; investigation, X.X. and J.L.; resources, X.X.; data curation, X.X. and D.L.; writing—original draft preparation, X.X.; writing—review and editing, X.X.; visualization, X.X.; supervision, X.X. and J.L.; project administration, N.L.; funding acquisition, N.L. and C.Z. All authors have read and agreed to the published version of the manuscript.

Funding

This work was funded by the Key Research and Development Program of China (2021YFB3901104), the Special Fund of the Jiangsu for Carbon Peak and Carbon Neutralization Science and Technology Innovation (BK20220021), and the Special Fund of the Chinese Central Government for Basic Scientific Research Operations in the Commonweal Research Institute (GYZX210405).

Data Availability Statement

The data in this study are available upon request from the corresponding author.

Conflicts of Interest

The authors declare no conflict of interest.

References

  1. Yang, Y.; Shi, Y.; Sun, W.; Chang, J.; Zhu, J.; Chen, L.; Wang, X.; Guo, Y.; Zhang, H.; Yu, L.; et al. Terrestrial carbon sinks in China and around the world and their contribution to carbon neutrality. Sci. China Life Sci. 2022, 65, 861–895. [Google Scholar] [CrossRef]
  2. Anderegg, W.R.L.; Trugman, A.T.; Badgley, G.; Anderson, C.M.; Bartuska, A.; Ciais, P.; Cullenward, D.; Field, C.B.; Freeman, J.; Goetz, S.J.; et al. Climate-driven risks to the climate mitigation potential of forests. Science 2020, 368, eaaz7005. [Google Scholar] [CrossRef]
  3. Qiao, Y.; Jiang, Y.; Zhang, C. Contribution of karst ecological restoration engineering to vegetation greening in southwest China during recent decade. Ecol. Indic. 2021, 121, 107081. [Google Scholar] [CrossRef]
  4. Leifeld, J. Carbon farming: Climate change mitigation via non-permanent carbon sinks. J. Environ. Manag. 2023, 339, 117893. [Google Scholar] [CrossRef] [PubMed]
  5. Williams, M.; Reay, D.; Smith, P. Avoiding emissions versus creating sinks—Effectiveness and attractiveness to climate finance. Glob. Chang. Biol. 2023, 29, 2046–2049. [Google Scholar] [CrossRef] [PubMed]
  6. He, G.; Zhao, X.; Yu, M. Exploring the multiple disturbances of karst landscape in Guilin World Heritage Site, China. Catena 2021, 203, 105349. [Google Scholar] [CrossRef]
  7. Hartmann, A.; Goldscheider, N.; Wagener, T.; Lange, J.; Weiler, M. Karst water resources in a changing world: Review of hydrological modeling approaches. Rev. Geophys. 2014, 52, 218–242. [Google Scholar] [CrossRef]
  8. Huang, J.; Ge, Z.; Huang, Y.; Tang, X.; Shi, Z.; Lai, P.; Song, Z.; Hao, B.; Yang, H.; Ma, M. Climate change and ecological engineering jointly induced vegetation greening in global karst regions from 2001 to 2020. Plant Soil 2021, 475, 193–212. [Google Scholar] [CrossRef]
  9. Chaudhary, N.; Zhang, W.; Lamba, S.; Westermann, S. Modeling Pan-Arctic Peatland Carbon Dynamics Under Alternative Warming Scenarios. Geophys. Res. Lett. 2022, 49, e2021GL095276. [Google Scholar] [CrossRef]
  10. Ilyina, T.; Li, H.; Spring, A.; Müller, W.A.; Bopp, L.; Chikamoto, M.O.; Danabasoglu, G.; Dobrynin, M.; Dunne, J.; Fransner, F.; et al. Predictable Variations of the Carbon Sinks and Atmospheric CO2 Growth in a Multi-Model Framework. Geophys. Res. Lett. 2021, 48, e2020GL090695. [Google Scholar] [CrossRef]
  11. Clifton, O.E.; Fiore, A.M.; Massman, W.J.; Baublitz, C.B.; Coyle, M.; Emberson, L.; Fares, S.; Farmer, D.K.; Gentine, P.; Gerosa, G.; et al. Dry Deposition of Ozone over Land: Processes, Measurement, and Modeling. Rev. Geophys. 2020, 58, e2019RG000670. [Google Scholar] [CrossRef] [PubMed]
  12. Wang, X.; Liu, L.; Piao, S.; Janssens, I.A.; Tang, J.; Liu, W.; Chi, Y.; Wang, J.; Xu, S. Soil respiration under climate warming: Differential response of heterotrophic and autotrophic respiration. Glob. Chang. Biol. 2014, 20, 3229–3237. [Google Scholar] [CrossRef] [PubMed]
  13. Lian, J.; Chen, H.; Wang, F.; Nie, Y.; Wang, K. Separating the relative contributions of climate change and ecological restoration to runoff change in a mesoscale karst basin. Catena 2020, 194, 104705. [Google Scholar] [CrossRef]
  14. Zhang, X.M.; Brandt, M.; Yue, Y.M.; Tong, X.W.; Wang, K.L.; Fensholt, R. The Carbon Sink Potential of Southern China after Two Decades of Afforestation. Earth’s Future 2022, 10, e2022EF002674. [Google Scholar] [CrossRef] [PubMed]
  15. Mummery, J. Environmental integrity of forest offsets in a changing climate: Embedding future climate in Australia’s sinks policy regime. J. Environ. Plan. Manag. 2023, 67, 1–19. [Google Scholar] [CrossRef]
  16. Xu, X.; Liu, J.; Jiao, F.; Zhang, K.; Ye, X.; Gong, H.; Lin, N.; Zou, C. Ecological engineering induced carbon sinks shifting from decreasing to increasing during 1981–2019 in China. Sci. Total Env. 2023, 864, 161037. [Google Scholar] [CrossRef]
  17. Chen, Y.; Feng, X.; Tian, H.; Wu, X.; Gao, Z.; Feng, Y.; Piao, S.; Lv, N.; Pan, N.; Fu, B. Accelerated increase in vegetation carbon sequestration in China after 2010: A turning point resulting from climate and human interaction. Glob. Chang. Biol. 2021, 27, 5848–5864. [Google Scholar] [CrossRef]
  18. Xu, X.; Jiao, F.; Liu, H.; Gong, H.; Zou, C.; Lin, N.; Xue, P.; Zhang, M.; Wang, K. Persistence of increasing vegetation gross primary production under the interactions of climate change and land use changes in Northwest China. Sci. Total Env. 2022, 834, 155086. [Google Scholar] [CrossRef]
  19. Frank, D.; Reichstein, M.; Bahn, M.; Thonicke, K.; Frank, D.; Mahecha, M.D.; Smith, P.; van der Velde, M.; Vicca, S.; Babst, F.; et al. Effects of climate extremes on the terrestrial carbon cycle: Concepts, processes and potential future impacts. Glob. Chang. Biol. 2015, 21, 2861–2880. [Google Scholar] [CrossRef]
  20. Piao, S.; Wang, X.; Wang, K.; Li, X.; Bastos, A.; Canadell, J.; Ciais, P.; Friedlingstein, P.; Sitch, S. Interannual variation of terrestrial carbon cycle: Issues and perspectives. Glob. Chang. Biol. 2019, 26, 300–318. [Google Scholar] [CrossRef]
  21. Piao, S.; Yue, C.; Ding, J.; Guo, Z. Perspectives on the role of terrestrial ecosystems in the ‘carbon neutrality’ strategy. Sci. China-Earth Sci. 2022, 65, 1178–1186. [Google Scholar] [CrossRef]
  22. Koch, A.; Hubau, W.; Lewis, S.L. Earth System Models Are Not Capturing Present-Day Tropical Forest Carbon Dynamics. Earth’s Future 2021, 9, e2020EF001874. [Google Scholar] [CrossRef]
  23. He, H.; Wang, S.; Zhang, L.; Wang, J.; Ren, X.; Zhou, L.; Piao, S.; Yan, H.; Ju, W.; Gu, F.; et al. Altered trends in carbon uptake in China’s terrestrial ecosystems under the enhanced summer monsoon and warming hiatus. Natl. Sci. Rev. 2019, 6, 505–514. [Google Scholar] [CrossRef]
  24. Diallo, T.M.O.; Morin, A.J.S. Power of Latent Growth Curve Models to Detect Piecewise Linear Trajectories. Struct. Equ. Model. Multidiscip. J. 2015, 22, 449–460. [Google Scholar] [CrossRef]
  25. Sun, G.; Stynes, M. Finite element methods on piecewise equidistant meshes for interior turning point problems. Numer. Algorithms 1994, 8, 111–129. [Google Scholar] [CrossRef]
  26. Piao, S.; Wang, X.; Ciais, P.; Zhu, B.; Wang, T.A.O.; Liu, J.I.E. Changes in satellite-derived vegetation growth trend in temperate and boreal Eurasia from 1982 to 2006. Glob. Chang. Biol. 2011, 17, 3228–3239. [Google Scholar] [CrossRef]
  27. Tong, X.; Brandt, M.; Yue, Y.; Horion, S.; Wang, K.; Keersmaecker, W.D.; Tian, F.; Schurgers, G.; Xiao, X.; Luo, Y.; et al. Increased vegetation growth and carbon stock in China karst via ecological engineering. Nat. Sustain. 2018, 1, 44–50. [Google Scholar] [CrossRef]
  28. Yue, Y.; Liao, C.; Tong, X.; Wu, Z.; Fensholt, R.; Prishchepov, A.; Jepsen, M.R.; Wang, K.; Brandt, M. Large scale reforestation of farmlands on sloping hills in South China karst. Landsc. Ecol. 2020, 35, 1445–1458. [Google Scholar] [CrossRef]
  29. Arora, V.K.; Melton, J.R. Reduction in global area burned and wildfire emissions since 1930s enhances carbon uptake by land. Nat. Commun. 2018, 9, 1326. [Google Scholar] [CrossRef]
  30. Chen, J.M.; Ju, W.; Ciais, P.; Viovy, N.; Liu, R.; Liu, Y.; Lu, X. Vegetation structural change since 1981 significantly enhanced the terrestrial carbon sink. Nat. Commun. 2019, 10, 4259. [Google Scholar] [CrossRef]
  31. Peters, W.; van der Velde, I.R.; van Schaik, E.; Miller, J.B.; Ciais, P.; Duarte, H.F.; van der Laan-Luijkx, I.T.; van der Molen, M.K.; Scholze, M.; Schaefer, K.; et al. Increased water-use efficiency and reduced CO2 uptake by plants during droughts at a continental-scale. Nat. Geosci. 2018, 11, 744–748. [Google Scholar] [CrossRef] [PubMed]
  32. Redlin, M.; Gries, T. Anthropogenic climate change: The impact of the global carbon budget. Theor. Appl. Climatol. 2021, 146, 713–721. [Google Scholar] [CrossRef]
  33. Ding, J.; Yang, T.; Zhao, Y.; Liu, D.; Wang, X.; Yao, Y.; Peng, S.; Wang, T.; Piao, S. Increasingly Important Role of Atmospheric Aridity on Tibetan Alpine Grasslands. Geophys. Res. Lett. 2018, 45, 2852–2859. [Google Scholar] [CrossRef]
  34. Konings, A.G.; Williams, A.P.; Gentine, P. Sensitivity of grassland productivity to aridity controlled by stomatal and xylem regulation. Nat. Geosci. 2017, 10, 284–288. [Google Scholar] [CrossRef]
  35. He, B.; Chen, C.; Lin, S.; Yuan, W.; Chen, H.W.; Chen, D.; Zhang, Y.; Guo, L.; Zhao, X.; Liu, X.; et al. Worldwide impacts of atmospheric vapor pressure deficit on the interannual variability of terrestrial carbon sinks. Natl. Sci. Rev. 2022, 9, nwab150. [Google Scholar] [CrossRef]
  36. Qi, X.; Jia, J.; Liu, H.; Lin, Z. Relative importance of climate change and human activities for vegetation changes on China’s silk road economic belt over multiple timescales. Catena 2019, 180, 224–237. [Google Scholar] [CrossRef]
  37. Sun, Y.L.; Yang, Y.L.; Zhang, L.; Wang, Z.L. The relative roles of climate variations and human activities in vegetation change in North China. Phys. Chem. Earth 2015, 87–88, 67–78. [Google Scholar] [CrossRef]
  38. Cai, H.; Yang, X.; Wang, K.; Xiao, L. Is Forest Restoration in the Southwest China Karst Promoted Mainly by Climate Change or Human-Induced Factors? Remote Sens. 2014, 6, 9895–9910. [Google Scholar] [CrossRef]
  39. Goldscheider, N.; Chen, Z.; Auler, A.S.; Bakalowicz, M.; Broda, S.; Drew, D.; Hartmann, J.; Jiang, G.; Moosdorf, N.; Stevanovic, Z.; et al. Global distribution of carbonate rocks and karst water resources. Hydrogeol. J. 2020, 28, 1661–1677. [Google Scholar] [CrossRef]
  40. Keenan, T.F.; Williams, C.A. The Terrestrial Carbon Sink. Annu. Rev. Environ. Resour. 2018, 43, 219–243. [Google Scholar] [CrossRef]
  41. Ying, J.; Jiang, J.; Wang, H.; Liu, Y.; Gong, W.; Liu, B.; Han, G. Analysis of the Income Enhancement Potential of the Terrestrial Carbon Sink in China Based on Remotely Sensed Data. Remote Sens. 2023, 15, 3849. [Google Scholar] [CrossRef]
  42. Piao, S.; Fang, J.; He, J. Variations in Vegetation Net Primary Production in the Qinghai-Xizang Plateau, China, from 1982 to 1999. Clim. Chang. 2006, 74, 253–267. [Google Scholar] [CrossRef]
  43. Zhang, M.; Huang, X.; Chuai, X.; Xie, X.; Zhu, Z.; Wang, Y. Spatial Distribution and Changing Trends of Net Ecosystem Productivity in China. Geogr. Geo-Inf. Sci. 2020, 36, 69–74. [Google Scholar]
  44. Chen, S.; Huang, Y.; Zou, J.; Shi, Y.; Lu, Y.; Zhang, W.; Hu, Z. Interannual variability in soil respiration from terrestrial ecosystems in China and its response to climate change. Sci. China Earth Sci. 2012, 55, 2091–2098. [Google Scholar] [CrossRef]
  45. Xu, X.; Liu, H.; Lin, Z.; Jiao, F.; Gong, H. Relationship of Abrupt Vegetation Change to Climate Change and Ecological Engineering with Multi-Timescale Analysis in the Karst Region, Southwest China. Remote Sens. 2019, 11, 1564. [Google Scholar] [CrossRef]
  46. Abatzoglou, J.T.; Dobrowski, S.Z.; Parks, S.A.; Hegewisch, K.C. TerraClimate, a high-resolution global dataset of monthly climate and climatic water balance from 1958–2015. Sci. Data 2018, 5, 170191. [Google Scholar] [CrossRef]
  47. Pan, N.; Feng, X.; Fu, B.; Wang, S.; Ji, F.; Pan, S. Increasing global vegetation browning hidden in overall vegetation greening: Insights from time-varying trends. Remote Sens. Environ. 2018, 214, 59–72. [Google Scholar] [CrossRef]
  48. Chu, H.; Venevsky, S.; Wu, C.; Wang, M. NDVI-based vegetation dynamics and its response to climate changes at Amur-Heilongjiang River Basin from 1982 to 2015. Sci. Total Env. 2019, 650, 2051–2062. [Google Scholar] [CrossRef]
  49. Sen, P.K. Estimates of the Regression Coefficient Based on Kendall’s Tau. J. Am. Stat. Assoc. 1968, 63, 1379–1389. [Google Scholar] [CrossRef]
  50. Brandt, M.; Yue, Y.; Wigneron, J.P.; Tong, X.; Tian, F.; Jepsen, M.R.; Xiao, X.; Verger, A.; Mialon, A.; Al-Yaari, A.; et al. Satellite-Observed Major Greening and Biomass Increase in South China Karst During Recent Decade. Earth’s Future 2018, 6, 1017–1028. [Google Scholar] [CrossRef]
  51. Chen, C.; Park, T.; Wang, X.; Piao, S.; Xu, B.; Chaturvedi, R.K.; Fuchs, R.; Brovkin, V.; Ciais, P.; Fensholt, R.; et al. China and India lead in greening of the world through land-use management. Nat. Sustain. 2019, 2, 122–129. [Google Scholar] [CrossRef] [PubMed]
  52. Dornburg, V.; Marland, G. Temporary storage of carbon in the biosphere does have value for climate change mitigation: A response to the paper by Miko Kirschbaum. Mitig. Adapt. Strateg. Glob. Chang. 2007, 13, 211–217. [Google Scholar] [CrossRef]
  53. O’Sullivan, M.; Friedlingstein, P.; Sitch, S.; Anthoni, P.; Arneth, A.; Arora, V.K.; Bastrikov, V.; Delire, C.; Goll, D.S.; Jain, A.; et al. Process-oriented analysis of dominant sources of uncertainty in the land carbon sink. Nat. Commun. 2022, 13, 4781. [Google Scholar] [CrossRef] [PubMed]
  54. Chang, J.; Yue, Y.; Tong, X.; Brandt, M.; Zhang, C.; Zhang, X.; Qi, X.; Wang, K. Rural outmigration generates a carbon sink in South China karst. Prog. Phys. Geogr. Earth Environ. 2023, 47, 655–667. [Google Scholar] [CrossRef]
  55. Yue, Y.; Qi, X.; Wang, K.; Liao, C.; Tong, X.; Brandt, M.; Liu, B. Large scale rocky desertification reversal in South China karst. Prog. Phys. Geogr. Earth Environ. 2022, 46, 661–675. [Google Scholar] [CrossRef]
  56. Houghton, R.A. Interactions Between Land-Use Change and Climate-Carbon Cycle Feedbacks. Curr. Clim. Chang. Rep. 2018, 4, 115–127. [Google Scholar] [CrossRef]
  57. Tong, X.; Brandt, M.; Yue, Y.; Ciais, P.; Rudbeck Jepsen, M.; Penuelas, J.; Wigneron, J.P.; Xiao, X.; Song, X.P.; Horion, S.; et al. Forest management in southern China generates short term extensive carbon sequestration. Nat. Commun. 2020, 11, 129. [Google Scholar] [CrossRef]
  58. Zhu, X.-C.; Ma, M.-G.; Tateno, R.; He, X.-H.; Shi, W.-Y. Effects of vegetation restoration on soil carbon dynamics in Karst and non-karst regions in Southwest China: A synthesis of multi-source data. Plant Soil 2021, 475, 45–59. [Google Scholar] [CrossRef]
  59. Allen, C.D.; Macalady, A.K.; Chenchouni, H.; Bachelet, D.; McDowell, N.; Vennetier, M.; Kitzberger, T.; Rigling, A.; Breshears, D.D.; Hogg, E.H.; et al. A global overview of drought and heat-induced tree mortality reveals emerging climate change risks for forests. For. Ecol. Manag. 2010, 259, 660–684. [Google Scholar] [CrossRef]
  60. Wang, M.; Ding, Z.; Wu, C.; Song, L.; Ma, M.; Yu, P.; Lu, B.; Tang, X. Divergent responses of ecosystem water-use efficiency to extreme seasonal droughts in Southwest China. Sci. Total Env. 2021, 760, 143427. [Google Scholar] [CrossRef]
  61. Wang, P.; Wu, X.; Hao, Y.; Wu, C.; Zhang, J. Is Southwest China drying or wetting? Spatiotemporal patterns and potential causes. Theor. Appl. Climatol. 2019, 139, 1–15. [Google Scholar] [CrossRef]
  62. Li, X.; Piao, S.; Huntingford, C.; Peñuelas, J.; Yang, H.; Xu, H.; Chen, A.; Friedlingstein, P.; Keenan, T.F.; Sitch, S. Global variations in critical drought thresholds that impact vegetation. Natl. Sci. Rev. 2023, 10, nwad049. [Google Scholar] [CrossRef] [PubMed]
  63. Pu, J.; Zhao, X.; Huang, P.; Gu, Z.; Shi, X.; Chen, Y.; Shi, X.; Tao, J.; Xu, Y.; Xiang, A. Ecological risk changes and their relationship with exposed surface fraction in the karst region of southern China from 1990 to 2020. J. Env. Manag. 2022, 323, 116206. [Google Scholar] [CrossRef]
  64. Huang, X.; Zhou, Y.; Zhang, Z. Carbon Sequestration Anticipation Response to land use change in a mountainous karst basin in China. J. Env. Manag. 2018, 228, 40–46. [Google Scholar] [CrossRef] [PubMed]
Figure 1. (a) The distribution of karst regions in Southwest China; (b) the elevation in the karst region in Southwest China.
Land 12 01906 g001
Figure 2. Pattern of the nonlinear trends of carbon sinks in the (a) entire SWC and (b) KRSWC. The area proportion is also given.
Land 12 01906 g002
Figure 3. The timings of the breakpoints of carbon sinks experiencing (a) negative reversals and (b) positive reversals. Only breakpoints that passed the significance test are shown.
Land 12 01906 g003
Figure 4. Pattern of the dominant role of climate change and human activities in the increasing trends of carbon sinks in the (a) entire SWC and (b) KRSWC. The area proportion is also given.
Land 12 01906 g004
Figure 5. Pattern of the dominant role of climate change and human activities in the positive shifts of carbon sinks (a) before the breakpoints in the entire SWC, (b) after the breakpoints in the entire SWC, (c) before the breakpoints in the KRSWC, and (d) after the breakpoints in the KRSWC. The area proportion is also given.
Land 12 01906 g005
Figure 6. Pattern of the dominant role of climate change and human activities in the negative shifts of carbon sinks (a) before the breakpoints in the entire SWC, (b) after the breakpoints in the entire SWC, (c) before the breakpoints in the KRSWC, and (d) after the breakpoints in the KRSWC. The area proportion is also given.
Land 12 01906 g006
Figure 7. Pattern of the dominant role of climate factors in the increasing trends of carbon sinks (a) in the entire SWC and (b) in the KRSWC. The area proportion is also given.
Land 12 01906 g007
Figure 8. Pattern of the dominant role of climate factors in the positive reversals of carbon sinks (a) before the breakpoints in the entire SWC; (b) after the breakpoints in the entire SWC; (c) before the breakpoints in the KRSWC; (d) after the breakpoints in the KRSWC. The area proportion is also given.
Land 12 01906 g008
Figure 9. Pattern of the dominant role of climate factors in the negative reversals of carbon sinks (a) before the breakpoints in the entire SWC; (b) after the breakpoints in the entire SWC; (c) before the breakpoints in the KRSWC; (d) after the breakpoints in the KRSWC. The area proportion is also given.
Land 12 01906 g009
Figure 10. Land use change in the (a) entire SWC with increasing trends, (b) the KRSWC with increasing trends, (c) the entire SWC with positive reversal trends, (d) the KRSWC with positive reversal trends, (e) the entire SWC with negative reversal trends, and (f) the KRSWC with negative reversal trends.
Land 12 01906 g010
Table 1. Detailed information of all data used in this study.
NamesData SourcesPeriodsSpatial Resolution
NDVIAVHRR 3g [45]1981–20191/12°
Temperature and precipitationWorldClim [2]1981–20191 km
Downward shortwave radiation (RAD)TerraClimate1981–20191/24°
The land use (LUC)Copernicus climate data store [46]1992–2019300 m
CO2EDGAR [31]1981–20190.1°
Vapor pressure deficit (VPD)Provided by a previous study [35]1981–20190.1°
Disclaimer/Publisher’s Note: The statements, opinions and data contained in all publications are solely those of the individual author(s) and contributor(s) and not of MDPI and/or the editor(s). MDPI and/or the editor(s) disclaim responsibility for any injury to people or property resulting from any ideas, methods, instructions or products referred to in the content.

