1. Introduction
Cultivated land forms the material basis for the survival and development of human society. During the different periods of social development, there have been different concepts of the quality of cultivated land, from a single objective of crop production capacity and basic land capacity in the preliminary exploration stage to a comprehensive evaluation of productivity, suitability, carrying capacity, ecological security, environmental health and social development in more recent times (
Table 1).
The United Nations Food and Agriculture Organization and the United Nations Environment Program put forward ten functions of land, which can be summarized into three categories, namely ecological function, production function and carrying function. Therefore, the land quality index system should include the ecological quality index system, the production quality index system and the bearing quality index system [
1]. There is more discussion on land quality in the world. For example, the land quality index system jointly established by the Food and Agriculture Organization of the United Nations, the World Bank, the United Nations Development Program and the United Nations Environment Program in 1995 considers land quality to be a range. It is the land condition related to agricultural production, forestry production, environmental protection, management and other land-use needs, and it is the ability to maintain the health of the ecosystem, animals and plants without soil degradation and other ecological environmental problems. Pieri et al. believed that land quality includes soil, climate and biological characteristics, as well as the land conditions and production capacity, together with the degree to which human needs are met [
2]. Rossiter believed that land quality is a complex attribute of land and the ability of the land to meet the specific requirements of certain utilization types [
3]. Costanza et al. published a paper on “The Value of World Ecosystem Services and Natural Capital”, which provided a theoretical basis and basis for the measurement of the externality of cultivated land [
4]. Bouma et al. defined land quality as the ratio of crop yield to potential yield under certain conditions [
5]. At present, there are few studies on the protection of the trinity of cultivated land in China. Some scholars have sorted out the main practices of cultivated land protection in developed countries, including the corresponding system, cultivated land protection trend and management measures, and put forward corresponding suggestions for the protection of cultivated land in China [
6,
7]. Some elaborated the important influence, main content and the relationship among the three, and proposed multiple measures to build a new pattern of cultivated land protection [
8,
9,
10]. From the perspective of system theory and public management, some scholars have conducted a preliminary study on the integrated supervision system of cultivated land quantity, quality and ecology [
11,
12,
13]. In addition, many scholars discussed in their literature that the overall quality of cultivated land in China tends to decline from different angles [
14,
15,
16].
By distilling the definition of cultivated land quality from previous studies and understanding the need to protect all three facets of cultivated land quantity, quality and ecology, the evaluation of cultivated land quality can be seen to be best carried out from the functional dimension. The multi-function characteristics of cultivated land—production, ecological, landscape and carrying function—have been widely recognized by researchers in China and globally. In recent years, experts and researchers have made progress in studies on cultivated land quality evaluation. The concepts and content of cultivated land quality are gradually expanding, and the evaluation purposes and methods have become more diversified. The content of cultivated land quality evaluation focuses on the evaluation of productivity, suitability, potential, environment and sustainable use. The evaluation indicators include site conditions, soil physical and chemical properties. The environment tends not to be comprehensively evaluated with regard to the quality of the cultivated land. Furthermore, less research on the value and application of the evaluation results of cultivated land quality has been carried out. The research on cultivated land protection tends to focus on protecting the overall quantity and improving the quality, whereas research on quality protection of local cultivated land through zoning needs to be further promoted.
On the basis of the existing research and from the perspective of the spatial layout, functional use and environmental protection of cultivated land, this study constructed a cultivated land quality evaluation index system based on the space–function–environment, which included three dimensions, eight levels and twenty-three indicator factors. The spatial, ecological and environmental indicators were added as important factors to expand the research scope of the cultivated land quality evaluation. The Qujiang District, Zhejiang Province, China, was used as an example to explore the application of the cultivated land quality evaluation. By analyzing the differences and aggregation characteristics of the quality of the indicators at all levels, a reasonable and effective zoning scheme for cultivated land quality was identified from the perspective of space, function and the environment. This study provides a theoretical basis and practical reference for research on cultivated land protection.
2. Materials and Methods
2.1. Study Area
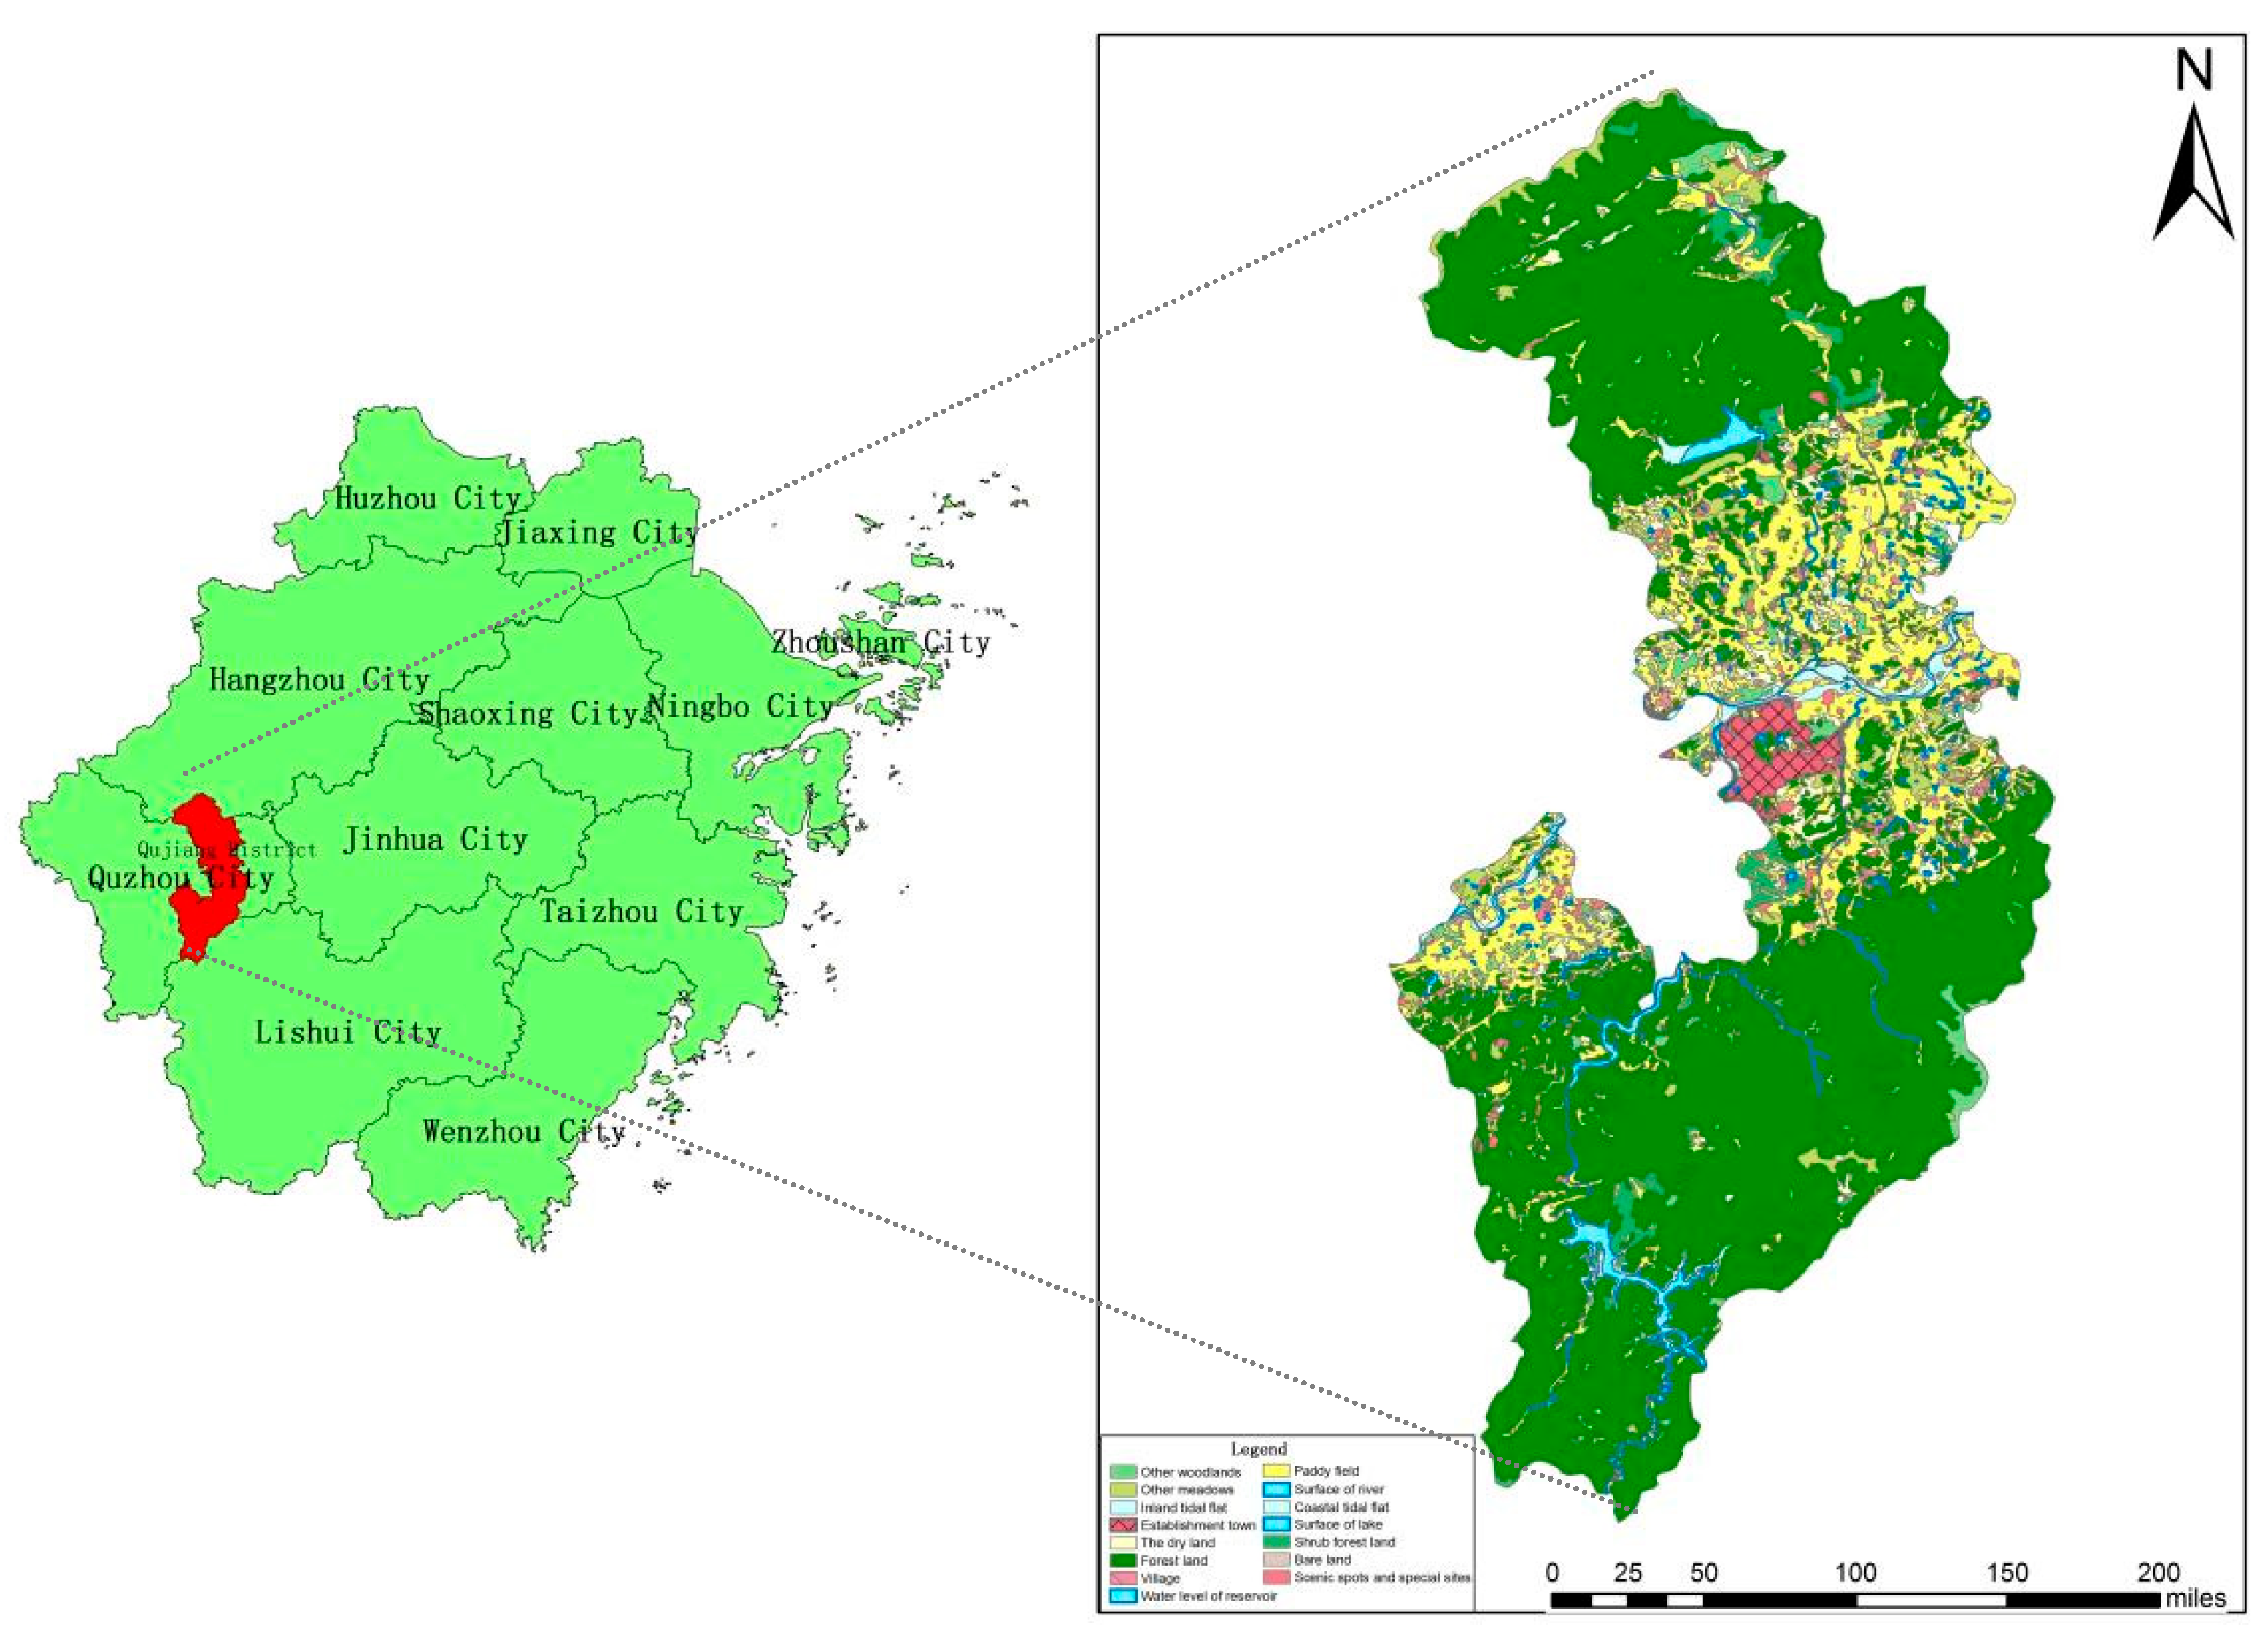
The Qujiang District is located within the hilly basin area in the middle of Zhejiang Province, in eastern China (
Figure 1). Each administrative village in the 2018 land-use status map of Qujiang District was used as a research unit, and the cultivated land was extracted as the minimum unit for the collection of basic data. The total area of the cultivated land accounted for 18.57% of the total land area of the region. There is multiple cropping with two crops a year, generally consisting of an early and late rice crop. Qujiang District was used as a pilot county for agricultural land grading and evaluation by the Ministry of Land and Resources. Therefore, it has complete agricultural land quality grading, a land quality geochemical survey, a land change survey and other data, which provide a good foundation for the development of the cultivated land space, function and environmental quality evaluation.
2.2. Data Sources
The main sources of the evaluation index data in this study were collected as follows: Basic data collection included the area of each plot, basic fertility, surface soil texture, soil organic matter content, soil pH, tillage layer thickness, irrigation assurance rate and altitude. We obtained the above data from the Bureau of Natural Resources and Planning, Bureau of Agriculture and Rural Affairs, Environmental Protection Agency and relevant websites. Data on the thickness of the effective soil layer, drainage conditions, soil heavy metals, white pollution, soil earthworms, fertilizer application amount of each administrative village, crop yield and planting conditions were obtained through field surveys and demographic data from the Statistical Yearbook. The shape, density, fragmentation, separation, atmospheric regulation, farmland attractiveness index, population carrying capacity and agricultural chemical fertilizer residue were calculated using relevant models [
17,
18,
19]. According to the current situation of land use, cultivated land patches, remote sensing images and other relevant data, the slope, field road accessibility and farming distance were obtained by combining remote sensing and GIS methods. Kriging interpolation was used to convert the collected survey point data into continuous areal attribute data in each evaluation unit [
20].
2.3. Research Method
2.3.1. Spearman Rank Correlation
This study selected eight indicators related to space quality, function quality and environmental quality; namely, scale, space characteristics, production function, ecological function, landscape function, carrying function, social environment and natural environment. In the analysis of these complex indicator relationships, if an increase in one indicator value was accompanied by a decrease in another indicator value, the two were considered to have a trade-off relationship. If the values of two indicators increased simultaneously with the interaction, they were regarded as having a collaborative relationship.
Spearman rank correlation is a common method used to analyze trade-offs and synergies. If the correlation coefficient is positive, it means that the relationship of indicators is synergistic; if the correlation coefficient is negative, the relationship of indicators are trade-offs. If the correlation is not significant, then the relationship of indicators is compatible [
20,
21]. The specific description of the correlation coefficient is:
Let n pairs of
data be represented.The pairs
are rearranged in order to generate new data pairs
, where
is the sequence opposite to
, but is the
concomitant of
. Suppose that when
it is located at the kth position in the sequence, k is the rank of
. By analogy, the rank of
is recorded as
. The details are as follows:
In the formula, indicates the ranking number of the ith attribute weight in the weight vector. If rs = 1, it indicates that the rank between the attribute weight and the correlation coefficient is exactly the same, showing a positive correlation. If rs = −1, the rank between them is completely opposite, showing a negative correlation. If rs = 0, the rank between them is completely independent. As the rs value increases, the correlation between attribute weights and correlation coefficients improves.
2.3.2. Spatial Analysis Method
Through the correlation analysis of various indicators that affect the quality of cultivated land, we gained a preliminary understanding of the trade-offs and synergies among the indicators. On this basis, using Getis–Ord Gi* on the ArcGIS platform, this study analyzed the cold and hot spots of the cultivated land space–function–environment assessment index system and all of its secondary indicators, and identified the hot and cold spots for each indicator [
22,
23,
24,
25]. Hot spots refer to administrative villages with high cultivated land quality and good concentration in the study area, and vice versa. The specific calculation formula of Getis–Ord Gi* is as follows:
where
is the aggregation index of spatial unit
i,
is the spatial weight defined by distance,
is the attribute value of spatial units
i and
j, and
n is the total number of spatial units.
where
is the significance of the agglomeration index,
and
are the mathematical expectation and variance of
, respectively. Where
> 0 indicates a positive spatial correlation and a tendency for spatial objects to cluster or agglomerate, the area showed as the hot spot district; where
indicates a negative spatial correlation and a tendency for objects to spatially disperse, the area showed as the cold spot district;
is 0 indicates a situation where objects are randomly distributed. In this study, Finally, the ArcGIS overlay analysis tool was used to obtain the spatial distribution map of cold and hot spots in the comprehensive quality of cultivated land.
3. Results
3.1. Construction of Theoretical Framework for Cultivated Land Quality Evaluation
With the development and progress of society, the quality of cultivated land is no longer measured only from the traditional sense of high yield. The quality of cultivated land is related to the amount, shape and scale, as well as the spatial location, structure, relationship and other spatial elements of the cultivated land. However, the versatility of the cultivated land varies in different spaces. For example, in areas where the production function of the cultivated land is dominant, the production function and carrying function should be dominant to ensure food security, including quantity, quality, food safety supply and other aspects. In areas where the ecological and landscape qualities of the cultivated land are important, the ecological and landscape functions should be dominant, the ecological environmental protection and landscape aesthetics should be emphasized, and the traditional culture, modern culture and multi-cultural aspects should be combined for development. Therefore, priority should be given to the dominant function when evaluating the quality of cultivated land, and the function quality evaluation should combine functions using different weights. The cultivated land environment quality is an important standard to measure whether the cultivated land space quality and function quality meet the sustainable use of the cultivated land. Its indicators include the natural environment and the social environment. Physical, energy and other objective factors are generated by the natural environment, whereas the main factors of the social environment that affect the quality of the cultivated land include technology, capital investment and transportation.
The evaluation of cultivated land quality is thus a comprehensive process, which should establish a multi-level indicator system from multiple dimensions to judge the quality of the cultivated land, comprehensively and scientifically. The indicator system constructed in this study was composed of spatial quality, functional quality and environmental quality. Differences were found in the evaluation directions of the three-dimensional indicator systems, evaluation means and calculated indicators. Therefore, the space quality, functional quality and environmental quality should not be confused when the indicators are established [
22]. The evaluation dimensions of the cultivated land space, function and environmental quality are shown in
Figure 2.
The evaluation system of the cultivated land space, function and environmental quality was multi-level. The space quality, function quality and environmental quality were all affected by external natural factors, such as light and temperature, weather, soil and biology. At the same time, the impact of human activities on the quality of the cultivated land could not be ignored. The various influencing factors were intertwined and complex. Therefore, when positioning the hierarchy, it should be subdivided based on dimensions. The subdivision rules should not only ensure the independence of each level but also realize the systematic nature of the whole hierarchy. On the basis of the three dimensions of space–function–environment, this study constructed a cultivated land quality evaluation system with eight levels: scale, spatial characteristics, production function, ecological function, landscape function, carrying function, social environment and natural environment.
3.2. Construction of Cultivated Land Space–Function–Environment Quality Evaluation Index System
The selection of the indicators is the key to an accurate evaluation of the quality of the cultivated land. Selection should meet the principles of combining science and feasibility, integrity and independence, comprehensiveness and pertinence, dynamics and stability to build a set of indicators that are interrelated and mutually restrictive and can comprehensively express the quality of cultivated land. At the government level, the Ministry of Agriculture has established a land productivity evaluation system, which uses 64 evaluation factors, including climate, soil, terrain, constraints and agricultural input. The Ministry of Land and Resources, by collecting relevant data from different counties and cities in various provinces, has divided the indicator areas, determined the farming system, the light temperature production potential index and yield ratio coefficient, and calculated the quality of the cultivated land in combination with the soil physical and chemical data, terrain and land use from field surveys. At the academic research level, researchers have built an indicator system for evaluating the quality of cultivated land from five levels of ecological and production functions: soil, climate, biodiversity, landscape and productivity [
26]. Some researchers have established an evaluation system for cultivated land quality from the background, health and economy of the cultivated land. When evaluating the background quality of the cultivated land, they evaluated it from five levels: site conditions, soil physical and chemical properties, soil nutrient status, soil structure and management. When evaluating the health quality of the cultivated land, they selected two evaluation factors: soil environment and irrigation water quality pollution. When evaluating the economic quality of the cultivated land, they selected materials, labor and management along with five evaluation factors of input and policy effect [
26,
27]. Some researchers selected climate, site conditions, soil physical and chemical properties, transportation, agricultural inputs, farming systems and policy measures to build a cultivated land quality evaluation system [
28]. Some researchers selected 12 indicators, including weather, terrain and soil when building their land-use system health assessment framework [
29]. There are other scholars who divided the farmland health evaluation index system into three aspects. The first was the quality of the farmland, which included 14 evaluation factors, such as physical properties, chemical properties and the farmland infrastructure conditions [
30,
31].
Using the three aspects that affect the quality of cultivated land, the present study conducted a comprehensive analysis from the perspective of combining human factors, resources and the environment. Space, function and the environment were selected to form a complete cultivated land quality evaluation index system. Combined with the data obtained from the study area and the analysis of the cultivated land space, function and environmental quality evaluation index system, the present study was able to determine a cultivated land quality evaluation index system in the Qujiang District (
Table 2).
3.3. Correlation Analysis and Zoning of Cultivated Land Space–Function–Environment Quality
The interaction of cultivated land space, function and environmental quality is influenced by natural factors, social factors and human factors. With the development and progress of society, a conflict between cultivated land protection and economic prosperity is growing. This conflict is not conducive to the protection and sustainable development of cultivated land and will eventually affect the sustainable development of human society, which requires a large area or high quality of cultivated land. The premise of cultivated land protection needs balance and coordination between cultivated land space, function and environment. Identifying the relationships among these three dimensions is important for implementing cultivated land protection, promoting regional coordination and achieving sustainable development.
Trade-offs and synergies often occur between small regions and large regions, short- term and long-term, and reversible and irreversible services. The current study mainly conducted trade-off and synergy analysis on the quality of the cultivated land in the study area. Therefore, from the perspective of space, combined with the imbalance of the spatial distribution of cultivated land quality, diversity of functional types and human use selectivity, we used Spearman rank correlation and cold/hot spot analysis to analyze the spatial quality of the cultivated land. There was a trade-off between the functional quality and environmental quality and a synergistic relationship of mutual promotion or inhibition for the systematic analysis. Using the evaluation results of cultivated land space quality, functional quality and environmental quality, the current study identified the absolute value and positive and negative directions of the correlation coefficients and judged the relationship type and intensity characteristics among the cultivated land space quality, functional quality and environmental quality. At the same time, the spatial autocorrelation analysis was used to draw a spatial distribution map of the cultivated land quality evaluation results and to divide the cultivated land quality.
3.3.1. Space Quality Evaluation
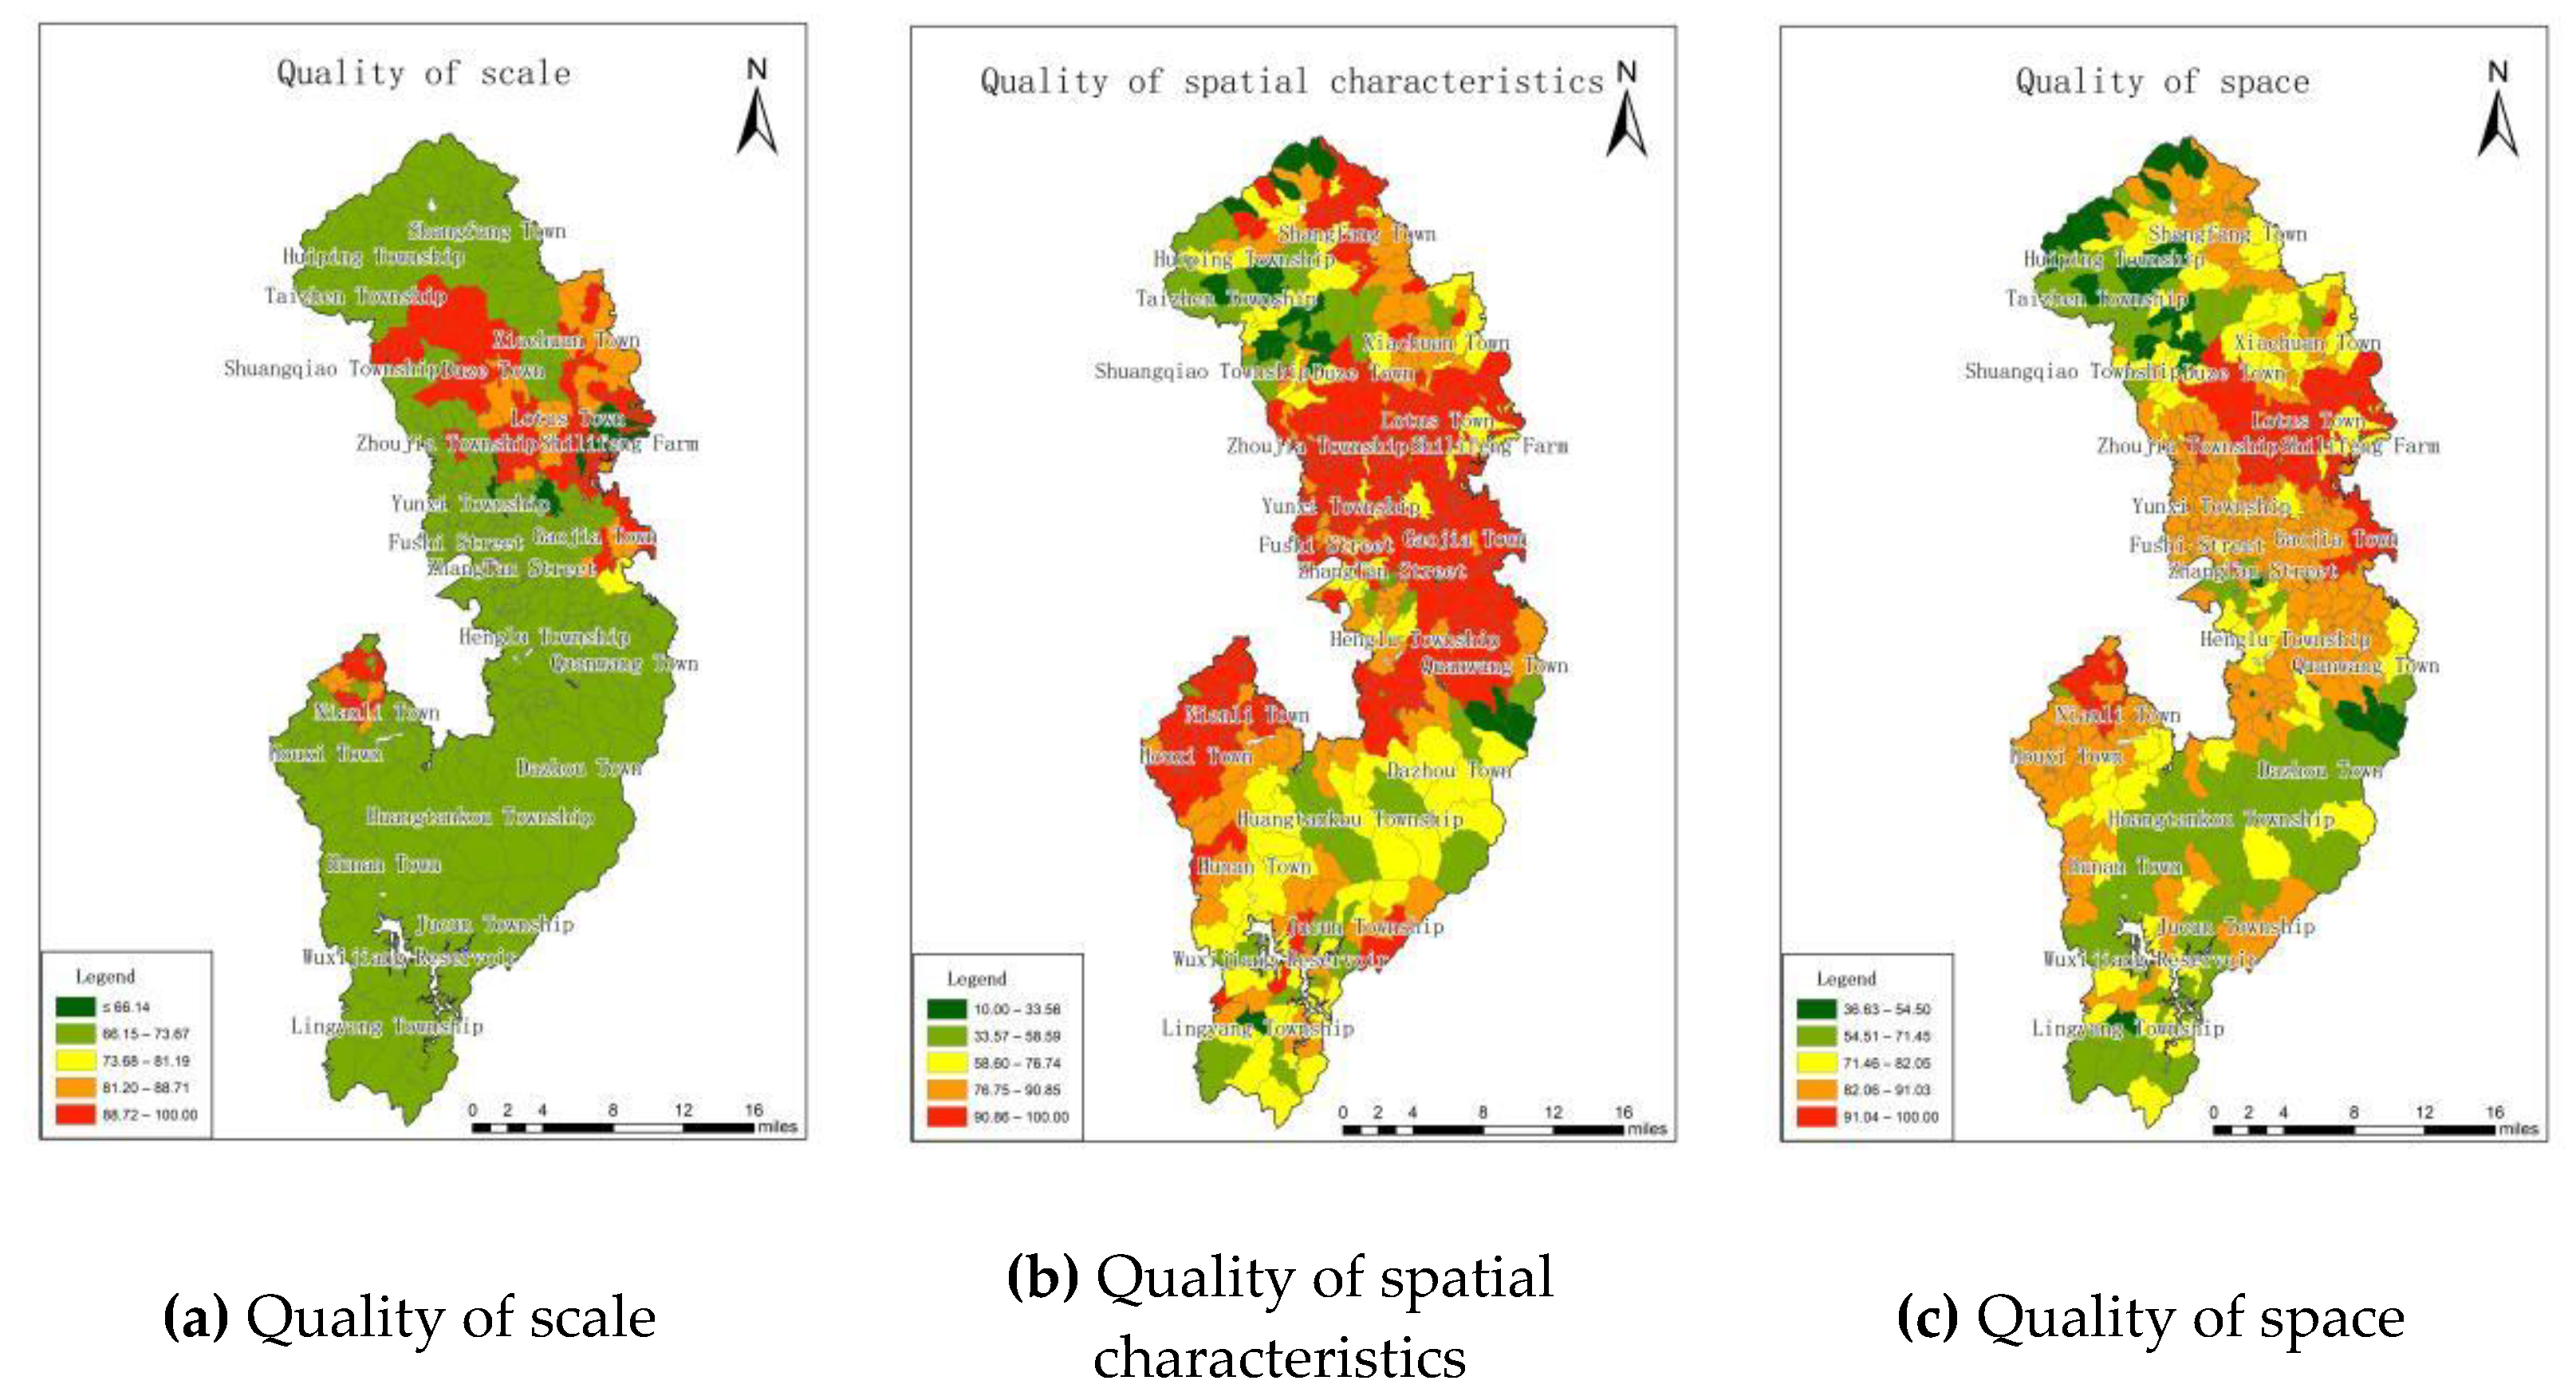
In this study, the indicators used to measure the spatial quality of the cultivated land included the quality of the scale and the quality of the spatial characteristics, which were mainly determined using the five factors of area, shape, density, fragmentation and separation. The cultivated land with the highest score was the best, the cultivated land with the lowest score was the worst, and the cultivated land in the middle three grades was average. The high-quality area of the spatial characteristics was also located in the middle, and the scope of high-quality area was larger (
Figure 3).
The overall spatial quality of the cultivated land in Qujiang District was good. Most of the cultivated land was above the average level of the whole district. The cultivated land with high spatial quality was distributed in the central plain area, with good connectivity and regularity. However, the cultivated land in the southwest and northeast was located in mountainous areas, with undulating terrain and scattered distribution. Forming a good spatial association between the plots was difficult; thus, the spatial quality of the cultivated land was poor. The cultivated land with good space quality was conducive to the implementation of agricultural mechanization, especially large-scale agricultural mechanization. In contrast, the cultivated land with poor space quality was not conducive to agricultural mechanization, especially large-scale mechanized operations. Small agricultural mechanized operation could be considered for cultivated land with average space quality.
3.3.2. Function Quality Evaluation
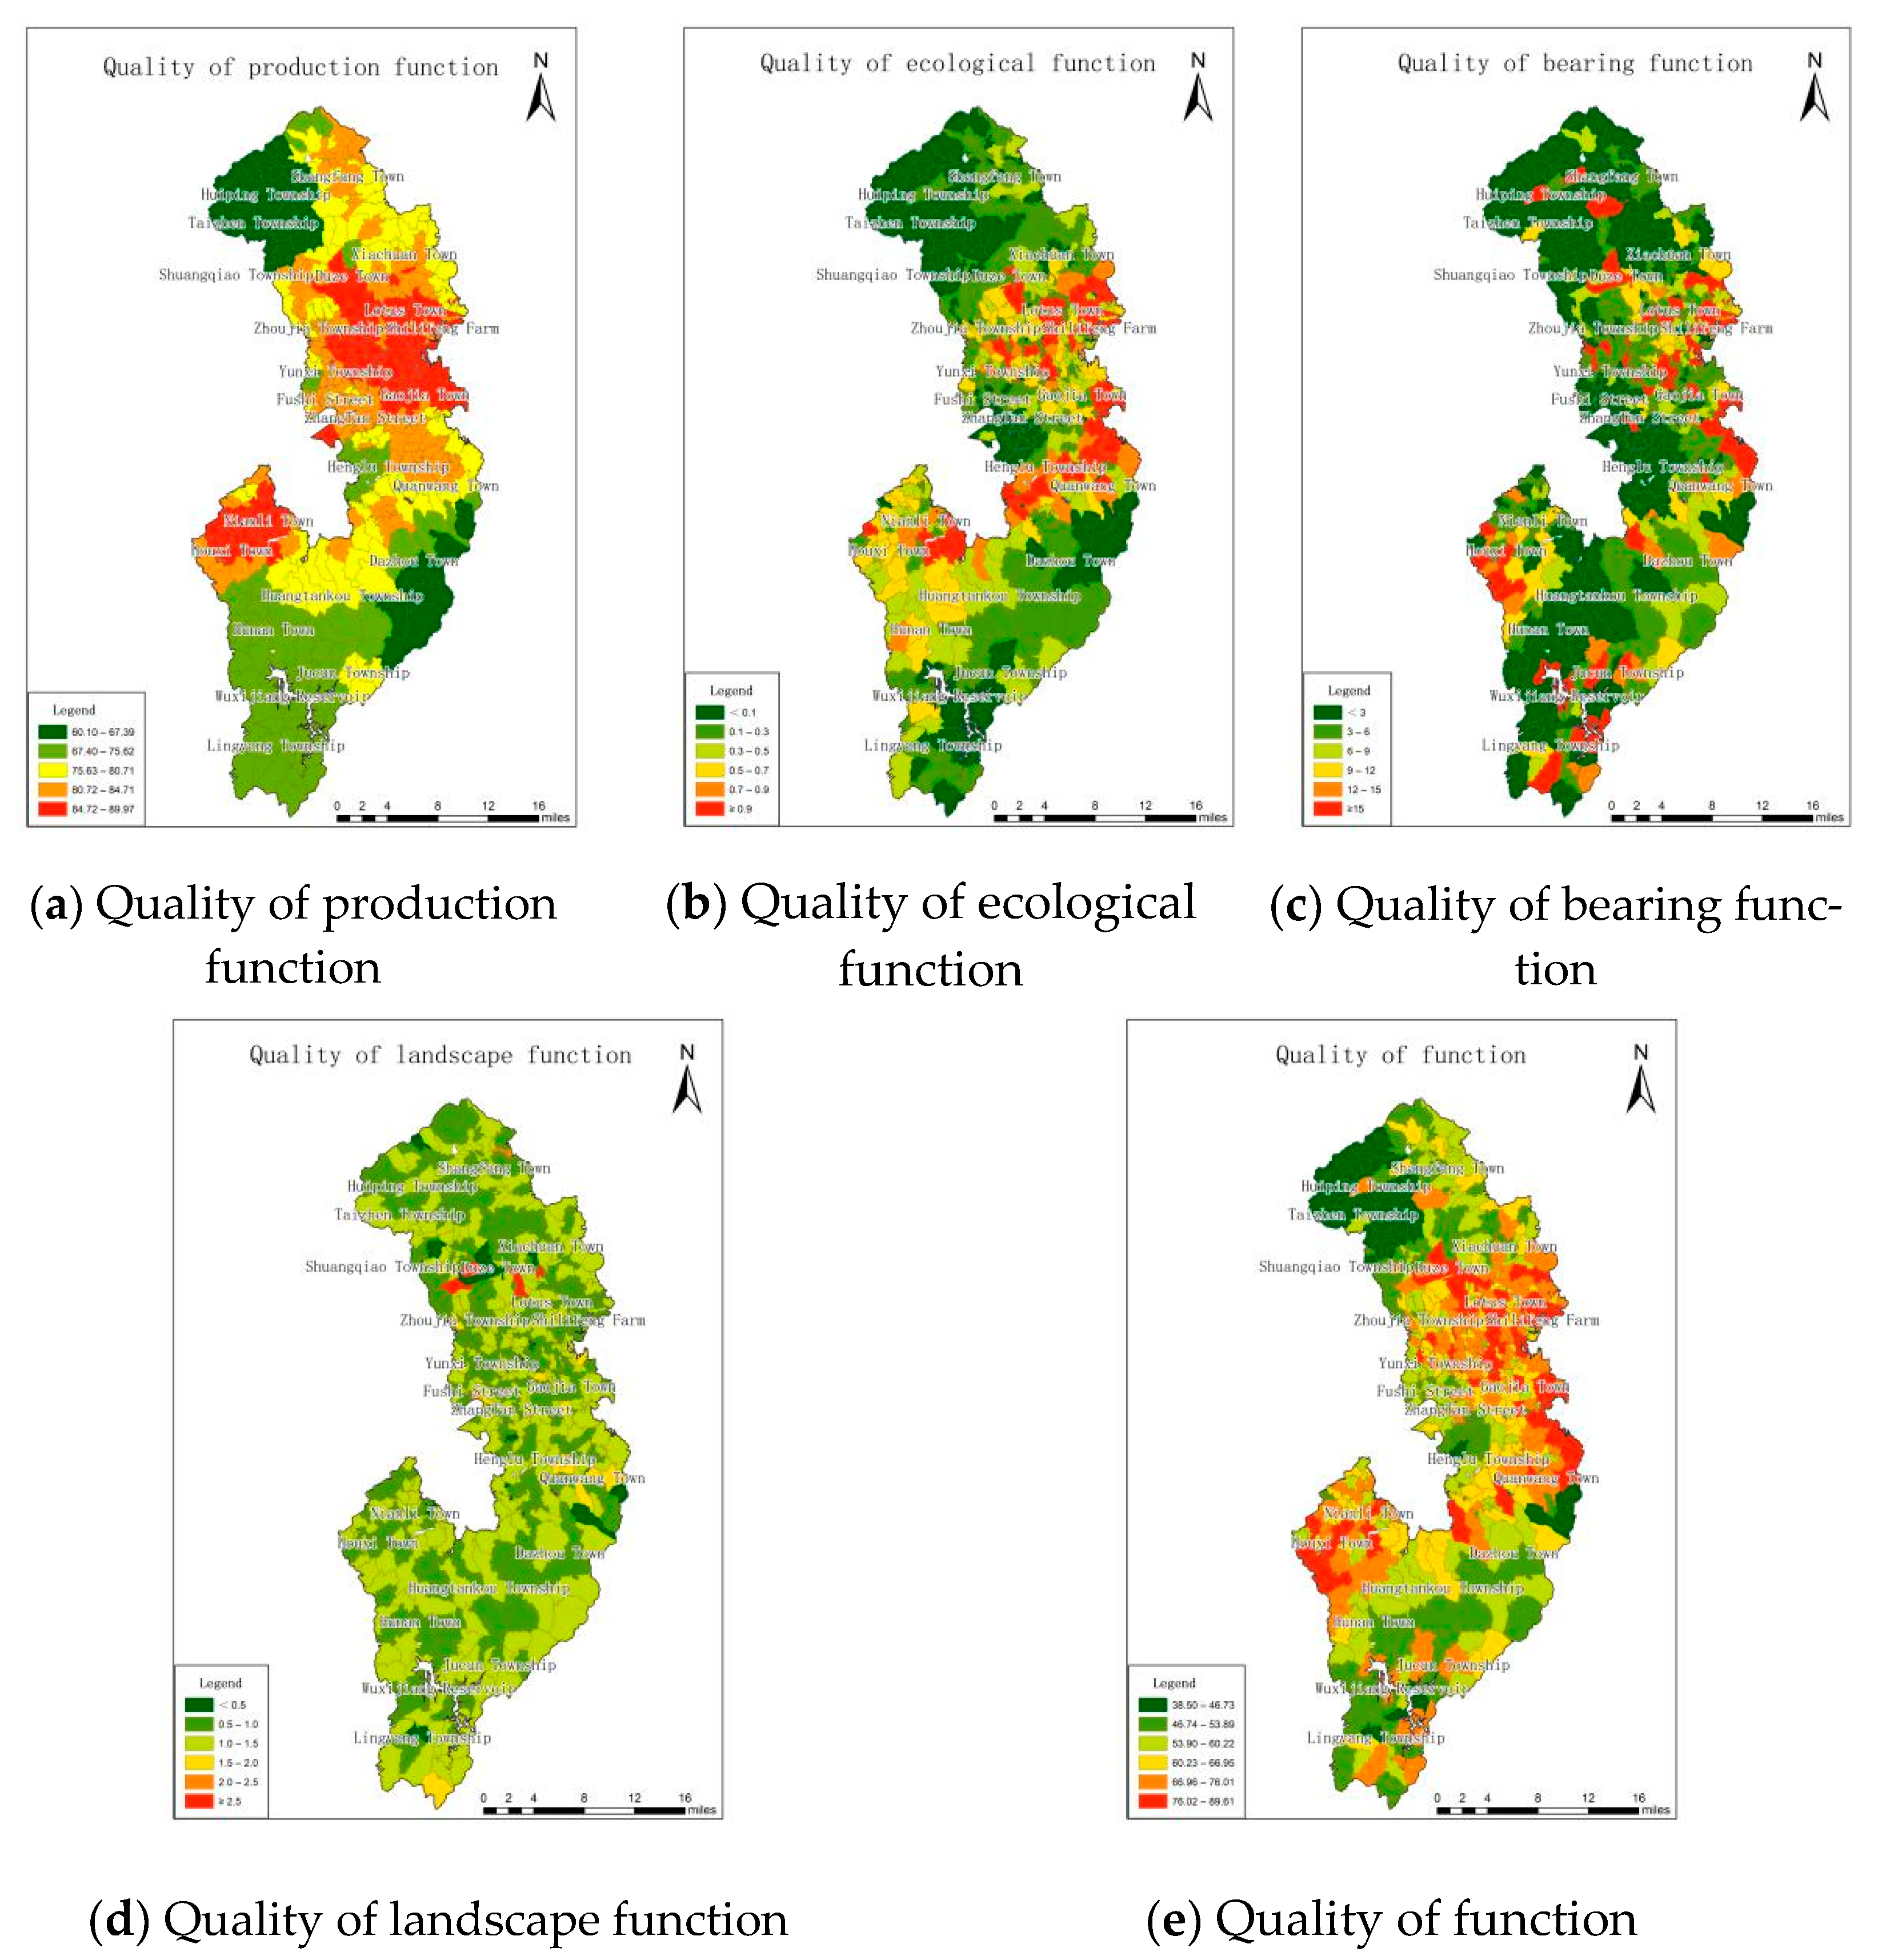
In this study, the indicators for measuring cultivated land function quality included production function quality, ecological function quality, landscape function quality and carrying function quality, which were mainly determined by 13 factors such as soil organic matter content, soil pH, atmospheric regulation and population carrying capacity. The score for the quality of the production function was divided into five grades by the natural breaks method, while the quality of ecological function, landscape function and carrying function was calculated by relevant models, and the quality was divided according to the rating standards. The high-quality area of cultivated land production function in Qujiang District was located in the middle, while the low-quality area was mainly located in Huiping Township and Taizhen Township. The high-quality areas of ecological function and landscape function were scattered over the central plain area, and the high-quality areas of carrying function were scattered over the whole area. The overall ecological function, landscape function and carrying function quality of Qujiang District were relatively low (
Figure 4).
The overall cultivated land function quality in Qujiang District was average, and the score was mainly approximately 50 points. In addition, nearly 10% of the cultivated land was less than 50 points, which was mainly distributed in the southwest and north. Owing to the relatively biased terrain, fewer human activities and a high degree of non-agricultural cultivated land, the functional quality was poor. In the central region, close to the urban area, there was a large demand for agricultural products, and farmers tended to increase investment and intensive farming; thus, the quality of the cultivated land function was good. The cultivated land with high functional quality is suitable for the development of food, cash crops, tourism and leisure agriculture. The relationship between food and cash crop production, agricultural production and leisure tourism should be properly handled to fully meet the basic needs of food and the increasing income for farmers. The limiting factors of cultivated land with poor functional quality should be addressed and its functional quality enhanced.
3.3.3. Environmental Quality Assessment
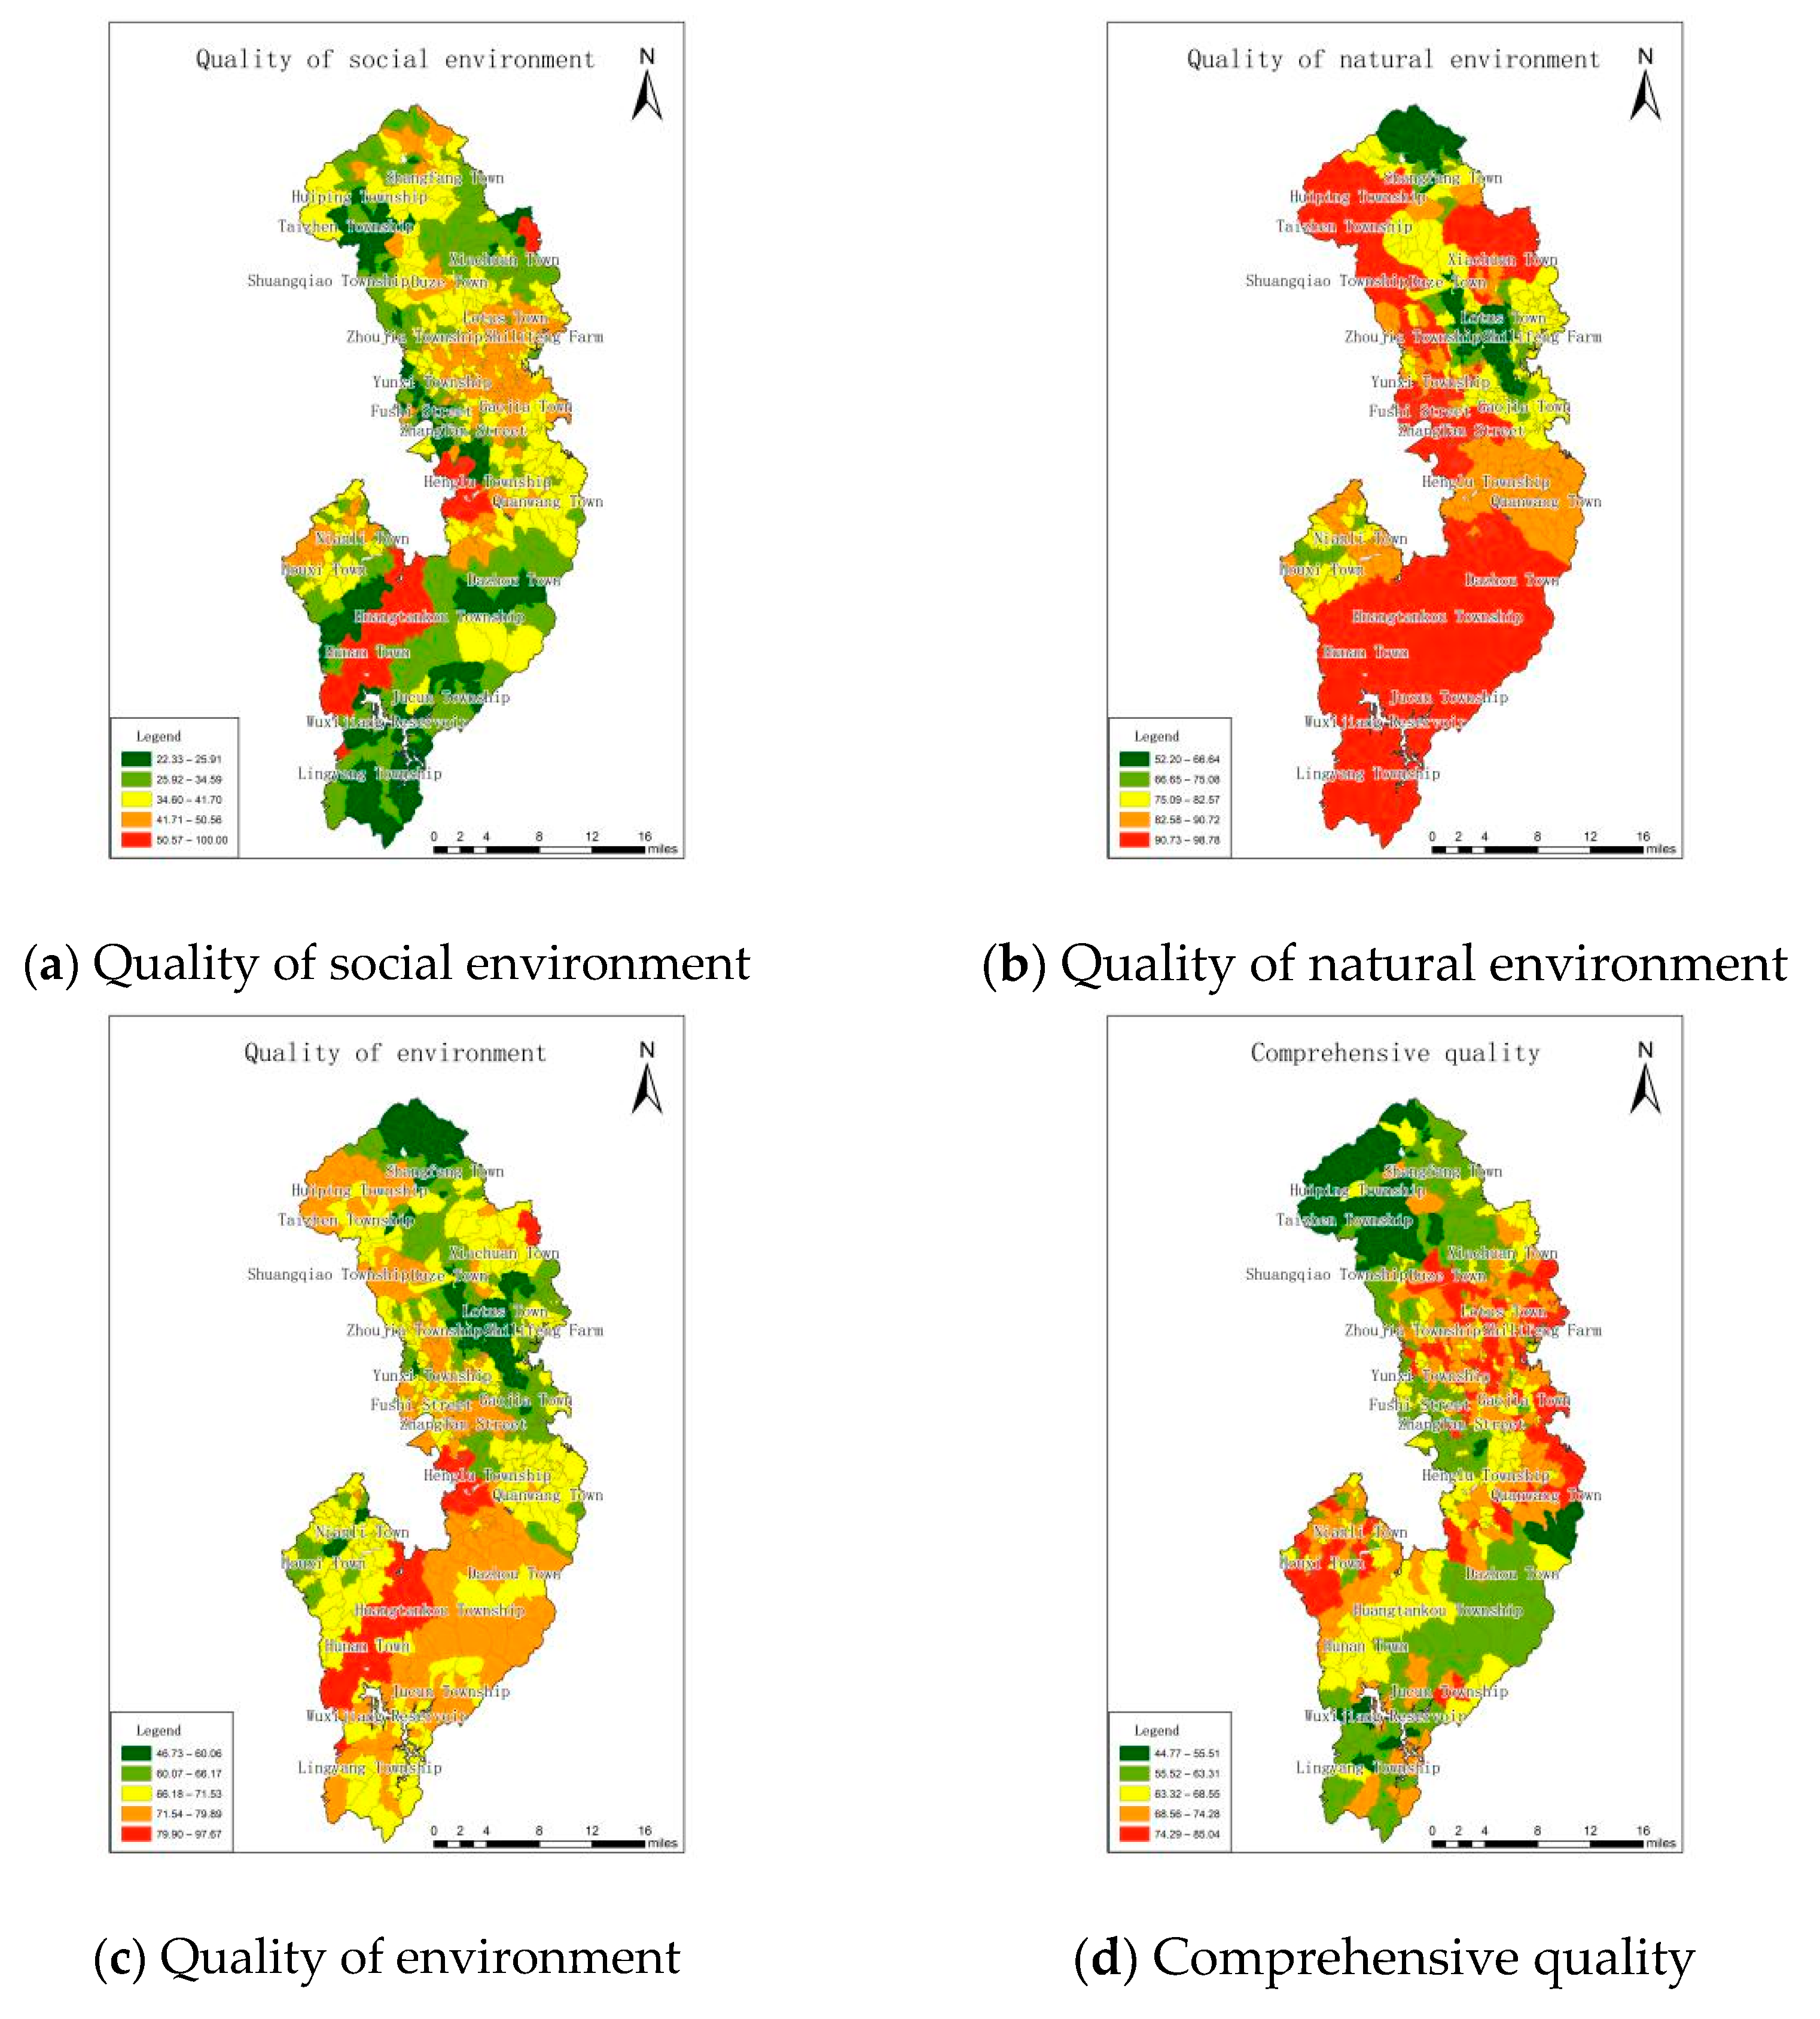
In this study, the indicators used to measure the environmental quality of the cultivated land included social and natural environmental quality, which were mainly determined by five factors: the residue of agricultural fertilizer, the accessibility of roads in the field, heavy metals in the soil, white pollution and earthworms in the soil. The scores for the quality of the social environment and the quality of the natural environment were divided into five grades using the natural breaks method. The high-quality area of cultivated land with regard to the social environment in Qujiang District was located in the south–central part, while the low-quality area was mainly located in the south. The overall quality of the natural environment in the Qujiang District was relatively high, although was relatively low in the central and northernmost areas (
Figure 5).
Qujiang District had a good overall cultivated land environment quality. Most of the cultivated land environment quality was above the average level of the whole district. The area with the best environmental quality was located in the southwest. This was an eco-tourism area in Qujiang District, with convenient transportation, beautiful natural environment and less pollution. The central and northern regions were dominated by industrial development. Although the transportation was more convenient, the cultivated land environment quality was poor because of frequent human activities and more pollution sources. The cultivated land with high environmental quality should actively develop organic agricultural products and improve the production grade of agricultural products, as well as developing pollution-free agricultural products. The cultivated land with poor environmental quality should be strictly prohibited or restricted from producing agricultural products. At the same time, it is necessary to actively carry out farmland environmental restoration projects to improve the environmental quality of the cultivated land.
In general, the quality of the cultivated land in the central part of Qujiang District was the highest, followed by the southern part, while the northern part was relatively poor. The cultivated land with high comprehensive quality is the essence of cultivated land. It should not only be used efficiently but should also be strictly protected. It should be included in permanent basic farmland, whereby construction, occupation and destruction are strictly prohibited.
3.4. Analysis of Spatial Agglomeration Characteristics of Cultivated Land Quality Indicators
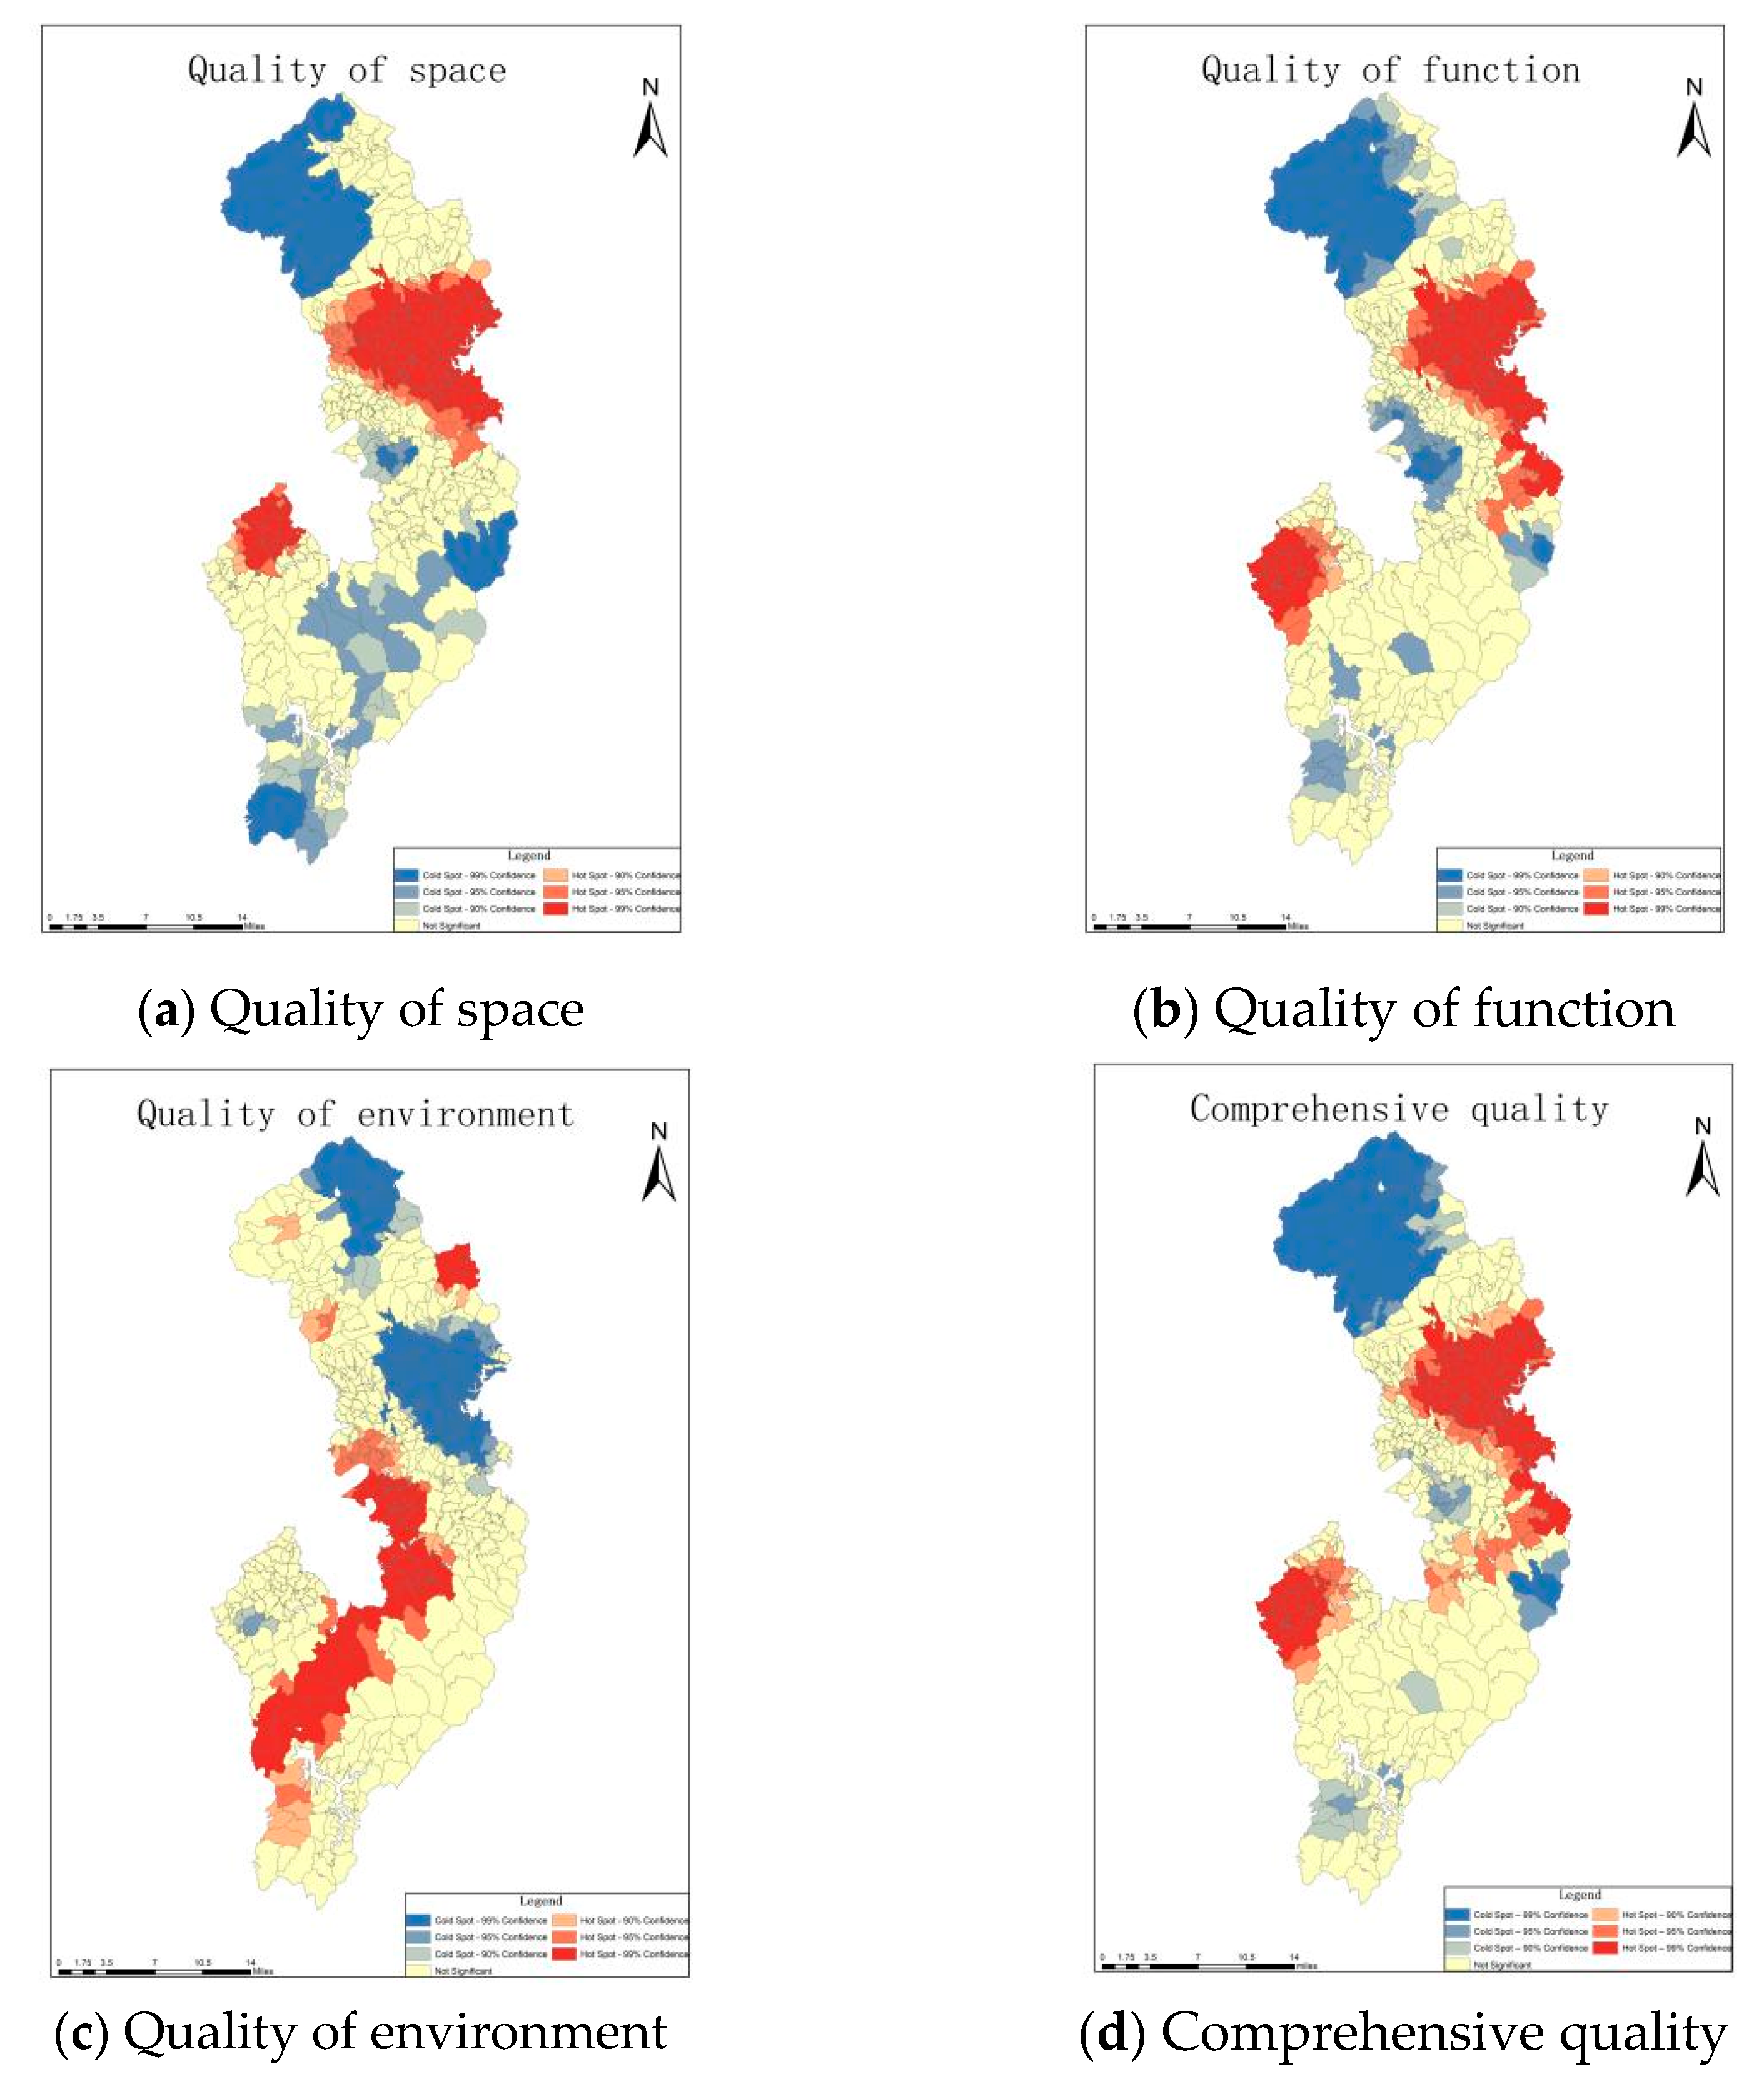
By analyzing the spatial distribution of cold and hot spots of the eight secondary indicators of cultivated land quality, this study found that the distribution of cold and hot spots in some different indicators were similar, such as scale, spatial characteristics and production function. The hot spots were mainly concentrated in the central plain area, while the cold spots were distributed in the northwest. One difference was that the production function in the south was a cold spot area, while the space characteristics in the south were insignificant. The cold and hot spots of the different indicators also varied greatly, such as the social environment and natural environment. For example, the cold spot area for the social environment was the hot spot area for the natural environment. The distribution of cold and hot spots of the landscape function in Qujiang District was not significant in most areas, and clustering was not statistically significant.
Figure 6 shows the spatial distribution of the cold and hot spots that affected the quality of the cultivated land.
The distribution of the cold and hot spots of cultivated land space quality, functional quality and comprehensive quality was basically consistent. The center part was the hot spot area, the northwest was the cold spot area, while the hot spot area of environmental quality was located in the southwest, and the cold spot area was located in the center and northeast.
According to the analysis of cold and hot spots, the regions with hot spots in terms of scale, spatial characteristics, production function, carrying function and social environment were mainly in the central plain of Qujiang District, and these regions had large-scale production of cultivated land, priority protection of cultivated land and were the main food production areas. The hot spot area of ecological function was located in the south–central part of Qujiang District, which was suitable for the development of a cultivated land eco-tourism industry. The hot spots for the natural environment were located in the north and south of the area, and thus ecological environment protection should be carried out, such as returning farmland to forests. The cold spot area of each indicator shows the key areas for implementing the cultivated land protection system and is an important basis for quality zoning.
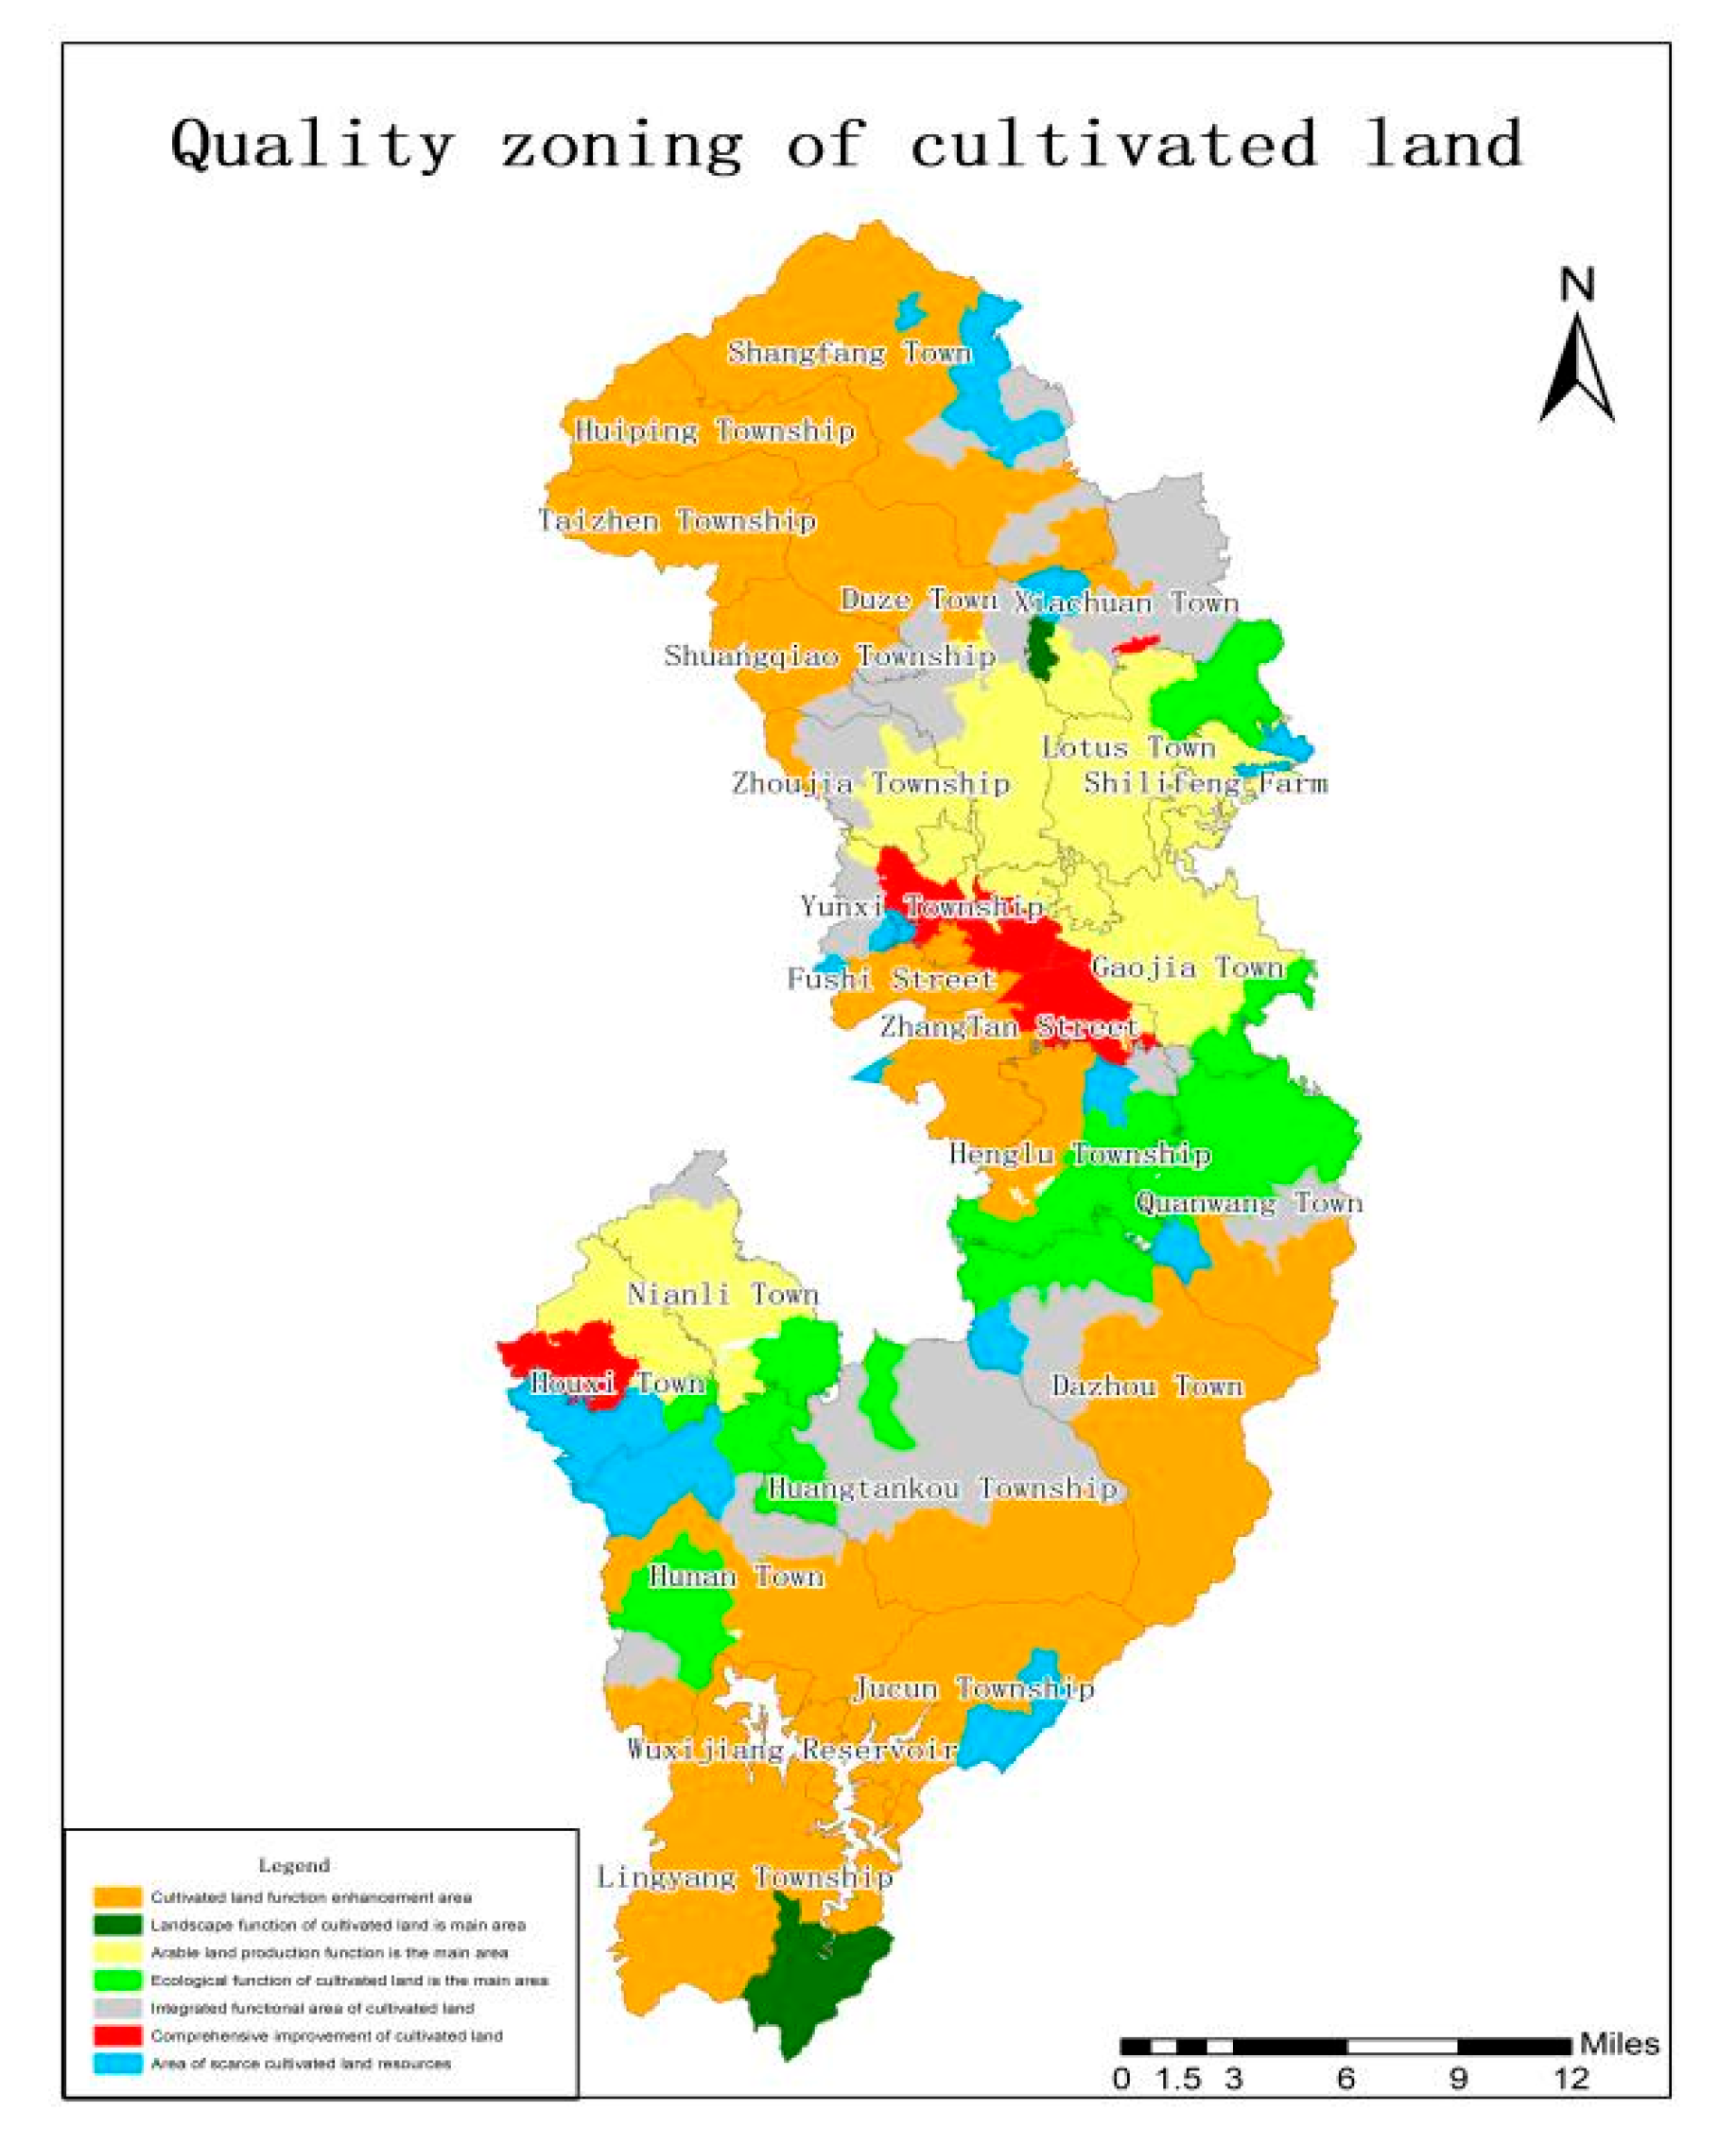
The cultivated land in Qujiang District was initially divided into seven types of areas (as shown in
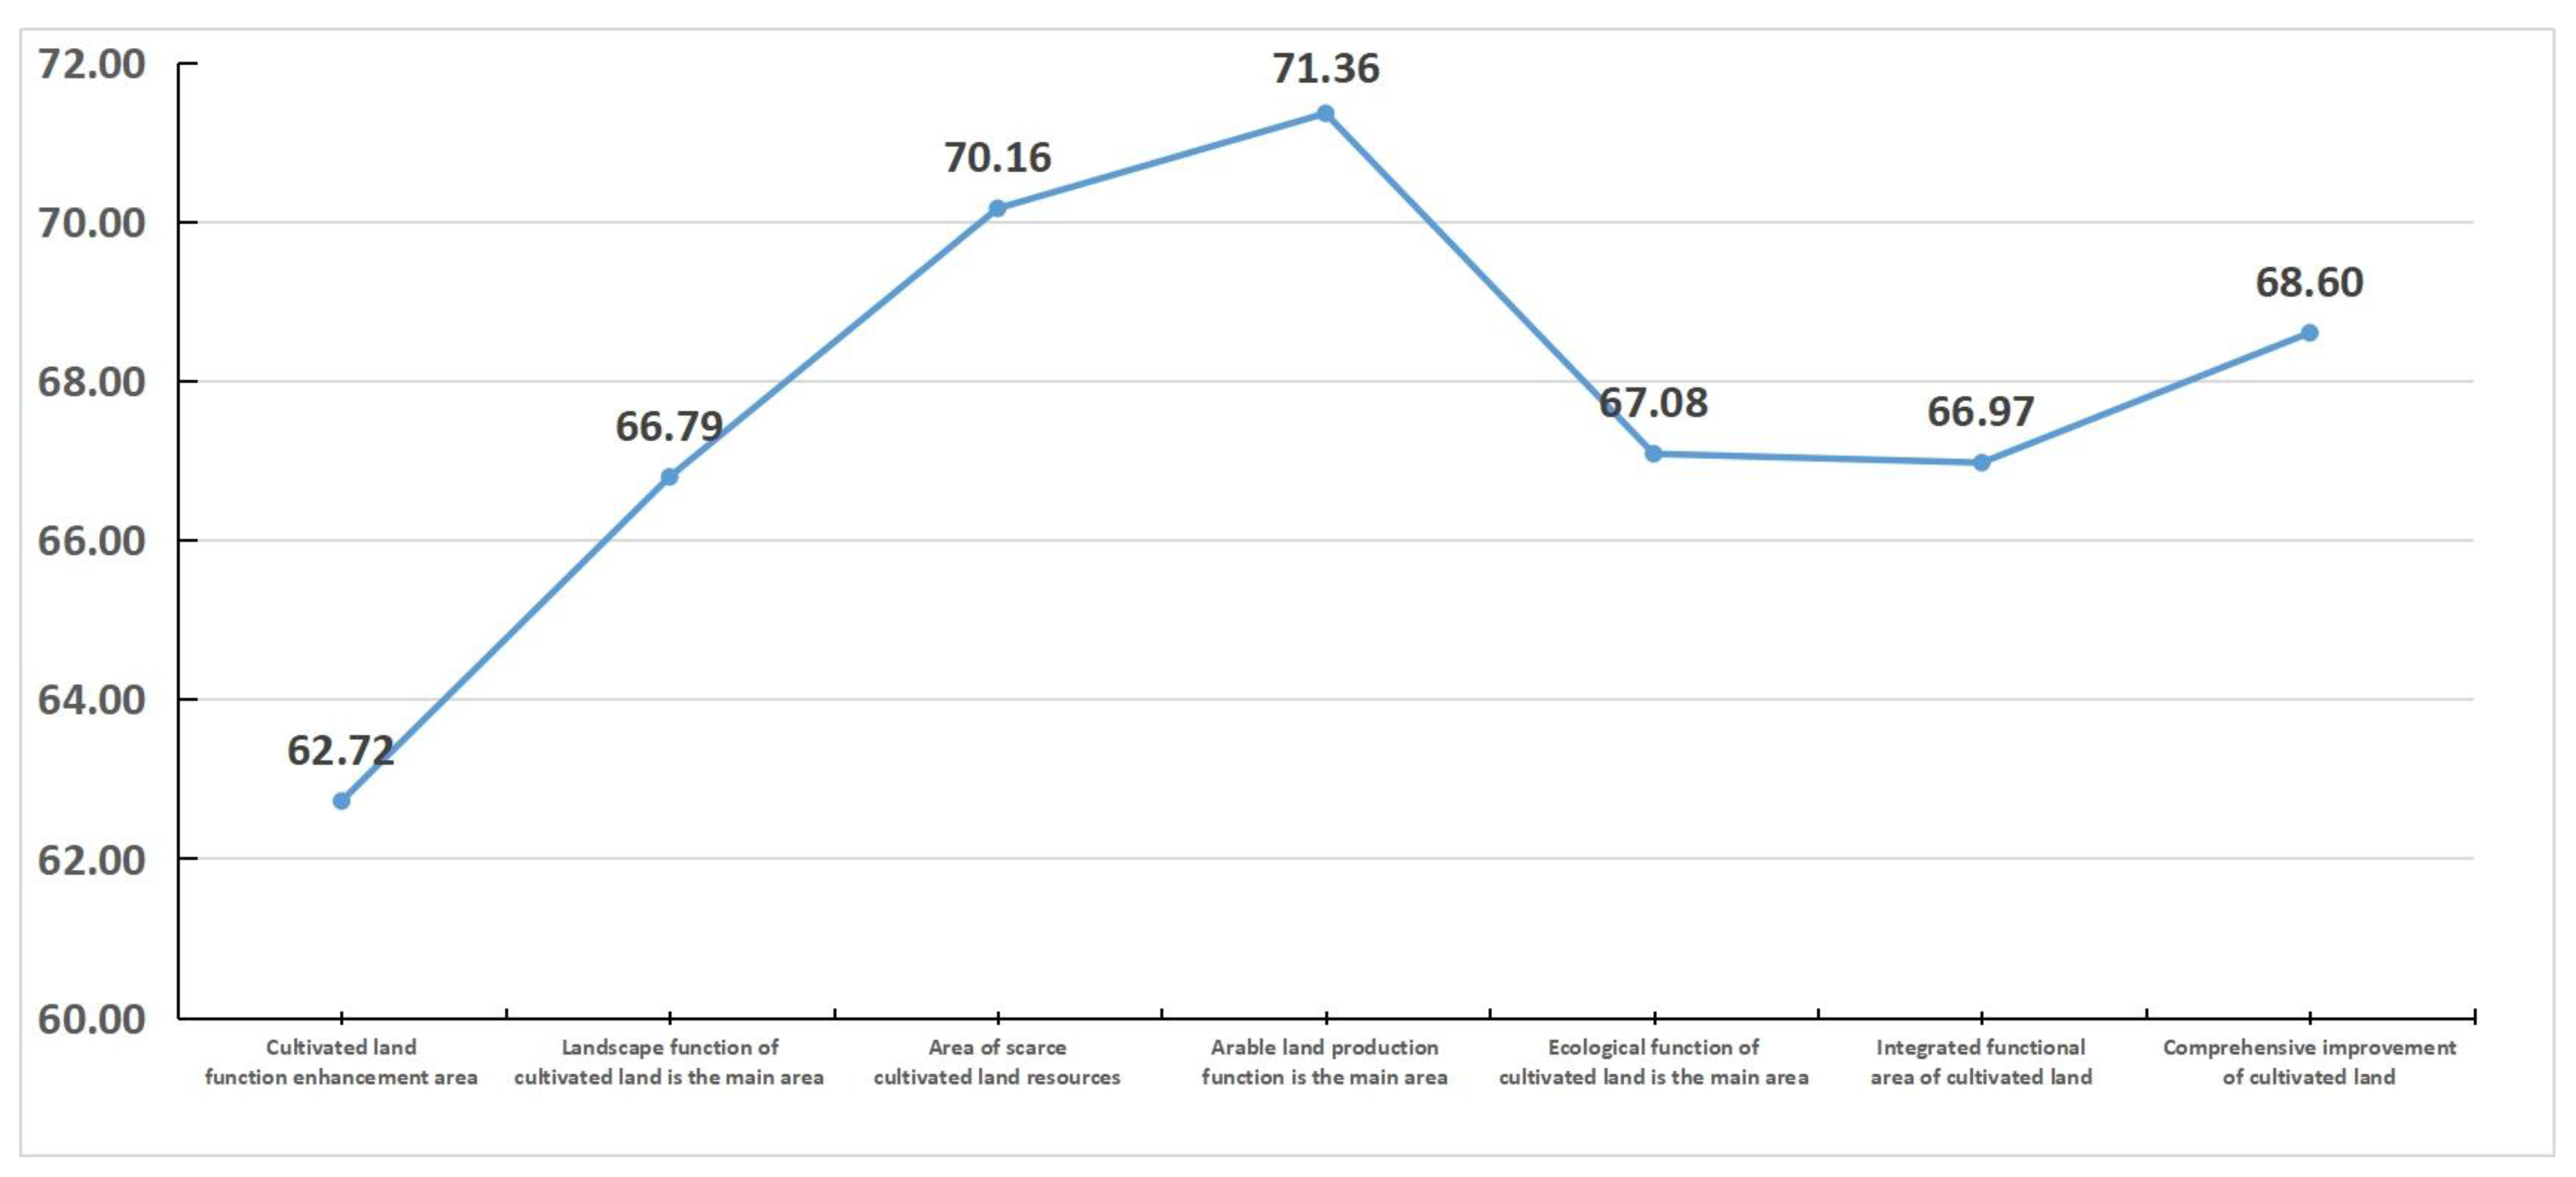
Figure 7): the main area of production function, the main area of ecological function, the main area of landscape function, the area of resource tension, the comprehensive functional area, the comprehensive rehabilitation area and the area of function improvement. The comprehensive quality score of cultivated land in each type of area is shown in
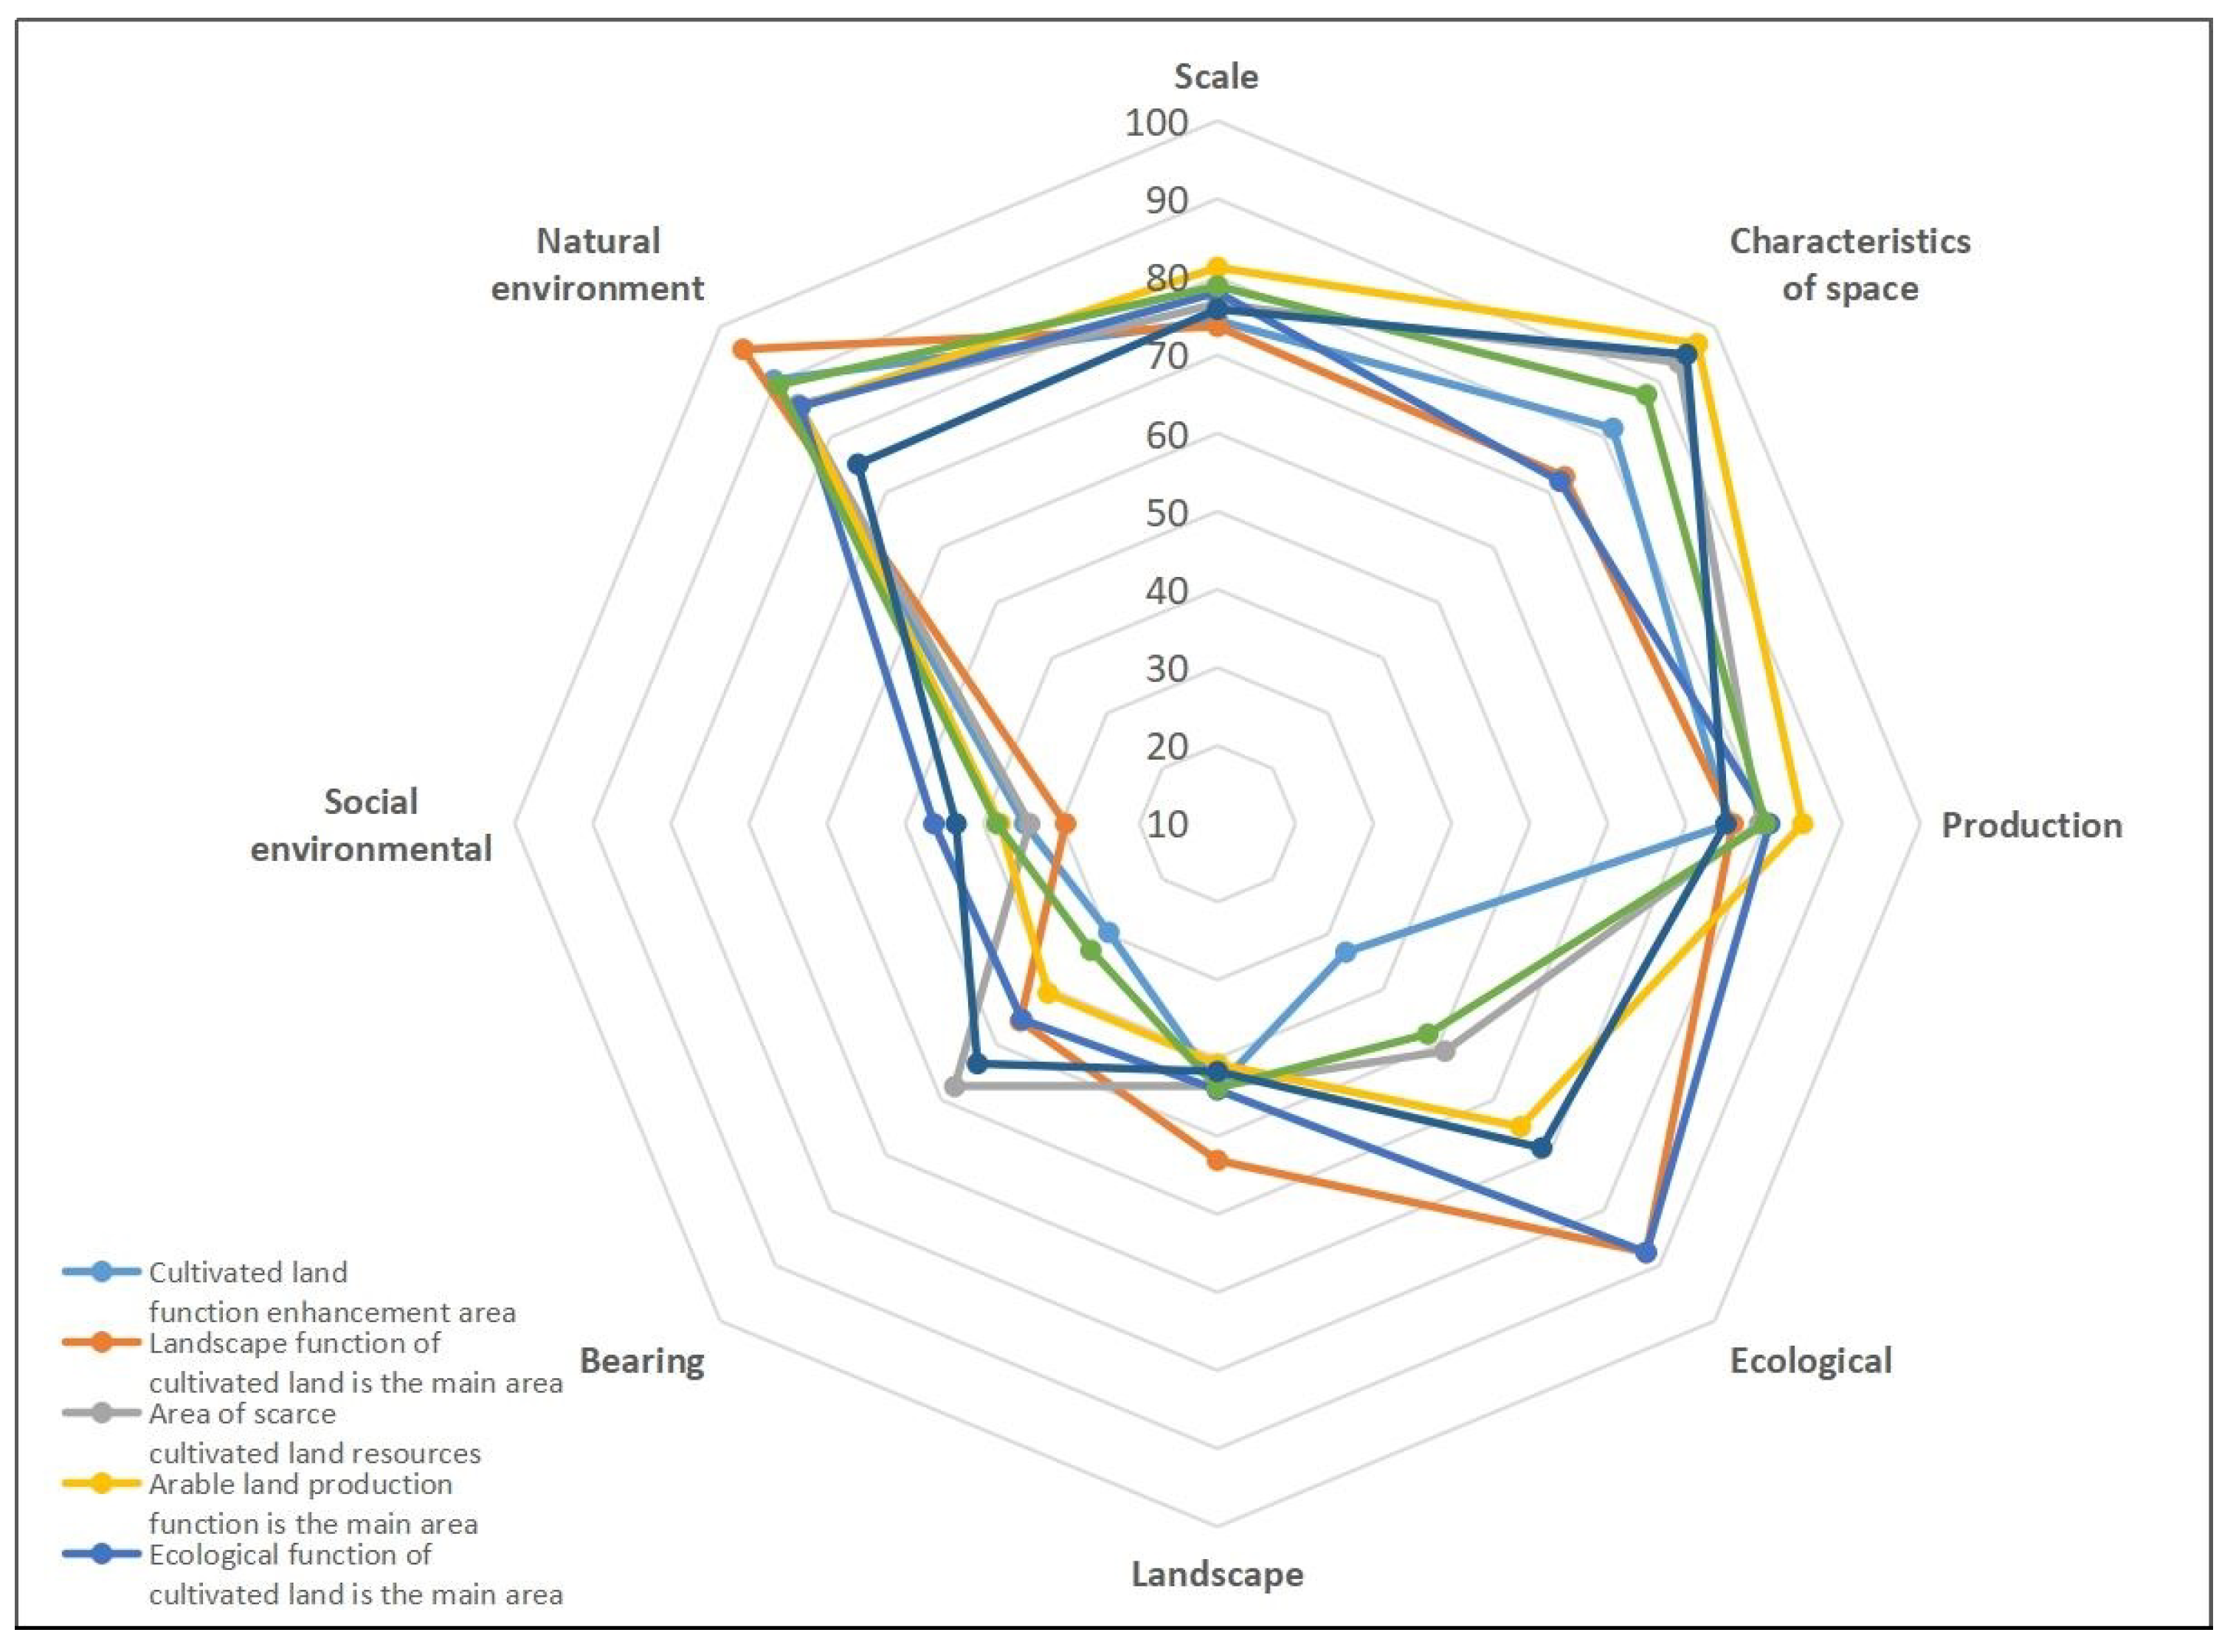
Figure 8, and the quality results of each indicator in each type of area are shown in
Figure 9. Using qualitative and quantitative analysis, the areas with a high degree of proximity were merged. The cultivated land in Qujiang District was then divided into five types of areas: the main area of production function, the main area of ecological and landscape function, the area of resource tension, the comprehensive functional area and the area of comprehensive improvement and function improvement.
4. Discussion
The protection of cultivated land in the new era aims to focus more on the comprehensive protection of the trinity of the quantity, quality and ecology of cultivated land, strictly abide by the red line of cultivated land, ensure that the functional quality of cultivated land does not decline and maintain the balance between cultivated land and its surrounding environment. In the face of the huge economic benefits from farmland conversion, there is a gap between the implementation effect of cultivated land protection policies and the expected goals. There is an urgent need to improve the utilization mechanism of space, function and environment, and establish a system of cultivated land space, function and environmental protection. On the basis of the quality evaluation and zoning results of the space–function–environment of cultivated land, the following suggestions are put forward from this study.
4.1. Tradeoff and Cooperative Analysis of Cultivated Land Quality Index
Through calculation, the tradeoff and synergistic relationship among the indicators of cultivated land quality are shown below(
Table 3).
Spearman rank correlation was applied to analyze the correlation properties of the indicators affecting cultivated land quality, and it was found that 15 of the 28 groups of relationships had significant positive correlation, 7 groups had insignificant correlation and 6 groups had significant negative correlation. Therefore, there were more synergistic relationships than tradeoff relationships. Specifically, in the spatial quality of cultivated land, there was a synergistic relationship between scale and spatial characteristics. In the quality of the cultivated land function, there was a synergistic relationship between production function, ecological function and bearing function, while the relationship between landscape function and production function was not significant. In the quality of the cultivated land environment, the social environment and the natural environment showed trade-offs.
In addition, through comprehensive analysis, it was seen that spatial quality and functional quality had both synergistic and tradeoff relations. Scale had a synergistic relationship with production function and carrying function but had an insignificant relationship with ecological function and landscape function. The spatial characteristics showed a synergistic relationship with production function, ecological function and carrying function, but not a significant relationship with landscape function. There were both synergistic and tradeoff relations between spatial quality and environmental quality, both showing a synergistic relationship with social environment and a tradeoff relationship with natural environment. There was a synergistic relationship between functional quality and environmental quality as well as a tradeoff relationship between production function and social environment, and a tradeoff relationship between production function and natural environment. The ecological function and social environment showed a tradeoff relationship, and the natural environment showed a synergistic relationship. There was no significant relationship between landscape function and social environment and natural environment. The bearing function had an insignificant relationship with the social environment and a tradeoff relationship with the natural environment.
The scale and spatial characteristics were synergistic with production function, bearing function and social environment, indicating that the better the spatial quality of cultivated land, the greater the productive capacity of cultivated land, the more population that the cultivated land could satisfy, and the better the social environment could be formed. There was a synergistic relationship between the production function and the social environment, which indicated that the effect of human action on the production function of cultivated land was positive. The relationship between ecological function and natural environment was synergistic, which showed that they were complementary to each other.
Scale, spatial characteristics and natural environment in environmental quality were tradeoffs, indicating that the better the spatial quality was, the more easily the natural environment would be destroyed. Production function, carrying function and natural environment were trade-offs, indicating that the productive capacity and population carrying capacity of cultivated land in better natural environment were not large. However, ecological function and social environment were tradeoffs, which showed that human activities had a negative effect on ecological function.
4.2. Correlation Analysis
4.2.1. Correlation Analysis of Spatial Quality, Functional Quality and Environmental Quality of Cultivated Land
The correlation results of the indexes affecting the spatial quality, functional quality and environmental quality of the cultivated land revealed the following three points: First, the synergistic relationship between the scale and spatial characteristics representing the spatial quality of the cultivated land showed that the agglomeration effect formed by the scale and contiguity of the cultivated land had a positive effect on the quality of cultivated land. Secondly, according to the tradeoffs and synergies among the production function, ecological function, landscape function and carrying function, which represent the functional quality of cultivated land, it can be seen that there was a certain degree of positive influence among the functions of cultivated land, but the relationship between production function and landscape function was not significant. Thirdly, the tradeoff between the social environment and the natural environment, which represented the environmental quality of cultivated land, showed that the social environment and the natural environment became a set of conflicting indicators because the social development always occurred at the expense of the natural environment. It is incorrect to sum up the past experience of this development situation, and a sustainable development road must be found.
4.2.2. Correlation Analysis of Two Indexes Affecting Cultivated Land Quality
It can be seen from the correlation results of various indicators affecting cultivated land quality that there were synergistic and tradeoff relations among spatial quality, functional quality and environmental quality, indicating that the influences of the three on cultivated land quality were mutually restricted and act together. The quality of scale and spatial characteristics were synergistic with the production function, bearing function and social environment, indicating that the large-scale operation and management of cultivated land improved the production capacity of the cultivated land, and the positive impact on the social environment could not be ignored. The scale quality, spatial characteristic quality and the natural environment were all trade-offs, indicating that the land renovation project changed the original natural shape, thus destroying the natural environment. Production function and social environment were synergistic, which showed that production function and human activities were complementary. The production function, bearing function and natural environment were tradeoff relations, from the root showed that the formation of cultivated land was a kind of artificial transformation of nature behavior. The quality of cultivated land production function, bearing function and natural environment was a kind of relationship. Ecological function and natural environment were synergistic, which showed that they were complementary to each other. Ecological function and social environment were trade-offs, which showed that human activities had a negative effect on ecological function.
4.3. Cold and Hot Spot Analysis Results
The quality of cultivated land depends on the factors such as light temperature, water, soil and people, which differ greatly with the change of geographical environment. Therefore, it is necessary to analyze the indicators affecting cultivated land from the spatial distribution. It is of great significance to zoning cultivated land quality, giving full play to the agglomeration effect of cultivated land scale, formulating targeted protection measures and improving the efficiency of cultivated land use.
Based on the correlation analysis and cold and hot spot analysis, it could be seen that the hot spot areas, such as scale, spatial characteristics, production function, carrying function and social environment, were mainly in the central plain area of Qujiang District, which is the area of cultivated land large-scale production and cultivated land priority protection in the whole region, and was the main grain production area. The ecological function hotspot was located in the middle and south of Qujiang District, which was suitable for the development of cultivated land eco-tourism industry. The hot spots of natural environment were located in the north and south of the district, which should be protected for ecological environment and suitable for returning farmland to forest. The cold point area of each index was the key area to implement the cultivated land protection system and the important basis for quality zoning.
4.4. Zoning Analysis of Cultivated Land Quality
According to the quality of cultivated land quality index, correlation and cold and hot spot analysis, the cultivated land quality of Qujiang District was divided into regions, which provided ideas for realizing differentiated protection and fine management and protection of cultivated land. According to the result of the quality division, the construction, utilization and protection of cultivated land were proposed from three aspects of economy, society and the environment.
In the social aspect, the cultivated land production function area, the cultivated land comprehensive improvement and function improvement area and the cultivated land resource shortage area should play their advantages in space, productivity and carrying capacity, ensure food security, develop modern agricultural industry and through strengthening agricultural infrastructure construction and cultivated land management level, establish centralized contiguously high standard farmland, maintain stable cultivated land area and improve the quality of cultivated land.
In terms of the economy, the cultivated land comprehensive functional area, which focuses on developing comprehensive agriculture and improving comprehensive agricultural production capacity, is a key area to develop into a modern agricultural demonstration area under the background of traditional agricultural transformation and upgrading.
In terms of the environment, the main area of cultivated land ecology and landscape function is the main area to maintain the balance of ecological environment, protect biodiversity protection and maintain the aesthetics of cultivated land landscape. At the same time, through the formation of characteristic agricultural industry, it drives the development of the agricultural economy and is an important area to help rural revitalization.
5. Conclusions
On the basis of the existing research results, this study combined the existing research on cultivated land quality and explored how to conduct comprehensive and systematic protection of cultivated land from the three aspects of space, function and environment. By clarifying the basic concepts, this study made a theoretical analysis of the relationship between the quantity, quality and ecology of cultivated land and the space, function and environment of cultivated land. The current study proposed a systematic theoretical framework for evaluating the space, function and environmental quality of cultivated land, constructed an indicator system and made an empirical application using the Qujiang District as the case area. The following conclusions are drawn.
The cultivated land quality evaluation results based on the space–function–environment have a supporting role in the development of modern agriculture. The cultivated land with good space quality is suitable for large-scale mechanized agricultural operation, the cultivated land with moderate space quality can be used for small-scale mechanized agricultural operation and the cultivated land with poor space quality is not suitable for mechanized operation. The cultivated land with high functional quality is suitable for the development of food, cash crops, tourism and other industries. The cultivated land with poor functional quality should identify its limiting factors and improve the functional quality of its cultivated land. The cultivated land with high environmental quality can produce high-grade organic agricultural products, as well as pollution-free agricultural products, while the cultivated land with poor environmental quality needs to strictly prohibit or restrict the production of edible agricultural products, and switch to industrial grain production or flower cultivation. The cultivated land with high comprehensive quality of space–function–environment should be classified as permanent basic farmland.
The trade-offs and synergies among the indicators of space–function–environment of the cultivated land are the basis for exploring zoning construction, utilization and protection measures based on cultivated land quality. The scale and spatial characteristics in spatial quality were synergistic with the production function, carrying function and social environment in the environmental quality, indicating that cultivated land with a better spatial quality also had a greater production capacity, which could support a greater population and form a better social environment. The relationship between the production function and social environment was also synergistic, which showed that the influence of human action on the production function of the cultivated land was positive. The ecological function and natural environment were synergistic, indicating that they also had a positive relationship. The scale, spatial characteristics and the natural environment in the environmental quality were trade-offs, indicating that if the spatial quality was better, the natural environment was more likely be damaged. The production function, carrying function and the natural environment were also trade-offs, which showed that few places had a high productive capacity and population carrying capacity of cultivated land and a good natural environment. The ecological function and social environment were trade-offs, which showed that human activities played a negative role in ecological function.
No significant relationship was found between landscape function and scale, spatial characteristics, production function, social environment, natural environment, ecological function and scale, carrying function and the social environment.
According to the cold and hot spot analysis of the secondary indicators of space quality, functional quality and environmental quality, cultivated land in the Qujiang District was divided into the main areas of cultivated land production function, ecological and landscape function, cultivated land resource tension, comprehensive improvement and function improvement of cultivated land and comprehensive functional areas of cultivated land. The main cultivated land production function area had the characteristics of large overall cultivated land area, relatively flat terrain, high plot connectivity and regularity, complete infrastructure and high comprehensive quality of the cultivated land. The main areas of cultivated land ecological and landscape functions were characterized by good ecological environment, beautiful landscape, scattered distribution of cultivated land and low farming efficiency. The cultivated land resource shortage area had the characteristics of a small, cultivated land area, dense population and cultivated land pollution. The comprehensive improvement and function improvement area of the cultivated land had the characteristics of inefficient use of the cultivated land, nonstandard layout and low comprehensive quality of the cultivated land.
Author Contributions
Conceptualization, F.X.; Methodology, X.X. and Y.X.; Writing—original draft, Y.S.; Supervision, B.X.; Project administration, H.L.; Funding acquisition, L.P. All authors have read and agreed to the published version of the manuscript.
Funding
This research was funded by the Natural Science Foundation of Zhejiang Province, China(LY21D010008,LQ21D010007), the National Natural Science Foundation of China (41701618,42101068,41871083, 41230751), the Natural Science Foundation for Distinguished Young Scholars of Zhejiang Province, China (LR21G030001), the Natural Science Foundation of Guangdong Province, China (2020A1515010730), the Humanities and Social Science General Program sponsored by the Ministry of Education of China (22YJCZH208) and the Open Fund of Key Laboratory of Coastal Zone Exploitation and Protection, Ministry of Natural Resources (2019CZEPK09).
Data Availability Statement
The data presented in this study are available on request from the corresponding author.
Conflicts of Interest
The authors declare no conflict of interest.
References
- FAO. A Framework for Land Evaluation; Soils Bulletin 32; Food and Agriculture Organization of the United Nations: Rome, Italy, 1976; p. 65. [Google Scholar]
- Pieri, C.; Dumanski, J.; Hamblin, A.; Young, A. Land quality indicators. In World Bank Discussion Papers; World Bank: Washington, DC, USA, 1995; p. 315. [Google Scholar]
- Rossiter, D.G. A theoretical framework for land evaluation. Geoderma 1996, 72, 165–190. [Google Scholar] [CrossRef]
- Costanza, R.; d’Arge, R.; De Groot, R.; Farber, S.; Grasso, M.; Hannon, B.; Limburg, K.; Naeem, S.; O’neill, R.V.; Paruelo, J.; et al. The value of the world’s ecosystem service and natural capital. Nature 1997, 387, 253–260. [Google Scholar] [CrossRef]
- Bouma, J.; Droogers, P. A procedure to derive land quality indicators for sustainable agricultural production. Geoderma 1998, 85, 103–110. [Google Scholar] [CrossRef]
- Yang, H.; Li, X. Cultivated land and food supply in China. Land Use Policy 2000, 17, 73–88. [Google Scholar] [CrossRef]
- Lichtenberg, E.; Ding, C.R. Assessing farmland protection policy in China. Land Use Policy 2008, 25, 59–68. [Google Scholar] [CrossRef]
- Kong, X.B. China must protect high-quality arable land. Nature 2014, 506, 7. [Google Scholar] [CrossRef]
- Vasu, D.; Srivastava, R.; Patil, N.G. A comparative assessment of land suitability evaluation methods for agricultural land use planning at village level. Land Use Policy 2018, 79, 146–163. [Google Scholar] [CrossRef]
- Ni, S.X.; Liu, Y.S. On the importance of cultivated land quality in the total cultivated land dynamic equilibrium. Econ. Geogr. 1998, 18, 83–85. [Google Scholar]
- Matsom, P.A.; Parton, W.J.; Power, A.G.; Swift, M.J. Agricultural intensification and ecosystem properties. Science 1997, 277, 504–509. [Google Scholar] [CrossRef]
- Hvistendahl, M. China’s push to add by substracting fertilizer. Science 2010, 327, 801. [Google Scholar] [CrossRef]
- Vitousek, P.M.; Naylor, R.; Crews, T.; David, M.B.; Drinkwater, L.E.; Holland, E.; Johnes, P.J.; Katzenberger, J.; Martinelli, L.A.; Matson, P.A.; et al. Nutrient imbalances in agricultural development. Science 2009, 324, 1519–1520. [Google Scholar] [CrossRef]
- Guo, J.; Liu, X.; Zhang, Y.; Shen, J.; Han, W.; Zhang, W.; Christie, P.; Goulding, K.; Vitousek, P.; Zhang, F. Significant acidification in major Chinese croplands. Science 2010, 327, 1008–1010. [Google Scholar] [CrossRef]
- Xu, Y.; Pu, L.J.; Zhang, R.; Zhu, M.; Zhang, M.; Bu, X.; Xie, X.; Wang, Y. Effects of agricultural reclamation on soil physicochemical properties in the mid-eastern coastal area of China. Land 2021, 10, 142. [Google Scholar] [CrossRef]
- Xie, X.F.; Wu, T.; Zhu, M.; Jiang, J.J.; Xu, Y.; Wang, X.H.; Pu, L.J. Comparison of random forest and multiple linear regression models for estimation of soil extracellular enzyme activities in agricultural reclaimed coastal saline land. Ecol. Indic. 2021, 120, 106925. [Google Scholar] [CrossRef]
- Uwizeyimana, H.; Wang, H.; Chen, W. Evaluation of combined noxious effects of siduron and cadmium on the earthworm Esisenafoetida. Environ. Sci. Pollut. Res. 2016, 24, 5349–5359. [Google Scholar] [CrossRef]
- Zhao, F.J.; Ma, Y.; Zhu, Y.G.; Tang, Z.; McGrath, S.P. Soil contamination in China, current status and mitigation strategies. Environ. Sci. Technol. 2015, 49, 750. [Google Scholar] [CrossRef]
- Wang, F.F.; Guan, Q.Y.; Tian, J.; Lin, J.K.; Yang, Y.Y.; Yang, L.Q.; Pan, N.H. Contamination characteristics, source apportionment, and health risk assessment of heavy metals in agricultural soil in the Hexi Corridor. Catena 2020, 191, 104573. [Google Scholar] [CrossRef]
- Pearson, W.R.; Lipman, D.J. Improved tools for biological sequence comparison. Proc. Natl. Acad. Sci. USA 1988, 85, 16138–16143. [Google Scholar] [CrossRef]
- Spearman, C. The proof and measurement of association between two things. Am. J. Psychol. 1904, 15, 72–101. [Google Scholar] [CrossRef]
- Yang, Y.; Christakos, G.; Guo, M.W.; Xiao, L.; Huang, W. Space-time quantitative source apportionment of soil heavy metal concentration increments. Environ. Pollut. 2017, 223, 560–566. [Google Scholar] [CrossRef]
- Guo, W.; Wu, T.; Jiang, G.; Pu, L.; Zhang, J.; Xu, F.; Yu, H.; Xie, X. Spatial distribution, environmental risk and safe utilization zoning of soil heavy metals in farmland, subtropical China. Land 2021, 10, 569. [Google Scholar] [CrossRef]
- Rodríguez, J.P.; Beard, T.D., Jr.; Bennett, E.M.; Cumming, G.S.; Cork, S.J.; Agard, J.; Peterson, G.D. Trade-offs across space, time, and ecosystem services. Ecol. Soc. 2006, 11, 709–723. [Google Scholar] [CrossRef]
- Getis, A.; Keith Ord, J. The Analysis of Spatial Association by Use of Distance Statistics. Geogr. Anal. 1992, 24, 189–206. [Google Scholar] [CrossRef]
- Huan, L. Introduction to the Research of Marginalization of Agricultural Land, 1st ed.; China Social Sciences Press: Beijing, China, 2023; pp. 154–196. [Google Scholar]
- Coyle, C.; Creamer, R.E.; Schulte, R.P.O.; O’Sullivan, L.; Jodan, P. A Functional Land Management conceptual framework under soil drainage and land use scenarios. Environ. Sci. Policy 2016, 56, 39–48. [Google Scholar] [CrossRef]
- Akhtar, K.; Wang, W.Y.; Ren, G.X.; Khan, A.; Feng, Y.Z.; Yang, G.H.; Wang, H.Y. Integrated use of straw mulch with nitrogen fertilizer improves soil functionality and soybean production. Environ. Int. 2019, 132, 105092. [Google Scholar] [CrossRef]
- Schellberg, J.; Hill, M.J.; Grehards, R.; Rothmund, M.; Braun, M. Precision agriculture on grassland: Applications, perspectives and constraints. Eur. J. Agron. 2008, 29, 59–71. [Google Scholar] [CrossRef]
- Legaz, B.V.; De Souza, D.M.; Teixeira RF, M.; Antón, A.; Putman, B.; Sala, S. Soil quality, properties, and functions in life cycle assessment: An evaluation of models. J. Clean. Prod. 2017, 140, 502–515. [Google Scholar] [CrossRef]
- Zhang, L.G.; Wang, Z.Q.; Chai, J.; Li, B.Q. Multifunction spatial differentiation and comprehensive zoningof cultivated land in Hubei Province. Areal. Res. Dev. 2019, 38, 125–130. [Google Scholar]
| Disclaimer/Publisher’s Note: The statements, opinions and data contained in all publications are solely those of the individual author(s) and contributor(s) and not of MDPI and/or the editor(s). MDPI and/or the editor(s) disclaim responsibility for any injury to people or property resulting from any ideas, methods, instructions or products referred to in the content. |
© 2023 by the authors. Licensee MDPI, Basel, Switzerland. This article is an open access article distributed under the terms and conditions of the Creative Commons Attribution (CC BY) license (https://creativecommons.org/licenses/by/4.0/).
