Article

Multi-Window Identification of Landslide Hazards Based on InSAR Technology and Factors Predisposing to Disasters

1
School of Environment and Spatial Informatics, China University of Mining and Technology, Xuzhou 221116, China
2
Shandong GEO-Surveying and Mapping Institute, Jinan 250002, China
3
Artificial Intelligence Research Institute, China University of Mining and Technology, Xuzhou 221116, China
*
Authors to whom correspondence should be addressed.
Land 2023, 12(1), 173; https://doi.org/10.3390/land12010173
Submission received: 15 December 2022 / Revised: 1 January 2023 / Accepted: 3 January 2023 / Published: 5 January 2023
(This article belongs to the Section Land Innovations – Data and Machine Learning)

Abstract

:
Identification of potential landslide hazards is of great significance for disaster prevention and control. CNN (Convolutional Neural Networks), RNN (Recurrent Neural Networks) and many other deep learning methods have been used to identify landslide hazards. However, most samples are made with a fixed window size, which affects recognition accuracy to some extent. This paper presents a multi-window hidden danger identification CNN method according to the scale of the landslide in the experimental area. Firstly, the hidden danger area is preliminarily screened by InSAR deformation processing technology. Secondly, based on topography, geology, hydrology and human activities, a total of 15 disaster-prone factors are used to create factor datasets for in-depth learning. According to the general scale of the landslide, models with four window sizes of 48 × 48, 32 × 32, 16 × 16 and 8 × 8 are trained, respectively, and several window models with better recognition effect and suitable for the scale of landslide in the experimental area are selected for the accurate identification of landslide hazards. The results show that, among the four windows, 16 × 16 and 8 × 8 windows have the best model recognition effect. Then, according to the scale of the landslide, these optimal windows are pertinently selected, and the precision, recall rate and F-measure of the multi-window deep learning model are improved (82.86%, 78.75%, 80.75%). The research results prove that the multi-window identification method of landslide hazards combining InSAR technology and factors predisposing to disasters is effective, which can play an important role in regional disaster identification and enhance the scientific and technological support ability of geological disaster prevention and mitigation.

1. Introduction

The fine investigation degree of landslides and other geological disasters depends on the early identification, continuous monitoring and geological analysis and judgment of hidden dangers [1,2,3]. In recent years, most of the major landslide disasters that have occurred one after another are outside the scope of the hidden danger points of the existing investigation work. How to identify hidden dangers more comprehensively puts forward new requirements for the investigation of ground disasters [4,5]. It is of great practical significance to study the causes of landslides, fully understand their form background and comprehensively use various new technologies, such as InSAR and high-resolution satellite remote sensing, to further improve the accuracy of landslide hazard identification, so as to find and monitor hazards more efficiently [6,7,8].
InSAR technology can use radars located in different spatial positions to observe the same target ground features, obtain two or more SAR images and then perform interference processing. Through the interference phase difference of two echo signals of the same target, the elevation or deformation information of the target can be obtained [9,10]. Compared with traditional monitoring methods for geological disasters, such as ground fissures, surface deformation, deep displacement, in-situ stress, etc., InSAR technology has the characteristics of a wide monitoring range, a large space-time scale and the ability to extract more abundant deformation information [11,12]. It has become a key technology in the application of geological disaster monitoring [13,14,15]. However, due to the limitations of the SAR image itself and the scope of application of InSAR technology, it is not enough to directly determine the landslide hazard based on the results obtained by InSAR. It is also necessary to analyze the formation conditions and form a background of the landslide from the disaster itself [10,16,17]. Landslides and other geological disasters are caused by many factors, such as topography, stratum lithology, hydrology, vegetation development and human activities. Among them, topography, stratum lithology, etc., are the basic conditions for landslide disasters, which provide the necessary material basis and activity space for landslide formation and control the landslide. Rainfall and human activities play a role in the occurrence of landslides through basic factors, which can accelerate or decelerate landslides, as well as stimulate or inhibit them. These factors can be collectively referred to as the background or formation conditions of landslides, and can be characterized by multi-source data.
In recent years, deep learning methods have been used in the related fields of landslide hazard identification. For example, Dong et al. [10], based on a combination of InSAR technology and the background indicators of disaster formation in the experimental area, used a convolution neural network and a long-term and short-term memory neural network to identify the geological hazard in the eastern part of the Three Gorges reservoir area. Zheng et al. [5] used InSAR deformation monitoring data and high-resolution optical remote sensing data, combined with 17 landslide influencing factors, to characterize the morphology and texture characteristics of landslides. Through spatial superposition analysis of 64 potential active landslides, 83 potential landslide disaster deformation accumulation areas and 54 non-potential landslide disaster deformation accumulation areas were identified in the experimental area. Ding et al. [18] combined the six-layer CNN network and the texture features of Gaofen-1 satellite images to realize the automatic extraction of landslides. Feng [19] used the Defor-Net image segmentation network to intelligently identify surface deformation and detect the deformation disaster area according to the error characteristics of the InSAR deformation results. Zhu et al. [20] proposed the DRS-Unet image segmentation network, which can quickly identify active landslides in InSAR images. Ju et al. [21] established a sample database of historical loess landslides based on open source Google Earth images, and realized the automatic identification of loess landslides by using the target detection module of the Mask Region Convolutional Neural Network (Mask R-CNN). In addition, FCN (Fully Convolutional Networks), U-Net, Seg-Net, ResU-Net and other deep semantic segmentation models have also been used in the field of deformation disaster area identification [22]. Among the many deep learning models, CNN has a highly classic and effective architecture, which has been well applied in landslide classification, landslide detection and landslide segmentation [23,24,25,26], but most of them use fixed window size samples for modeling, which limits the recognition accuracy to some extent.
Therefore, this paper develops a multi-window hidden danger identification CNN according to the scale of the landslide in the experimental area. The structure of this paper is as follows. The Section 2 describes the general flow of the whole method and the specific steps. The Section 3 describes the experimental area used and the related data. The Section 4 presents and discusses the experimental results. The Section 5 summarizes our work and makes relevant points.

2. Methodologies

2.1. Data Processing Flow

The flow chart of this method is shown in Figure 1, which mainly includes: (1) Data sources and influencing factors of landslides: namely, Sentinel-1A image used for InSAR deformation processing, Gaofen-1 image used to assist in correcting InSAR hidden danger identification results, in addition, DEM (Digital Elevation Model), DLG (Digital Line Graph), relevant geological and hydrological data, etc., are also used. They are used to obtain lithology, distance from faults, rainfall, NDVI, distance from road, distance from river, DEM, aspect, slope, curvature, plane curvature, profile curvature, roughness, relief and TWI (Topographic Wetness Index), with a total of 15 landslide-related risk factors. (2) Catalog of potential landslide hazards: the identification of landslide hazards based on the combination of radar differential interferometry (D-InSAR) and time series InSAR technology. (3) Comparison of different windows samples: namely, multi-window screening of landslide hazards with geographical factors. According to the general scale of the landslide, the python code was written using Pycharm editor to train four CNN models with 48 × 48, 32 × 32, 16 × 16 and 8 × 8 window sizes, respectively, and the model with better recognition effect and most suitable for the scale of the landslide in the experimental area was selected. Each part is described in detail below.

2.2. Landslide Hazard Identification Based on InSAR Technology

In order to ensure the reliability of deformation processing results, a combination of radar differential interferometry (D-InSAR) and time series InSAR technology was used to identify the hidden dangers of geological disasters in the work area [20]. By comparing the extraction results of different methods, the best deformation results that met the technical specifications of InSAR data processing and the quality of subsequent analysis were selected. We delineated the concentrated distribution area of slope surface deformation, and used it as the landslide hidden danger area for preliminary screening.
However, it was necessary to analyze whether the deformation was the real deformation or the interference of other factors [20], especially for mountainous and canyon areas with lush vegetation. Therefore, on the basis of the above screening results, combined with the background and formation conditions of landslide disasters, the second screening of landslide hidden danger areas was carried out, and statistical information, such as deformation variables and deformation rates of hidden danger areas, were extracted.

2.3. Multi-Window Screening of Landslide Hazards Supplemented by Geographical Factors

CNN is used to complete the modeling of landslide hazard identification. CNN is a feed-forward neural network, of which the artificial neurons can respond to some surrounding units in the coverage area, and it has excellent performance for large-scale image processing. Compared with other depth and feed-forward neural networks, CNN has fewer parameters to consider and can give better results in terms of images [23,24]. The basic structure of CNN is as follows: input layer, hidden layer and output layer, among which, the hidden layer mainly consists of a convolution layer, a pool layer and a full connection layer. In the hidden layer, by arranging these layers in a certain order and with a certain number of repetitions, mutual coordination and interaction among the layers can be realized, which allows the neural network powerful functions [27]. The details are as follows:
(1) Convolutional layer: The convolutional layer is the core component of the convolutional neural network. This layer extracts more abstract and advanced local features from the original data by the convolutional kernel. The graph obtained after convolutional processing is also called a feature map [27,28]; its size J o M a p is calculated as shown in Equation (1). J i M a p is the dimension of the input feature map, J W i n d o w is the dimension of the convolutional kernel, J I n t e r v a l is the sliding step of the convolutional kernel.
J o M a p = ( J i M a p J W i n d o w J I n t e r v a l + 1 )
The calculation formula of the convolution layer input and output is shown in Equation (2), where f represents the activation map, Y ( r ) represents the output characteristic map of the current convolution layer, X ( r 1 ) represents the output characteristic map of the r − 1 layer pool layer, and W ^ ( r ) represents the convolution kernel, which B ^ ( r ) is offset [28].
Y ( r ) = f ( W ^ ( r ) × X ( r 1 ) + B ^ ( r ) )
Sigmoid function is often used as the activation function to realize the nonlinearity of the network and enhance the nonlinear ability of the network [27]. Its calculation formula is shown in Equation (3):
f ( x ) = 1 1 + e x
(2) Pooling layer: The pooling layer is mainly used for down sampling, which serves to remove redundant information and reduce computation, as well as to prevent overfitting through feature down sampling, which is actually a nonlinear form of down sampling [25,26]. The output feature map size P o M a p is calculated as shown in Equation (4), where S i M a p represents the dimensionality of the input feature map and S W i n d o w represents the dimensionality of the computational window of the layer [28].
P o M a p = S i M a p S W i n d o w
The output X ( r ) of the pooling layer is calculated as shown in Equation (5), where W ( r ) is the pooling window of the current layer, Y ( r ) is the output of the convolutional layer, and B ^ ( r ) is the bias [27].
X ( r ) = W ( r ) Y ( r ) + B ( r )
(3) The fully connected layer, on the other hand, combines all the effective features through complete connection between networks, which is calculated by the following formula. Where Y ( f ) represents the output of the current fully connected layer, W ( f ) represents the weight of the fully connected layer, Y ( f 1 ) represents the input of the previous fully connected layer, and B ( f ) is the bias [27,28].
Y ( f ) = f ( W ( f ) Y ( f 1 ) + B ( f ) )
For the screened factors, we use the ArcGIS band synthesis tool to make multi-band datasets of disaster-bearing factors. Based on factor datasets within the range where the landslide hazard sites are located, four landslide sample datasets with 48 × 48, 32 × 32, 16 × 16 and 8 × 8 window sizes are constructed. At the same time, non-landslide ranges are randomly selected in the experimental area, and non-landslide sample datasets are constructed in the same way. Based on Pycharm editor, CNN models are built to train landslide hazard models using the TensorFlow framework in Python language. Adam is used as the optimizer; the number of samples selected in one training is set to 64; the learning rate is set to 0.01; the momentum is set to 0.9; and the weight is set to 0.01 to prevent over-fitting. The initial number of training epochnum is set to 200, and the model is trained until train loss converges.
For the trained deep learning model, the precision, recall and F-measure are used to evaluate the performance, as shown in Formulas (7)–(9). TP (True Positive) indicates the number of landslide samples with correct classification; TN (True Negative) indicates the number of non-landslide samples with correct classification; FP (False Positive) indicates the number of landslide samples with wrong classification; FN (False Negative) indicates the number of non-landslide samples with wrong classification [27].
p r e c i s i o n = T P T P + F P
r e c a l l l = T P T P + F N
F M e a s u r e = 2 p r e c i s i o n p r e c i s i o n p r e c i s i o n + r e c a l l l

3. Study Area and Data

3.1. Study Area

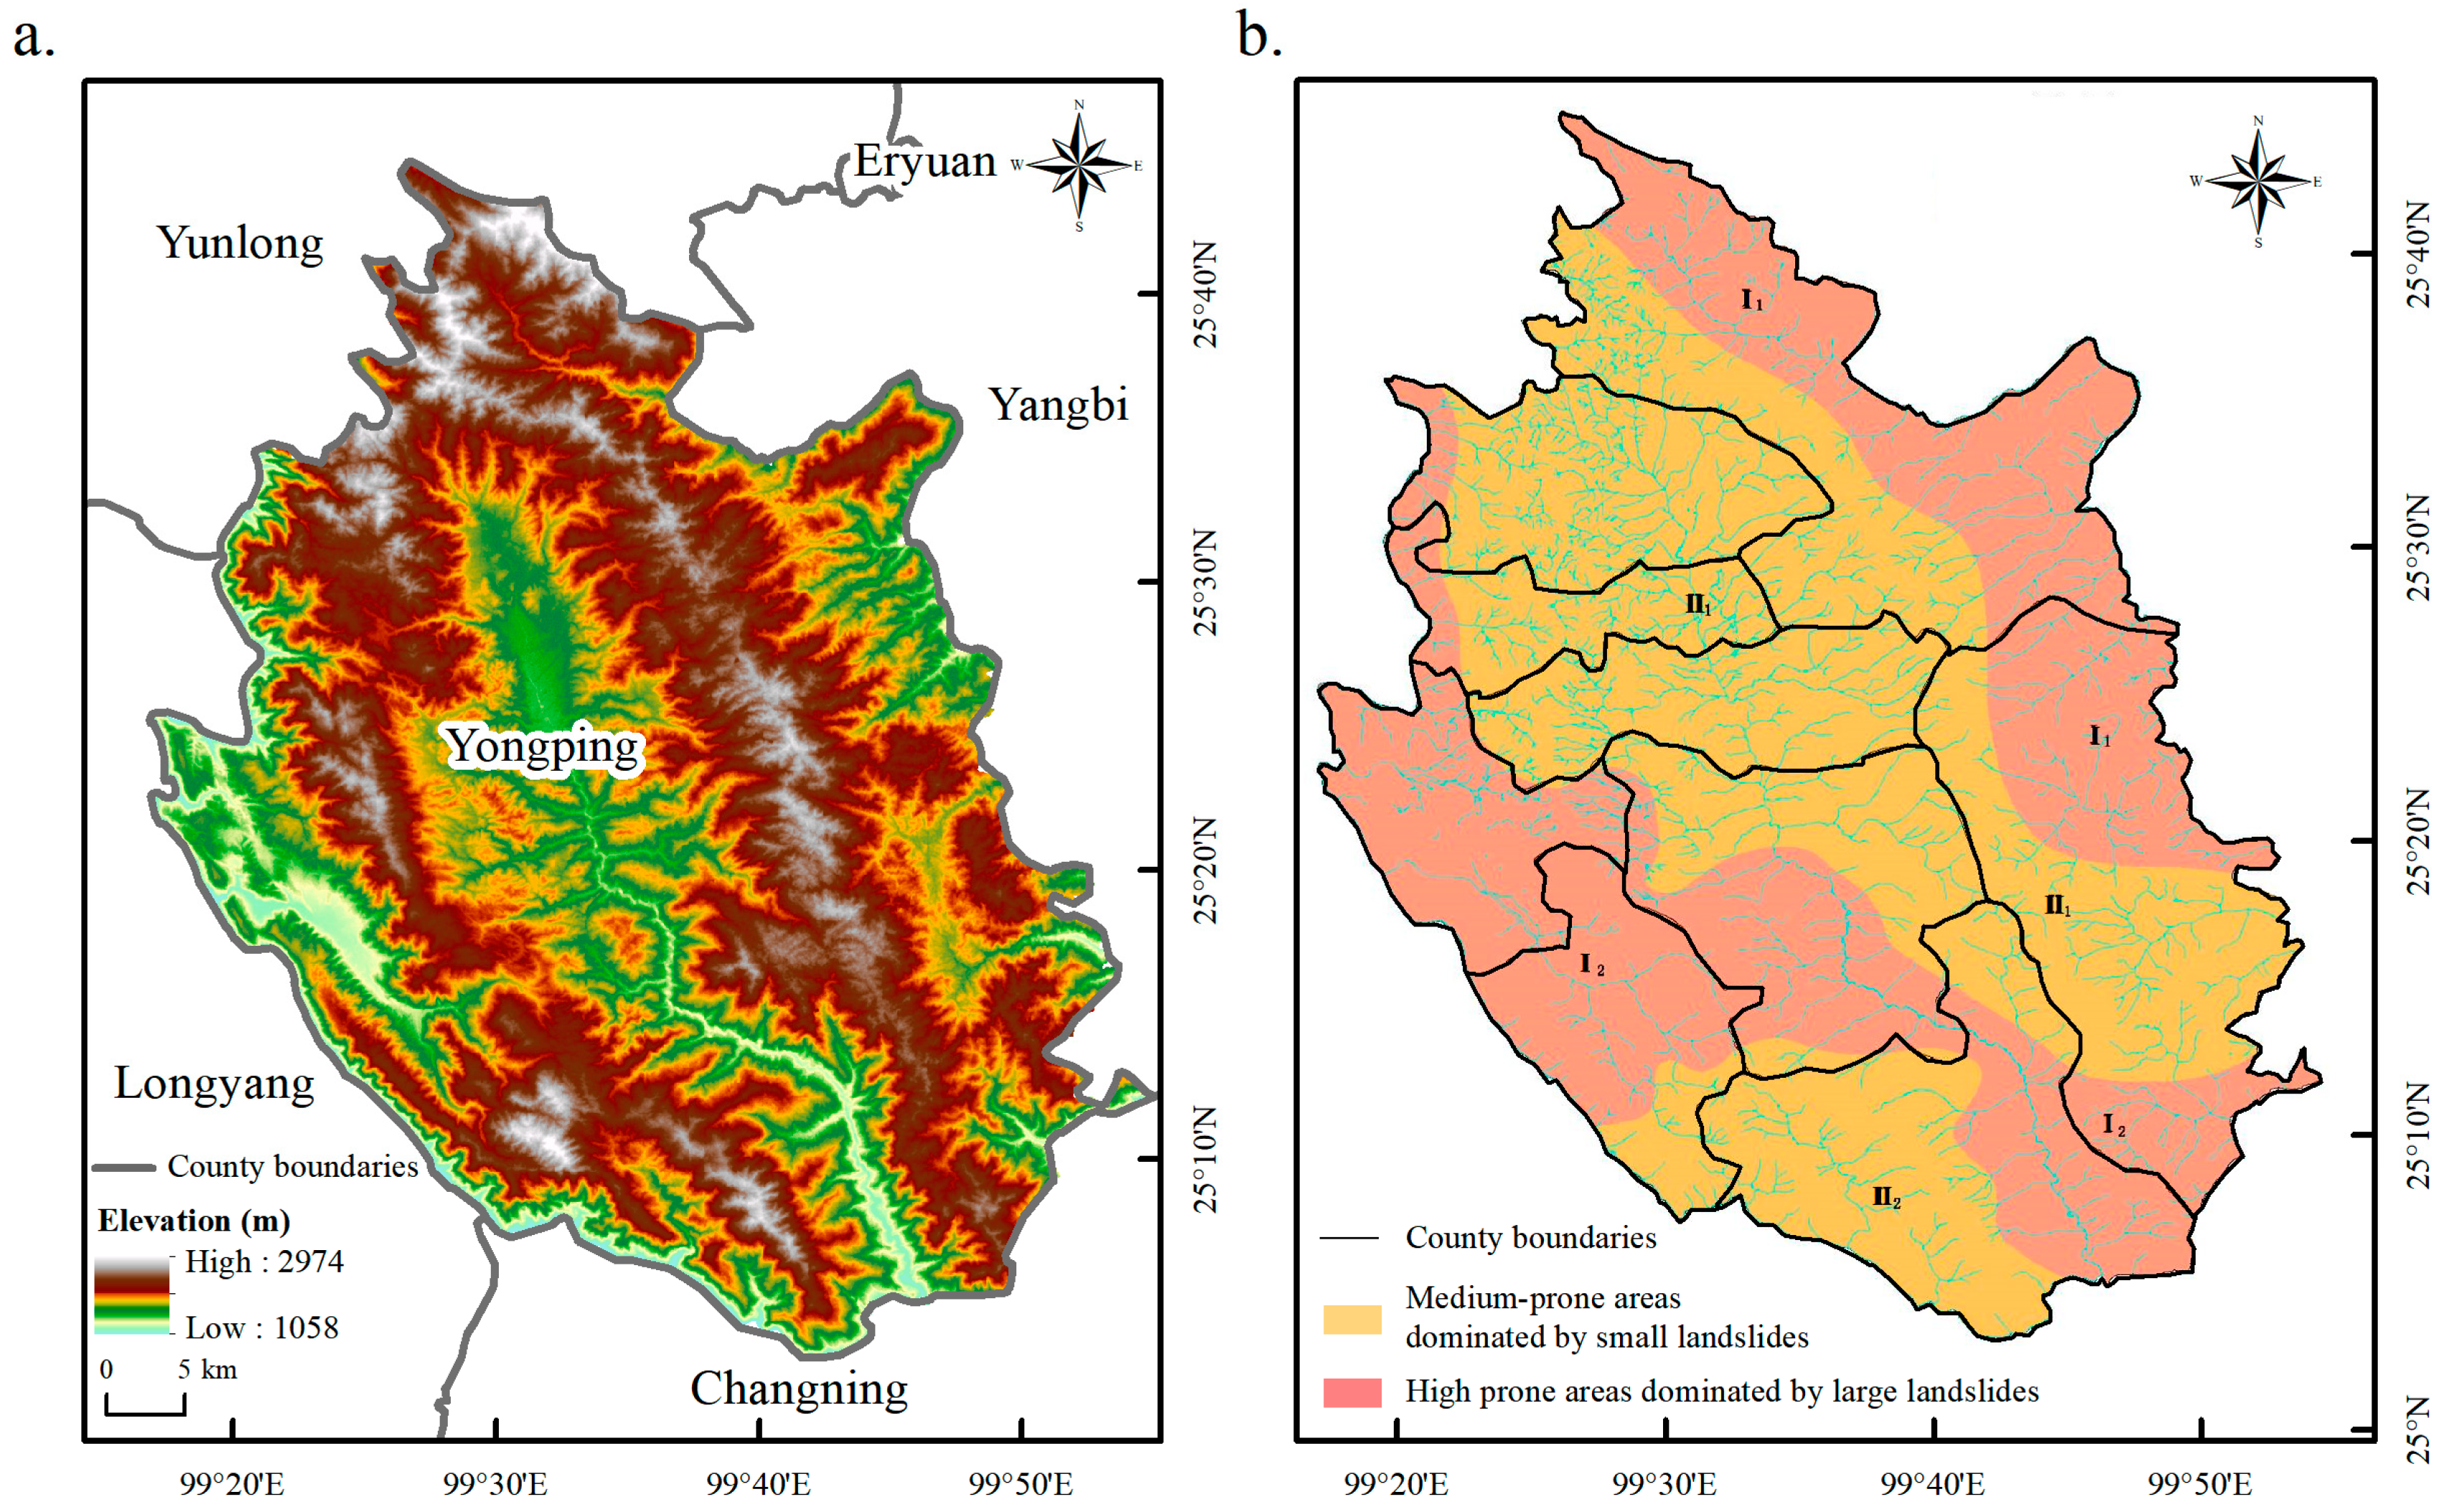
The selected experimental area was Yongping County (Figure 2a, using GIS software to draw, the same below), which is located in the west of Dali Bai Autonomous Prefecture (99°17′–99°56′ E, 25°03′–25°45′ N), China, with a total area of 2789.43 km2 [29]. The complex topography and geomorphology of Yongping County, with well-developed geological structures in the region, has led to the compression and deformation of rocks, the development of joints and fissures and the destruction of the integrity of rock mass, which reduces the stability of the slope and provides favorable conditions for the formation of geological disasters. At the same time, due to the seasonal difference in precipitation, precipitation in winter and summer are quite different, and the special topographic features often lead to geological disasters, such as collapses, landslides and debris flows [30]. According to the statistics of the Shandong GEO-Surveying and Mapping Institute, landslides are the most developed geological disaster type in Yongping County, which endangers the safety of local people’s lives and property, and hinders local social and economic development. Specifically, small landslides account for about 90.61%, mainly concentrated in areas prone to geological disasters; medium and large landslides account for about 10%, mainly concentrated in areas prone to geological disasters (Figure 2b).

3.2. Data and Preprocessing

For deformation processing, Sentinel-1A images are used as a source of radar satellite data. Specifically, the IW mode SLC data is dominated by the satellite’s interferometric wide-field mode (IW) single-view complex (SLC) images. For Yongping County, at the same time in the ascending direction, two images with the same track are needed to cover the whole county, and, at the same time in the descending direction, one image can cover the whole county. Therefore, between January 2019 and December 2020, 122 period images in the ascending direction were involved, along with 51 periods for the descending data. In addition, Gaofen-1 optical images are used to help correct the results of InSAR hidden danger identification.
Currently, there is no unified standard for the selection of landslide impact factors [31]. In this paper, based on the geological conditions of the study area, previous research results and fieldwork [26,32], fifteen landslide hazard factors were selected (Table 1 and Figure 3), including nine topographic factors (DEM, slope, aspect, curvature, plane curvature, profile curvature, roughness, relief, TWI). Two geological factors (lithology, distance from fault). Two hydrological factors (distance from river and rainfall), one human activity factor (distance from road) and NDVI products based on Landsat 8. To ensure the consistency of spatial resolution among all factor layer data, all factor layer data were resampled to 30 m resolution; a 30 m × 30 m grid unit was used as evaluation unit. At the same time, in order to eliminate the adverse effects of multicollinearity among evaluation factors on the prediction results of the model, a Pearson Correlation Coefficient (Pearson correlation coefficient) and Variance Inflation Factor (VIF) independence test were used to screen the risk factors after ensuring that the data were all transformed to normal distribution [33,34,35]. When the correlation between evaluation factors is greater than 0.7, there is collinearity among variables. When the variance expansion factor of the evaluation factor is greater than 10, there is multicollinearity among variables. When calculating the VIF, the evaluation factors with the highest VIF value are gradually eliminated until the VIF values of the remaining evaluation factors are all less than 10 [35,36].
The “Spatial Distribution Data of Geological Disaster Points” issued by the Resource and Environmental Science and Data Center of China Academy of Sciences (http://www.resdc.cn/data.aspx?DATAID=290, accessed on 1 December 2022) was used, among which there were 124 landslide disaster points in Yongping County. In addition, 121 hidden landslide spots and planes in the experimental area provided by Shandong GEO-Surveying and Mapping Institute were used to test the recognition effect of the deep learning model.

4. Results and Discussion

4.1. InSAR Deformation Treatment Results

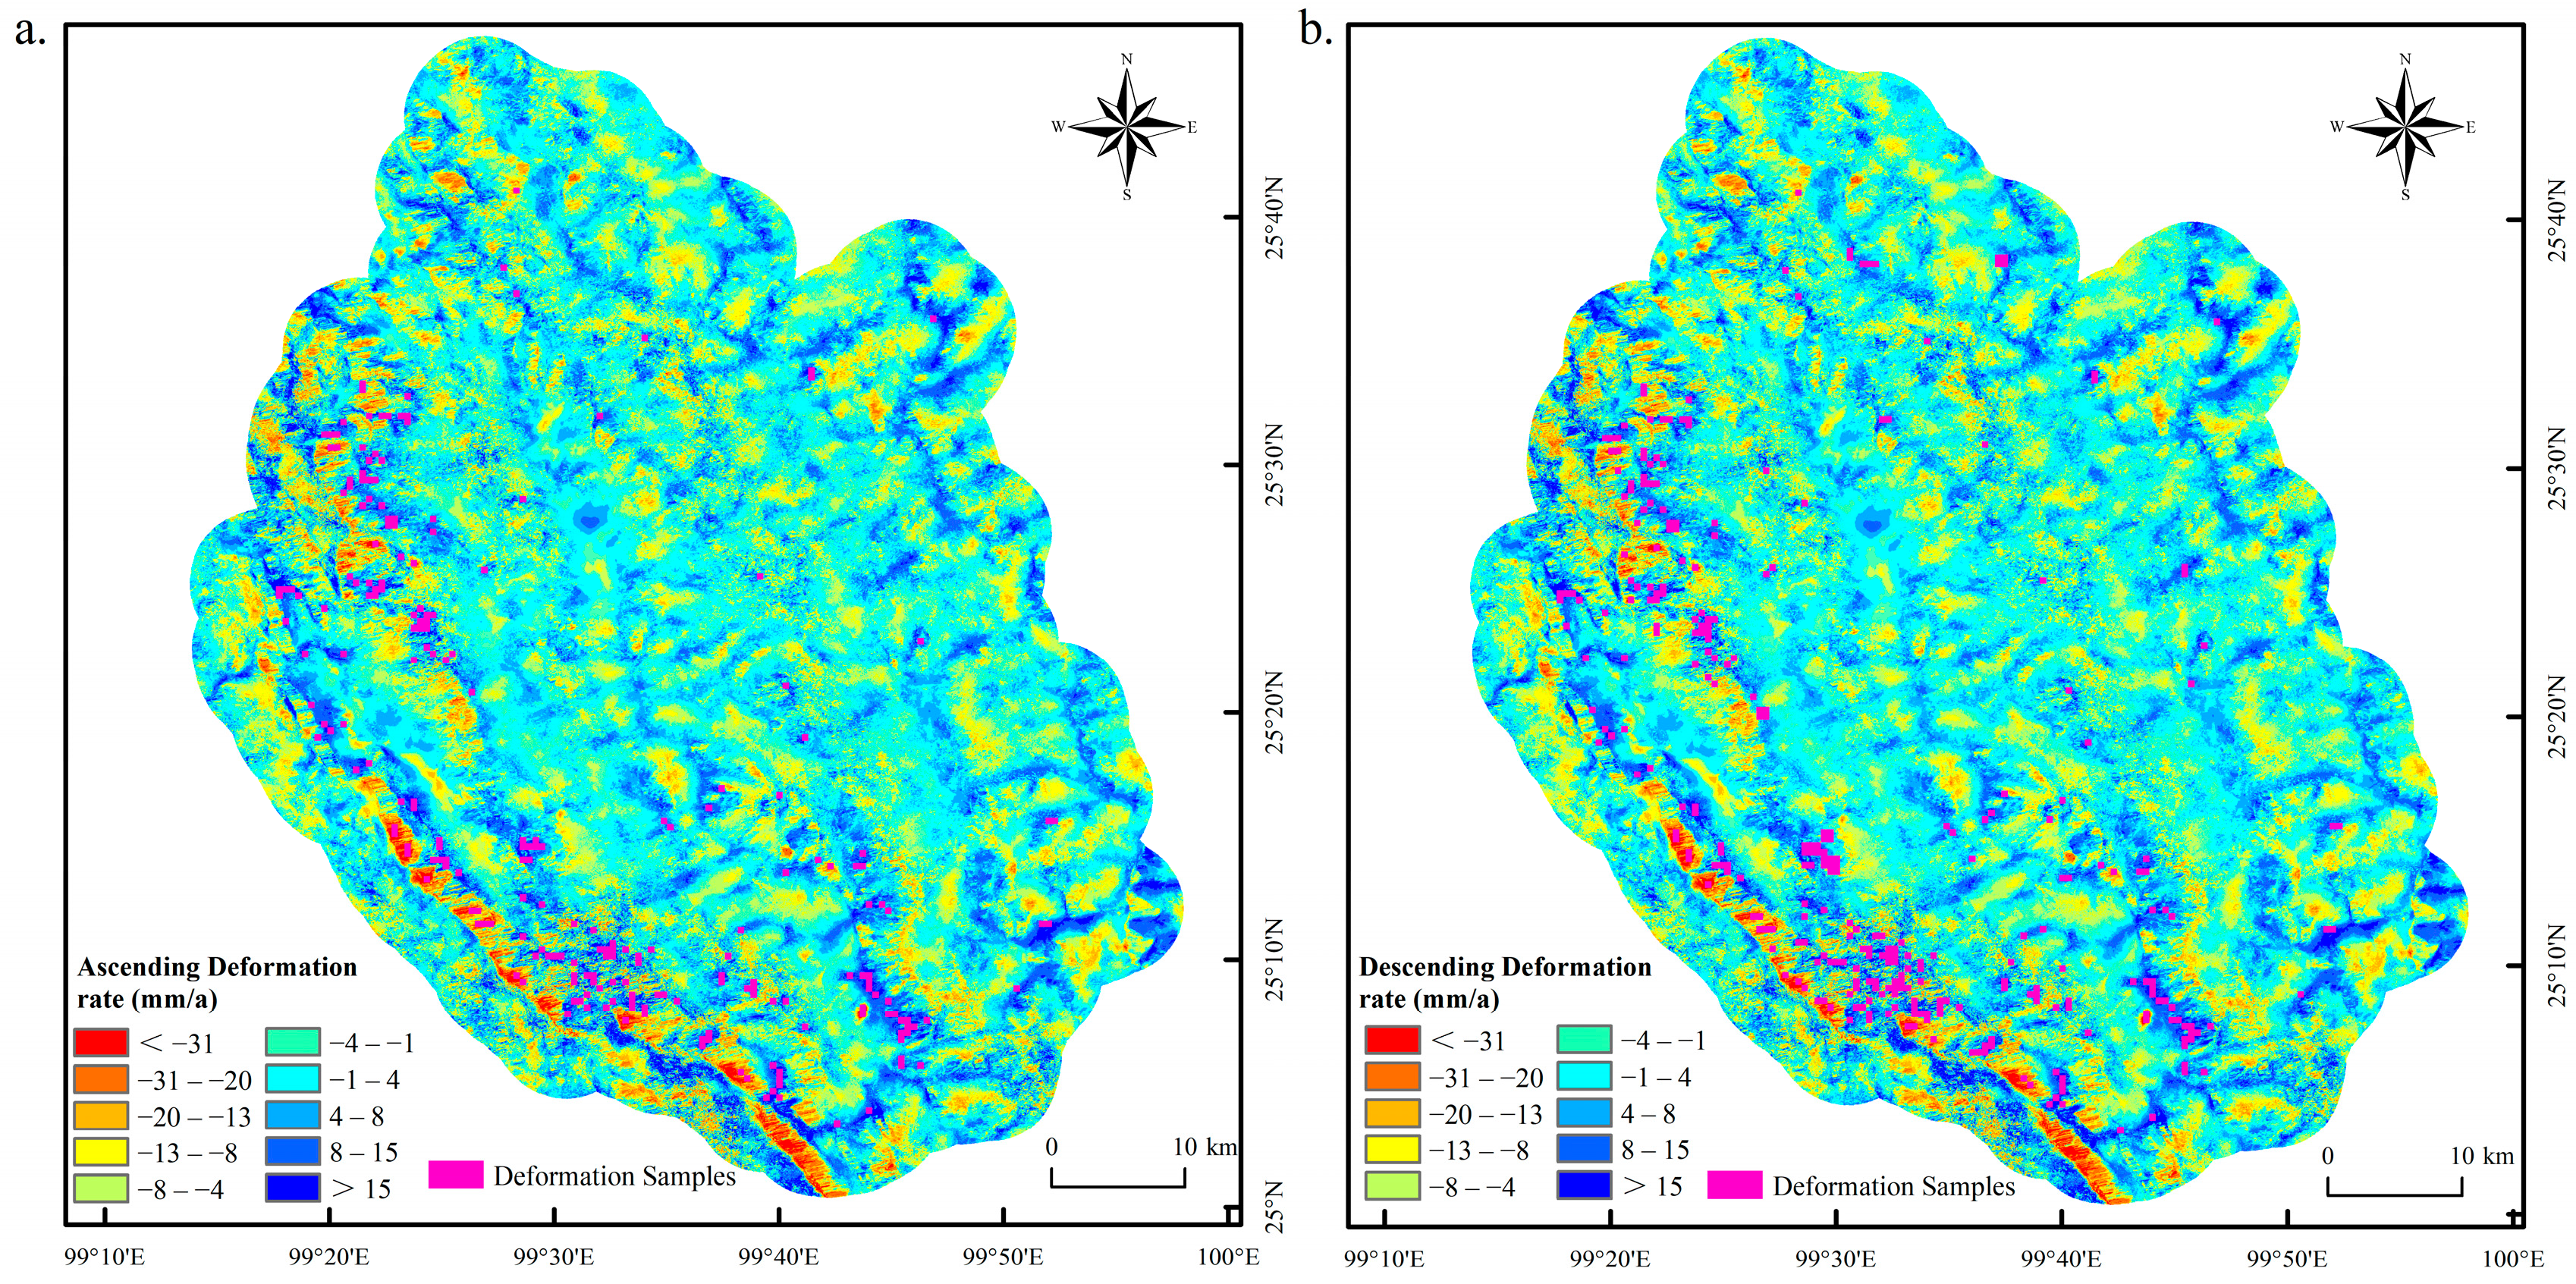
In order to facilitate the processing, we made a 5 km buffer for Yongping County, and the related deformation processing results are shown in Figure 4, and the samples selected based on this are shown in Figure 5. As shown in Figure 4a and Table 2, the monitoring data of ground surface deformation in Yongping County is normally distributed as a whole (the values of skewness and kurtosis passed the statistical test, as shown in Table 3), and the deformation rate in most areas is between −8 and 8 mm/a, covering an area of 2215.59 km2 and accounting for 79.42% of the total area. The area with a deformation rate of −20~−8 mm/a is 264.5 km2, accounting for 9.48% of the total area. The area of <−31 mm/a is only 7.14 km2, accounting for 0.26% of the total area. The area with a deformation rate of 8~15 mm/a is 226.95 km2, accounting for 8.14% of the total area. The area larger than 15 mm/a is 50.83 km2, accounting for 1.82% of the total area. As shown in Figure 4b and Table 4, the monitoring data of ground surface deformation in Yongping County shows a normal distribution as a whole (the values of skewness and kurtosis passed the statistical test, as shown in Table 3), and the deformation rate in most areas is between −11 and 14 mm/a, covering an area of 2559.71 km2 and accounting for 91.77% of the total area. The area with a deformation rate of −30~−11 mm/a is 153.06 km2, accounting for 5.49% of the total area. The area of <−30 mm/a is only 5.91 km2, accounting for 0.21% of the total area. The area larger than 14 mm/a is 70.75 km2, accounting for 2.53% of the total area. It can also be seen that the deformation in most areas of Yongping County is within the normal threshold range, and the performance is relatively stable. Some severe deformation areas with low deformation rates may have landslides, collapses or debris flows, which are the focus of follow-up research.
According to the results of deformation treatment, the typical areas of abnormal deformation are delineated by windows of 48 × 48, 32 × 32, 16 × 16 and 8 × 8, respectively, (Figure 5 shows the deformation sample selected by the window of 16 × 16, which is still based on the 5 km buffer zone in Yongping County), which are the potential landslide hazards preliminarily screened out. Based on the known landslide hazards in the experimental area provided by Shandong GEO-Surveying and Mapping Institute, 31 samples of 48 × 48 window landslide hazards and 105 samples of non-landslide hazards were made. In order to ensure the unity of the data itself, other window samples were made based on the location of 48 × 48 window samples, and the number of landslide and non-landslide samples of various window models was balanced as much as possible by means of data enhancement, such as rotation transformation [37].

4.2. Multi-Window Identification Results of Landslide Hazards

The results of the factor correlation analysis show (Table 5) that the pairwise correlation of slope, roughness and relief is greater than 0.7. After the independence test of variance expansion factor, the slope factor and topographic relief factor with a VIF value greater than 10 are eliminated, and the roughness factor is retained (Table 6). Finally, 13 factors including lithology, distance from faults, rainfall, NDVI, distance from road, distance from river, DEM, aspect, curvature, plane curvature, profile curvature, roughness and TWI are retained, and 13 bands of synthesized raster data are made.
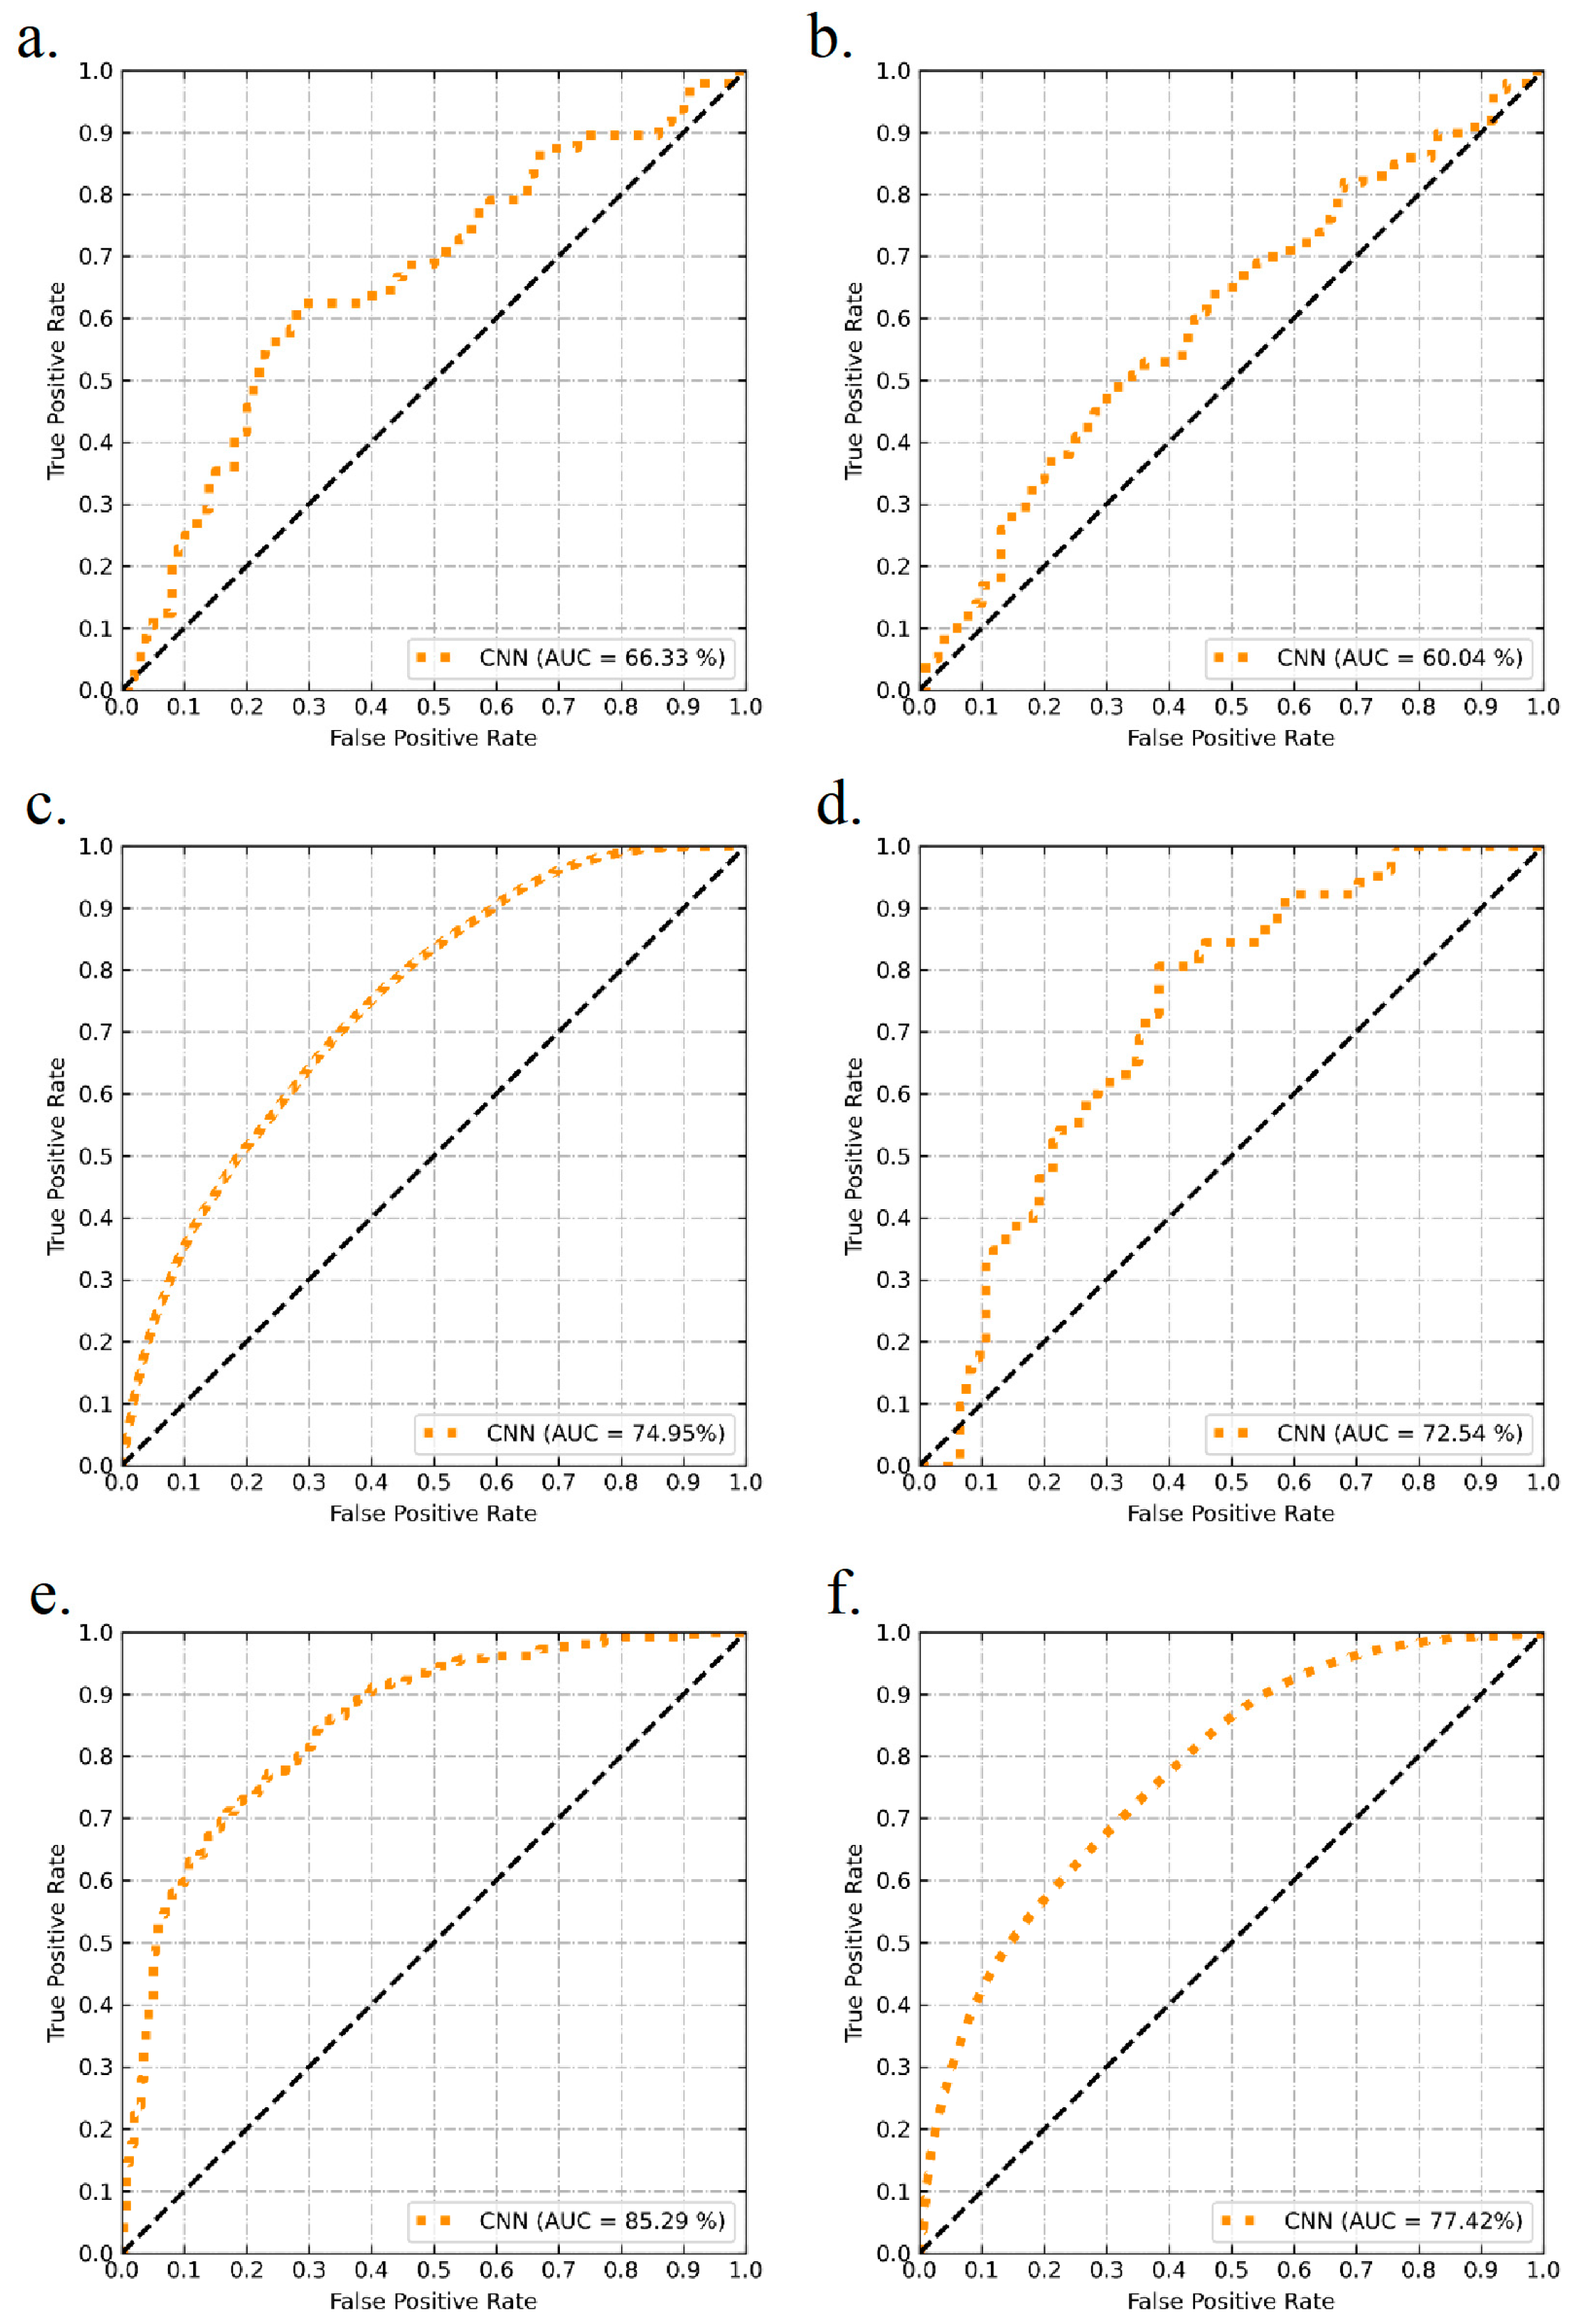
Train CNN models with window sizes of 48 × 48, 32 × 32, 16 × 16 and 8 × 8, respectively. The precision, recall and F-measure of each model are shown in Table 7, and the changes in ROC (Receiver Operating Characteristic Curve) and AUC (Area Under ROC) in the training process are shown in Figure 6a–d. The results show that, among the four fixed-size windows, the 16 × 16 window and the 8 × 8 window have relatively good landslide hazard identification effects (76.51%, 74.38%, 75.43% and 74.53%, 70.89%, 72.66%, respectively), and they are most in line with the present situation of landslide scale in the experimental area; therefore, they are the most suitable.
According to the distribution of landslides of different scales in the experimental area (Figure 2b), multiple optimal windows of 16 × 16 and 8 × 8 are used to identify hidden dangers. For precision, recall and F-measure, the recognition results of multiple windows of 16 × 16 and 8 × 8 are 82.86% for precision and 78.75% for recall. F-measure is 80.75% (Table 7), which is superior to the results obtained by the fixed window model, 6.35% higher than the precision of the best 16 × 16 fixed-window model, 4.37% higher than recall and 5.32% higher than F-measure. For ROC and AUC, according to Figure 6, it is not difficult to see that the ROC and AUC of various models are acceptable, both of which are higher than 66%, especially the multi-window method proposed in this paper. The ROC and AUC changes are shown in Figure 6e,f, respectively, and the AUC of the comprehensive recognition result is 81.34%, which proves that the recognition effect of the multi-window method used in this paper is obviously better than that of the fixed window [5,10,26], which shows the effectiveness of the method.

5. Conclusions

In the modeling of landslide hazard identification, using the traditional deep learning model with fixed windows is difficult to identify landslide hazards of different scales, which limits the identification accuracy to some extent. In this paper, a multi-window deep learning model was innovatively constructed, and, for medium, large and small landslide gathering areas, 16 × 16 window and 8 × 8 window CNN models were trained, respectively, which effectively identified the landslide hazards in Yongping County, Yunnan, China. Compared with the existing depth models using fixed windows, the proposed multi-window depth model could identify the hidden danger of landslides more effectively, and, at the same time, avoid subjective prejudice caused by only relying on expert experience to predict hidden danger. However, this paper mainly used a simpler hybrid approach to achieve landslide hazard identification with different windows. Future improvements can be made in terms of deep learning network structures to develop integrated models that can identify landslides of multiple scales using multiple windows.

Author Contributions

Conceptualization, W.Y. and X.X; Methodology, C.N. and W.Y.; Software, C.N. and Y.S.; Validation, W.Y. and Y.S.; Formal analysis, W.X.; Investigation, W.X. and S.Z.; Resources, S.Z.; Data curation, W.X.; Writing – original draft, C.N. and W.Y.; Writing—review & editing, X.Z. and Y.X.; Visualization, W.Y. and X.X.; Supervision, X.Z. and Y.X.; Project administration, C.N.; Funding acquisition, C.N. All authors have read and agreed to the published version of the manuscript.

Funding

This research was funded by the Key Technology Research and Development Program of SDGM (ShanDong Provincial Bureau of Geology and Mineral Resources), Grant Numbers: KY202224.

Data Availability Statement

Not applicable.

Conflicts of Interest

The authors declare no conflict of interest.

References

  1. Scaioni, M.; Longoni, L.; Melillo, V.; Papini, M. Remote sensing for landslide investigations: An overview of recent achievements and perspectives. Remote Sens. 2014, 6, 9600–9652. [Google Scholar] [CrossRef] [Green Version]
  2. Liu, X.; Miao, C. Large-scale assessment of landslide hazard, vulnerability and risk in China. Nat. Hazards Risk 2018, 9, 1037–1052. [Google Scholar] [CrossRef] [Green Version]
  3. Zhao, C.; Lu, Z. Remote sensing of landslides—A review. Remote Sens. 2018, 10, 279. [Google Scholar] [CrossRef] [Green Version]
  4. Lissak, C.; Bartsch, A.; De Michele, M.; Gomez, C.; Maquaire, O.; Raucoules, D.; Roulland, T. Remote sensing for assessing landslides and associated hazards. Surv. Geophys. 2020, 41, 1391–1435. [Google Scholar] [CrossRef]
  5. Zheng, X.; He, G.; Wang, S.; Wang, Y.; Wang, G.; Yang, Z.; Yu, J.; Wang, N. Comparison of machine learning methods for potential active landslide hazards identification with multi-source data. ISPRS Int. J. Geo-Inf. 2021, 10, 253. [Google Scholar] [CrossRef]
  6. Tien Bui, D.; Shahabi, H.; Shirzadi, A.; Chapi, K.; Alizadeh, M.; Chen, W.; Mohammadi, A.; Ahmad, B.B.; Panahi, M.; Hong, H.; et al. Landslide detection and susceptibility mapping by airsar data using support vector machine and index of entropy models in cameron highlands, malaysia. Remote Sens. 2018, 10, 1527. [Google Scholar] [CrossRef] [Green Version]
  7. Liu, Y.; Lu, Z.; Zhao, C.; Kim, J.; Zhang, Q.; de la Fuente, J. Characterization of the kinematics of three bears landslide in Northern California using L-band InSAR observations. Remote Sens. 2019, 11, 2726. [Google Scholar] [CrossRef] [Green Version]
  8. Zhou, C.; Cao, Y.; Hu, X.; Yin, K.; Wang, Y.; Catani, F. Enhanced dynamic landslide hazard mapping using MT-InSAR method in the Three Gorges Reservoir Area. Landslides 2022, 19, 1585–1597. [Google Scholar] [CrossRef]
  9. Dong, J.; Zhang, L.; Tang, M.; Liao, M.; Xu, Q.; Gong, J.; Ao, M. Mapping landslide surface displacements with time series SAR interferometry by combining persistent and distributed scatterers: A case study of Jiaju landslide in Danba, China. Remote Sens. Environ. 2018, 205, 180–198. [Google Scholar] [CrossRef]
  10. Dong, J.H.; Niu, R.Q.; Qi, M.R.; Ding, Z.; Xu, H.; He, R. Identification of geological hazards based on the combination of InSAR technology and disaster background indicators. Bull. Geol. Sci. Technol. 2022, 41, 187–196. [Google Scholar] [CrossRef]
  11. Osmanoğlu, B.; Sunar, F.; Wdowinski, S.; Cabral-Cano, E. Time series analysis of InSAR data: Methods and trends. ISPRS J. Photogramm. Remote. Sens. 2016, 115, 90–102. [Google Scholar] [CrossRef]
  12. Rongier, G.; Rude, C.; Herring, T.; Pankratius, V. Generative modeling of InSAR interferograms. Earth Space Sci. 2019, 6, 2671–2683. [Google Scholar] [CrossRef] [PubMed] [Green Version]
  13. Shi, X.; Liao, M.; Li, M.; Zhang, L.; Cunningham, C. Wide-area landslide deformation mapping with multi-path ALOS PALSAR data stacks: A case study of Three Gorges Area, China. Remote Sens. 2016, 8, 149. [Google Scholar] [CrossRef] [Green Version]
  14. Rosi, A.; Tofani, V.; Tanteri, L.; Stefanelli, C.T.; Agostini, A.; Catani, F.; Casagli, N. The new landslide inventory of Tuscany (Italy) updated with PS-InSAR: Geomorphological features and landslide distribution. Landslides Landslides 2018, 15, 5–19. [Google Scholar] [CrossRef] [Green Version]
  15. Zhang, Y.; Meng, X.; Dijkstra, T.; Jordan, C.; Chen, G.; Zeng, R.; Novellino, A. Forecasting the magnitude of potential landslides based on InSAR techniques. Remote. Sens. Environ. 2020, 241, 111738. [Google Scholar] [CrossRef]
  16. Ge, D.Q.; Dai, K.R.; Guo, Z.C.; Li, Z.H. Early Identification of Serious Geological Hazards with Integrated Remote Sensing Technologies: Thoughts and Recommendations. Geomat. Inf. Sci. Wuhan Univ. 2019, 44, 949–956. [Google Scholar] [CrossRef]
  17. He, K.; Li, B.; Zhao, C.Y.; Gao, Y.; Chen, L.Q.; Liu., P.F. Identification of large-scale landslide hazards based on differences of geological structure prone to sliding and multiple-source data in karstmountainous areas. Carsologica Sin. 2020, 39, 467–477. [Google Scholar] [CrossRef]
  18. Ding, A.Z.; Zhang, Q.Y.; Zhou, X.M.; Dai, B.C. Automatic recognition of landslide based on CNN and texture change detection. In Proceedings of the Youth Academic Annual Conference of Chinese Association of Automation (YAC), Wuhan, China, 11–13 November 2016; pp. 444–448. [Google Scholar] [CrossRef]
  19. Feng, G.C. InSAR National 40 m Resolution Deformation A Map. 2022. Available online: https://engine.piesat.cn/live-detail?id=610&type=1 (accessed on 12 December 2022).
  20. Zhu, Y.F.; Yao, X.; Yao, L.H.; Yao, C.C. Detection and characterization of active landslides with multisource SAR data and remote sensing in western Guizhou, China. Nat. Hazards 2022, 111, 973–994. [Google Scholar] [CrossRef]
  21. Ju, Y.Z.; Xu, Q.; Jin, S.C.; Li, W.L.; Dong, X.J.; Guo, Q.H. Automatic Object Detection of Loess Landslide Based on Deep Learning. Geomat. Inf. Sci. Wuhan Univ. 2020, 45, 1747–1755. [Google Scholar] [CrossRef]
  22. Qi, W.W.; Wei, M.F.; Yang, W.T.; Xu, C.; Ma, C. Automatic mapping of landslides by the ResU-net. Remote Sens. 2020, 12, 2487. [Google Scholar] [CrossRef]
  23. Sameen, M.I.; Pradhan, B.; Lee, S. Application of convolutional neural networks featuring Bayesian optimization for landslide susceptibility assessment. Catena 2020, 186, 104249. [Google Scholar] [CrossRef]
  24. Wang, Y.; Fang, Z.; Hong, H.Y. Comparison of convolutional neural networks for landslide susceptibility mapping in Yanshan County, China. Sci. Total. Environ. 2019, 666, 975–993. [Google Scholar] [CrossRef]
  25. Yang, X.; Liu, R.; Yang, M.; Chen, J.; Liu, T.; Yang, Y.; Chen, W.; Wang, Y. Incorporating landslide spatial information and correlated features among conditioning factors for landslide susceptibility mapping. Remote Sens. 2021, 13, 2166. [Google Scholar] [CrossRef]
  26. Huang, W.B.; Ding, M.T.; Wang, D.; Jiang, L.W.; Li, Z.H. Evaluation of Landslide Susceptibility Based on Layer Adaptive Weighted Convolutional Neural Network Model along Sichuan-Tibet Traffic Corridor. Earth Sci. 2022, 47, 2015–2030. [Google Scholar] [CrossRef]
  27. Nikoobakht, S.; Azarafza, M.; Akgün, H.; Derakhshani, R. Landslide Susceptibility Assessment by Using Convolutional Neural Network. Appl. Sci. 2022, 12, 5992. [Google Scholar] [CrossRef]
  28. Song, F.B. Research on Convolutional Neural Network Modeling and Its Application; North China Electric Power University: Beijing, China, 2021. [Google Scholar] [CrossRef]
  29. Yongping County People’s Government Office. Yongping Overview. 2022. Available online: http://www.ypx.gov.cn/ypxrmzf/c102483/zjyp.shtml (accessed on 12 December 2022).
  30. Baidu Encyclopedia. Yongping County. 2022. Available online: https://baike.baidu.com/item/%E6%B0%B8%E5%B9%B3%E5%8E%BF/3556662?fr=aladdin (accessed on 12 December 2022).
  31. Pourghasemi, H.R.; Yansari, Z.T.; Panagos, P.; Pradhan, B. Analysis and evaluation of landslide susceptibility: A review on articles published during 2005–2016 (periods of 2005–2012 and 2013–2016). Arab. J. Geosci. 2018, 11, 193. [Google Scholar] [CrossRef]
  32. Wang, S.B.; Zhuang, J.Q.; Zheng, J.; Mou, J.Q.; Wang, Y.; Fu, Y.T. Landslide susceptibility evaluation based on deep learning along kangding-litang section of cz railway. J. Eng. Geol. 2022, 30, 908–919. [Google Scholar] [CrossRef]
  33. Li, W.B.; Fan, X.M.; Huang, F.M.; Chen, W.; Hong, H.Y.; Huang, J.S.; Guo, Z.Z. Uncertainties analysis of collapse susceptibility prediction based on remote sensing and GIS: Influences of different data-based models and connections between collapses and environmental factors. Remote. Sens. 2020, 12, 4134. [Google Scholar] [CrossRef]
  34. Sahin, E.K.; Colkesen, I.; Acmali, S.S.; Akgun, A.; Aydinoglu, A.C. Developing comprehensive geocomputation tools for landslide susceptibility mapping: LSM tool pack. Comput. Geosci. 2020, 144, 104592. [Google Scholar] [CrossRef]
  35. Zhang, X.; Yin, W.P.; Xie, F.; Fan, H.; Chen, F. Habitat suitability evaluation of Asian elephants in the Yuanjiang-Lixianjiang River Basin based on meta-analysis and remote sensing big data. Acta Ecol. Sin. 2022, 42, 5067–5078. [Google Scholar] [CrossRef]
  36. Zhang, T.Y.; Li, Y.N.; Wang, T.; Wang, H.Y.; Chen, T.Q.; Sun, Z.H.; Luo, D.; Li, C.; Han, L. Evaluation of different machine learning models and novel deep learning-based algorithm for landslide susceptibility mapping. Geosci. Lett. 2022, 9, 26. [Google Scholar] [CrossRef]
  37. Shorten, C.; Khoshgoftaar, T.M. A survey on image data augmentation for deep learning. J. Big Data 2019, 6, 60. [Google Scholar] [CrossRef]
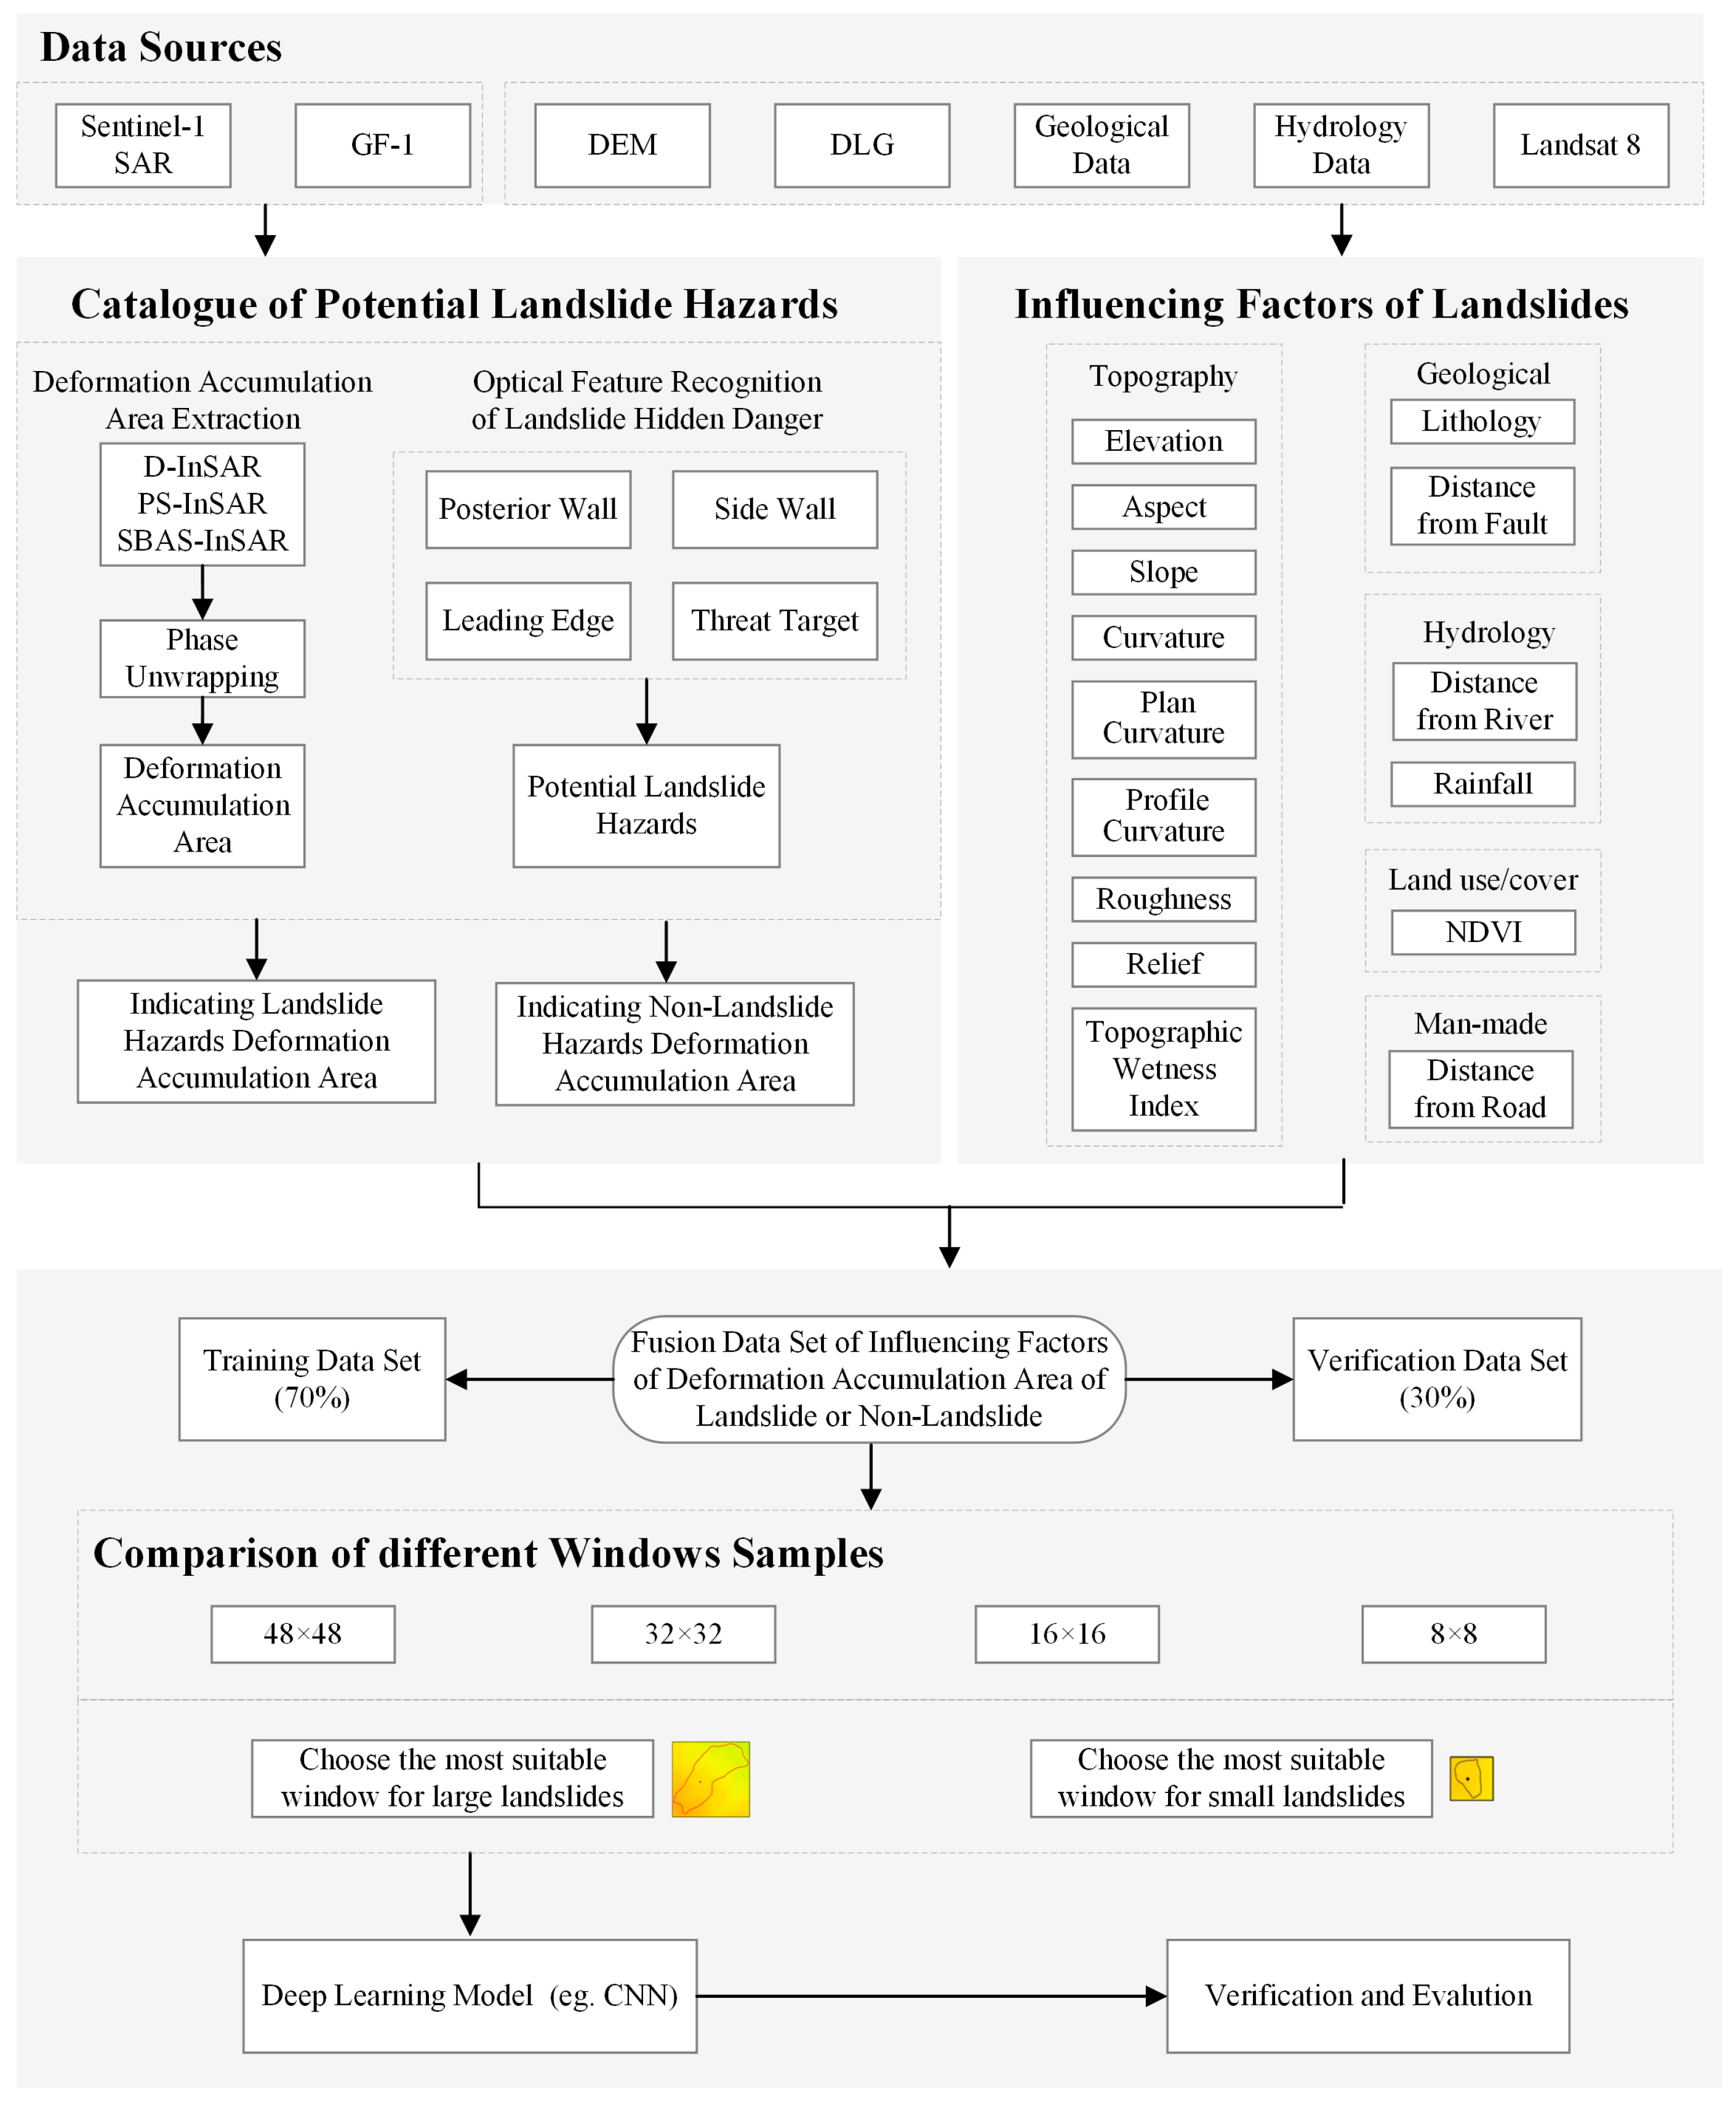
Figure 1. Flow chart.
Land 12 00173 g001
Figure 2. Schematic diagram of the experimental area. (a) Elevation range and (b) landslide prone areas.
Land 12 00173 g002
Figure 3. Landslide formation factors: (a) lithology, (b) distance from fault, (c) rainfall, (d) NDVI, (e) distance from road, (f) distance from river, (g) elevation, (h) aspect, (i) slope, (j) curvature, (k) plane curvature, (l) profile curvature, (m) surface roughness, (n) terrain relief, (o) Topographic Wetness Index.
Land 12 00173 g003aLand 12 00173 g003b
Figure 4. InSAR deformation processing results. (a) Ascending deformation rate results, (b) Descending deformation rate results.
Land 12 00173 g004
Figure 5. InSAR deformation rate map and 16 × 16 sample selection. (a) Ascending deformation rate with deformation samples, (b) Descending deformation rate with deformation samples.
Land 12 00173 g005
Figure 6. ROC for models with different window sizes; 48 × 48 windows (a), 32 × 32 windows (b), 16 × 16 windows (c), 8 × 8 windows (d), the optimal 16 × 16 windows only for large landslide body recognition (e) and the optimal 8 × 8 windows only for small landslide body recognition (f), respectively.
Land 12 00173 g006
Table 1. Factors and their sources.
FactorSourceFactorSource
Lithologyhttps://geocloud.cgs.gov.cn/
(accessed on 1 December 2022)
Aspect30 m SRTM DEM
Distance from faultshttps://geocloud.cgs.gov.cn/
(accessed on 1 December 2022)
Slope
Rainfallhttps://gpm.nasa.gov/
(accessed on 1 December 2022)
Curvature
NDVILandsat OLI 30 mPlane curvature
Distance from roadhttps://www.webmap.cn
(accessed on 1 December 2022)
Profile curvature
Distance from riverhttps://www.webmap.cn
(accessed on 1 December 2022)
Roughness
DEMhttps://dwtkns.com/srtm30m/
(accessed on 1 December 2022)
Relief
TWI
Table 2. Statistics of InSAR surface deformation anomaly information in Yongping County (ascending).
NO.Threshold Range (mm/a)Area (km2)Percentage (%)Characteristics Reflect
1<−317.140.26subsidence
2−31~−2024.420.88subsidence
3−20~−1371.982.58subsidence
4−13~−8192.526.9subsidence
5−8~−4421.0415.09subsidence
6−4~−1501.0117.96subsidence
7−1~4894.432.06subsidence/uplift
84~8399.1414.31uplift
98~15226.958.14uplift
10>1550.831.82uplift
Table 3. Skewness and kurtosis of ascending results.
IndicatorValue of the Ascending ResultValue of the Descending Result
Skewness1.2041.246
Skewness standard error0.6870.687
Kurtosis1.3561.212
Kurtosis standard error1.3341.334
Table 4. Statistics of InSAR surface deformation anomaly information in Yongping County (descending).
NO.Threshold Range (mm/a)Area (km2)Percentage (%)Characteristics Reflect
1<−305.910.21subsidence
2−30~−1836.421.31subsidence
3−18~−11116.644.18subsidence
4−11~−629210.47subsidence
5−6~−2539.1519.33subsidence
6−2~3946.0833.92subsidence/uplift
73~7499.4417.9uplift
87~14283.0410.15uplift
914~2561.522.2uplift
10>259.230.33uplift
Table 5. Correlation Matrix (highly correlated values to be highlighted in bold.).
LayerLithologyDistance
from Faults
RainfallNDVIDistance from RoadDistance
from River
DEMAspectSlopeCurvaturePlane
Curvature
Profile
Curvature
RoughnessReliefTWI
Lithology1
Distance
from faults
−0.161
Rainfall0.36−0.131
NDVI−0.170.04−0.021
Distance
from road
−0.080.06−0.030.191
Distance
from river
0.100.0300.050.091
DEM−0.320.21−0.220.490.170.141
Aspect−0.030.040.0400.020.02−0.011
Slope−0.040.040.070.140.03−0.03−0.020.041
Curvature0000.010.010.030.0500.011
Plane
curvature
−0.01−0.02−0.070.020−0.040.06−0.02−0.4601
Profile
curvature
−0.050.02−0.030.060.01−0.040.04−0.010.11−0.010.121
Roughness−0.020.030.100.110.02−0.04−0.050.040.930.01−0.380.071
Relief−0.040.040.080.130.03−0.03−0.020.040.950.01−0.420.140.931
TWI0.04−0.030.01−0.12−0.06−0.12−0.14−0.01−0.39−0.320.27−0.04−0.31−0.361
Table 6. VIF analysis results.
VariablesVIF
Lithology1.29
Distance
from faults
1.09
Rainfall1.20
NDVI1.42
Distance from road1.05
Distance from river1.07
DEM1.61
Aspect1.01
Slope14.12
Curvature1.15
Plane curvature1.40
Profile curvature1.12
Roughness9.72
Relief14.79
TWI1.45
Table 7. Identification results of landslide hazards in different windows.
Window SizePrecision (%)Recall (%)F-Measure (%)
48 × 4868.9764.5266.67
32 × 3258.8954.9256.84
16 × 1676.5174.3875.43
8 × 874.5370.8972.66
Mixed (16 × 16 and 8 × 8)82.8678.7580.75
Disclaimer/Publisher’s Note: The statements, opinions and data contained in all publications are solely those of the individual author(s) and contributor(s) and not of MDPI and/or the editor(s). MDPI and/or the editor(s) disclaim responsibility for any injury to people or property resulting from any ideas, methods, instructions or products referred to in the content.