
The Long-Term Hydraulic Efficiency of Green Infrastructure under Sea Level: Performance of Raingardens, Swales and Permeable Pavement in New Orleans

Abstract
1. Introduction
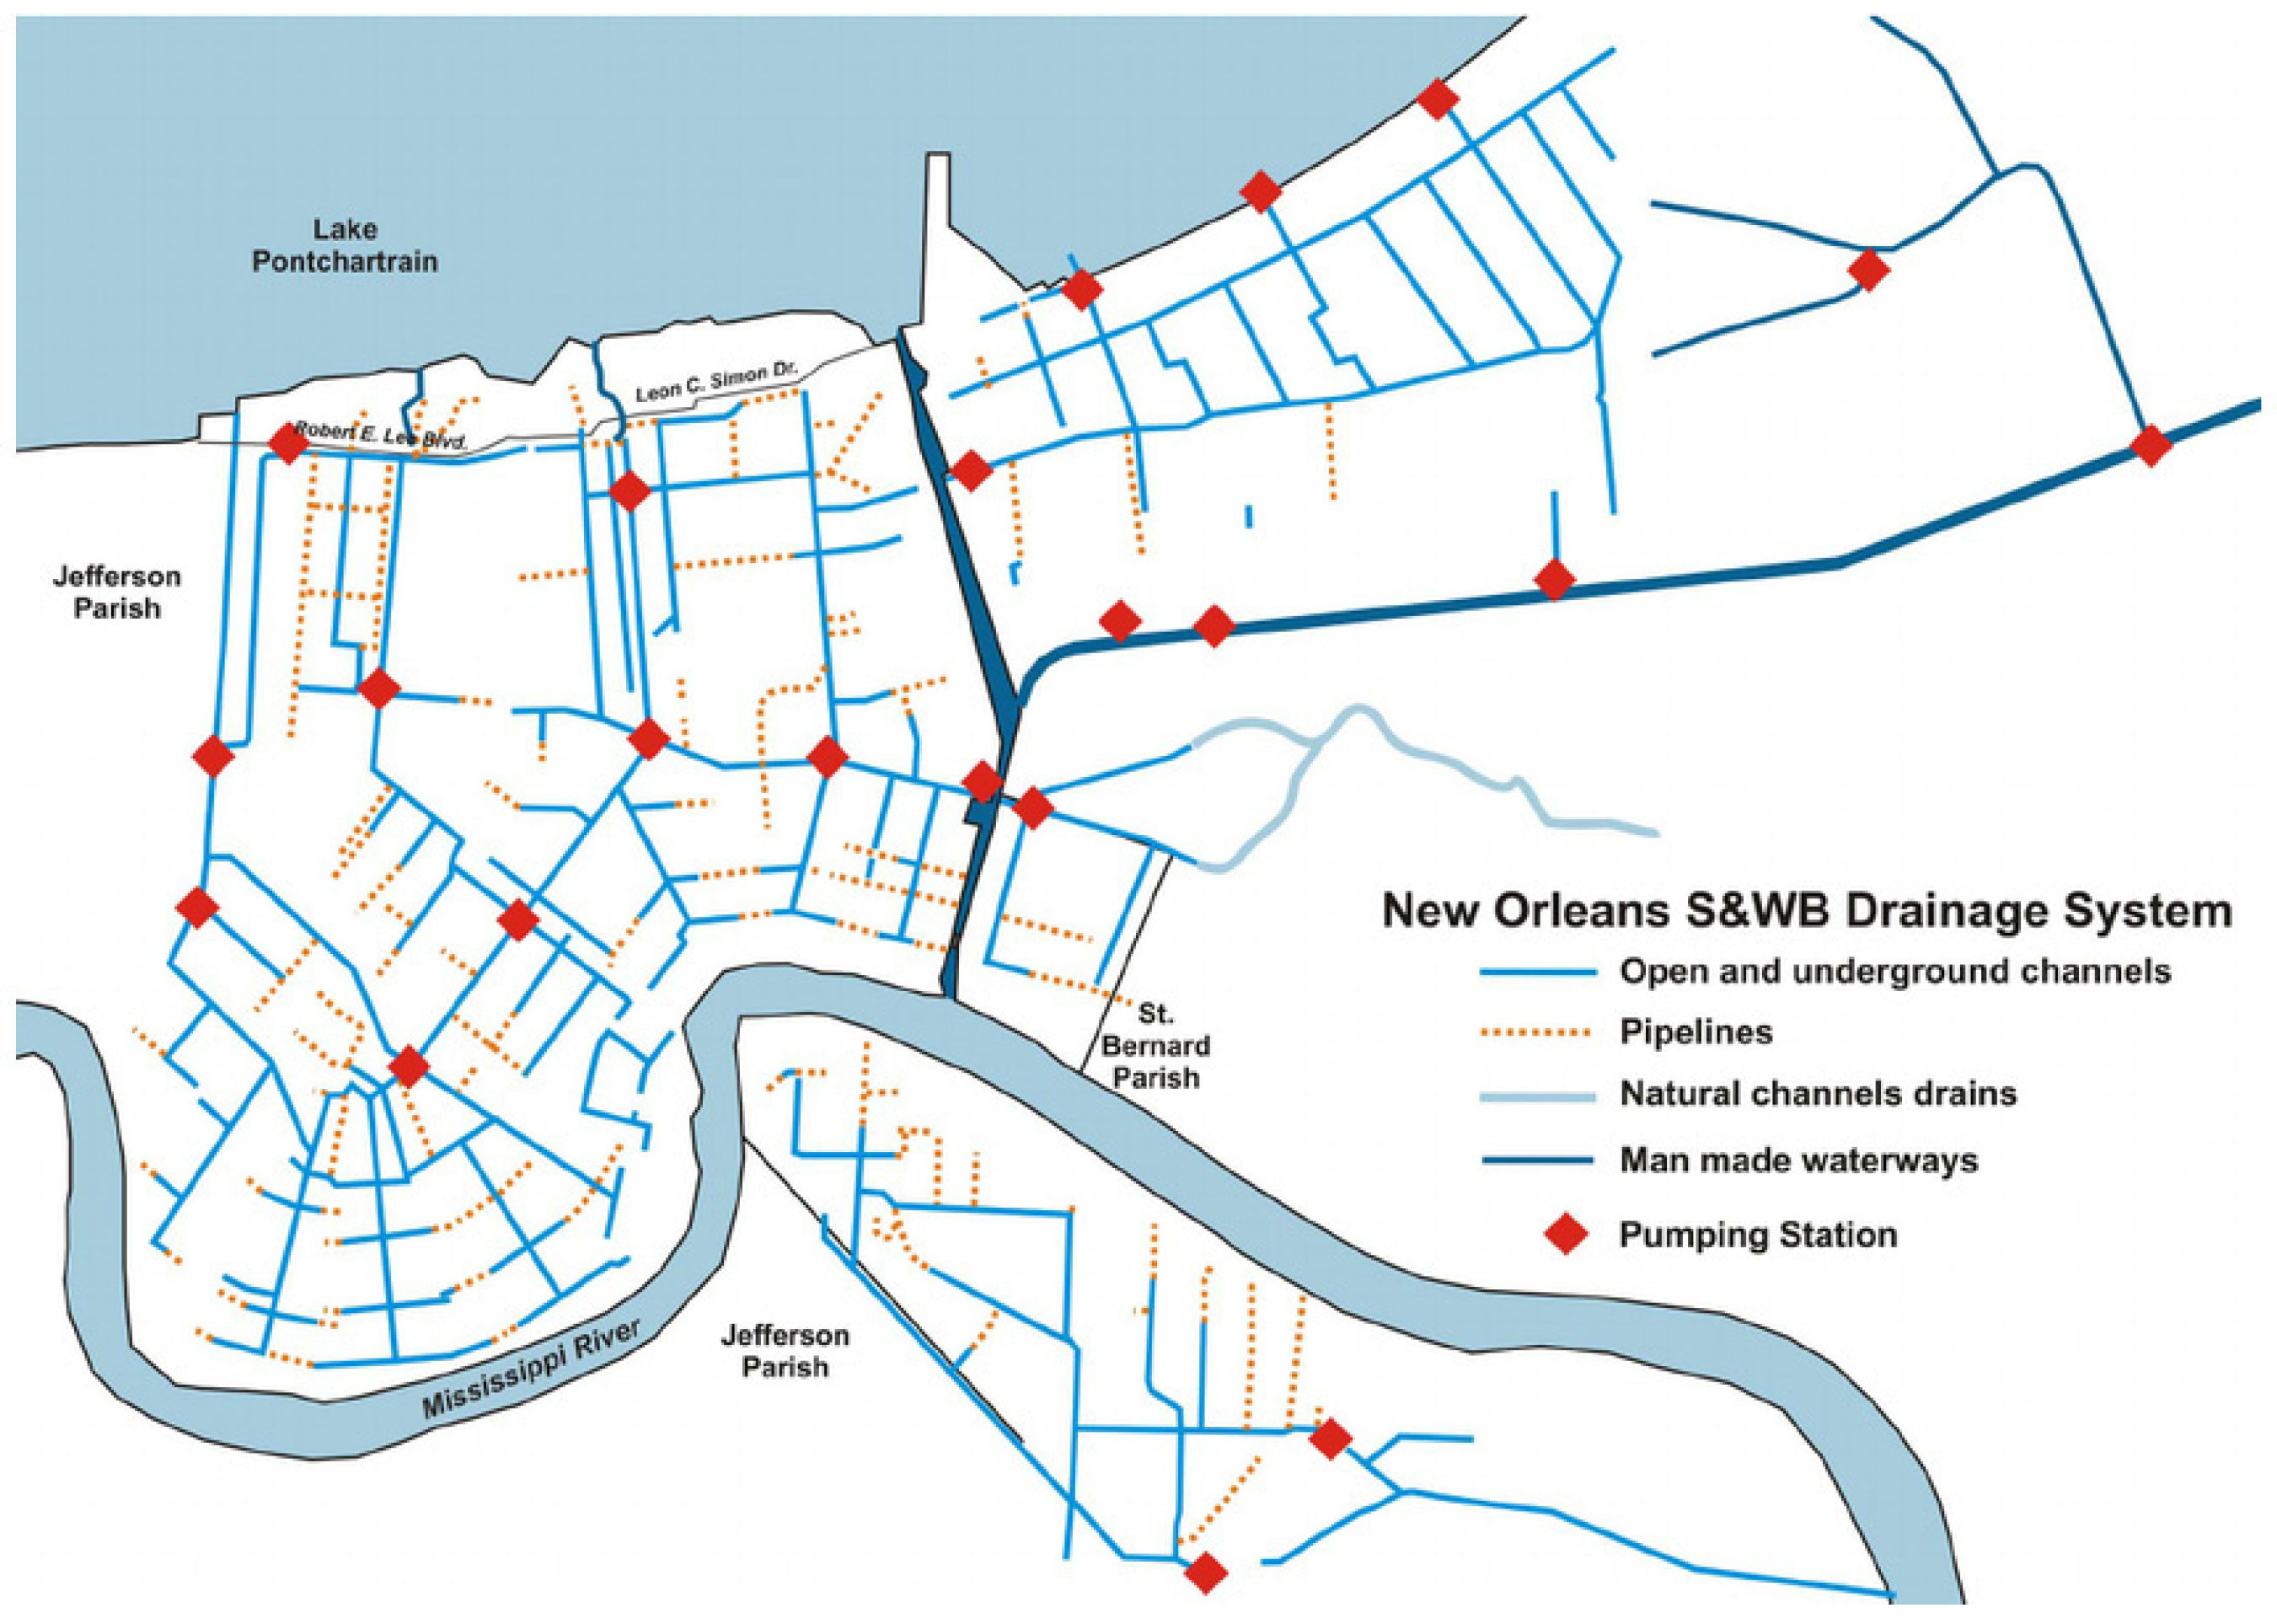
1.1. New Orleans
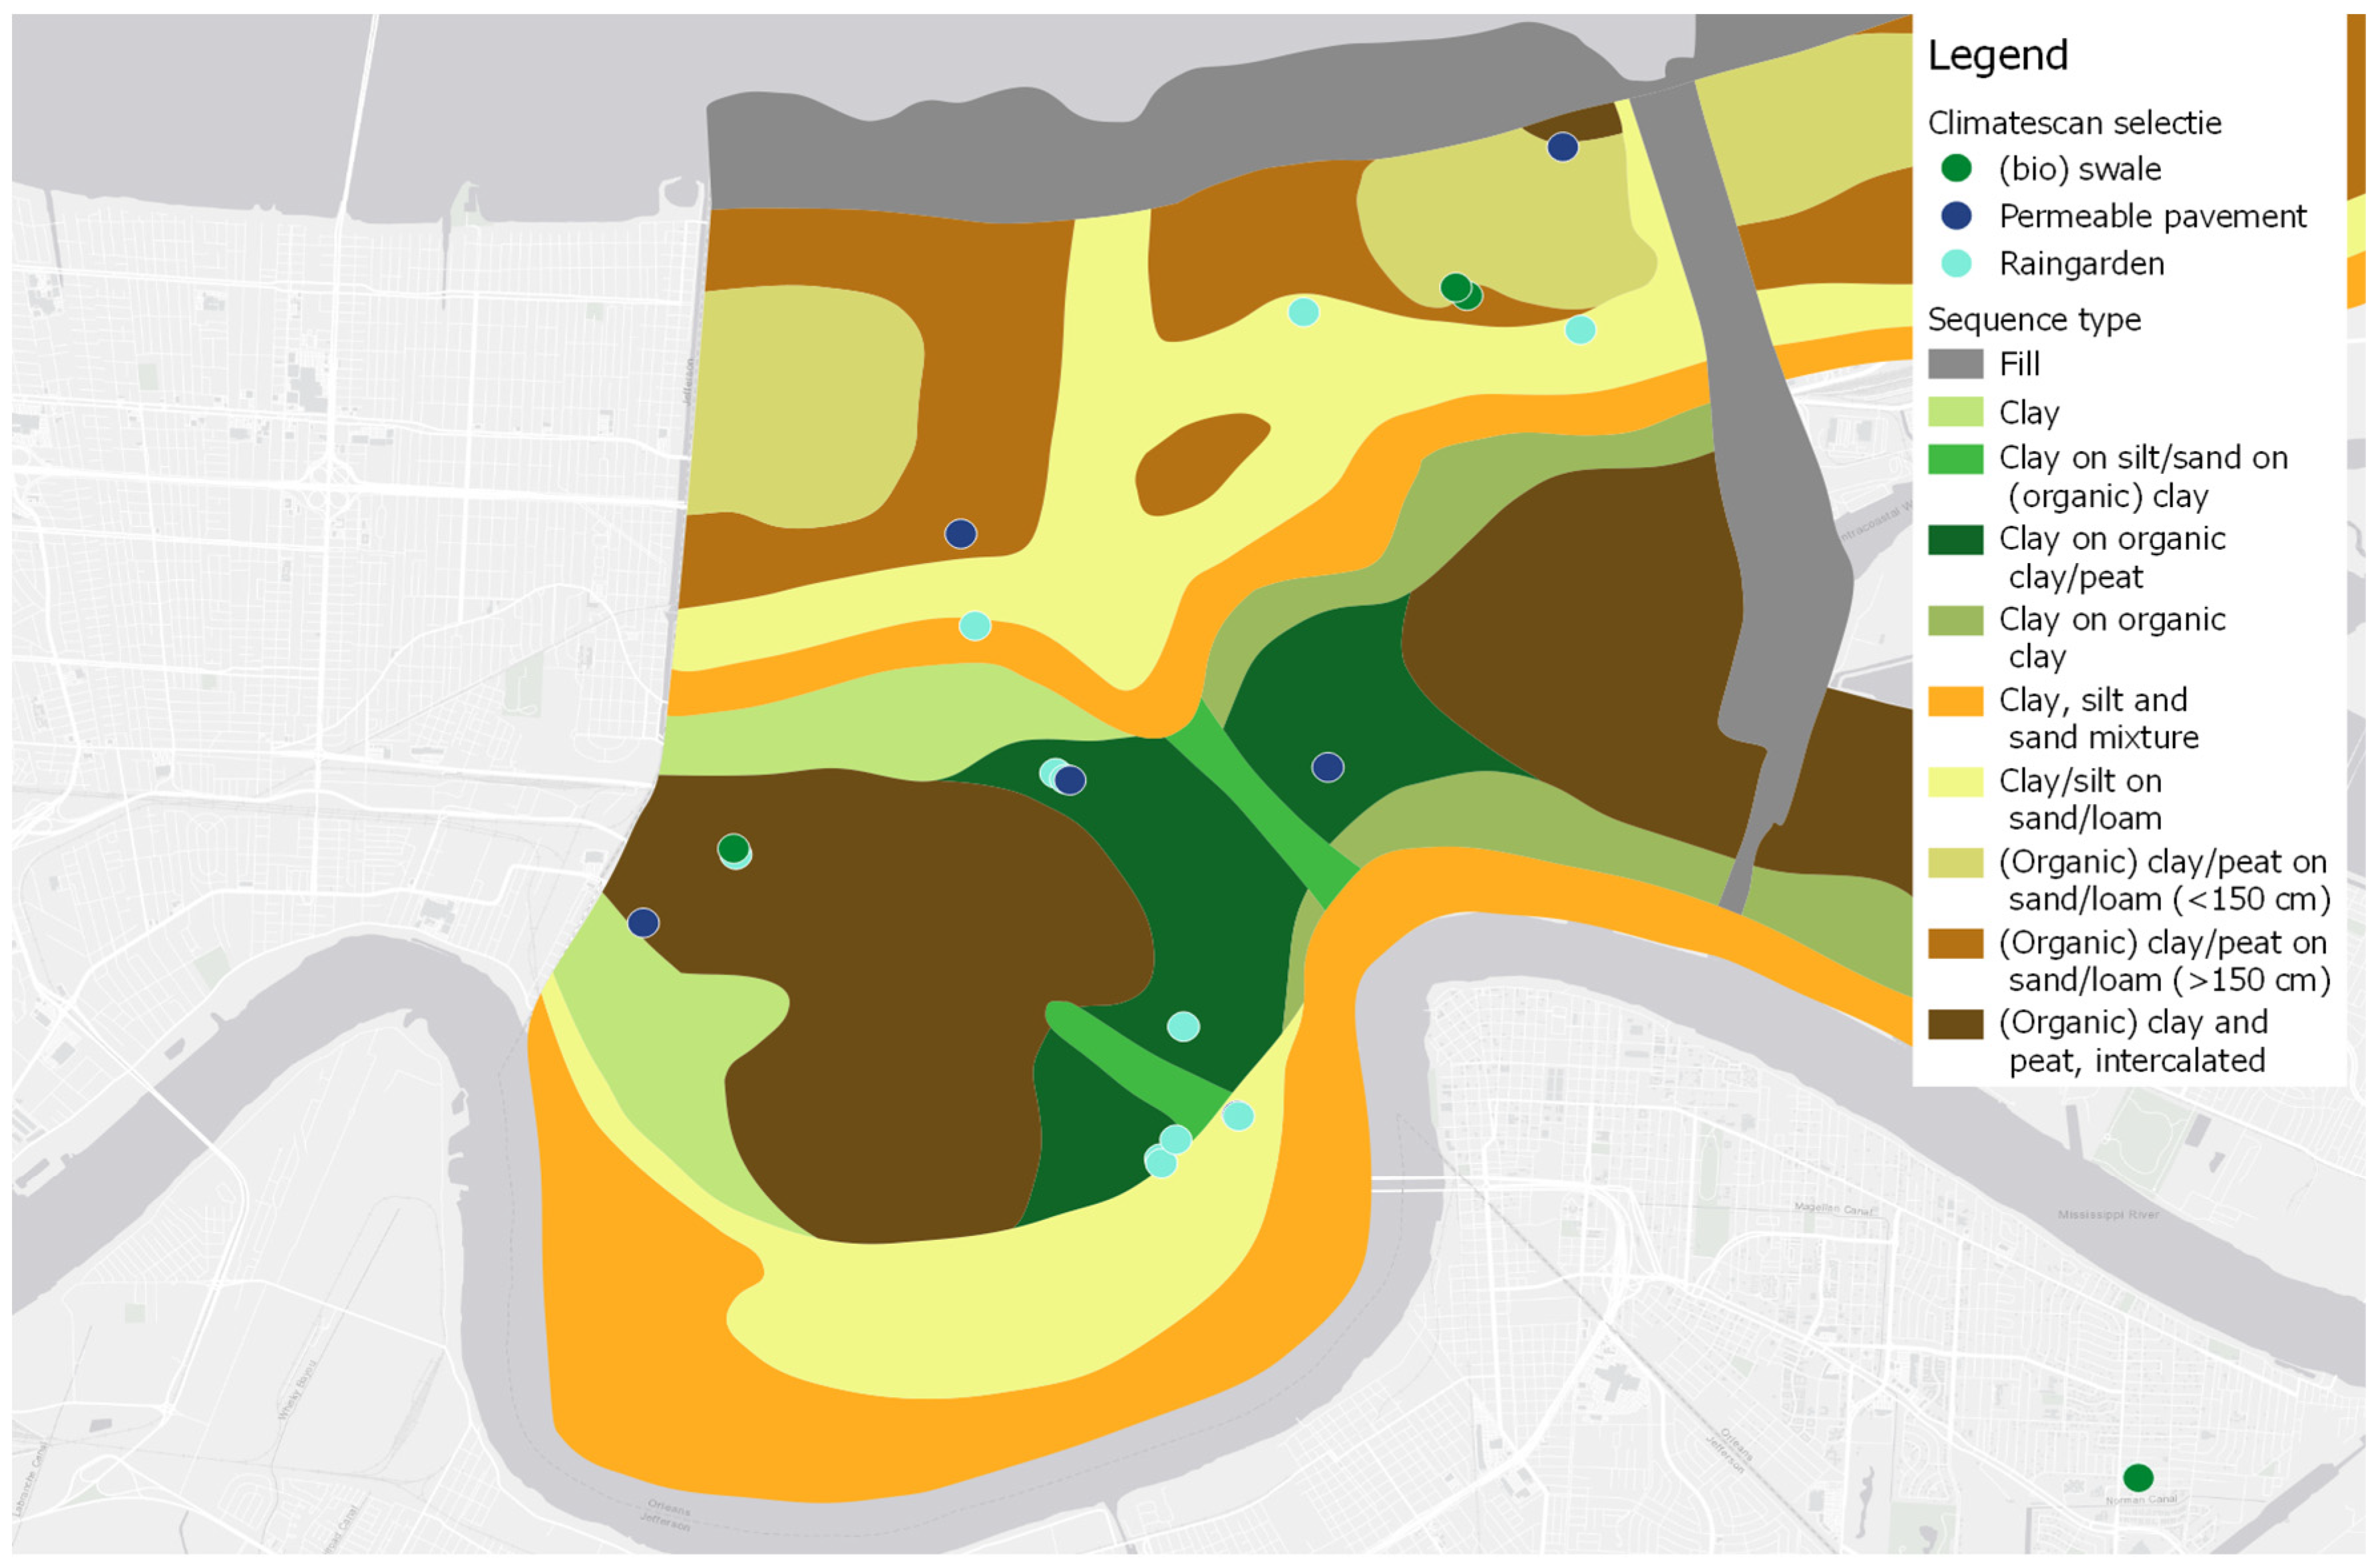
1.2. Soil, Geology and Groundwater Situation
2. Materials and Methods
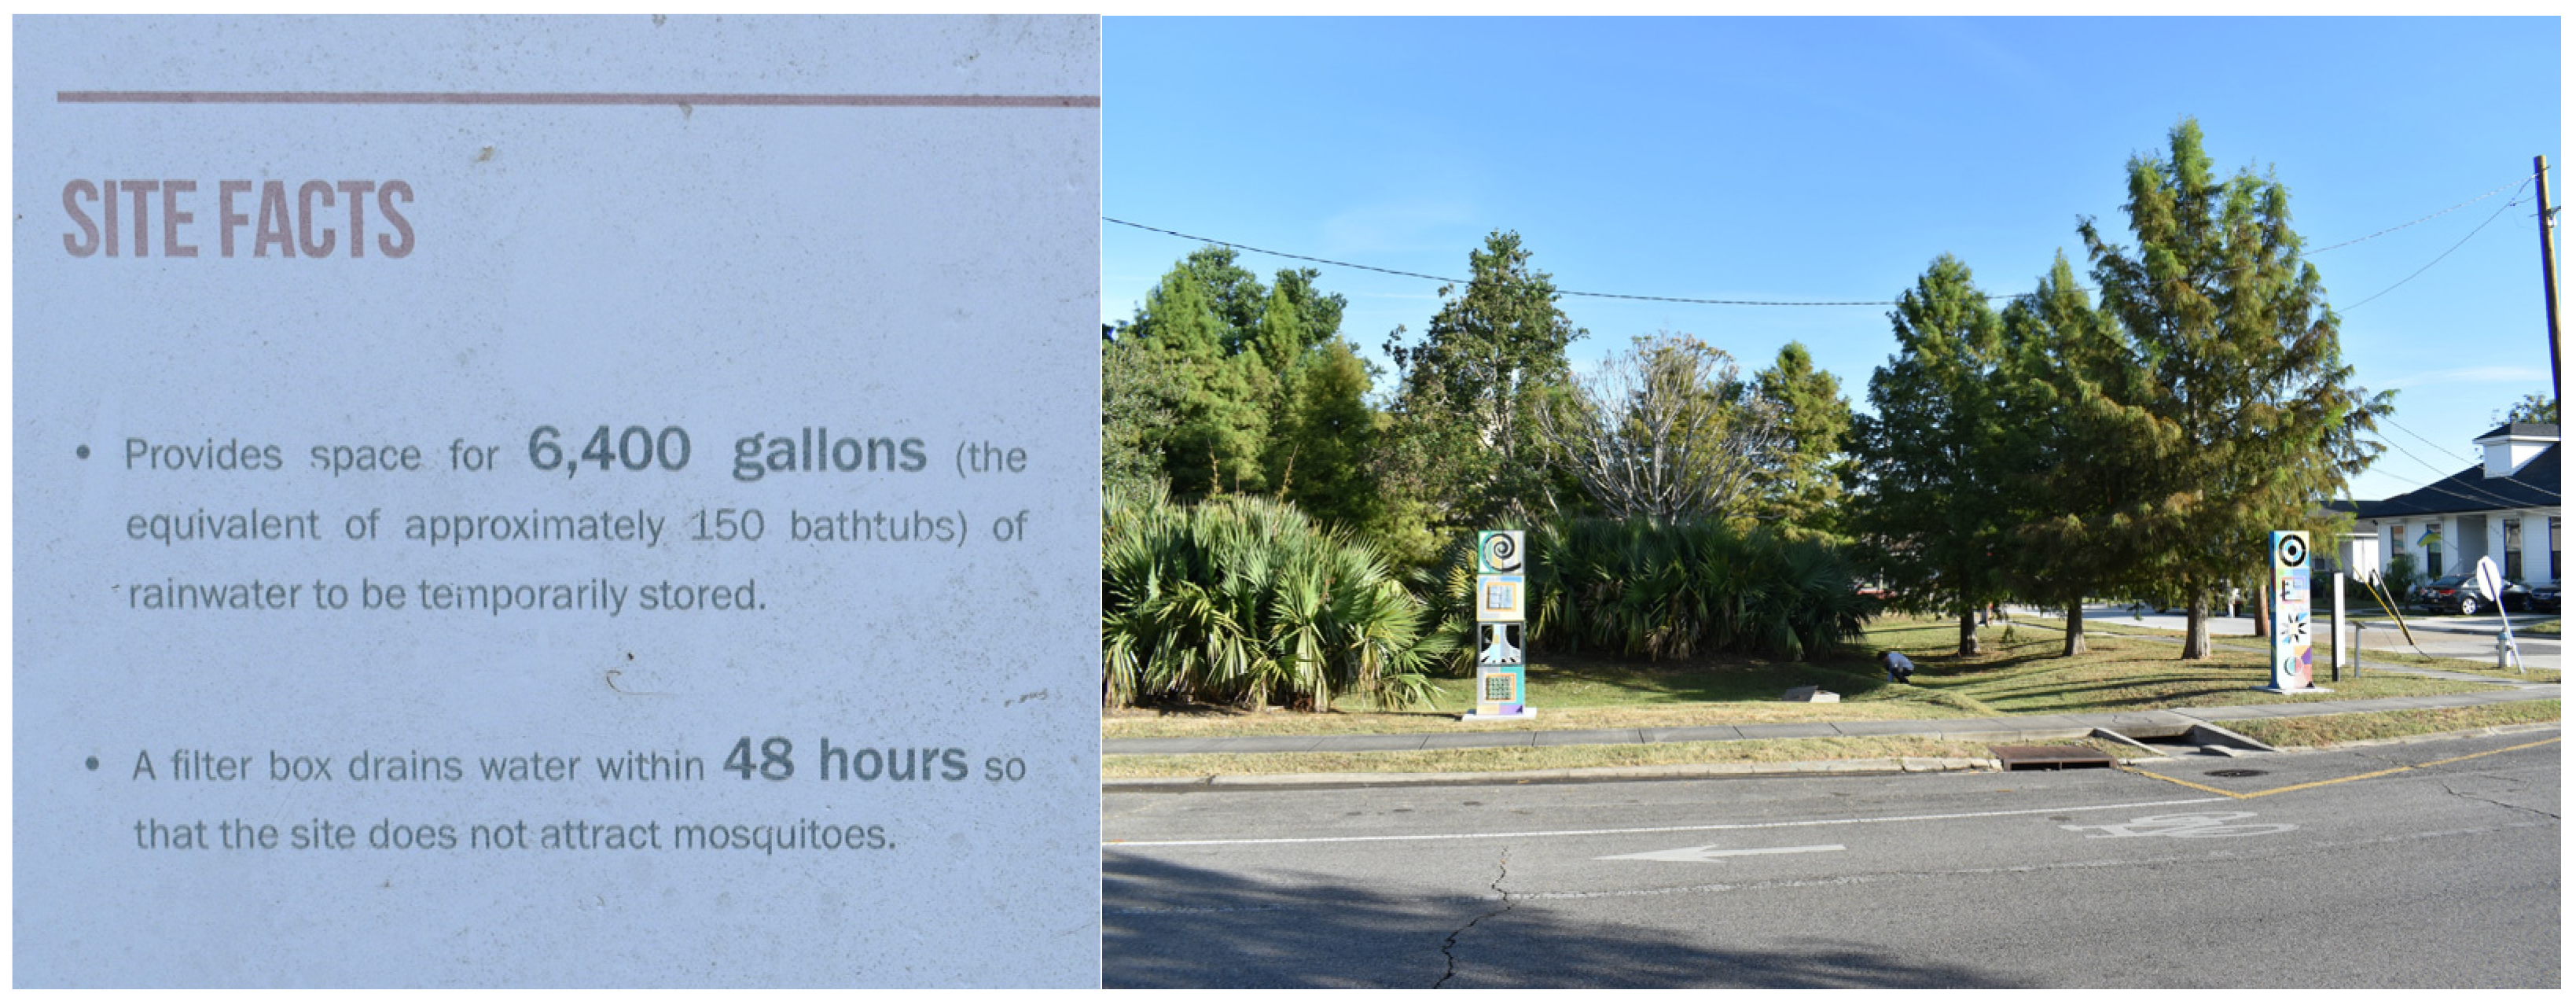
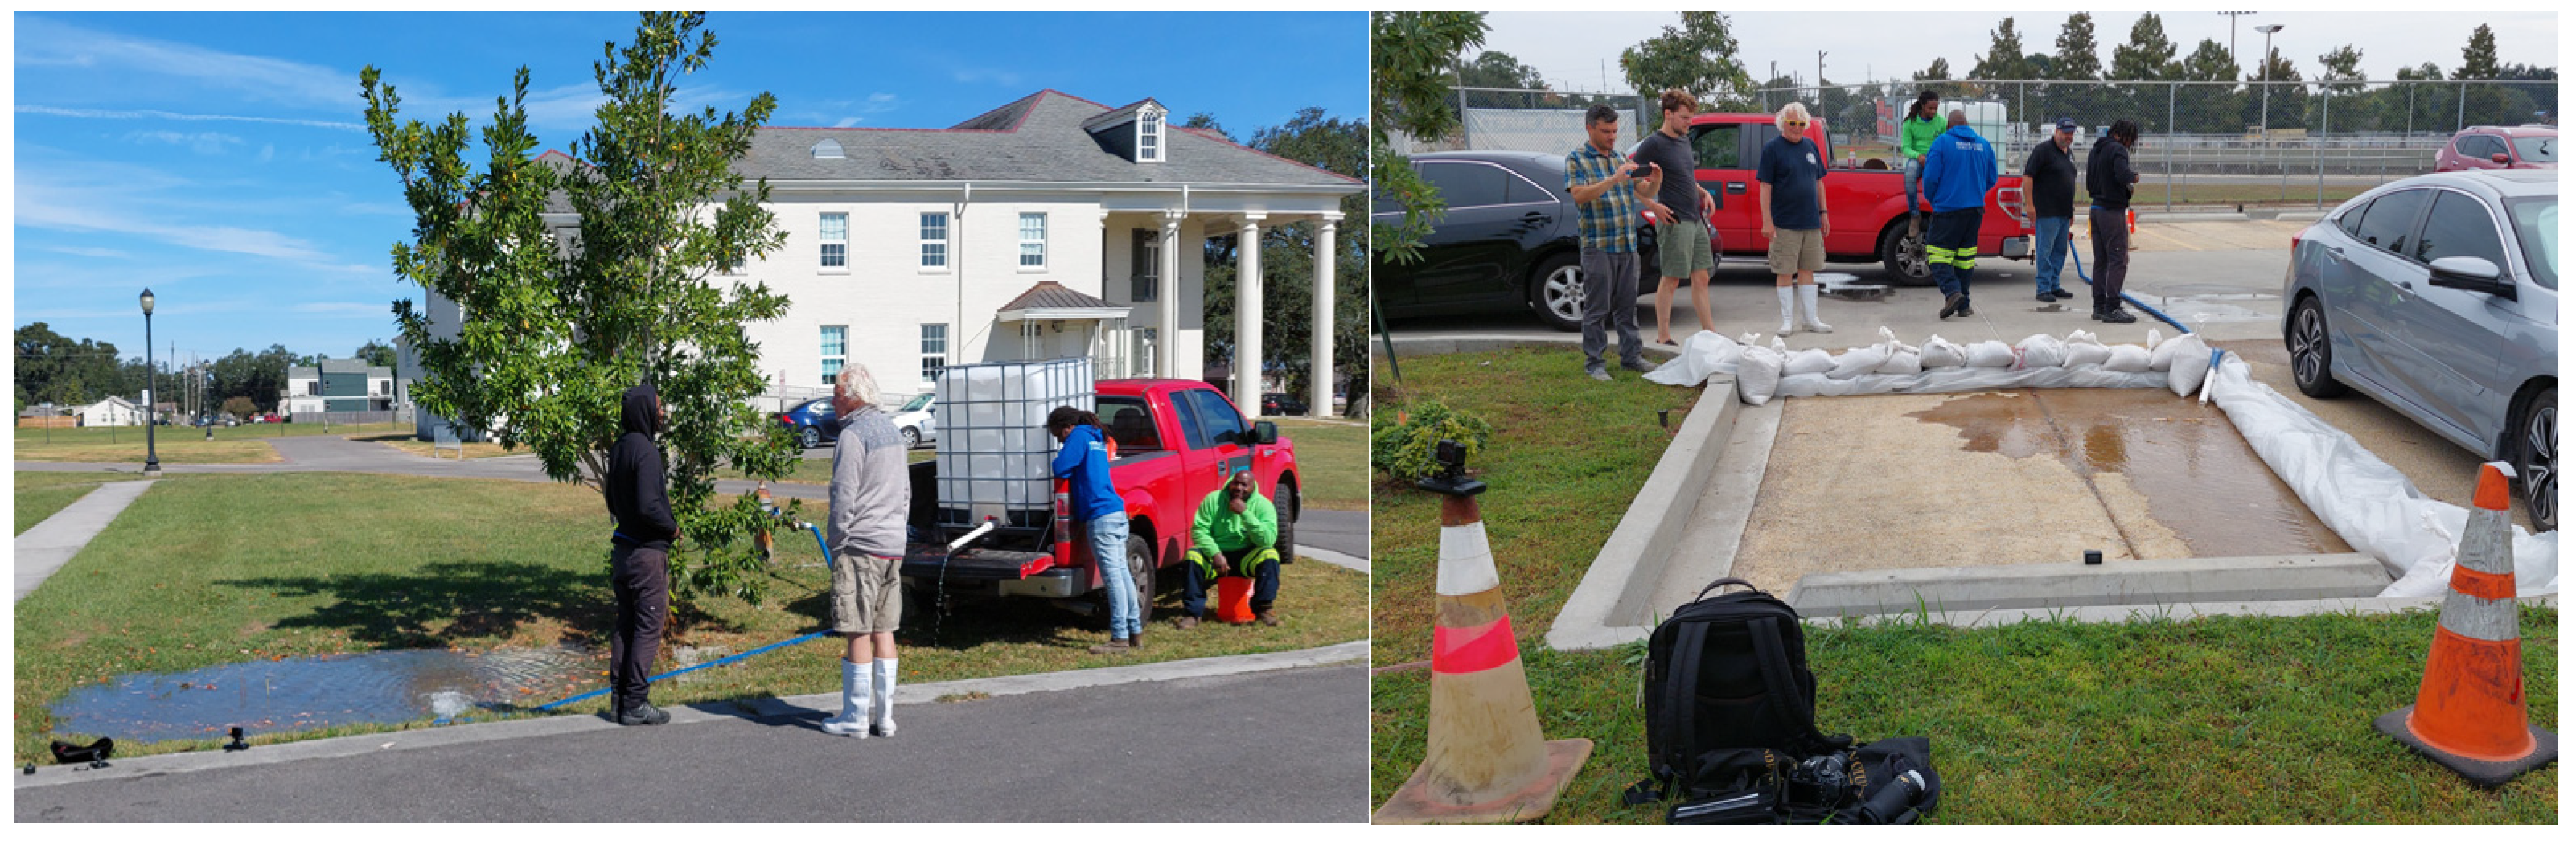
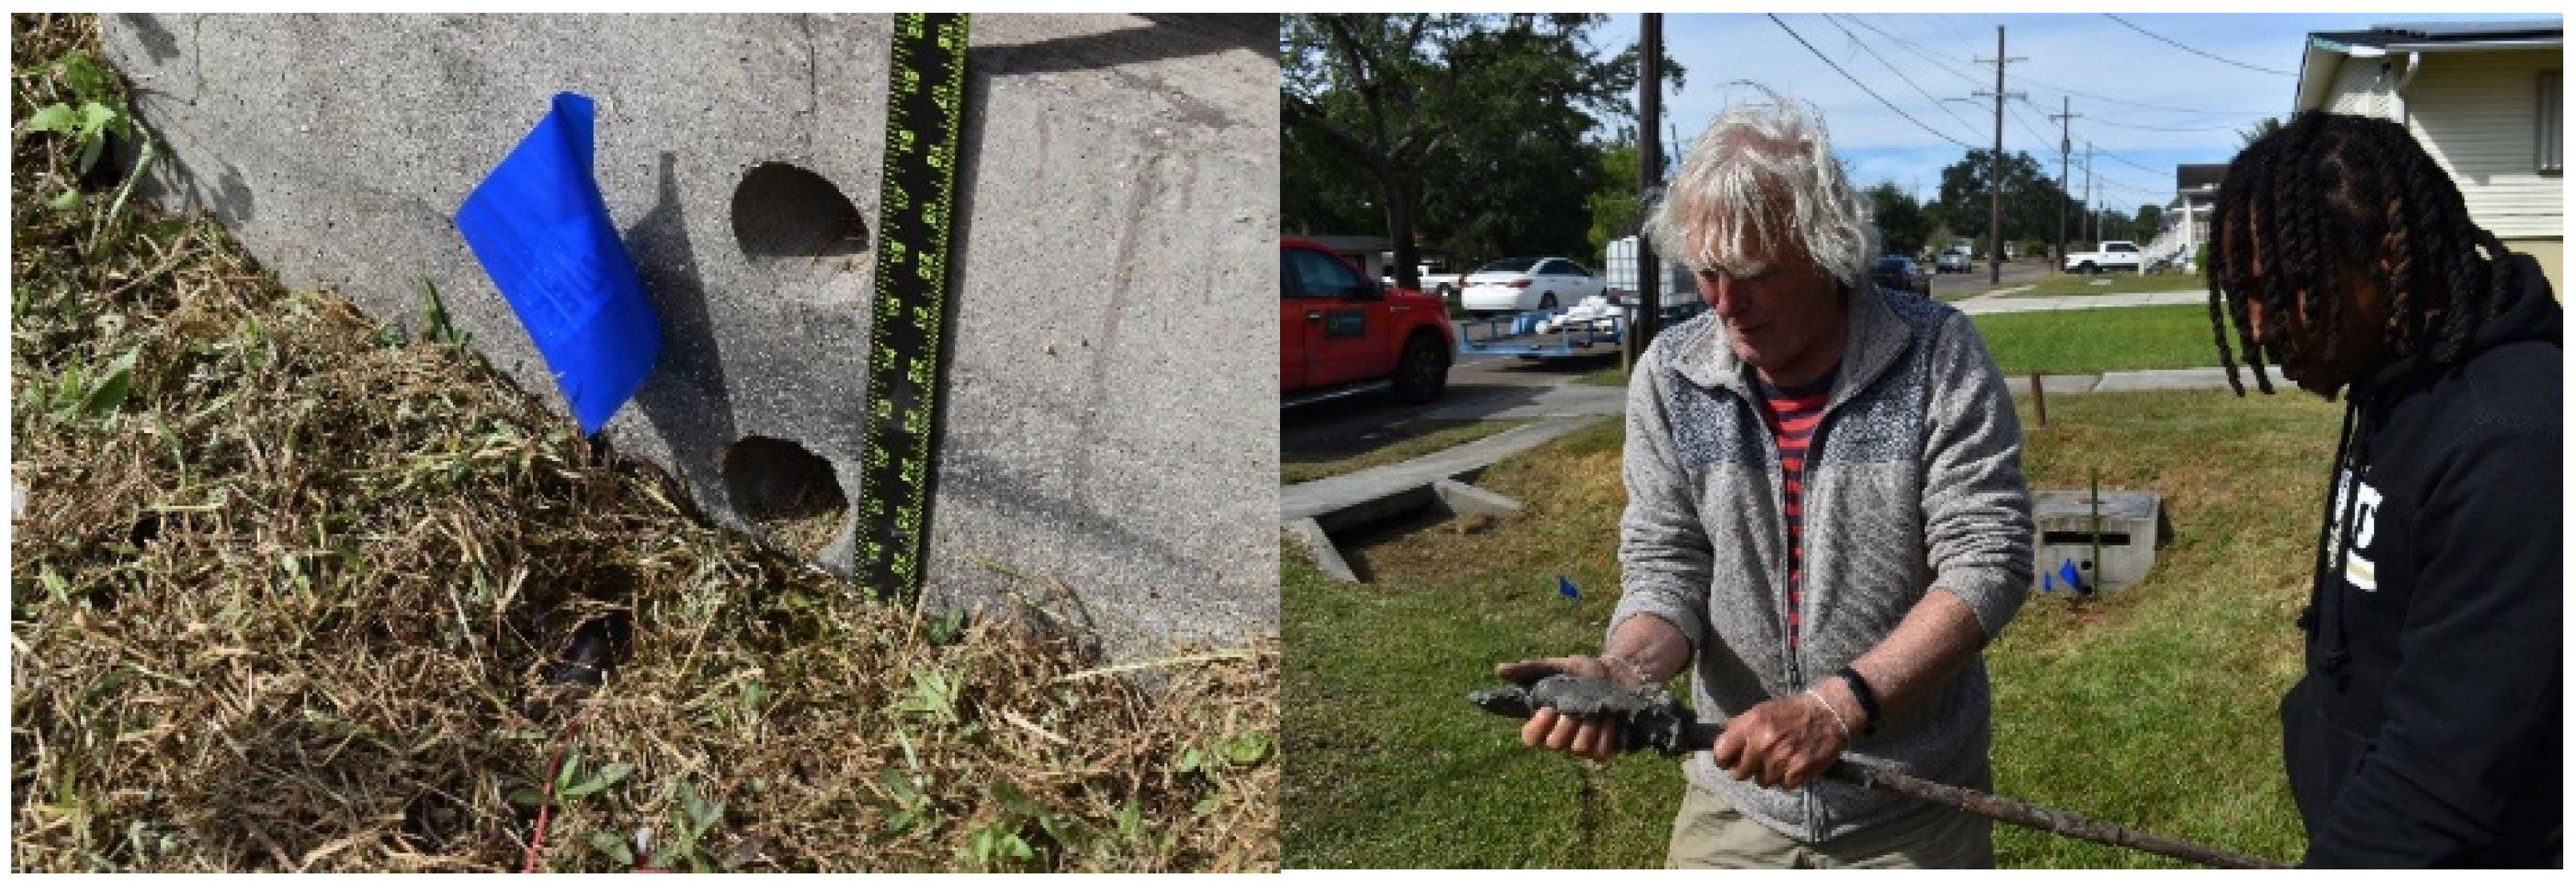
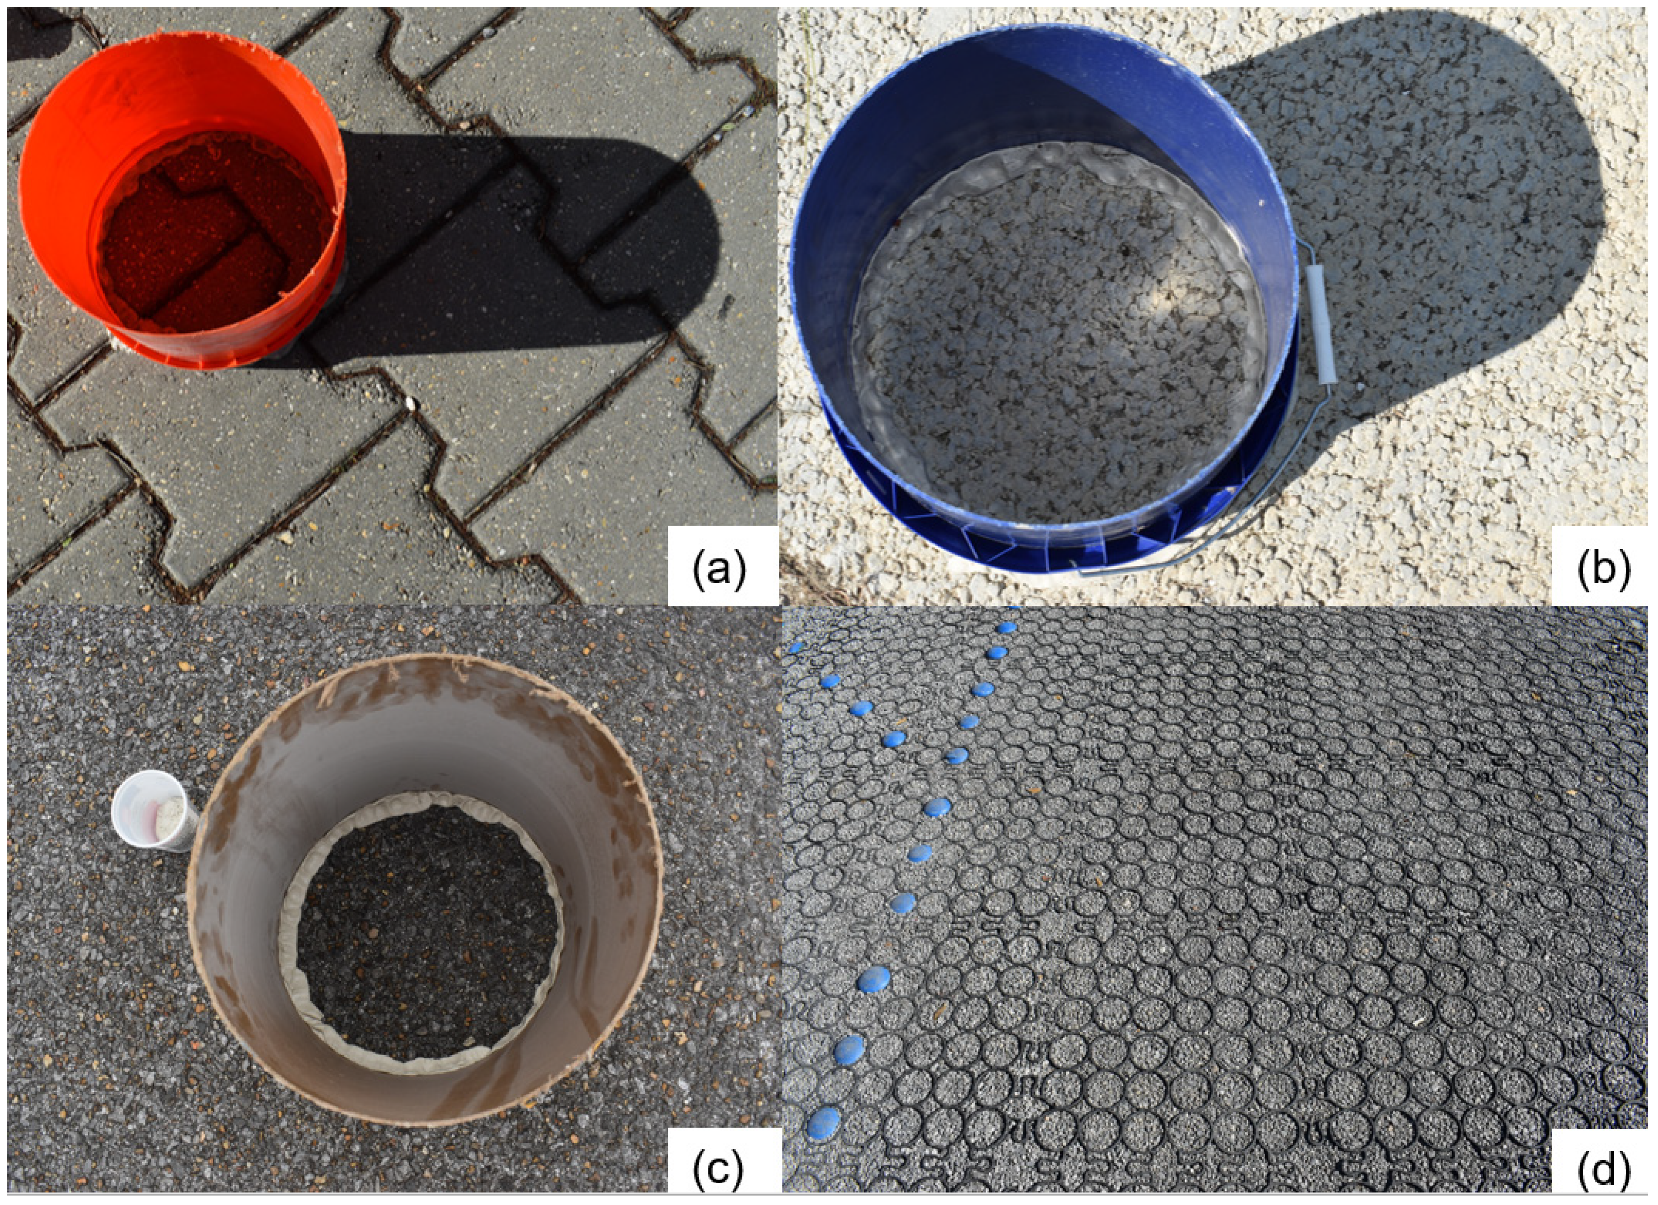
Full-Scale Method
3. Results
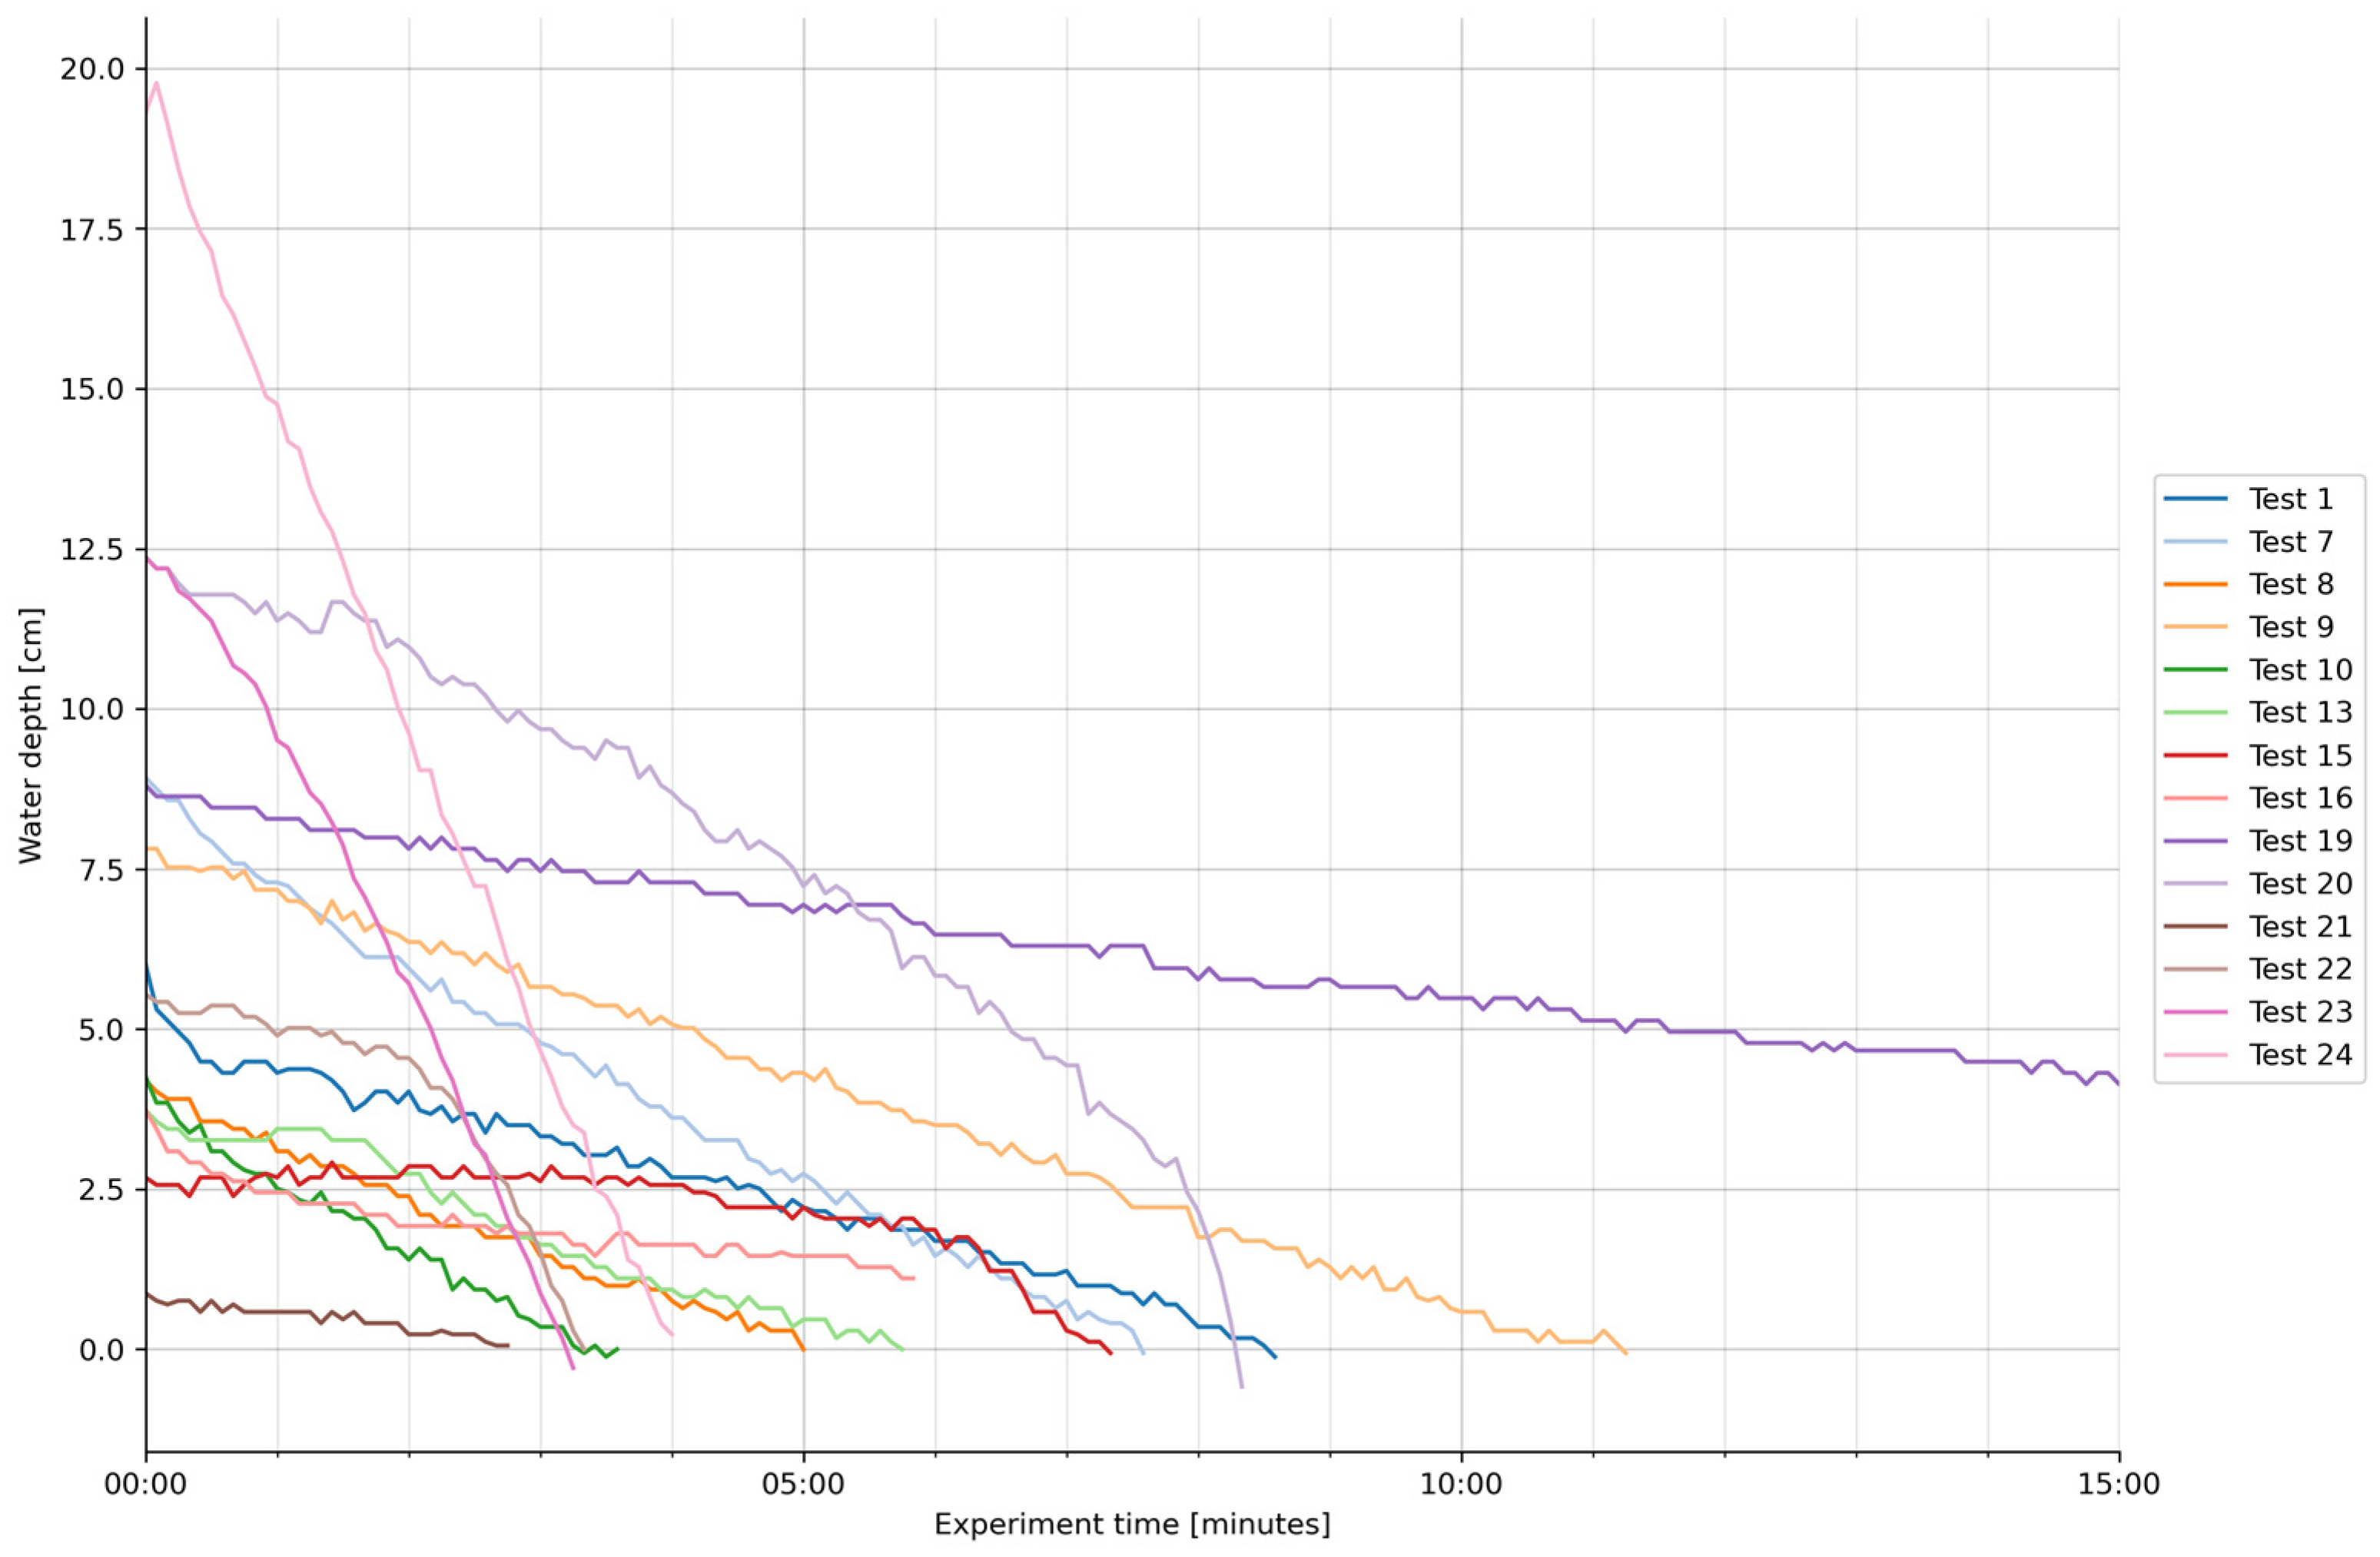
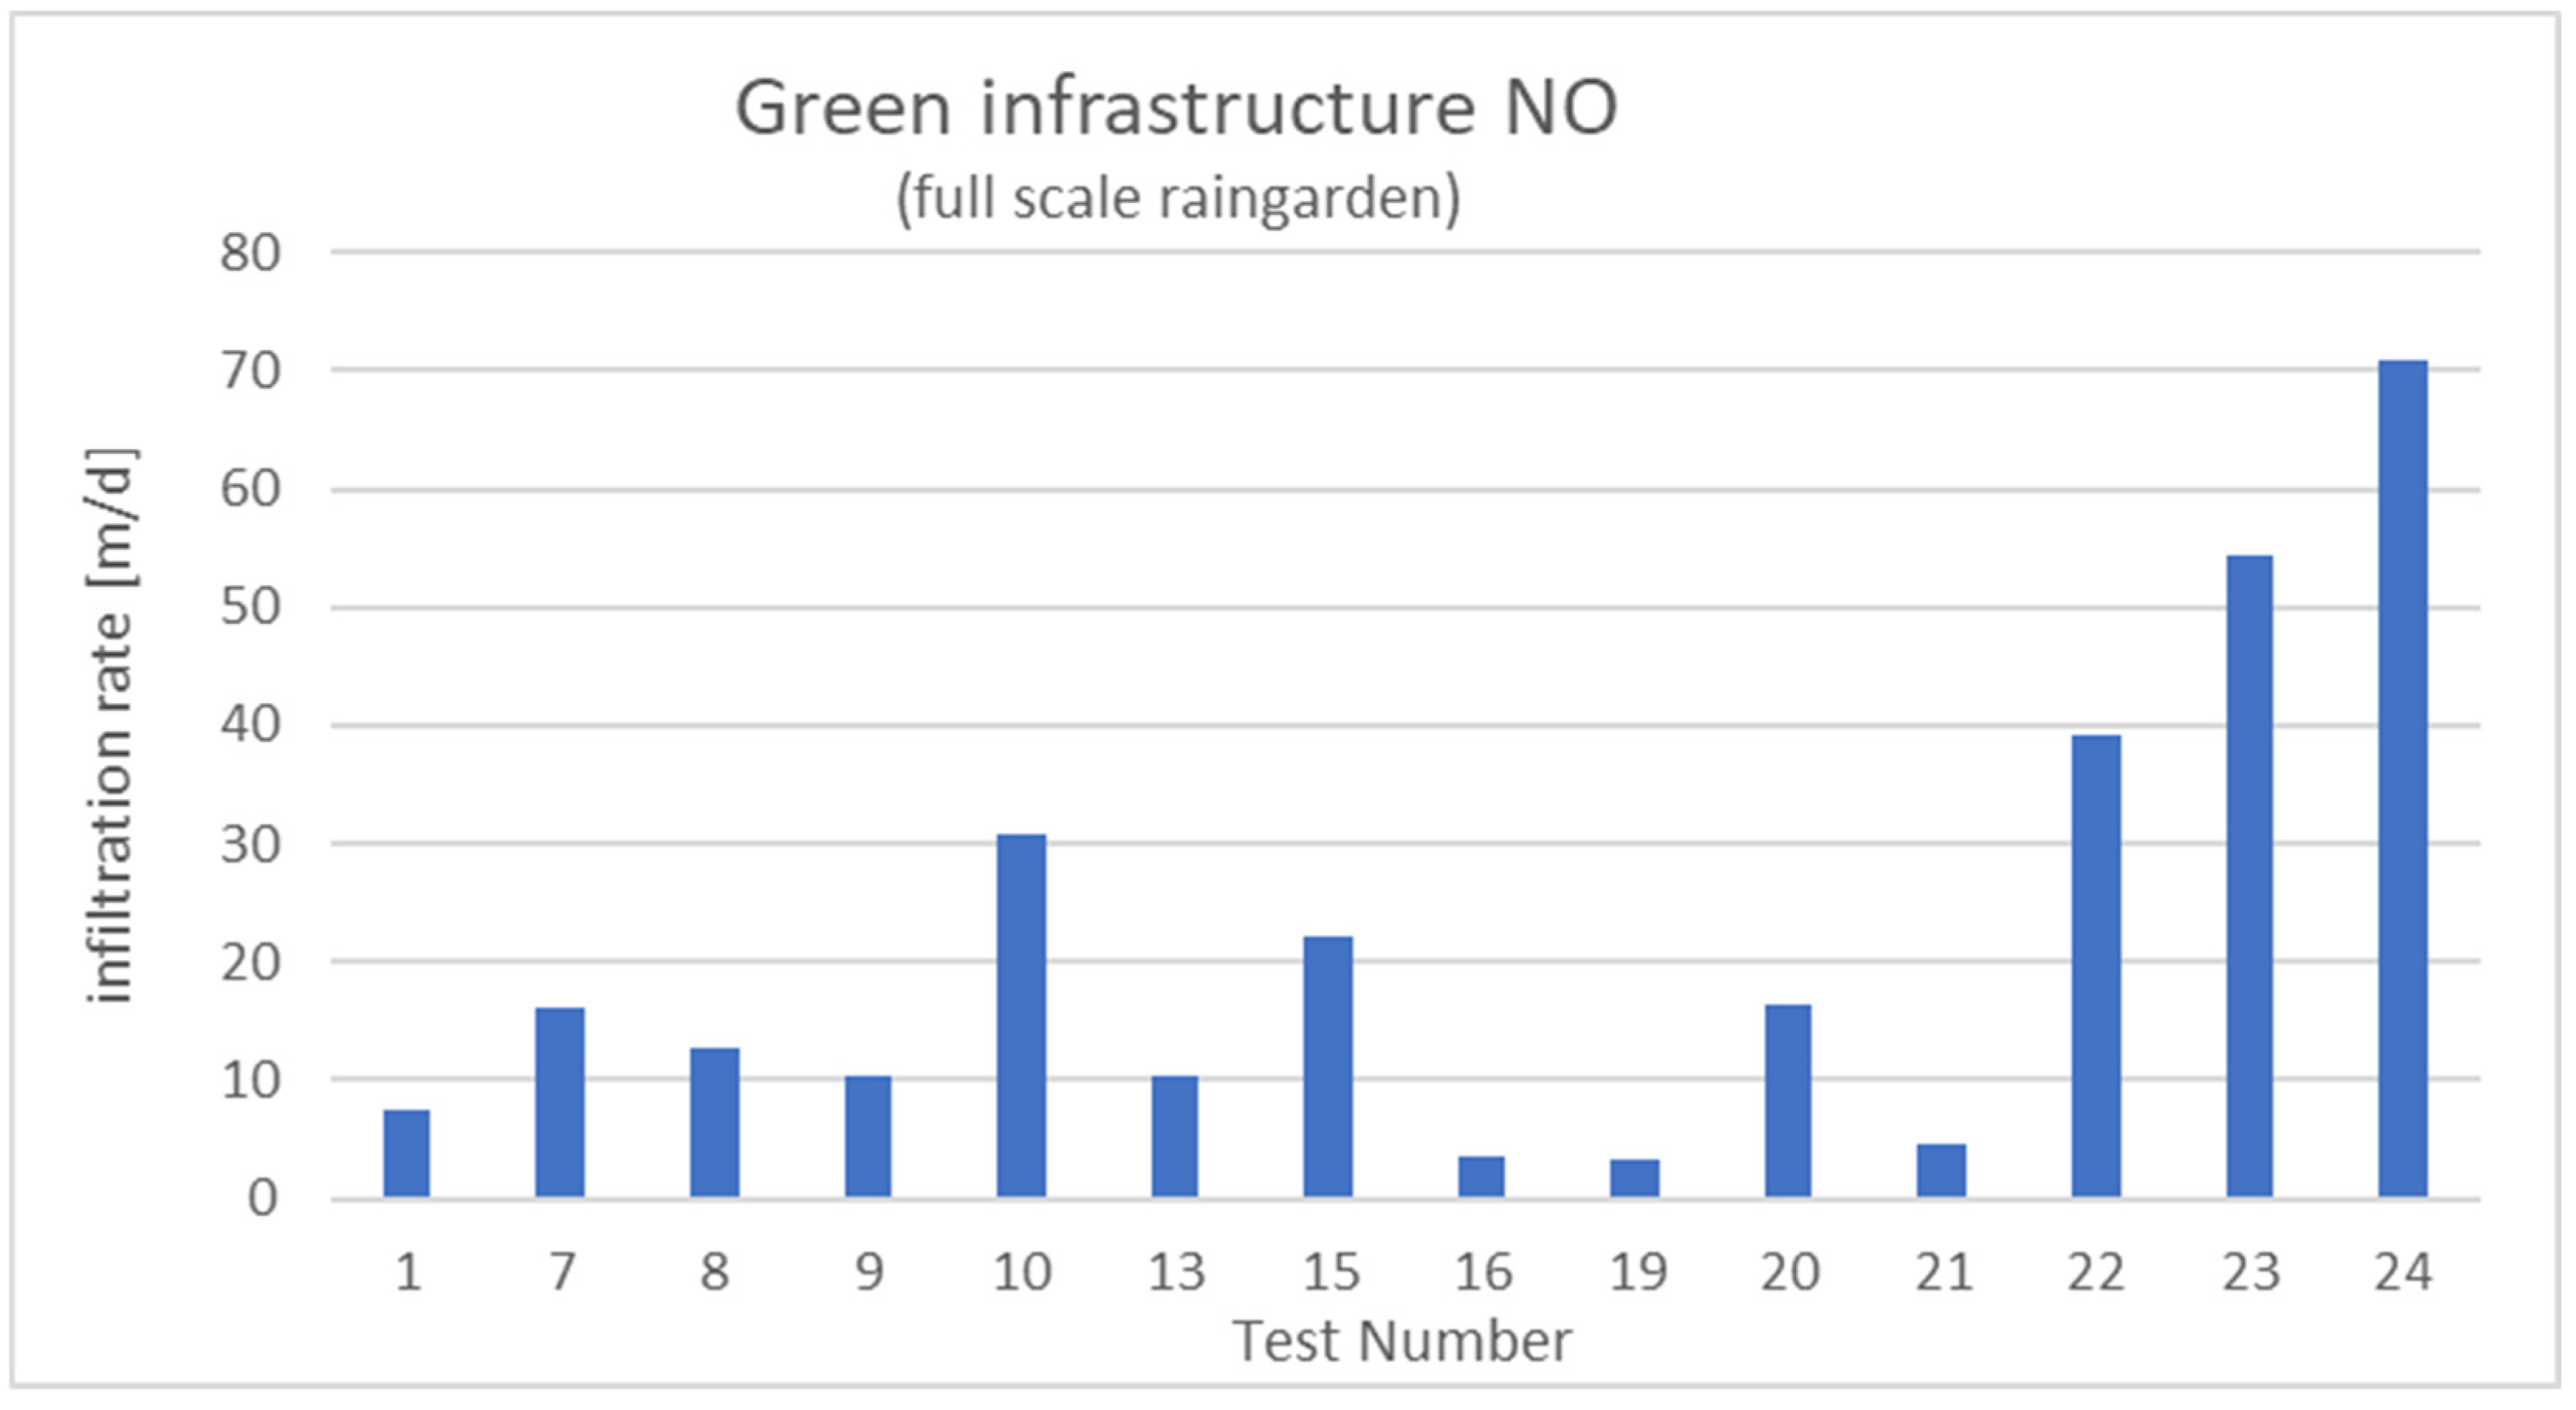
3.1. Green Infrastructure Infiltration Rates
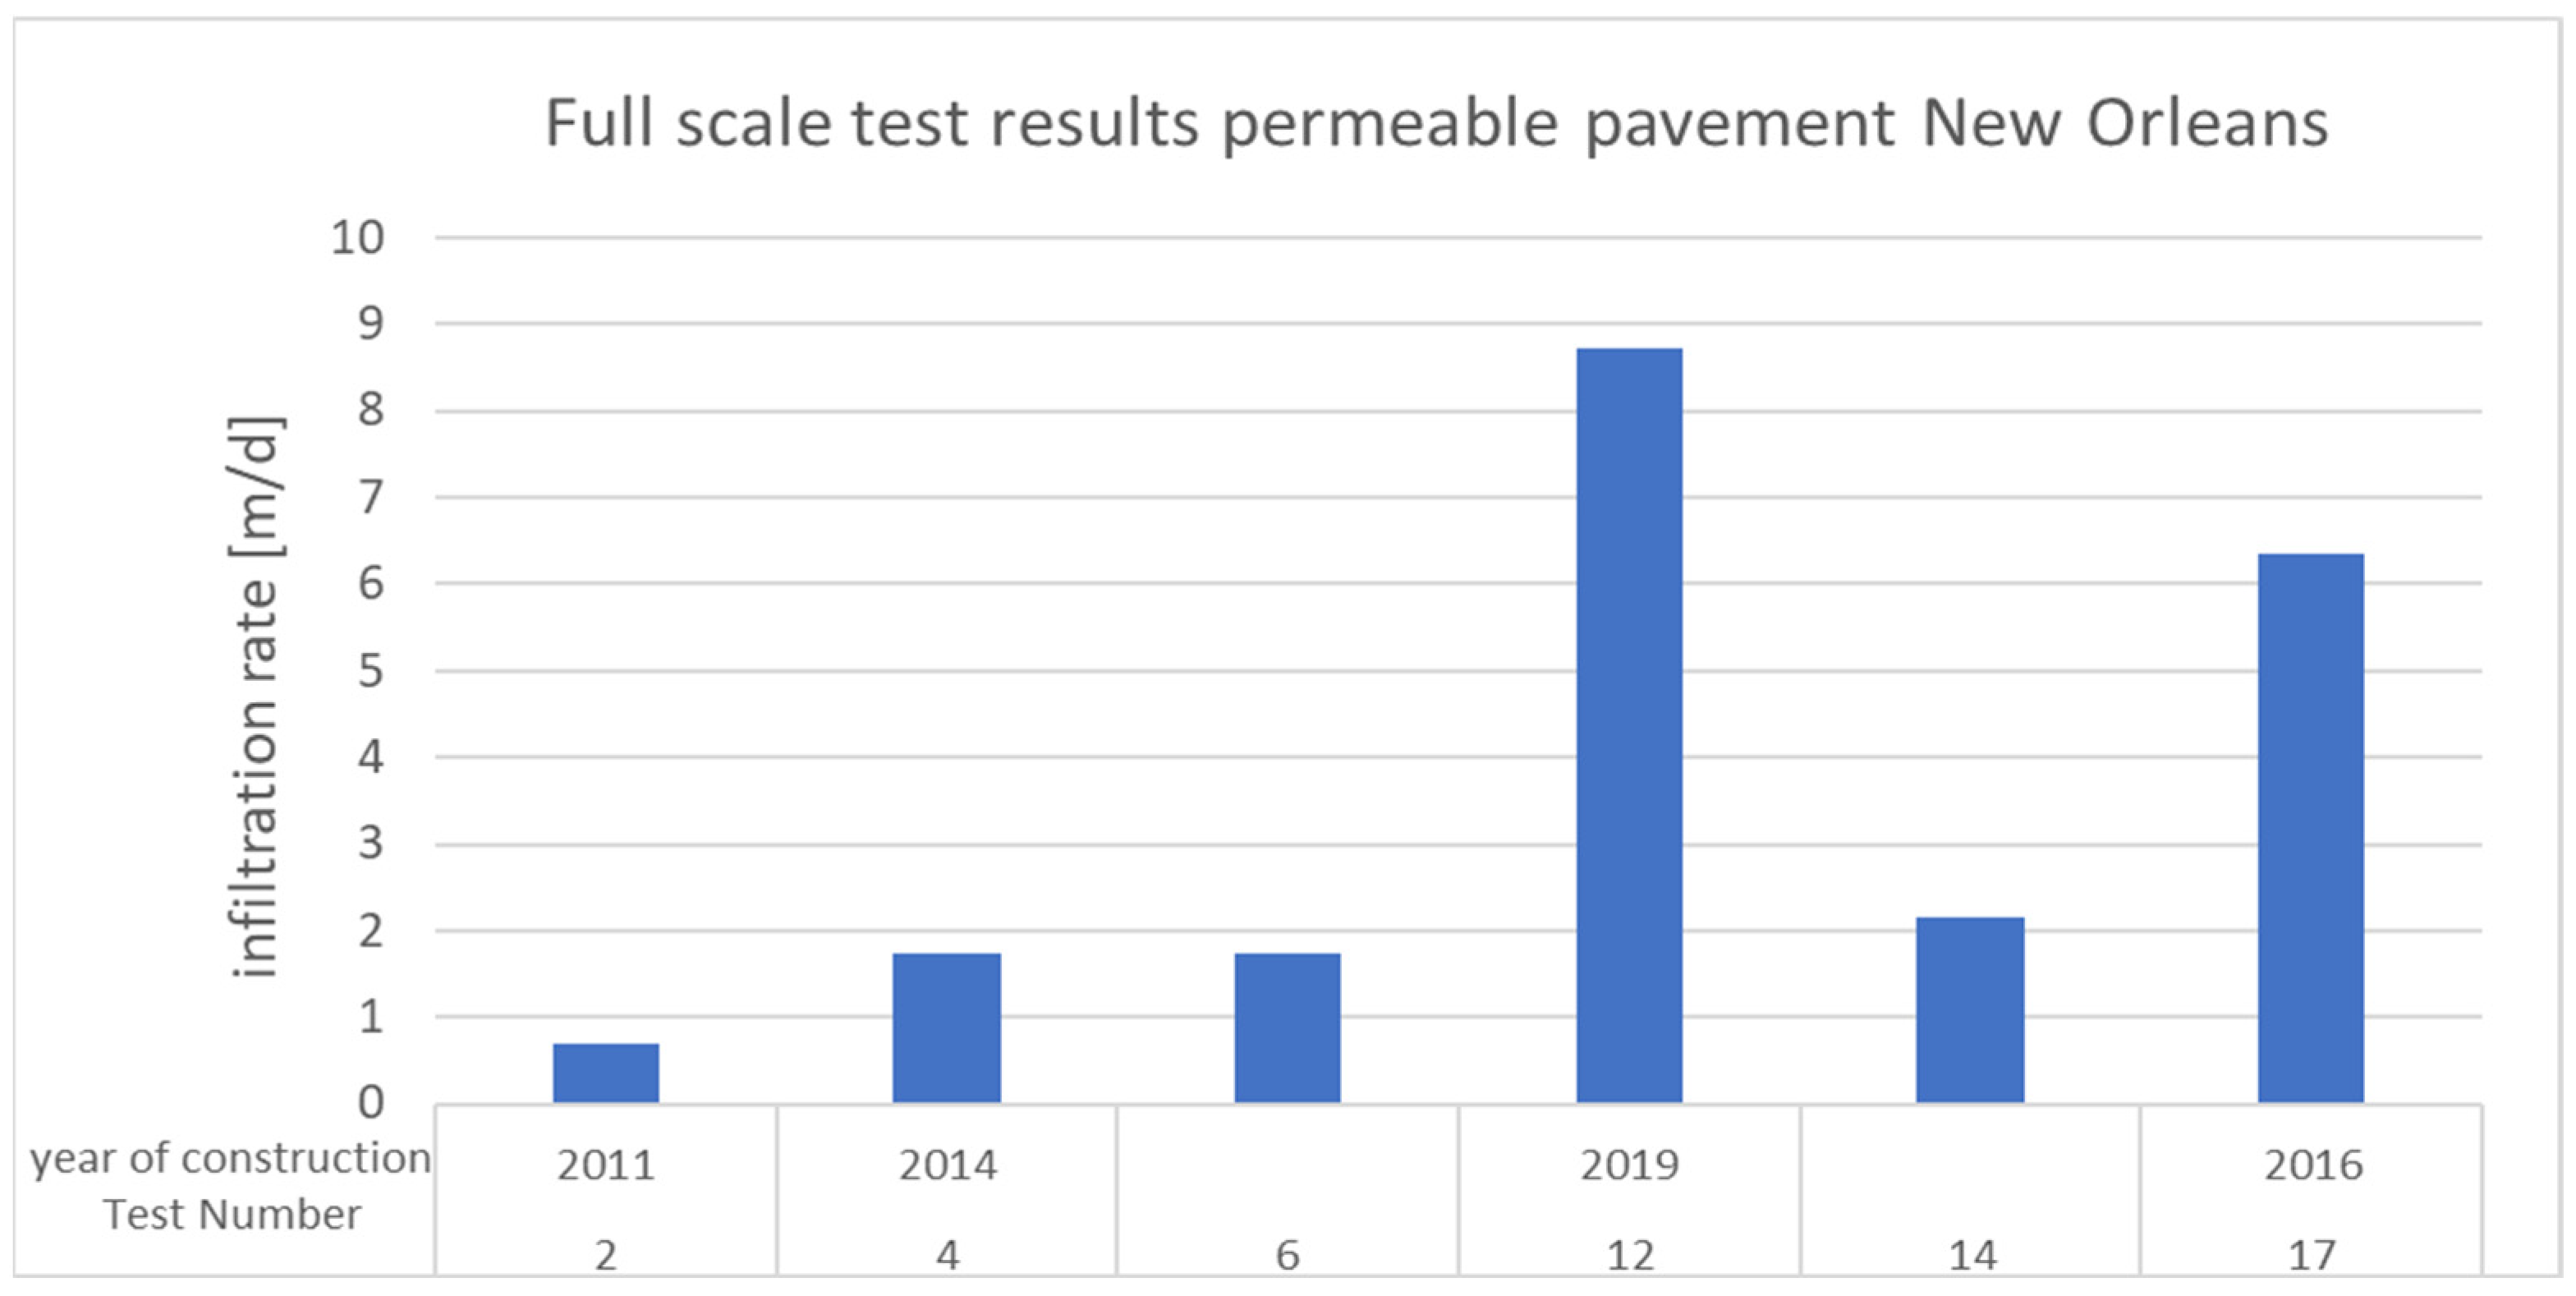
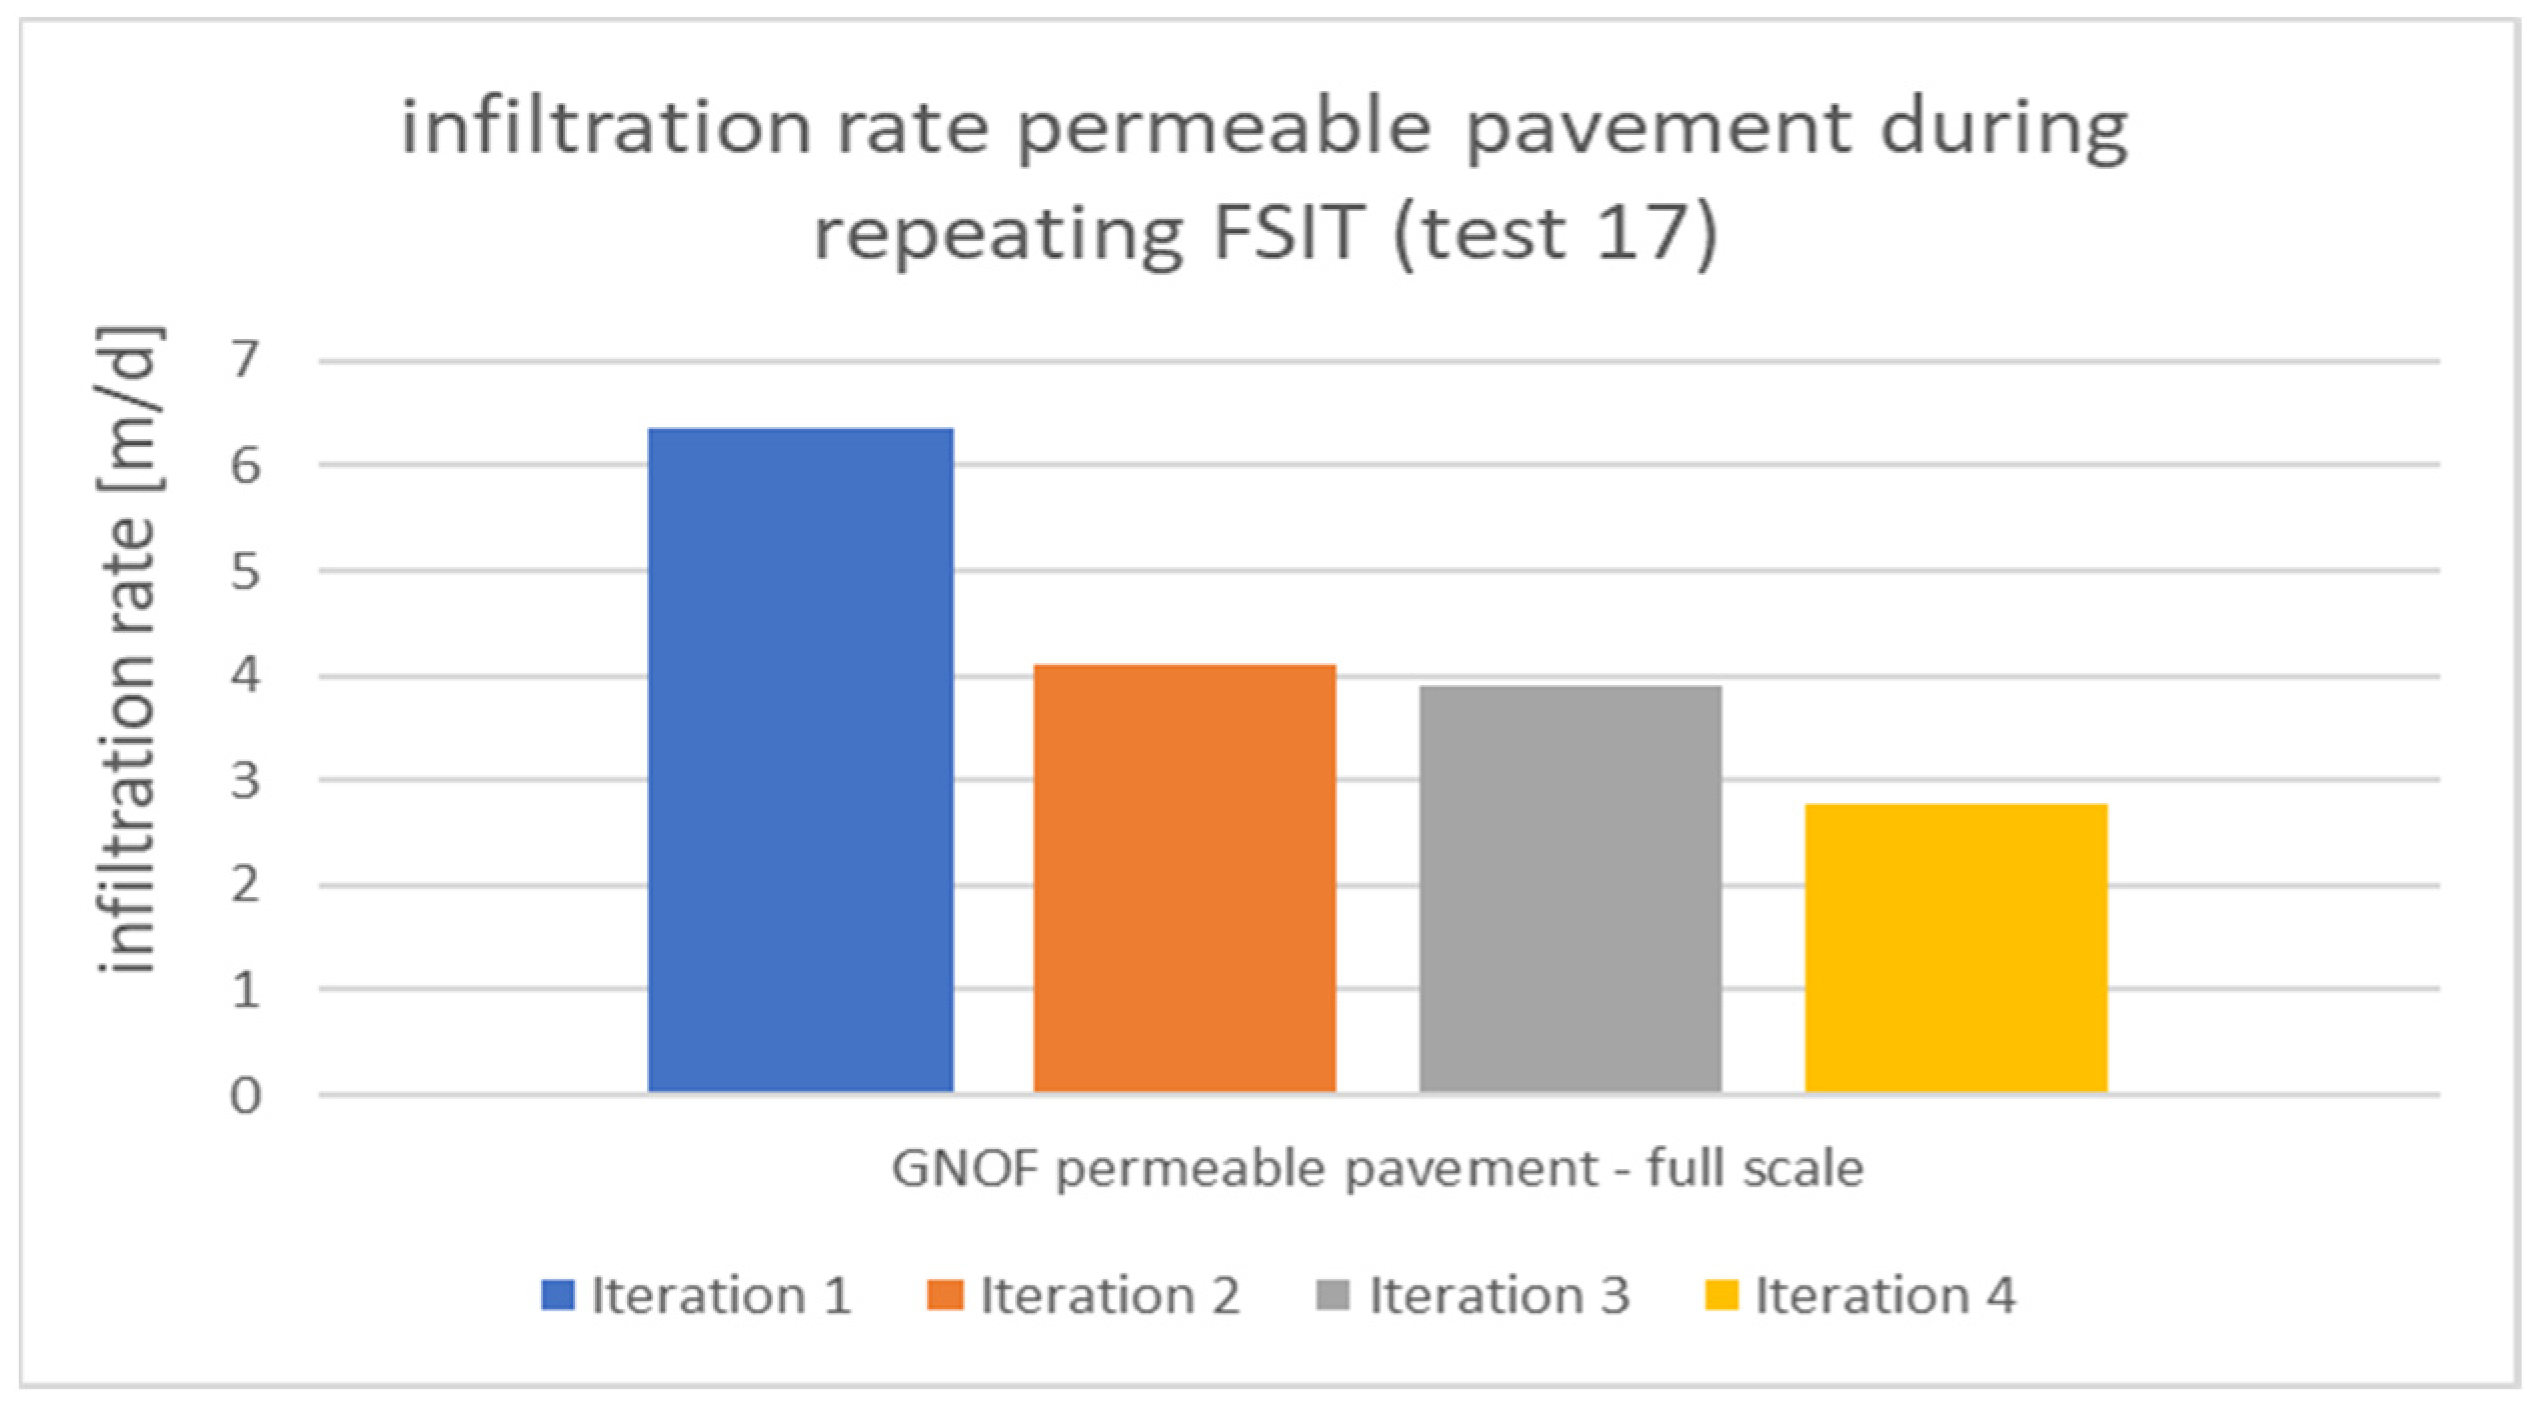
3.2. Permeable Pavement Infiltration Rates
4. Discussion
5. Conclusions
Author Contributions
Funding
Data Availability Statement
Acknowledgments
Conflicts of Interest
References
- Fletcher, T.D.; Andrieu, H.; Hamel, P. Understanding, Management and Modelling of Urban Hydrology and Its Consequences for Receiving Waters: A State of the Art. Adv. Water Resour. 2013, 51, 261–279. [Google Scholar] [CrossRef]
- Ballard, B.W.; Wilson, S.; Udale-Clarke, H.; Illman, S.; Scott, T.; Ashley, R.; Kellagher, R. The SUDS Manual; CIRIA: London, UK, 2017; ISBN 978-0-86017-697-8. [Google Scholar]
- Fletcher, T.D.; Shuster, W.; Hunt, W.F.; Ashley, R.; Butler, D.; Arthur, S.; Trowsdale, S.; Barraud, S.; Semadeni-Davies, A.; Bertrand-Krajewski, J.-L.; et al. SUDS, LID, BMPs, WSUD and More—The Evolution and Application of Terminology Surrounding Urban Drainage. Urban Water J. 2015, 12, 525–542. [Google Scholar] [CrossRef]
- Barrett, M.E. Comparison of BMP Performance Using the International BMP Database. J. Irrig. Drain. Eng. 2008, 134, 556–561. [Google Scholar] [CrossRef]
- Winston, R.J.; Al-Rubaei, A.M.; Blecken, G.T.; Viklander, M.; Hunt, W.F. Maintenance Measures for Preservation and Recovery of Permeable Pavement Surface Infiltration Rate—The Effects of Street Sweeping, Vacuum Cleaning, High Pressure Washing, and Milling. J. Environ. Manag. 2016, 169, 132–144. [Google Scholar] [CrossRef]
- Vollaers, V.; Nieuwenhuis, E.; van de Ven, F.; Langeveld, J. Root Causes of Failures in Sustainable Urban Drainage Systems (SUDS): An Exploratory Study in 11 Municipalities in The Netherlands. Blue-Green Syst. 2021, 3, 31–48. [Google Scholar] [CrossRef]
- Rushton, B.T. Low-Impact Parking Lot Design Reduces Runoff and Pollutant Loads. J. Water Resour. Plan. Manag. 2001, 127, 172–179. [Google Scholar] [CrossRef]
- Deletic, A. Modelling of Water and Sediment Transport over Grassed Areas. J. Hydrol. 2001, 248, 168–182. [Google Scholar] [CrossRef]
- Wang, J.; Meng, Q.; Zou, Y.; Qi, Q.; Tan, K.; Santamouris, M.; He, B.-J. Performance Synergism of Pervious Pavement on Stormwater Management and Urban Heat Island Mitigation: A Review of Its Benefits, Key Parameters, and Co-Benefits Approach. Water Res. 2022, 221, 118755. [Google Scholar] [CrossRef]
- Langeveld, J.G.; Liefting, H.J.; Boogaard, F.C. Uncertainties of Stormwater Characteristics and Removal Rates of Stormwater Treatment Facilities: Implications for Stormwater Handling. Water Res. 2012, 46, 6868–6880. [Google Scholar] [CrossRef]
- Rodak, C.M.; Jayakaran, A.D.; Moore, T.L.; David, R.; Rhodes, E.R.; Vogel, J.R. Urban Stormwater Characterization, Control, and Treatment. Water Environ. Res. 2020, 92, 1552–1586. [Google Scholar] [CrossRef]
- Lin, Z.; Yang, H.; Chen, H.; Ouyang, X.; Liu, Z. Comparison of the Decontamination Performance of Three Permeable Bricks: Adsorption and Filtration Experiments. Polish J. Environ. Stud. 2020, 29, 3225–3233. [Google Scholar] [CrossRef]
- Koritz, A.; Sanchez, G.J. Civic Engagement in the Wake of Katrina; U OF M DIGT CULT BOOKS: Ann Arbor, MI, USA, 2009; ISBN 9780472116980. Available online: https://www.press.umich.edu/923684/civic_engagement_in_the_wake_of_katrina/?s=description (accessed on 20 December 2022).
- Nguyen, N.P.T.; Sultana, A.; Areerachakul, N.; Kandasamy, J. Evaluating the Field Performance of Permeable Concrete Pavers. Water 2022, 14, 2143. [Google Scholar] [CrossRef]
- Davis, A.P.; Traver, R.G.; Hunt, W.F.; Lee, R.; Brown, R.A.; Olszewski, J.M. Hydrologic Performance of Bioretention Storm-Water Control Measures. J. Hydrol. Eng. 2012, 17, 604–614. [Google Scholar] [CrossRef]
- Nougues, L.; Stuurman, R. Groundwater Drainage in New Orleans. H20 Water Matters 2022, 36–39. [Google Scholar]
- Adams, V.; van Hattum, T.; English, D. Chronic Disaster Syndrome: Displacement, Disaster Capitalism, and the Eviction of the Poor from New Orleans. Am. Ethnol. 2009, 36, 615–636. [Google Scholar] [CrossRef] [PubMed]
- Burkett, V.R.; Zilkoski, D.B.; Hart, D.A. Sea-Level Rise and Subsidence: Implications for Flooding in New Orleans, Louisiana. In Proceedings of the US Geological Survey Subsidence Interest Group Conference, Galveston, TX, USA, 27–29 November 2001; pp. 63–70. [Google Scholar]
- Carter, L.M.; Jones, J.W.; Berry, L.; Burkett, V.; Murley, J.F.; Obeysekera, J.; Schramm, P.J.; Wear, D.Ch. 17: Southeast and the Caribbean. In Climate Change Impacts in the United States: The Third National Climate Assessment; Carter, L.M.; Jones, J.W.; Berry, L.; Burkett, V.; Murley, J.F.; Obeysekera, J.; Schramm, P.J.; Wear, D.Ch. U.S. Global Change Research Program; Washington, DC, USA, 2014. Available online: http://nca2014.globalchange.gov/report/regions/southeast (accessed on 20 December 2022).
- Mallum, F. Stormwater Management and the Assessment of Green Infrastructure Implementation in New Orleans. Shima Int. J. Res. Isl. Cult. 2022, 16, 61–75. [Google Scholar] [CrossRef]
- Chini, C.; Canning, J.; Schreiber, K.; Peschel, J.; Stillwell, A. The Green Experiment: Cities, Green Stormwater Infrastructure, and Sustainability. Sustainability 2017, 9, 105. [Google Scholar] [CrossRef]
- Sewerage and Water Board of New Orleans. Green Infrastructure. 2014. Available online: https://www.swbno.org/documents/environmental/greeninfrastructure/GreenInfrastructurePlan.pdf (accessed on 31 December 2022).
- Waggonner, D.; Dolman, N.; Hoeferlin, D.; Meyer, H.; Schengenga, P.; Thomaesz, S.; Van Den Bout, J.; Van Der Salm, J.; Van Der Zwet, C. New Orleans after Katrina: Building America’s Water City. Built Environ. 2014, 40, 281–299. [Google Scholar] [CrossRef]
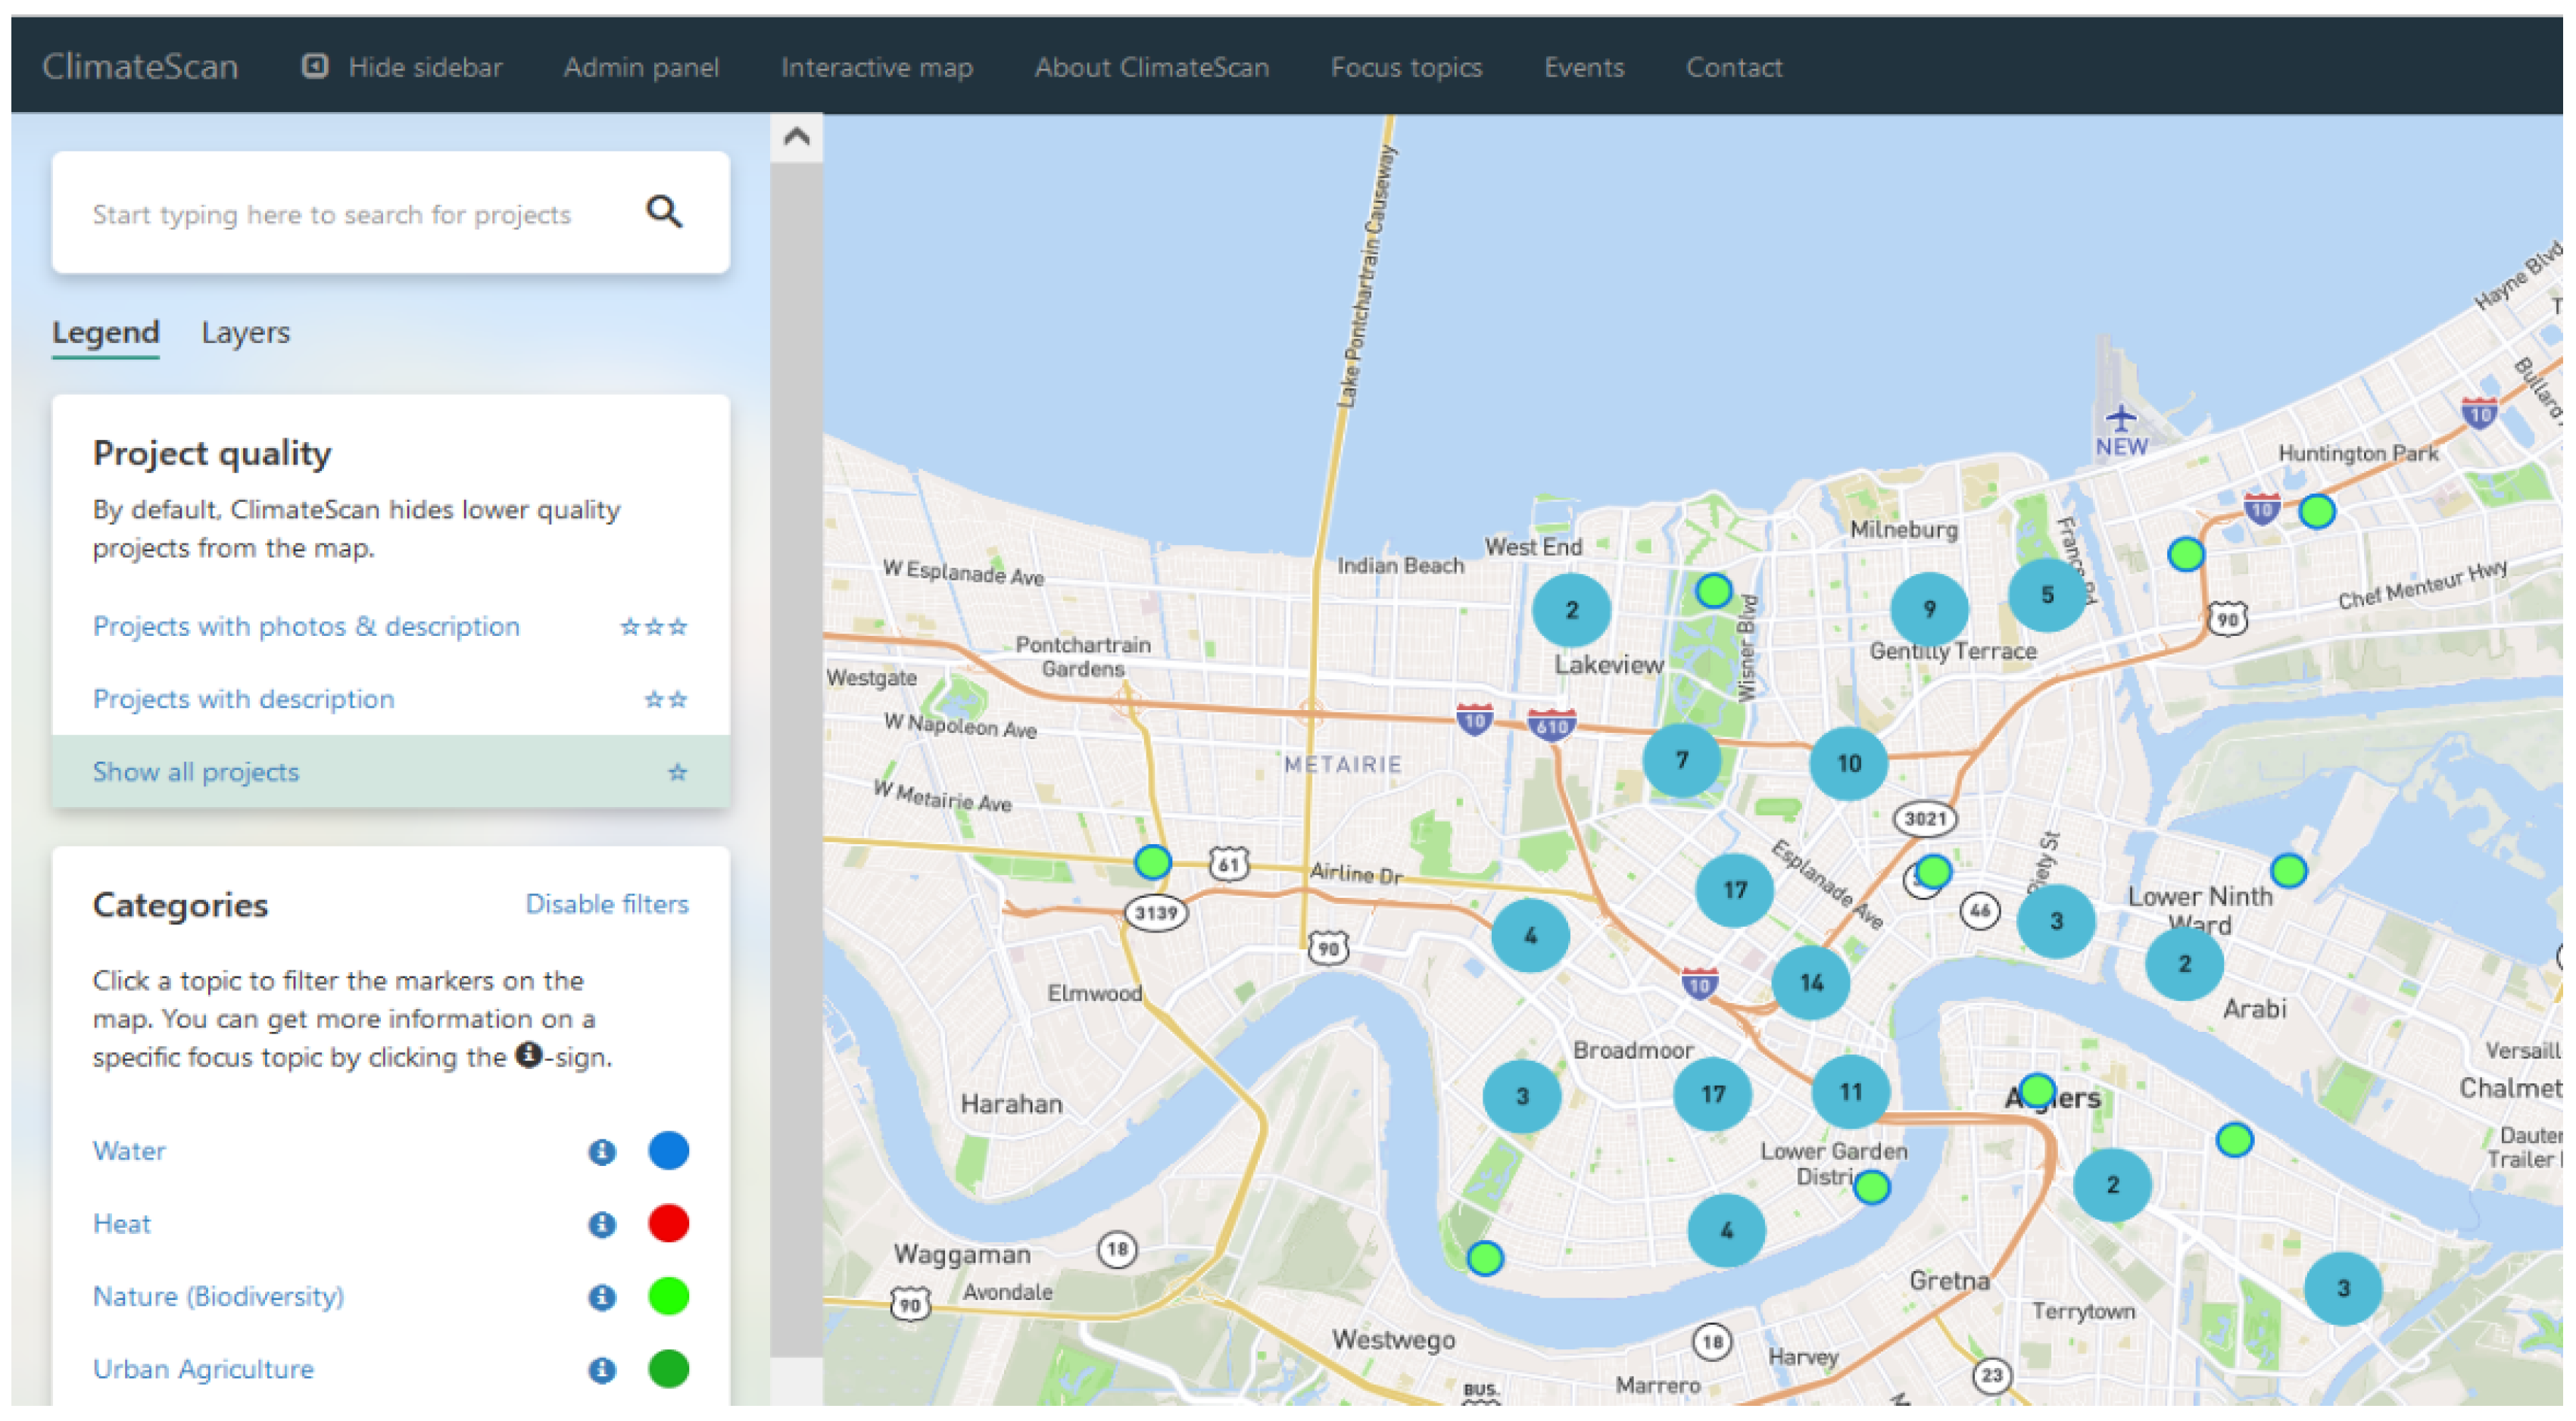
- Restemeyer, B.; Boogaard, F.C. Potentials and Pitfalls of Mapping Nature-Based Solutions with the Online Citizen Science Platform Climatescan. Land 2021, 10, 5. [Google Scholar] [CrossRef]
- Kumar, P.; Debele, S.E.; Sahani, J.; Rawat, N.; Marti-Cardona, B.; Alfieri, S.M.; Basu, B.; Basu, A.S.; Bowyer, P.; Charizopoulos, N.; et al. An Overview of Monitoring Methods for Assessing the Performance of Nature-Based Solutions against Natural Hazards. Earth-Sci. Rev. 2021, 217, 103603. [Google Scholar] [CrossRef]
- ASTM C1701/C1701M-17a. Standard Test Method for Infiltration Rate of In Place Pervious Concrete. Astm Int. 2020, 3. [Google Scholar] [CrossRef]
- Li, H.; Kayhanian, M.; Harvey, J.T. Comparative Field Permeability Measurement of Permeable Pavements Using ASTM C1701 and NCAT Permeameter Methods. J. Environ. Manag. 2013, 118, 144–152. [Google Scholar] [CrossRef] [PubMed]
- Lucke, T.; Beecham, S. Field Investigation of Clogging in a Permeable Pavement System. Build. Res. Inf. 2011, 39, 603–615. [Google Scholar] [CrossRef]
- Pezzaniti, D.; Beecham, S.; Kandasamy, J. Influence of Clogging on the Effective Life of Permeable Pavements. Proc. Inst. Civ. Eng. Water Manag. 2009, 162, 211–220. [Google Scholar] [CrossRef]
- Lucke, T.; Boogaard, F.; van de Ven, F. Evaluation of a New Experimental Test Procedure to More Accurately Determine the Surface Infiltration Rate of Permeable Pavement Systems. Urban Plan. Transp. Res. 2014, 2, 893200. [Google Scholar] [CrossRef]
- Veldkamp, T.I.E.; Boogaard, F.C.; Kluck, J. Unlocking the Potential of Permeable Pavements in Practice: A Large-Scale Field Study of Performance Factors of Permeable Pavements in The Netherlands. Water 2022, 14, 2080. [Google Scholar] [CrossRef]
- Boogaard, F.C.; Venvik, G.; de Lima, R.L.P.; Cassanti, A.C.; Roest, A.H.; Zuurman, A. ClimateCafe: An Interdisciplinary Educational Tool for Sustainable Climate Adaptation and Lessons Learned. Sustainability 2020, 12, 3694. [Google Scholar] [CrossRef]
- VanEssen. Available online: https://www.vanessen.com/products/data-loggers/td-diver (accessed on 31 December 2022).
- Boogaard, F.; Lucke, T. Long-Term Infiltration Performance Evaluation of Dutch Permeable Pavements Using the Full-Scale Infiltration Method. Water 2019, 11, 320. [Google Scholar] [CrossRef]
- Boogaard, F.C. Spatial and Time Variable Long Term Infiltration Rates of Green Infrastructure under Extreme Climate Conditions, Drought and Highly Intensive Rainfall. Water 2022, 14, 840. [Google Scholar] [CrossRef]
- Chopra, M.; Kakuturu, S.; Ballock, C.; Spence, J.; Wanielista, M. Effect of Rejuvenation Methods on the Infiltration Rates of Pervious Concrete Pavements. J. Hydrol. Eng. 2010, 15, 426–433. [Google Scholar] [CrossRef]
- Gilbert, J.K.; Clausen, J.C. Stormwater Runoff Quality and Quantity from Asphalt, Paver, and Crushed Stone Driveways in Connecticut. Water Res. 2006, 40, 826–832. [Google Scholar] [CrossRef] [PubMed]
- Chen, L.-M.; Chen, J.-W.; Chen, T.-H.; Lecher, T.; Davidson, P. Measurement of Permeability and Comparison of Pavements. Water 2019, 11, 444. [Google Scholar] [CrossRef]
- Chen, L.-M.; Chen, J.-W.; Lecher, T.; Chen, T.-H.; Davidson, P. Assessment of Clogging of Permeable Pavements by Measuring Change in Permeability. Sci. Total Environ. 2020, 749, 141352. [Google Scholar] [CrossRef] [PubMed]
- Coleri, E.; Kayhanian, M.; Harvey, J.T.; Yang, K.; Boone, J.M. Clogging Evaluation of Open Graded Friction Course Pavements Tested under Rainfall and Heavy Vehicle Simulators. J. Environ. Manag. 2013, 129, 164–172. [Google Scholar] [CrossRef] [PubMed]
- NOAA-NCEI, Lakefront Airport. Available online: https://www.nws.noaa.gov/wtf/obslocal.php?warnzone=LAZ062&local_place=New+Orleans+Lakefront+Airport+LA&zoneid=CDT&offset=18000 (accessed on 31 December 2022).
- Asleson, B.C.; Nestingen, R.S.; Gulliver, J.S.; Hozalski, R.M.; Nieber, J.L. Performance Assessment of Rain Gardens. JAWRA J. Am. Water Resour. Assoc. 2009, 45, 1019–1031. [Google Scholar] [CrossRef]


| Facility Number | Name | Owner | Construction Year (if Known) | Type of Test | More Info (Location, Pictures and Movies) https://www.climatescan.nl/projects/X/detail (accessed on 20 December 2022)X= |
|---|---|---|---|---|---|
| GI1 | City Park Tricentennial parking lot | City Park | 2011 | Full-scale | 7397 |
| GI2 | Wildair | NORA | 2014 | Full-scale | 7399 |
| GI3 | Milne—eastern bioswale | Full-scale | 9703 | ||
| GI4 | Milne—northern bioswale | Full-scale | 9704 | ||
| GI5 | Press Drive | NORA | Full-scale | 7398 | |
| GI6 | NORA OC Haley—raingarden | NORA | Full-scale | 9651 | |
| GI7 | Groundwork OC Haley, next to no. 1520 | NORA | Full-scale | 9652 | |
| GI8 | Groundwork OC Haley, next to no. 1307 | NORA | Full-scale | 9684 | |
| GI9 | Aurora raingarden | SWBNO | 2017 | Full-scale | 7407 |
| GI10 | Aurora swale | SWBNO | 2017 | Full-scale | 9695 |
| GI11 | Greenline pavilion swale | SWBNO | 2016 | Full-scale | 9685 |
| GI12 | Hollygrove—Forshey St. | Full-scale | 9685 | ||
| GI13 | Lafitte raingarden (Toulouse and N. Lopez St.) | Full-scale | 9693 | ||
| GI14 | Lafitte raingarden (Toulouse and N. Rendon St.) | Full-scale | 9692 | ||
| GI15 | City Hall raingardens | City of New Orleans | Infiltrometer | 9691 |
| Facility Number | Name | Owner | Construction Year | Type of Test | More Info (Location, Pictures and Movies) https://www.climatescan.nl/projects/X/detail (accessed on 20 December 2022)X= |
|---|---|---|---|---|---|
| PP1 | City Park Administration building Total area: 213.00 ft2 (19.79 m2) | City Park | 2011 | Full-scale and infiltrometer | 9653 |
| PP2 | SWBNO parking lot | SWBNO | 2014 | Full-scale and infiltrometer | 9677 |
| PP3 | Hunters field Total area: 32.99 ft2 (3.07 m2) | Full-scale and infiltrometer | 9678 | ||
| PP4 | SUNO permeable pavement Total Are 238.43 ft2 (22.15 m2) | City of New Orleans | 2019 | Full-scale and infiltrometer | 9663 |
| PP5 | NORA OC Haley | NORA | Full-scale and infiltrometer | 9651 | |
| PP6 | GNOF permeable pavement Total area: 149.22 ft2 (13.86 m2) | GNOF | 2016 | Full-scale and infiltrometer | 9700 |
| PP7 | Lafitte permeable pavement (Toulouse and N. Lopez St.) | Infiltrometer | 9694 |
| Test Number | Facility | Type of Test | Name | Test 1 [m/d] | Test 2 [m/d] | Test 3 [m/d] | Test 4 [m/d] |
|---|---|---|---|---|---|---|---|
| 1 | Raingarden | Full-scale | City Park Tricentennial parking lot | 7.52 | |||
| 2 | Permeable pavement | Full-scale | City Park Administration building | 0.7 | |||
| 3 | Permeable pavement | Infiltrometer | City Park Administration building | 0.83 | |||
| 4 | Permeable pavement | Full-scale | SWBNO parking lot | 1.73 | |||
| 5 | Permeable pavement | Infiltrometer | SWBNO parking lot—infiltrometer | 2.43 | |||
| 6 | Permeable pavement | Full-scale | Hunters field | 1.73 | |||
| 7 | Raingarden | Full-scale | Wildair | 16 | |||
| 8 | Swale | Full-scale | Milne—eastern bioswale | 12.73 | |||
| 9 | Swale | Full-scale | Milne—northern bioswale | 10.3 | |||
| 10 | Raingarden | Full-scale | Press Drive | 30.7 | |||
| 11 | Permeable pavement | Infiltrometer | SUNO permeable pavement | 61.4 | |||
| 12 | Permeable pavement | Full-scale | SUNO permeable pavement | 8.72 | |||
| 13 | Raingarden | Full-scale | NORA OC Haley—rain garden | 10.34 | |||
| 14 | Permeable pavement | Full-scale | NORA OC Haley—permeable pavement | 2.16 | 2.2 | ||
| 15 | Raingarden | Full-scale | Groundwork OC Haley, no. 1520 | 22.2 | |||
| 16 | Raingarden | Full-scale | Groundwork OC Haley, no. 1307 | 3.54 | |||
| 17 | Permeable pavement | Full-scale | GNOF permeable pavement | 6.35 | 4.11 | 3.9 | 2.79 |
| 18 | Permeable pavement | Infiltrometer | GNOF permeable pavement | 194.13 | |||
| 19 | Raingarden | Full-scale | Aurora rain garden | 3.31 | 2.37 | ||
| 20 | Swale | Full-scale | Aurora swale | 16.27 | 8.86 | ||
| 21 | Swale | Full-scale | Greenline pavilion swale | 4.71 | |||
| 22 | Raingarden | Full-scale | Hollygrove—Forshey St. | 39.29 | |||
| 23 | Raingarden | Full-scale | Lafitte raingarden (Toulouse and N. Lopez St.) | 54.44 | 38.93 | ||
| 24 | Raingarden | Full-scale | Lafitte raingarden (Toulouse and N. Rendon St.) | 70.81 | 55.76 | ||
| 25 | Permeable pavement | Infiltrometer | Lafitte permeable pavement | 58.85 | |||
| 26 | Raingarden | Infiltrometer | City Hall raingardens | 23.84 | 35.625 | 33.135 | 38.05 |
| Challenges Green Infrastructure | Solution |
|---|---|
| Trash is present. | Remove the trash/debris and implement trash collecting facilities. |
| Green infrastructure inlet is higher then the stormwater drainage inlet. | Lower the inlet of the GI to make sure the GI fills up first |
| Signs of damage at the outlet such as erosion after storms. | Repair the damage and improve the flow dissipation structure with reinforment of the slope (eg with stones). |
| The inlet pipe is clogged. | Unclog the pipe and dispose of any sediment in a location where it will not impact the waterflow. |
| The inlet is too close to outlet (bypassing waterquality improvement and storage capacity is not used). | Adjust design so that the entire storage volume is used. Constructing a outlet at a higher level also contributes to a higher storage capacity. |
| Lack of insight in water and soil quality. | monitoring advised. |
| Lack of insight in the green infrastructure for stakeholders and residents. | Document design (e.g. climatescan.org), construction and maintenance of nature based solutions. Improve basic insights with signs or other means of communication and participation. |
Disclaimer/Publisher’s Note: The statements, opinions and data contained in all publications are solely those of the individual author(s) and contributor(s) and not of MDPI and/or the editor(s). MDPI and/or the editor(s) disclaim responsibility for any injury to people or property resulting from any ideas, methods, instructions or products referred to in the content. |
© 2023 by the authors. Licensee MDPI, Basel, Switzerland. This article is an open access article distributed under the terms and conditions of the Creative Commons Attribution (CC BY) license (https://creativecommons.org/licenses/by/4.0/).
Share and Cite
Boogaard, F.; Rooze, D.; Stuurman, R. The Long-Term Hydraulic Efficiency of Green Infrastructure under Sea Level: Performance of Raingardens, Swales and Permeable Pavement in New Orleans. Land 2023, 12, 171. https://doi.org/10.3390/land12010171
Boogaard F, Rooze D, Stuurman R. The Long-Term Hydraulic Efficiency of Green Infrastructure under Sea Level: Performance of Raingardens, Swales and Permeable Pavement in New Orleans. Land. 2023; 12(1):171. https://doi.org/10.3390/land12010171
Chicago/Turabian StyleBoogaard, Floris, Daan Rooze, and Roelof Stuurman. 2023. "The Long-Term Hydraulic Efficiency of Green Infrastructure under Sea Level: Performance of Raingardens, Swales and Permeable Pavement in New Orleans" Land 12, no. 1: 171. https://doi.org/10.3390/land12010171
APA StyleBoogaard, F., Rooze, D., & Stuurman, R. (2023). The Long-Term Hydraulic Efficiency of Green Infrastructure under Sea Level: Performance of Raingardens, Swales and Permeable Pavement in New Orleans. Land, 12(1), 171. https://doi.org/10.3390/land12010171