Abstract
Rockfall analysis is a multiparametric procedure with many uncertainties and the outputs are largely dependent on some critical engineering geological parameters involved in the used simulation model. In this paper, three completely different limestone rock sequences, named Pantokratoras, Vigla, and Paxos limestones along the western coastal slopes of Lefkada island, in Greece, are examined regarding their rockfall susceptibility as expressed by produced kinetic energy, under aseismic and seismic conditions. A rockfall inventory was prepared through detailed field measurements after the extensive rockfalls which were caused by the strong earthquake of November 2015, while engineering geological surveys were systematically conducted on the limestone rock masses. Two case scenarios were adopted for the rockfall simulations: one without the horizontal initial velocity of the detached rock boulder and the other with an estimated value obtained from the peak ground velocity (PGV) of the main seismic shock. Two-dimensional rockfall simulations were performed in selected cross-sections for each rock mass, and spatial distribution maps of the intensity (kinetic energy) were generated. A comparison of the maps has shown a strong maximum variation in the intensity levels among the three rock masses mainly due to the differential size of the detached boulders because of the inherent engineering geological characteristics of the rock masses. The results show that the earthquake ground velocity generally leads to a fluctuating change in the intensity values due to the trajectory shape and increases the rockfall magnitude as the main triggering factor.
1. Introduction
Rockfalls are one of the most serious natural hazards which are incorporated in the general term “landslides”, constitute one of the classified landslide types [1], and are considered to be very critical due to their frequency and intensity. There are several kinds of approaches, such as investigations of the rockfall mechanism, the determination of the coefficients of restitution, the design of remedial measures, in situ rockfall experimental tests, and laboratory modelling.
In the framework of predicting or estimating the rockfall hazard, many researchers deal with the issues of the “susceptibility”, “hazard”, and “risk” of this phenomenon. Particularly, classification systems have been developed for the rockfall hazard qualitative assessment, including the Rockfall Hazard Rating System (RHRS) [2], Swiss codes of practice [3], and the Evolving Rockfall Hazard Assessment (ERHA) [4]. The next stage is the rockfall risk assessment [5]. Some studies emphasize designing mitigation measures against rockfall hazards, based on the site-specific characteristics, to protect the slope use, considering the rockfall trajectories simulation, kinetic energy, and the bounce height of the rock blocks [6,7,8].
In particular, susceptibility is the possibility of the occurrence of an event in a specific area and is dependent on its local characteristics [9]. Landslide susceptibility could be expressed in terms of the volume (or area), velocity, and intensity of the landslide in a quantitative context, while the qualitative assessment includes the spatial distribution of the landslides [10]. For instance, the rockfall susceptibility is quantitatively expressed through the rockfall kinetic energy [6] and is estimated using empirical models in combination with experimental in situ work usually imported into geographical information systems (GIS) [11].
The study area of Lefkada island constitutes an extensively investigated area due to its rich history of earthquakes, which are considered to be the main triggering factor for landslides and rockfalls. Specifically, seismological recordings show that Lefkada experiences damaging earthquakes, on average, every 18 years [12]. The most frequent earthquake magnitudes that have occurred on the island are Mw = 5–6.5 [13]. The recordings in detailed seismic catalogues and archives show that the western slopes of the island are most frequently affected by landslides and rockfalls, characterising them as the most susceptible. In the past, a landslide susceptibility assessment has been applied to the study area with a model based on remote sensing, fuzzy logic, and expert knowledge, analysing two types of slide movements: rapid and slow [14]. In addition, several statistical methods for the landslide susceptibility assessment on Lefkada island have also been applied [15,16].
Although there is a plethora of publications in the field of landslide susceptibility, in the broadest sense, very few publications exist regarding the rockfall quantitative susceptibility assessment, based on the engineering–geological parameters. This is the research gap that the present study aims to fill. This paper aims to investigate the effect and importance of some critical rock mass engineering–geological and seismic parameters on rockfall simulation analyses and especially on the induced kinetic energy distribution that can be attributed to rockfall susceptibility maps. These maps can be used by local authorities for civil protection purposes and target the development of protective measures against rockfalls.
Furthermore, the present research emphasised the use of detailed fieldwork for the identification of rockfalls, accompanied by extensive research on the date of their occurrence. Extended and analytical recordings were taken for the rock blocks in the slope exposures, as well as for the rock masses. Particularly, global positioning system (GPS) measurements were used for the identification of each rockfall site, and rock mass characterisation and classification, as well as discontinuity mechanical description, was also accomplished. In the end, a detailed rockfall database was compiled where a correlation among the rockfall parameters occurred. The aforementioned techniques were combined also with GIS to spatially define the rockfall phenomena in the area.
Rock block detachment could be triggered by forcing factors such as seismic ground motion, rainfall, freeze–thaw cycles, root growth or leverage in high winds, or progressive rock mass degradation. Among the triggering factors, the seismic ground motion parameters are the most frequent for a rockfall occurrence [17], which is the main case on the island of Lefkada.
Limestone has been identified as the most frequent rockfall occurrence lithological formation in Greece [18], with a rockfall frequency within the limestone formation equal to 64%. The fractured limestone rock masses, especially those in the vicinity of faults, combined with the presence of water or seismic loading favour rockfalls, under the prerequisite of the intersecting discontinuities, from where the rock blocks can easily be detached. This rock fall pattern is also common among the limestone rock masses of Lefkada island. In particular, the mechanical parameters of Lefkada’s limestone formations (cohesion, friction angle, and discontinuity properties), as well as the geometrical parameters of the slopes and pre-detached rock blocks (topography, the identification of the potential start points of rockfalls, the limits of the outcropping materials, the location of the elements at risk, the block shape, and the volume of rocks), express the local characteristics of the area and the spatial rockfall potential. For this reason, their investigation and correlation with the rockfall events are of a high importance for a precise rockfall susceptibility assessment.
2. Materials and Methods
2.1. Study Area
2.1.1. Engineering Geology and Earthquakes
Lefkada is an island in the Ionian Sea in western Greece. It covers about 335 km2 with 117 km of coastline. In terms of the surface geology, it is built by carbonate sedimentary rocks (mainly limestones) that belong to the Ionian and Paxos geotectonic zones [19]. The boundary between the two different zones (Ionian and Paxos) runs through the island, forming the so-called Ionian Thrust. The main part of the island consists of a carbonate sequence of the Ionian zone (Vigla and Pantokratoras limestone sequences), while the SW part of the island consists of the limestones of the Paxos geotectonic zone (Paxos limestone sequence). Detailed field observations on Lefkada [20,21,22,23] showed several active and neotectonic faults striking N-S and NE-SW. The engineering geological conditions of the island were considered, and a simplified multipurpose engineering geological map was compiled at an original scale of 1:25,000. In this map (Figure 1), the geological formations encountered were grouped into six engineering geological units based mainly on their origin and relevant age as well as their generalised engineering behaviour. The major fault traces which have affected the area are also shown on this map, as well as the sites of the recorded landslides and rockfalls that occurred after recent seismic events. The island is characterised by a high seismic activity (highest seismic zone, according to the Greek Seismic Code), which triggers secondary phenomena, such as landslides. The study area is limited by the western slopes of the island, where the steeper slopes prevail (>50°), and it was separated into three individual areas (A, B, and C) considering the three main identified engineering geological units: the Pantokratoras and Vigla limestones of the Ionian geotectonic unit and the Paxos limestones of the Paxos geotectonic unit (Figure 1).
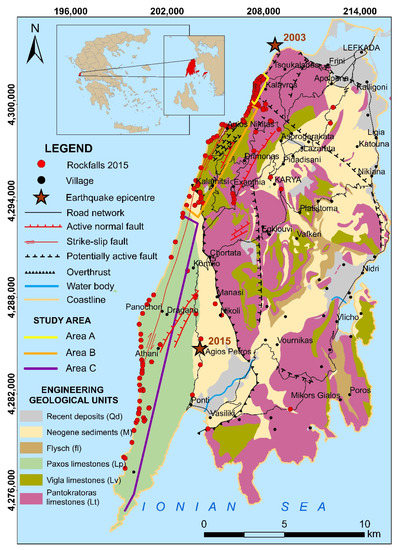
Figure 1.
Simplified engineering geological map of Lefkada island with the study locations (map in Greek Geodetic Reference System—GGRS87).
Lefkada island is characterised by a large earthquake history. In general, the western part of Lefkada presents the highest susceptibility to landslides and rockfalls induced by earthquakes compared with other parts of the island. Many landslide events that occurred in the past on Lefkada island due to earthquakes have been recorded, reported, and analysed in the literature. Particular investigations have been performed (a) on the kinematic evolution of an unprecedented rockfall trajectory in the Ponti area, which concluded that such a trajectory could not have been accurately predicted due to the limitations of the rockfall analysis [24], (b) on the engineering geological conditions of the instabilities that occurred in the Egremnoi and Gyalos areas [25], and (c) on the Okeanos landslide (near the Athani village), which highlighted the importance of the geological study as a prevention and not a mitigation tool for slope failures, especially in the case of the construction of buildings [26].
The most recent strong earthquakes occurred on 14 August 2003 and 17 November 2015. The field observations of the rockfall events included in the current study were derived from the second earthquake. The affected areas are in a good agreement with those which are already recognised as susceptible to rockfalls from the 2003 earthquake [15].
2.1.2. The Earthquake of 14 August 2003
The earthquake of 14 August 2003 (Mw 6.2), (05:14:53.9 GMT) with an epicentre at 38.81°N, 20.56°E, focal depth h = 12 km, occurred in the northern segment of the Cephalonia Transform Fault Zone (CTFZ) [27,28]. The Lefkada segments of the CTFZ have been related to past strong earthquakes (1914, 1948) of a similar size [29]. The CTFZ is a well-known plate boundary with the highest seismicity rate in Greece and it is believed to have been the source of most past large earthquakes in the area [30].
2.1.3. The Earthquake of 17 November 2015
The earthquake of 17 November 2015 occurred 12 years after the 2003 earthquake [31,32] and is the fifth earthquake in a period of 100 years (1914–2015) that provoked severe geo-environmental consequences on and around the Lefkada Island [12,33,34]. A near-vertical strike-slip fault with a dextral sense of motion is responsible for the earthquake of 17 November 2015, (Mw 6.5), (07:10:07 GMT; 09:10 local time) with an epicentre at 38.39° N, 20.35° E, focal depth h = 10.7 km). The fault plane strikes N20 ± 5° E, dips towards the east with an angle of about 70–80°, and is part of the CTFZ [35,36,37,38,39,40]. Furthermore, the 2015 earthquake has been related to a fault trace [23] that runs along the western coast of Lefkada. It is concluded that the 2015 earthquake ruptured the part of the Cephalonia–Lefkada fault that the 2003 earthquake did not [35]. The earthquake caused two fatalities, one in the Ponti village (south of Lefkada island) where a rock block of 2 m3 made a trajectory of about 800 m, which ended in a house and killed a woman [24], and the other was in the Athani village where a fallen wall killed a woman.
2.2. Applied Methodology
A flowchart of the applied methodology is shown in Figure 2. Extended fieldwork was employed just after the earthquake event of 2015, which included a detailed recording of rockfall occurrences accompanied by rock mass engineering geological mapping and the characterisation of the slope exposures.
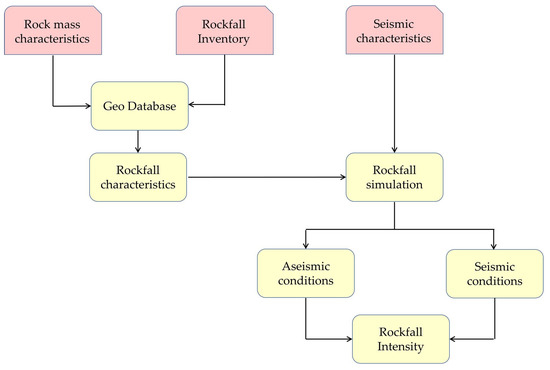
Figure 2.
Flow chart of the applied methodology.
2.2.1. Rock Mass Characteristics
The rock mass mapping additionally included all the suggested quantitative description methods of the discontinuity parameters [41], such as the orientation, number of sets, spacing/frequency, persistence, block size, scale-dependent roughness, wall strength, aperture, filling material, and seepage. Moreover, the rock mass classification was based on the known classification systems GSI [42] and SMR [43,44].
The Pantokratoras rock mass (area A in Figure 1) is a thick-bedded fractured Triassic limestone formation, with a low vegetation and karst voids in some places. On some of the slopes, the limestones appear to either be very fractured or mylonitised due to the tectonic activity, thus the geomechanical behaviour is reduced and the slopes are susceptible to failures (rockfalls and rockslides), especially under dynamic conditions, such as earthquakes. Three to four major discontinuity sets intersect the rock mass. The Vigla rock mass (area B in Figure 1) is a thin-bedded (bed thickness 5–30 cm) fractured Jurassic limestone formation with a dense low vegetation. It is strongly fragmented to a mylonitised formation in places, due to the tectonic activity, and thus a decreased geomechanical behaviour appears that results in slope stability issues (rockfalls and rockslides), especially under dynamic conditions (e.g., earthquakes). The slope rock mass is intersected by three to four major discontinuity sets in places. In the southern slopes of the island, the Paxos rock mass is a Cretaceous to Eocene limestone (area C in Figure 1), with very disintegrated and almost powdered formations, to such a high extent that discontinuity measurements were not possible to be taken.
The block size has been defined by the International Society for Rock Mechanics and Rock Engineering as a critical parameter controlling the rock mass behaviour [41]. The rock failures are highly affected by the spatial distribution and the natural variability in the individual rock blocks. Specifically, the rockfall intensity is determined by the volume and velocity of the detachable blocks [45]. The rock block volumes for each of the three rock masses were evaluated in two ways: estimated in situ by measuring the dimensions of the fallen boulders, and analytically calculated through literature-based equations [46,47,48,49]. Statistical distribution analysis was employed for both the in situ estimated and calculated volumes for the determination of the most representative for the later rockfall analysis [50].
2.2.2. Rockfall Inventory
Mapping the rock block distribution of past or recent rockfalls in a studied area is the best tool for the selection of the most representative rockfall characteristics (the block volume, trajectory, etc.) for the respective simulations. Previous studies in other areas have noticed that the mapping of the rock block volumes is crucial for hazard analysis [51,52]. After the 2015 earthquake that struck the island of Lefkada, complete fieldwork was employed in the study area (Figure 3).
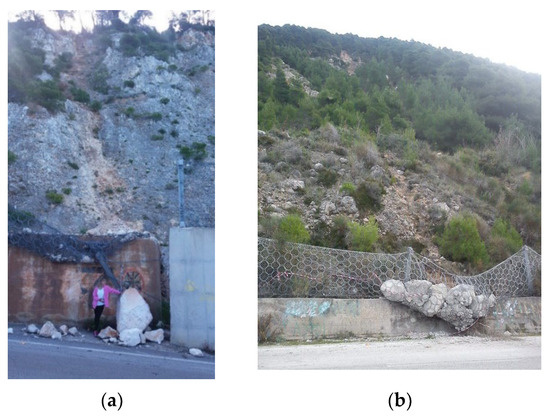
Figure 3.
View of fallen rock blocks in areas A (a) and B (b) induced by the 2015 earthquake (photos taken on 19 November 2015).
The main information sources for the rockfall and rockslide identification were (a) direct fieldwork, (b) remote sensing using Google Earth tools of historical image visualisation, and (c) newspapers and technical reports for the period 1973–2003. In the end, 137 rockfall and rockslide occurrences were identified for the period 1973–2015 and imported into the existing database “Landslide Management System of Western Greece” compiled by the Laboratory of Engineering Geology, the University of Patras [53]. This system includes data fields that, especially for rockfalls, refer to the site and trajectory coordinates, quantitative description of the discontinuities, rock mass classification, slope geometry, detached boulder volumes, etc. The 137 recordings were identified in situ after the earthquake of 2015 and their history was obtained from other sources, up to 1973, to confirm if rockfalls have occurred in the past in the same locations.
Most rock slope failures were recorded on the western steep slopes of the island with a cut-off slope gradient greater than 45°. Figure 4a–c represents the resulting rockfall inventory maps of areas A, B, and C on the island of Lefkada for the slope failures that occurred after the earthquake of 2015. The inventory maps were compiled on the slope terrain of the area which was created through the DEM of National Cadastre with a cell size of 5 × 5 m. During the fieldwork, GPS measurements were taken in order to define the exact position of each observed slope failure.
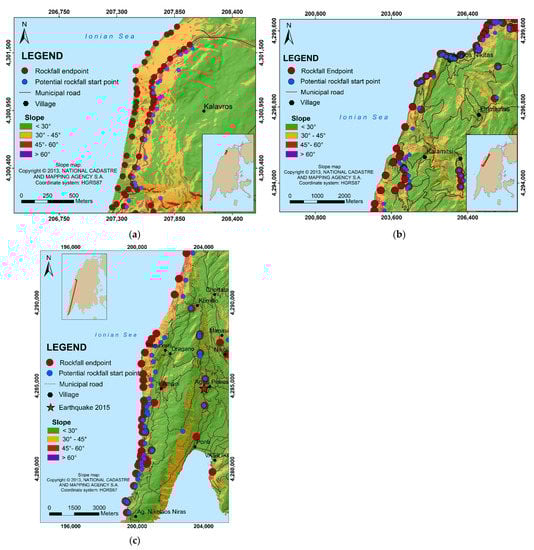
Figure 4.
Rockfall Inventory maps on the island of Lefkada for (a) area A, (b) area B, (c) area C (map in the Greek Geodetic Reference System—GGRS87).
2.2.3. Rockfall Simulation
The rockfall trajectographic analysis or the energy dissipation during the rockfall is controlled by the geometry and geomechanical characteristics of the slope and the detached blocks [52,54,55,56]. In particular, the engineering geological characteristics of the slope rock mass, which are expressed through the coefficients of restitution, are the crucial parameters that show the energy dissipation during the rockfall. Additionally, the initial conditions of the rock block are of a high importance, specifically the rock block volume and the initial velocity. In the present study, the initial velocity was considered as the peak ground velocity (PGV) from the earthquakes of 2003 and 2015, which was topographical amplified. Two separate sets of rockfall analyses were employed by importing the topographical amplified PGV into the rockfall simulation model.
The initial horizontal velocity of the block, at the time of detachment, was calculated based on the empirical Equation (1) [57]. It was used for the two recent strong earthquakes in Lefkada island in 2003 and 2015.
where is the earthquake magnitude, R is the epicentral distance (km), is the mean focal depth, which is considered to be 7 km for the Greek data, is the variable related to the fault mechanism effect, and is the variable related to the local conditions. The vertical component of the peak ground velocity (PGV) is assumed to be zero for the rockfall analyses.
The calculated peak ground acceleration (PGA) on the slope base (PGAb) is affected by topography [58] and is thus modified according to the following equation to obtain the respective acceleration in the slope crest (PGAcr):
Due to the proportional relationship between the velocity and acceleration, it was assumed that Equation (2) could be used for the PGV too, so Equation (2) is transformed as:
In the ArcGIS environment, the distance between the earthquake epicentre and each site was calculated from the centroid of each polygon to the epicentre point (Figure 5).
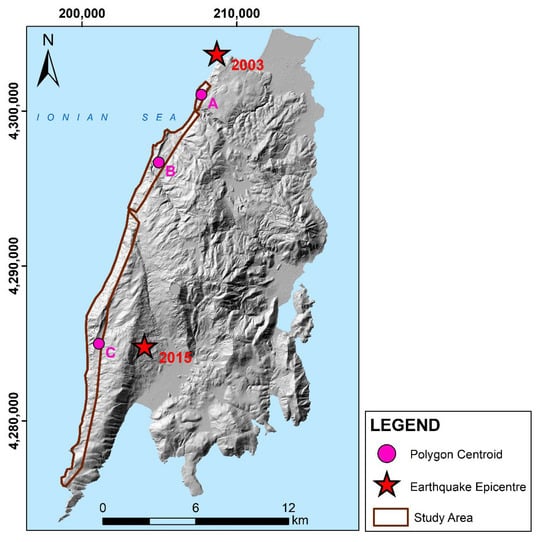
Figure 5.
Epicentre locations of the recent strong earthquakes in the Lefkada island and polygons centroids for the distance calculation (the limits of the map correspond to the GGRS87).
Two-dimensional (2D) trajectographic analyses and simulations were performed in the selected cross-sections of the existing digital elevation model (DEM) derived by the Hellenic Cadastre and Mapping Agency, through the well-known 2D RocFall software (Rocscience Inc., 54 St Patrick Street, Toronto, ON M5T 1V1, Canada). Using this code, the falling boulder’s characteristics, such as the kinetic energy distribution, velocity, bounce height, as well as the run-out distance along the specified slope profile, can be estimated. The most critical input parameters that can be obtained through engineering geological appraisals controlling the rockfall simulation are the restitution coefficients of the materials outcropping on the slope and the selected rock block (falling bounder) volume.
The restitution coefficients are expressed as the ratio between the post-impact and pre-impact velocities, subdivided into the components of tangential (Rt) and normal (Rn) coefficients, respectively, to the slope [59]. Initially, the coefficients of restitution were determined based on the field observations and back analyses on the representative real trajectories recorded in the inventory, which were then calibrated according to the “Ana-rock” named algorithm developed in the Laboratory of Engineering Geology of Patras University [60].
The rockfall analyses were employed by adopting the “reach angle” empirical model, which takes into account that the fallen rock block is connected with the rockfall source [11]. The in-situ mapping of the rockfall trajectories (potential initial point, endpoints, etc.), observation of the fallen rock block characteristics, and engineering geological mapping constitute the basis of the analysis. By using the DEM of the Hellenic Cadastre 2013, with a cell size of 5 × 5 m, cross-sections were designed for each study area, with a sampling density to achieve the most possible accuracy. For area A, eight cross-sections were designed (per 250 m distance and 155 to 355 m long), which start from the steeper slope angle, cross the municipal road, and end in the sea. For area B, 25 cross-sections were designed (per 250 m distance and 100 to 650 m long), while 33 were designed for site C (per 500 m distance and 350 to 850 m long). All off the cross-section locations are shown in Figure 6.
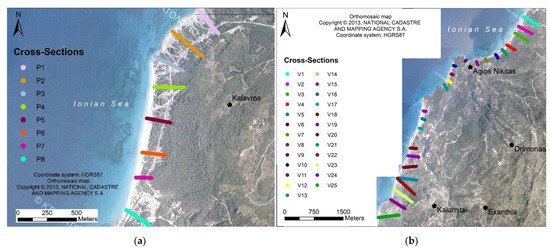
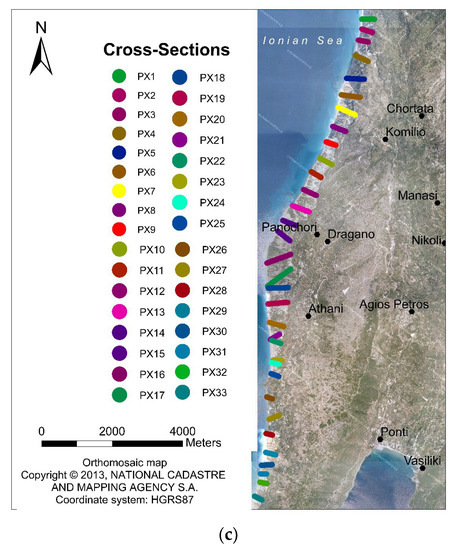
Figure 6.
Location of the cross-sections (trajectories) for rockfall simulation in areas (a–c).
2.2.4. Rockfall Intensity
The rockfall intensity is expressed in terms of the rockfall kinetic energy along the rockfall trajectory. The kinetic energy values were derived by the rockfall simulations, considering the representative rock block volume detached from each rock mass, as well as the different initial conditions each time. The rockfall susceptibility mapping that is later presented was employed by combining two software codes. More specifically, the results of the rockfall kinetic energy were exported from the Rocfall software and imported into the ArcMap 10.8 (ESRI, educational version (released: 2020) provided by University of Patras, Patras, Greece) environment for the maximum kinetic energy values to be interpolated. From the interpolation procedure, a raster file was produced with rated DEM units of a cell size of 5 × 5 m in terms of the kinetic energy. The interpolations were conducted using geostatistical principles. Specifically, the Empirical Bayesian Kriging (ΕΒΚ) geostatistical interpolation method was selected for the spatial interpolation of the kinetic energy values. The advantages of this interpolation method are that (a) it considers the uncertainty in semivariogram estimation, (b) the standard errors of prediction are more accurate than other kriging methods, and (c) has a higher accuracy than other kriging methods for small datasets [61].
Theoretical Framework of Rockfall Kinetic Energy
The kinematic analysis of the rockfall phenomenon is a crucial step for understanding the phenomenon and dealing with it. Especially, the knowledge of the rockfall trajectory and rockfall kinetic energy distribution constitutes the key information for the interpretation of the phenomenon [62]. In the international literature, many studies emphasise the kinematic analyses of the rock slopes and especially the rockfall parameters (the kinetic energy, horizontal location of the endpoints, bounce height, and velocity of the rocks) [63]. A typical rockfall trajectory along the slope is described in Figure 7 in the case that the rock block has an initial velocity and in the case that it has no initial velocity. The initial mechanical energy is derived by the sum of the dynamic (due to the position) and kinetic energy (due to the velocity) of the rock block.
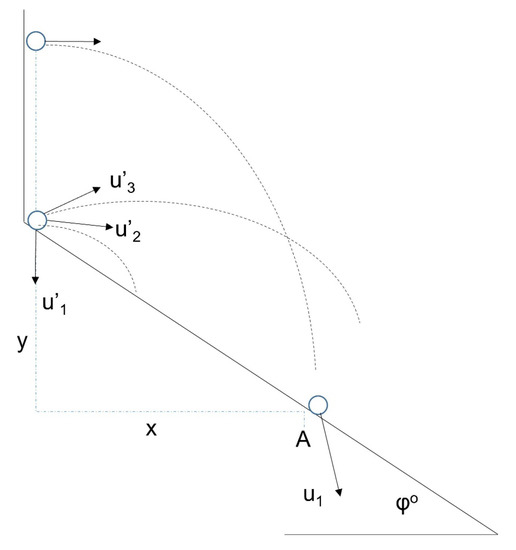
Figure 7.
Theoretical scheme of rock block motion with an initial velocity and with zero initial velocity.
In the case that the rock block has no initial velocity, the rock block motion is described by Equations (4) and (5). The balance of the energies can be expressed by Equation (4):
where is the initial mechanical energy, is the initial kinetic energy, is the initial dynamic energy, m is the mass of the rock block, g is the gravity acceleration, y is the vertical displacement, and is the initial velocity. The balance of energies can be obtained by the following equation:
where is the mechanical energy in the impact point A, is the kinetic energy in point A, is the dynamic energy in point A, and is the velocity in point A. The initial mechanical energy is greater than the final one because of the energy dissipation due to the slope friction angle (Equation (6)).
In the case that the rock block has obtained the initial velocity, the rock block motion is described by Equations (7) and (8). The initial mechanical energy is described as follows:
where is the initial kinetic energy, is the initial dynamic energy, and is the initial velocity. The mechanical energy in the impact point A:
where is the kinetic energy in point A, is the dynamic energy in point A, and is the velocity in point A.
Considering that the air resistance is negligible, the initial mechanical energy is equal to the final mechanical energy in the impact point A:
The comparison of the velocities is expressed by comparing Equations (6) and (9), as follows:
3. Results and Discussion
3.1. Determination of the Representative Rock Block Volume
Table 1 presents the characterisation parameters of the studied rock masses as well as the respective calculated and in situ rock block volumes, which were obtained from the constructed database. One of the most important parameters that give information for the potential rock block volumes that could be detached is the spacing among the discontinuities. The geometric mean spacing (Sm-geom) was calculated based on the equation proposed by the author of [49] because it has been proved that it best represents the potential rock block volume detachment among the arithmetic mean spacing (Sm-arithm) and the volumetric joint count (Jv). The volumetric joint count was calculated based on the equations proposed by the literature [46,47,48]. The discontinuities’ spacing values of the Pantokratoras and Vigla rock masses show that the potential block volumes are larger compared with the Paxos rock mass. The Jv values declare strong disintegrated rock masses and rock blocks from small (Pantokratoras limestones) to very small (Vigla and Paxos limestones). The joint roughness coefficient (JRC) also constitutes a crucial parameter for the understanding of the discontinuities’ shear strength. The JRC evaluation was employed in situ by using the typical roughness profiles [64]. The discontinuities of the Pantokratoras and Vigla rock masses present medium conditions of roughness, whereas the Paxos discontinuities present a lower roughness, which declares a comparatively lower shear strength and slopes which are more susceptible to failures. The joint compression strength (JCS) parameter was assessed in the field through in situ uniaxial compression tests with a Schmidt hammer, to determine the rebound value of the discontinuities’ wall surface. The average Schmidt hammer values (SHV) for the three limestones were measured in the following ranges: 45–50 (Pantokratoras), 40–45 (Vigla), and 30–35 (Paxos). Assuming that the limestone density is 26 kN/m3 and by using the nomogram of Deere [65], the joint compressive strength was indirectly calculated.

Table 1.
Typical range of rock mass characterisation and classification of the studied sites.
The in situ GSI rock mass classification showed that the Pantokratoras rock mass is very blocky and intersected by three or more discontinuity sets, with weathered surfaces. The Vigla rock mass quality varies in places, with a very blocky condition, and moderately to highly weathered discontinuity surfaces. The Paxos rock mass is presented as disturbed and with highly weathered surfaces. The SMR values of the Pantokratoras rock mass show a very bad to bad quality, while the slopes are characterised in places, as completely unstable to unstable. The Vigla and Paxos rock masses belong to the same rating class of “bad”, while the slopes are characterised as unstable too.
Different analytical calculations were elaborated for the three and four discontinuity sets for each rock mass, not considering the shape factor of the rock block (Vcalc1) and considering it (Vcalc2). The former calculation is based on the mean spacing of the discontinuities, while the latter calculation is based on the volumetric joint count. It is observed that the former calculation derives bigger volumes in the Pantokratoras and Vigla rock mass, whereas the Paxos rock mass does not. This is interpreted by the fact that, as the rock mass is more disintegrated, the shape factor does not play a crucial role.
Finally, as shown in Table 1, the estimated mean block volumes (Vcalc1 and Vcalc2) using in situ discontinuity measurements and analytical calculations are “very small” and rather justify the rock flow instability phenomena than the rockfalls.
Direct fieldwork just after the 2015 earthquake event allowed for accurate in situ measurements on the detached boulders in regard to their dimensions, volumes, as well as their exact trajectories. To determine the most representative rock block volume for the rockfall analyses, statistical distribution analyses were employed on the recorded boulders of the 137 sites. The statistical analyses were employed in the IBM SPSS Statistics 27 software (educational version provided by the University of Patras, Greece). The results are presented in Figure 8 and summarised in Table 2, with the mean volumes of the detached boulders that ranged from 0.045 to 1.26 m3 for the three studied limestone units. However, the selection of the volume with the highest frequency was considered to be a safer choice for the rockfall mitigation measures. The Pantokratoras samples present the highest frequency between the histograms of 1.3–1.5 and 1.6–1.7 m3. To cover the worst-case scenario, the mean value of the histogram 1.6–1.7 m3 was selected, so 1.65 m3 was determined as the most representative volume. The rock blocks belonging to the class of 0.20–0.30 m3 are more frequent of the total Vigla samples, and the mean value of 0.25 m3 was selected, while the higher frequency for the Paxos limestones is observed in between the 0.04 and 0.05 m3, and the mean value of 0.045 m3 was selected. From the histograms of Figure 8, it is observed that the distribution of the blocks is not normal because of the non-uniformity that characterises the recorded block volumes. Especially in Figure 8a, the rock volumes are large and have different sizes. The same condition is observed in Figure 8b, whereas in Figure 8c the rock volumes are more uniform due to the smaller volumes of the recorded blocks.
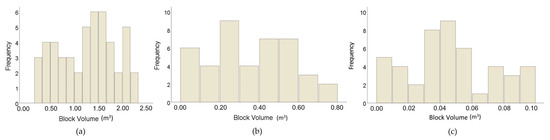
Figure 8.
Rock block volume frequency histograms for the limestone rock masses of (a) Pantokratoras, (b) Vigla, and (c) Paxos.
Table 2.
Results of the statistical distribution tests in (m3).
A comparative assessment of the rock block volume distribution through their respective cumulative curves showed the critical volume thresholds for each rock mass. Particularly, 65% of the Pantokratoras sample is smaller than 1.65 m3, while 35% of the Vigla sample is smaller than 0.25 m3, and 45% of the Paxos sample is smaller than 0.045 m3 (Figure 9). The remaining percentages (35%, 65%, and 55%, respectively) constitute the limitation of this approach, as some bigger volumes are not considered in the rockfall analyses. Furthermore, the cumulative distribution curves show the volume range of each sample. The shape of the cumulative distribution function of the Gaussian (normal) distribution is S-shaped. If a distribution is normal, then the values of the mean, median, and mode are the same. However, the value of the mean, median, and mode may be different if the distribution is not normal. The cumulative distribution curves of the Lefkada limestones are composite with a non-uniform shape up to 30% and an almost uniform shape from 30% to 100% of the cumulative rock volume. This is an expected distribution because it is very common to measure rocks with different sizes and volumes in the field, since all rock masses are a discontinuous solid medium disrupted by different geological discontinuities; thus, they generate rocks of a different size and volume. In addition, a distinct volume difference is observed among the rock masses, and this is justified also by the rock mass characterisation and classification that was employed.
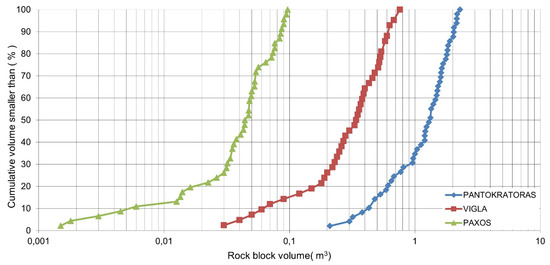
Figure 9.
Cumulative distribution of in situ recorded rock block volumes.
The results obtained from the rock block analytical calculations represent the rock mass potential volumes that could be detached from the slope. However, in the frame of this work, there are two limitations regarding the discontinuity measurements: (a) they were taken in the slope base, whereas the real rock blocks were detached from higher slopes, where the rock mass is probably in a better condition (as it has been confirmed by the detached block), and (b) in some sites the measurements were not able to be taken due to highly weathered surfaces or due to the non-accessible sites. Regarding the in situ estimated rock block volumes recorded in the database, bigger volumes were observed compared with the calculated ones. Based on the previous data, the in situ estimated volumes were determined as being more suitable for the rockfall analysis.
3.2. Estimation of Rockfall Restitution Coefficients
The coefficients of restitution were determined for all the limestones in their different physical conditions; bare limestones without vegetation, limestones covered with vegetation, talus cover, and talus cover with vegetation. In order to make the trajectories simulations more realistic, the bare limestones’ coefficients of restitution, which constitute the detached rock blocks, were adjusted based on the “Ana-rock” algorithm [59]. The algorithm considers the kinematic behaviour of the rockfall trajectory (e.g., the angular velocity and angular momentum) and considers the intermediate impact points with the ground on the slope, whereas through a back analysis, only the first and the last ones are considered. Table 3 presents the coefficients finally determined.
Table 3.
Calibrated coefficients of restitution for each slope material.
3.3. Initial Rock Block Velocity
The earthquake parameters used for the ground velocity calculations are presented in Table 4, while the calculated peak ground velocity (the horizontal initial velocity) for each earthquake is presented in Table 5. The calculated PGVb values were recalculated by adding to this the positive standard deviation to cover the worst-case scenario with the higher rock block initial velocity. In turn, the derived value was amplified due to topography according to Equation (3).
Table 4.
Earthquake parameters of the two earthquakes discussed in this work.
Table 5.
Peak ground velocity values for each area and earthquake.
3.4. Rockfall Intensity in Aseismic and Seismic Conditions
During the collision process, the kinetic energy of the rock block, when it impacts the ground, for a defined rock mass is always higher when the block has obtained the initial velocity compared with the block that has not [66,67]. In the case of the block with an initial velocity, the maximum impact force is increased and, consequently, the rockfall intensity and the degree of damage also increases in its first impact. In the frame of this work, the rockfall intensity was investigated through rockfall simulations by adopting two case scenarios; (a) the rock block without an initial velocity (Vo = 0 m/s) and (b) the rock block with the initial velocity acquired from the two recent strong earthquakes (Vo = PGV). The results derived kinetic energy distribution values along the trajectories which were used in turn for the susceptibility mapping. More specifically, the kinetic energy spatial distribution maps were derived from the spatial interpolation of the maximum kinetic energy values produced by the rockfall simulations.
Figure 10, Figure 11 and Figure 12 present the spatial distribution of rock block kinetic energy for areas A, B, and C, respectively. The kinetic energy classes were determined based on the statistical distribution of the values for each area. Changes are observed in the spatial distribution, in places, which show a varied increasing or decreasing trend of the kinetic energy when the block has an initial velocity induced by the earthquake events compared with the respective places of a zero initial velocity (no earthquake event). It is worth noticing that the combination of the movements is different for each case and, consequently, the impact points with the ground are different too. Particularly, a rock block with a zero initial velocity means that it starts moving by free fall, whereas with an initial velocity, it starts like a shot. In the case of a free fall, the impact points are fewer than in the shot, meaning that the kinetic energy dissipation occurs more slowly, as it is depicted in the maps. Considering a point-to-point comparison, and the fact that the trajectories are different, the point where the block is above the slope in the air (the zero initial velocity) could be an impact point in the other trajectory.
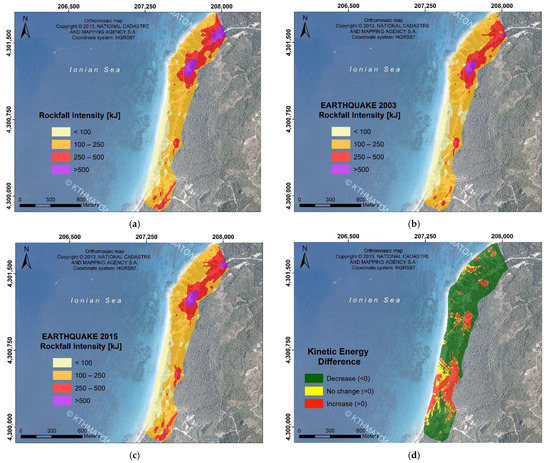
Figure 10.
Rockfall intensity maps of area A, with (a) Vo = 0, (b) Vo = 0.80 m/s, (c) Vo = 0.65 m/s, and (d) difference in the kinetic energy distribution between (a and b).
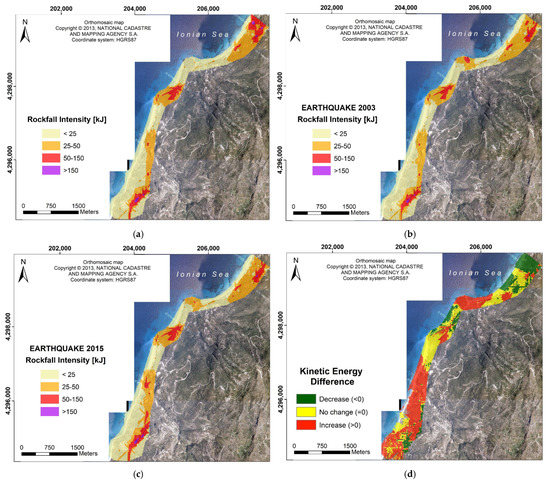
Figure 11.
Rockfall intensity maps of area B, with (a) Vo = 0, (b) Vo = 0.69 m/s, (c) Vo = 0.72 m/s, and (d) difference in the kinetic energy distribution between (a and c).
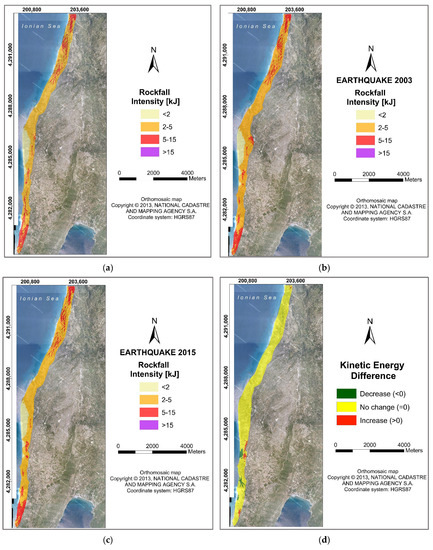
Figure 12.
Rockfall intensity maps of area C, with (a) Vo = 0, (b) Vo = 0.57 m/s, (c) Vo = 1.18 m/s, and (d) difference in the kinetic energy distribution between (a and c).
In Figure 10, the spatial distribution of the maximum kinetic energy for the Pantokratoras rock blocks along their trajectories is presented with zero initial velocity (a) and with the initial velocity obtained from the two earthquakes (b and c), which corresponds to the respective peak ground velocity (PGVcr) of Table 5. Due to the highest proximity of the epicentre of the 2003 earthquake to area A, the initial velocity (PGVcr) of this earthquake has more of an effect on the phenomenon, so it was selected for the comparison of the two cases. The map of Figure 10d is derived from the subtraction of the two kinetic energy maps: the map with zero initial velocity, Vo = 0 m/s (a) by the map with an initial velocity Vo = 0.80 m/s (b). The resulting new map shows that the initial rock block velocity increased the rockfall intensity in places (red colour), while the areas with a yellow colour show that the kinetic energy was not affected by the initial velocity. The areas with a green colour which are larger than the red and yellow areas show that the kinetic energy was higher in the case of zero initial velocity, and factors like the slope angle, the slope material, and rock weathering acted in combination, favouring the free fall of the rock versus other movement types.
The intensity maps for area B are presented in Figure 11, where the kinetic energy classes are quite different compared with area A. Area B is almost in the middle distance between the two earthquake epicentres, and the velocity values are very close. However, the higher velocity from the 2015 earthquake (PGVcr of Table 5) was evaluated as being more effective compared with the scenario of zero initial velocity. The map of the kinetic energy difference in Figure 11d shows that most of the B area was affected mostly by the initial rock block velocity of the earthquake event and the respective rockfall total kinetic energy increased along the trajectories when compared with the scenario of zero initial velocity. There is also quite a large area (with yellow colour in Figure 11d) that had no change in terms of the difference in the kinetic energy among the two scenarios.
Figure 12 shows the kinetic energy distribution maps along the Paxos limestone slopes where the values of the kinetic energy are quite small compared with the two previous cases. Area C is very close to the epicentre of the 2015 earthquake and the highest initial rock block velocity is observed (1.18 m/s) among the three areas. This value was evaluated as being more effective compared with the scenario of zero initial velocity. However, the spatial distribution of the rockfall kinetic energy is depicted almost the same as in the case of zero initial velocity. Although the initial rock block velocity constitutes a crucial factor for the kinetic energy distribution, the rock block volumes in this area are so small that the differences are negligible (Figure 12d). The phenomenon could be characterised as a complex type, including rockfalls and rockslides simultaneously.
The results obtained from the rockfall analyses and in turn from the respective rockfall intensity are very important for rockfall monitoring and a susceptibility assessment in seismic regions since the site-specific characteristics and the seismic parameters are thoroughly examined. The techniques followed in this research could be performed in other seismic regions too for rockfall mitigation planning. Finally, the present research aims to be extended with 3D rockfall simulations to derive comparative conclusions between 2D and 3D simulations, as well as the respective difference in rockfall intensity distributions.
4. Conclusions
The rockfall susceptibility of the western limestone slopes of Lefkada island in western Greece was assessed by combining a deterministic and a probabilistic approach. The former included rockfall simulations and trajectographic analyses through the Rocfall software and the “Ana-rock” algorithm, whereas the latter included the spatial geostatistical interpolation of the kinetic energy values, so the spatial distribution could be elaborated for sites where no data were available.
This study showed the significance of incorporating the engineering geological parameters in the rockfall analyses, as well as the initial conditions of the unstable rock blocks (the volume, initial velocity, height, and slope angle in the start point). One of the most crucial steps of the engineering geological investigation is the volume and shape assessment of the unstable rock blocks or the rock blocks observed in the slope exposures after a rockfall event. Although the rock mass quality evaluation gives a certain aspect about the potential rock block volumes that could be detached, the in situ observed rock block volumes were determined as being more reliable to be used as representative ones for the rockfall analysis. This is interpreted by the fact that the in-situ block volumes were derived after an earthquake event which constitutes a real event, whereas the calculated volumes include more uncertainties, especially concerning the measurements of the discontinuities’ properties. Particularly, the discontinuities’ measurements were taken at the slope base, whereas the rock blocks started from the higher elevation points, at the slope crest, where the limestone blocks are clean, in a better condition, and are not covered by scree. In this context, the representative block volume for each area was determined as 1.65 m3 for area A, 0.25 m3 for area B, and 0.045 m3 for area C. The three investigated rock masses present quite a different behaviour in the rockfall simulations, and this is depicted by the classification of the kinetic energy values in the intensity maps (the susceptibility).
The consideration of the horizontal initial rock block velocity in the initial conditions of the rockfall analysis proved to be essential for the susceptibility assessment, as it quantifies the triggering factor of the rockfall. The initial velocity seems to be a considerable shaping factor of the rockfall trajectory. The results show that the earthquake ground velocity generally leads to a fluctuating change in the peak kinetic energy values compared with the scenario of zero ground velocity. The fluctuations are attributed a) to the rock block condition and b) to the complex behaviour of the slope characteristics (alterations of the slope material and slope angle).
In this work, the spatial distribution of the maximum rockfall kinetic energy is considered as the final susceptibility map for the area, as it incorporates all the significant parameters. Furthermore, the comparison of the two case scenarios (with an initial seismic velocity and with a zero velocity), showed the fluctuations in the kinetic energy values. In particular, the kinetic energy in the case of the initial seismic velocity is in places increased, decreased, or remains the same depending on the configuration of the rockfall trajectory. The type of movement changes depending on the measure of the initial velocity; the larger the velocity is, the longer the shot of the rock that will follow will be. It should be considered that rockfall simulations include random trajectories to some extent, so the results of the kinetic energy may vary. Minimising this type of uncertainty could be a future challenge for pertinent research.
This study was greatly based on fieldwork, which is still considered to be the most crucial part of a rockfall investigation, whether there are new technologies available or not. Undoubtedly, technological development gives more tools that enhance the work of geologists, but they should always be used complementarily to fieldwork.
Author Contributions
Conceptualization, A.S., N.D. and N.S.; methodology, A.S., N.V., N.D. and N.S.; software, A.S. and N.V.; validation, N.D., N.S., E.S. and Z.R.; formal analysis, A.S., N.D. and N.S.; investigation, A.S.; resources, N.D. and N.S.; data curation, N.D., N.S., E.S. and Z.R.; writing—original draft preparation, A.S.; writing—review and editing, N.D., N.S., E.S. and Z.R.; visualization, A.S.; supervision, N.D., N.S. and E.S.; project administration, N.D. and N.S. All authors have read and agreed to the published version of the manuscript.
Funding
This research received no external funding.
Institutional Review Board Statement
Not applicable.
Informed Consent Statement
Not applicable.
Data Availability Statement
The data used to support the findings of this study are available from the corresponding author upon reasonable request.
Conflicts of Interest
The authors declare no conflict of interest.
References
- Varnes, D.J. Slope Movement Types and Processes. In Special Report 176: LAndslides: Analysis and Contro; Schuster, R.L., Krizek, R.J., Eds.; TRB, National Research Council: Washington, DC, USA, 1978; pp. 11–33. [Google Scholar]
- Ferrari, F.; Giacomini, A.; Thoeni, K. Qualitative Rockfall Hazard Assessment: A Comprehensive Review of Current Practices. Rock Mech. Rock Eng. 2016, 49, 2865–2922. [Google Scholar] [CrossRef]
- Lateltin, O.; Haemmig, C.; Raetzo, H.; Bonnard, C. Landslide Risk Management in Switzerland. Landslides 2005, 2, 313–320. [Google Scholar] [CrossRef]
- Ferrari, F.; Giacomini, A.; Thoeni, K.; Lambert, C. Qualitative Evolving Rockfall Hazard Assessment for Highwalls. Int. J. Rock Mech. Min. Sci. 2017, 98, 88–101. [Google Scholar] [CrossRef]
- Saroglou, H.; Marinos, V.; Marinos, P.; Tsiambaos, G. Rockfall Hazard and Risk Assessment: An Example from a High Promontory at the Historical Site of Monemvasia, Greece. Nat. Hazards Earth Syst. Sci. 2012, 12, 1823–1836. [Google Scholar] [CrossRef]
- Depountis, N.; Nikolakopoulos, K.; Kavoura, K.; Sabatakakis, N. Description of a GIS-Based Rockfall Hazard Assessment Methodology and Its Application in Mountainous Sites. Bull. Eng. Geol. Environ. 2020, 79, 645–658. [Google Scholar] [CrossRef]
- Asteriou, P.; Saroglou, H.; Tsiambaos, G. Geotechnical and Kinematic Parameters Affecting the Coefficients of Restitution for Rock Fall Analysis. Int. J. Rock Mech. Min. Sci. 2012, 54, 103–113. [Google Scholar] [CrossRef]
- Ulamış, K.; Kılıç, R. Combined Instability Assessment and Rockfall Hazard in Volcanic Rocks (Keçiören, Ankara). Arab. J. Geosci. 2020, 13, 349. [Google Scholar] [CrossRef]
- Brabb, E.E. Innovative Approaches to Landslide Hazard Mapping. In Proceedings of the 4th International Symposium on Landslides, Toronto, ON, Canada, 16 September 1984; Volume 1, pp. 307–324. [Google Scholar]
- Fell, R.; Corominas, J.; Bonnard, C.; Cascini, L.; Leroi, E.; Savage, W.Z. Guidelines for Landslide Susceptibility, Hazard and Risk Zoning for Land-Use Planning. Eng. Geol. 2008, 102, 99–111. [Google Scholar] [CrossRef]
- Antoniou, A.A.; Lekkas, E. Rockfall Susceptibility Map for Athinios Port, Santorini Island, Greece. Geomorphology 2010, 118, 152–166. [Google Scholar] [CrossRef]
- Papathanassiou, G.; Pavlides, S.; Ganas, A. The 2003 Lefkada Earthquake: Field Observations and Preliminary Microzonation Map Based on Liquefaction Potential Index for the Town of Lefkada. Eng. Geol. 2005, 82, 12–31. [Google Scholar] [CrossRef]
- Zekkos, D.; Clark, M.; Cowell, K.; Medwedeff, W.; Manousakis, J.; Saroglou, H.; Tsiambaos, G. Satellite and UAV-Enabled Mapping of Landslides Caused by the November 17th 2015 Mw 6.5 Lefkada Earthquake. In Proceedings of the 19th International Conference on Soil Mechanics and Geotechnical Engineering, Seoul, Republic of Korea, 17–21 September 2017; pp. 2235–2238. [Google Scholar]
- Tsangaratos, P.; Loupasakis, C.; Nikolakopoulos, K.; Angelitsa, V.; Ilia, I. Developing a Landslide Susceptibility Map Based on Remote Sensing, Fuzzy Logic and Expert Knowledge of the Island of Lefkada, Greece. Environ. Earth Sci. 2018, 77, 363. [Google Scholar] [CrossRef]
- Papathanassiou, G.; Valkaniotis, S.; Ganas, A.; Pavlides, S. GIS-Based Statistical Analysis of the Spatial Distribution of Earthquake-Induced Landslides in the Island of Lefkada, Ionian Islands, Greece. Landslides 2013, 10, 771–783. [Google Scholar] [CrossRef]
- Polykretis, C.; Kalogeropoulos, K.; Andreopoulos, P.; Faka, A.; Tsatsaris, A.; Chalkias, C. Comparison of Statistical Analysis Models for Susceptibility Assessment of Earthquake-Triggered Landslides: A Case Study from 2015 Earthquake in Lefkada Island. Geosciences 2019, 9, 350. [Google Scholar] [CrossRef]
- Keefer, D.K. Rock Avalanches Caused by Earthquakes: Source Characteristics. Science 1984, 223, 1288–1290. [Google Scholar] [CrossRef] [PubMed]
- Saroglou, C. GIS-Based Rockfall Susceptibility Zoning in Greece. Geosciences 2019, 9, 163. [Google Scholar] [CrossRef]
- Koukouvelas, I. Geology of Greece; Liberal Books: Athens, Greece, 2019; ISBN 978-618-5012-40-3. [Google Scholar]
- Bornovas, J.; Rontogianni-Tsiabaou, T. Geological Map of Greece; Institute of Geology and Mineral Exploration: Athens, Greece, 1983. [Google Scholar]
- Cushing, E.M. Structural Evolution of the Greek Northwestern Margin on the Island of Lefkas and Its Surroundings (Northwestern Greece). Ph.D. Thesis, Université de Paris-Sud, Orsay, France, 1985. [Google Scholar]
- Lekkas, E.; Danamos, G.D.; Lozios, S.G. Neotectonic Structure and Evolution of Lefkada Island. Bull. Geol. Soc. Greece 2001, 34, 157–163. [Google Scholar] [CrossRef]
- Rondoyanni, T.; Sakellariou, M.; Baskoutas, J.; Christodoulou, N. Evaluation of Active Faulting and Earthquake Secondary Effects in Lefkada Island, Ionian Sea, Greece: An Overview. Nat. Hazards 2012, 61, 843–860. [Google Scholar] [CrossRef]
- Saroglou, C.; Asteriou, P.; Zekkos, D.; Tsiambaos, G.; Clark, M.; Manousakis, J. UAV-Based Mapping, Back Analysis and Trajectory Modeling of a Coseismic Rockfall in Lefkada Island, Greece. Nat. Hazards Earth Syst. Sci. 2018, 18, 321–333. [Google Scholar] [CrossRef]
- Grendas, N.; Marinos, V.; Papathanassiou, G.; Ganas, A.; Valkaniotis, S. Engineering Geological Mapping of Earthquake-Induced Landslides in South Lefkada Island, Greece: Evaluation of the Type and Characteristics of the Slope Failures. Environ. Earth Sci. 2018, 77, 425. [Google Scholar] [CrossRef]
- Valkaniotis, S.; Papathanassiou, G.; Ganas, A. Mapping an Earthquake-Induced Landslide Based on UAV Imagery; Case Study of the 2015 Okeanos Landslide, Lefkada, Greece. Eng. Geol. 2018, 245, 141–152. [Google Scholar] [CrossRef]
- Karakostas, V.G. Properties of the 2003 Lefkada, Ionian Islands, Greece, Earthquake Seismic Sequence and Seismicity Triggering. Bull. Seismol. Soc. Am. 2004, 94, 1976–1981. [Google Scholar] [CrossRef]
- Zahradnik, J.; Serpetsidaki, A.; Sokos, E.; Tselentis, G.-A. Iterative Deconvolution of Regional Waveforms and a Double-Event Interpretation of the 2003 Lefkada Earthquake, Greece. Bull. Seismol. Soc. Am. 2005, 95, 159–172. [Google Scholar] [CrossRef]
- Louvari, E.; Kiratzi, A.A.; Papazachos, B.C. The Cephalonia Transform Fault and Its Extension to Western Lefkada Island (Greece). Tectonophysics 1999, 308, 223–236. [Google Scholar] [CrossRef]
- Scordilis, E.M.; Karakaisis, G.F.; Karacostas, B.G.; Panagiotopoulos, D.G.; Comninakis, P.E.; Papazachos, B.C. Evidence for Transform Faulting in the Ionian Sea: The Cephalonia Island Earthquake Sequence of 1983. Pure Appl. Geophys. 1985, 123, 388–397. [Google Scholar] [CrossRef]
- Benetatos, C.; Kiratzi, A.; Roumelioti, Z.; Stavrakakis, G.; Drakatos, G.; Latoussakis, I. The 14 August 2003 Lefkada Island (Greece) Earthquake: Focal Mechanisms of the Mainshock and of the Aftershock Sequence. J. Seismol. 2005, 9, 171–190. [Google Scholar] [CrossRef]
- Papadimitriou, P.; Kaviris, G.; Makropoulos, K. The MW=6.3 2003 Lefkada Earthquake (Greece) and Induced Stress Transfer Changes. Tectonophysics 2006, 423, 73–82. [Google Scholar] [CrossRef]
- Papadopoulos, G.A.; Karastathis, V.K.; Ganas, A.; Pavlides, S.; Fokaefs, A.; Orfanogiannaki, K. The Lefkada, Sea (Greece), Shock (Mw 6.2) of 14 August 2003: Evidence for the Characteristic Earthquake from Seismicity and Ground Failures. Earth Planets Space 2003, 55, 713–718. [Google Scholar] [CrossRef]
- Ganas, A.; Elias, P.; Bozionelos, G.; Papathanassiou, G.; Avallone, A.; Papastergios, A.; Valkaniotis, S.; Parcharidis, I.; Briole, P. Coseismic Deformation, Field Observations and Seismic Fault of the 17 November 2015 M = 6.5, Lefkada Island, Greece Earthquake. Tectonophysics 2016, 687, 210–222. [Google Scholar] [CrossRef]
- Sokos, E.; Zahradník, J.; Gallovič, F.; Serpetsidaki, A.; Plicka, V.; Kiratzi, A. Asperity Break after 12 Years: The MW 6.4 2015 Lefkada (Greece) Earthquake: The MW 6.4 2015 Lefkada earthquake. Geophys. Res. Lett. 2016, 43, 6137–6145. [Google Scholar] [CrossRef]
- Chousianitis, K.; Konca, A.O.; Tselentis, G.-A.; Papadopoulos, G.A.; Gianniou, M. Slip Model of the 17 November 2015 MW = 6.5 Lefkada Earthquake from the Joint Inversion of Geodetic and Seismic Data: Lefkada 2015 slip model. Geophys. Res. Lett. 2016, 43, 7973–7981. [Google Scholar] [CrossRef]
- Melgar, D.; Ganas, A.; Geng, J.; Liang, C.; Fielding, E.J.; Kassaras, I. Source Characteristics of the 2015 MW 6.5 Lefkada, Greece, Strike-Slip Earthquake: THE 2015 MW 6.5 LEFKADA EARTHQUAKE. J. Geophys. Res. Solid Earth 2017, 122, 2260–2273. [Google Scholar] [CrossRef]
- Papathanassiou, G.; Valkaniotis, S.; Ganas, A.; Grendas, N.; Kollia, E. The November 17th, 2015 Lefkada (Greece) Strike-Slip Earthquake: Field Mapping of Generated Failures and Assessment of Macroseismic Intensity ESI-07. Eng. Geol. 2017, 220, 13–30. [Google Scholar] [CrossRef]
- Schmitt, R.G.; Tanyas, H.; Jessee, M.A.N.; Zhu, J.; Biegel, K.M.; Allstadt, K.E.; Jibson, R.W.; Thompson, E.M.; Van Westen, C.J.; Sato, H.P.; et al. An Open Repository of Earthquake-Triggered Ground-Failure Inventories; U.S. Geological Survey: Washington, DC, USA, 2017. [Google Scholar] [CrossRef]
- Saltogianni, V.; Taymaz, T.; Yolsal-Çevikbilen, S.; Eken, T.; Moschas, F.; Stiros, S. Fault Model for the 2015 Leucas (Aegean Arc) Earthquake: Analysis Based on Seismological and Geodetic Observations. Bull. Seismol. Soc. Am. 2017, 107, 433–444. [Google Scholar] [CrossRef]
- Barton, N.R. International Society for Rock Mechanics Commission on Standardization of Laboratory and Field Tests—Suggested Methods for the Quantitative Description of Discontinuities in Rock Masses. Int. J. Rock Mech. Min. Sci. Geomech. 1978, 15, 319–368. [Google Scholar]
- Marinos, P.; Hoek, E. GSI–A Geologically Friendly Tool for Rock Mass Strength Estimation. In Proceedings of the GeoEng2000 Conference, Melbourne, Australia, 19–24 November 2000; pp. 1422–1442. [Google Scholar]
- Romana, M. New Adjustment Ratings for Application of Bieniawski Classification to Slopes. In Proceedings of the International Symposium on the Role of Rock Mechanics in Excavations for Mining and Civil Works, Zacatecas, Mexico, 2–4 September 1985; International Society of Rock Mechanics: Lisbon, Portugal, 1985; pp. 49–53. [Google Scholar]
- Romana, M. The Geomechanical Classification SMR for Slope Correction. In Proceedings of the 8th ISRM Congress on Rock Mechanics, Tokyo, Japan, 25 September 1995; Volume 3, pp. 1085–1092. [Google Scholar]
- Mavrouli, O.; Corominas, J. Evaluation of Maximum Rockfall Dimensions Based on Probabilistic Assessment of the Penetration of the Sliding Planes into the Slope. Rock Mech. Rock Eng. 2020, 53, 2301–2312. [Google Scholar] [CrossRef]
- Palmstrom, A. The Volumetric Joint Count—A Useful and Simple Measure of the Degree of Rock Mass Jointing; New Delhi, India, 1982; pp. 221–228.
- Palmstrom, A. Application of the Volumetric Joint Count as a Measure of Rock Mass Jointing. In Proceedings of the International Symposium on Fundamentals of Rock Joints, Bjorkliden, Sweden, 15–20 September 1985; pp. 103–110. [Google Scholar]
- Palmstrom, A. The Volumetric Joint Count as a Measure of Rock Mass Jointing. In Proceedings of the F3 (fragmentation, form and flow in fractured media) Conference, Jerusalem, Israel, 6–9 January 1986; pp. 1–18. [Google Scholar]
- Morelli, G.L. Empirical Assessment of the Mean Block Volume of Rock Masses Intersected by Four Joint Sets. Rock Mech. Rock Eng. 2016, 49, 1759–1771. [Google Scholar] [CrossRef]
- Mavrouli, O.; Corominas, J.; Jaboyedoff, M. Size Distribution for Potentially Unstable Rock Masses and In Situ Rock Blocks Using LIDAR-Generated Digital Elevation Models. Rock Mech. Rock Eng. 2015, 48, 1589–1604. [Google Scholar] [CrossRef]
- Brunetti, M.T.; Guzzetti, F.; Rossi, M. Probability Distributions of Landslide Volumes. Nonlinear Process. Geophys. 2009, 16, 179–188. [Google Scholar] [CrossRef]
- Guzzetti, F.; Reichenbach, P.; Wieczorek, G.F. Rockfall Hazard and Risk Assessment in the Yosemite Valley, CA, USA. Nat. Hazards Earth Syst. Sci. 2003, 3, 491–503. [Google Scholar] [CrossRef]
- Laboratory of Engineering Geology, University of Patras Landslide. Management System of Western Greece. Available online: http://landslide.engeolab.gr/admin/ (accessed on 10 December 2022).
- Agliardi, F.; Crosta, G.B. High Resolution Three-Dimensional Numerical Modelling of Rockfalls. Int. J. Rock Mech. Min. Sci. 2003, 40, 455–471. [Google Scholar] [CrossRef]
- Guzzetti, F.; Crosta, G.; Detti, R.; Agliardi, F. STONE: A Computer Program for the Three-Dimensional Simulation of Rock-Falls. Comput. Geosci. 2002, 28, 1079–1093. [Google Scholar] [CrossRef]
- Guzzetti, F.; Reichenbach, P.; Ghigi, S. Rockfall Hazard and Risk Assessment Along a Transportation Corridor in the Nera Valley, Central Italy. Environ. Manag. 2004, 34, 191–208. [Google Scholar] [CrossRef]
- Skarlatoudis, A.A.; Papazachos, C.B.; Margaris, B.N.; Theodulidis, N.; Papaioannou, C.; Kalogeras, I.; Scordilis, E.M.; Karakostas, V. Erratum to Empirical Peak Ground-Motion Predictive Relations for Shallow Earthquakes in Greece. Bull. Seismol. Soc. Am. 2007, 97, 2219–2221. [Google Scholar] [CrossRef]
- Mavrouli, O.; Corominas, J.; Wartman, J. Methodology to Evaluate Rock Slope Stability under Seismic Conditions at Solà de Santa Coloma, Andorra. Nat. Hazards Earth Syst. Sci. 2009, 9, 1763–1773. [Google Scholar] [CrossRef]
- Sabatakakis, N.; Depountis, N.; Vagenas, N. Evaluation of Rockfall Restitution Coefficients. In Engineering Geology for Society and Territory—Volume 2; Lollino, G., Giordan, D., Crosta, G.B., Corominas, J., Azzam, R., Wasowski, J., Sciarra, N., Eds.; Springer International Publishing: Cham, Switzerland, 2015; pp. 2023–2026. ISBN 978-3-319-09056-6. [Google Scholar]
- Vagenas, N. Rockfall Simulation by Analytical Methods. Correlation of Rockfall Energy Dissipation Parameters and Rock Mass Characteristics. Ph.D. Thesis, University of Patras, Patras, Greece, 2020. [Google Scholar]
- ESRI. ArcGIS for Desktop Empirical Bayesian Kriging. Available online: https://desktop.arcgis.com/en/arcmap/10.3/guide-books/extensions/geostatistical-analyst/what-is-empirical-bayesian-kriging-.htm (accessed on 10 December 2022).
- He, Y.; Nie, L.; Lv, Y.; Wang, H.; Jiang, S.; Zhao, X. The Study of Rockfall Trajectory and Kinetic Energy Distribution Based on Numerical Simulations. Nat. Hazards 2021, 106, 213–233. [Google Scholar] [CrossRef]
- Keskin, İ.; Polat, A. Kinematic Analysis and Rockfall Assessment of Rock Slope at the UNESCO World Heritage City (Safranbolu/Turkey). Iran. J. Sci. Technol. Trans. Civ. Eng. 2022, 46, 367–384. [Google Scholar] [CrossRef]
- Barton, N.R.; Choubey, V. The Shear Strength of Rock Joints in Theory and Practice. Rock Mech. 1977, 10, 1–54. [Google Scholar] [CrossRef]
- Deere, D.U.; Miller, R.P. Engineering Classification and Index Properties for Intact Rock; Air Force Weapons Ltd. Kirtland Airforce Base: Albuquerque, NM, USA, 1966; p. 308, AFWL-TR-65-116. [Google Scholar]
- Zhang, G.; Tang, H.; Xiang, X.; Karakus, M.; Wu, J. Theoretical Study of Rockfall Impacts Based on Logistic Curves. Int. J. Rock Mech. Min. Sci. 2015, 78, 133–143. [Google Scholar] [CrossRef]
- Yu, B.; Yi, W.; Zhao, H. Experimental Study on the Maximum Impact Force by Rock Fall. Landslides 2018, 15, 233–242. [Google Scholar] [CrossRef]


Disclaimer/Publisher’s Note: The statements, opinions and data contained in all publications are solely those of the individual author(s) and contributor(s) and not of MDPI and/or the editor(s). MDPI and/or the editor(s) disclaim responsibility for any injury to people or property resulting from any ideas, methods, instructions or products referred to in the content. |
© 2023 by the authors. Licensee MDPI, Basel, Switzerland. This article is an open access article distributed under the terms and conditions of the Creative Commons Attribution (CC BY) license (https://creativecommons.org/licenses/by/4.0/).