Article

Sustainable Food Supply by Peri-Urban Diversified Farms of the Agri-Food Region of Central Córdoba, Argentina

by
María Victoria Marinelli
1,2,3,*,
Evangelina Beatriz Argüello Caro
4,5,
Irene Petrosillo
3,6,*,
Franca Giannini Kurina
5,
Beatriz Liliana Giobellina
2,
Carlos Marcelo Scavuzzo
1 and
Donatella Valente
3
1
Institute of Advanced Space Studies Mario Gulich (IG), National Commission for Space Activities (CONAE) & National University of Cordoba (UNC), Falda del Cañete, Córdoba 5187, Argentina
2
Observatory of Urban, Peri-urban Agriculture and Agroecology (O-AUPA), National Institute of Agricultural Technology (INTA), Córdoba 5000, Argentina
3
Laboratory of Landscape Ecology, Department of Biological and Environmental Sciences and Technologies, University of Salento, 73100 Lecce, Italy
4
Institute of Plant Pathology (IPAVE), Centre for Agricultural Research (CIAP), National Institute of Agricultural Technology (INTA), Córdoba 5119, Argentina
5
Faculty of Agricultural Sciences (FCA), National University of Cordoba (UNC), Córdoba 5000, Argentina
6
NBFC, National Biodiversity Future Center, 90133 Palermo, Italy
*
Authors to whom correspondence should be addressed.
Land 2023, 12(1), 101; https://doi.org/10.3390/land12010101
Submission received: 25 November 2022 / Revised: 21 December 2022 / Accepted: 22 December 2022 / Published: 28 December 2022
(This article belongs to the Special Issue New Advance in Landscape Patterns in Urban–Rural Interfaces)

Abstract

:
Peri-urban vegetable cropping areas, such as horticultural farms, provide several ecosystem services, such as the provision of fresh food. However, food supply must be estimated on the basis of the current and potential demand of future populations, taking into account the landscape carrying capacity towards sustainable agricultural planning. From this perspective, the study aimed at estimating the resilience of the “Agri-food Region of Central Córdoba” (ARCC) and its role in supporting the provisioning of ecosystem services, such as proximal services, provided by the diversified agricultural landscape in the peri-urban area of Córdoba (Argentina). A direct field survey has been carried out to collect data on the main species and types of crops, the annual productivity, and the area covered by each species and type of horticultural crops. The data have been statistically elaborated to test the spatial and temporal variability of productivity as well as the spatial autocorrelation. In relation to crop diversification, a total of 30 vegetable species have been recorded in the diversified farms under study, with 15 species identified as the most frequent crops as on the basis of the area dedicated to each vegetable species sampled in the farms (in %). The productivity of 30 species has been integrated into a single value of “vegetable crop productivity mean” (kg/m2), proposed and measured in this study, which has been 3.46 kg/m2. It can be a useful monitoring indicator in diversified production contexts. The estimated food supply (ton/year) of vegetable crops for the 170 farmlands has been 72,881 ton/year. An accurate measurement of the biomass harvested on a given surface area can be useful to assign productivity data to the pixel of each land use/cover class, providing accurate input data for remotely sensed-based models supporting decision-making on food provision in peri-urban systems. In this sense, the paper proposes a methodological framework that can be useful worldwide when up-to-date official productivity data are not available, but they are a necessary basis for planning, decision-making, and the implementation of public policies. Thus, diversity in farming systems can combine high ecological and socio-economic benefits, in terms of ecosystem service provision and sustainable food production.

1. Introduction

Peri-urban landscapes and their benefits are at risk of the urban sprawl and extensive agricultural development, along with the lack of policies to protect them [1,2,3,4]. These productive landscapes provide several ecosystem services particularly related to the supply of fresh food in proximity to the population [5]. Hence, it is essential to promote the maintenance of diversified peri-urban agricultural areas as they can guarantee the sustainable supply of ecosystem services (ES), useful for ensuring human well-being [6]. In particular, peri-urban provisioning services contribute to the protection of citizens’ health and to their quality of life [7] through a diversified food provision, which plays a crucial role in the sustainability of communities, promoting both social and economic benefits [3]. Therefore, the multiple roles played by urban and peri-urban agriculture, such as the provision of ecosystem services [8], food security [9], and socio-political functions [10,11,12] can support the sustainability towards the Sustainable Development Goals (SDGs) [13,14]. In this sense, urban agriculture contributes to the achievement of the 11th SDG, that is, to “make cities and human settlements inclusive, safe, resilient and sustainable”, and at the same time, to promote the efficient use of resources and improve adaptation to climate change (SDG objective 11b). In this perspective, widespread agricultural practices have been focused on the development of sustainable agricultural systems in the peri-urban areas of metropolises to respond to a growing demand for food through the eco-efficient management of agricultural land and suitable policies for their planning [15,16,17,18].
Horticultural farms in peri-urban areas are landscapes that provide ecosystem services to the urban population [19] and, given the small scale, they can be seen as green infrastructures useful for the sustainable development of urban areas [20] where food provision is a material contribution co-produced by nature and people [5]. However, IPBES (2019) [20] warned that this contribution should not be prioritized over others, as it would lead to negative ecological changes and ecosystem services trade-offs. Likewise, knowing the typology and the amount of food produced in a geographic area can be useful to assess the level of food supply provided by that specific area and thus make inferences regarding food security and biodiversity conservation and restoration in terms of crop diversity and adaptation to climate change [21]. Thus, food supply must be estimated on the basis of the current and potential demand of the future population, taking into account the landscape carrying capacity when planning agriculture for sustainability.
Furthermore, the development of an effective and sustainable peri-urban agriculture could be a strategy capable of addressing not only the issue of food security but also the provision of cultural services in an urban context [22]. Peri-urban landscapes are areas of connection between the real urban environment and the rural suburbs [23]. When traditional agricultural practices are maintained, they can represent a cultural landscape capable of conditioning the quality of life in the city [24,25,26]. However, the request for food, in particular in recent decades, has increased with effects on the traditional practices in agricultural production that have been replaced by extensive agricultural fields [27].
In this perspective, the study aims at characterizing the potential of diversified farmlands in peri-urban horticulture towards the resilience of the “Agri-food Region of Central Córdoba” (ARCC) and their role in supporting the provision of proximal ecosystem services in terms of food supply and production based on crop diversity. This first assessment, when official data are not available, can support the proposal of suitable policies for the sustainable development of peri-urban horticulture in metropolitan areas and can be an example for other similar cases worldwide.

2. Materials and Methods
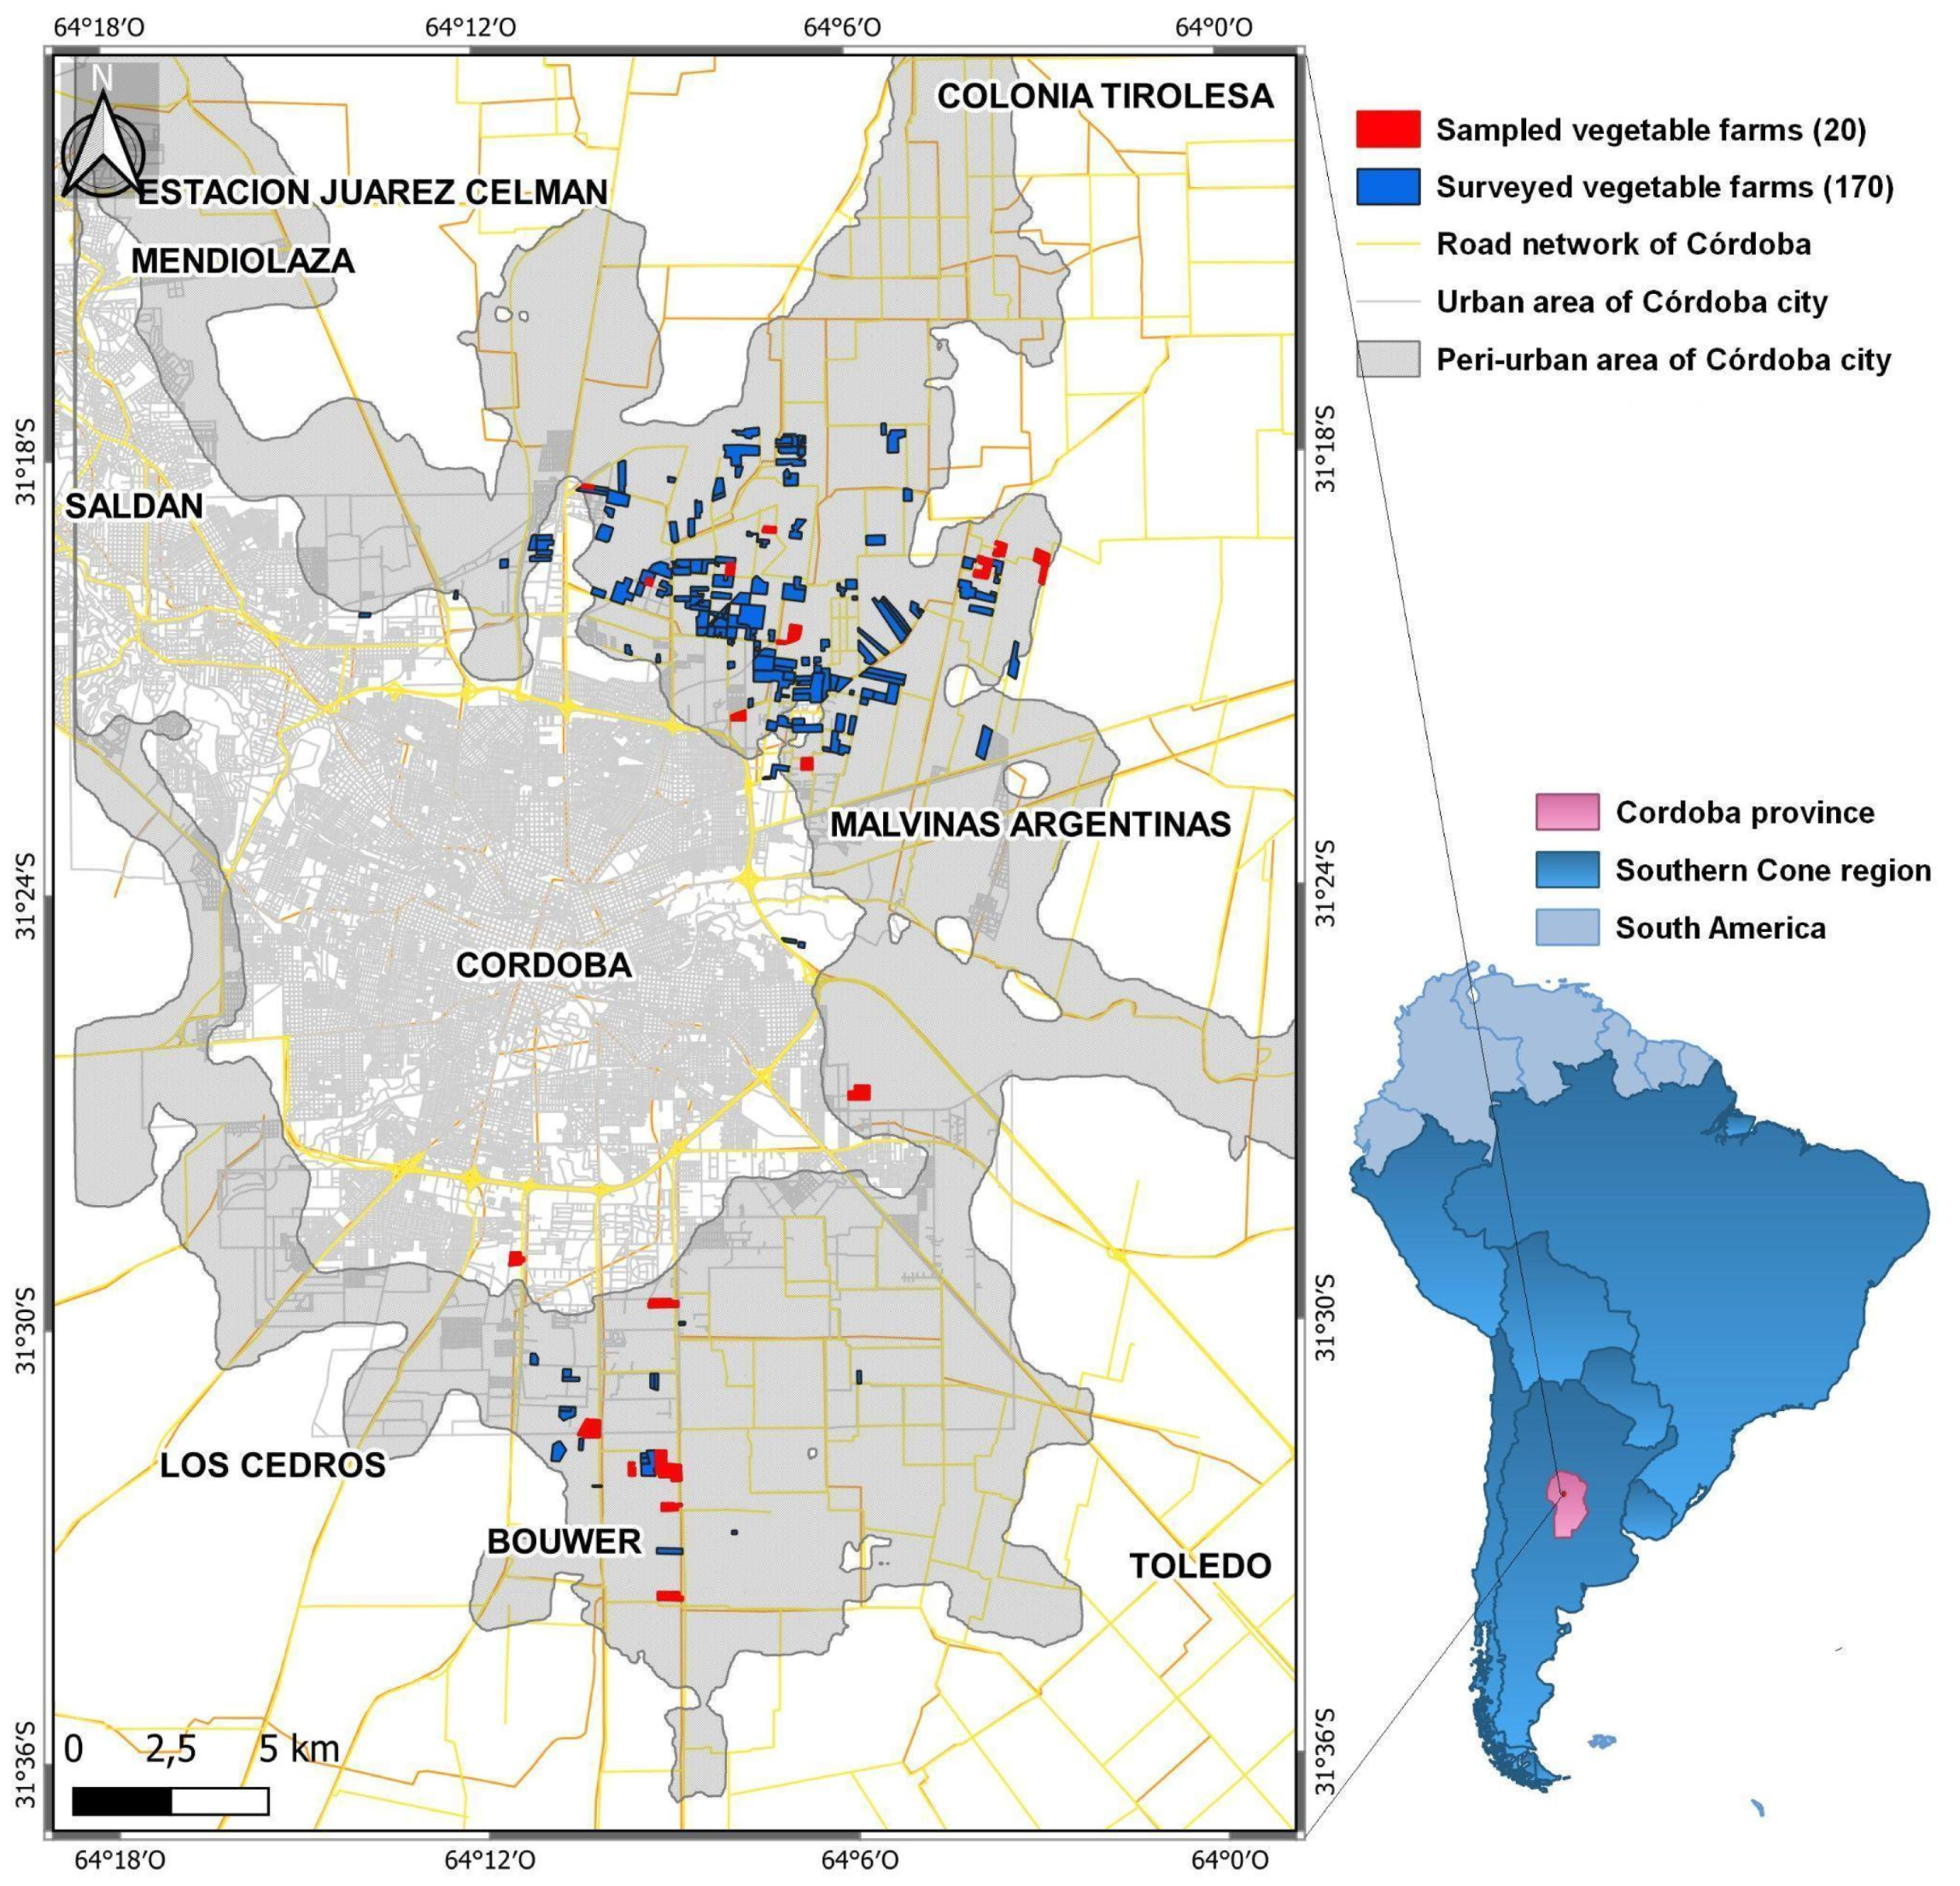
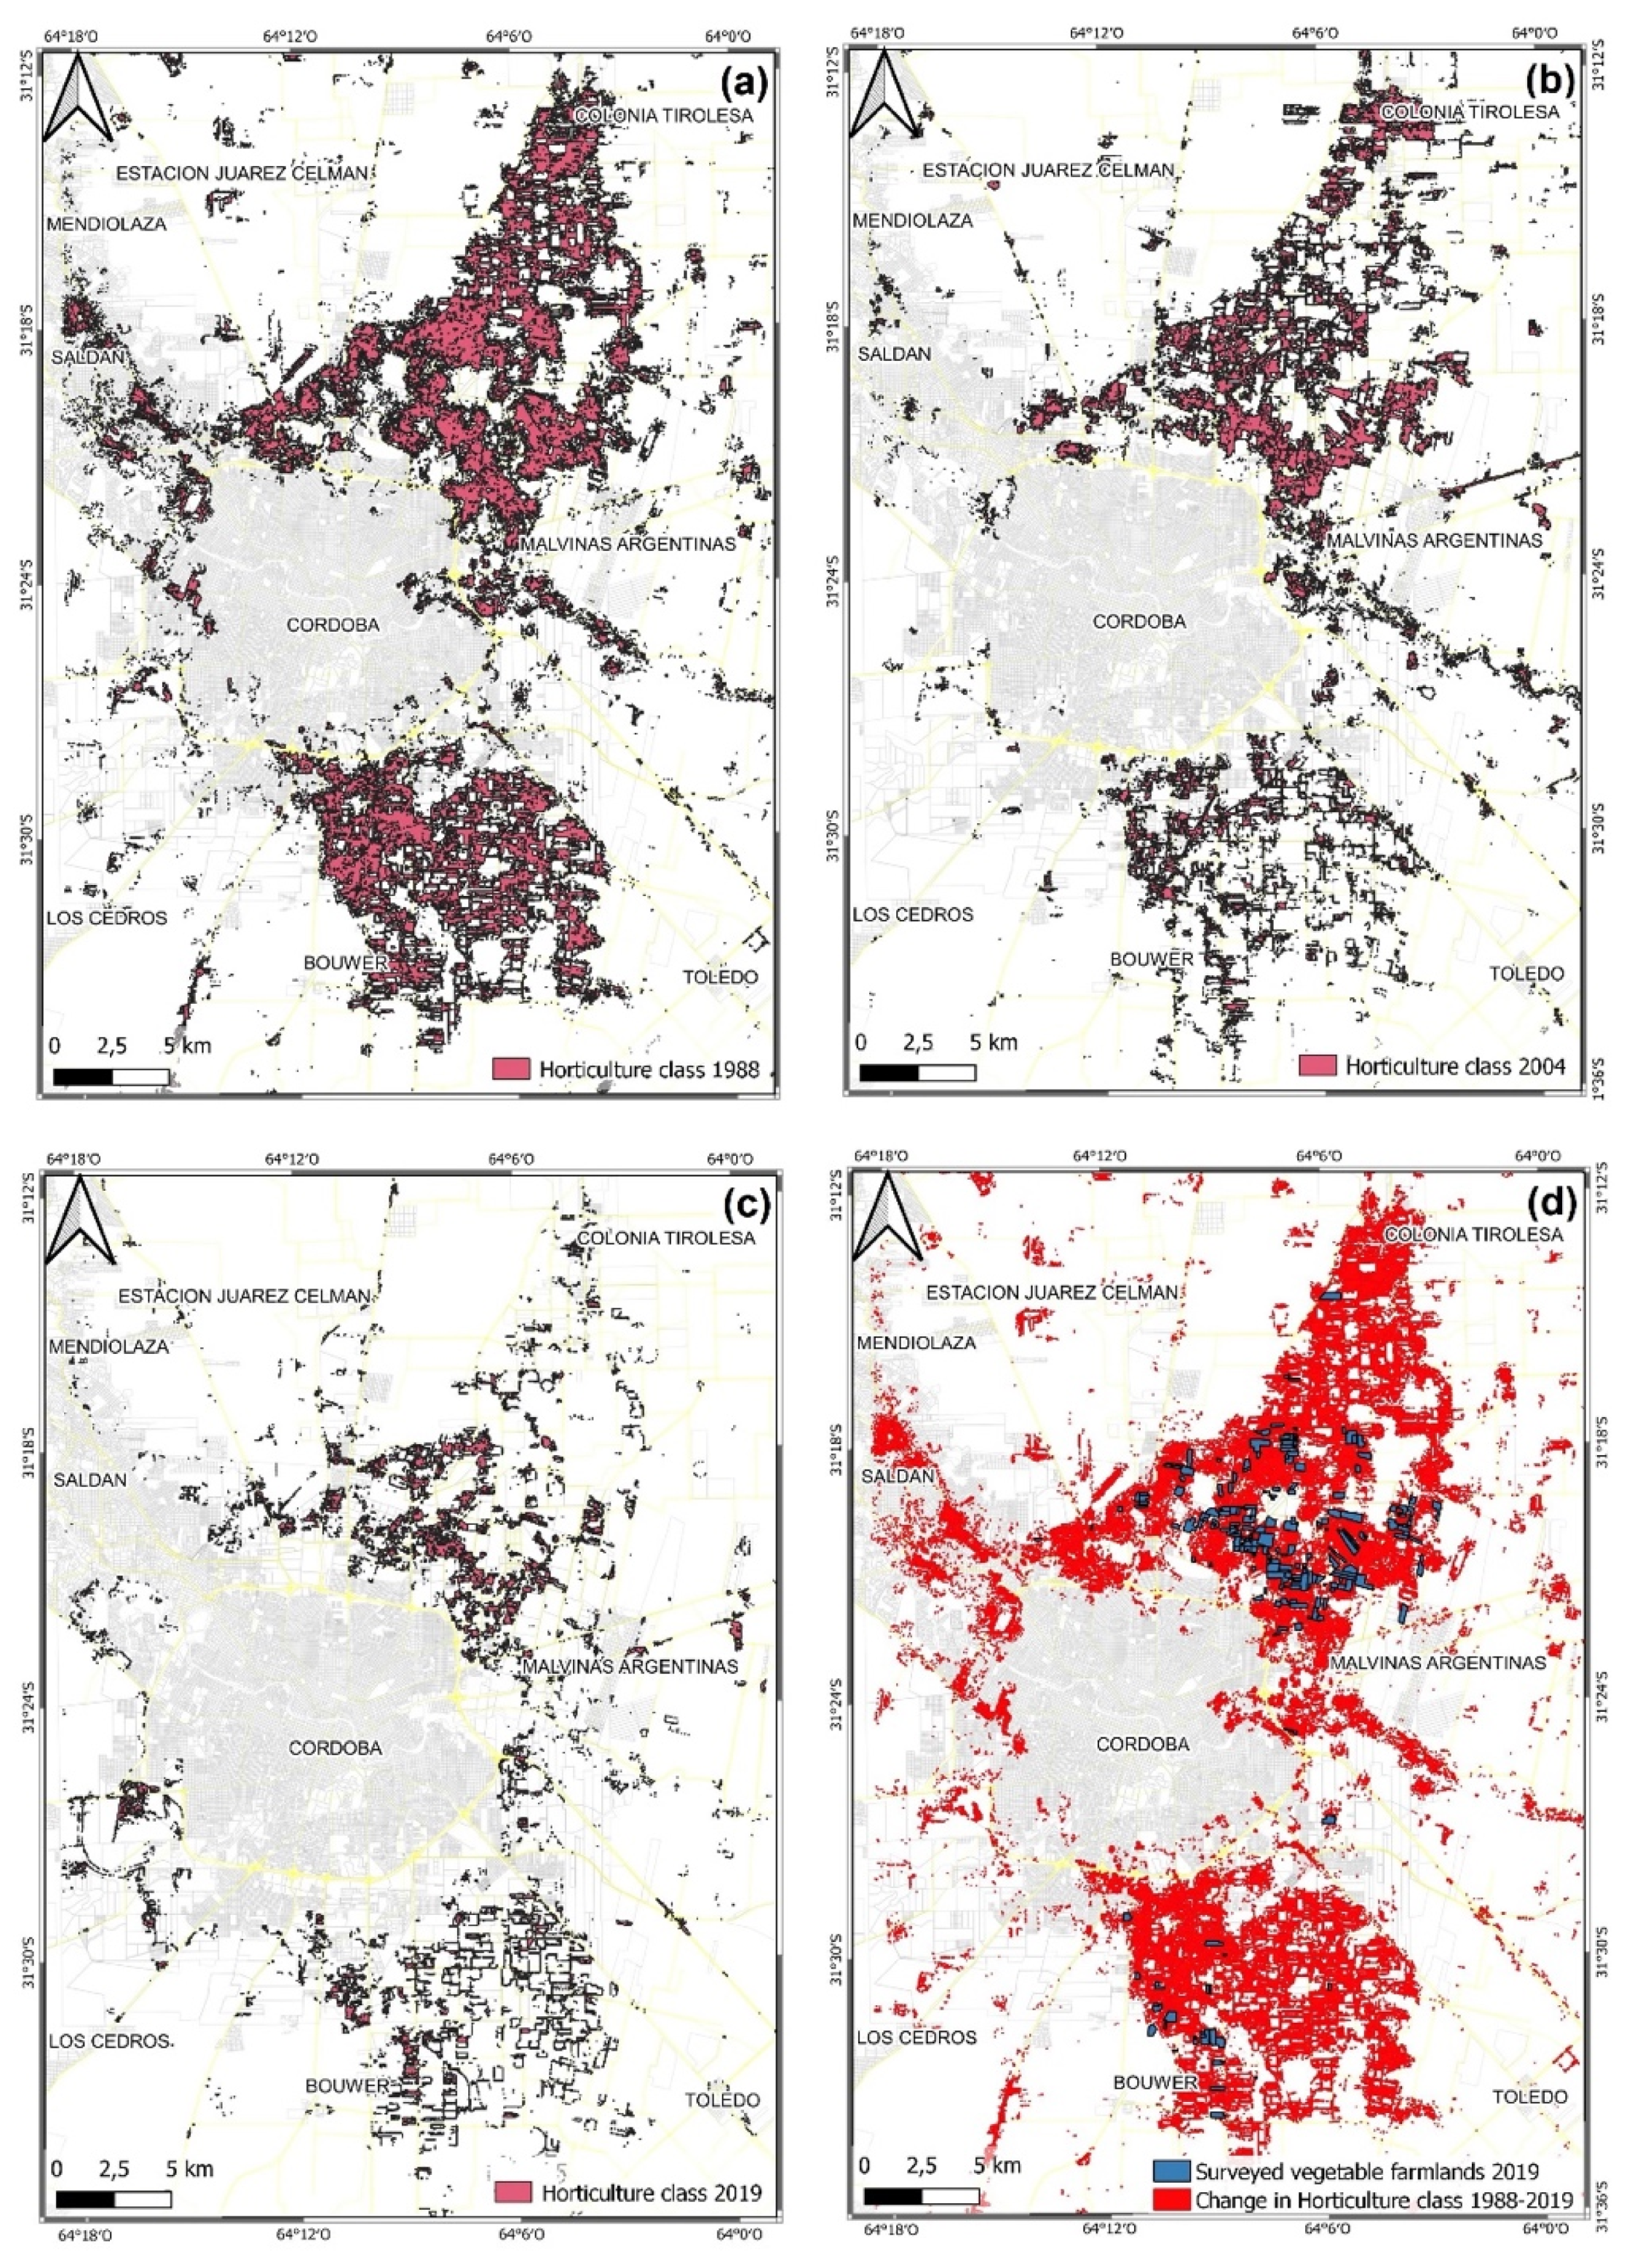
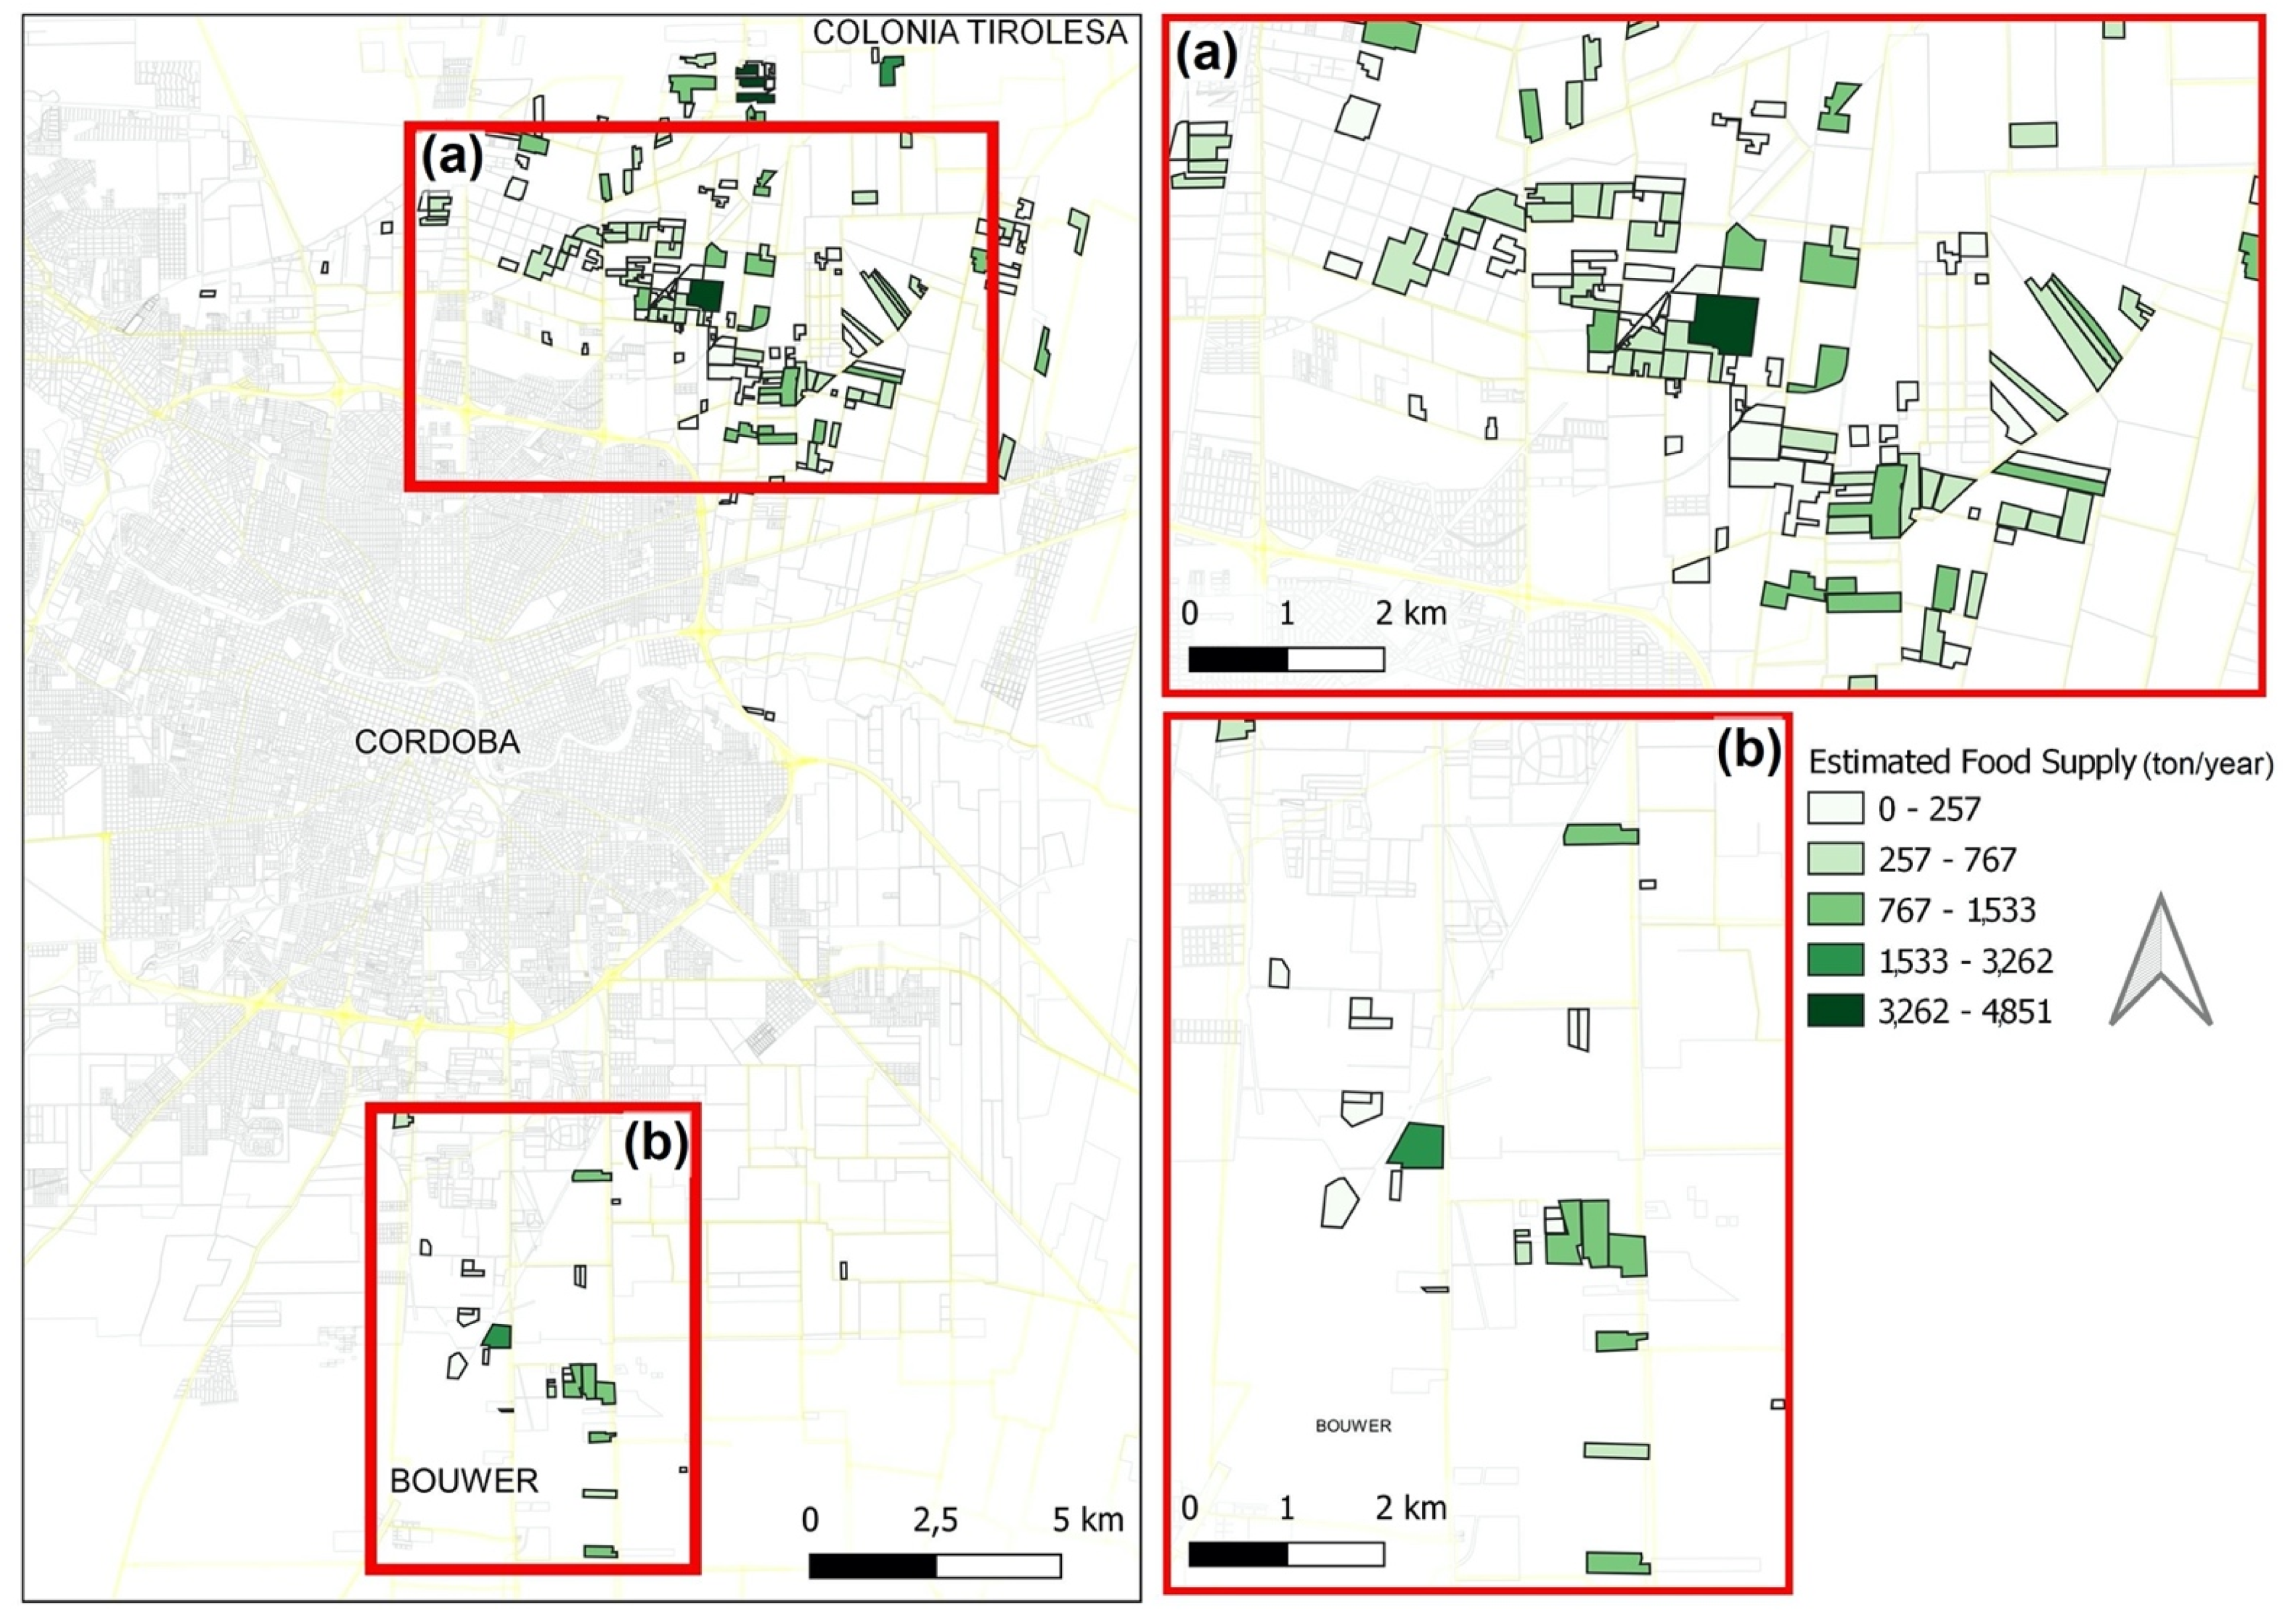
2.1. Study Area

The study area is represented by the ARCC, defined as the vegetable crop production area proximal to the metropolitan city of Córdoba, Argentina (Figure 1).
The mean annual temperature in the study area is 17 °C, with a thermal amplitude of 14 °C and a frost-free period of up to 270 days, between September and May. Precipitations range between 750 mm to the west and 800 mm to the east, with a seasonal monsoonal distribution and a hydric deficit of 180 mm to the east and 240 mm to the west of Córdoba city [28]. The NE winds prevail, with a mean speed of 7 km/h [29]. In 2019, when the study was carried out, mean monthly precipitation and temperature resulted within the normal values, evaluated within a historical series of 20 years (satellite data from CHIRPS and GPM-IMERG provided by CONAE, and data obtained from the meteorological station of the Ingeniero Aeronáutico Ambrosio Taravella International Airport, Córdoba).
The population of the capital department of Córdoba is 1,329,604 (from the last National Population Census 2010), and a population density of 2,319.5 inhabitants/km2. The General Directorate of Statistics and Censuses calculates for the period 2010 to 2018, an urban growth of 11% and densification of 4% [30]. The diversified or multi-species horticultural production of the ARCC is concentrated in the northern peripheral area of Córdoba city (Figure 1). It is characterized by family farms, smaller than 20 hectares of croplands, included in the same irrigation system, and whose distance to the urban edge does not exceed 30 km. The southern area is dominated by commercial farms, with little diversified production and intensive use of mechanized labor, with >20 ha plots devoted to potato crops associated with carrot and sweet corn [31].
From 1988 to 2019, the family farmlands have been progressively reduced by approximately 12,000 ha, which represents a reduction of 75% of the total area devoted to the production of fresh food in proximity to the urban edges [32]. This has been the result of the lack of public policies for its conservation [32,33,34,35,36]. In 2019, after 37 years, the first horticultural survey has been carried out to acquire crucial data for the sustainable planning of this productive sector [37].
Figure 2 shows the dynamics of the horticultural class in 1988 (Figure 2a), in 2004 (Figure 2b), and in 2019 (Figure 2c), while the overall horticultural class change is shown in Figure 2d, where it is evident that the horticultural farmlands sampled in this research are completely immersed in a changed landscape matrix, pressed, from one side, by urban sprawl, and, on the other side, by the spread of some industrial crops (i.e., soybean production).
At present, there are no scientific or official reference data on the fresh food production provided by the ARCC, and there is still a lack of accurate productivity data to assess the contribution of horticulture peri-urban landscape in terms of food provision to the population of Córdoba. Even if there are some local estimates, they are outdated [29,38], whereas global databases, such as the statistics of the Food and Agriculture Organization of the United Nations (FAOSTAT) [39], are scarcely accurate and not suitable for decision-making at the local level. Therefore, new methodological approaches suitable to obtain accurate data considering the technological-social context of productivity are necessary to estimate the food contribution of the ARCC. In turn, these databases should be dynamic in time and space (e.g., assisted by Geographic Information Systems, GIS), and should not rely on official databases that are often non-existent or outdated in developing countries such as Argentina.

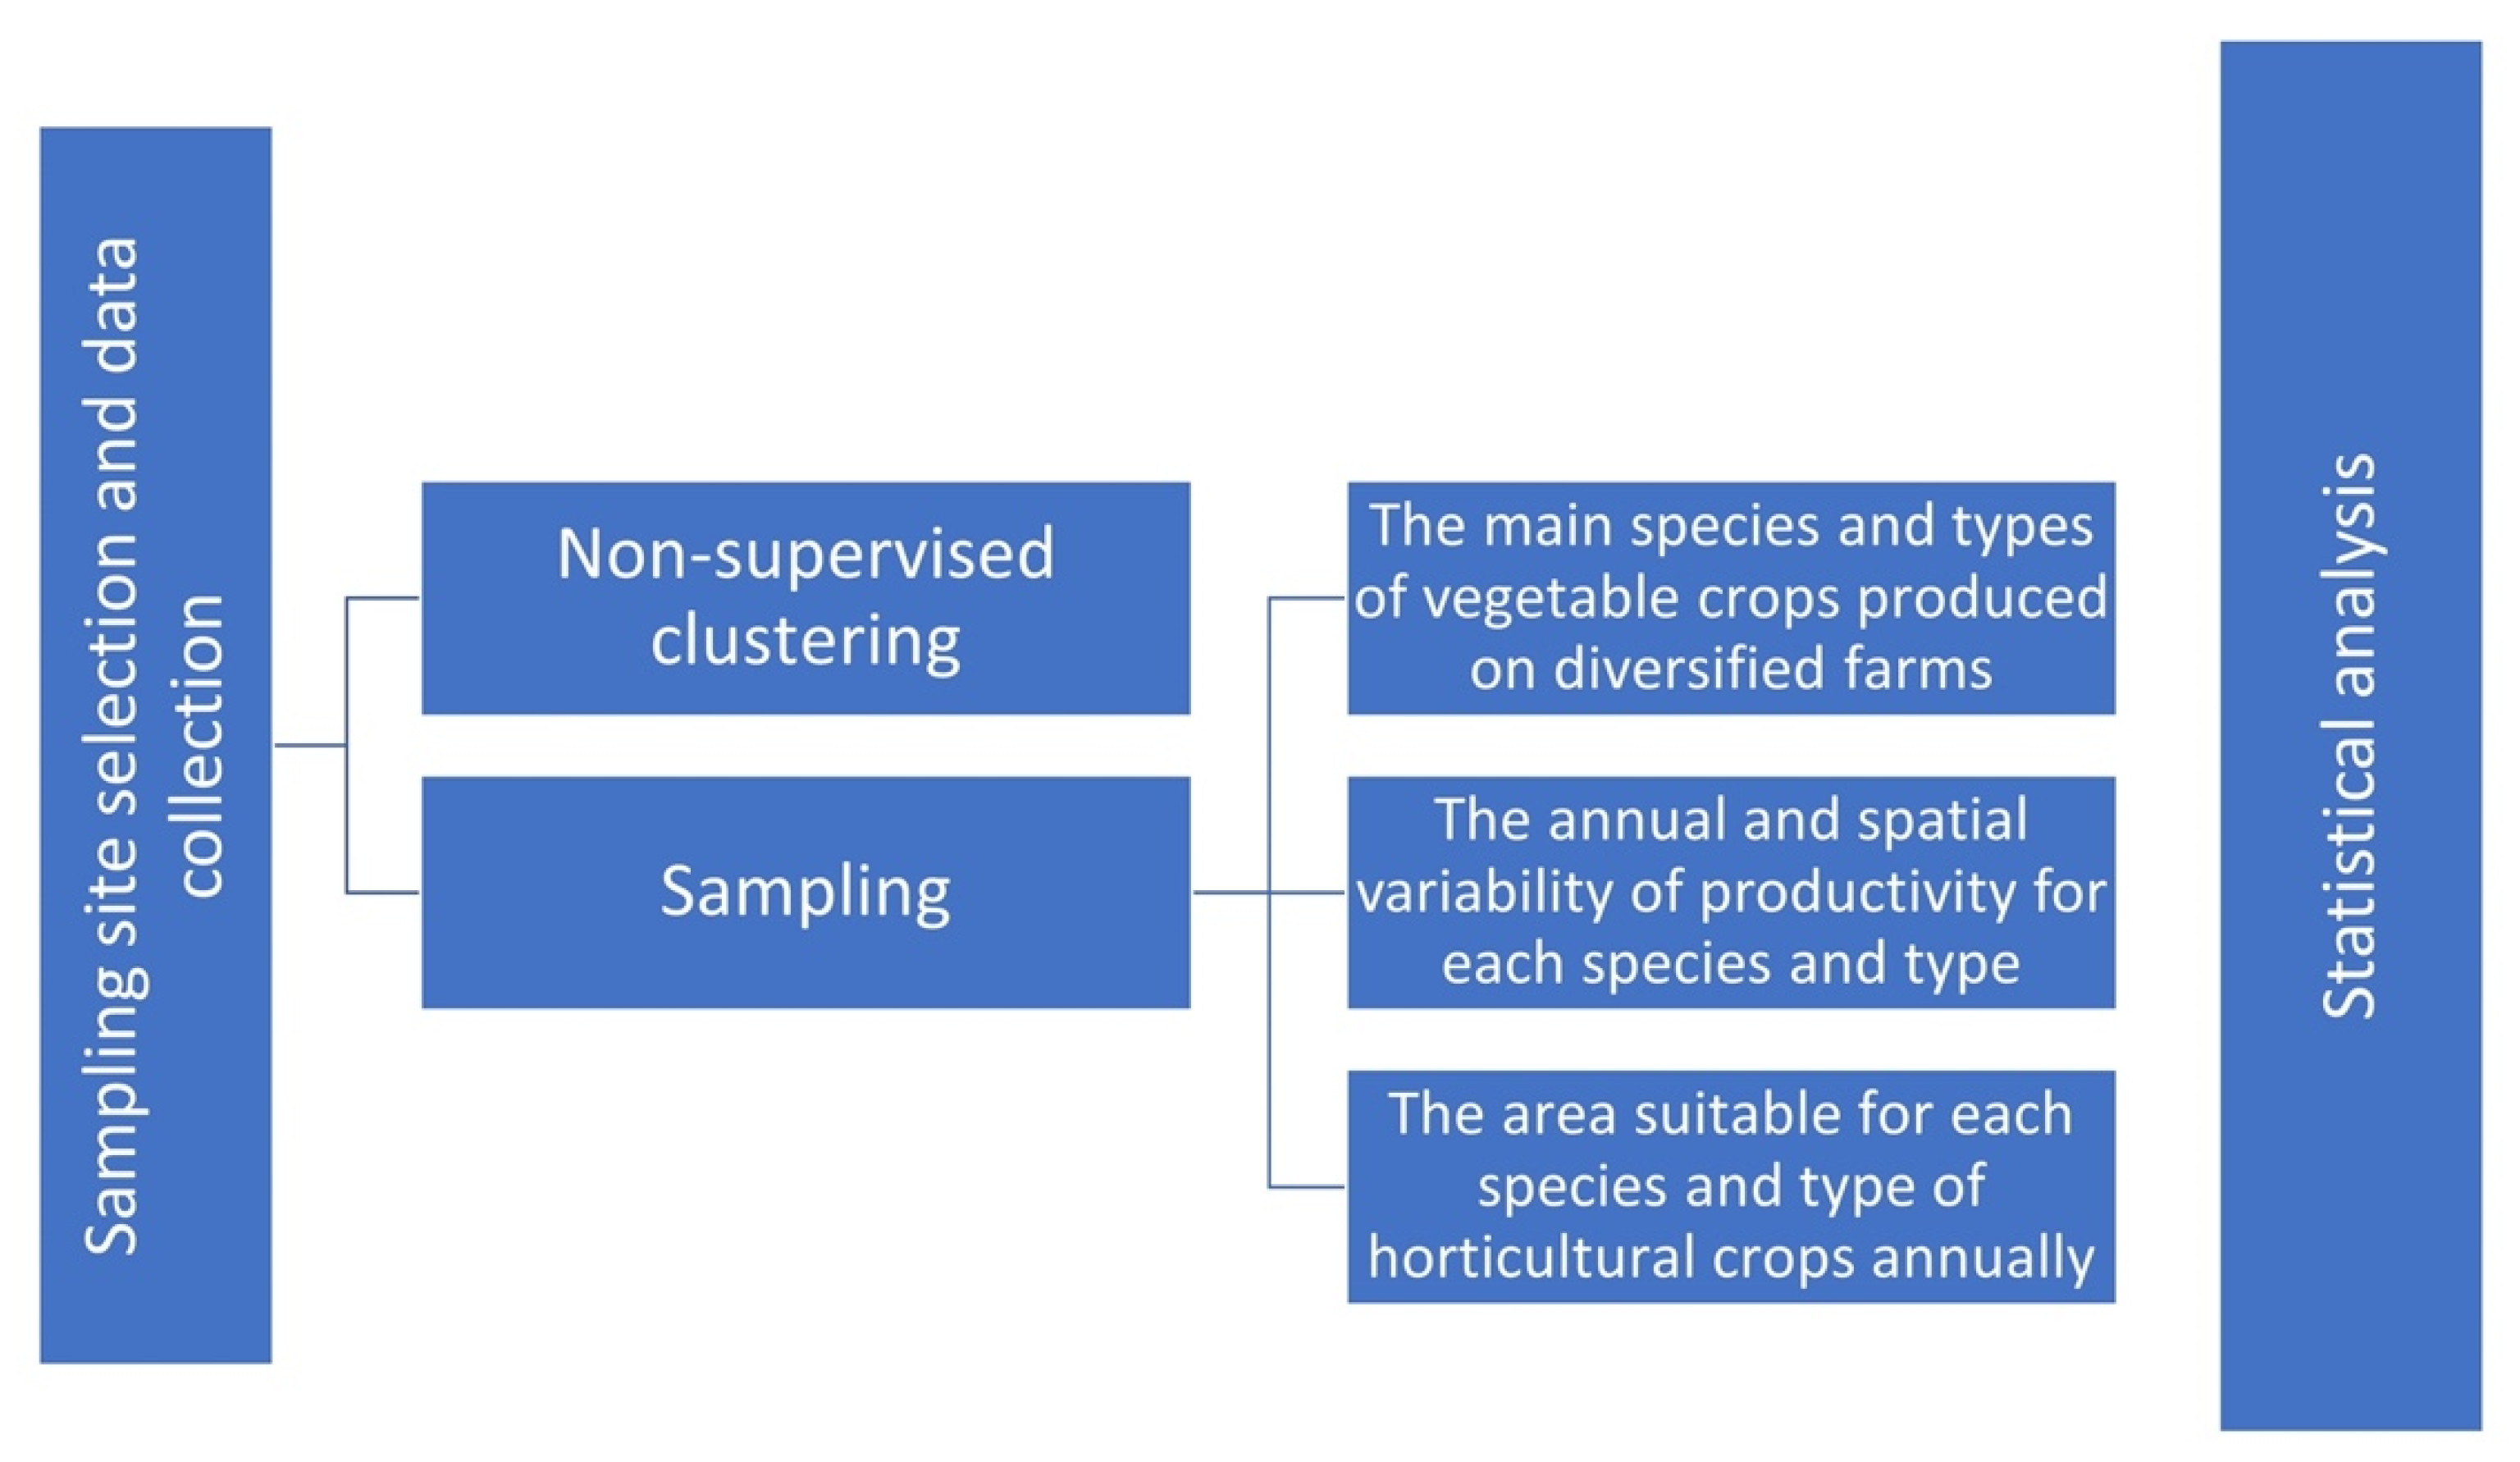
2.2. Farm Selection and Data Collection

In this research, the unit of analysis has been the “multispecies or diversified horticultural farm”, i.e., the production unit or agricultural holding whose main activity is the horticultural production of multiple species [37]. This type of holding has a single administration, a natural and/or legal person that makes productive and commercial decisions. These productive units can be composed of a single plot or two or more plots, regardless of land tenure conditions; therefore, the continuous spatial observation unit with defined borders is represented by the plot.
A total of 170 diversified vegetable farms are present in the ARCC (blue in Figure 1), with a mean area of 8.4 ha, and a mean area devoted to vegetable cropping of 6.05 ha. Among these farms, 48% of the farmers have access to land through lease contracts, while only 26.5% manage more than one farm [37]. Farms with sheltered crop production (shade cloth, anti-hail net, greenhouses) in part of the farm area account for 29%. Each farm produces on average 13 horticultural species, showing a strong multi-species connotation. Most of the farms’ products (67.7%) have a single trade destination as they are commercialized through the “Mercado de Abasto de Córdoba” (wholesale market). Regarding irrigation, 70% of the farms obtain water only through the irrigation canal system, only 7% of the farms obtain water from boreholes, and 23% have access to water from both channels and boreholes.
The methodology for sampling and data collection is synthesized in Figure 3.
A non-supervised clustering method has been used to find homogeneous groups among the 170 farms. Clustering has been based on technological-productive variables proposed by Giobellina and colleagues (2021), which are: total area, horticultural area, sheltered area, types of crop shelter (anti-hail net, greenhouse, shade cloth), land tenure type, management type, cultivated species grown (number and type), sales destination, machinery, facilities (pens, dams, storehouses, others), and irrigation system: source and type, among others. Thus, four homogeneous clusters have been identified, including a different number of farms: 34 farms, 40 farms, 50 farms, and 46 farms. This has allowed the selection of multi-species vegetable farms, characterized by accessibility and farmers’ willingness to participate; at least 10% of the farms from each cluster have been selected, totaling 20 sampled farms (red in Figure 1). The area of the sampled farms represents 18% of the peri-urban horticultural production in the study area.
Samplings have been performed and georeferenced monthly during the period from 29 September 2018 to 21 December 2019 to gather data and take photographs. From each georeferenced and dated point, the following factors have been recorded: species, the area occupied by crops, planting density, “condition” (soil cover, overall sanitation, degree of weed cover), and productivity (biomass per unit area, kg/m2).
In this way, updated and local data on vegetable production in the ARCC have been obtained in terms of (a) the main species and types of vegetable crops produced on diversified farms, (b) mean productivity per species and type, (c) annual and spatial variability of productivity per type, and (d) surface area allocated to each species and type in the farms, using a direct field survey on diversified farms of peri-urban areas.

2.2.1. Species and Characterization of Types of Crops

The species present in the farms have been recorded monthly during the sampling period in terms of frequency. Later, the sampled species have been grouped into the 5 horticultural typologies as proposed by FAO (2011) [40] and based on their edible parts: roots and tubers (e.g.,: carrot, potato, sweet potato, turnip, beet, radish), leafy vegetables (e.g., celery, parsley, chard, spinach, lettuce, and green onion), stems and bulbs (e.g., onion, garlic, and asparagus), inflorescences and brassicas (e.g., cauliflower, broccoli, cabbage, artichoke, and brussels sprout), and fruit vegetables (e.g., tomato, cucumber, pumpkin, broad bean, pea, chili, bell pepper, eggplant, french bean, melon, watermelon, and sweetcorn).

2.2.2. Area Suitable for Each Species and Type of Horticultural Crops Annually

The research has allowed the valuation of the area to be suitable annually for each species by considering the area used for vegetable cropping in each farm. A A i j (“mean area annually allocated to each species in the farms”) has been calculated based on the area of each sample relative to the vegetable crop area and the annual frequency of that species in each farm, using the following relation:
A A i j = i n A j A h i j F j n
where A j   represents the sampling area of the species j , A h i j is the horticultural area of the i   farm, and F j is the frequency, i.e., the number of times a given species j is cultivated in the farm i over a year. For the report of each type, data of A A i j have been aggregated according to the morphological typification of the vegetable crops.

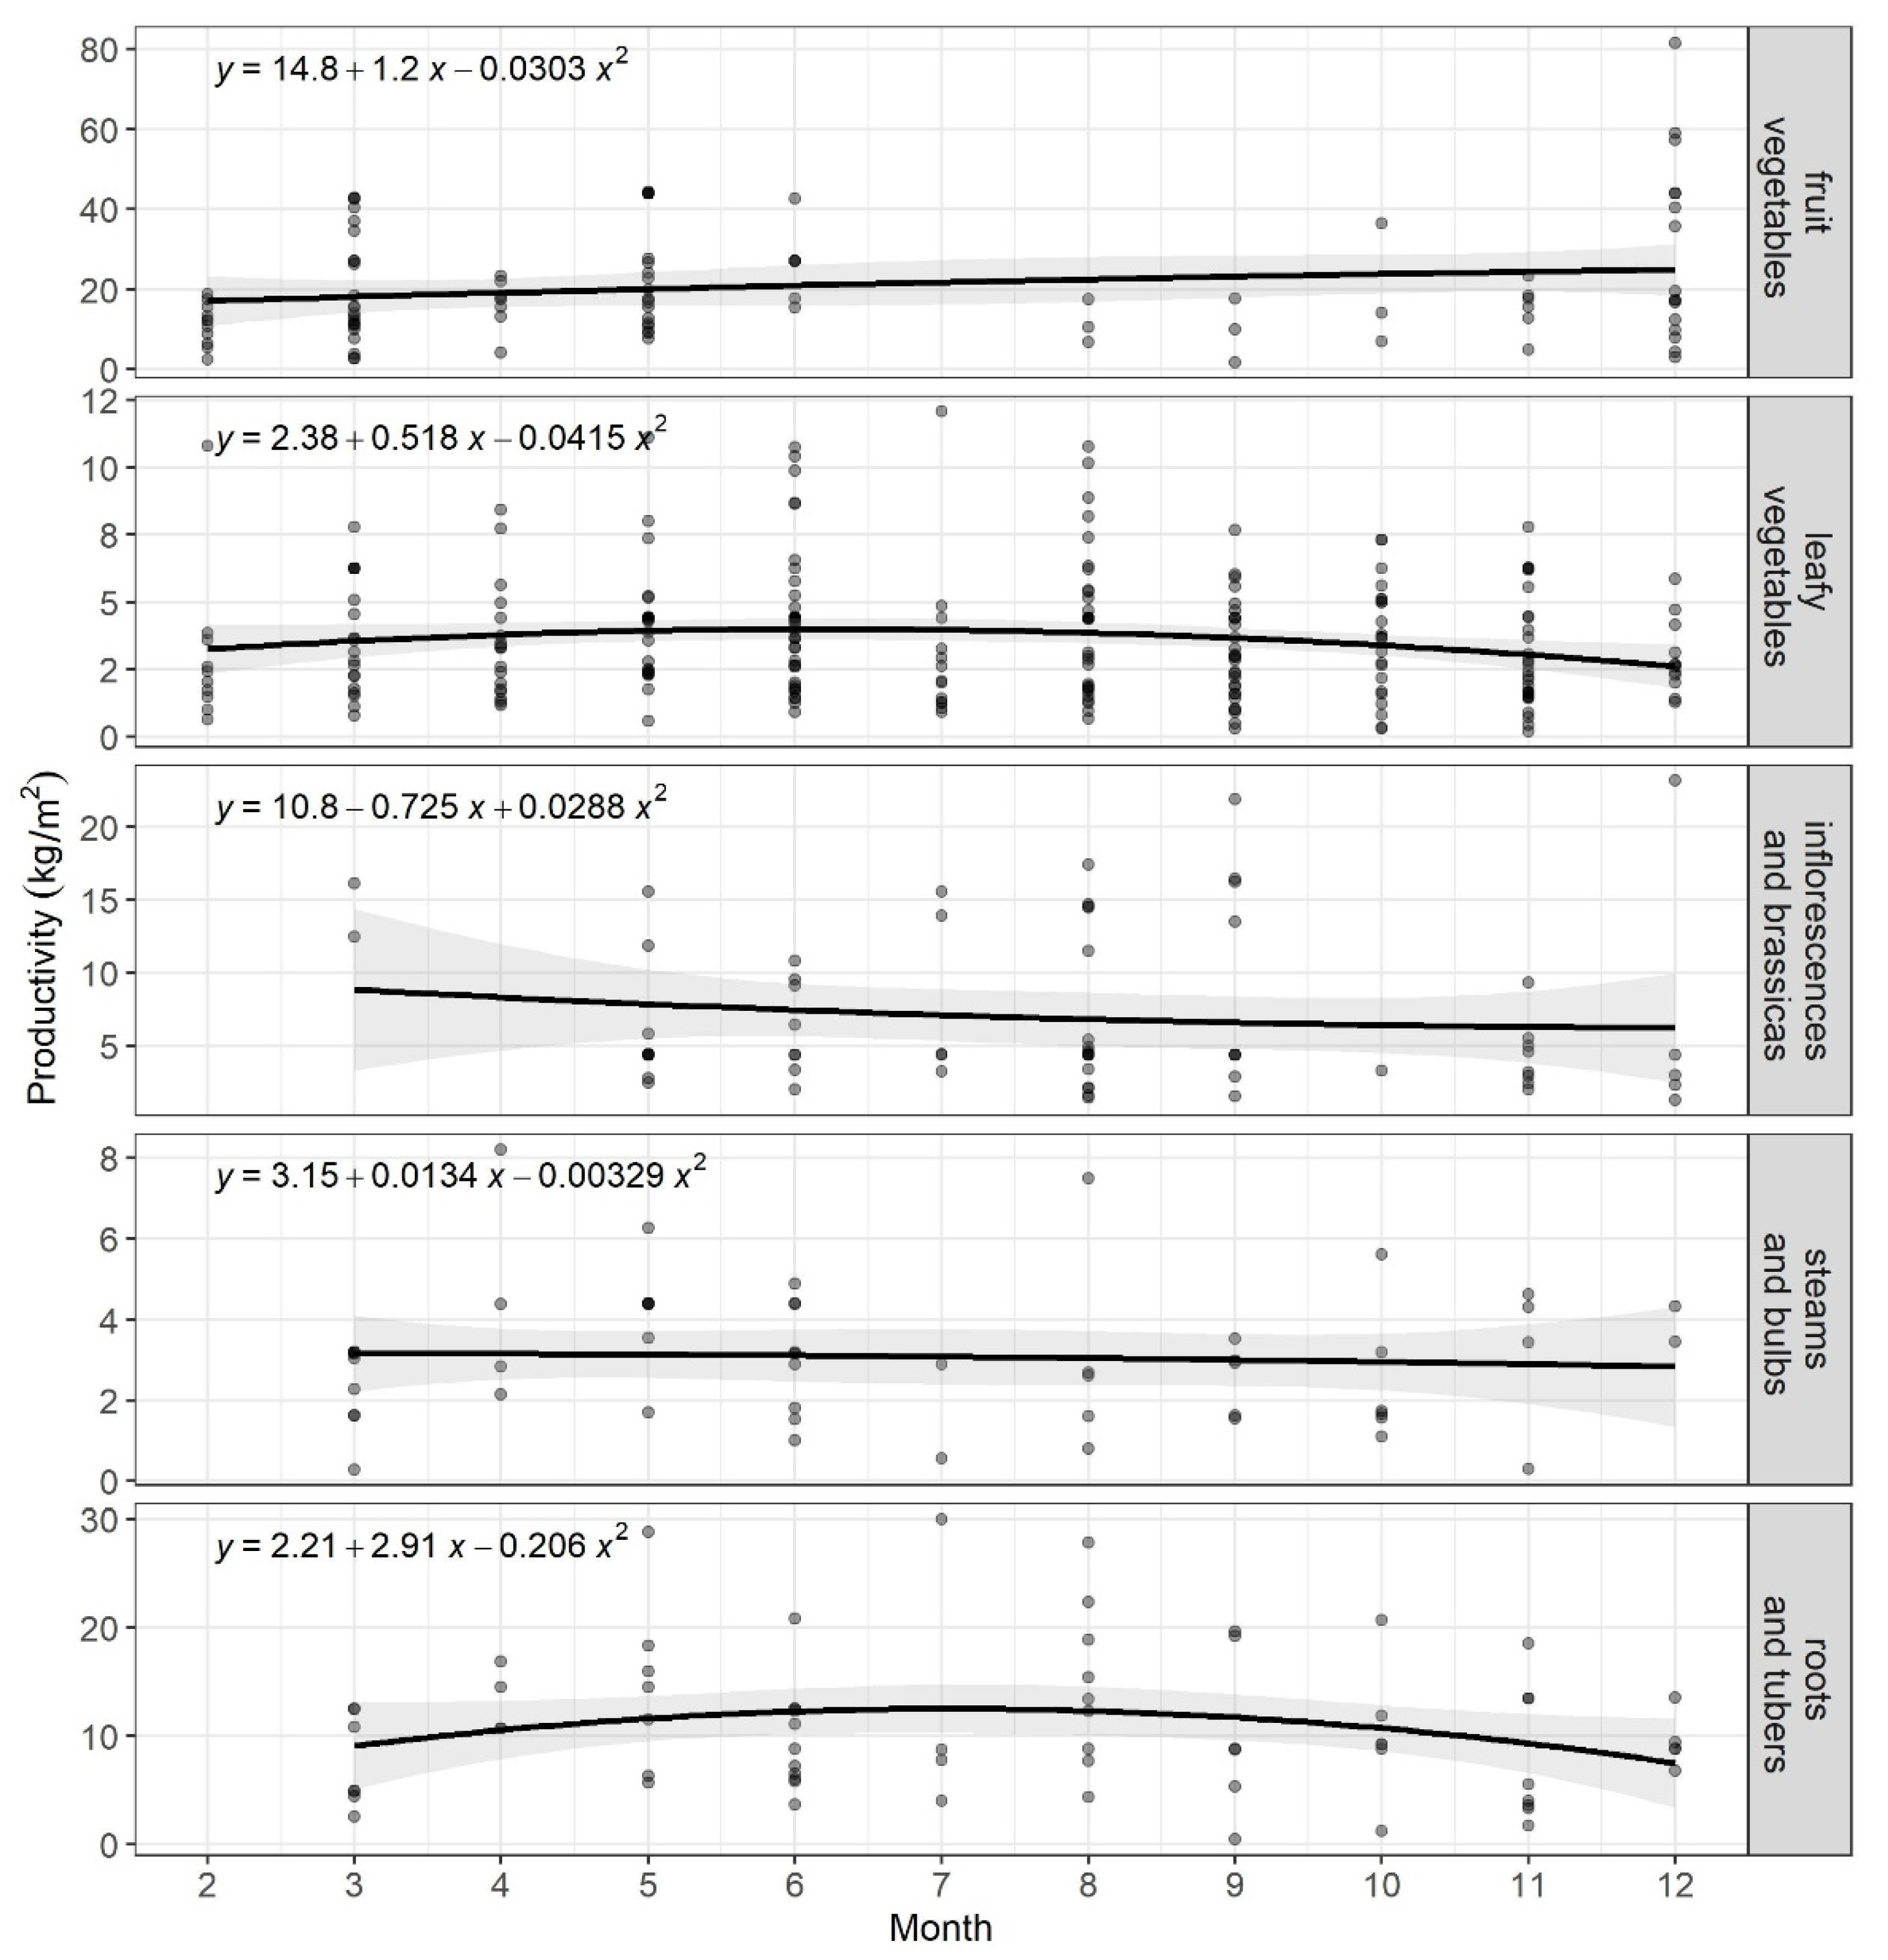
2.2.3. Mean Productivity Per Species and Characterization of Type of Horticultural Crop

The productivity of each sampled crop has been estimated from the harvest of a sampling unit of 1 m2. The harvested crop has been weighed in the field with a Roman scale, and the yield per square meter of each species has been recorded. Moreover, during these samplings, a survey has been carried out to systematize the data provided by the producer, the observations, and the photographic records.
The arithmetic mean of productivity per species (hereafter “mean productivity”) has been calculated, while the “productivity per cycle” for some species harvested more than once (i.e., beet, summer squash var. “zapallito”, eggplant, French bean, autumn squash, zucchini, small radish, broad bean, carrot, cucumber, bell pepper, or chili pepper) has been estimated multiplying the productivity value (kg/m2) by the number of harvests within the cycle.

2.3. Statistical Analysis

The spatial and temporal variability of productivity has been considered. More specifically, to investigate the possible existence of a potential spatial autocorrelation characterizing the productivity in the sampled farms, Global Moran’s Index and Geary’s coefficient in software R for each vegetable crop type have been estimated to analyze their effects. Those tests were parameterized, defining a neighborhood with a minimum distance of 0.05 km and a maximum distance of 20 km. Furthermore, other tests were performed to study the spatial variability of productivity between the North and South zones. A linear mixed-effect model was fitted with a random effect for the type of horticultural crop, using the library stats in R. That model allows for correlations and/or unequal variations of the errors within the group (North or South zone).
The annual productivity (kg/m2) distribution for each vegetable crop type has been analyzed by fitting a linear mixed-effect model of the productivity as a function of the month considering a random effect of horticultural crop type. Finally, productivity values have been compared with local databases [38] and regional ones [39] and analyzed through a ForestPlot in R [41], by calculating the ratio of means. For that graph, the total number of samples per species (n species), and the means and standard deviation for each species have been used. For the local references, the reported means have been used, the SDs have been calculated from the coefficients of variations, and the total number per species has been obtained from the experimental data. From the FAOSTAT database [39], records from countries from the Southern Cone region (Argentina, Bolivia, Brazil, Chile, Ecuador, Paraguay, Peru, and Uruguay) have been used, and the number per species, mean, and SD have been constructed from the reinterpretation of the categories “Vegetables”, “Tomatoes”, “Sweet potatoes”, “String beans”, “Spinach”, “Pumpkins, squash and gourds”, “Potatoes”, “Peas, green”, “Onions, shallots, green”, “Maize, green”, “Lettuce and chicory”, “Leeks, other alliaceous vegetables”, “Garlic”, “Eggplants”, “Cucumbers and gherkins”, “chilies and peppers, green”, “Cauliflowers and broccoli”, “Carrots and turnips”, “Cabbages and other brassicas”, “Broad beans, horse beans, dry”, “Beans, green”, “Asparagus”, “Artichokes”, and “Anise, badian, fennel, coriander”.

3. Results

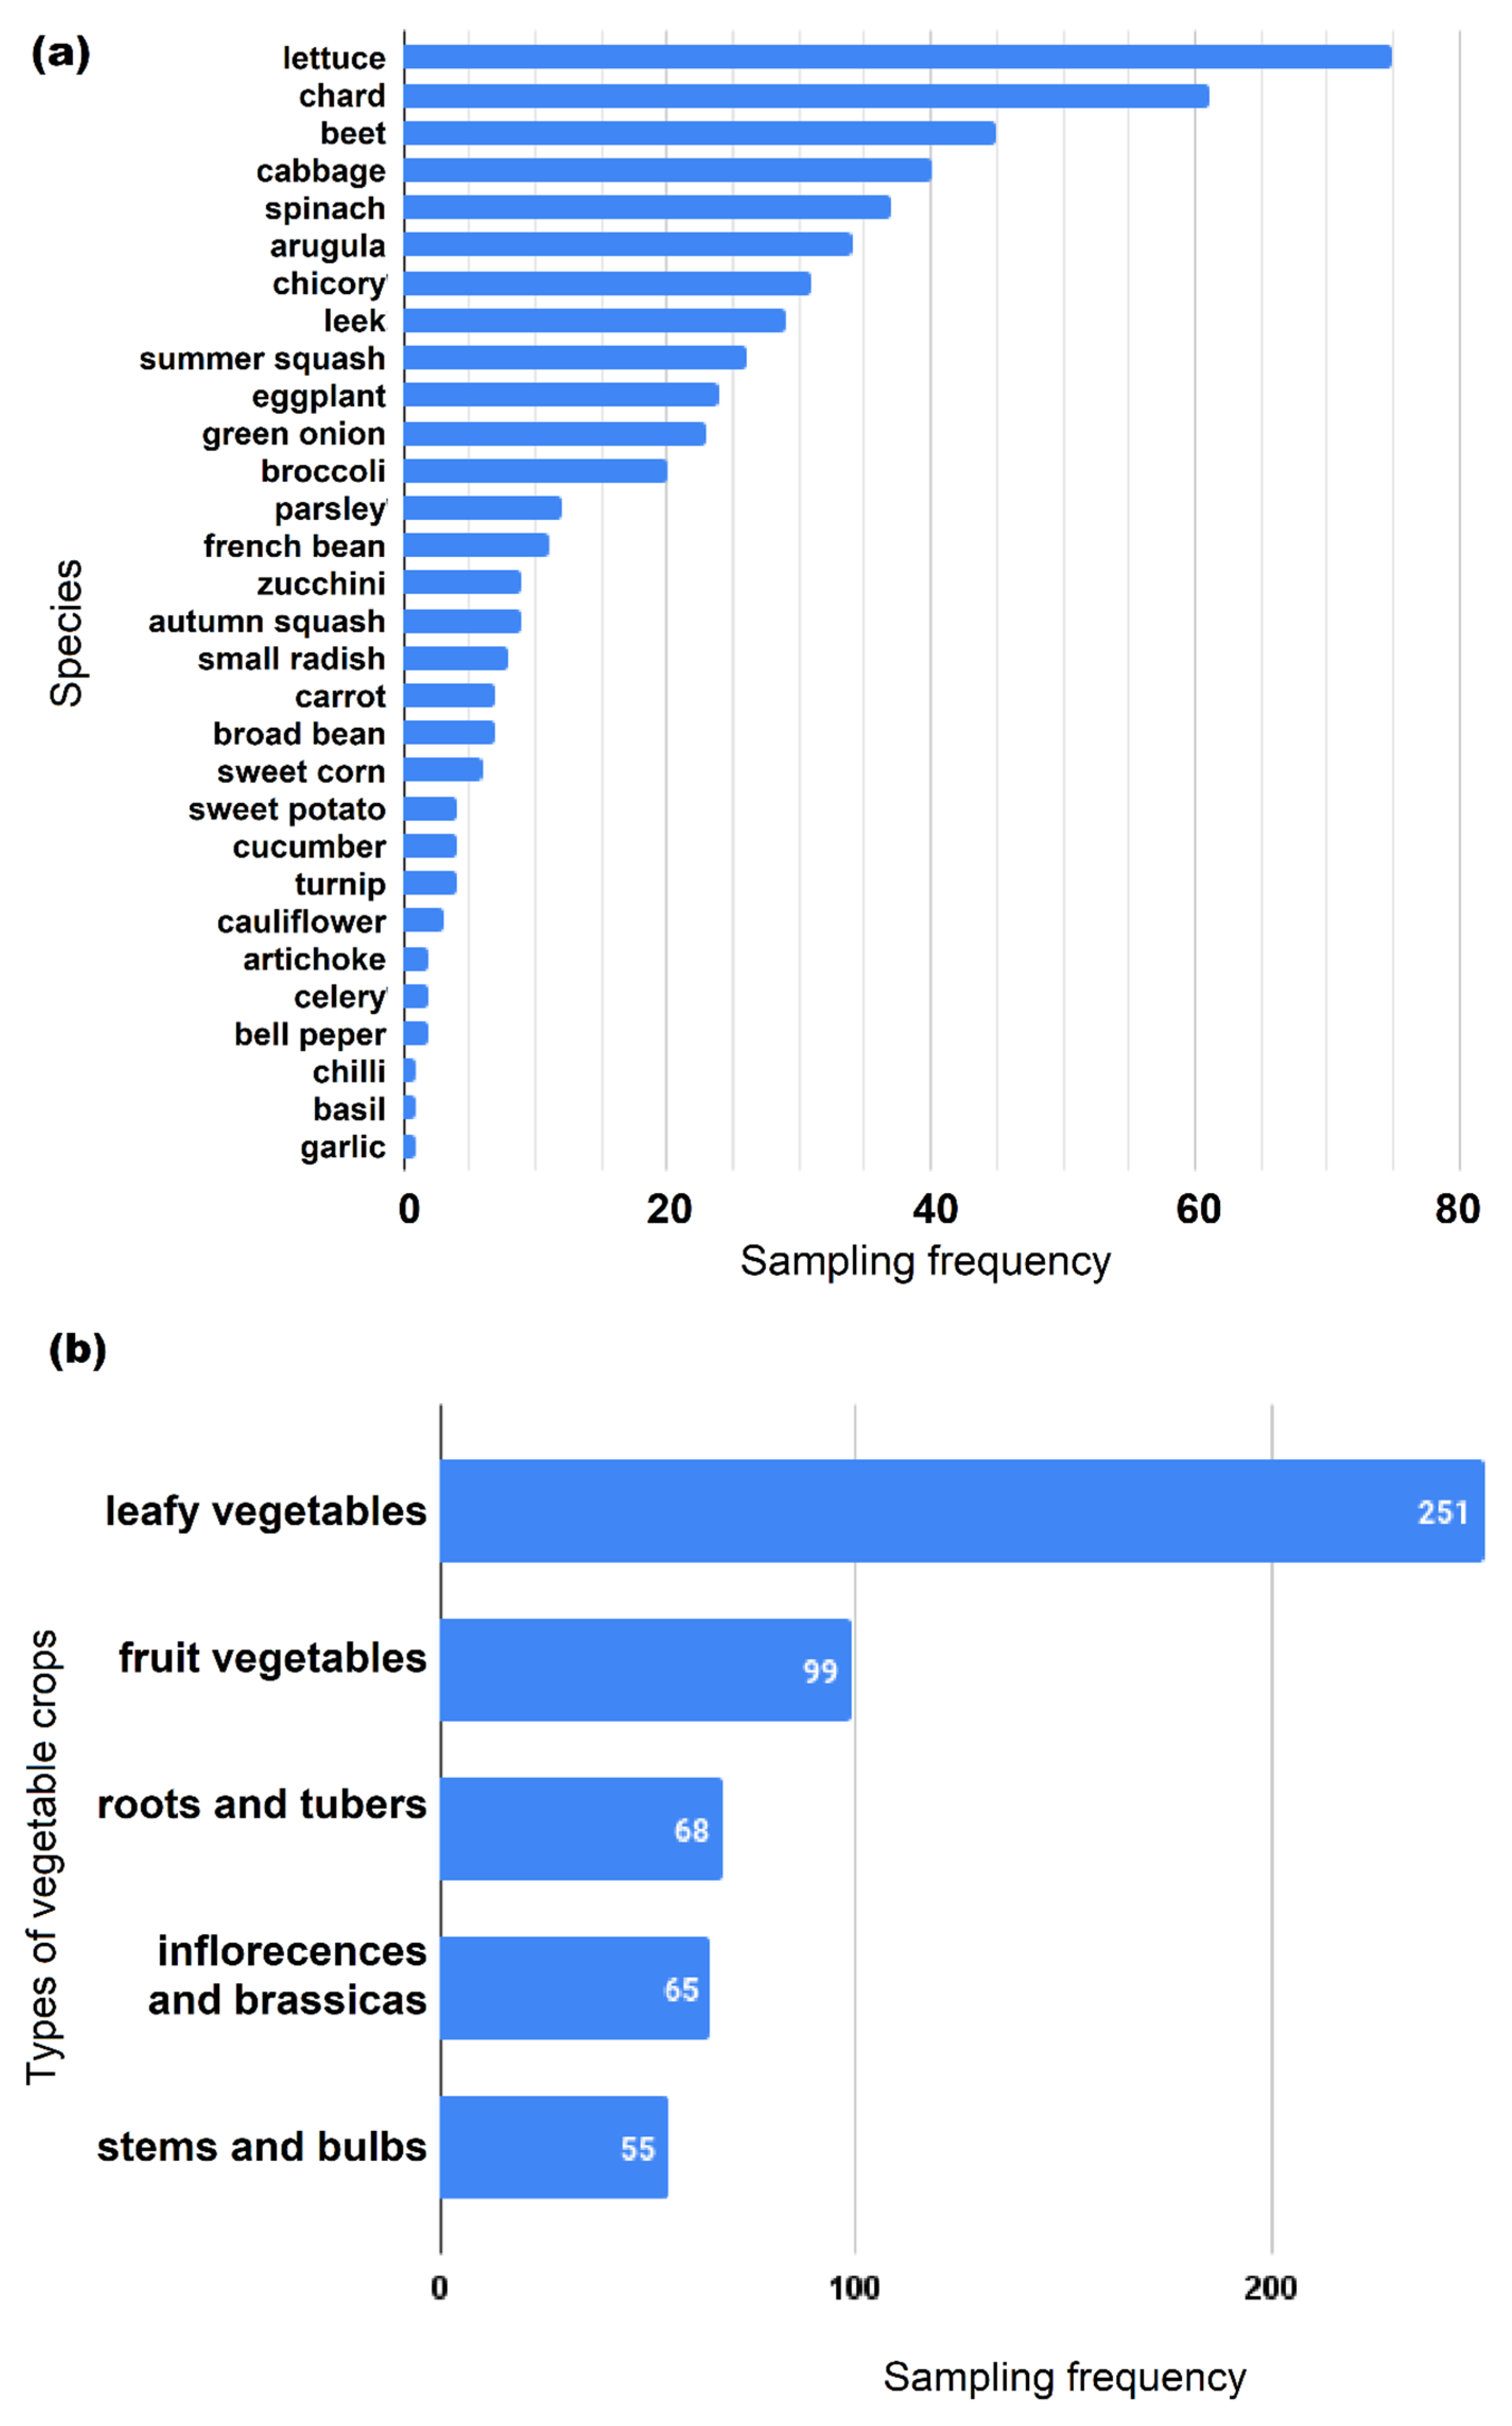
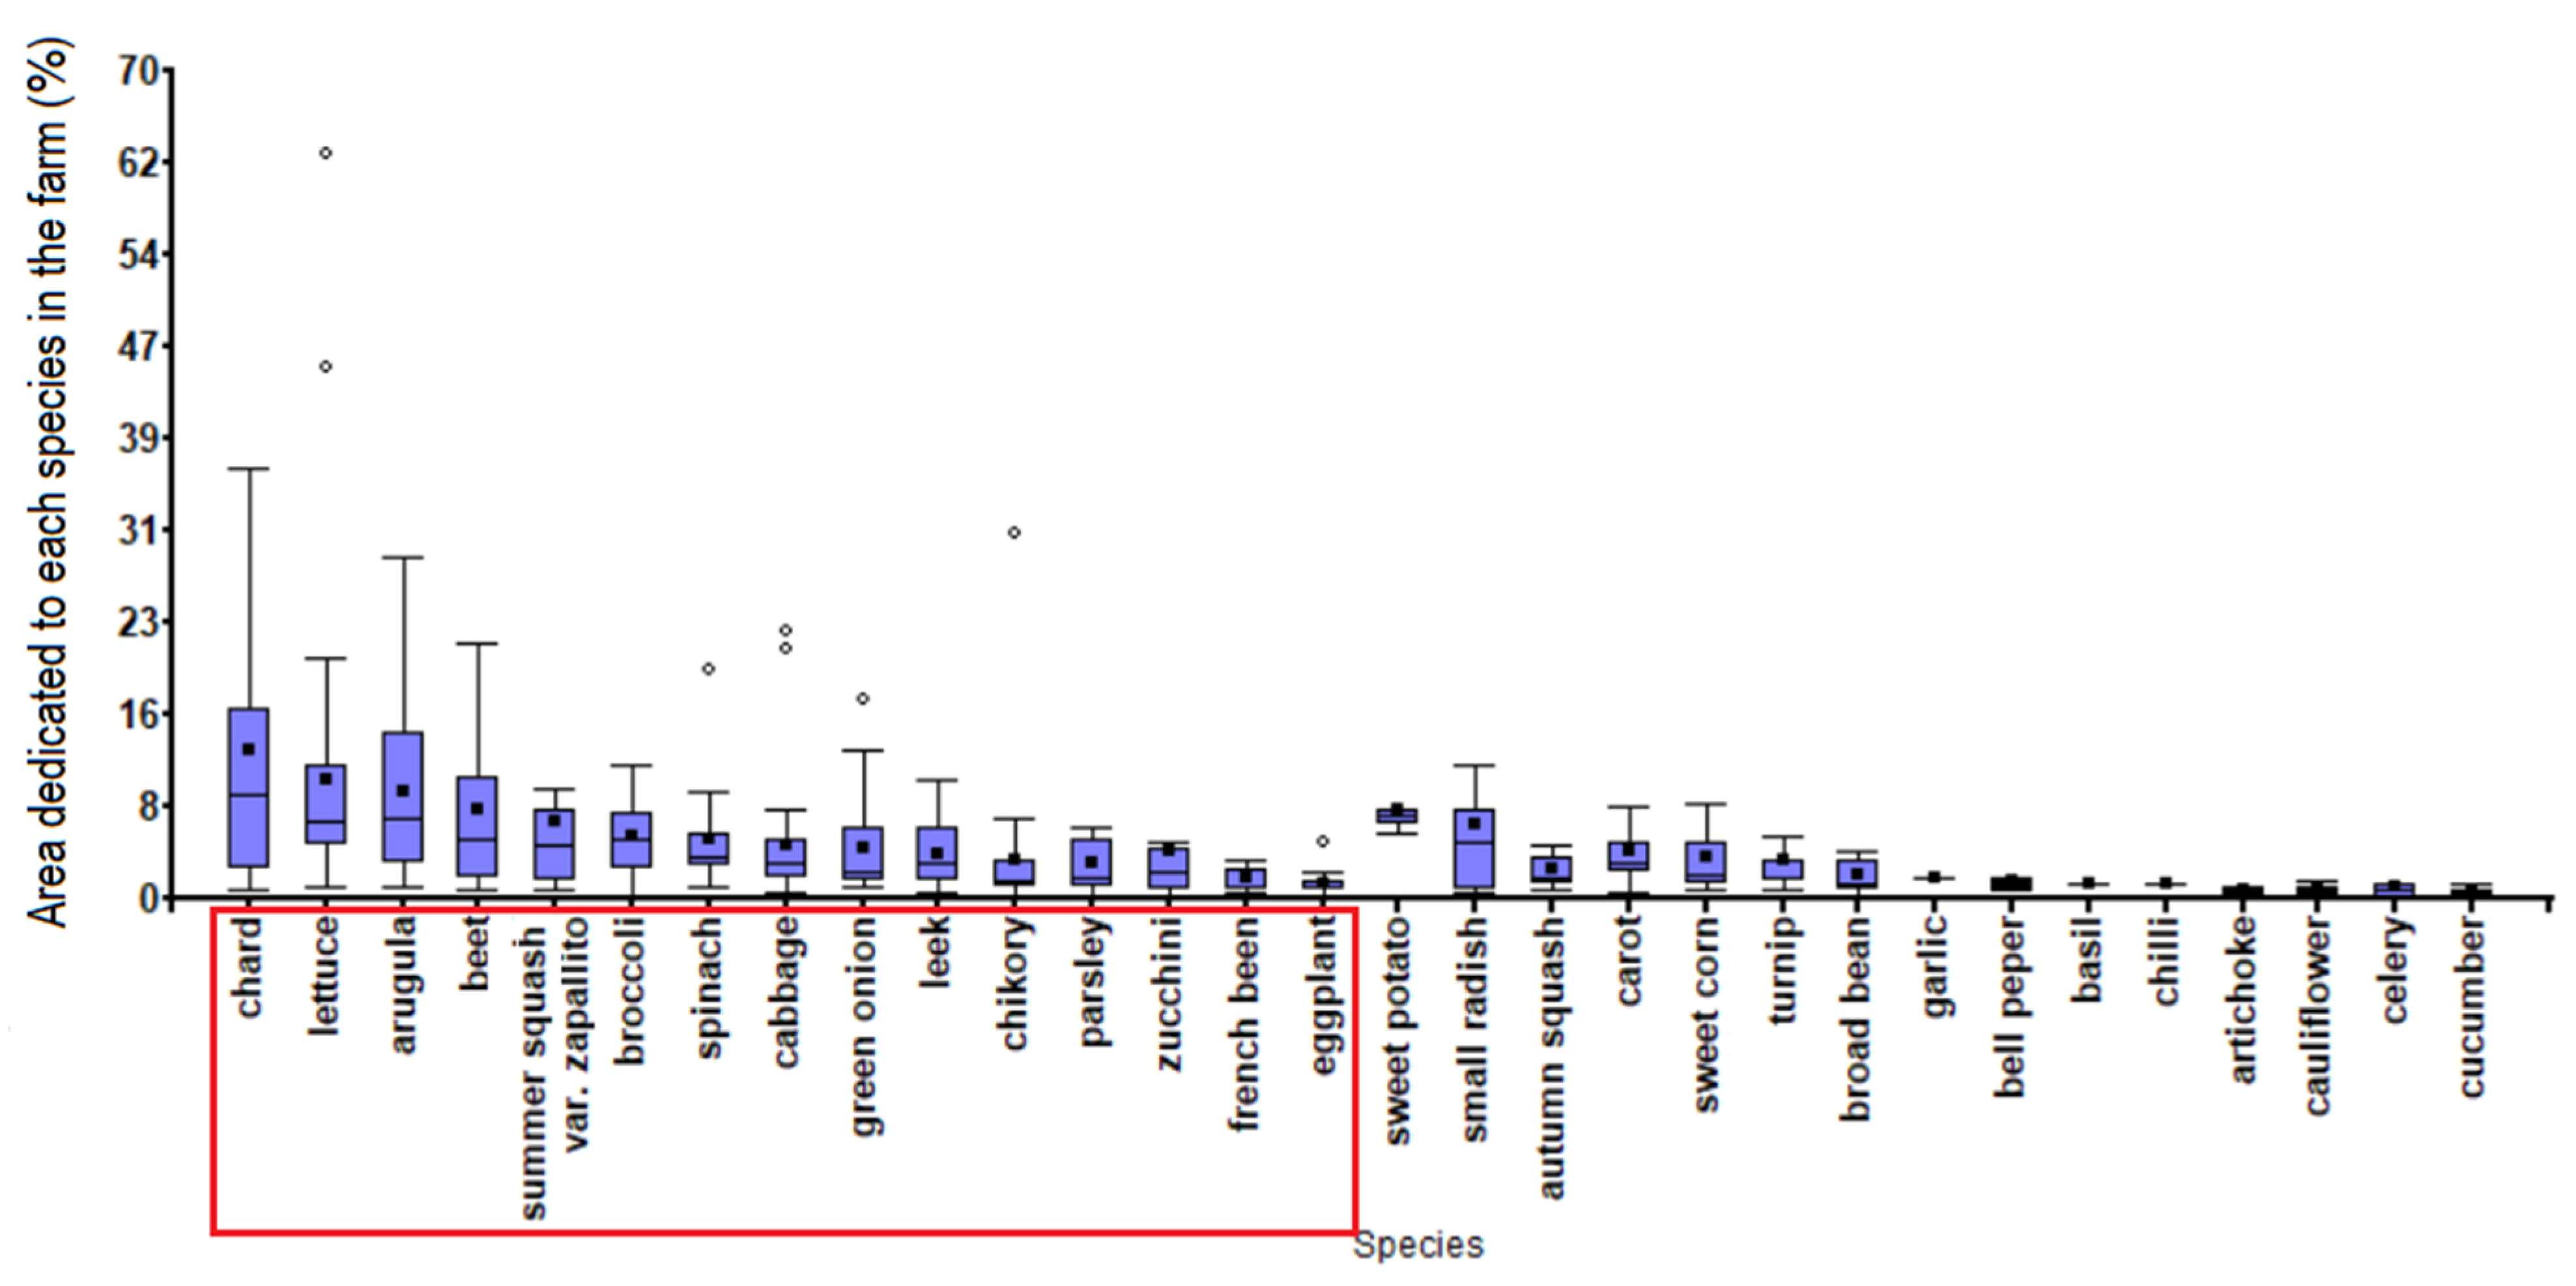
3.1. Dominant Species and Types of Vegetable Crops in the ARCC

During the study period, a total of 30 vegetable species were recorded in the sampled farms, and the 15 most frequent crops resulted: lettuce, chard, beet, cabbage, arugula, leek, chicory, spinach, summer squash var. zapallito, zucchini, green onion, broccoli, eggplant, parsley, and french bean (Figure 4a and Supplementary Materials Tables S1 and S2). The most common vegetable crop types, according to the FAO classification, have been leafy and fruit types (Figure 4b).

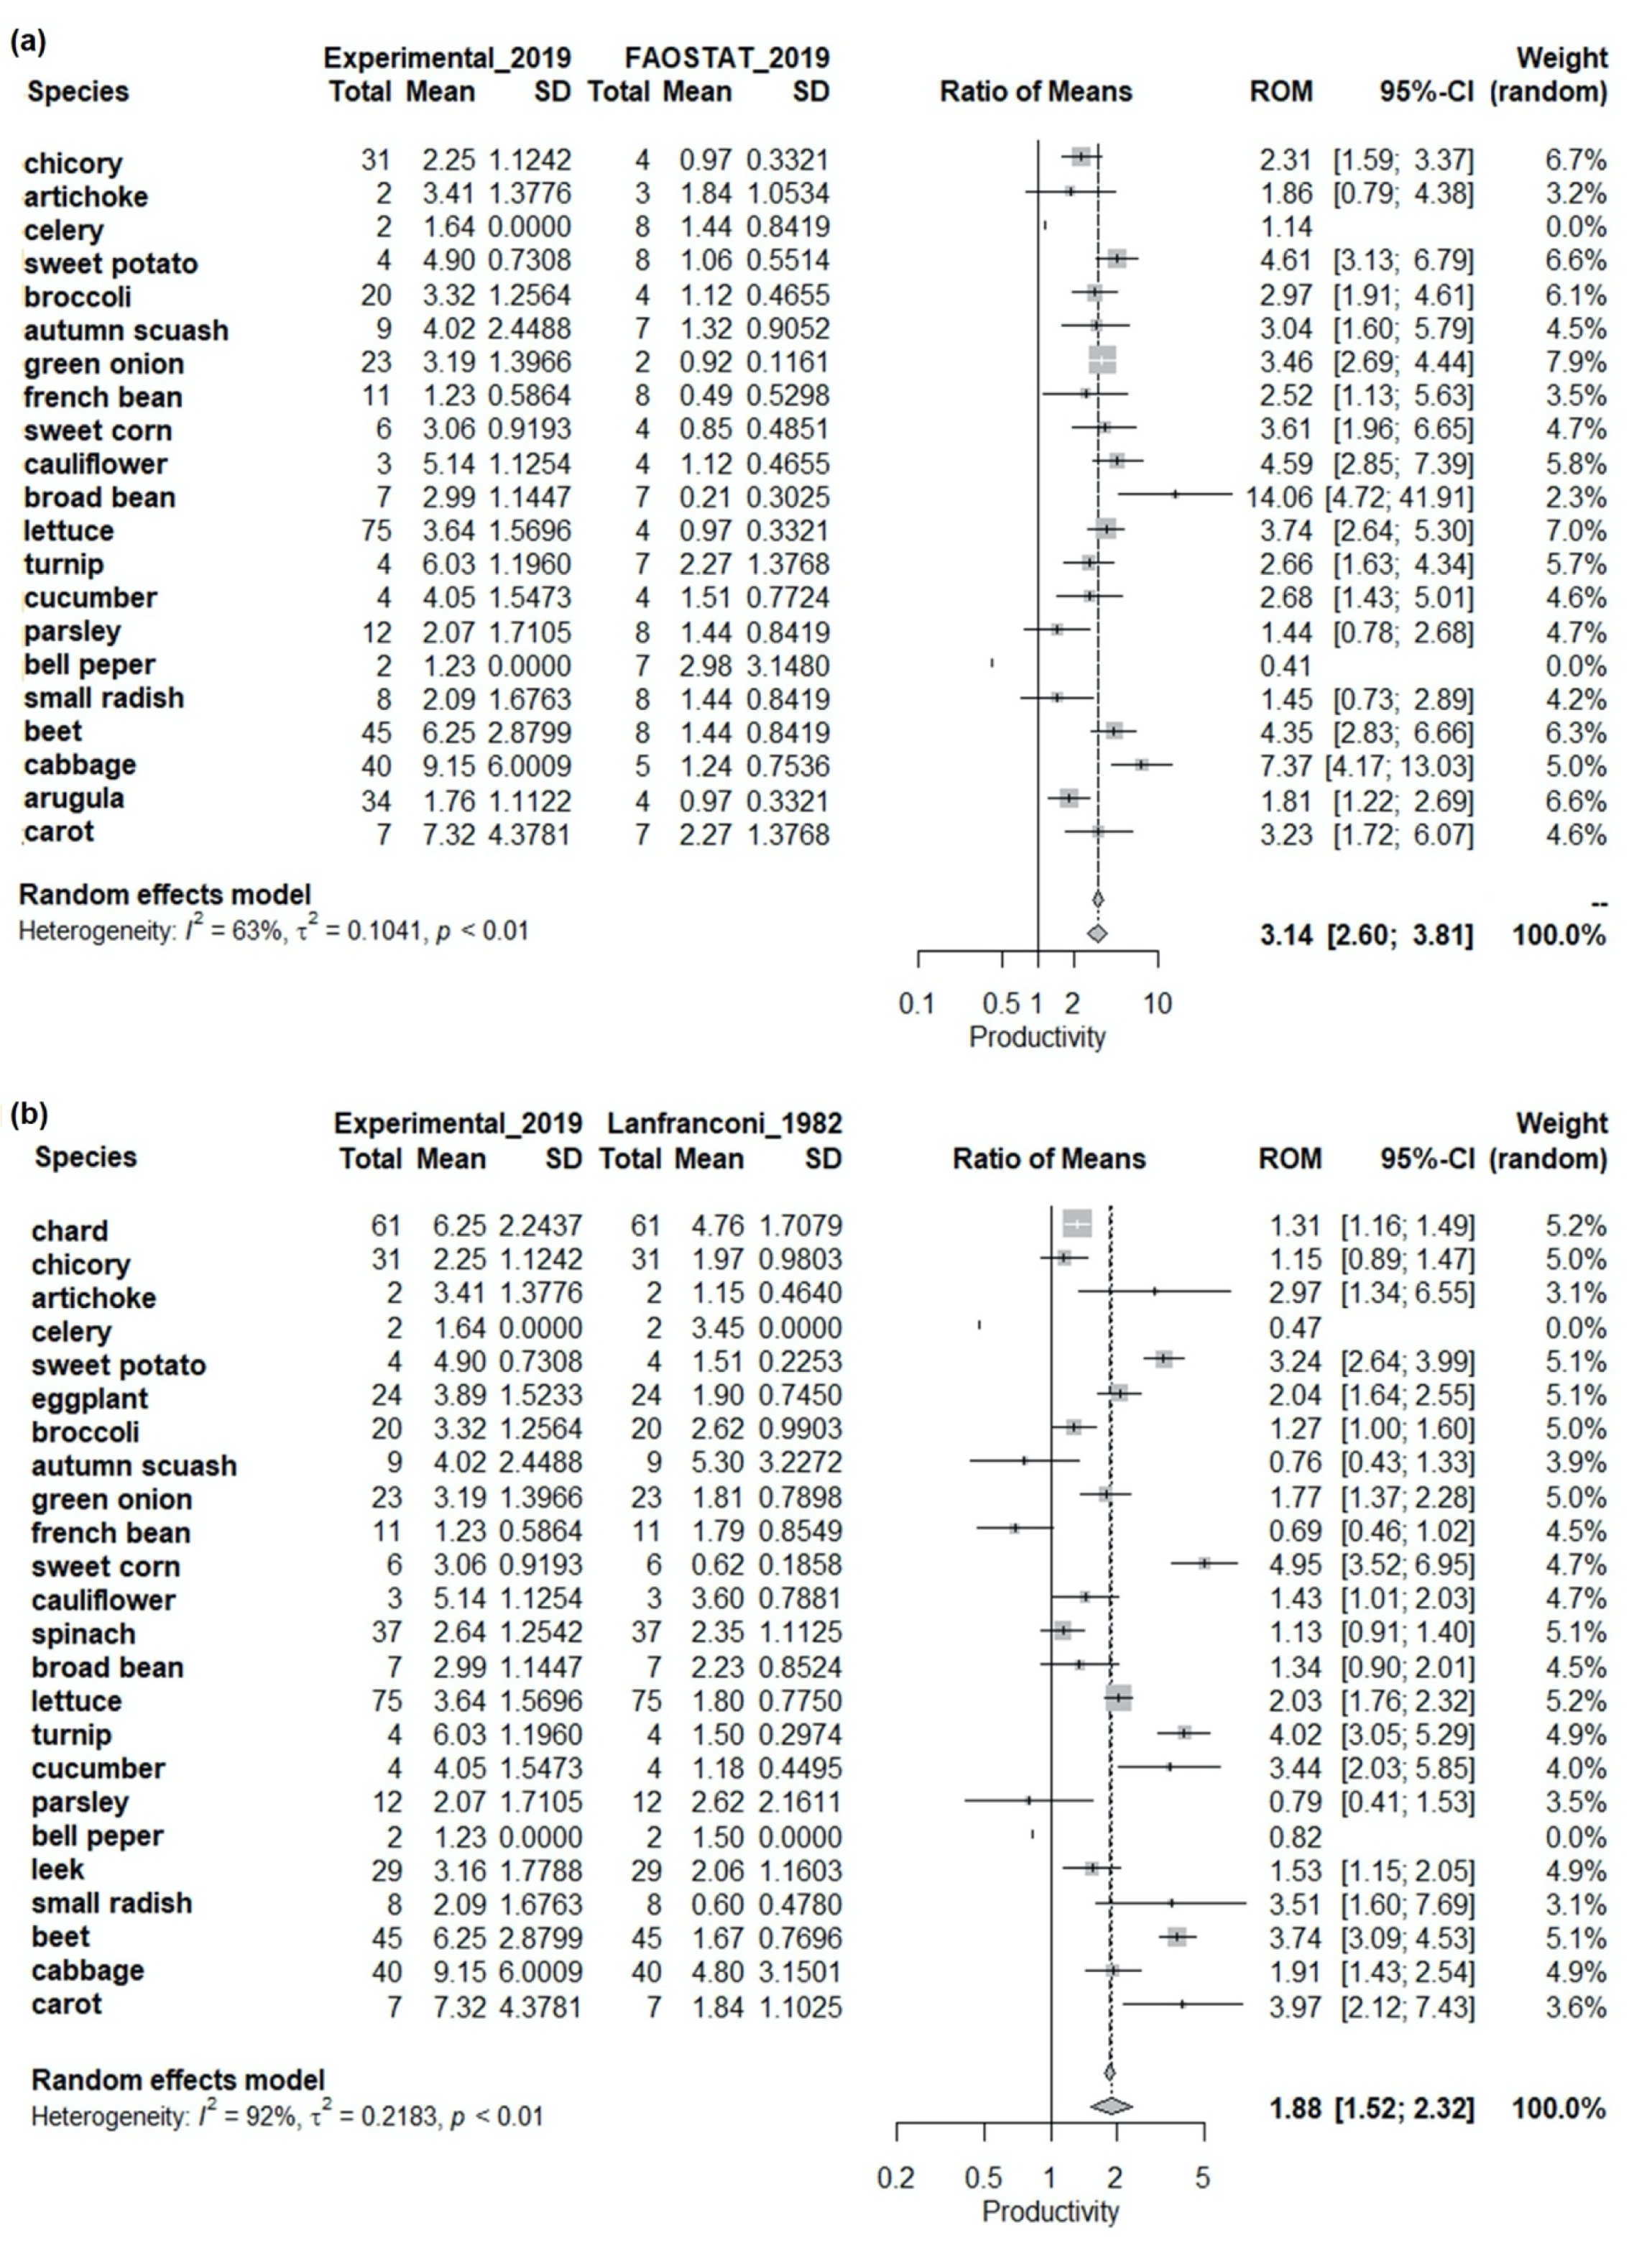
3.2. Mean Productivity per Species

Mean productivity values (kg/m2) have been obtained for each species, considering all the sampling sites and dates (Table 1). The data included all the varieties for each species sampled (e.g., lettuce: crisphead lettuce, butterhead lettuce, romaine lettuce, red leaf lettuce, and green leaf lettuce). In crops such as chard, chicory, and parsley, first- and second-harvest sampling has been included. Cabbage has included two planting densities: 4 plants/m2 and 6 plants/m2, while eggplant has included measurements under an anti-hail net and with no netting (“not sheltered”). The latter species has been measured during the harvest months; however, according to the farmers, the production usually decreases by 40% two months after the start of harvest.
The calculations of productivity in horticultural crops for “fruit”, “root”, and “tuber” (i.e., beet, summer squashed var. zapallito, eggplant, French bean, autumn squash, zucchini, small radish, broad bean, carrot, cucumber, bell pepper, and chili) require a different treatment. In these crops, harvesting is performed gradually or staggered. For this reason, in this work, a model has been fitted considering the harvesting frequency as declared by farmers, and a final productivity value has been assigned per cycle (Table 1).
A “mean vegetable productivity” value (mean productivity of all species) has been estimated at 3.46 kg/m2 in the present study (Table 1). When the model fitted per cycle has been applied to species with more than one harvest per crop cycle, the “mean vegetable productivity” increased from 3.46 kg/m2 to 9.34 kg/m2.
The report of commercial varieties of 16 species is presented in the Supplementary Materials (Table S2). In some cases, it has been not possible to record the variety because the producer did not know or remember it, or it has not been possible to visually differentiate the morphological characters (e.g.,: arugula, green onion, parsley, zucchini, small radish, broad bean, carrot, turnip, cucumber, cauliflower, celery, chili, and basil).
The comparison of the mean productivity of species (Table 1) with local sources orally declared by producers as reported by Lanfranconi et al. (1987) [38] and by Tártara et al. (1998) [29], and with regional and international references of the FAOSTAT platform for 2019 through Forest Plot, have shown that sample productivity has resulted statistically different and higher than the local and regional references (Figure 5a,b).
Exceptions have been recorded for autumn squash, French beans, bell pepper, parsley, and celery compared with data reported by Lanfranconi et al. (1987) [38], probably because they had scarce experimental data and were poorly weighted in calculating the global effect. Regarding the reported global effect, the experimental data are 3.14 times higher than the regional ones [39] and 1.88 times higher than the local values reported for 1982 [38] (Supplementary Materials Table S3).
Productivity values did not show spatial autocorrelation (p-value>0.05). In this sense, no significant differences in the productivity means have been observed between the northern and southern zones of the ARCC (p-value = 0.14), which have resulted in a distance of 50 km. The same behavior has been observed for all the horticultural groups under study.
Slight seasonal variations in the monthly productivity means of fruits and leaves have been observed throughout the year (Figure 6).
The groups, inflorescences and brassicas, tubers and roots, and stems and bulbs, have presented a higher dispersion of the data with an evident impact of seasonality where we observed that the inclusion of a quadratic term in the linear regression of productivity as a function of time resulted in a statistically significant (p < 0.05) and improved goodness of fit. The inclusion of this quadratic term indicates that productivity has a maximum in the month of June (month 6).
Regarding the area cultivated with each species in the farms, among the 15 most frequent species (Figure 4a), the highest values have been recorded for chard, lettuce, and arugula, with means of 12.43%, 10.08%, and 9.13% of the area occupied in the farm, respectively (Figure 7).
Likewise, these species have had the highest SD, with maximum values of 63%, 42.9%, and 28.8%, respectively, indicating that some farms have resulted almost exclusively in the production of these leafy species. Beet and summer squash var. zapallito have ranked second in the means of covered area, SD, and maximum allocated area. In general, most of the species detected in this work have had an allocated area smaller than 5% per farm.
The highest percentage of the productive area of the farm has been allocated to leafy horticultural crops (8.55 %), followed by roots and tubers (6.76 %) (Table 2), while fruit vegetables and roots and tubers have been the crop groups with the highest mean productivity per cycle (kg/m2/cycle) (Table 2).
The estimations of “vegetable crop productivity mean” per crop cycle (kg/m2) as well as the identification of areas suitable for each type of horticultural crop yearly allow to estimate the annual potential food supply. For the 170 farmlands surveyed until 2019, the food supply is 72,881 ton/year. Furthermore, the frequency of each crop type in each farmland and the horticultural area in the peri-urban territory (GIS data) allow to estimate the spatially explicit food supply and design the first territorial cartographic characterization of this ecosystem service, as is shown in Figure 8.

4. Discussion

Rural areas adjacent to cities are under severe pressure, resulting in environmental degradation, biodiversity loss, and decreased ecosystem service (ES) provision for city dwellers [42,43]. Peri-urban areas represent the supply zone of multiple ESs [44,45,46]; in such peripheral areas, food production [47] remains a dominant ES [16,48,49]. The food supply indicator shows the capacity of agricultural peri-urban landscapes to provide ecosystem services to crops [50].
Urban governing bodies appear to be oriented toward converting their peri-urban areas into areas capable of providing food locally [51,52]. This need is linked, on the one hand, to the desire to provide food to cities in a sustainable way and, on the other, to the sense of uncertainty that pervades the current model of food supply. This insecurity is justified by the increasingly unstable geopolitical situations, the continuous and increasingly ruinous natural disasters due to climate change, etc. [53], hence the need to reorient the food production of cities, and especially of metropolises, with a more sustainable and resilient approach that tends to mitigate the impact of such events on the food system [9,54]. In this perspective, implementing the diversification of crops with a high economic value, for example, such as vegetables, fruits, and so on, could secure agriculture-based incomes, hastening growth and cutting rural impoverishment [55,56].
Food supply must be estimated on the basis of the current and potential demand of future populations taking into account the landscape carrying capacity for sustainable land-use planning. Therefore, an accurate measurement of the biomass harvested on a given surface area is needed (i.e., kilograms per square meter) to assign pixel (minimum unit of remote observation)-level productivity to each land use land cover class. In the few databases of vegetable production in the ARCC, data have been not expressed in surface area units, but in “bulk”, “box”, “bunch”, “rows”, or “plots”, based on empirical estimations or producers’ oral reports [29,38]. Consequently, more accurate input data for remote-sensing-based models are needed to obtain reference data for decision-making regarding food provision in peri-urban systems.
In consumer research from Barbero (2012) [57], the most widely consumed species in the area in decreasing order of importance were potato, tomato, chard, onion, carrot, and lettuce. Hence, lettuce and chard have resulted as the two most widely consumed species, in agreement with the highest production frequency in the ARCC (Figure 5a). Among food cultures, the price of vegetables is one of the main factors determining consumers’ behavior [57,58], and it is also a food policy focal point to allow equal access to food supply. Regarding the promotion of diversified consumption, there are only the strategies of producer-consumer fairs and the generation of a network for trading large sacks with diverse seasonal horticultural crops (Supplementary Materials Table S4). However, these isolated actions do not reach most of the population, unlike other public policy strategies assessed in other countries (Supplementary Materials Table S4), such as the food provided at schools or complimentary food bags (given to retired people and low-income sectors), or purchases for soup kitchens of public institutions (hospitals, schools, universities, etc.).
The FAO [58] indicates that diversified production systems of fruits and vegetables are usually more profitable than monocultures for a given land area. Therefore, the production of leafy and fruit vegetable crops rather than of other types (Figure 5b) may be related to the economic decisions of farmers, such as the sales price, production costs, input costs, and the need for rapid economic return. In this sense, leafy vegetables have shorter cycles, whereas fruit species have higher prices and productivity. In particular, integrating the productivity of all species into a single value of “vegetable crop productivity mean” (kg/m2) can be a reference criterion in diversified production contexts (Table 1). This is especially important in highly diversified systems such as agroecological zones, which typically use practices such as multiple cropping systems, intercropping, and the supply of hosts for natural enemies [59], where more than one species per unit is observed. This parameter may be particularly useful considering the current trend toward the diversification of production systems [60]. Considering crops with more than one harvest (i.e., fruit vegetables), the mean of “vegetable crop productivity” increased from 3.46 kg/m2 to 9.34 kg/m2, closer to that reported for diversified horticulture [59,61].
The surveys carried out in the diversified farms have grouped the species according to FAO horticultural crop types [40] with the advantage of generalizing or, rather, including other less frequent or unsampled crops (e.g., coriander, pak choi, tomato) for making estimations. The multiplication of the average area occupied by a type of vegetable crop by the number of species of that type has allowed the estimation of the area occupied by a specific group of crops at a given moment on a farm. For instance, if, as we observed, the leafy species occupy on average 8.55% of the farm area (Table 2), and a producer grows three leafy species, the area occupied with leafy crops will be 25.65% of the farm, with an average productivity of 10.86 kg/m2 (Table 2). Then, the percentage of occupation of a farm can be obtained with the number of species per type. Although this is a coarse estimation of composition, it may be a very useful value to characterize regions of proximal vegetable food.
Regarding the spatial variability of productivity, at the scale of analysis used in this work, the results have indicated that productivity is not conditioned by the site where the farm is located. This conclusion is supported by the fact that in vegetable crop production, plant requirements are met through the management of water, nutrients, tillage, and pest management rather than a local spatial variation of edaphoclimatic factors.
The analysis of the past trajectory of horticulture land use has highlighted its serious risk to collapse due to the strong land use change (−75% from 1988 to 2019) caused by urban sprawl and extensive monocultures. Thus, agricultural policies towards the resilience of this fragile land use are needed to guarantee not only the maintenance of food supply but also the conservation of its cultural role.

5. Conclusions

The provision of ESs in agroecosystems is strongly correlated with the integration of different policy domains, including land use planning, agricultural and environmental policies, etc. [62]. In addition, the governance framework should guarantee space and enact aid for an exchange of interests between stakeholders. In this sense, this paper proposes a methodological framework that can be useful worldwide when up-to-date official productivity data are not available and are a necessary basis for planning, decision-making, and for the implementation of public policies. Diversified farming can include a wide range of agricultural management practices, promoting ecosystem functioning and related ecosystem services such as soil fertility and productivity conservation, as well as crop diversity. Furthermore, the diversity and amount of food provided in a specific area allows inferences regarding food security, the conservation and restoration of biodiversity, and resilience to climate change. In relation to diversification, a total of 30 vegetable species were recorded in diversified farms of the studied area, with 15 species identified as the most frequent crops, as reported in Figure 7, based on the area dedicated to each vegetable species sampled in the farms (in %). In particular, a reference value of “average vegetable productivity” (kg/m2) was obtained, which is very important in highly diversified systems, where multiple cropping systems, intercropping, and the provision of hosts for natural enemies are commonly used practices. It was also found that productivity is not site-dependent, but may be more related to anthropogenic factors, such as production decisions, financial and technological aspects, as well as demand and consumption habits, policies promoting diversification, and land access policies. In this sense, it is necessary to support the supply of fresh local horticultural food with public policies that promote the consumption of more diversified foods, as well as territorial planning and the diversification of production.
Diversified peri-urban horticultural farms, therefore, represent a good example of sustainable agriculture in the face of the challenge of maintaining the provision of ecosystem services while ensuring secure access to food in proximity to megacities. Furthermore, they can represent suitable nature-based solutions in industrial agricultural areas, where crop diversity can mitigate the impact of extensive monoculture. In this perspective, spatial planning policies should consider how to make these agroecosystems resilient, basing development strategies on a good knowledge of the specific agricultural context to be planned, not only in terms of economic productivity but also in ecological and socio-cultural terms.
The approach of this research will allow regular follow-up about the food supply through a periodic classification of land cover and land use in the peri-urban landscape. The results of this research will be the basis for new sustainable agricultural policies focused not only on food security, i.e., agricultural productivity, but also on traditional farmland practices, as well as on fostering cultural and social capital.

Supplementary Materials

The following supporting information can be downloaded at: https://www.mdpi.com/article/10.3390/land12010101/s1.

Author Contributions

Conceptualization, M.V.M., E.B.A.C., B.L.G., I.P., D.V. and C.M.S.; methodology, M.V.M., E.B.A.C., F.G.K., B.L.G. and C.M.S.; software, M.V.M. and F.G.K.; validation, M.V.M., E.B.A.C., B.L.G., I.P., D.V. and C.M.S.; formal analysis, M.V.M., E.B.A.C., B.L.G. and C.M.S.; data curation, M.V.M., E.B.A.C., B.L.G. and C.M.S.; writing—original draft preparation, M.V.M., E.B.A.C., B.L.G. and C.M.S.; writing—review and editing, M.V.M., E.B.A.C., F.G.K., B.L.G., I.P., D.V. and C.M.S.; visualization, M.V.M., E.B.A.C. and F.G.K.; supervision, B.L.G., I.P., D.V. and C.M.S. All authors have read and agreed to the published version of the manuscript.

Funding

The research activities have been funded by Federation Agency for the Economic Development of the City of Córdoba (ADEC): agreements 170 and 210; PIODOS-Ministry of Science and Technology—Government of Córdoba: Resolution 58/2018 Decree 69/2018, the National Scientific and Technical Research Council: 001, and the National Institute for Aerospace Technology: 001.

Data Availability Statement

The authors confirm that the data supporting the findings of the current study are available within the article. Further supplementary data are available from the corresponding author upon reasonable request.

Acknowledgments

Special thanks to the field assistants and to other UNC undergraduate and graduate students who assisted in taking field data. This work could not have been carried out without the commitment of the horticultural producers who allowed access to their properties and offered their kindness and generosity during the field observation days for the dialogue of knowledge and fellowship.

Conflicts of Interest

The authors declare no conflict of interest. The funders had no role in the design of the study; in the collection, analyses, or interpretation of data; in the writing of the manuscript; or in the decision to publish the results.

References

  1. Baldini, C.; Marasas, M.E.; Drozd, A.A. Three Decades of Landscape Change across the Largest Peri-Urban Horticultural Region of Argentina: Urban Growth, Productive Intensification and the Need for Resilient Landscape Management. J. Environ. Plan. Manag. 2021, 65, 1781–1820. [Google Scholar] [CrossRef]
  2. Rolf, W.; Diehl, K.; Zasada, I.; Wiggering, H. Integrating Farmland in Urban Green Infrastructure Planning. An Evidence Synthesis for Informed Policymaking. Land Use Policy 2020, 99, 104823. [Google Scholar] [CrossRef]
  3. Ayambire, R.; Amponsah, O.; Peprah, C.; Takyi, S. A Review of Practices for Sustaining Urban and Peri-Urban Agriculture: Implications for Land Use Planning in Rapidly Urbanising Ghanaian Cities. Land Use Policy 2019, 84, 260–277. [Google Scholar] [CrossRef]
  4. Barsky, A. El Periurbano Productivo, Un Espacio En Constante Transformación. Introducción al Estado Del Debate, Con Referencias al Caso de Buenos Aires. Scr. Nova Rev. Electrónica Geogr. Cienc. Soc. 2005, 9. [Google Scholar]
  5. Díaz, S.; Pascual, U.; Stenseke, M.; Martín-López, B.; Watson, R.T.; Molnár, Z.; Hill, R.; Chan, K.M.A.; Baste, I.A.; Brauman, K.A.; et al. Assessing Nature’s Contributions to People. Science 2018, 359, 270–272. [Google Scholar] [CrossRef] [PubMed] [Green Version]
  6. Cueva, J.; Yakouchenkova, I.A.; Fröhlich, K.; Dermann, A.F.; Dermann, F.; Köhler, M.; Grossmann, J.; Meier, W.; Bauhus, J.; Schröder, D.; et al. Synergies and Trade-Offs in Ecosystem Services from Urban and Peri urban Forests and Their Implication to Sustainable City Design and Planning. Sustain. Cities Soc. 2022, 82, 103903. [Google Scholar] [CrossRef]
  7. TEEB. Ecosystem Services in the City—Protecting Health and Enhancing Quality of Life, Summary for Decision-Makers; Technical University of Berlin, Helmholtz Centre for Environmental Research—UFZ: Berlin, Germany; Technical University of Berlin, Helmholtz Centre for Environmental Research—UFZ: Leipzig, Germany, 2017; p. 40. [Google Scholar]
  8. Lin, B.B.; Philpott, S.M.; Jha, S. The Future of Urban Agriculture and Biodiversity-Ecosystem Services: Challenges and next Steps. Basic Appl. Ecol. 2015, 16, 189. [Google Scholar] [CrossRef]
  9. Opitz, I.; Berges, R.; Piorr, A.; Krikser, T. Contributing to Food Security in Urban Areas: Differences between Urban Agriculture and Peri-Urban Agriculture in the Global North. Agric. Hum. Values 2016, 33, 341–358. [Google Scholar] [CrossRef] [Green Version]
  10. Bradley, K.; Galt, R. Practicing Food Justice at Dig Deep Farms & Produce, East Bay Area, California: Self-Determination as a Guiding Value and Intersections with Foodie Logics. Local Environ. 2013, 19, 172–186. [Google Scholar] [CrossRef]
  11. Pole, A.; Gray, M. Farming Alone? What’s up with the ‘“C”’ in Community Supported Agriculture? Agric. Hum. Values 2013, 30, 85–100. [Google Scholar] [CrossRef]
  12. Obach, B.K.; Tobin, K. Civic Agriculture and Community Engagement. Agric. Hum. Values 2014, 31, 307–322. [Google Scholar] [CrossRef]
  13. DeClerck, F.A.J.; Jones, S.K.; Attwood, S.; Bossio, D.; Girvetz, E.; Chaplin-Kramer, B.; Enfors, E.; Fremier, A.K.; Gordon, L.J.; Kizito, F.; et al. Agricultural Ecosystems and Their Services: The Vanguard of Sustainability? Curr. Opin. Environ. Sustain. 2016, 23, 92–99. [Google Scholar] [CrossRef] [Green Version]
  14. Avtar, R.; Aggarwal, R.; Kharrazi, A.; Kumar, P.; Kurniawan, T.A. Utilizing Geospatial Information to Implement SDGs and Monitor Their Progress. Environ. Monit. Assess. 2020, 192, 35. [Google Scholar] [CrossRef] [PubMed]
  15. Jennings, S.; Cottee, J.; Curtis, T.; Miller, S. Food in an Urbanised World: The Role of City Region Food Systems. Urban Agric. Mag. 2015, 29, 5–7. [Google Scholar]
  16. Zasada, I.; Schmutz, U.; Wascher, D.; Kneafsey, M.; Corsi, S.; Mazzocchi, C.; Monaco, F.; Boyce, P.; Doernberg, A.; Sali, G.; et al. Food beyond the City—Analysing Foodsheds and Self-Sufficiency for Different Food System Scenarios in European Metropolitan Regions. City Cult. Soc. 2019, 16, 25–35. [Google Scholar] [CrossRef]
  17. Perrin, C.; Clément, C.; Melot, R.; Nougarédes, B. Preserving Farmland on the Urban Fringe: A Literature Review on Land Policies in Developed Countries. Land 2020, 9, 223. [Google Scholar] [CrossRef]
  18. Toma, P.; Miglietta, P.P.; Zurlini, G.; Valente, D.; Petrosillo, I. A Non-Parametric Bootstrap-Data Envelopment Analysis Approach for Environmental Policy Planning and Management of Agricultural Efficiency in EU Countries. Ecol. Indic. 2017, 83, 132–143. [Google Scholar] [CrossRef]
  19. Sanyé-Mengual, E.; Specht, K.; Vávra, J.; Artmann, M.; Orsini, F.; Gianquinto, G. Ecosystem Services of Urban Agriculture: Perceptions of Project Leaders, Stakeholders and the General Public. Sustainability 2020, 12, 10446. [Google Scholar] [CrossRef]
  20. IPBES. Summary for Policymakers of the Global Assessment Report on Biodiversity and Ecosystem Services. Popul. Dev. Rev. 2019, 45, 680–681. [Google Scholar]
  21. Novotny, I.P.; Tittonell, P.; Fuentes-Ponce, M.H.; López-Ridaura, S.; Rossing, W.A.H. The Importance of the Traditional Milpa in Food Security and Nutritional Self-Sufficiency in the Highlands of Oaxaca, Mexico. PLoS ONE 2021, 16, e0246281. [Google Scholar] [CrossRef]
  22. Renting, H.; Oostindie, H.; Laurent, C.; Brunori, G.; Rossi, A.; Charollais, M.; Barjolle, D.; Prestegard, S.; Jervell, A.; Granberg, L.; et al. Multifunctionality of Activities, Plurality of Identities and New Institutional Arrangements; Synthesis Report. HAL Open Science: Lyon, France, 2005. [Google Scholar]
  23. la Rosa, D.; Geneletti, D.; Spyra, M.; Albert, C.; Fürst, C. Sustainable Planning for Peri-Urban Landscapes. In Ecosystem Services from Forest Landscapes; Perera, A., Peterson, U., Pastur, G., Iverson, L., Eds.; Springer: Cham, Switzerland, 2018; pp. 89–126. [Google Scholar] [CrossRef]
  24. Ives, C.D.; Kendal, D. Values and Attitudes of the Urban Public Edwards Peri-Urban Agricultural Land. Land Use Policy 2013, 34, 80–90. [Google Scholar] [CrossRef]
  25. Inostroza, L.; Hamstead, Z.; Spyra, M.; Qureshi, S. Beyond Urban–Rural Dichotomies: Measuring Urbanisation Degrees in Central European Landscapes Using the Technomass as an Explicit Indicator. Ecol. Indic. 2019, 96, 466–476. [Google Scholar] [CrossRef]
  26. Sylla, M.; Solecka, I. Highly Valued Agricultural Landscapes and Their Ecosystem Services in the Urban-Rural Fringe–an Integrated Approach. J. Environ. Plan. Manag. 2019, 63, 883–911. [Google Scholar] [CrossRef]
  27. Tilman, D.; Fargione, J.; Wolff, B.; D’Antonio, C.; Dobson, A.; Howarth, R.; Schindler, D.; Schlesinger, W.H.; Simberloff, D.; Swackhamer, D. Forecasting Agriculturally Driven Global Environmental Change. Science 2001, 292, 281–284. [Google Scholar] [CrossRef] [PubMed] [Green Version]
  28. Capitanelli, R. Clima. In Geografía Física de la Provincia de Córdoba; Vázquez, J.B., Ed.; Boldt: Córdoba, Argentina, 1979; pp. 45–138. [Google Scholar]
  29. Tártara, E.J.; Apezteguía, J.; Roberi, A.; Bocco, M.; Adib, O. Caracterización de Los Sistemas Frutihortícolas Bajo Riego Del Cinturón Verde de La Ciudad de Córdoba; Universidad Nacional de Córdoba: Córdoba, Argentina, 1998; p. 45. [Google Scholar]
  30. Direccion General de Estadística y Censos. Indicadores Departamentales de la Provincia de Córdoba. Available online: https://estadistica.cba.gov.ar/conoce-cordoba/ (accessed on 11 July 2022).
  31. Fernández Lozano, J.; La Producción de Hortalizas En Argentina. Report; Gerencia de Calidad y Tecnología, Mercado Central de Buenos Aires: Buenos Aires, Argentina, 2012; Available online: https://www.academia.edu/23974120/La_produccion_de_hortalizas_en_argentina (accessed on 1 June 2020).
  32. Marinelli, M.V.; Valente, D.; Scavuzzo, C.M.; Petrosillo, I. Landscape Service Flow Dynamics in the Metropolitan Area of Córdoba (Argentina). J. Environ. Manag. 2021, 280, 111714. [Google Scholar] [CrossRef] [PubMed]
  33. Barchuk, A.; Suez, L.; Locati, L. Cobertura y Uso de La Tierra En El Área Periurbana de La Ciudad de Córdoba, Argentina. Aportes a La Planificación Territorial. Rev. Asoc. Argent. Ecol. Paisajes 2017, 7, 15–30. [Google Scholar]
  34. Giobellina, B.L. La Alimentación de Las Ciudades. Transformaciones Territoriales y Cambio Climático en el Cinturón Verde de Córdoba; Ediciones INTA: Buenos Aires, Argentina, 2018. [Google Scholar]
  35. Mari, N.A.; Giobellina, B.; Benitez, A.; Marinelli, V. Mapping and Characterizing the Green Belt of Córdoba: Land Dynamics and the Urban-Rural Transformation Process. J. Agron. Res. 2019, 2, 29–46. [Google Scholar] [CrossRef] [Green Version]
  36. Celiz, Y. Transformaciones en Territorios de Interfase un Aporte a la Planificación de Sierras Chicas en Córdoba desde los Socio-Ecosistemas. Ph.D. Thesis, Universidad Nacional de La Plata, La Plata, Argentina, 2020. [Google Scholar]
  37. Giobellina, B.L.; Marinelli, V.; Lobos, D.; Eandi, M.; Bissio, C.; Butinof, M.; Narmona, L.; Romero, M. Caracterización y Mapeo de La Producción Fruti-Hortícola de La Región Alimentaria de Córdoba Córdoba, Argentina; Ediciones INTA: Buenos Aires, Argentina, 2021. [Google Scholar]
  38. Lanfranconi, L.; Tuda, E.; Buteler, M.; Fontán, H.; Beretta, R.; Robledo, C. Situación de Contexto Del Área Central Bajo Riego de La Provincia de Córdoba; Córdoba, Argentina; Report; Estación Experimental Agropecuaria Manfredi: Cordoba, Argentina; Centro Regional Córdoba: Cordoba, Argentina; Instituto Nacional de Tecnología Agropecuaria (INTA): Buenos Aires, Argentina, 1987; Volume I, 100p. [Google Scholar]
  39. FAO. FAOSTAT. Food and Agriculture Organization of the United Nations; Food and Agriculture Organization of the United Nations: Rome, Italy, 2019; Available online: https://www.fao.org/faostat/en/#home (accessed on 1 February 2021).
  40. FAO. Producción de Hortalizas; FAO Bolivia: La Paz, Bolivia, 2011; Available online: https://www.fao.org/3/as972s/as972s.pdf (accessed on 15 November 2021).
  41. R Core Team. R: A Language and Environment for Statistical Computing; R Foundation for Statistical Computing: Vienna, Austria, 2021; Available online: https://www.r-project.org/ (accessed on 15 October 2021).
  42. Baude, M.; Meyer, B.C.; Schindewolf, M. Land Use Change in an Agricultural Landscape Causing Degradation of Soil Based Ecosystem Services. Sci. Total Environ. 2019, 659, 1526–1536. [Google Scholar] [CrossRef]
  43. Chen, T.; Feng, Z.; Zhao, H.; Wu, K. Identification of Ecosystem Service Bundles and Driving Factors in Beijing and Its Surrounding Areas. Sci. Total Environ. 2019, 711, 134687. [Google Scholar] [CrossRef]
  44. Larondelle, N.; Haase, D. Urban Ecosystem Services Assessment along a Rural–Urban Gradient: A Cross-Analysis of European Cities. Ecol. Indic. 2013, 29, 179–190. [Google Scholar] [CrossRef]
  45. Shen, J.; Li, S.; Liang, Z.; Liu, L.; Li, D.; Wu, S. Exploring the Heterogeneity and Nonlinearity of Trade-Offs and Synergies among Ecosystem Services Bundles in the Beijing-Tianjin-Hebei Urban Agglomeration. Ecosyst. Serv. 2020, 43, 101103. [Google Scholar] [CrossRef]
  46. Spyra, M.; la Rosa, D.; Zasada, I.; Sylla, M.; Shkaruba, A. Governance of Ecosystem Services Trade-Offs in Peri-Urban Landscapes. Land Use Policy 2020, 95, 104617. [Google Scholar] [CrossRef]
  47. Busck, A.G.; Kristensen, S.P.; Præstholm, S.; Primdahl, J. Porous Landscapes—The Case of Greater Copenhagen. Urban Urban Green 2008, 7, 145–156. [Google Scholar] [CrossRef]
  48. Gren, Å.; Andersson, E. Being Efficient and Green by Rethinking the Urban-Rural Divide—Combining Urban Expansion and Food Production by Integrating an Ecosystem Service Perspective into Urban Planning. Sustain. Cities Soc. 2018, 40, 75–82. [Google Scholar] [CrossRef]
  49. Świąder, M.; Szewrański, S.; Kazak, J.K.; van Hoof, J.; Lin, D.; Wackernagel, M.; Alves, A. Application of Ecological Footprint Accounting as a Part of an Integrated Assessment of Environmental Carrying Capacity: A Case Study of the Footprint of Food of a Large City. Resources 2018, 7, 52. [Google Scholar] [CrossRef] [Green Version]
  50. Maes, J.; Paracchini, M.L.; Zulian, G. A European Assessment of the Provision of Ecosystem Services—Towards an Atlas of Ecosystem Services EUR-Scie. Ed; Publications Office of the European Union: Luxembourg, 2011. [Google Scholar] [CrossRef]
  51. Moragues-Faus, A.; Morgan, K. Reframing the Foodscape: The Emergent World of Urban Food Policy. Environ. Plan. A Econ. Space 2015, 47, 1558–1573. [Google Scholar] [CrossRef]
  52. Blay-Palmer, A.; Santini, G.; Dubbeling, M.; Renting, H.; Taguchi, M.; Giordano, T. Validating the City Region Food System Approach: Enacting Inclusive, Transformational City Region Food Systems. Sustainability 2018, 10, 1680. [Google Scholar] [CrossRef] [Green Version]
  53. Langemeyer, J.; Madrid-Lopez, C.; Mendoza Beltran, A.; Villalba Mendez, G. Urban Agriculture—A Necessary Pathway towards Urban Resilience and Global Sustainability? Landsc. Urban Plan 2021, 210, 104055. [Google Scholar] [CrossRef]
  54. Nicholls, E.; Ely, A.; Birkin, L.; Basu, P.; Goulson, D. The Contribution of Small-Scale Food Production in Urban Areas to the Sustainable Development Goals: A Review and Case Study. Sustain. Sci. 2020, 15, 1585–1599. [Google Scholar] [CrossRef] [Green Version]
  55. Michler, J.D.; Josephson, A.L. To Specialize or Diversify: Agricultural Diversity and Poverty Dynamics in Ethiopia. World Dev. 2017, 89, 214–226. [Google Scholar] [CrossRef]
  56. Birthal, P.S.; Hazrana, J.; Negi, D.S. Diversification in Indian Agriculture towards High Value Crops: Multilevel Determinants and Policy Implications. Land Use Policy 2020, 91, 104427. [Google Scholar] [CrossRef]
  57. Barbero, M.L. Estudio Sobre Hábitos de Consumo de Frutas y Verduras de Los Consumidores Cordobeses; Programa de Desarrollo Territorial en el Area Metropolitana de Córdoba-ADEC: Córdoba, Argentina, 2012; Available online: https://desarrolloterritorial.adec.org.ar/horticola/images/habitos-de-consumo-de-frutas-y-verduras.pdf (accessed on 1 March 2021).
  58. FAO. Fruit and Vegetables—Your Dietary Essentials; FAO: Rome, Italy, 2020. [Google Scholar] [CrossRef]
  59. Altieri, M.A.; Nicholls-Estrada, C.I. Agroecología Urbana: Diseño de Granjas Urbanas Biodiversas, Productivas y Resilientes; CELIA Ediciones: Medellin, Colombia, 2019. [Google Scholar]
  60. IPBES-FOOD. From Uniformity to Diversity: A Paradigm Shift from Industrial Agriculture to Diversified Agroecological Systems. Report. 2016. Available online: https://www.ipes-food.org/_img/upload/files/UniformityToDiversity_FULL.pdf (accessed on 10 April 2021).
  61. Sarmiento, C. Evaluación de La Sustentabilidad de Establecimientos Rurales Orgánicos. Ph.D. Thesis, Universidad Nacional De Río Cuarto, Río Cuarto, Argentina, 2018. [Google Scholar]
  62. Holt, A.R.; Alix, A.; Thompson, A.; Maltby, L. Food Production, Ecosystem Services and Biodiversity: We Can’t Have It All Everywhere. Sci. Total Environ. 2016, 573, 1422–1429. [Google Scholar] [CrossRef] [PubMed]
Figure 1. Map showing the study area characterized by the diversified horticultural farms in the ARCC.
Land 12 00101 g001
Figure 2. Maps showing the horticultural class in 1988 (a), 2004 (b), and 2019 (c). Map of horticultural class change from 1988 to 2019 (d).
Land 12 00101 g002
Figure 3. Flow chart of the methodology used to estimate fresh food supply in the ARCC, Argentina.
Land 12 00101 g003
Figure 4. Sampling frequency of vegetable crops in diversified farms from the ARCC: (a) The recorded species during the sampling. (b) Frequency per type of vegetable crops, according to the morphological FAO classification [40].
Land 12 00101 g004
Figure 5. ForestPlot of the ratio of means: (a) between sampled data and regional reference (source of regional data FAO, 2019 [39]); (b) between sampled data and local reference of 1982 (source of local data Lanfranconi et al., 1987 [38]).
Land 12 00101 g005
Figure 6. Mean productivity (Kg/m2) per cycle in a year for each type of vegetable crops in diversified farms of the ARCC for the 2018–2019 period. The trend line corresponds to a linear regression of productivity.
Land 12 00101 g006
Figure 7. Area (%) dedicated to each vegetable species sampled in the farms of the ARCC. The red box groups the 15 most frequent species.
Land 12 00101 g007
Figure 8. Estimated food supply (ton/year) of vegetable crops in each diversified farm of the ARCC for the 2018–2019 period: in (a) the northern part of the study area, while in (b) the southern part of the study area. For the 170 farmlands, the estimated total food supply is 72,881 ton/year.
Land 12 00101 g008
Table 1. Mean productivity per cycle (kg/m2) of vegetable species in diversified farms of the ARCC during the period from September 2018 to December 2019.
Mean Productivity per Cycle (kg/m2)
SpeciesnMeanS.D.MinMax
lettuce753.641.570.6210.42
chard616.252.24212.08
beet *4512.55.763.3528.84
cabbage409.1561.2823.22
spinach372.651.250.655.38
arugula341.771.110.34.42
chicory312.261.120.54.42
leek293.161.780.297.5
summer squash var. zapallito *2627.1313.436.459.1
eggplant *2415.556.097.7635.75
green onion233.21.41.548.21
broccoli203.331.261.445.82
parsley122.081.710.24.4
french bean *1112.265.862.5221.93
autumn squash *916.19.794.8434.56
zucchini *942.6816.522.881.65
small radish *82.091.680.224.41
broad bean *711.954.586.7417.61
carrot *714.658.765.3530
sweet corn63.060.921.744.41
sweet potato44.90.7345.79
turnip46.031.24.387.19
cucumber *440.4715.472057.4
cauliflower35.141.134.386.43
artichoke23.411.372.444.38
celery21.6401.641.64
bell pepper *212.25012.2512.25
chili *17.6507.657.65
garlic10.3100.310.31
basil10.8900.890.89
Global production 9.34
* Species with more than one harvest per crop cycle. The reported arithmetic mean corresponds to the model of harvest per cycle for each species.
Table 2. Farm area (%) and monthly productivity means (kg/m2) for each type of vegetable crops. The highest values are highlighted in grey.
TypenCovered Farm Area (%)Mean Monthly Productivity (kg/m2)
Leaves258.553.62
Roots and Tubers *686.7610.91
Inflorescences and Brassicas654.477.00
Stems and Bulbs553.873.07
Fruit vegetables *993.2020.59
* Types of vegetable crops with species with more than one harvest per crop cycle.
Disclaimer/Publisher’s Note: The statements, opinions and data contained in all publications are solely those of the individual author(s) and contributor(s) and not of MDPI and/or the editor(s). MDPI and/or the editor(s) disclaim responsibility for any injury to people or property resulting from any ideas, methods, instructions or products referred to in the content.

