Abstract
Ecosystem services (ES) are the contribution of ecosystem structure and function to human well-being, connecting natural and socio-economic systems. ES trade-off/synergy has been one of the critical issues in sustainable environmental governance for guiding and formulating environmental policies. However, science-to-practice framework for ecosystem services trade-off/synergy governance are still rare. This study presents a comprehensive framework for identifying and managing trade-off and synergy of ESs in an urbanizing region. Using Guangdong-Hong Kong-Macao Greater Bay Area (GBA)—one of the fastest urbanizing regions in China—as a case, this study identified major ecosystem service bundles (ESBs) and applied the comprehensive framework to inform ES trade-off/synergy governance. The results showed that there were three stable ESBs in the GBA, and that ESB 1 (high grain production) and ESB 2 (high carbon sequestration) should be increased, and ESB 3 (all ES provision are low) should be increased. Moreover, there was large spatial–temporal change in ESBs in the central area of the GBA during 2000–2015 due to population and land urbanization. This study provides valuable information for sustainable land management and environmental governance in an urbanizing region.
1. Introduction
Ecosystem services (ES) refer to the natural environmental conditions and utilities on which human beings depend for their formation and maintenance, and are all the benefits that humans derive directly or indirectly from ecosystems [1], covering both physical services (such as grain production) and intangible ES (such as aesthetic or cultural values). The ES concept intuitively explains how nature contributes to human well-being, thereby enhancing the consideration of nature in sustainable environmental governance [2]. Sustainable environmental governance often requires the management of multiple types of ES [3]. Because of the shared socio-ecological systems, a set of ES may recur in different landscapes, known as ES bundles (ESBs) [4]. The complexity of socio-ecosystem requires new empirically based research on the trade-offs of multiple ecosystems [5], while ESBs provide a new way to understand the relationships between multiple ecosystems [6,7]. ESBs are defined as mixtures of ES sets with significant correlations [8], which are sets of ES that occur repeatedly together across space or time [9]. These sets of ES are closely related to ES trade-offs and synergies [8]. Quantification of ESBs can capture the links between specific ecosystems and human-dominated land use and its associated ecosystems [10].
ES trade-offs/synergies are increasingly used for managing ESBs [11]. The trade-off is that the relationships between different types of ES conflict with each other, and synergy refers to the simultaneous increase or decrease of two or more types of ES [12]. It is vital to note that not every ES can maximize its provision at the same time, and when anthropogenic activities continue to alter ES to obtain a larger specific ES, other types of ES will be affected [13]. Governments or societies must make natural resource management decisions based on relative demand preferences for different ES to maximize the overall benefits of ES as much as possible. Therefore, in-depth study of the trade-offs and synergies of ES is of great significance to promote regional sustainable environmental governance and achieve “win-win” for human well-being, ES, and natural capital management.
Currently, there are rich studies on trade-offs and synergies in ES. For example, Bennett et al. [13] pointed out that maximizing the production of one ES often led to a significant reduction in the generation of other ES, and the study proposed the types of relationships between ES based on the role of drivers and the interaction between ES. Zhao et al. [14] took the Pearl River Delta as the research object, applied K-means clustering and redundancy analysis to identify regional ESBs, and quantitatively analyzed the static trade-offs/synergies of eight ES in the year 2010. However, recent studies are still in the stage of theoretical analysis and model simulation, and how to transform the scientific cognition of relevant research results into decision-making application still needs further work [15]. Moreover, spatiotemporal change of the interactions between various types of ES has not yet been clarified, which requires researchers to carry out relevant explorations to provide a scientific basis for environmental governance.
Rapid urbanization is shaping the landscape of land use and putting enormous pressure on ecosystems [16]. Changes in urban land use patterns and the growth of urban populations have accelerated the process of urbanization, affecting the relationship between ES. In terms of land use, the reduction of arable land and the increase in construction land have led to reduction of net productivity [17], water conservation [18], climate regulation [19], soil and nutrient retention [20], carbon storage [21], habitat conservation [22], etc. In general, urbanization has not only changed the human demand for ES [23] but also changed the potential supply of ES in the process of urbanization, mainly creating a trade-off between provisioning services and regulating services.
China is one of the developing countries with rapid urbanization. Over the past 40 years, China has experienced rapid urbanization and an immense growth in population as the consequence of economic and political reforms in 1978 [24]. China has entered a period of accelerated development in the past 40 years. In the year 2011, the urban population finally exceeded the rural population [24,25]. It is expected that by 2030, the urbanization level in China will reach 60% [24,25]. The ever-increasing number and scale of cities and the resulting shift in the original landscape at different scales resulted in changes to the local biogeochemical cycles, leaving enormous challenges in mitigating biodiversity loss and improving ES and human well-being [26,27,28,29,30,31]. The Guangdong-Hong Kong-Macao Greater Bay Area (GBA) is one of the fastest urbanizing regions in China, experiencing a significant period of population urbanization and land urbanization [32]. Rapid urbanization has dramatically altered land-use/land-cover patterns and ecosystems in the region, resulting in widespread ecological problems such as habitat fragmentation, ecosystem degradation, and reduced ES [33]. These problems restrict the sustainable development of the GBA. In the face of challenges, the GBA is carrying out the practice of regional ecological integration planning and management cooperation, and urgently needs the guidance of relevant theories and methods. Thereupon, the aims of this study are (1) to present a comprehensive framework to identify and manage trade-off and synergy of ES in an urbanizing region and (2) to apply the framework to the GBA’s environmental governance. The specific objectives are as follows: (1) to quantitatively identify the typical ESBs and their major ES in the GBA, (2) to analyze the spatial–temporal change of trade-offs/synergies among the major and other ES, and (3) to propose the collaborative management process of major and other ES and trade-offs/synergies of ES. This study can provide scientific support for ES approach from science to practice.
2. Material and Methods
2.1. Study Area
Located in the Pearl River Delta region (21°25′ N–24°30′ N, 111°12′ E–115°35′ E) (Figure 1), the GBA is the fourth largest bay area in the world after the New York Bay Area, the San Francisco Bay Area, and the Tokyo Bay Area. The GBA is the largest area in the plain of China’s southeast coastal region, including nine cities such as Guangzhou, Foshan, and Zhaoqing, and the two special administrative regions of Hong Kong and Macao (“9 + 2” pattern), with a total area of 65,010.5 km2, surrounded by hills and mountains to the west, north, and east, forming a natural shelter and a coastline of 1059 km in the south with numerous islands
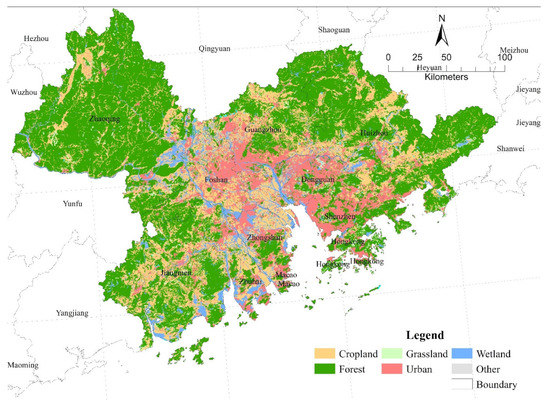
Figure 1.
Study area.
The GBA has a subtropical and tropical monsoon climate, with an average annual precipitation from 1300 to 2500 mm and an average annual temperature of 22.3 °C. Affected by the monsoon, the summer has high temperatures and is rainy, the winter is mild and rainy, and the light, heat, and water resources are abundant. The vegetation is rich in types, mainly subtropical evergreen broad-leafed forests. The terrain is high in the north and low in the south, the mountains are mainly distributed in the northeast and northwest, and the central and other coastal areas are dominated by plains.
The permanent population of the GBA is about 71 million. Although this urban agglomeration accounts for only 0.58% of China’s land area and accommodates about 5% of China’s population, it accounts for 12.25% of the country’s GDP and has become a focus of the national development strategy [31,32,33]. The total population of the GBA as a whole showed an upward trend, from 5004.08 million in 2000 to 6957.16 million in 2017, with a population growth of nearly 20 million [31,32,33]. Since 2000, the economy of the GBA has developed rapidly, and the total GDP of the GBA in 2017 exceeded 10 trillion yuan, 2000–2017. The annual growth rate exceeds 8 trillion RMB (taking into account the exchange rates of Hong Kong dollars, the annual exchange rate is 0.85).
2.2. Data Collection and Ecosystem Type Classification
Spatial–temporal ecological data and social statistics data of the GBA were collected for ES assessment (Table 1):

Table 1.
Data Collection.
For ecosystem type classification, land use and land cover (LULC) data from 2000 and 2015, with a spatial resolution of 30 m, was collected by the Resources and Environmental Scientific Data Center (RESDC) of the Chinese Academy of Sciences (CAS) (https://www.resdc.cn/) accessed on 15 May 2020. In this study, six main ecosystem types (Cropland, Urban, Forest, Grassland, Wetland, and Other) were further classified corresponding to twenty-one LULC types in the GBA in preparation for ES assessment (Table 2). Table 2 showed the ecosystem type classification.
Table 2.
Ecosystem Type and Land Use and Land Cover (LULC) Type.
2.3. Identify Critical Problems and Ecosystem Services Framework Design
Based on literature review and expert consultation for critical problems identification, land urbanization in 2000–2015 has led to prominent ecological and environmental problems such as the reduction and fragmentation of ecological space, flooding, soil and water loss, carbon loss, etc. [33,34,35].
The GBA has taken many conservation measures to protect ecological space and functions. Managing ecological product and services in a sustainable way is one of the major challenges facing by the GBA.
2.4. Quantify and Sample Ecosystem Services
In this study, quantitative assessment of ES was based on widely used ES assessment methods or models according to Ouyang et al. [36].
- (1)
- Rainstorm runoff regulating service:
Using the simulated runoff coefficient method and the SCS-CN model [37,38], the stormwater runoff regulation service at the city scale was calculated. The formula and parameters of this ES were according to Wang et al. [31]:
where in Q is the daily runoff (runoff depth, mm); P is the daily rainfall (mm); R is the runoff coefficient (dimensionless); S is the potential maximum storage load of the soil (mm); and CN is the number of runoff curves (dimensionless), among which the main reference factors of CN value include soil hydrological grouping (K), pre-soil moisture classification (AMC), and feature cover type (LC).
- (2)
- Soil conservation service:
The modified General Soil Erosion Equation (RUSLE) was used to estimate the potential soil erosion and the actual soil erosion in the region, and the difference between the two is the soil conservation service of the ecosystem in the region, which can be regarded as the supply of soil conservation services in the region [31,37,38]. The reference for calculating the amount of soil conservation services is according to Wischmeier et al. [39]:
where Qsr is the amount of soil retention (t/ha); R is the rainfall erosion force factor (MJ·mm·hm−2·h−1·a−1), expressed in terms of the multi-year average annual rainfall erosion index, the specific accounting method is shown in formula (3); K is the soil corrosibility factor (t·hm2·h·hm−2·MJ−1·mm−1), expressed as soil erosion per unit of rainfall erosion force on the standard sample; L is the slope length factor (dimensionless); S is the slope factor (dimensionless); C is the vegetation cover factor (dimensionless); and P is the soil and water conservation measure factor (dimensionless). The actual amount of soil erosion refers to the actual amount of soil erosion produced by the population agglomeration area under the current vegetation cover conditions and soil and water conservation engineering factors, and the potential soil erosion amount is the amount of soil erosion that may be generated by the ecosystem of the population agglomeration area without vegetation cover and soil and water conservation engineering factors; generally, the latter is higher than the former.
- (3)
- Water conservation service:
The formula and parameters of water conservation (retention) service were according to [31,37]:
where Qwr—Water conservation (m3/a); Pi—Rainfall (mm/a); Ri—Surface runoff (mm/a); ETi—Evapotranspiration (mm/a); Area of A i-i ecosystems (m2); i—Type i ecosystems (dimensionless); n—Total number of ecosystem types (dimensionless). Note: The data of rainfall, surface runoff, and evapotranspiration in the accounting area are obtained from the relevant literature of the meteorological department or the accounting area.
- (4)
- Grain production service:
Cropland is the main ecosystem type for crop production, and the Normalized Difference Vegetation Index (NDVI) value can effectively reflect crop production capacity [40]. For calculating this ES, the formula was according to [40]:
where CYi,k is the crop yield of cropland pixel i in district/county k (kg/km2); CYk is the average crop yield of croplands in district/county k (kg/km2), which can be derived from the Guangdong Province Statistics Yearbook and the Hong Kong and Macao Statistics Book; NDVIi,k is the NDVI value of cropland pixel i in district/county k; and NDVImean,k is the mean cropland NDVI value in district/county k. According to Zhao, Peng, Liu, Li, and Wang [14], crop yields in each district/county are distributed on cropland cells based on cropland NDVI values. The average crop yield (kg/km2) of cropland in each district/county can be obtained from the Guangdong Rural Statistical Yearbook and the statistical yearbooks of local cities and the Hong Kong and Macao Special Administrative Regions.
- (5)
- Carbon sequestration services:
Net ecosystem productivity (NEP) is an important scientific indicator for quantitative analysis of ecosystem carbon sources/sinks, and ecosystem carbon sequestration can be measured by the NEP method [31,37]. For calculating this ES, the formula and parameter was according to [31,37]:
where QtCO2 is carbon sequestration in terrestrial ecosystems (t·CO2/a) and NEP is net ecosystem productivity (tC/A).
NEP is widely used in carbon cycle studies. NEP can be obtained from net primary productivity (NPP) minus the consumption of vegetation respiration or converted according to the correlation conversion coefficient of NPP and NEP, and then the mass of fixed carbon dioxide in terrestrial ecosystems is measured.
Based on the identification of critical ecological problems and the assessment of ES in the preceding paragraph, this case study used a grid with a spatial granularity of 1 km × 1 km to spatially sample five ES in the years 2000 and 2015 as pre-preparation for ESB analysis and trade-off/synergy in the GBA.
2.5. Evaluate Trade-Offs and Synergies of Ecosystem Services
- (1)
- Calculation of correlation coefficients between ES [9,14]: Through the standardization of de-dimension treatment, the correlation analysis was carried out by using SPSS, and the correlation coefficient matrix between water conservation service, soil conservation service, rainstorm runoff service, carbon sequestration service, and gain production service were obtained.
- (2)
- Evaluation of intensity of trade-offs/synergies between ES [14]: If the correlation coefficient between a pair of ES passes the horizontal significance test and the correlation coefficient is negative, there is a significant trade-off between the pairs of ES. Conversely, if the significance test is passed, but its value is positive, it is a significant synergy for ES.
In this study, Pearson correlation analysis was performed on each pair of ES by SPSS 26. Through Pearson correlation analysis, we can determine whether there is a significant correlation among ES and determine the direction of the correlation and the strength of the correlation. The correlation between the dominant ES and other ES in the ESB was analyzed as a basis for quantifying ES trade-offs and synergies.
2.6. Investigate Spatial–Temporal Pattern of Ecosystem Service Bundles
ESBs are a combination of ES and the dominant functional representations in ecosystem versatility [6]. ESBs can often be detected with interactions of multiple ES in natural landscapes, e.g., forest, wetland, and semi-natural landscapes such as cropland [9,41]. In order to identify multiple ESBs that recur in regionally similar landscapes, spatial clustering methods could be applied to cluster ES values in spatial meshes [9,41]. We identified distinct ESBs types using K-means cluster analysis through IBM SPSS Statistics for Windows, Version 26.0. Armonk, NY: IBM Corp, a constrained multivariate linear response method [14], and explored the relationships between land-use distribution and multiple ES. Three ESBs types in the GBAs were identified by K-means cluster analysis (sampled by spatial granularity of 1 km × 1 km). Their values were standardized for comparison with each other (Table 3).
Table 3.
Distinct ecosystem service bundles in the Greater Bay Area in 2000 and 2015.
Through spatial clustering methods, the interactions of five critical types of ES (water conservation service, soil conservation service, rainstorm runoff regulating service, carbon sequestration service, and grain production service) and typical ESBs in the GBA were identified. The correlation analysis method was used to quantitatively analyze the strength and weakness of the trade-offs/synergies of ES.
2.7. Put Forward Environmental Governance Strategies
In this step, the environmental governance of the study area should attach importance to the guidance of ES theory instead of emphasizing short-term engineering and technical measures and ignoring the long-term sustainable ecosystem conservation [41,42,43]. At the same time, ecological restoration should establish a systematic thinking, with the goal of regional ecosystem restoration, and guide the ecosystem protection and restoration of the study area from the perspective of the multifunction of ecosystems (Figure 2).
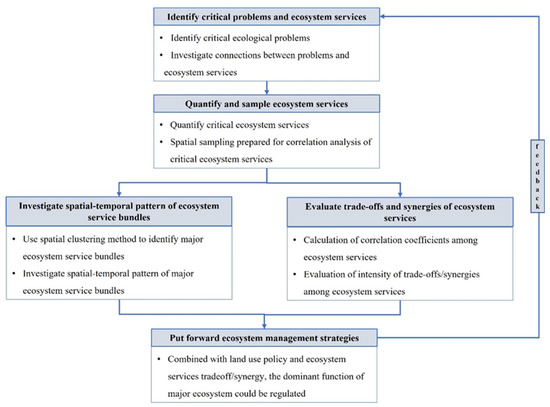
Figure 2.
Framework of ecosystem service bundle identification for ecosystem services trade-off and synergy governance.
3. Results
3.1. Spatial–Temporal Change and Ecosystem Transition and Change
From 2000 to 2015, it was found that the urban ecosystem with the largest change increased by 2719 km2, with an increase of 53.5%. Cropland ecosystem decreased the most, by 1907 km2, or approximately 13.2%. The forest ecosystem also showed a downward trend, with a total reduction of 708 km2, approximately 2.3%. The wetland ecosystem also showed a slight downward trend, decreasing approximately 6.0%. Grassland ecosystem showed an upward trend with an increase of approximately 11.0%.
From 2000 to 2015, the natural and semi-natural ecosystem had a large transition to urban ecosystem (Table 4). As Table 3 shows, the most ecosystem transition was the cropland to urban ecosystem during 2000–2015 by 2028.75 km2, the next was forest to urban ecosystem by 914.46 km2, and the third was wetland to urban ecosystem by 626.62 km2.
Table 4.
Ecosystem transition matrix between 2000 and 2015 in the Greater Bay Area (Unit: Area km2).
Figure 3 shows that the spatial–temporal change of the main ecosystem occurred mainly in the central area of the GBA. For instance, cropland close to the mouth of the Pearl River was greatly changed to urban ecosystem during the period from 2000 to 2015. This spatial–temporal change of ecosystem largely influenced the distribution of ES supply in the study area.
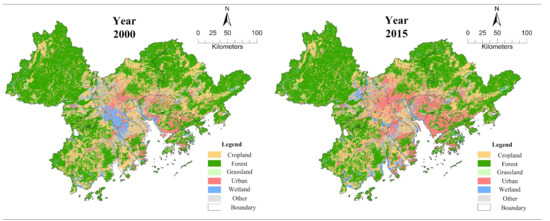
Figure 3.
Spatiotemporal pattern of main ecosystem types in the Greater Bay Area.
3.2. Investigate Spatial–Temporal Pattern of Ecosystem Service Bundles
By comparing the spider web diagrams of ES in the three sets of ESBs after standardization (Figure 4), each ES supply potential in each of the ESBs can be compared. The dominant ES in each ES bundle can be identified in the GBA: the dominant ES of the ESB 1 is grain production (grain production); The dominant ES of ESB 2 is carbon sequestration service, and the ESB 3 has no prominent dominant ES.
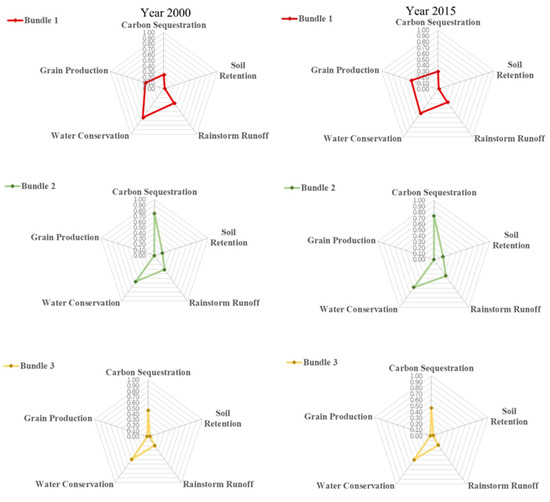
Figure 4.
Spider web map of ecosystem service bundle in the Guangdong-Hongkong-Macao Greater Bay Area. Note: Ecosystem Service Bundle 1 (ESB 1)—red; Ecosystem Service Bundle 2 (ESB 2)—green; Ecosystem Service Bundle 3 ESB 3)—yellow.
Taking 2000 as the base year and combining land use changes, the spatial–temporal pattern evolution of ESBs in 2015 after fifteen years of rapid urbanization was analyzed. As shown in Figure 3, three more stable ESBs were formed from 2000 to 2015. ESB 1 of ES had a relatively high supply of grain production and low supply of carbon sequestration service. ESB 2 had a high carbon sequestration supply and a low grain production supply, while the supply of all of the ES in ESB 3 are all relatively low. Compared with 2000, the grain production supply of ESB 1 has increased, while the supply for water conservation service has decreased. ESB 2 remained largely unchanged. The supply for carbon sequestration service in ESB 3 was further reduced.
As shown in Figure 5, between 2000 and 2015, there was a large spatial–temporal change in the spatial pattern of ESBs:
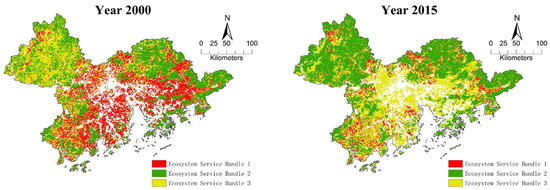
Figure 5.
Spatial distribution map of ecosystem service bundles in the Greater Bay Area. Note: Ecosystem Service Bundle 1 (ESB 1)—red; Ecosystem Service Bundle 2 (ESB 2)—green; Ecosystem Service Bundle 3 (ESB 3)—yellow.
The spatial–temporal change in the ESBs in the central and eastern parts of the GBA from ESB 1 to ESB 3 indicates that the dominant ES of these areas has shifted from grain production to no prominent ES. In 2000, the central part of the GBA was originally covered by ESB 1 with high supply of grain production service, but in 2015 it was occupied by ESB 3 with low service supply potentials. This is due to the fact that the urban expansion in the 15 years has significantly changed the land use pattern in the central part of the GBA and the urban land expansion in the central area of the GBA that occupied a large amount of arable land, resulting in changes in the regional ESBs.
At the same time, the ESB in the northeast and northwest of the GBA has changed from ESB 3 to ESB 2, indicating that the dominant ES of these areas has changed from no prominent service to carbon sequestration service as the major service. In year 2000, the outer area of the GBA was covered by ESB 3. It was replaced in 2015 by ESB 2 with high carbon sequestration supply, notably in the northwest and northeast GBA. One of the important reasons is that forests in these areas have been extensively restored.
3.3. Evaluate Trade-Offs and Synergies of Ecosystem Services
Grain production service is the dominant ES of ESB 1. In 2015, there was a significant negative correlation between this provisioning service and other regulating services, but the correlation coefficient was small, indicating that there was a weak trade-off between this ES and others (Table 5). Among them, the trade-off between grain production service and carbon sequestration service and soil conservation service was slightly higher than that of the other two. As shown in Table 5, carbon sequestration service was the dominant ES for ESB 2. In addition to being negatively correlated with grain production service, carbon sequestration service was significantly positively correlated with soil conservation service, rainstorm runoff regulating, and water conservation service. Among them, the correlation coefficient between carbon sequestration service and soil retention was significantly higher than that of the other three pairs (0.503 **), indicating that the synergy between the two ES was relatively strong. In the other three pairs of ES relationships, there was a relatively strong positive correlation (0.471 **) between water conservation and rainstorm runoff regulating service, which was always present in the three ESBs.
Table 5.
Pearson Correlation Coefficient for Ecosystem Service in the Greater Bay Area (2015).
As shown in Table 5 and Table 6, the weak negative correlation between grain production and other ES in 2015 was unchanged compared with 2000, while the correlation coefficient changed with carbon sequestration service. The absolute value of the correlation coefficient with soil conservation service increased, whereas the correlation coefficient with rainstorm runoff and water conservation service decreased.
Table 6.
Pearson Correlation Coefficient for Ecosystem Service in the Greater Bay Area (2000).
At the same time, the correlation and correlation coefficients of carbon sequestration service with the other three ES changed. Carbon sequestration service and rainstorm runoff regulating service changed from uncorrelated to significant positive correlation, and water conservation service changed from significant negative to significant positive correlation. The correlation coefficient with soil retention was reduced.
4. Discussion
4.1. Trade-Offs/Synergies and Managing Ecosystem Services
The quantitative expression of ES trade-offs/synergies could be based on the correlation analysis method [14]. In this study, the trade-offs/synergies between the ES were evaluated by the positive and negative signs of the correlation coefficients, and the strength of the trade-off/synergy relationship was judged by the size of the absolute value of the correlation coefficients. In the study area, grain production had trade-off relations between carbon sequestration service, soil retention service, rainstorm runoff regulating service, and water conservation service. The results in this study were similar to Raudsepp-Hearne et al. [9] in Canada which found that enhancing important provisioning services such as food often leads to trade-offs between regulating services such as flood protection. This means that similar trade-off and synergy of similar ES relations could occur in different locations. However, this trade-off/synergy relation was different from Sun et al. [44] that indicated no trade-off relations between grain production and carbon sequestration service in another urbanizing region in China. Because there was different spatial heterogeneity in distribution of main ecosystems and different intensity of human disturbance between these two urban agglomerations, this means that trade-off/synergy relations of similar ES bundles could change with spatial heterogeneity and locations.
In this study, population and land urbanization were the main drivers that shaped the spatial–temporal change of ES interaction in the GBA. During 2000–2015, population urbanization increased the demand for urban land expansion in the central area of the GBA, especially in the urban area of Guangzhou, Foshan, Dongguan, and Shenzhen City, costing reduction of cropland and wetland in these cities. The population density had a larger increase in these cities than in peripheral rural areas such as in Zhaoqing. This was the main cause that ESBs had a large spatial–temporal change in the central and peripheral area.
4.2. Contributions and Limitations
The framework presented for identifying and managing trade-off/synergy of ES could be widely used for environmental governance in other regions in the world, especially in an urbanizing region. Fully understanding the ES interaction is still a significant problem in the current research. The relationships among ES change dynamically with time, and the research on the continuity and dynamic transformation characteristics of trade-off/synergy with long time-series analysis should be strengthened in the future. In addition, many biological processes, physical mechanisms, and chemical mechanisms are involved in ES trade-offs and synergies. If there is no in-depth analysis of biological, physical, and chemical processes, it will affect the cognition of driving mechanism of ES. Therefore, when studying the interactions among ES, more attention should be paid to the interpretation of biological, physical, and chemical processes so as to improve the resilience and stability of the ecosystem and promote sustainable development.
5. Conclusions
ESBs help develop better environmental policies by considering trade-offs/synergies among ES, as different types of socio-ecological interactions can be exploited for ESBs rather than individual ES. The ESB emphasizes the relationship between natural ecosystems and human society. This study developed a framework for identifying and managing trade-off/synergy of ES in an urbanizing region to narrow the gap between ES science and practice.
This study found that the GBA formed three relatively stable ESBs from 2000 to 2015: ESB 1 has a relatively high grain production supply and low carbon sequestration supply, ESB 2 has a higher carbon sequestration supply and lower grain production supply capacity, and ESB 3 has no relatively high ES supply capacity. At the same time, the study found that the spatial pattern of ESBs in urban agglomerations will change abruptly with the change of time scale. This is due to the fact that the urban expansion in the fifteen years has significantly changed the land use pattern in the central part of the GBA, and the urban land expansion in the central area of the GBA occupies a large amount of arable land, resulting in changes in the regional ESBs. The expansion of ESB 3 in the central region of the GBA should be inhibited through land use management, while protecting the area and distribution of ESB 1 and ESB 2. The results of this study help to understand the trade-offs/synergies of ES reflected in land-use change in these ESBs, which are essential for ecosystem-based management.
Funding
This research was funded by National Natural Science Foundation of China (Grant No.42130510), National Natural Science Foundation of China (Grant No. 72104232), National Natural Science Foundation of China (Grant No. 31670474), National Key Research Program of China (Grant No.2016YFC0502701), Chinese Ministry of Education (Grant No. 19JZD023), Chinese Academy of Sciences (Grant No. XDA230301).
Data Availability Statement
Publicly available datasets were analyzed in this study. These data can be found here: Chinese Academy of Sciences Geography Science and Resource Institute (http://www.resdc.cn/DataList.aspx: accessed on 8 June 2021); ‘Technical specification for accounting gross ecosystem product (GEP)—Terrestrial ecosystems’ published by Zhejiang Provinces in September 2021 (http://db33.cnzjqi.com/ewebeditor/uploadfile/20200930145340879.pdf: accessed on 6 September 2021); and National Bureau of Statistics (http://www.stats.gov.cn/: accessed on 6 June 2021).
Acknowledgments
The author gratefully acknowledges the support of the State Key Laboratory of Urban and Regional Ecology, Research Center for Eco-Environment Sciences and East China Normal University.
Conflicts of Interest
The author declares no conflict of interest.
References
- Costanza, R.; d’Arge, R.; De Groot, R.; Farber, S.; Grasso, M.; Hannon, B.; Limburg, K.; Naeem, S.; O’neill, R.V.; Paruelo, J. The value of the world’s ecosystem services and natural capital. Nature 1997, 387, 253. [Google Scholar] [CrossRef]
- Bennett, E.M.; Morrison, P.; Holzer, J.M.; Winkler, K.J.; Fraser, E.D.G.; Green, S.J.; Robinson, B.E.; Sherren, K.; Botzas-Coluni, J.; Palen, W. Facing the challenges of using place-based social-ecological research to support ecosystem service governance at multiple scales. Ecosyst. People 2021, 17, 574–589. [Google Scholar] [CrossRef]
- Costanza, R. Valuing natural capital and ecosystem services toward the goals of efficiency, fairness, and sustainability. Ecosyst. Serv. 2020, 43, 101096. [Google Scholar] [CrossRef]
- Turner, V.K.; Galletti, C.S. Do Sustainable Urban Designs Generate More Ecosystem Services? A Case Study of Civano in Tucson, Arizona. Prof. Geogr. 2015, 67, 204–217. [Google Scholar] [CrossRef]
- Goldstein, J.H.; Caldarone, G.; Duarte, T.K.; Ennaanay, D.; Hannahs, N.; Mendoza, G.; Polasky, S.; Wolny, S.; Daily, G.C. Integrating ecosystem-service tradeoffs into land-use decisions. Proc. Natl. Acad. Sci. USA 2012, 109, 7565–7570. [Google Scholar] [CrossRef]
- Baro, F.; Gomez-Baggethun, E.; Haase, D. Ecosystem service bundles along the urban-rural gradient: Insights for landscape planning and management. Ecosyst. Serv. 2017, 24, 147–159. [Google Scholar] [CrossRef]
- Saidi, N.; Spray, C. Ecosystem services bundles: Challenges and opportunities for implementation and further research. Environ. Res. Lett. 2018, 13, 113001. [Google Scholar] [CrossRef]
- Renard, D.; Rhemtulla, J.M.; Bennett, E.M. Historical dynamics in ecosystem service bundles. Proc. Natl. Acad. Sci. USA 2015, 112, 13411–13416. [Google Scholar] [CrossRef]
- Raudsepp-Hearne, C.; Peterson, G.D.; Bennett, E.M. Ecosystem service bundles for analyzing tradeoffs in diverse landscapes. Proc. Natl. Acad. Sci. USA 2010, 107, 5242–5247. [Google Scholar] [CrossRef]
- Dickie, I.A.; Yeates, G.W.; St. John, M.G.; Stevenson, B.A.; Scott, J.T.; Rillig, M.C.; Peltzer, D.A.; Orwin, K.H.; Kirschbaum, M.U.F.; Hunt, J.E.; et al. Ecosystem service and biodiversity trade-offs in two woody successions. J. Appl. Ecol. 2011, 48, 926–934. [Google Scholar] [CrossRef]
- Power, A.G. Ecosystem services and agriculture: Tradeoffs and synergies. Philos. Trans. R. Soc. B Biol. Sci. 2010, 365, 2959–2971. [Google Scholar] [CrossRef]
- Zhang, Z.; Liu, Y.; Wang, Y.; Liu, Y.; Zhang, Y.; Zhang, Y. What factors affect the synergy and tradeoff between ecosystem services, and how, from a geospatial perspective? J. Clean. Prod. 2020, 257, 120454. [Google Scholar] [CrossRef]
- Bennett, E.M.; Cramer, W.; Begossi, A.; Cundill, G.; Díaz, S.; Egoh, B.N.; Geijzendorffer, I.R.; Krug, C.B.; Lavorel, S.; Lazos, E.; et al. Linking biodiversity, ecosystem services, and human well-being: Three challenges for designing research for sustainability. Curr. Opin. Environ. Sustain. 2015, 14, 76–85. [Google Scholar] [CrossRef]
- Zhao, M.Y.; Peng, J.; Liu, Y.X.; Li, T.Y.; Wang, Y.L. Mapping Watershed-Level Ecosystem Service Bundles in the Pearl River Delta, China. Ecol. Econ. 2018, 152, 106–117. [Google Scholar] [CrossRef]
- Xu, Z.; Peng, J. Ecosystem services-based decision-making: A bridge from science to practice. Environ. Sci. Policy 2022, 135, 6–15. [Google Scholar] [CrossRef]
- Haas, J.; Ban, Y. Urban growth and environmental impacts in Jing-Jin-Ji, the Yangtze, River Delta and the Pearl River Delta. Int. J. Appl. Earth Obs. Geoinf. 2014, 30, 42–55. [Google Scholar] [CrossRef]
- Li, J.; Wu, L. Examining the potential impact of land use/cover changes on the NPP ecosystem services of Yan’an region of China: A scenario-based analysis. Int. J. Glob. Warm. 2015, 8, 319–334. [Google Scholar] [CrossRef]
- Zheng, H.; Li, Y.F.; Robinson, B.E.; Liu, G.; Ma, D.C.; Wang, F.C.; Lu, F.; Ouyang, Z.Y.; Daily, G.C. Using ecosystem service trade-offs to inform water conservation policies and management practices. Front. Ecol. Environ. 2016, 14, 527–532. [Google Scholar] [CrossRef]
- Ma, L.; Bicking, S.; Mueller, F. Mapping and comparing ecosystem service indicators of global climate regulation in Schleswig-Holstein, Northern Germany. Sci. Total Environ. 2019, 648, 1582–1597. [Google Scholar] [CrossRef]
- Hou, Y.; Ding, S.; Chen, W.; Li, B.; Burkhard, B.; Bicking, S.; Müller, F. Ecosystem service potential, flow, demand and their spatial associations: A comparison of the nutrient retention service between a human- and a nature-dominated watershed. Sci. Total Environ. 2020, 748, 141341. [Google Scholar] [CrossRef]
- Sadat, M.; Zoghi, M.; Malekmohammadi, B. Spatiotemporal modeling of urban land cover changes and carbon storage ecosystem services: Case study in Qaem Shahr County, Iran. Environ. Dev. Sustain. 2020, 22, 8135–8158. [Google Scholar] [CrossRef]
- Caro, C.; Marques, J.C.; Cunha, P.P.; Teixeira, Z. Ecosystem services as a resilience descriptor in habitat risk assessment using the InVEST model. Ecol. Indic. 2020, 115, 106426. [Google Scholar] [CrossRef]
- Tao, Y.; Wang, H.; Ou, W.; Guo, J. A land-cover-based approach to assessing ecosystem services supply and demand dynamics in the rapidly urbanizing Yangtze River Delta region. Land Use Policy 2018, 72, 250–258. [Google Scholar] [CrossRef]
- UN—Department of Economic and Social Affairs, Population Division. World Urbanization Prospects: The 2011 Revision; UN: New York, NY, USA, 2012. [Google Scholar]
- Han, J.; Meng, X.; Zhou, X.; Yi, B.; Liu, M.; Xiang, W.-N. A long-term analysis of urbanization process, landscape change, and carbon sources and sinks: A case study in China’s Yangtze River Delta region. J. Clean. Prod. 2017, 141, 1040–1050. [Google Scholar] [CrossRef]
- Su, S.; Xiao, R.; Jiang, Z.; Zhang, Y. Characterizing landscape pattern and ecosystem service value changes for urbanization impacts at an eco-regional scale. Appl. Geogr. 2012, 34, 295–305. [Google Scholar] [CrossRef]
- Zhou, Z.X.; Li, J.; Zhang, W. Coupled urbanization and agricultural ecosystem services in Guanzhong-Tianshui Economic Zone. Environ. Sci. Pollut. Res. 2016, 23, 15407–15417. [Google Scholar] [CrossRef]
- Su, S.; Li, D.; Hu, Y.N.; Xiao, R.; Zhang, Y. Spatially non-stationary response of ecosystem service value changes to urbanization in Shanghai, China. Ecol. Indic. 2014, 45, 332–339. [Google Scholar] [CrossRef]
- Qiu, B.; Li, H.; Zhou, M.; Zhang, L. Vulnerability of ecosystem services provisioning to urbanization: A case of China. Ecol. Indic. 2015, 57, 505–513. [Google Scholar] [CrossRef]
- Li, B.; Chen, D.; Wu, S.; Zhou, S.; Wang, T.; Chen, H. Spatio-temporal assessment of urbanization impacts on ecosystem services: Case study of Nanjing City, China. Ecol. Indic. 2016, 71, 416–427. [Google Scholar] [CrossRef]
- Wang, W.J.; Wu, T.; Li, Y.Z.; Zheng, H.; Ouyang, Z.Y. Matching Ecosystem Services Supply and Demand through Land Use Optimization: A Study of the Guangdong-Hong Kong-Macao Megacity. Int. J. Environ. Res. Public Health 2021, 18, 2324. [Google Scholar] [CrossRef]
- Zhang, Z.M.; Peng, J.; Xu, Z.H.; Wang, X.Y.; Meersmans, J. Ecosystem services supply and demand response to urbanization: A case study of the Pearl River Delta, China. Ecosyst. Serv. 2021, 49, 101274. [Google Scholar] [CrossRef]
- Yang, Y.; Li, M.W.; Feng, X.M.; Yan, H.M.; Su, M.R.; Wu, M.W. Spatiotemporal variation of essential ecosystem services and their trade-off/synergy along with rapid urbanization in the Lower Pearl River Basin, China. Ecol. Indic. 2021, 133, 108439. [Google Scholar] [CrossRef]
- Yang, R.; Qin, B.; Lin, Y. Assessment of the Impact of Land Use Change on Spatial Differentiation of Landscape and Ecosystem Service Values in the Case of Study the Pearl River Delta in China. Land 2021, 10, 1219. [Google Scholar] [CrossRef]
- Sun, C.; Zhang, S.; Song, C.; Xu, J.; Fan, F. Investigation of Dynamic Coupling Coordination between Urbanization and the Eco-Environment-A Case Study in the Pearl River Delta Area. Land 2021, 10, 190. [Google Scholar] [CrossRef]
- Ouyang, Z.; Zheng, H.; Xiao, Y.; Polasky, S.; Liu, J.; Xu, W.; Wang, Q.; Zhang, L.; Xiao, Y.; Rao, E.; et al. Improvements in ecosystem services from investments in natural capital. Science 2016, 352, 1455–1459. [Google Scholar] [CrossRef]
- Wang, W.J.; Wu, T.; Li, Y.Z.; Xie, S.L.; Han, B.L.; Zheng, H.; Ouyang, Z.Y. Urbanization Impacts on Natural Habitat and Ecosystem Services in the Guangdong-Hong Kong-Macao “Megacity”. Sustainability 2020, 12, 6675. [Google Scholar] [CrossRef]
- Natural Resources Conservation Service. Urban Hydrology for SmallWatersheds—Technical Release 55; US Department of Agriculture Natural Resources Conservation: Washington, DC, USA, 1986.
- Wischmeier, W.H.; Smith, D.D. Predicting Rainfall Erosion Losses: A Guide to Conservation Planning; Department of Agriculture, Science and Education Administration: Washington, DC, USA, 1978.
- Li, K.; Hou, Y.; Andersen, P.S.; Xin, R.; Rong, Y.; Skov-Petersen, H. An ecological perspective for understanding regional integration based on ecosystem service budgets, bundles, and flows: A case study of the Jinan metropolitan area in China. J. Environ. Manag. 2022, 305, 114371. [Google Scholar] [CrossRef]
- Queiroz, C.; Meacham, M.; Richter, K.; Norstrom, A.V.; Andersson, E.; Norberg, J.; Peterson, G. Mapping bundles of ecosystem services reveals distinct types of multifunctionality within a Swedish landscape. AMBIO 2015, 44, S89–S101. [Google Scholar] [CrossRef]
- Cai, W.; Gibbs, D.; Zhang, L.; Ferrier, G.; Cai, Y. Identifying hotspots and management of critical ecosystem services in rapidly urbanizing Yangtze River Delta Region, China. J. Environ. Manag. 2017, 191, 258–267. [Google Scholar] [CrossRef]
- Cai, W.; Jiang, W.; Du, H.; Chen, R.; Cai, Y. Assessing Ecosystem Services Supply-Demand (Mis)Matches for Differential City Management in the Yangtze River Delta Urban Agglomeration. Int. J. Environ. Res. Public Health 2021, 18, 8130. [Google Scholar] [CrossRef]
- Sun, W.; Li, D.; Wang, X.; Li, R.; Li, K.; Xie, Y. Exploring the scale effects, trade-offs and driving forces of the mismatch of ecosystem services. Ecol. Indic. 2019, 103, 617–629. [Google Scholar] [CrossRef]
Publisher’s Note: MDPI stays neutral with regard to jurisdictional claims in published maps and institutional affiliations. |
© 2022 by the author. Licensee MDPI, Basel, Switzerland. This article is an open access article distributed under the terms and conditions of the Creative Commons Attribution (CC BY) license (https://creativecommons.org/licenses/by/4.0/).