Article

Assessment of Accessibility and Activity Intensity to Identify Future Development Priority TODs in Hefei City

1
Graduate School of Human-Environment Studies, Kyushu University, Fukuoka 819-0395, Japan
2
Faculty of Human-Environment Studies, Kyushu University, Fukuoka 819-0395, Japan
*
Author to whom correspondence should be addressed.
Land 2022, 11(9), 1590; https://doi.org/10.3390/land11091590
Submission received: 22 August 2022 / Revised: 12 September 2022 / Accepted: 13 September 2022 / Published: 16 September 2022

Abstract

:
Hefei, the capital city of Anhui Province, China, has been experiencing rapid development due to fast population growth and continuous city expansion since 2010. The Hefei government began to operate the subway system in 2017 and introduced the concept of transit-oriented development (TOD) as a strategy to reduce traffic pressure and environmental pollution. By 2020, there were 77 TODs in operation. However, some TODs could not attract enough public transport passengers or increase the economic activities. This study analyzed the Hefei City TOD network and tried to identify TODs that need development priority among the existing TODs to guide the efficient allocation of resources for the development of the TOD network. First, this study measured the accessibility and activity intensity at each TOD by using the node–place model. Second, the 77 existing TODs were divided into 4 priority levels by applying the silhouette method. Level 1 and level 2 TODs have development priority and are referred to as “Unstable TODs” and “Unbalanced TODs,” respectively. Finally, this paper provides some strategies for developing these priority TODs.

1. Introduction

China is currently in the stage of rapid urbanization, with a large number of people choosing to migrate from rural areas to urban areas for better employment opportunities or living environments [1]. According to the seventh national population census, there were 63.89% of the total population of China living in urban areas in 2020. Heilig [2] predicted that about 70% of China’s population will live in urban areas by 2035. As a result, the population density on the limited available land is increasing. Therefore, it is of great significance to improve the quality of life in high-density cities.
At the same time, another important problem for Chinese cities is rapid urban expansion. The level of urbanization was 64.72% in 2021 according to the National Bureau of Statistics of China, and increased at a rate of nearly 2% per year. Urban expansion has led to an increase in commuter distances. The total mileage of roads in China has increased by 3.6107 million kilometers from 2000 to 2021 [3]. People are gradually relying on various modes of transportation, such as buses and private cars, to overcome the long commute distances. However, with the growth in the number of vehicles, the existing road system is gradually becoming unable to meet the rapidly growing traffic demand, and congestion is one of the most urgent problems in many Chinese cities [4].
In this context, many Chinese cities have adopted the rail transit system because of its advantages of large capacity, high efficiency, and less environmental impact [5]. Jen and Huang [6] stated that the rail transit system has changed the city’s travel mode from ground to underground. The introduction of rail transit changed travel behavior and increased the traffic capacity at the same time. China is in a period of rapid development of the urban rail transit system at present. Rail transit has become an essential part of the public transportation system in many Chinese cities.
Recently, finding appropriate methods to coordinate the relationship between the rail transit system and urban development has stimulated the discussion of many researchers [7]. The transit-oriented development (TOD) concept is used in different cities as a common method to solve the above problem [8,9]. According to the definition proposed by the Institute for Transportation and Development Policy (ITDP) in 2017, transit-oriented development (TOD) is a tool that can maximize the urban development around public transport nodes and attract more people to choose public transport.
However, the implementation of transit development faces many challenges due to differences of local environments, managers, and planners [10]. The subway system, which is one of the most important components of the rail transit system, has been developing continuously since it was introduced into China in the late 1990s. However, the TOD concept was first applied in China in the early 2010s [11]. Therefore, in the implementation of the TOD concept in existing subway stations or developed areas it is difficult to achieve the expected goals such as attracting more public transport passengers, reducing traffic pressure, and improving the quality of life. At the same time, there are differences in the levels of development among TODs in the same network. For example, some TODs are in highly developed areas with sufficient density and diverse human activities, whereas some TODs are in underdeveloped urban areas with low human activity density and diversity. In the past decade, these situations have generally appeared in many Chinese cities. If these problems are not solved, long-term development will lead to unnecessary land waste, urban space chaos, and inconvenient transportation. Therefore, it is necessary to understand the characteristics of existing TODs and accurately grasp the development level of each TOD. This helps to find the shortcomings of the existing TODs. This study aimed to develop a method to find the priorities between the existing TODs. Hefei city was used as a case study.
As the capital city of Anhui Province, Hefei City has been experiencing rapid urban development since 2010. The permanent population of Hefei had reached 8.189 million by the end of 2019, an increase of 102,000 over the previous year according to the data of the Hefei Municipal Bureau of Statistics. It is estimated that the urbanization rate of Hefei will reach 90–95% by 2030 [12]. The traffic congestion in Hefei is becoming more serious with the increase in the population and the expansion of the city. The number of private cars in Hefei has increased by 12.6% over the previous year to the end of 2019 [13]. If the demand for private cars is not effectively controlled, the problems of traffic congestion and exhaust emissions will become increasingly serious. Therefore, Hefei City operated the subway system and introduced the TOD concept as a guideline to reduce traffic pressure and environmental pollution in 2017.
By 2020, there were 3 subway lines and 77 subway stations operating in Hefei. So far, the subway has occupied an important position in people’s daily travel. According to 2019 statistics, the total passenger volume of the Hefei subway was 179.8 million person-times, and the public transportation share rate was 19.06%. The share of public transport increased to 26.02% by February 2020. The subway has gradually become the backbone of Hefei’s public transport system. In this study, the 77 TODs, composed of 77 subway stations and their surrounding urban development, were selected for analysis, as shown in Figure 1.
Meanwhile, with the continuous development of urban public transport infrastructure, the construction and operation of public transport infrastructure require a large amount of government financial investment. The investment demand for the development of transport infrastructure has been increasing, but the government’s annual financial investment is limited. Therefore, the limited financial investment should be directly and reasonably allocated [14]. The Hefei government has committed to invest 19.484 billion CNY in transportation infrastructure construction in 2022, and development of TODs is also included. The investment that can be used to improve the existing TODs is limited. Su [15] classified the TODs in five Chinese megacities after calculating the TOD degree to understand the gap between existing theoretical principles and actual planning practices. They provided recommendations for planning different TOD clusters and emphasized that planners need to give priority to the development of TOD clusters that can maximize benefits and minimize costs. Higgins [16] attempted to solve the issue of complexity in understanding the heterogeneity of TODs among planners and policy makers. They developed a method to classify the 372 different TODs in Toronto into a set of heterogeneous classes based on a latent class method to guide them to maximize the potential return on investment. Therefore, it is of great significance to find the TODs that can use the investment reasonably. In this case, these TODs can be regarded as priority TODs.
The objective of this paper is to identify the priority TODs among the existing 77 TODs to guide reasonable resource allocation for investment in existing TODs. First, the development level at each TOD needs to be evaluated to find priority TODs. The node–place model is a model widely used to evaluate TODs, which can determine the relatively balanced and unbalanced TODs. Unbalanced TODs are candidates for priority development. However, the original node–place model is only a conceptual model, and there is no definition of the exact range of the balanced and unbalanced areas. Therefore, this paper proposes to combine the original node–place model with the silhouette method to determine the priority TODs accurately. In general, the priority TODs can be found by combining the silhouette method to define the exact range of the unbalanced areas in the original node–place model. The application of this method can help planners or designers find TODs that need to be developed in priority among the existing TODs, and allocate the investment reasonably.
The paper’s structure is as follows: Section 2 reviews the previous literature and describes the methods. The results are described and discussed in Section 3. Section 4 presents the research’s conclusions.

2. Materials and Methods

In this section, first, the node–place model is used to evaluate the existing TODs. Secondly, the priority TODs are determined by applying the silhouette model. The following is the research flow chart (Figure 2).

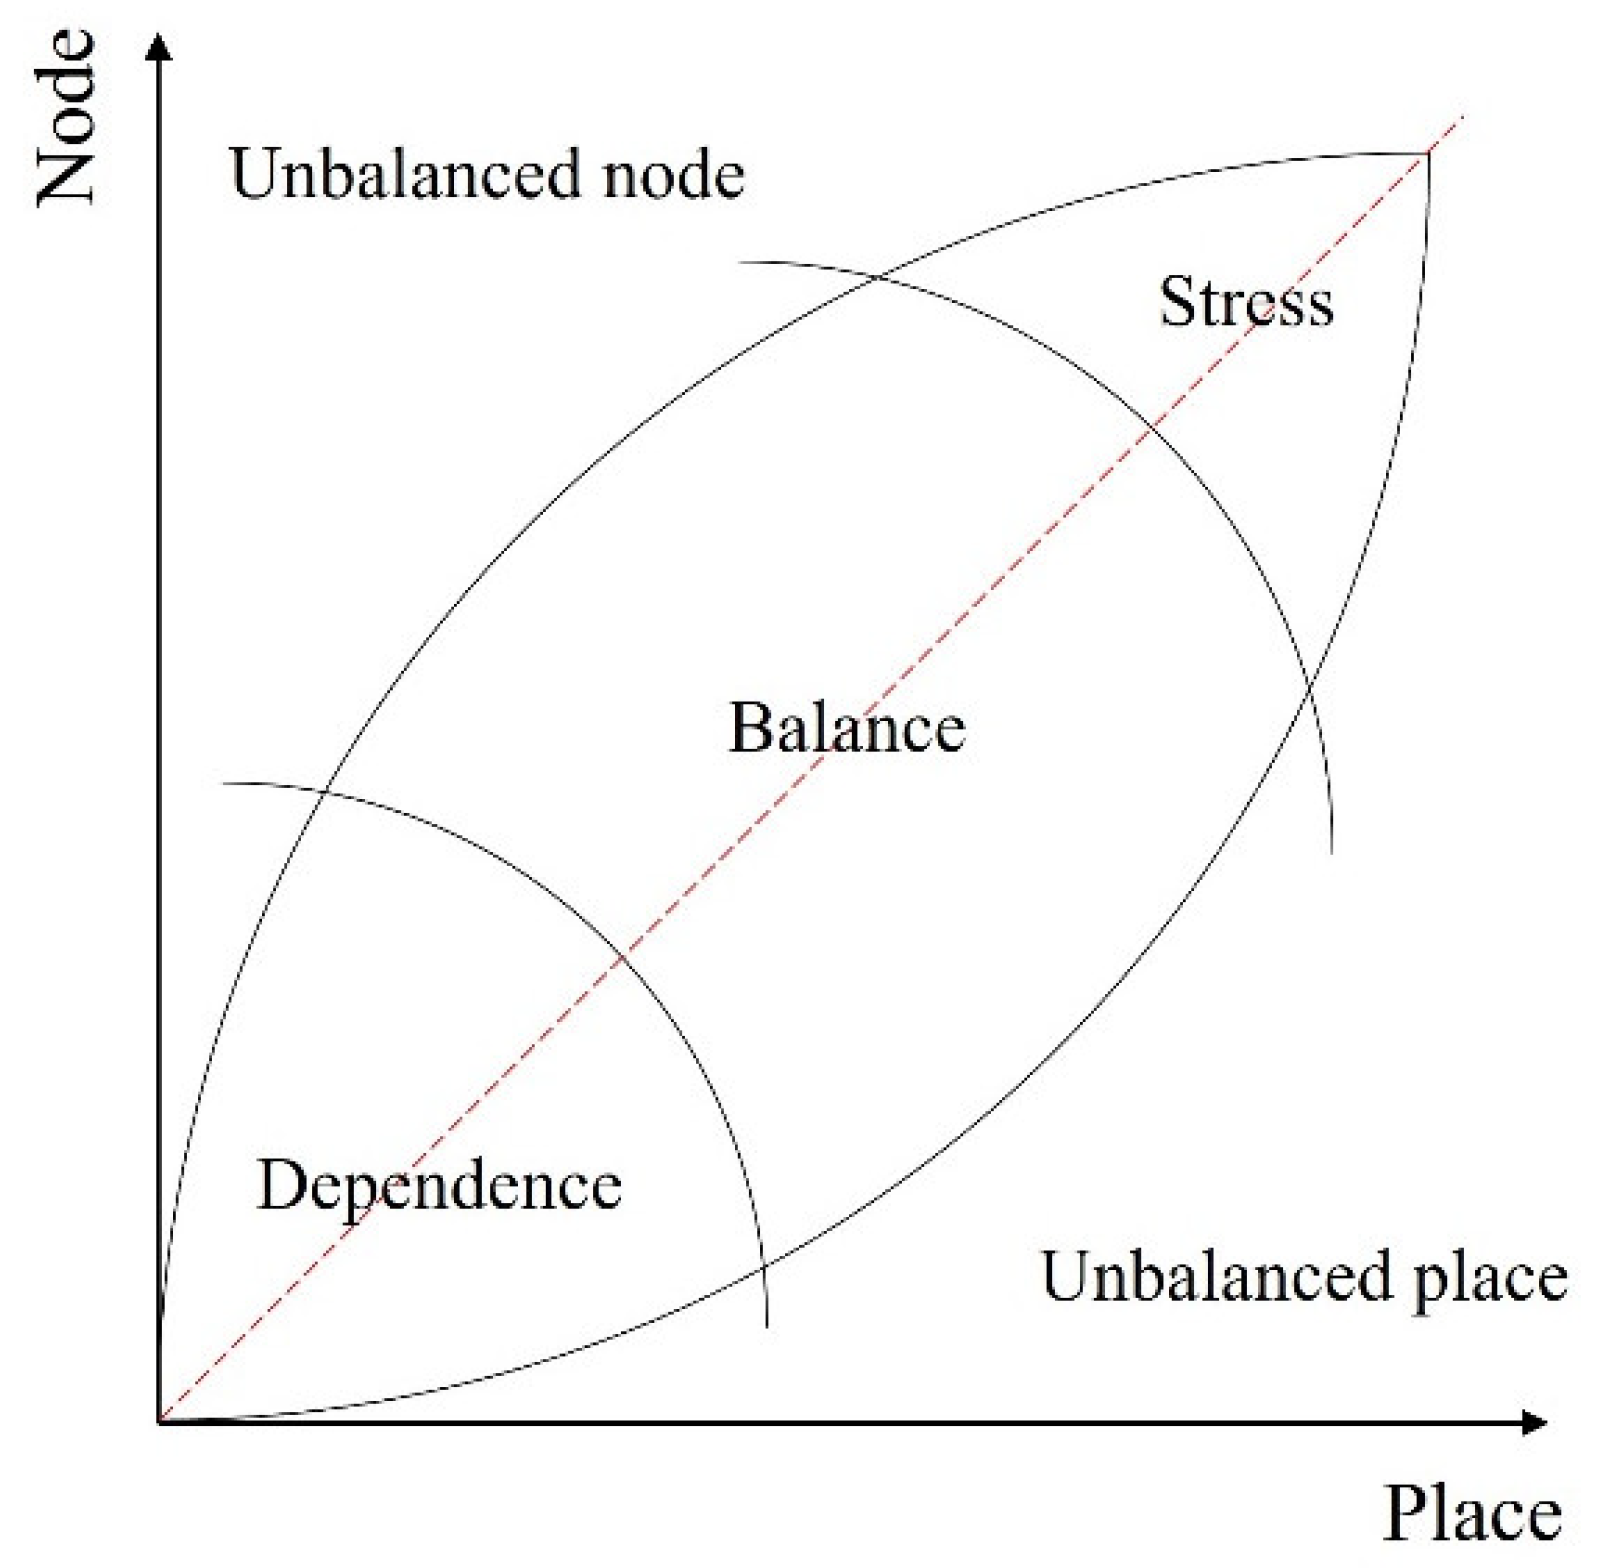
2.1. Previous Literature

The important characteristic of the TOD concept is that it is the integration of land-use and public transport, so as to encourage urban development around public transport nodes and improve quality of life. Many researchers found that TOD development has other positive effects on urban development. For example, Dong [17] found that TODs greatly reduced the travel costs of residents by comparing the travel costs between TOD and non-TOD households. Li [18] stated that TODs have a positive impact on house prices, even in China. By investigating TODs’ transportation-related carbon dioxide emissions, Rahman [19] proved that TODs can reduce the carbon dioxide emissions of human activities and help achieve sustainable environmental development. Therefore, the Chinese government has also chosen the TOD concept to strengthen the relationship between transport and urban development. The “guidelines for planning and design of areas along the urban rail transit” published by the Ministry of Housing and Urban–Rural Development in 2015 encouraged the implementation of TOD development around public transport nodes [20]. The TOD concept has been widely applied in many Chinese cities based on the general TOD development guideline, and there has been some adaptations of the general guideline according to local contexts. For example, the Shanghai Master Plan (2017–2035) has introduced the TOD concept into land-use planning to make the 15 min community life circle (15 min-CLC) the basic unit of social governance and the basis for common community resource allocation. Shenzhen City began to use the concept of TOD for urban planning in 2009, and in its latest master plan, it plans to configure community public service facilities with the community life circle (15 min-CLC) as the unit to form a more convenient and accessible community service network.
Many previous studies on TODs in China focused on metropolises, such as Beijing, Shanghai, and Shenzhen. However, with the recent promotion, medium-sized cities are increasingly adopting TOD concepts in urban planning. Unlike the mature public transport systems of metropolises, TOD usage in these medium-sized cities is still under development. Hefei is one of the medium-sized cities that are developing TODs. This paper chose Hefei City as a case study to find the future development directions of the TOD concept in medium-sized cities.
Previous studies have used the concept of priority development to make suggestions for the development of public transportation. For example, Agnihotri [21] proposed a new priority index, “development priority indexing”, using the availability of developable land and land value to measure the priority value of subway stations. Lee [22] calculated the efficiency scores of subway stations in Seoul using transit trip data and socio-economic data of the surrounding urban area. They gave top development priority to stations with low-efficiency scores. Kalyuzhnyi [23] studied transfer hub development in Saint Petersburg and proposed a model to determine the priority position of a transfer hub based on the passenger flow of rail transit. Some researchers proposed development strategies that should be prioritized for the efficient development of TODs. He [24] studied the factors of development in station areas and stated that the top priority is to improve the transfer function and urban space through the design of the surrounding areas of station areas.
The basis for finding TODs that can be given priority is to accurately evaluate each TOD. Therefore, developing a practical tool that measures the TODs is important. The node–place model [25] is a common method used to evaluate TODs. This model describes the transport nodes, the surrounding area, and the relationship between them with the x and y axes, shown in Figure 3. The y value represents the accessibility of nodes; the x value expresses the activity intensity of the surrounding area. The original node–place model provides five assumptions, namely “balance”, “dependence”, “unbalanced place”, “unbalanced node”, and “stress”. Bertolini [25] also indicated that there is a trend toward a more balanced state for “unbalanced place” and “unbalanced node”. In general, the node–place model could be used as a systematic method to measure the development situation of TODs by evaluating the accessibility and activity intensity. It could help identify the weakness of TODs as well.
This study selected several indicators to make the node–place model operable as shown in Table 1. For describing the node-value, the intensity and diversity of the transport supply at each TOD are crucial. Bertolini [25] proposed analyzing the accessibility of TODs by trains, buses, trams, subways, automobiles, and bicycles to obtain node-value. The place-value was evaluated by considering the activity intensity and diversity of TODs. Variables such as the number of residents, the number of employees, and the degree of functional mix within catchment areas need to be considered.
The node–place model has many applications. For example, Chorus [26] used the node–place model to understand the traffic and land use factors that will affect the formation of the station areas by analyzing the spatial development dynamics of 99 subway stations in Tokyo. Reusser [27] applied the node–place model to the analysis of Swiss railway stations, proving that stations with unbalanced development of transportation and land use tend to develop into a more balanced state. Kamruzzaman [28] showed that the traffic and land use of different TODs will have different characteristics.
After understanding the place-value and node-value at each TOD, the relative position of each TOD in the node–place graph can be obtained. The development priority of TODs can be identified by analyzing the position of these TODs on the node–place model. In the original node–place model, nodes close to the middle line were regarded as balance nodes [25]. Researchers also argued that the unbalanced nodes that are far from the middle line might tend to progress toward a balanced position [26]. Therefore, it can be inferred that the unbalanced TODs should be given priority for development. However, the original node–place model is a conceptual model and is good at showing the relative position of TODs on the node–place model and the development possibilities of these TODs towards the “balance” location in the node–place model. Researchers are concerned about how to define the range of the five ideal situations in the node–place model. Although Reusser [27] proposed the development path for the five ideal situations, there is no clear definition of the range. Monajem [29] evaluated the spatial integration of station areas in Tehran and divided those station areas into five types through the node–place model. However, they did not specify the different types defined according to what conditions. Some studies chose to combine other methods for classification since defining the accurate range is difficult. For example, Zhang [30] divided station areas in Greater London into five categories based on the node–place model combined with cluster analysis. The result did not fully indicate the five ideal situations in the original node–place model.
So far, there is no definition of the exact range of the balanced and unbalanced areas. Therefore, it is necessary to combine other methods to clarify the priority TODs.
There are many algorithms for dividing a set of objects into several clusters, which can be used to distinguish between different priority levels of TODs. Among these clustering methods, k-means is a commonly used algorithm. However, there is an unavoidable limitation to the k-means method. The number of clusters k is hard to choose when not given by external limits [31]. Therefore, this paper chose the silhouette method [32]. Rousseeuw [32] proposed the silhouette method, which describes the classification of each object in a whole graph. The silhouette score can directly express the similarity between objects. The appropriate number of clusters for accurate clustering analysis can be determined by averaging the silhouette scores of all objects. Therefore, this study applied a combination of the silhouette method and the node–place model to help identify priority TODs.

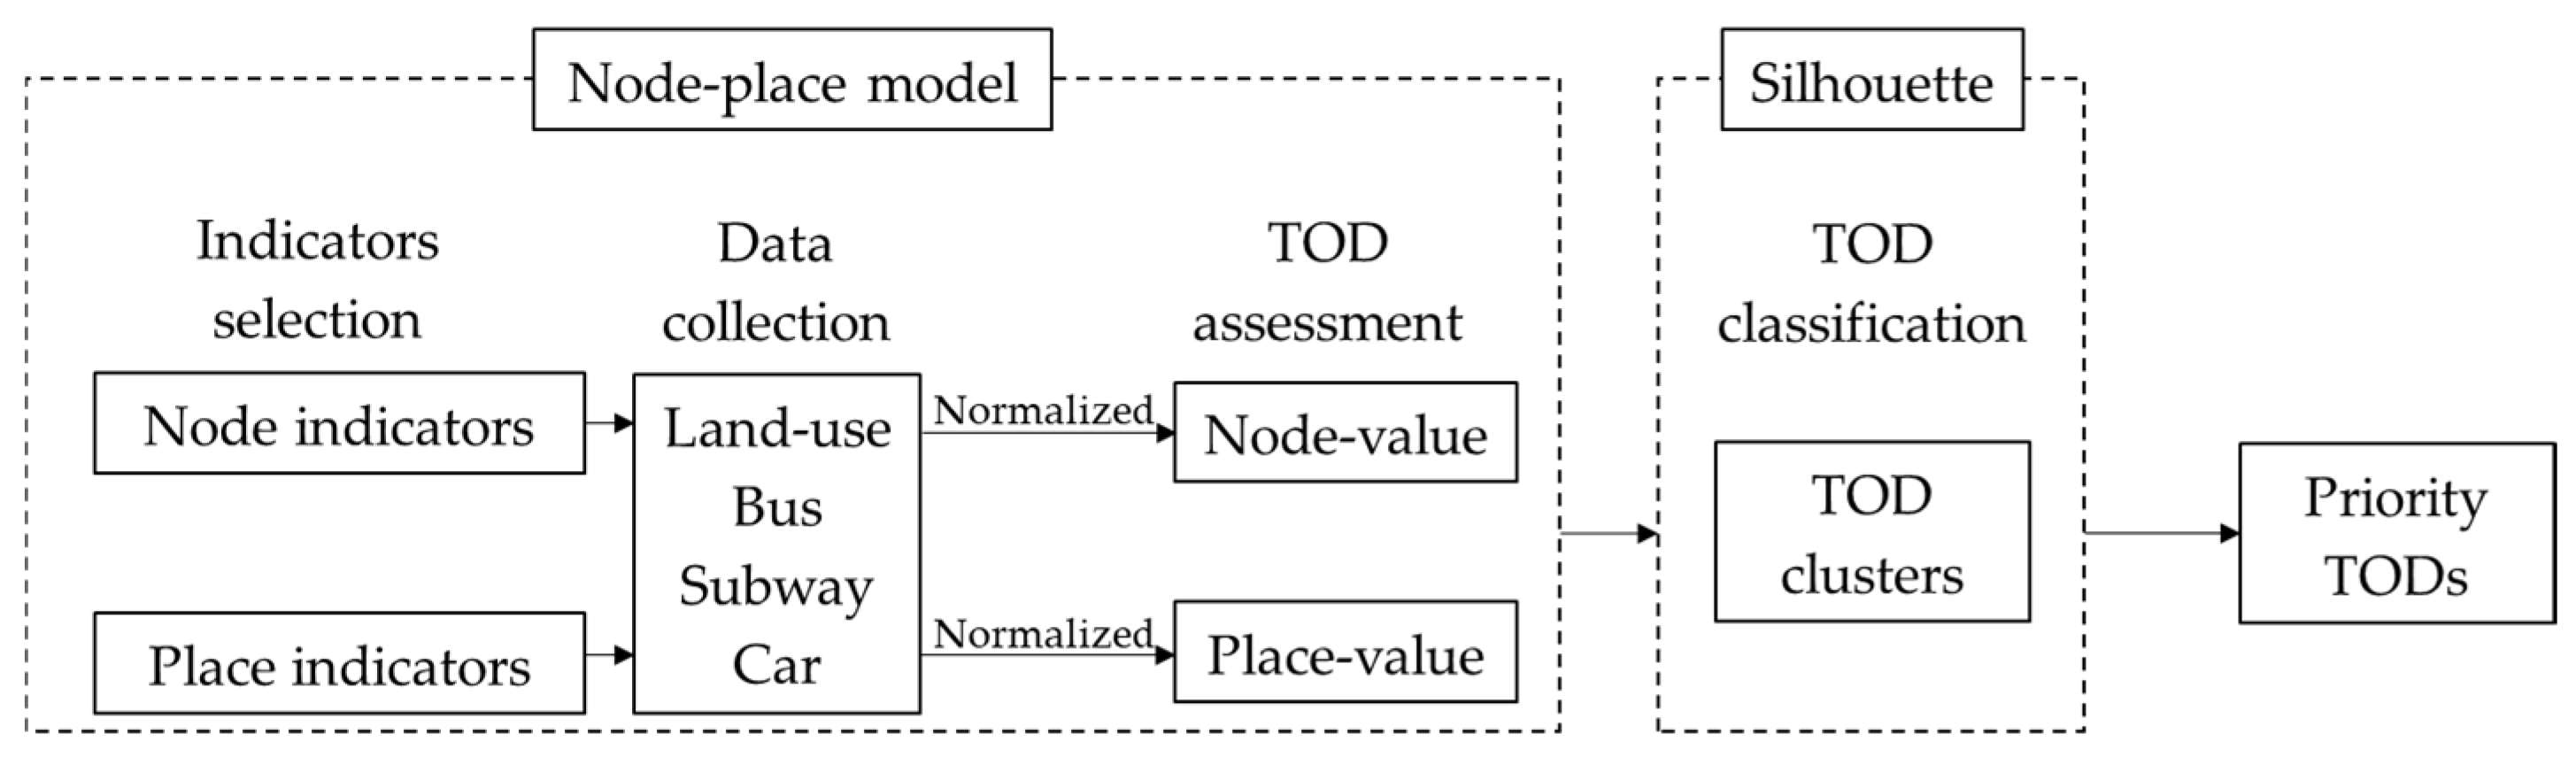
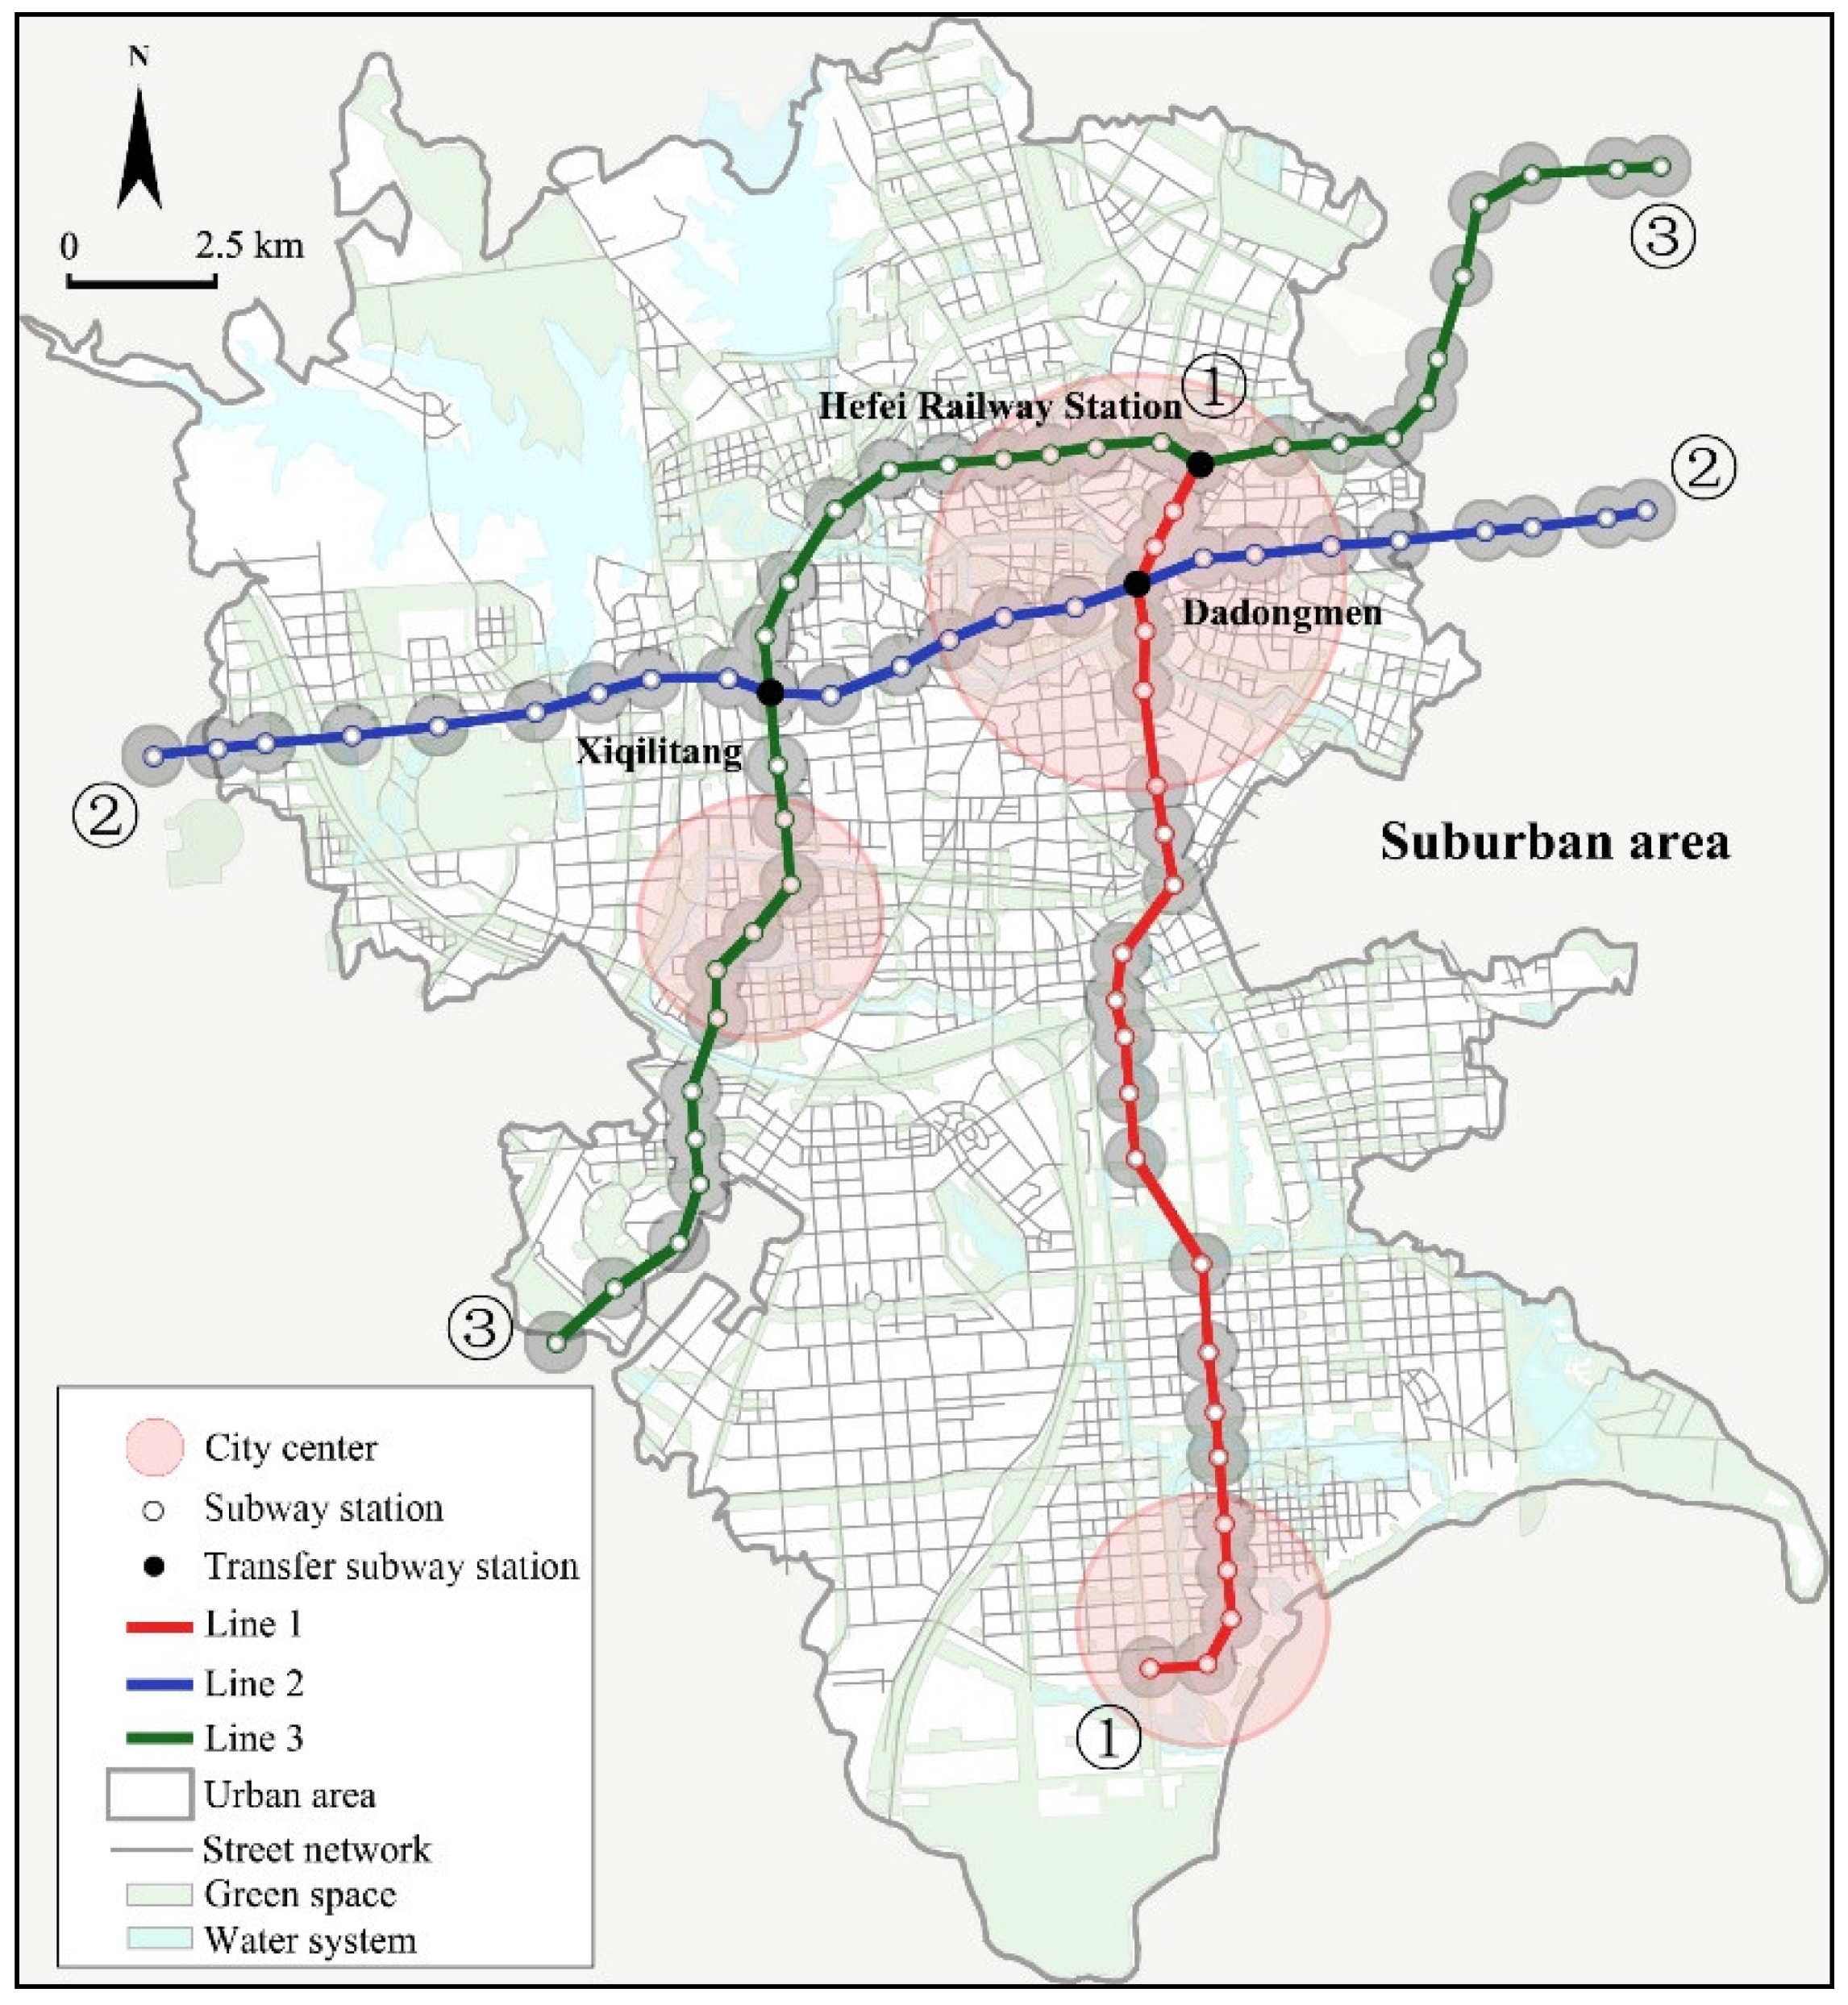
2.2. Implementation of the Node–Place Model for Hefei City TODs

The accessibility and activity intensity of the 77 TODs in Hefei City was assessed by the node–place model. Firstly, the size of a suitable catchment area was determined to apply the node–place model within Hefei local context. Secondly, selected a set of indicators based on the previous literature with considering the local context. Thirdly, measured the selected indica tors, and fourthly, obtained the node–place graph based on the existing situation of accessibility and activity intensity. The process of applying the node–place model is explained in the following section. The following section explains in detail the process of applying the node–place model.

2.2.1. Catchment Area

There is no fixed standard for defining the transit catchment area of TODs. Most studies are based on the distance that local people are willing to walk and take public transportation [33,34]. For instance, some researchers suggested the Euclidean distance of 700 m from the transit station as the boundary of a TOD [25,27,35,36]. Chinese re-searchers commonly selected a range from 400 to 800 m [7,37,38]. In this paper, the catchment area is defined as a buffer area of 500 m walking distance from a subway station. The reason for choosing this scale is that the recent Master Plan of Hefei decided to build 500 m walkable neighborhoods for residents.

2.2.2. Indicator Selection

Combined with the previous literature and the characteristics of Hefei TODs, this study obtained the indicators of nodes and place-values within the catchment area to apply Bertolini’s node–place model. The node-value of the transit stop describes the traffic accessibility to other places and the service capacity of the transit stop [25]. Subway, bus, and car are the main transportation choices for Hefei citizens. Therefore, the node-value includes three categories, namely the accessibility of the subway, bus, and car. As shown in Table 2, the node-value has a total of eight indicators. The place-value describes the activity intensity within 500 m at each TOD. However, the census data of Hefei City released the population of the whole city, and there are no accurate data within 500 m at each TOD. Other statistical methods need to be selected in order to better reflect the activity intensity in small areas. Li [34] directly calculated the geometric area of each land-use type in the study area to reveal the activity intensity. Therefore, this paper follows the same method to calculate the land area of six different land uses for measuring the place-value. Meanwhile, the reason why this paper considers the area of green land within the catchment area is that parks and farmland play an important role in Hefei urban planning, and regional planning will also focus on parks and farmland. Additionally, the land function mix is one of the important indicators in calculating the place-value. It represents the degree of land-use mix in the TODs calculated based on the land area of different land-use types, such as D1, D2, D3, D4, D5, and D6. Table 2 shows the final indicators of the measured node- and place-values.

2.2.3. Data Sources

For node-value, the bus lines and bus stops, data were obtained from the Hefei Bus Guide App [39]. The subway line data came from the website of the Metro Operational Map [40]. For place-value, the land use data came from the 2017 Land Use GIS database on the OpenStreetMap website [41] (accessed on 21 December 2021).

2.2.4. Reorganization of the Dataset

To reduce the skewness of univariate distribution, the normality of all indicators was tested, and any non-normal distribution indicators were log-transformed. Secondly, all indicators were normalized to rescale to 0–1. All indicators had equal weights. This paper calculated the average value of eight node indicators as the node-value at each TOD; the average value of the six place indicators was taken as the place-value at each TOD. Therefore, the development at each TOD can be obtained based on the final place- and node-values.

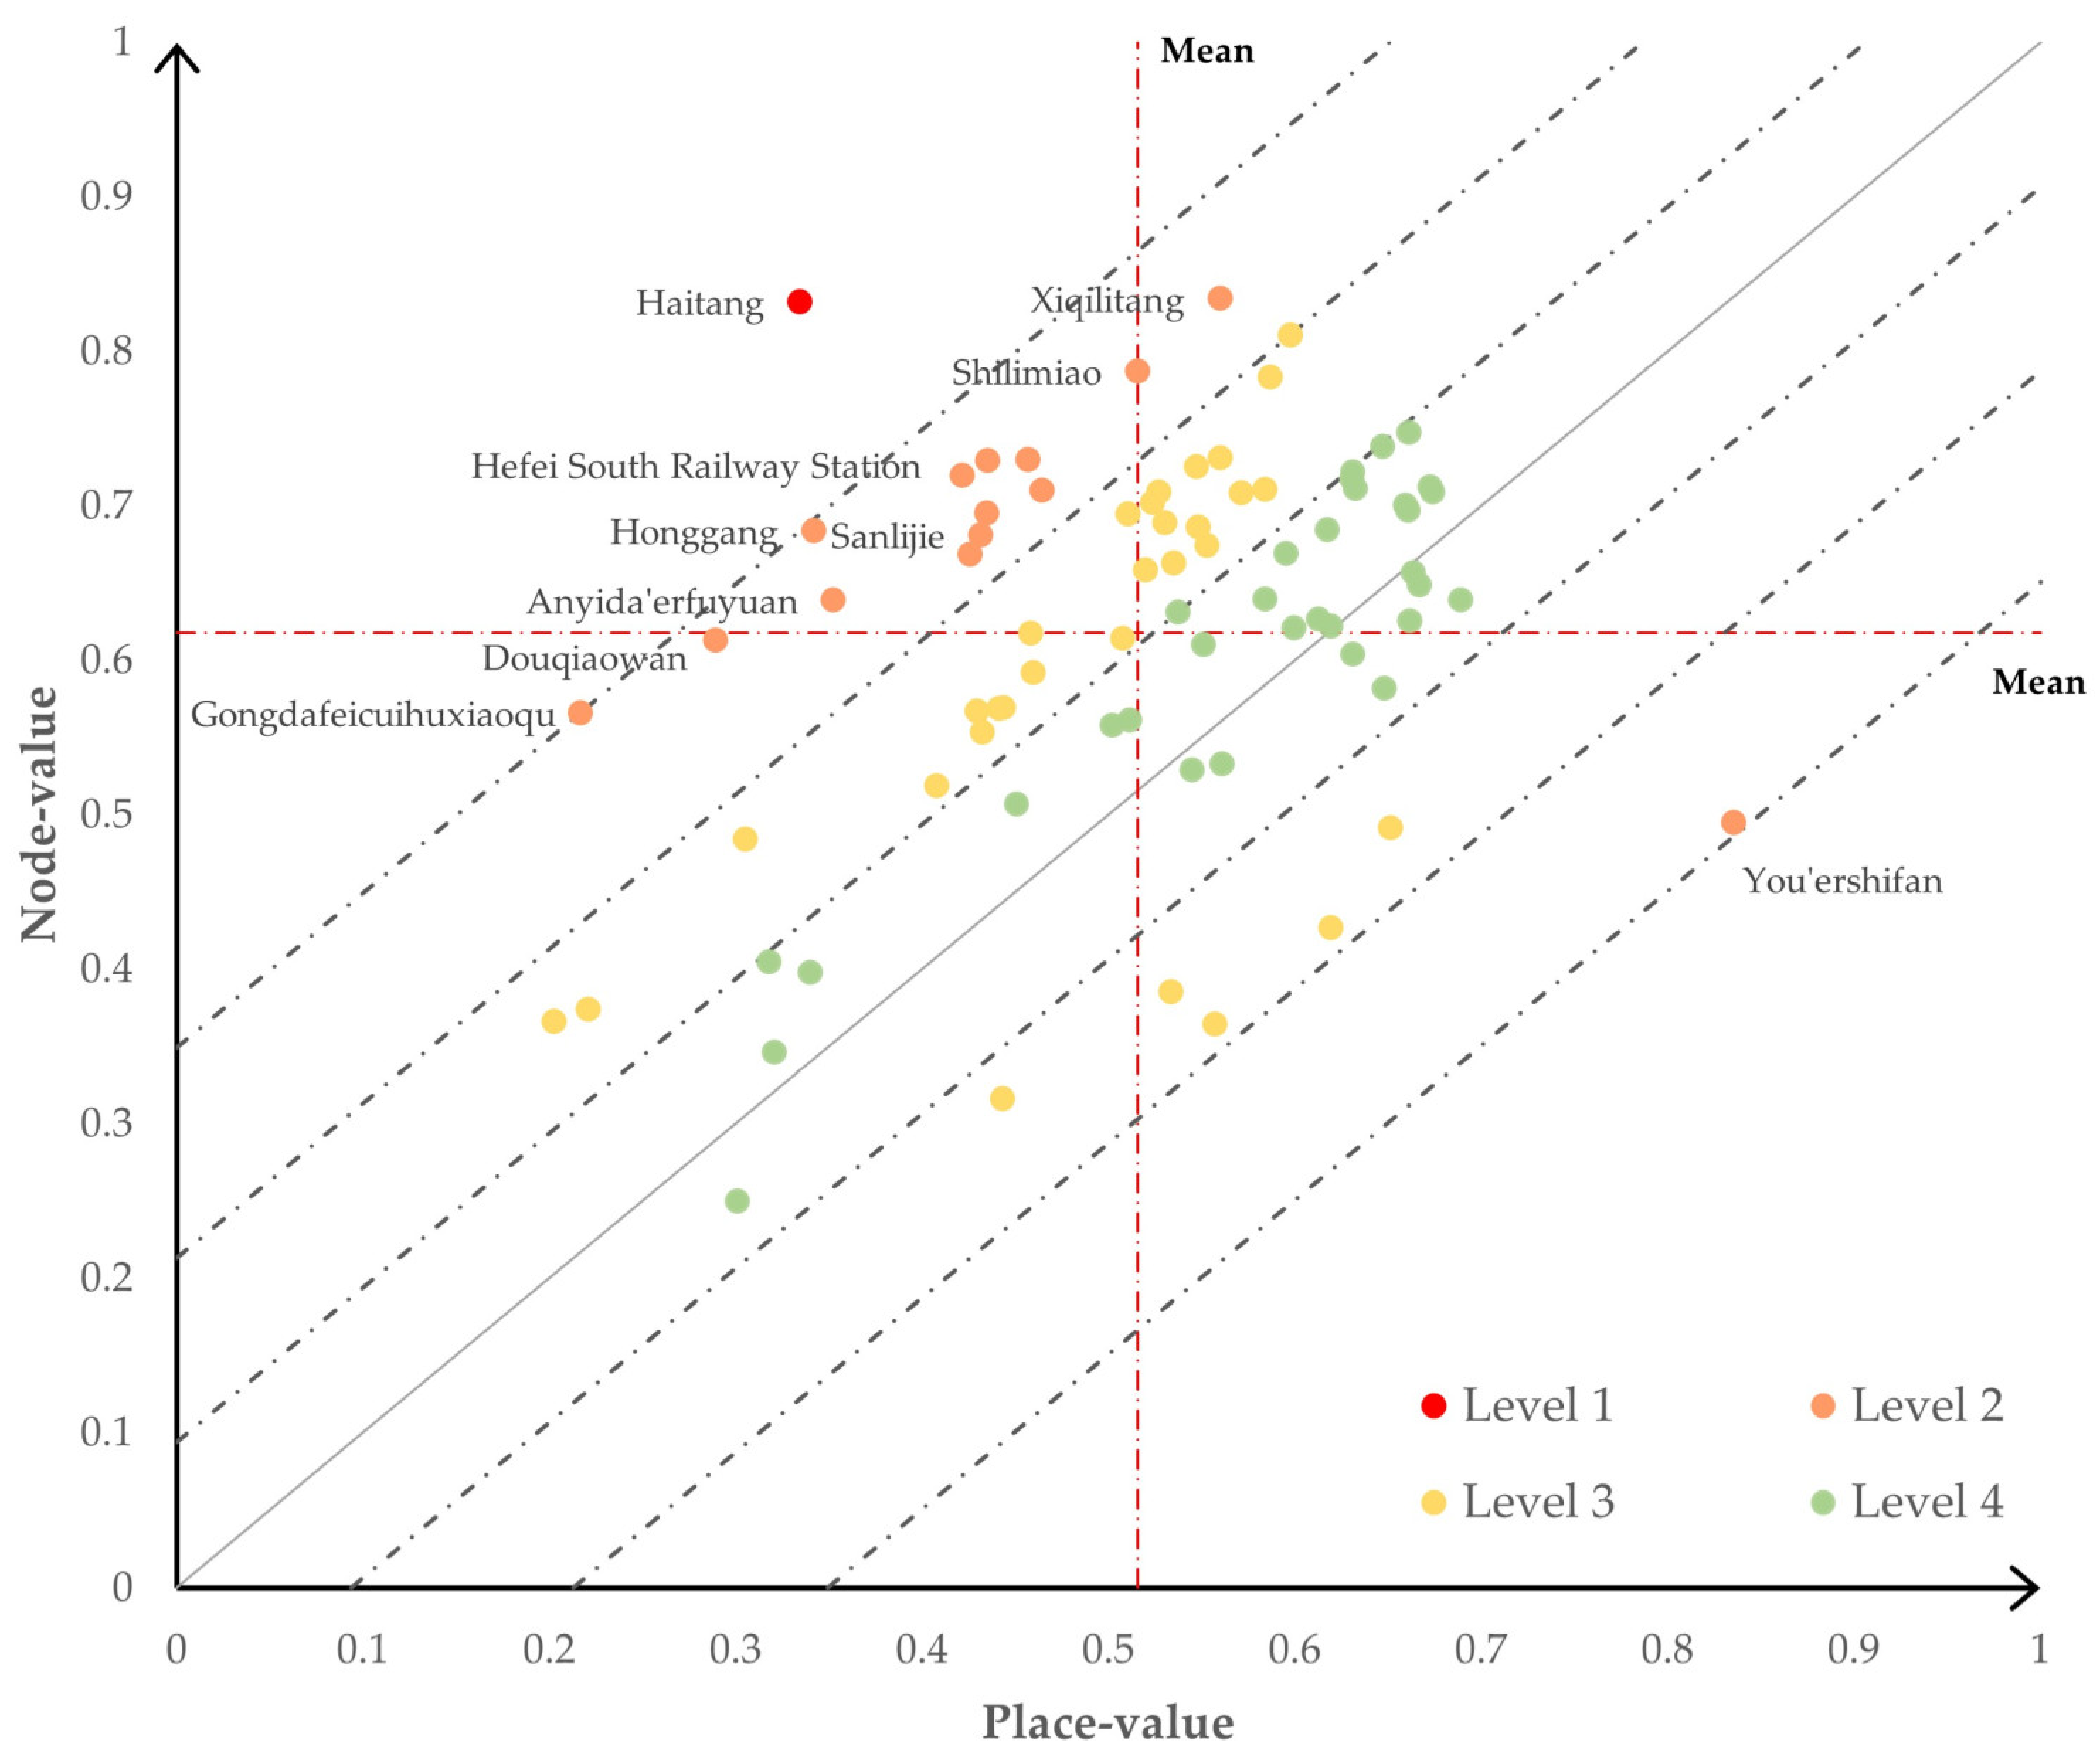
2.3. Development Priority among the Existing TODs

The silhouette method [30] was applied based on the original node–place model. The silhouette value is a method used to measure the similarity of an object in different clusters. The average silhouette value could be used to evaluate the effectiveness of different clusters and select the suitable number of clusters. In this case, the silhouette method could be used to distinguish between the balanced and unbalanced TODs. First, the silhouette method was applied to determine the number of clusters within the dataset. Then, we plotted the node- and place-values to show the silhouette score of each TOD and the cluster to which each TOD belongs. TODs could be divided into different clusters according to their Euclidean distance to the middle line. The farther the cluster is from the middle line, the more priority should be given to development. In future planning, the TODs can be efficiently developed in batches according to the priority order of the clusters.

3. Results and Discussion

Through the calculation of node- and place-values, a node–place graph was obtained as shown in Figure 4. The application of the node–place model to the Hefei City reveals differences between the node- and place-values of the 77 TODs. The node-value varies between 0.25 and 0.83, with a mean value of 0.62. The place-value varies between 0.20 and 0.84, with a mean value of 0.52. The average node-value is higher than the average place-value. This shows that the mean node-value is higher than the mean place-value, which indicates that the transport infrastructure development of Hefei TODs is better than that of the surrounding environment.
The node–place graph shows that the node-value and place-value in most TODs are not close enough to each other. This indicates the development of accessibility and activity intensity of these TODs are unbalanced. Only a small number of TODs are in the balanced portion of the node–place graph. The imbalance between accessibility and activity intensity at each TOD proves that the node–place model is a useful method for measuring TODs and finding the weaknesses in them.
As shown in Figure 4, the middle line of the node–place model divides the 77 TODs into two general categories: developed-node TODs and developed-place TODs. Developed-node TODs represent TODs that have a higher node-value but need to improve their activity intensity. The developed-place TODs have a higher place-value but need to improve their accessibility. Therefore, a practical approach to improving the place- and node-values is important. Some improvement strategies need to be proposed to improve activity intensity or accessibility so that more TODs can be promoted to balanced situations in the future.
Figure 5 and Figure 6 show the distribution of node- and place-values of 77 TODs in Hefei City. The high node-values and high place-values are concentrated in existing city centers. The node-values in the old city center are comparatively high and gradually decrease in the suburban areas. The place-values have a different distribution pattern. TODs with high place-values are mostly found in developed areas.
The minimum distance from each station to the middle line of the node–place graph can be calculated based on the node- and place-values already obtained, and the range of distance was from 0.0024 to 0.3523 in Hefei City. Then, the silhouette coefficient was used to determine the priority development level at each TOD. The silhouette score was largest when the number of clusters was four, which indicates that it is suitable to divide 77 TODs into 4 clusters. The priority levels of the clusters depend on their distance from the middle line. Level 1 in Figure 7 has the highest development priority. Figure 7 shows the distribution of the four priority levels in the node–place model. There is only one TOD at priority level 1. There are 14 TODs in priority level 2, 30 TODs in priority level 3, and 32 TODs in priority level 4.
The boundary line of a cluster is determined by a parallel line to the middle line passing through the farthest point in the cluster. Therefore, the exact priority ranges are directly expressed through the six boundary lines. The range of priority level 1 is above 0.2470, the range of level 2 is from 0.1506 to 0.2470, the range of level 3 is from 0.0662 to 0.1506, and the range of level 4 is less than 0.0662.
As mentioned above, there are four TOD development priority levels in Hefei City. This paper analyzes the TODs that need priority development. The 15 priority TODs are explained in detail in Table 3a,b. Figure 8 shows the distribution of 15 priority TODs in the Hefei City map.
Haitang is the only TOD located on Level 1 among the existing 77 TODs. According to Table 2, the accessibility by subway, bus, and car in Haitang are all higher than the aver-age, and only the frequency of subway is lower. However, only residential, commercial, and distributional activities exist in the region. The lack of other types of activities leads to the lowest land-use mix degree, and a lower than average activity intensity value in this TOD. This also leads to a big difference between the node-value and the place-value of the TOD. Haitang is far from the middle line in the node–place graph. A completed transportation environment combined with developing land use leaves TODs in an unstable situation and easily moving towards a more balanced situation. Therefore, a TOD at level 1 is named an “Unstable TOD”. In addition, this paper only analyzes the existing TODs in Hefei, so only TODs with high accessibility and low activity intensity appear in this case. However, TODs with low accessibility and high activity intensity may still exist in other cities.
Two representative TODs among the 14 TODs in Level 2 were selected for analysis. Douqiaowan is a TOD at Level 2. It is close to the city center, and its accessibility by subway and bus is slightly below average. The reason is that it is far from the middle line and has an extremely low intensity of activity. There are only residential and education-related activities in the region. You’ershifan is a TOD at the end of the subway, in the suburban area. There are few subway and bus lines. However, there are many types of activities within the 500 m range. Generally, there is still a big gap between the node-value and the place-value of TODs at level 2. However, compared with TODs at level 1, TODs at level 2 have a larger development potential for accessibility or activity intensity. They have more indicators of lower value than the average value. Therefore, TODs at level 2 are named “Unbalanced TODs”.
While the above results can explain the development priorities of TODs based on node–place model results, there is a noticeable difference in the indicators that need to be developed among TODs in the same priority group, as shown in Table 3a,b, due to the specialized nature of certain TODs. For example, Hefei South Railway Station is a transportation hub mainly specialized in the distribution of goods and passenger transfer services, which drives the economic development of the region. In the Hefei South Railway Station TOD, the development of commercial activities should be encouraged, and parking needs must be met. However, industrial or administrative activities do not have the same high priority of development. Gongdafeicuihuxiaoqu mainly serves surrounding universities. Promoting further diversification of activities is not possible within 500 m of that TOD. Therefore, understanding a TOD’s service attributes is the basis for accurately understanding its development direction and formulating its development strategy. The future development strategies of TODs need to consider the local conditions. The purpose of this research was to first understand the unbalanced situations in some TODs by examining the relationship between accessibility and activity intensity and then prioritize development based on the distance from a balanced status. While this strategy can group a broad range of TODs based on the balanced development of land-use and accessibility at each TOD, further research is necessary to understand the priority TODs among spatialized TODs that cannot have a full range of land uses or do not require a full range of transport options.
As mentioned above, it can be found that some TODs can be fully developed as balanced TODs, while others are more suitable for being developed as specialized TODs. This paper assumes that the balanced TODs are distributed near the middle line of the node–place model (Figure 3). The balanced development assumption of the node–place model is only a good starting point for discovering priority TODs at the city scale. Reusser’s work [27] made the same observation after carrying out cluster analysis on the Swiss railway network. The current research proposes a simpler method to discover a similar broad group of priority TODs. At the same time, adopting the node–place model to find priority TODs has the advantage of helping to discover weaknesses of TODs and the ability to suggest development strategies, compared to other methods, such as analyzing the relative efficiency of TODs as used by Lee [22]. Berawi [42] defined TODs’ service function by analyzing the proportion of different land uses around TODs. Such an analysis is useful to define the specialization of TODs and suggest priorities and appropriate development strategies.
This study only considered the traffic accessibility and the surrounding activity intensity to measure the priority TODs. However, the development of TODs from the perspective of TOD users, such as TODs as living and working environments, is highly important to achieve the development goals of TODs. The 3D (density, diversity, and design) principle [43] of TOD development suggests the integration of design into TOD development models. To fully understand the development priority at each TOD requires broad considerations such as design, historic and natural value at TODs. These are the limitations of this research as a study to find priority TODs that need the attention of future research.

4. Conclusions

Many Chinese cities are currently facing some problems due to the rapid growth of their populations and the continuous city expansion. Hefei, the capital city of Anhui Province, has been experiencing rapid development since 2010 as well. The Hefei municipal government began to operate the subway system in 2017 and introduced the concept of transit-oriented development (TOD) as a guideline to reduce traffic pressure and environmental pollution. By 2020, there were three subway lines and 77 TODs in operation. However, some TODs cannot effectively implement the TOD concept, and the problems mentioned above still exist among these TODs. Therefore, the objective of this paper is to identify the priority TODs among the 77 existing TODs for reasonable investment allocation.
This paper presents a method to determine the priority TODs among the existing 77 TODs in Hefei City. The node–place model is a model commonly used to evaluate the development of TODs. The original node–place model can classify TODs into five ideal situations, in which the unbalanced TODs are in an unstable state, and there is a trend toward the balanced TODs. Therefore, this study assumed that the unbalanced TODs are the TODs that need to be given priority development. However, the scope of these priority TODs is not clearly defined in the original node–place model. Therefore, this study combined another method, the silhouette method, to accurately determine the priority TODs. Specifically, first, we calculated the vertical distance from each TOD to the middle line in the original node–place graph. Second, the silhouette method was used to effectively classify these TODs. Clusters that are further away from the middle line were considered to have a higher priority for development. According to the calculation results of the silhouette method, the silhouette score was largest when the number of groups was equal to 4. Therefore, there are four levels of priority TODs in Hefei City. The TODs in level 1 and level 2 need to be developed first because they are far from the middle line, and were named “Unstable TODs”, “Unbalanced TODs”, respectively. At the same time, several specific examples were provided to illustrate the unique characteristics of different development priorities. Generally, this paper not only makes the original node–place model more practical, but it also and allows planners or designers to improve the existing TODs more effectively by finding priority TODs and carry out reasonable allocation of limited investment at the same time.
However, this paper still has some limitations. First, the selection of indicators can directly affect the final node- and place-values, resulting in different orders of priority TODs. This paper is mainly based on the commonly used indicators selected in previous studies. Indicators that can better represent the local context can be included in the analysis. Second, this paper only considers the development within 500 m of each TOD. Different catchment areas can be considered when analyzing and developing priority TODs in future research.
For future research, this method can be applied in other cities to verify and develop it into a general tool. At the same time, more factors need to be studied, such as the composition of the TOD network, to deeply understand the future development of TODs. Furthermore, the methods currently used in this paper make it difficult to evaluate the living or working environment of TODs, which should be investigated further in future research.

Author Contributions

Conceptualization, W.W. and P.D.; methodology, W.W.; validation, W.W.; formal analysis, W.W.; investigation, W.W.; writing - original draft, W.W.; visualization, W.W.; writing - review & editing, W.W. and P.D.; supervision, P.D.; funding acquisition, W.W. and P.D. All authors have read and agreed to the published version of the manuscript.

Funding

This research was funded by the JST SPRING program at Kyushu University, grant number JPMJSP2136.

Institutional Review Board Statement

Not applicable.

Informed Consent Statement

Not applicable.

Data Availability Statement

Not applicable.

Conflicts of Interest

The authors declare no conflict of interest. The funders had no role in the design of the study; in the collection, analyses, or interpretation of data; in the writing of the manuscript; or in the decision to publish the results.

References

  1. Guo, Y.; Qiao, W. Rural migration and urbanization in China: Historical evolution and coupling pattern. Sustainability 2020, 12, 7307. [Google Scholar] [CrossRef]
  2. Heilig, G.K. World Urbanization Prospects the 2011 Revision; United Nations, Department of Economic and Social Affairs (DESA), Population Division, Population Estimates and Projections Section: New York, NY, USA, 2012. [Google Scholar]
  3. National Bureau of Statistics of China. 2021. Available online: http://www.stats.gov.cn/enGliSH/Statisticaldata/AnnualData/ (accessed on 11 April 2022).
  4. Wei, X.; Ren, Y.; Shen, L.; Shu, T. Exploring the spatiotemporal pattern of traffic congestion performance of large cities in China: A real-time data based investigation. Environ. Impact Assess. Rev. 2022, 95, 106808. [Google Scholar] [CrossRef]
  5. Hua, X.Y.; Cheng, L.; Bai, H. Thinking on application of transit oriented development in Chinese cities. Transp. Stand. 2009, 200, 80–84. [Google Scholar]
  6. Jen, T.P.; Huang, Y.H. The Travel Behaviours Change of the Residents of Transit Jointed Development in Taipei Metropolitan Area. Int. Rev. Spat. Plan. Sustain. Dev. 2013, 1, 15–23. [Google Scholar]
  7. Lyu, G.; Bertolini, L.; Pfeffer, K. Developing a TOD typology for Beijing metro station areas. J. Transp. Geogr. 2016, 55, 40–50. [Google Scholar] [CrossRef]
  8. Ewing, R.; Cervero, R. Travel and the Built Environment: A Meta-Analysis. J. Am. Plan. Assoc. 2010, 76, 265–294. [Google Scholar] [CrossRef]
  9. Nasri, A.; Zhang, L. The analysis of transit-oriented development (TOD) in Washington, DC and Baltimore metropolitan areas. Transp. Policy 2014, 32, 172–179. [Google Scholar] [CrossRef]
  10. Wang, D.; Chai, Y. The jobs–housing relationship and commuting in Beijing, China: The legacy of Danwei. J. Transp. Geogr. 2009, 17, 30–38. [Google Scholar] [CrossRef]
  11. Xu, W.; Guthrie, A.; Fan, Y.; Li, Y. Transit-oriented development in China: Literature review and evaluation of TOD potential across 50 Chinese cities. J. Transp. Land Use 2017, 10, 743–762. [Google Scholar]
  12. Zhao, W.; Zou, Y. Hefei: An emerging city in inland China. Cities 2018, 77, 158–169. [Google Scholar] [CrossRef]
  13. CNR News. 2020. Available online: http://www.cnr.cn/ah/jhfc/20200325/t20200325_525029357.shtml (accessed on 23 March 2020).
  14. Deng, H.; Li, Y.; Li, W.; Yu, Y. Urban transport social needs in China: Quantification with central government transit grant. Transp. Policy 2016, 51, 126–139. [Google Scholar] [CrossRef]
  15. Su, S.; Zhang, H.; Wang, M.; Weng, M.; Kang, M. Transit-oriented development (TOD) typologies around metro station areas in urban China: A comparative analysis of five typical megacities for planning implications. J. Transp. Geogr. 2021, 90, 102939. [Google Scholar] [CrossRef]
  16. Higgins, C.D.; Kanaroglou, P.S. A latent class method for classifying and evaluating the performance of station area transit-oriented development in the Toronto region. J. Transp. Geogr. 2016, 52, 61–72. [Google Scholar] [CrossRef]
  17. Dong, H. Evaluating the impacts of transit-oriented developments (TODs) on household transportation expenditures in California. J. Transp. Geogr. 2021, 90, 102946. [Google Scholar] [CrossRef]
  18. Li, J.; Huang, H. Effects of transit-oriented development (TOD) on housing prices: A case study in Wuhan, China. Res. Transp. Econ. 2020, 80, 100813. [Google Scholar] [CrossRef]
  19. Rahman, M.H.; Ashik, F.R.; Mouli, M.J. Investigating spatial accessibility to urban facility outcome of transit-oriented development in Dhaka. Transp. Res. Interdiscip. Perspect. 2022, 14, 100607. [Google Scholar] [CrossRef]
  20. Chinese Ministry of Housing and Urban-Rural Development. In Guidelines for Planning and Design of Areas along the Urban Rail Transit; Chinese Ministry of Housing and Urban-Rural Development: Beijing, China, 2015.
  21. Agnihotri, V.; Sahu, S.K.; Roy, S. Potential Assessment of New Metro Station Areas in Lucknow. Int. Res. J. Eng. Technol. (IRJET) 2020, 7, 11–14. [Google Scholar]
  22. Lee, E.H.; Shin, H.; Cho, S.H.; Kho, S.Y.; Kim, D.K. Evaluating the efficiency of transit-oriented development using network slacks-based data envelopment analysis. Energies 2019, 12, 3609. [Google Scholar] [CrossRef]
  23. Kalyuzhnyi, N.; Losin, L. A method of mathematical modeling for transfer hub establishment in Saint Petersburg. Transp. Res. Procedia 2018, 36, 245–251. [Google Scholar] [CrossRef]
  24. He, D. Urban Transport of China Failure and Improvement of 3D Principle in Transit-Oriented Development in China: Retrospection on Development along Subway Line 1 in Guangzhou. Urban Transp. China 2018, 2018, 47–53. [Google Scholar]
  25. Bertolini, L. Spatial development patterns and public transport: The application of an analytical model in the Netherlands. Plan. Pract. Res. 1999, 14, 199–210. [Google Scholar] [CrossRef]
  26. Chorus, P.; Bertolini, L. An application of the node place model to explore the spatial development dynamics of station areas in Tokyo. J. Transp. Land Use 2011, 4, 45–58. [Google Scholar]
  27. Reusser, D.E.; Loukopoulos, P.; Stauffacher, M.; Scholz, R.W. Classifying Railway Stations for Sustainable Transitions—Balancing Node and Place Functions. J. Transp. Geogr. 2008, 16, 191–202. [Google Scholar] [CrossRef]
  28. Kamruzzaman, M.; Baker, D.; Washington, S.; Turrell, G. Advance transit oriented development typology: Case study in Brisbane, Australia. J. Transp. Geogr. 2014, 34, 54–70. [Google Scholar] [CrossRef]
  29. Monajem, S.; Ekram Nosratian, F. The evaluation of the spatial integration of station areas via the node place model; an application to subway station areas in Tehran. Transp. Res. Part D Transp. Environ. 2015, 40, 14–27. [Google Scholar] [CrossRef]
  30. Zhang, Y.; Marshall, S.; Manley, E. Network criticality and the node-place-design model: Classifying metro station areas in Greater London. J. Transp. Geogr. 2019, 79, 102485. [Google Scholar] [CrossRef]
  31. Vale, D.S.; Viana, C.M.; Pereira, M. The extended node-place model at the local scale: Evaluating the integration of land use and transport for Lisbon’s subway network. J. Transp. Geogr. 2018, 69, 282–293. [Google Scholar] [CrossRef]
  32. Rousseeuw, P.J. Silhouettes: A graphical aid to the interpretation and validation of cluster analysis. J. Comput. Appl. Math. 1987, 20, 53–65. [Google Scholar] [CrossRef]
  33. Singh, Y.J.; Fard, P.; Zuidgeest, M.; Brussel, M.; van Maarseveen, M. Measuring transit oriented development: A spatial multi criteria assessment approach for the City Region Arnhem and Nijmegen. J. Transp. Geogr. 2014, 35, 130–143. [Google Scholar] [CrossRef]
  34. Li, Z.; Han, Z.; Xin, J.; Luo, X.; Su, S.; Weng, M. Transit oriented development among metro station areas in Shanghai, China: Variations, typology, optimization and implications for land use planning. Land Use Policy 2019, 82, 269–282. [Google Scholar] [CrossRef]
  35. Zemp, S.; Stauffacher, M.; Lang, D.J.; Scholz, R.W. Classifying railway stations for strategic transport and land use planning: Context matters! J. Transp. Geogr. 2011, 19, 670–679. [Google Scholar] [CrossRef]
  36. Vale, D.S. Transit-oriented development, integration of land use and transport, and pedestrian accessibility: Combining node-place model with pedestrian shed ratio to evaluate and classify station areas in Lisbon. J. Transp. Geogr. 2015, 45, 70–80. [Google Scholar] [CrossRef]
  37. Liang, Y.; Du, M.; Wang, X.; Xu, X. Planning for urban life: A new approach of sustainable land use plan based on transit-oriented development. Eval. Program Plan. 2020, 80, 101811. [Google Scholar] [CrossRef]
  38. Dou, M.; Wang, Y.; Dong, S. Integrating Network Centrality and Node-Place Model to Evaluate and Classify Station Areas in Shanghai. ISPRS Int. J. Geo-Inf. 2021, 10, 414. [Google Scholar] [CrossRef]
  39. Hefei Bus Guide App. Available online: http://hefei.gongjiao.com/ (accessed on 20 May 2021).
  40. The Website of Metro Operational Map. Available online: http://www.hfgdjt.com/ (accessed on 10 June 2021).
  41. The OpenStreetMap Website. Available online: https://www.openstreetmap.org/#map=6/31.504/122.058 (accessed on 21 December 2021).
  42. Berawi, M.A.; Saroji, G.; Iskandar, F.A.; Ibrahim, B.E.; Miraj, P.; Sari, M. Optimizing land use allocation of Transit-Oriented Development (TOD) to generate maximum ridership. Sustainability 2020, 12, 3798. [Google Scholar] [CrossRef]
  43. Cervero, R.; Kockelman, K. Travel demand and the 3Ds: Density, diversity, and design. Transp. Res. Part D Transp. Environ. 1997, 2, 199–219. [Google Scholar] [CrossRef]
Figure 1. Map of the 77 TODs in Hefei City.
Land 11 01590 g001
Figure 2. The research flow chart.
Land 11 01590 g002
Figure 3. The original node–place model by Bertolini [25].
Land 11 01590 g003
Figure 4. The 77 existing TODs in the node–place model.
Land 11 01590 g004
Figure 5. Map of node-values in Hefei City.
Land 11 01590 g005
Figure 6. Map of place-values in Hefei City.
Land 11 01590 g006
Figure 7. Four priority levels of 77 TODs.
Land 11 01590 g007
Figure 8. Map of the distribution of 15 priority TODs in Hefei City.
Land 11 01590 g008
Table 1. Selection of indicators from previous literature [25].
ValuesIndicators
Node-valueAccessibility by trainNumber of directions served


Place-value


Accessibility by bus, tram, and underground

Accessibility by car


Accessibility by bicycle
Daily frequency of services
Number of stations within 45 min of travel

Number of directions
Daily frequency

Distance from the closest motorway access
Parking capacity

Number of free-standing bicycle paths
Parking capacity

Number of residents in the area
Number of workers per each of four economic
clusters (retail/hotel and catering,
education/health/culture, administration and
services, industry and distribution)
Degree of functional mix
Table 2. The indicators chosen for the node- and place-values [25,34].
IndicatorsMeasurementData Source
Number of directions served by Metro (y1)Number of subway services offered at the station from Hefei Metro Operational MapThe website of Metro Operational Map. http://www.hfgdjt.com/ (accessed on 10 June 2021)
Daily frequency of Metro services (y2)Number of subways departing from the station on a working day from Hefei Metro Operational MapThe website of Metro Operational Map. http://www.hfgdjt.com/ (accessed on 10 June 2021)
Number of stations within 20 min of travel (y3)Number of stations reachable within 20 min by subway from Hefei Metro Operational MapThe website of Metro Operational Map. http://www.hfgdjt.com/ (accessed on 10 June 2021)
Travel time to the CBD (seconds) (y4)The travel time to the CBD by subway from Hefei Metro Operational MapThe website of Metro Operational Map. http://www.hfgdjt.com/ (accessed on 10 June 2021)
Number of directions served by buses (y5)Number of bus services offered at the station from Hefei Bus Guide AppHefei Bus Guide App. http://hefei.gongjiao.com/ (accessed on 20 May 2021)
Daily frequency of bus services (y6)Number of buses departing from the station on a working day from Hefei Bus Guide AppHefei Bus Guide App. http://hefei.gongjiao.com/ (accessed on 20 May 2021)
Distance from the closest motorway access (y7)Distance to next highway exitThe OpenStreetMap website. https://www.openstreetmap.org/#map=6/31.504/122.058 (accessed on 21 December 2021)
Car parking capacity (y8)The area of car parking within 500 m walking distance from metro stationsThe OpenStreetMap website. https://www.openstreetmap.org/#map=6/31.504/122.058 (accessed on 21 December 2021)
Residential land (x1)The area of residential land within 500 m walking distance from metro stations (D1)The OpenStreetMap website. https://www.openstreetmap.org/#map=6/31.504/122.058 (accessed on 21 December 2021)
Retail, hotel, and catering land (x2)The area of commercial land within 500 m walking distance from metro stations (D2)The OpenStreetMap website. https://www.openstreetmap.org/#map=6/31.504/122.058 (accessed on 21 December 2021)
Parks, forest (x3)The area of parks, forest within 500 m walking distance from metro stations (D3)The OpenStreetMap website. https://www.openstreetmap.org/#map=6/31.504/122.058 (accessed on 21 December 2021)
Industrial and distribution land (x4)The area of industrial and distribution within 500 m walking distance from metro stations (D4)The OpenStreetMap website. https://www.openstreetmap.org/#map=6/31.504/122.058 (accessed on 21 December 2021)
Education, health, culture land (x5)The area of cultural, education, health land within 500 m walking distance from metro stations (D5)The OpenStreetMap website. https://www.openstreetmap.org/#map=6/31.504/122.058 (accessed on 21 December 2021)
Service and administration land (x6)The area of public service land within 500 m walking distance from metro stations (D6)The OpenStreetMap website. https://www.openstreetmap.org/#map=6/31.504/122.058 (accessed on 21 December 2021)
Degree of functional mix (x7)Land function mix a = max (D1 D2 D3 D4 D5 D6)
b = min (D1 D2 D3 D4 D5 D6)
c = (D1 + D2 + D3 + D4 + D5 + D6)/6
d = D1 + D2 + D3 + D4 + D5 + D6
F = 1 − ((a − b)/d − (a − c)/d)/2
Table 3. (a) Detailed description of 15 priority TODs (node-value). (b) Detailed description of 15 priority TODs (place-value).
(a)
LevelTOD NameMetro
Directions
Metro
Frequency
Stations
within 20 min
Travel Time to CBDBus
Directions
Bus
Frequency
Distance to Motorway AccessCar
Parking Capacity
L1 (N = 1)Haitang0.50.03530.62630.725510.86950.86020.9515
L2 (N = 14)Douqiaowan0.50.03530.50960.68310.53720.73410.81770.5981
You’ershifan0.50.03530.1640.6330.64960.63480.85410
Changhuai0.50.13070.86450.38110.73350.89550.79730.9234
Sanlijie0.50.00000.90480.19060.98290.72370.76390.8834
Anyida’erfuyuan0.50.03530.29120.89570.80040.81480.34840.9379
Dongwulijing0.50.00000.85040.38110.85620.87090.77010.836
Fangmiao0.50.03530.8060.6330.53720.73410.81920.6854
Gongdafeicuihuxiaoqu0.50.03530.06010.95280.59810.73410.56140.5981
Hefei South Railway Station0.50.13070.75780.72550.88090.96410.00000.5054
Honggang0.50.03530.66710.76220.76860.71260.58650.9515
Longgang0.50.00000.60480.68310.73350.75950.70390.8655
Shilimiao0.50.00000.98890.72550.92550.83160.82581.0000
Tushuguan0.50.03530.48310.84980.76860.81950.28780.9234
Xiqilitang10.93390.87820.6331.00000.90480.69810.9448
Mean (N = 77) 0.49080.08770.5420.70790.59030.71280.68210.6614
(b)
LevelTOD NameResidentialRetail
Catering
Parks
Forest
IndustrialEducational
Health
Culture
ServiceDegree of Functional Mix
L1 (N = 1)Haitang0.77550.72330.00000.84020.00000.00000.9
L2 (N = 14)Douqiaowan0.77160.00000.0000.00000.70750.00000.9167
You’ershifan0.7120.71770.8680.79590.98240.77050.9306
Changhuai0.90730.94790.00000.00000.85160.00000.9167
Sanlijie0.79090.79320.00000.00000.92160.00000.9167
Anyida’erfuyuan0.7120.71770.8680.79590.98240.77050.9306
Dongwulijing0.77980.85780.00000.00000.86180.00000.9167
Fangmiao0.74960.76560.79720.88510.00000.00000.9167
Gongdafeicuihuxiaoqu0.00000.00000.00000.00000.97250.00000.9167
Hefei South Railway Station0.00000.74210.00000.79710.00000.96380.9167
Honggang0.79360.80130.00000.79650.00000.00000.9
Longgang0.80290.81380.00000.00000.820.00000.9167
Shilimiao0.95170.8710.00000.80740.43510.00000.9167
Tushuguan0.66070.82480.00000.92140.00000.00000.9167
Xiqilitang0.93940.91290.00000.00000.91670.6070.9167
Mean (N = 77) 0.76570.67280.19150.50010.65060.33450.9159
Publisher’s Note: MDPI stays neutral with regard to jurisdictional claims in published maps and institutional affiliations.

