Article

Impact of Urban Land Expansion Efficiency on Ecosystem Services: A Case Study of the Three Major Urban Agglomerations along the Yangtze River Economic Belt

1
School of Geography Science, Hunan Normal University, Changsha 410006, China
2
School of Engineering Management, Hunan University of Finance and Economics, Changsha 410006, China
*
Author to whom correspondence should be addressed.
Land 2022, 11(9), 1591; https://doi.org/10.3390/land11091591
Submission received: 4 August 2022 / Revised: 1 September 2022 / Accepted: 12 September 2022 / Published: 16 September 2022
(This article belongs to the Section Land Environmental and Policy Impact Assessment)

Abstract

:
The negative impacts of urban land expansion on ecosystem services have been confirmed by many studies; however, there has been a lack of studies examining the impacts of urban expansion on ecosystems from an efficiency perspective. China is increasingly emphasising the efficiency of development systems by maximising economic, social, and environmental benefits from limited land resources, which is a vital issue for high-quality urban development. Therefore, this paper aims to explore the evolutionary characteristics of urban land expansion efficiency (ULEE) and its impact on ecosystem services (ESs) to improve the ecological functions of urban systems. We first analysed the influence mechanism, based on efficiency and land use theory. Then, we used the Super-SBM and the InVEST model to measure ULEE and ecosystem service value (ESV). Finally, through regression analysis we explored the actual characteristics of the influence of ULEE on ESs. The results show: (1) ULEE positively influences ESs, and the influence mediators include three main aspects, i.e., land use structure, land use pattern, and land use quality. (2) The ULEE of the urban agglomerations exhibited a fluctuating downward trend from 2006–2020, and noticeable spatial differences were observed. (3) The AESV of the three major urban agglomerations showed a decreasing trend during the study period, with the UA-MRYR being higher than UA-YRD and UA-CY. Meanwhile, a certain degree of coincidence between the changing trend of AESV and ULEE was apparent. (4) A positive correlation was found between ULEE and the ESV of the three urban agglomerations. That is, the enhancement of ULEE was found to catalyse the improvement of ESs. The impact of ULEE on ESs exhibited a general decreasing trend from east to west. These results complement the study of the territorial system of the human–land relationship and have essential reference value for sustainable urban development and ecological restoration.

1. Introduction

Since the 1990s, China has experienced an unprecedented wave of urbanisation, with the rate rising from 26.44% in 1990 to 63.89% in 2020. Urban land has undergone a dramatic expansion due to socioeconomic activities that have fueled population growth. According to the Third National Land Survey data, China’s urban land area reached 52,218 km2 in 2020, from 35,000 km2 in 1990. At the same time, China’s urbanisation level retains vast room for improvement as there remains a strong demand for urban land, resulting in a continuous trend of urban land expansion [1,2]. However, urban land expansion often occurs at the cost of encroaching on agricultural and ecological land. This expansion is often accompanied by an increase in pollution emissions, posing a severe threat to the security and services of the ecosystem [3,4]. Many studies have explored the relationship between urban land expansion and ecosystem services [5,6]. Rapid and extensive urban land expansion has led to a series of problems, including loss of cultivated land [7], increased carbon emissions [8], decreased biodiversity [9], and intensified urban heat-island effects [10]. However, there has been a lack of literature examining the impact of urban land expansion on ecosystem services from an efficiency perspective.
Urban land expansion efficiency (ULEE) an expansion of the concept of urban land efficiency, which is one of the representative concepts of sustainable development [11]. Early scholars analysed urban land efficiency mainly from the perspective of economic output [12,13]. Wu [14] defined ULEE as “the ratio of the total production value of urban secondary and tertiary industries to the urban land area”. Later scholars linked urban land efficiency with long-term sustainable development from the perspectives of society, economy, and the ecological environment [15,16]. In recent years, due to the increasing attention paid to environmental pollution and the economic gap between the rich and the poor, some scholars have tried to incorporate unintended outputs such as income gap, pollution emissions, and environmental disturbance into the evaluation system of urban land efficiency [17,18]. In addition, certain scholars have studied the topic of urban land use efficiency from different perspectives, such as measurement and evaluation [19] of spatial patterns [20], and driving mechanisms [21]. As China’s economy has gradually shifted from a phase of high-speed development to one of high-quality development, the emphasis on efficiency throughout the development system has increased. Examining the issue of urban land expansion and reducing its negative impacts through efficiency improvement has become a meaningful way to promote sustainable and high-quality development of urban territorial systems. However, most relevant studies, especially comparative studies of urban agglomerations, have lacked examination of the efficiency of urban land expansion.
Ecosystem services (ESs) are vital products provided directly or indirectly by the ecosystem’s structure, processes, and functions. They include four main types of services: Provisioning, regulating, supporting, and cultural [22,23]. Daily [24] in 1997 provided the first systematic concept and valuation of ESs, and Costanza [22] provided the first systematic assessment for global ESV (Ecosystem Service Value, which is often used to quantify and characterise levels of ES). Since then, scholars have extensively discussed the assessment measurements [25], spatial patterns [26], and influencing factors [27] relating to ESV. The most commonly used technique for assessing ESV is the equivalence factor method, which combines different ecological conditions and land use changes to give different equivalence factors. However, reference coefficients and value equivalents vary greatly, and definitions of land use types can also differ [28]. Therefore, this paper attempts to construct a more objective and accurate measurement of ESV by using the InVEST model from four aspects, including food supply, carbon storage, habitat quality, and recreational culture, to improve on the results of existing studies. In general, there have been extensive discussions about urban land expansion, ecosystem services, the impact of urban land expansion on ecosystem services, and urban land efficiency, which together have produced a wealth of research results. However, certain limitations apply, as shown in Table 1.
In the processes of modern urbanisation, cities are increasingly no longer independent and individual but tend to merge into urban agglomerations (UAs) [18]. These are usually a combination of cities with one or several megacities as the centre, and multiple small and medium-sized cities as the components [29,30]. Some examples include the Atlantic coastal agglomerations in the northeast of the United States, the Great Lakes urban agglomerations, and the Pacific coastal agglomerations in Japan. Rapid urbanisation in China has resulted in the proliferation of many cities in clusters, eventually producing many UAs. These UAs include the Yangtze River Delta and the Pearl River Delta in Beijing–Tianjin–Hebei. UAs are products of urbanisation and industrialisation at an advanced stage. They have experienced a more drastic process of land expansion, causing more significant disturbance to ESs [31,32]. Therefore, the discrepancy between China’s urban agglomerations expansion and environment sustainable development is becoming increasingly severe. The Yangtze River Economic Belt (YREB) is the most promising basin region for China’s economic development in the new era. It is becoming an economic belt with global influence, and an essential support belt for the high-quality development of China’s national space [33,34]. The UA in the Yangtze River Delta (UA-YRD), the UA in the Middle Reaches of Yangtze River (UA-MRYR), and the UA in the Cheng-Yu District (UA-CY) are the three most essential growth poles in this economic belt.
The leading centres of the YREB play a critical role in regional economic organisation and territorial spatial optimisation. Meanwhile, situated in the east, middle, and west of China, these major UAs are at varying levels of development, exhibiting considerable differences in urban expansion and ecological construction. Therefore, practicality and significance are to be gained by using the three major urban agglomerations in the YREB to study the impact of ULEE on ESs. To sum up, the study objectives of this paper are as follows: (1) To clarify the impact mechanism of ULEE on ESs in UAs, and to construct a mechanism framework; (2) to monitor by using continuous panel data the spatio-temporal changes of ULEE and ESV in the three major urban agglomerations in the YREB, and to reveal their changing patterns; (3), to explore the realistic impact characteristics of ULEE on ESs in the three urban agglomerations, based on the impact mechanism and monitoring results; (4) to provide appropriate policy suggestions for the sustainable and high-quality development of the three urban agglomerations. Based on these aims, this paper contributes from three aspects to the existing literature and practice development. First, addressing the lack of research on urban land expansion efficiency, it explores from an efficiency perspective the problems of urban land expansion and its impact on ecosystem services. Second, the use of continuous panel data and multiple econometric models enabled accurate analysis of the continuous change characteristics of ULEE and ESV, thus deepening the research into urban regions and ecosystems. Third, taking the three urban agglomerations in YREB as a study area is significant for China’s new urbanisation and high-quality space development.
The analysis framework of the rest of this paper is as follows: Section 2 introduces the mechanism of ULEE’s influence on ESs. Section 3 introduces the study area, related research methods, and data description. Section 4 briefly describes and analyses the variations in spatiotemporal characteristics of ULEE and ESV, and the real influence of ULEE on ESs, and possible reasons for the findings are discussed. Section 5 provides the study’s conclusions and puts forward corresponding suggestions.

2. Theoretical Mechanism

2.1. Definition of the Concept of ULEE

The concept of efficiency first emerged in the field of economics. Classical economics considered efficiency to involve the improvement of labour productivity and the system of free competition, and divided efficiency into labour efficiency and competition efficiency [35]. Neoclassical economics emphasised that the essence of efficiency lies in the better allocation of resources [36]. However, whether they consider division efficiency, competitive efficiency, or allocative efficiency, these definitions are all narrow and static [37]. Therefore, some economists have further improved the concept of efficiency. Samuelson and Nordhaus defined efficiency as circumstances in which: “Under the conditions of given input and technology, economic resources are not wasted, or economic resources are utilised to the maximum possible degree of satisfaction” [38]. Land use activity aims to obtain ideal output through particular input in the land system. Therefore, scholars generally believe that the primary connotation of land use efficiency or urban land efficiency refers to the input–output ratio per unit of land area. In simpler terms, the term refers to land use efficiency in the whole urban area [18,39]. In terms of ULEE, there have been very few relevant specialised studies to date, so a detailed introduction to the concept has been lacking. We understand ULEE as referring to the output benefit of newly added urban land area, which under current developmental practices becomes a comprehensive benefit including economic, social, and environmental aspects. It has an important influence on the sustainable development of the urban system. The main difference between ULEE and urban land efficiency is that ULEE emphasises the efficiency of new urban land, highlighting the dynamic quality of urban expansion.

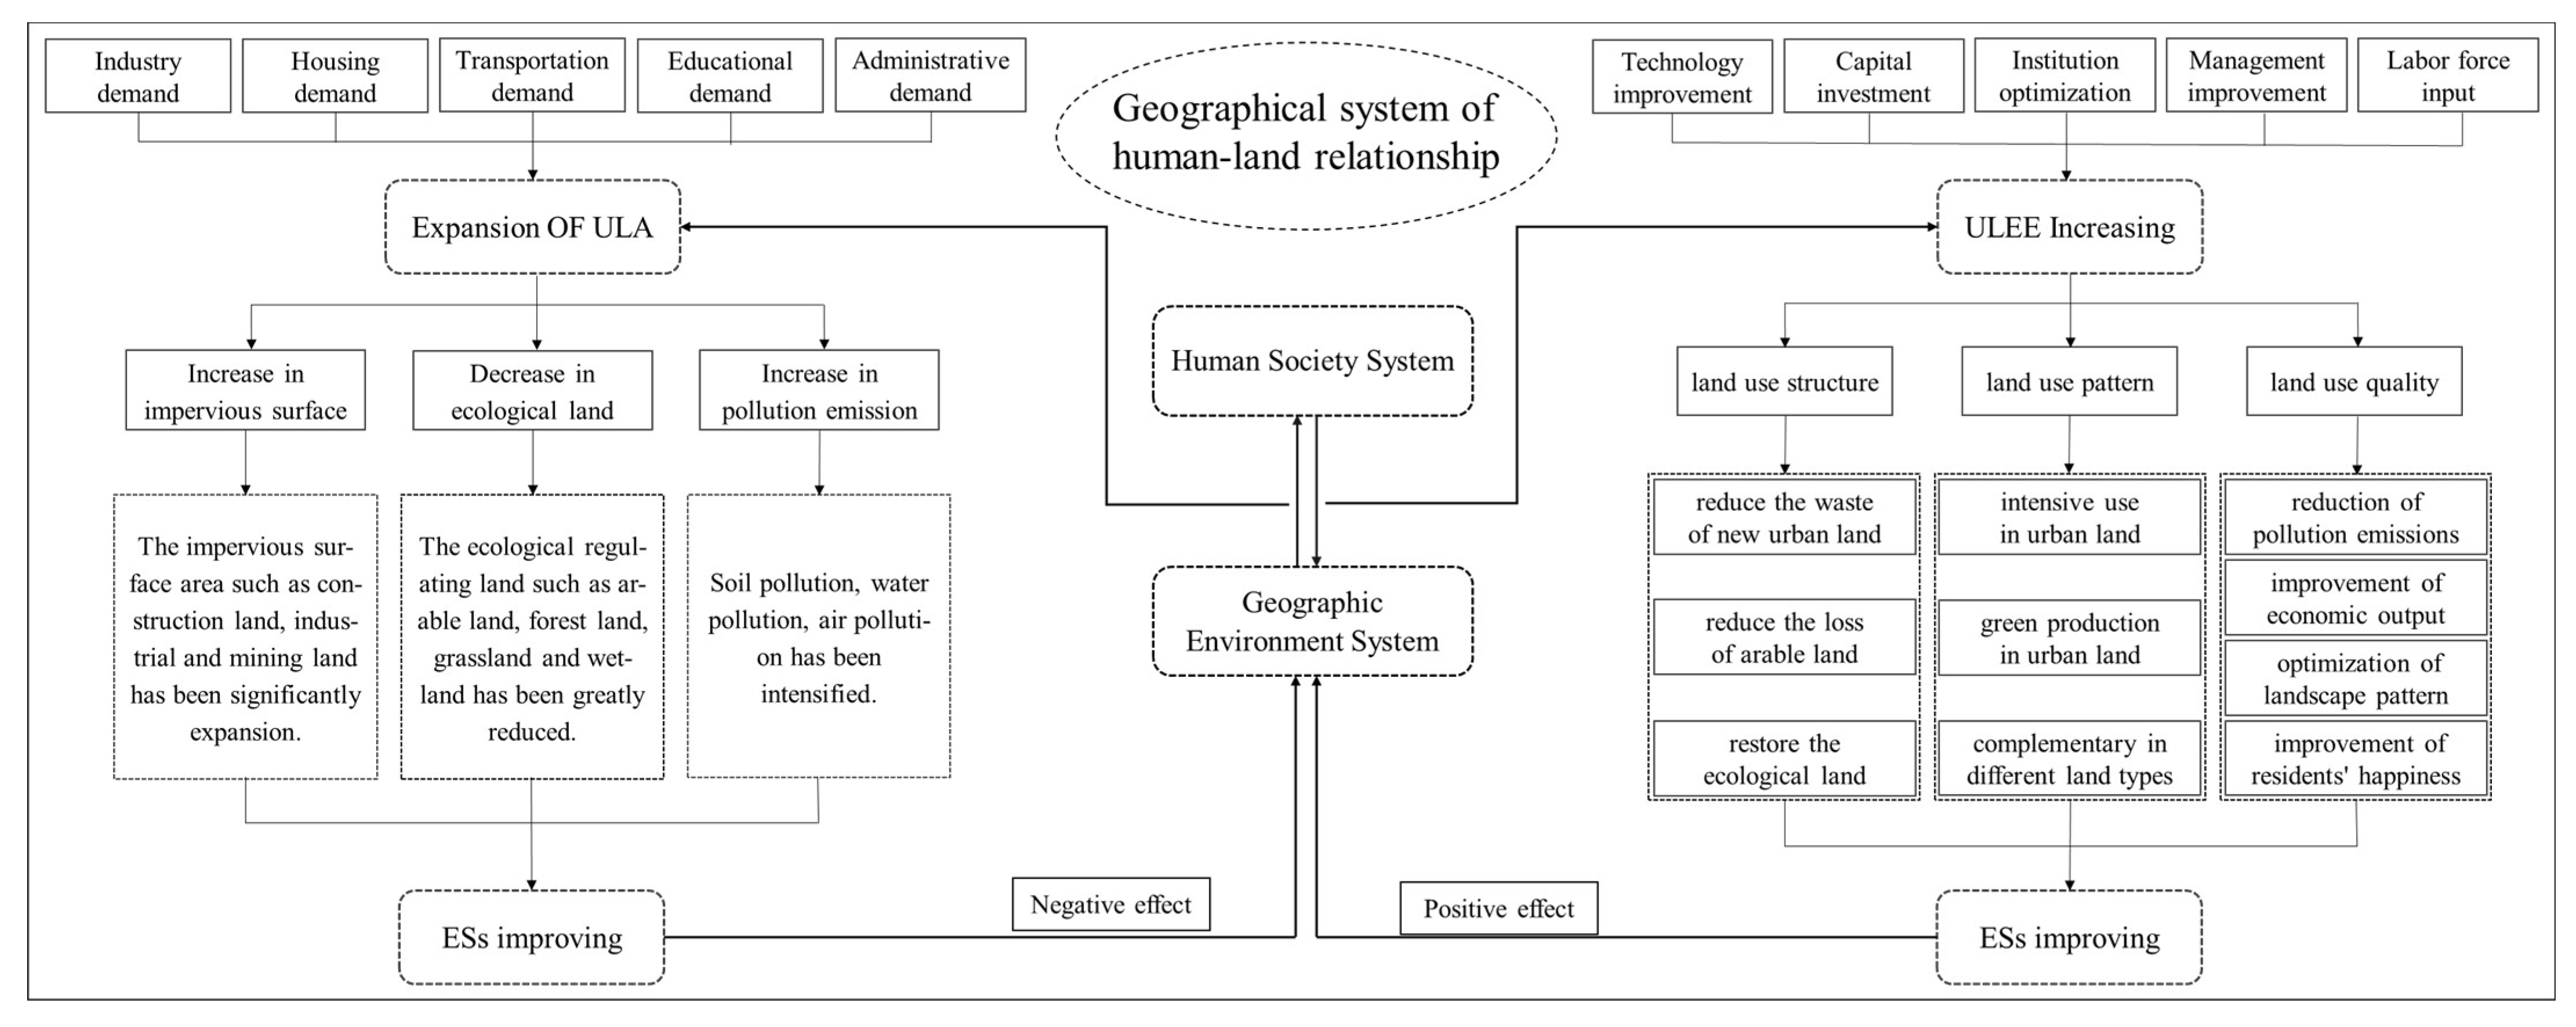
2.2. Impact Mechanism of ULEE on ESs

Urban land contains the dual attributes of resources and space [40]. Hence, the dynamic evolution of urban land includes changing its total allocation and utilisation efficiency whilst expanding the urban land area (ULA). The rapid expansion of urban land has occupied large areas of ecological and agricultural land [41], and has often been accompanied by environmental damage to soil, water, or atmosphere, as well as other environmental problems [42,43], resulting in damage to the ecosystem services of the earth’s surface. Therefore, there is essentially a negative correlation between urban land and ecosystem services. Numerous studies have shown that urban land expansion has been a major cause of ecosystem service decline in China over recent decades [44,45]. ULEE refers to the comprehensive utility generated in urban land expansion, which reflects the human ability to sustainably use and allocate land resources within the urban territorial system. This ability includes not only the optimisation of economic benefits, but also contains notions of equity, greenness, and coordination, which are essential for realising the harmony of the human–land relationship. Therefore, the improvement of ULEE has a positive significance for improving the ecological environment and is positively correlated with ESs. Nevertheless, this positive correlation is mainly a relationship of indirect influence, leading to the promotion of ULEE, which can positively promote ESs through a particular medium (land use ecosystem).
Human society can improve ULEE through technology improvement, capital investment, institution optimisation, management improvement, and labour input [11,14]. On this basis, ULEE influences ESs mainly from three aspects of mediation. First, by optimising land use structure, we can reduce the waste of land in city developments, and effectively transform limited land resources into a supply to meet demand for urban development. Doping so, we can reduce encroachment on arable and ecological land, so that retention of these lands can be maintained or even restored, and their ecological function can be improved [18]. Second, improvement of land use patterns can make urban land use more intensive [21]. More benefits can be generated from less land, while promoting the formation of greener production methods and enabling mutual coordination between different land use types, ultimately reducing negative impact on the ecosystem. Third, by improving land use quality, which includes the reduction of pollution emissions and energy consumption, economic output capacity increases, landscape is optimised, and residents’ happiness is improved [28]. These positive impacts can work together in the environmental system, resulting in sustained improvements in ecosystem services, and in turn supporting the development of human societies, thus achieving harmonisation of human–earth relations. The specific mechanism framework is shown in Figure 1.

3. Materials and Methods
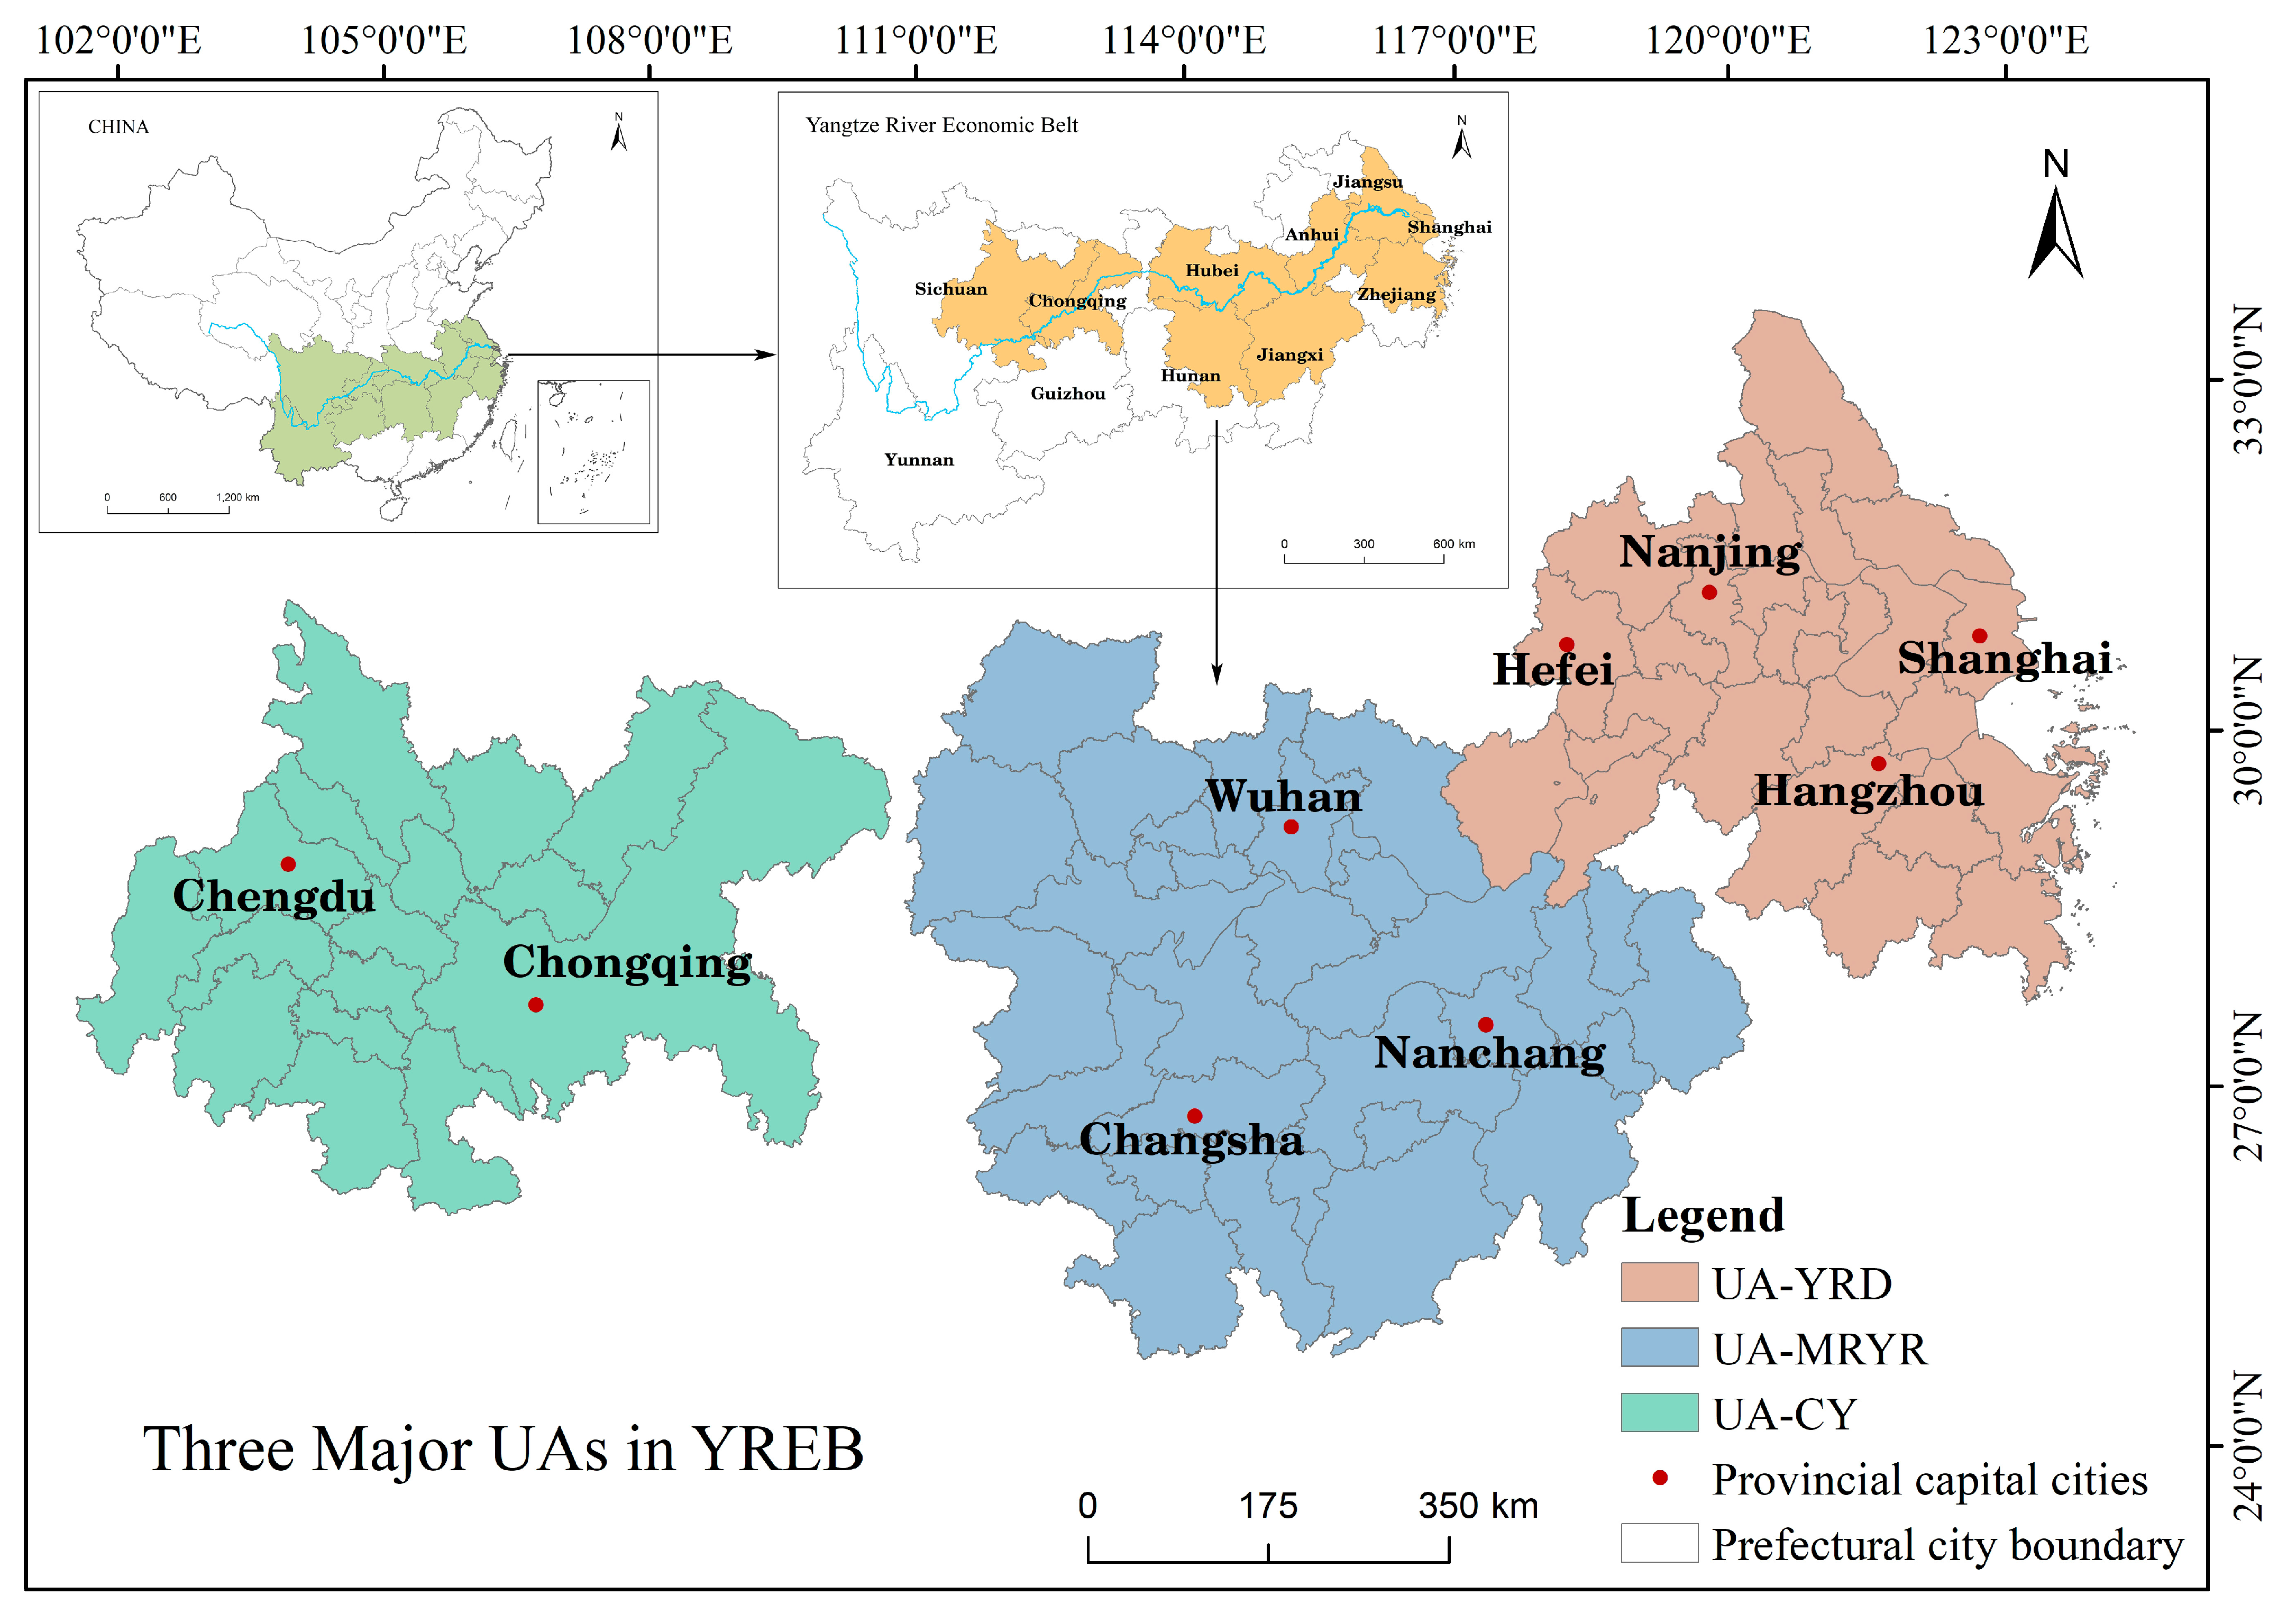
3.1. Study Area

As the basin-region economic belt with the most development potential, and the support belt for high-quality development of land space in China, the YREB comprises nine provinces and two municipalities and covers a land area of about 2.05 million km2. In the past 30 years, the area of urban land and its expansion intensity in the YREB have increased [46], while the ecosystem service function has decreased [47]. As a result, the pressure on the ecosystem caused by urban expansion has been increasing. In 2016, the outline of the Yangtze River Economic Belt Development Plan pointed out that the focus should be on the layout of the UA-YRD, UA-MRYR, and UA-CY, and that three central growth poles should lead the green development of the region.
Regarding the Development Plans of Urban Agglomerations in the Yangtze River Delta, in the middle reaches of the Yangtze River and in the Cheng-Yu District, the scope of the three major UAs considered in this paper includes seven provinces and two municipalities. The study area covers 73 cities, with a land area of about 710,000 km2 and a total resident population of nearly 400 million by the end of 2020 (Figure 2). This study used the three-level scale of “whole urban agglomeration–secondary urban agglomeration–city” as the research context, and the basic units of the study were 73 prefecture-level cities.

3.2. Methods

3.2.1. ULEE Measurement

(1)
Super-SBM model
There are two commonly used methods for evaluation of efficiency. One is the parametric stochastic frontier analysis method (SFA), which mainly considers the influence of uncertain variables on output performance. However, this mehod should strictly follow the presupposition proposed in advance, and it is difficult to deal with the evaluation problem of multiple output indicators [48]. The other frequently used technique is non-parametric data envelopment analysis (DEA). The DEA model is a systematic analysis method to evaluate the relative efficiency of decision-making units of the same type, according to multiple inputs and outputs [49], and does not require estimating input–output production functions. Moreover, it has better applicability to complex systems containing multiple input and output factors [50]. Therefore, the DEA model is the most widely used method for land use systems with multiple input and output factors.
However, the traditional DEA model is radial, does not consider the hysteresis of input or output, and lacks consideration of undesired output. For this reason, Tone [51] first proposed a non-radial SBM model in 2001, considering slack variables and explaining the undesired output. The specific calculation steps are as follows:
First of all, assume that there are n decision-making units. Each decision-making unit is composed of three vectors: input, desired output, and undesired output; the m unit of input will produce S 1 desired output and S 2 unexpected output. The three vectors are respectively expressed as x R m , y g R S 1 , y b R S 2 , and the matrix X , Y g , Y b can be defined as:
X = [ x 1 , x 2 , , x n ] R m × n , Y g = [ y 1 g , y 2 g , , y n g ] R S 1 × n , Y b = [ y 1 b , y 2 b , , y n b ] R S 2 × n
Then, assume X > 0 , Y g > 0 , Y b > 0 , and the production possibility set is:
P = { ( x , y g , y b ) | x X θ , y g Y g θ , y b Y b θ , θ 0 }
Therefore, the SBM model with undesirable outputs can be expressed as follows:
ρ = min 1 1 m i = 1 m S i x i 0 1 + 1 S 1 + S 2 ( r = 1 S 1 S r g y r 0 g + r = 1 S 2 S r b y r 0 b ) , s . t { x 0 = X θ + S y 0 g = Y g θ S g y 0 b = Y b θ S b S 0 , S g 0 , S b 0 , θ 0
where S , S g , S b respectively represent the slack of input, desired output, and undesired output; ρ ( 0 < ρ 1 ) is the efficiency value of the decision-making unit. For a given DMU ( x 0 , y 0 g , y 0 b ) , the DMU is valid only if ρ   =   1 , indicating that the evaluated unit is inefficient.
Although the SBM model can overcomes hysteresis and other unexpected problems, it may generate the problem of multi-effective decision-making units, especially when the input and output indexes are large, eventually being unable effectively to distinguish and compare differences in efficiency levels [52]. To solve this problem, Tone [53] further proposed the super-SBM model, which solved the problem of effective simultaneous decision-making unit ranking, ensuring the rationality of efficiency analysis. The calculation formula of the model is as follows:
ρ * = min 1 m i = 1 m x i ¯ x i 0 1 S 1 + S 2 ( r = 1 S 1 y ¯ r y r 0 + r = 1 S 2 z ¯ r z r 0 ) , s . t { x ¯ j = 1 , k n θ j x j y ¯ j = 1 , k n θ j y j z ¯ j = 1 , k n θ j z j x ¯ x 0 , 0 y ¯ y 0 , z ¯ z 0 , θ 0
where ρ * is the efficiency value of the decision unit; x , y , z respectively represent the slack of input, desired output, and undesired output; m , S 1 , S 2 are the number of input indicators, desired output, and undesired output indicators, respectively; and ( x 0 , y 0 , z 0 ) represents the given decision unit.
(2)
Index system of input–output
According to the requirements of sustainable development and the definition of expansion efficiency, the essence of ULEE refers to the maximisation of multiple benefits while minimising comprehensive input and environmental loss, involving multi-input and output factors. Based on the above mechanism analysis and existing study results, and considering the data acquisition problem, this study selected a total of nine indicators from the three dimensions of input, desired output, and undesired output (Table 2). When selecting the input index, we considered fully the primary and closely related factors of humans’ influence on land. We used investment in fixed assets as capital input, employment numbers in secondary and tertiary industries as labor input, new urban land area as land input, and R&D expenditure as technology input. Selecting the index for the desired output, we chose average GDP and per capita disposable income. In addition, since China is vigorously promoting energy conservation and emission reduction to promote the realisation of carbon peaking and carbon neutrality, and the YREB especially emphasises a strategy of jointly pursuing environment protection, we selected emissions of CO2 and SO2 for the undesired output index. It should be noted that all indicators were deflated using 2006 as the base period.

3.2.2. ESV Assessment

Ecosystem services are related to human wellbeing, and evaluation of their value has been a focus of study for many scholars in recent years. Researchers have created different quantitative assessment models, including the InVEST model [54], the ARIES model [55], and the Sol VES model [56]. The InVEST model is an ecosystem services evaluation tool that integrates fine and quantitative techniques. It comprises a series of modules and algorithms, including water yield, carbon storage, biodiversity, crop pollination, soil conservation, water purification, food supply, habitat quality, etc., all of which can be used to simulate changes of ecosystem services under changing land use or land cover scenarios [57]. The models is free and open source, allowing users to input relevant data for the study area; it has been widely used in the assessment of ecosystem services at home and abroad.
This paper refers to previous studies and combines the specific characteristics of ecosystem services within the three urban agglomerations. Four ecosystem services were selected, i.e., food production (FP), carbon storage (CS), habitat quality (HQ), and leisure and recreation (LR), respectively representing four service types, i.e., provisioning, regulating, supporting, and cultural. On this basis, different modules of InVEST were used to calculate the value of these four services, which were then summarised into the average ecosystem service value (AESV) of the study area.
(1)
Food Production (FP)
Food supply is a crucial service in agroecosystems, playing a vital role in human survival and ecological evolution. Studies have shown that different types of land use produce different types and quantities of food [58]. This study calculated regional food production capacity according to the value of food mass converted into corresponding energy (kJ/kg). Various food energy conversion coefficients have been referenced in relevant studies [59]. Among these, grassland corresponds to dairy and herbivore meat; arable land corresponds to grain, oil, sugar and fruit; water areas correspond to freshwater products (only terrestrial ecosystems are considered in this paper, so seawater products were not included). The calculation formula was:
P i = k = 1 k c = 1 c A c k i × P c k i
P c k i = p i k = 1 k c = 1 c A c k i = c = 1 c Y c E c k = 1 k c = 1 c A c k i
where P i is the total energy (kJ) supplied by food in the study cell i ; A c k i is the area (hm2) that the food type c occupies in land-use type k within the study unit i ; P c k i is the energy value(kJ/hm2) of food type c per unit area; Y c is the yield (kg) of food type c ; E c is the amount of calories (kJ/kg) contained in food types c .
(2)
Carbon Storage (CS)
Carbon storage is a key regulatory service in the ecosystem, and the carbon density and absorption capacity vary between different land cover and soil matrices [57]. This paper considered three typical carbon storage pools: the above-ground biogenic carbon pool, the below-ground biogenic carbon pool, and the soil organic carbon pool. The carbon storage module in InVEST was used for evaluation. The calculation formula was:
C t o t = C a b o v e + C b e l o w + C s o i l
where C t o t is the total carbon stock value in the study area; C a b o v e represents the carbon stock of the above-ground biocarbon pool; C b e l o w is the carbon stock of the subsurface biogenic carbon pool; C s o i l is the carbon stock of the soil organic carbon pool. The unit of all carbon stock values is t/hm2.
(3)
Habitat Quality (HQ)
Habitat quality is the ability of an ecosystem to provide suitable conditions for the long-term survival of individual organisms and populations [60]. The habitat quality module in the InVEST model has been welcomed due to its low cost, high accuracy, and partial solid analysis capability [61]. This module calculates the habitat quality index based on landscape sensitivity and external threat factors. The calculation formula was:
Q x j = H j [ 1 ( D x j z D x j z + k z ) ]
D x j = r = 1 R y = 1 Y r ( ω r r = 1 R ω r ) r y i r x y β x S j r
i r x y = 1 ( d x y / d r max )   if   linear
i r x y = exp ( 2.99 d x y / d r max )   if   exponential
where Q x j is the habitat quality value of the land type j in the raster cell x ; H j is the habitat suitability score of the land type j and takes the value 0–1; z is the scale constant, generally taken as 2.5; D x j is the habitat degradation of land type j in the raster x ; k is the half-saturation constant, usually taken as half of the Q x j maximum value; R is the number of stressors; y is the number of raster for the stressor type r ; Y r is the total number of grids for the stressor type r ; ω r is the weight of the stressor r , which takes the value 0–1; r y is the value (0 or 1) of the stressor in the grid y ; i r x y is the degree of disturbance of the stressor r in the grid y on the habitat raster x and is classified as linear decline and exponential decline; β x is the accessibility level of the raster x ; S j r is the sensitivity of habitat type j to stressor r ; d x y is the maximum threat distance of stressor r .
(4)
Leisure and Recreation (LR)
Eade [62] pointed out that the landscape recreation value of some specific pixels can be higher than that of other pixels within a specific range. The recreation service of a particular pixel is affected mainly by landscape accessibility and visibility. Leisure and recreation services decreased with increased distance from the landscape and increased with an increase in landscape visibility. In this study, ArcGIS software carried out buffer and visibility analysis to calculate each pixel’s leisure and recreation service value. The calculation formula was:
V t = V t ( a ) + V t ( b ) V t ( a ) = i = 1 i P i V t ( b ) = n C i
where V t represents the LR service value at pixel t ; V t ( a ) represents the LR service affected by accessibility at pixel t ; V t ( b ) represents the LR service affected by visibility at pixel t ; P i represents the average value of tourism income of the buffer of landscape i at pixel t ; C i represents the average value of tourism income of landscape in all visible pixels. n is the number of visible landscapes at pixel t .

3.2.3. The Methods to Analyse the Effect of ULEE on ESs

(1)
GWR model
The first law of geography points out the mutual connection between things in the world; the closer their distance, the greater the correlation and influence. Meanwhile, spatial differences in correlation or influence exist due to differences in the bases of geographical elements in different regions. Therefore, the traditional econometric analysis model fails to meet the needs of influence mechanism analysis with spatial characteristics. The GWR model overcomes the difficulties of the traditional regression model in resolving the spatial correlation and heterogeneity of geographic things, and is an essential tool for exploring spatially non-smooth relationships [63]. Its formula is as follows:
y i = β 0 ( u i , v i ) + k = 1 p β k ( u i , v i ) x i k + ε i , i = 1 , 2 , , n
where y i is the observed value; β 0 ( u i , v i ) is the regression coefficient of the study cell i ; ( u i , v i ) is the geographic location of the study unit i ; β k is the regression parameter of variable k in the study unit i and is the function of geographic location; p is the number of independent variables; ε i obeys the normal distribution. However, the GWR model lacks diagnostic functions, and OLS regression analysis should be conducted first before applying GWR analysis to ensure the model’s accuracy. The calculation steps of OLS analysis have appeared in many studies, so they are not repeated here.
(2)
Control variables system
Studies have shown that land-use factors led by human activities are important drivers of changes in regional ecosystem services [64]. Environmental (e.g., topography, climate, and soil) and socio-economic (e.g., population, economy, industry, and policy) factors are fundamental and critical influences on changes and heterogeneity in ecosystem services [65,66]. In addition, the role of scientific and technological innovation in ecosystems has been increasing [67]. Factors such as industrial development, investment intensity, and levels of science and technology have been associated with economic growth and can be characterised by economic density. Because some variables can be difficult to obtain (e.g., soil) or quantify (e.g., policy), this paper selected five representative control variable factors, i.e., elevation, population density, GDP density, greening rate of built-up areas, and urban road density.

3.3. Data Sources

① Land use data: The land use data in this paper were obtained through remote sensing interpretation. Remote sensing data were derived from the Landsat 8 of the United States Geological Survey (https://www.usgs.gov/, accessed on 18 February 2022). The cloud cover of all images was controlled within 5% and included radiometric correction, geometric correction, image enhancement, mosaic cutting, etc. Finally, the land use data was generated by using human–computer interaction interpretation. Impervious surfaces such as large, medium, and small urban construction land and town construction land were collectively considered and referred to as urban land.
② Input and output indicators: Fixed asset investment, employment in secondary and tertiary industries, tertiary industries, GDP, per capita disposable income, and CO2 and SO2 data were obtained from the China Urban Statistical Yearbook (2007–2021) and from the statistical yearbooks of seven provinces and two municipalities for the relevant years. The NPP data were provided by the Center for Resources and Environmental Sciences and Data, Chinese Academy of Sciences (https://www.resdc.cn/Default.aspx, accessed on 5 March 2022).
③ Food production, carbon density, habitat quality, and landscape points: Data on food crop production was obtained from the China Rural Statistical Yearbook (2007–2021) and from the statistical yearbooks of seven provinces and two municipalities for the relevant years. The carbon density data for different carbon pools were corrected by referring to relevant studies [68]. Paddy fields, dry land, construction land, and bare land were the primary stress sources for habitat quality. For each category, the habitat suitability, stressor weights, and related parameters including sensitivity to stressors and maximum stress distance were also based on relevant literature [69]. The data for landscape points were obtained from China National Earth System Science Data Center (http://www.geod-ata.cn/, accessed on 15 March 2022).
④ Control variables of influencing factors: Elevation, population density, and GDP were obtained from the Resource-Environment Science and Data Center of the Chinese Academy of Sciences (https://www.resdc.cn/Default.aspx, accessed on 19 March 2022). Data on the greening rate of built-up and urban road areas were obtained from the China Urban Statistical Yearbook (2007–2021).

4. Results and Discussion

The theoretical impact mechanism of ULEE on ESs is discussed above. As discussed in the following, the three urban agglomerations in the YREB were taken as examples for empirical analysis to verify the rationality and correctness of the theoretical mechanism. We first calculated ULEE and ESV for the period 2006–2020. Then, the actual impact was analysed to explore the specific impact characteristics of ULEE on ESs.

4.1. Spatial and Temporal Characteristics of ULEE

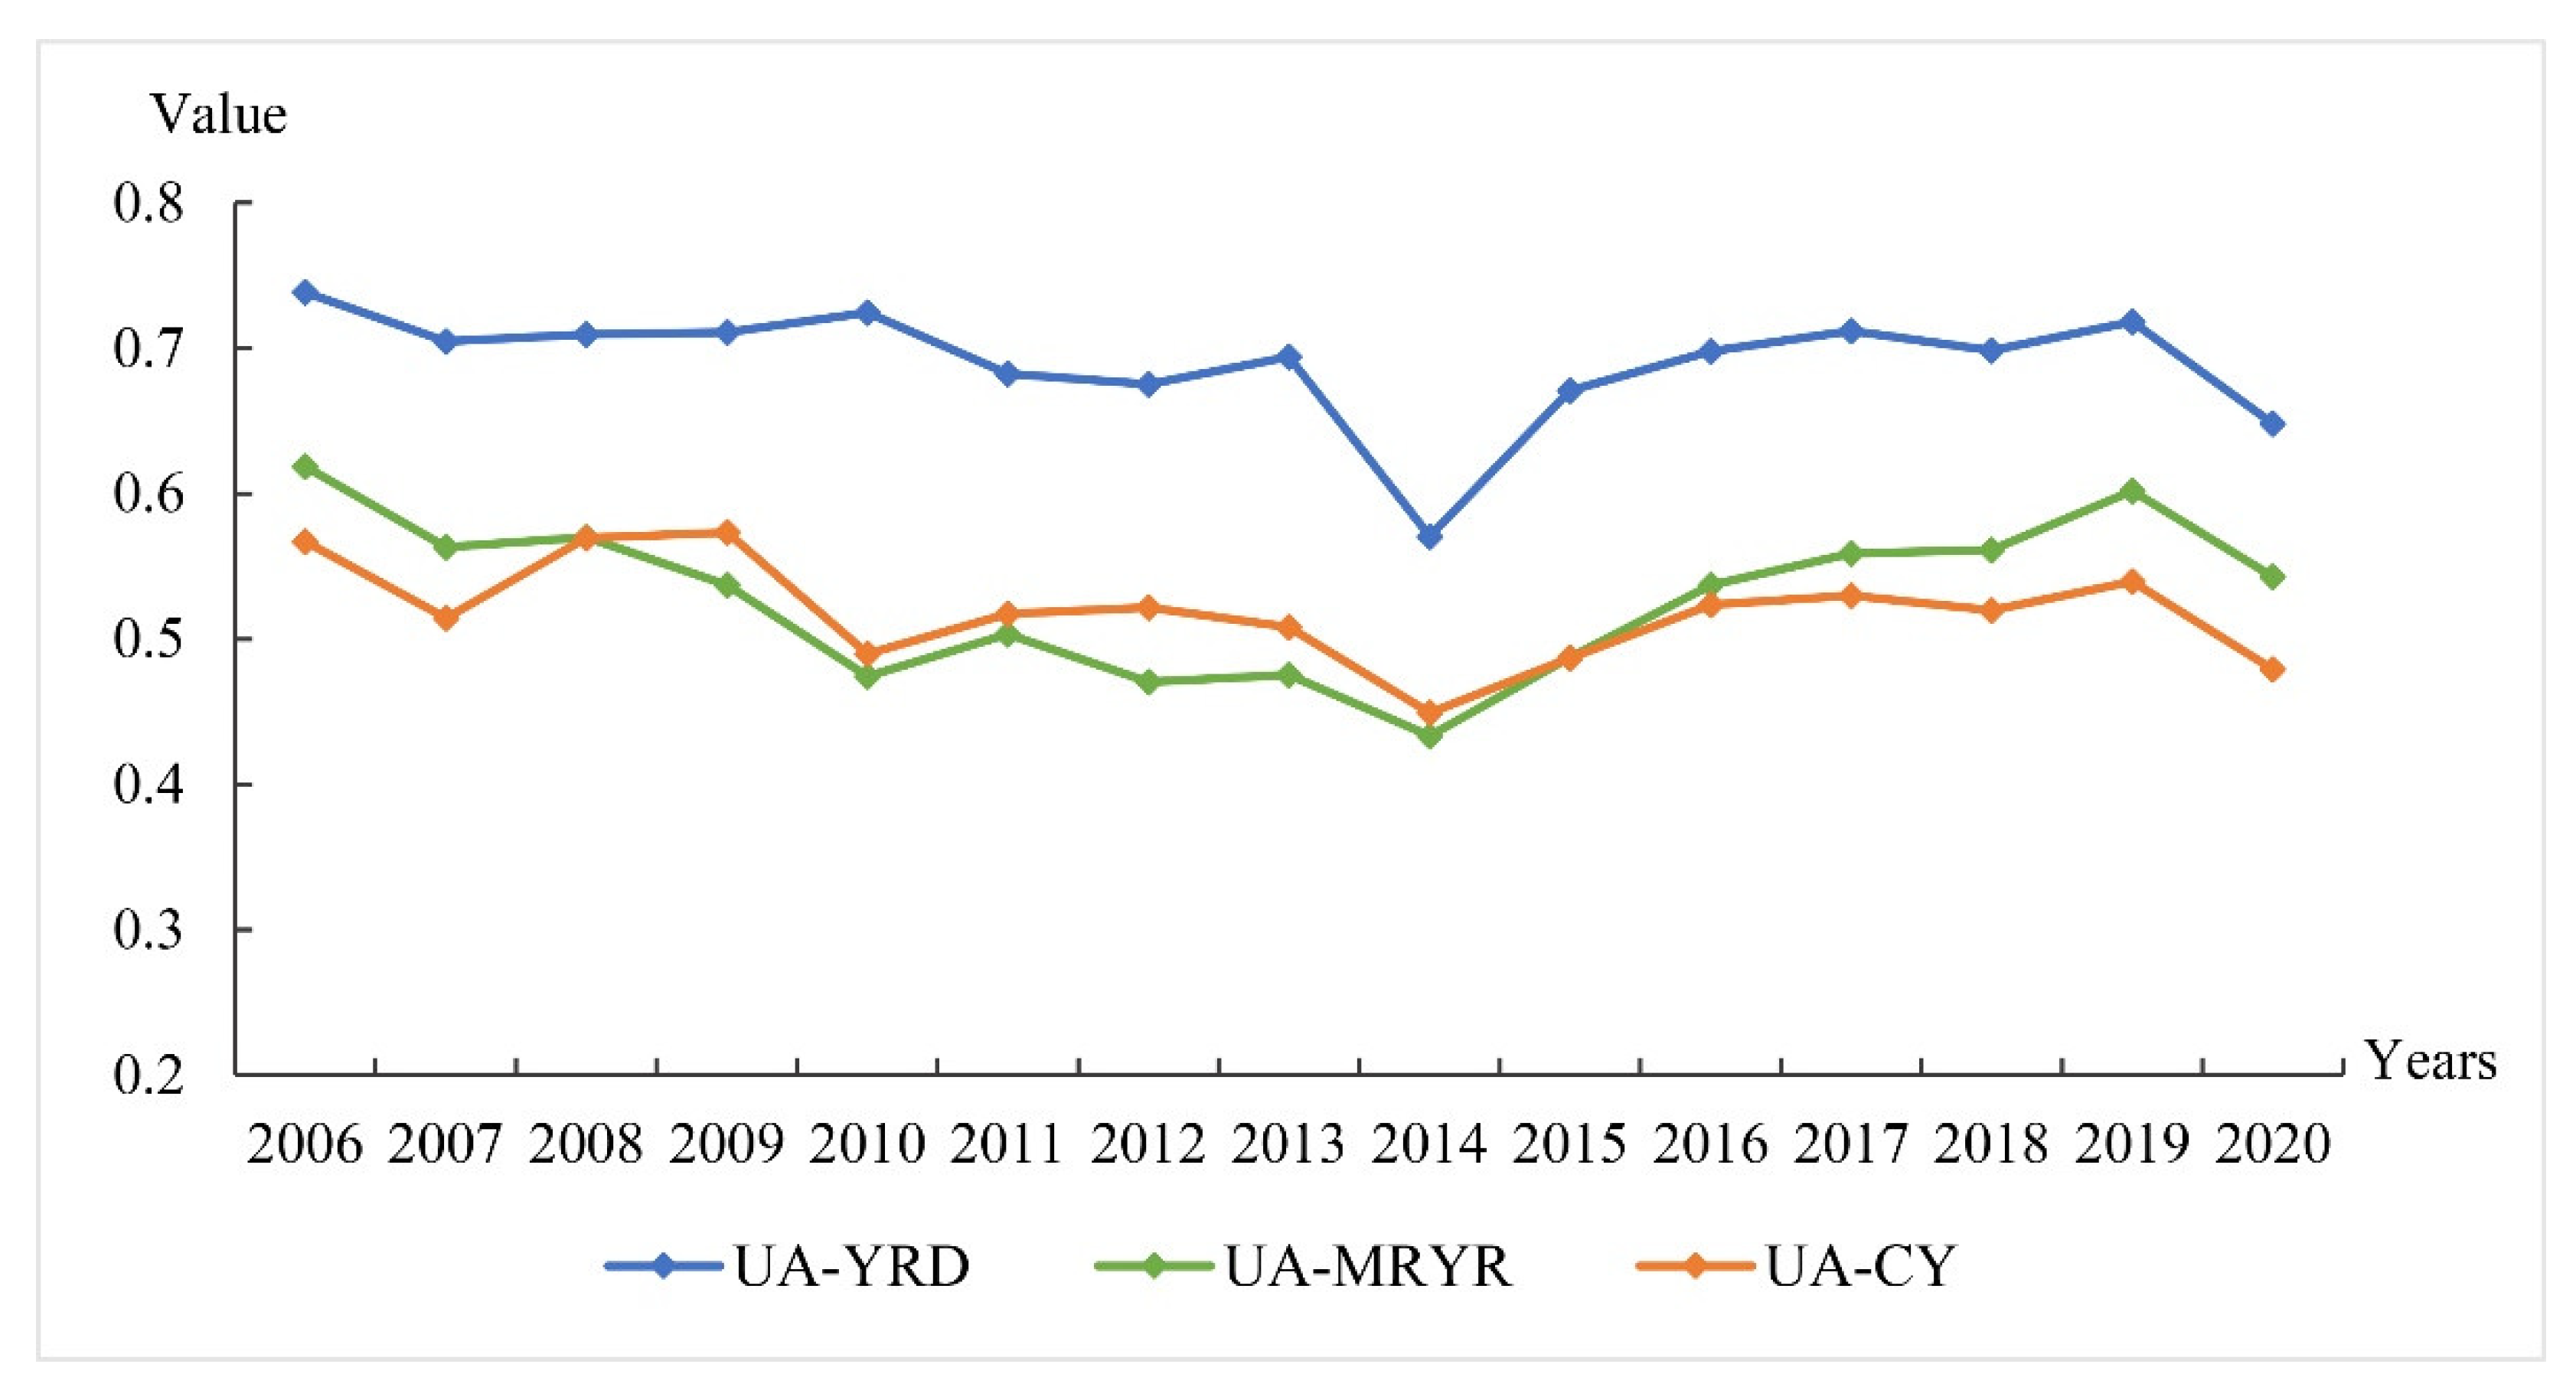
4.1.1. Temporal Evolution Characteristics

Based on the input–output index system, the ULEE of the study area was measured using Equation (2), and the results are shown in Figure 3. It can be seen that the changing trends of ULEE from 2006 to 2020 were the same for the three major urban agglomerations in the YREB, showing a fluctuating downward tendency. This downward trend indicates that the comprehensive benefits of urban land expansion declined to a certain extent during the study period, and that certain phases were apparent. The period of 2006–2014 mainly showed a decreasing trend, followed by an increasing trend in 2014–2019 and then a significant decline in 2020. The main reason for this change of phase was that from 2006 to 2014 the three major urban agglomerations experienced rapid expansion of urban space [47]. Accelerated economic construction, a high proportion of manufacturing industries, intensification of pollution emissions, and the compounding adverse effects of urban land expansion contributed to the significant decline of the ULEE. After 2014, the development of the Yangtze River Economic Belt was elevated to the national strategic level. The orientation of “stepping up conservation together, stopping overdevelopment” became the fundamental goal of regional development. With advances and application of new technologies, new urbanisation and high-quality development strategies were proposed, which have significantly restrained unmitigated urban sprawl and reduced the adverse effects of urban expansion, causing the steady rebound of the ULEE. Due to the COVID-19 pandemic in 2020, multiple parties’ economic, social, and environmental development suffered. Additionally, economic and social output growth sharply declined, causing a drop in urban land efficiency and a significant decrease in the ULEE.
Meanwhile, it is worth noting that the UA-YRD showed the most substantial decline among the three urban agglomerations, with its ULEE falling from 0.738 to 0.648. The UA-CY came second, its ULEE declining from 0.567 to 0.479, while the ULEE of the UA-MRYR had the smallest decline, decreasing from 0.618 to 0.542.

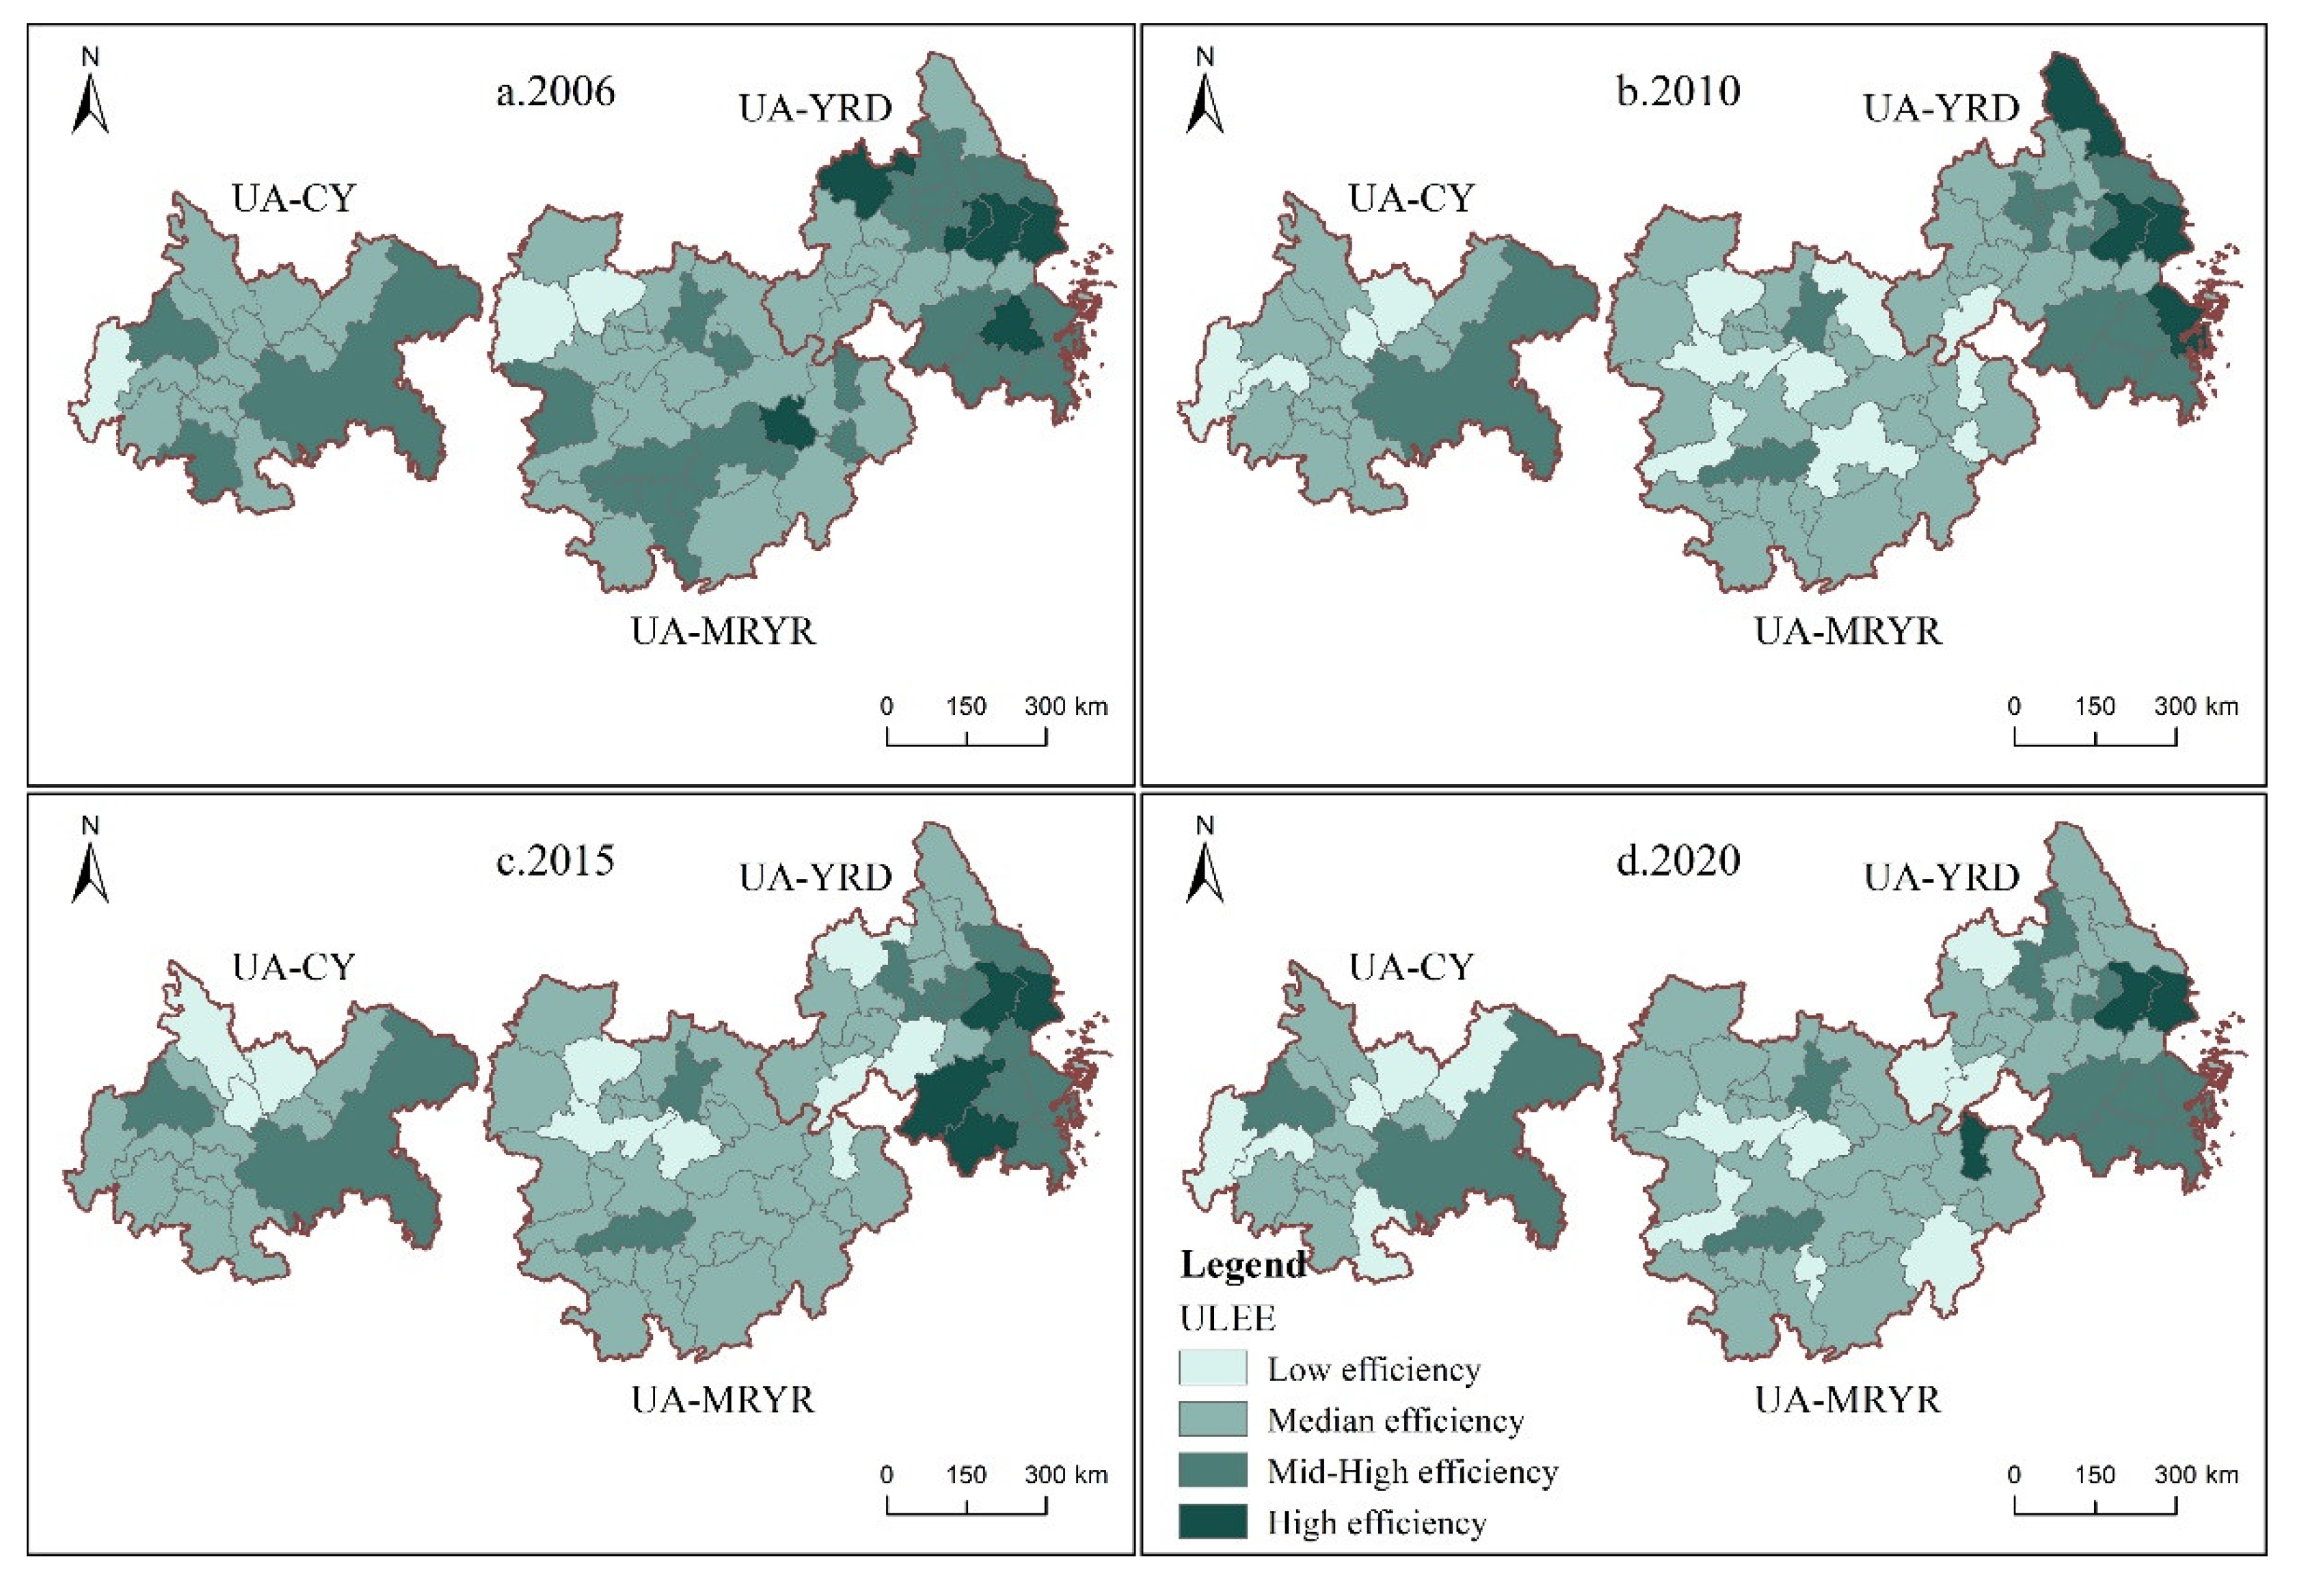
4.1.2. Spatial Evolution Characteristics

According to the results of the ULEE calculations and referring to the research results of Xia Cong [48] et al., the efficiency values were classified into four levels, i.e., low efficiency (≤0.400), median efficiency (0.400~0.650), mid-high efficiency (0.650~0.900), and high efficiency (≥0.900). Furthermore, four particular years, 2006, 2010, 2015, and 2020, were used as time points to explore the evolutionary characteristics of the spatial heterogeneity of ULEE in the three major urban agglomerations. As shown in Figure 4, the ULEE of UA-YRD was higher than the results for the UA-MRYR and UA-CY, in the central and western parts of the country. The ULEE of UA-YRD was generally at the mid-high efficiency level during the study period, while the UA-MRYR and the UA-CY were at median efficiency.
In terms of individual cities, Suzhou, Shanghai, Wuxi, Hangzhou, Ningbo, and Chongqing were the major cities with high ULEE levels, and their expansion efficiencies were generally high. Suzhou had the highest expansion efficiency during each of the four years, with values at 1.258, 1.361, 1.360, and 1.211. Chizhou, Chuzhou, Jingzhou, Jingmen, and Suining had expansion efficiencies at low-efficient levels. Jingmen had the lowest expansion efficiency in 2005, 2010, and 2015, at 0.257, 0.153, and 0.079, respectively, while Chuzhou had the lowest expansion efficiency in 2020 at 0.331. Regarding the possible causes of this spatial difference in ULEE, Suzhou, Shanghai, and Wuxi each have a high degree of economic and social development, along with high levels of economic output and income per unit of new urban land. These cities have mostly entered the middle and late stages of urban construction, with more emphasis on quality and land use efficiency, resulting in relatively high ULEE. Jingmen, Chizhou, and Chuzhou are mostly still in the stages of rapid and rough expansion of urbanisation, and the output value per unit of new land was relatively small during the study period, bringing relatively low income growth. For this reason, the coordination between urban land and economic and social environment was low, reflected in the poor ULEE level.

4.2. Spatial and Temporal Characteristics of AESV

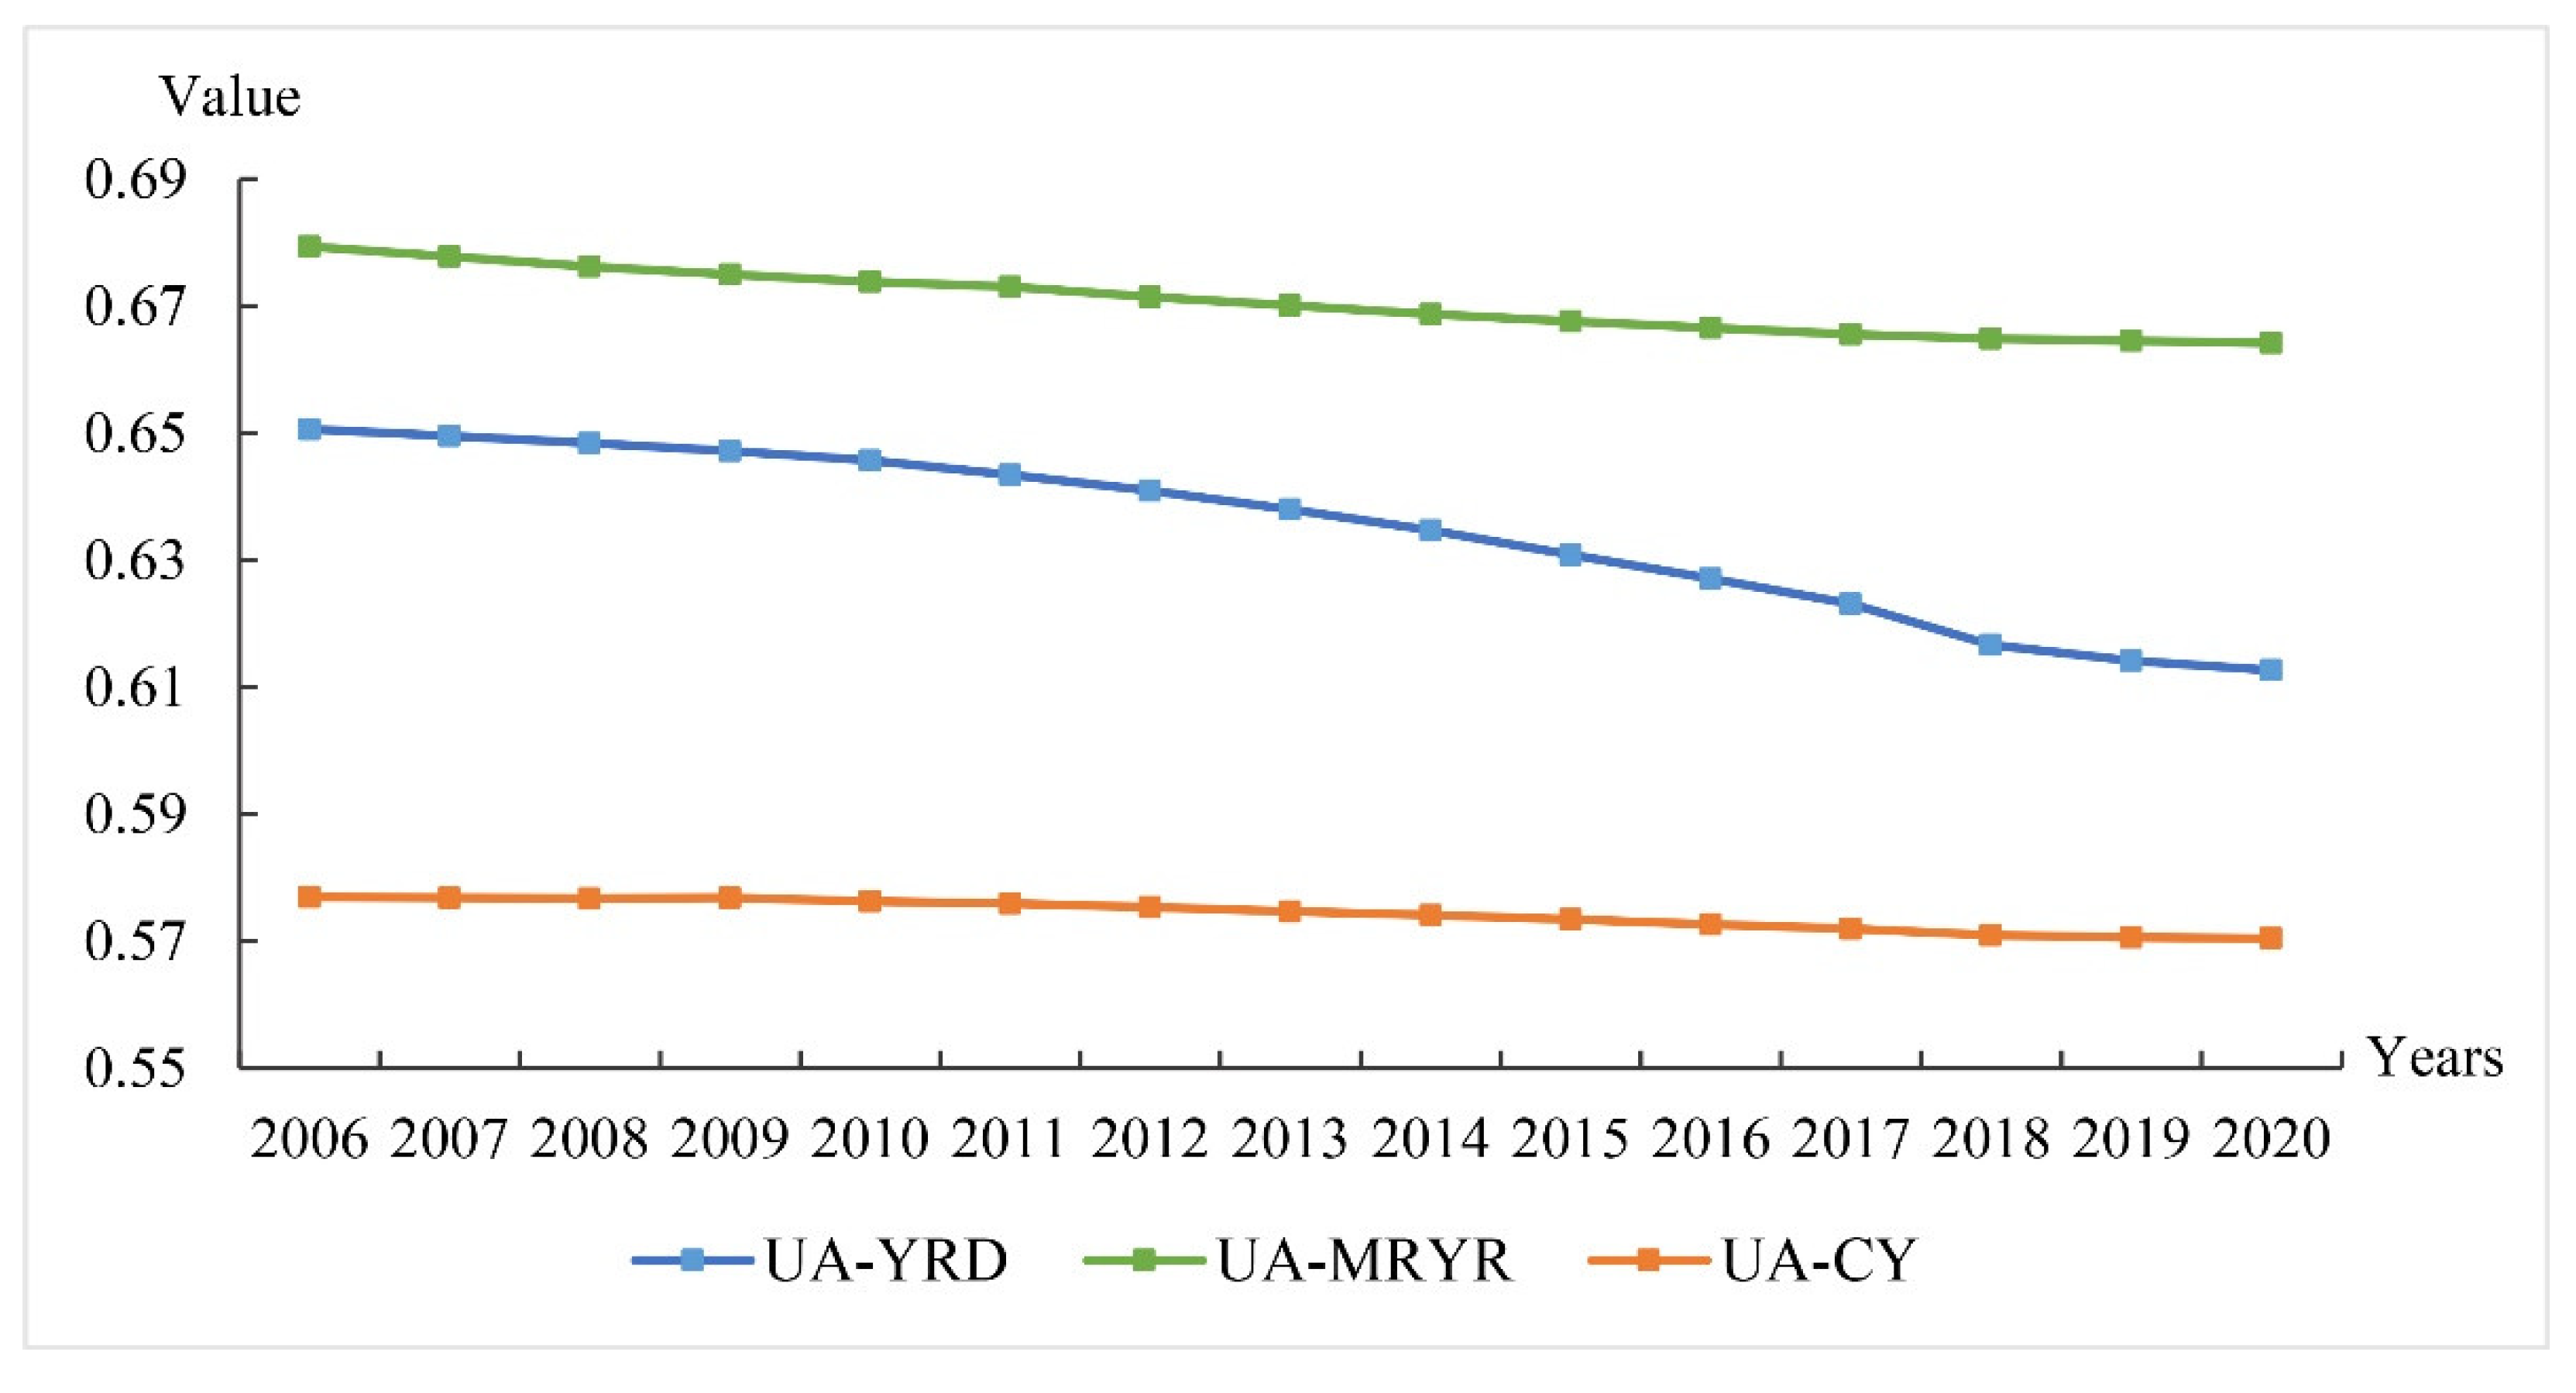
4.2.1. Temporal Evolution Characteristics

From Figure 5, it can be seen that the AESV of the three major urban agglomerations in the YREB showed a decreasing trend from 2006 to 2020. This indicates that the three urban agglomerations’ ecosystems suffered additional damage during the study period. The UA-YRD had the most pronounced decline of the three, with its AESV decreasing from 0.651 to 0.613. The UA-MRYR had the best ecosystem service performance, obtaining the highest AESV among the three while declining slightly from 0.679 to 0.664. The UA-CY had a lower ecosystem service function, but its AESV decreased at a lower rate and magnitude, dropping by 0.006 from 0.577 to 0.571. Combining the results of the ULEE analysis, a particular coincidence can be observed between the trends of AESV and ULEE in the three major urban agglomerations during the study period, with values showing a certain degree of decline in all cases.

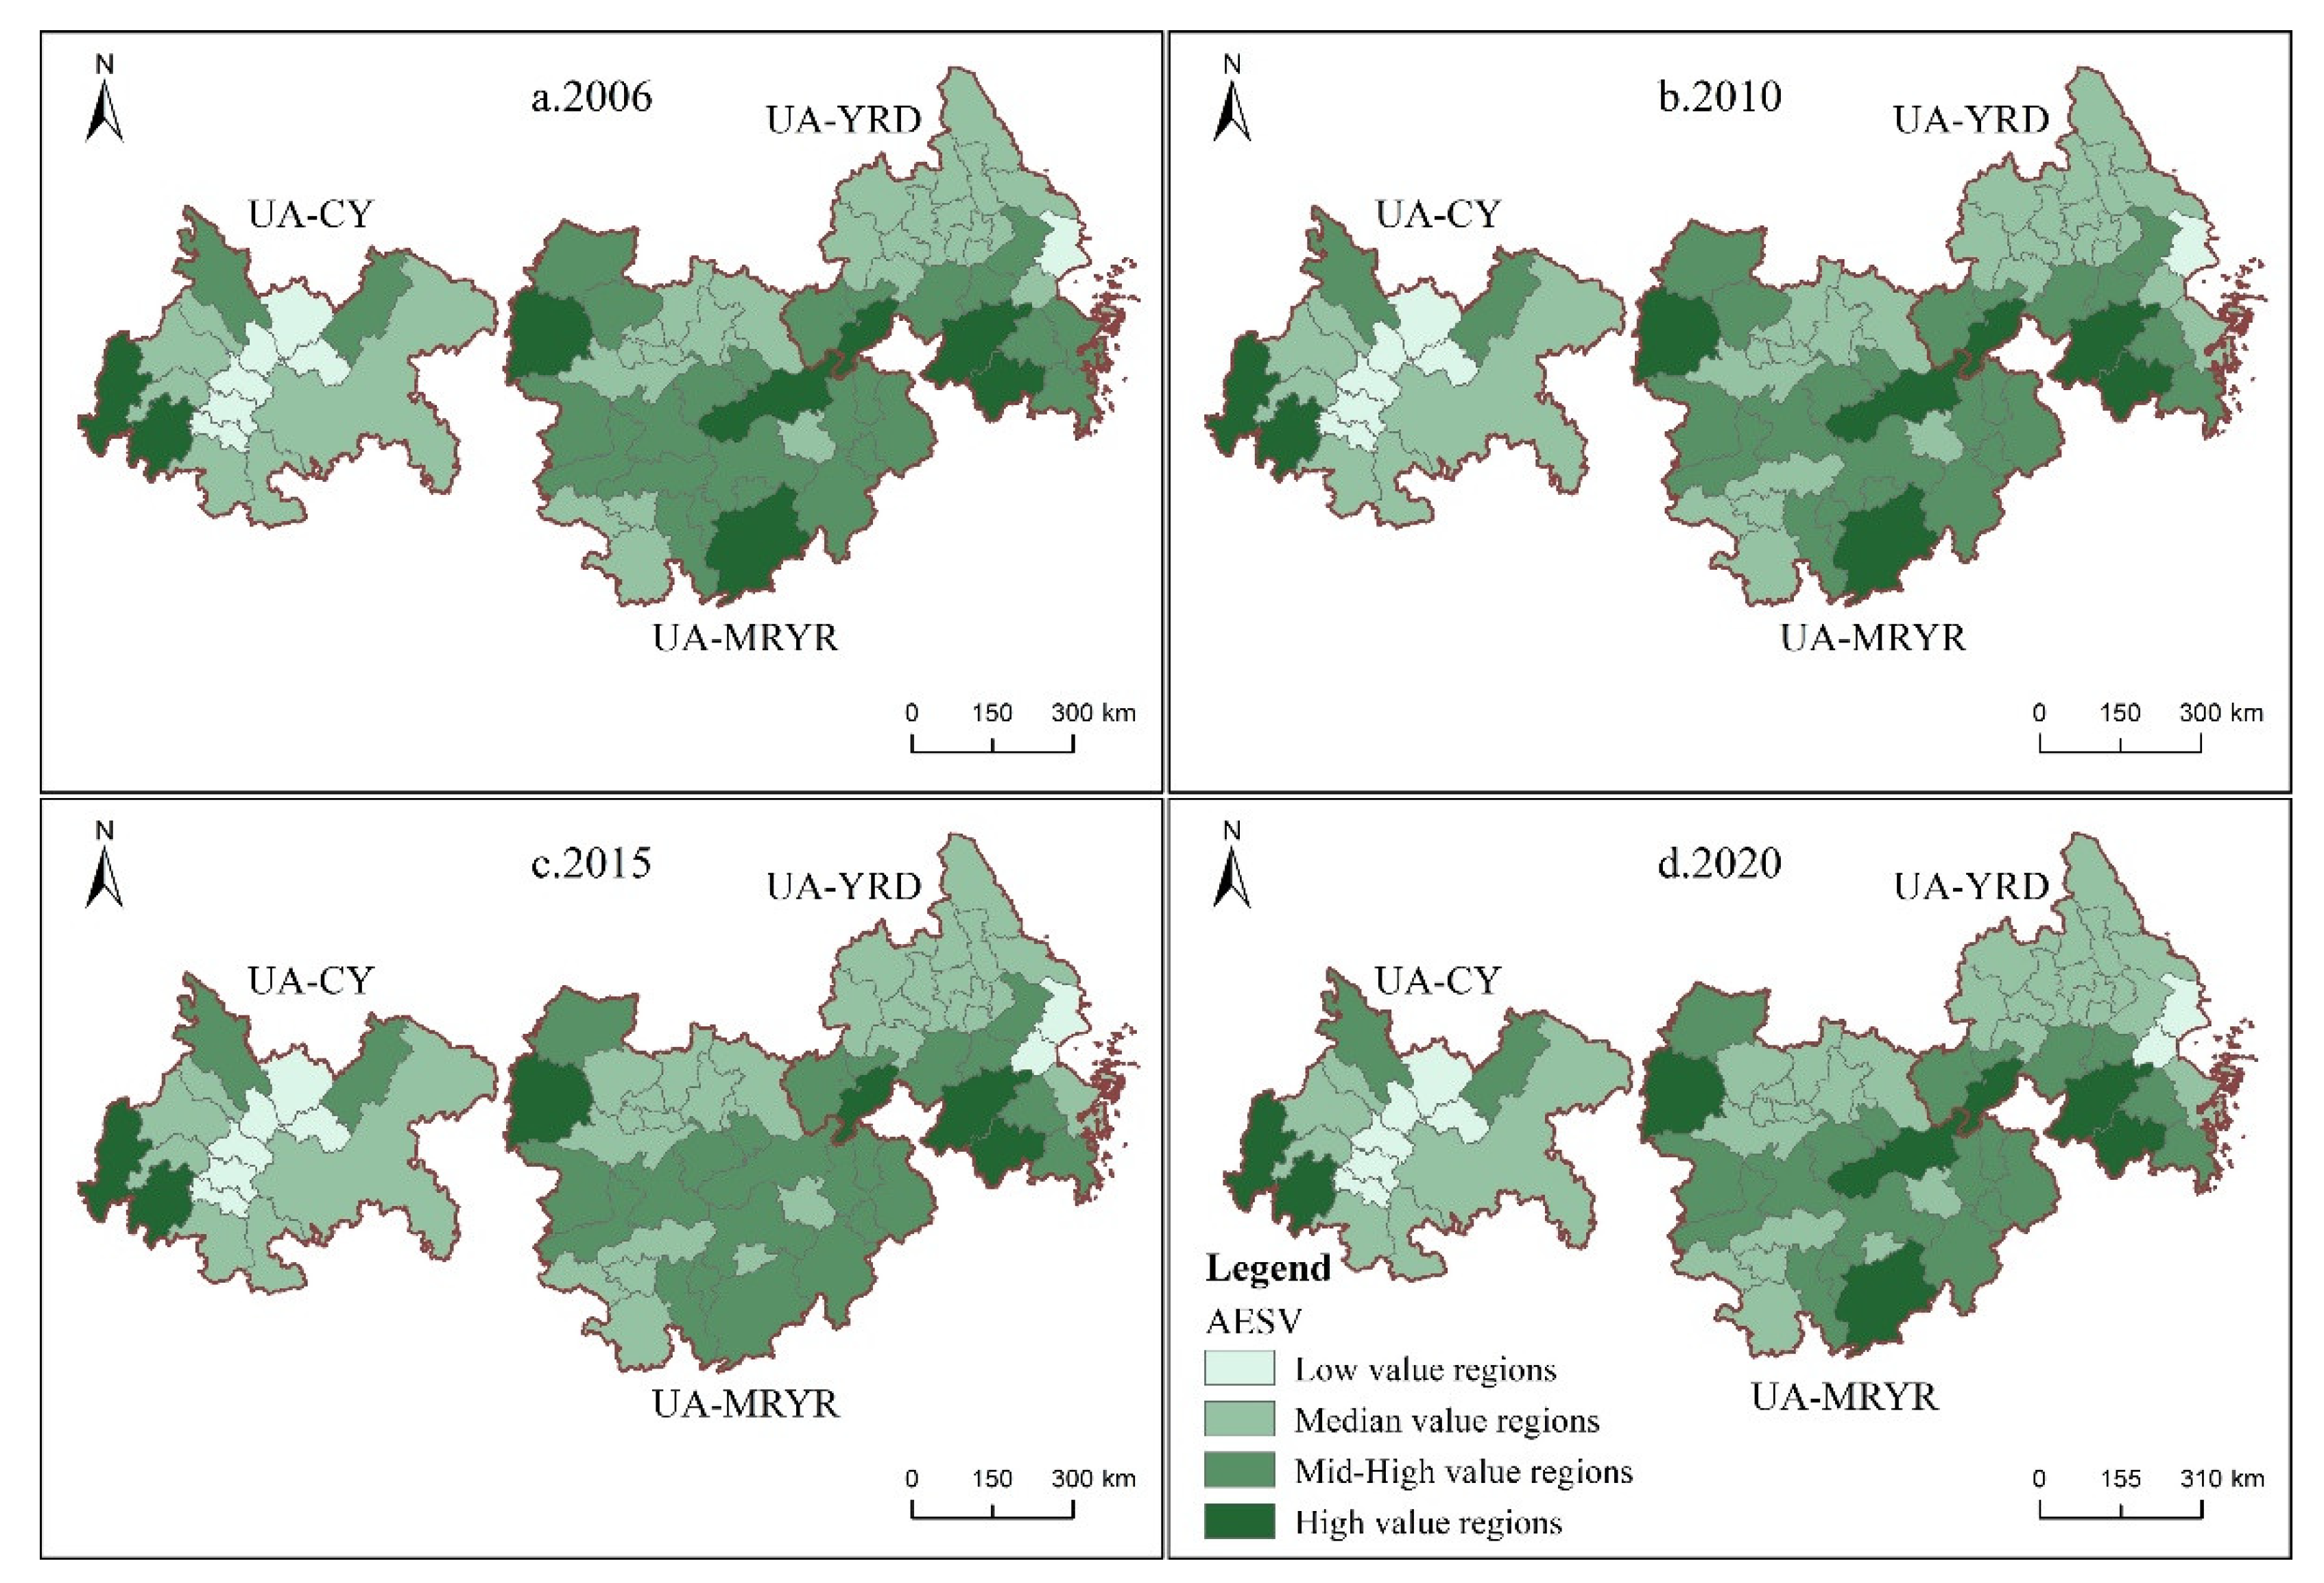
4.2.2. Spatial Evolution Characteristics

The ecosystem services in the study area were classified into four classes, based on the AESV calculation results using the natural breakpoint grading method; low-value zone (≤0.500), median-value zone (0.500~0.650), mid-high value zone (0.650~0.750), and high-value zone (≥0.750). Again, four separate years, 2006, 2010, 2015 and 2020, were used as time points to explore the evolutionary characteristics of spatial heterogeneity of AESV in the three major urban agglomerations. As shown in Figure 6, the UA-MRYR had higher AESV than did the UA-YRD in the east or the UA-CY in the west. During the study period, the UA-MRYR was generally in the mid-high value zone, while the UA-YRD and the UA-CY were in the median value zone.
The high AESV areas were mainly in Hangzhou, Jinhua, Chizhou, Jiujiang, Ji’an, Yichang, Ya’an, and Leshan. Ya’an had the highest ecosystem service function level during each of the four years, with AESV values of 0.899, 0.897, 0.896, and 0.895. The lowest AESV values for 2006, 2010, and 2015 were in Ziyang at 0.416, 0.415, and 0.414, while Shanghai was lowest in 2020 at 0.330.

4.3. Impact Characteristics of ULEE on ESs

4.3.1. Diagnostic Analysis Based on OLS Model

Using SPSS software, OLS regression analysis was performed on the main influencing factors, the results of the main parameters are shown in Table 3. The model’s R2 was 0.558, suggesting that the regression’s straight line was in good agreement with the actual distribution values. The VIF was less than 0.750, indicating no multicollinearity among the explanatory variables and that the model set was reasonable.
As can be seen from Table 3, the indicator coefficients were positive for elevation, greening rate of built-up area, and ULEE, which indicates positive correlations between these factors and the AESV of urban agglomerations. The indicator coefficients for ULEE and elevation were both statistically significant (p < 0.010), suggesting that ULEE improvements and increased elevation significantly affect ecosystem service functions. The coefficients were negative for population density, GDP density, and urban road density, indicating a negative correlation between these and the AESV. Given that the indicator coefficients were significant at p < 0.010, the higher the population density, GDP, and density of urban roads, the greater the negative effect on ecosystem service functions. This corresponds with the actual situation of the three major urban agglomerations and the above analysis results. For example, the UA-YRD has a high density of cities and industrial enterprises, a significant inflow of population, a high population, and economic activities that constantly disturb ecosystems. There have been certain degrees of decline in the efficiency of urban land expansion, contributing to its low AESV and the fastest decline among the three urban agglomerations. The UA-MRYR is located on the central Yangtze River Plain and surrounded by continuous mountain ranges, traditionally a major agricultural production area with high overall ecological values (e.g., food supply, carbon storage, and habitat quality). This has helped UA-MRYR to secure the largest AESV among the three urban agglomerations. Overall, to sum up, the results of the OLS analysis indicate that ULEE has a tremendous positive impact on ESs.

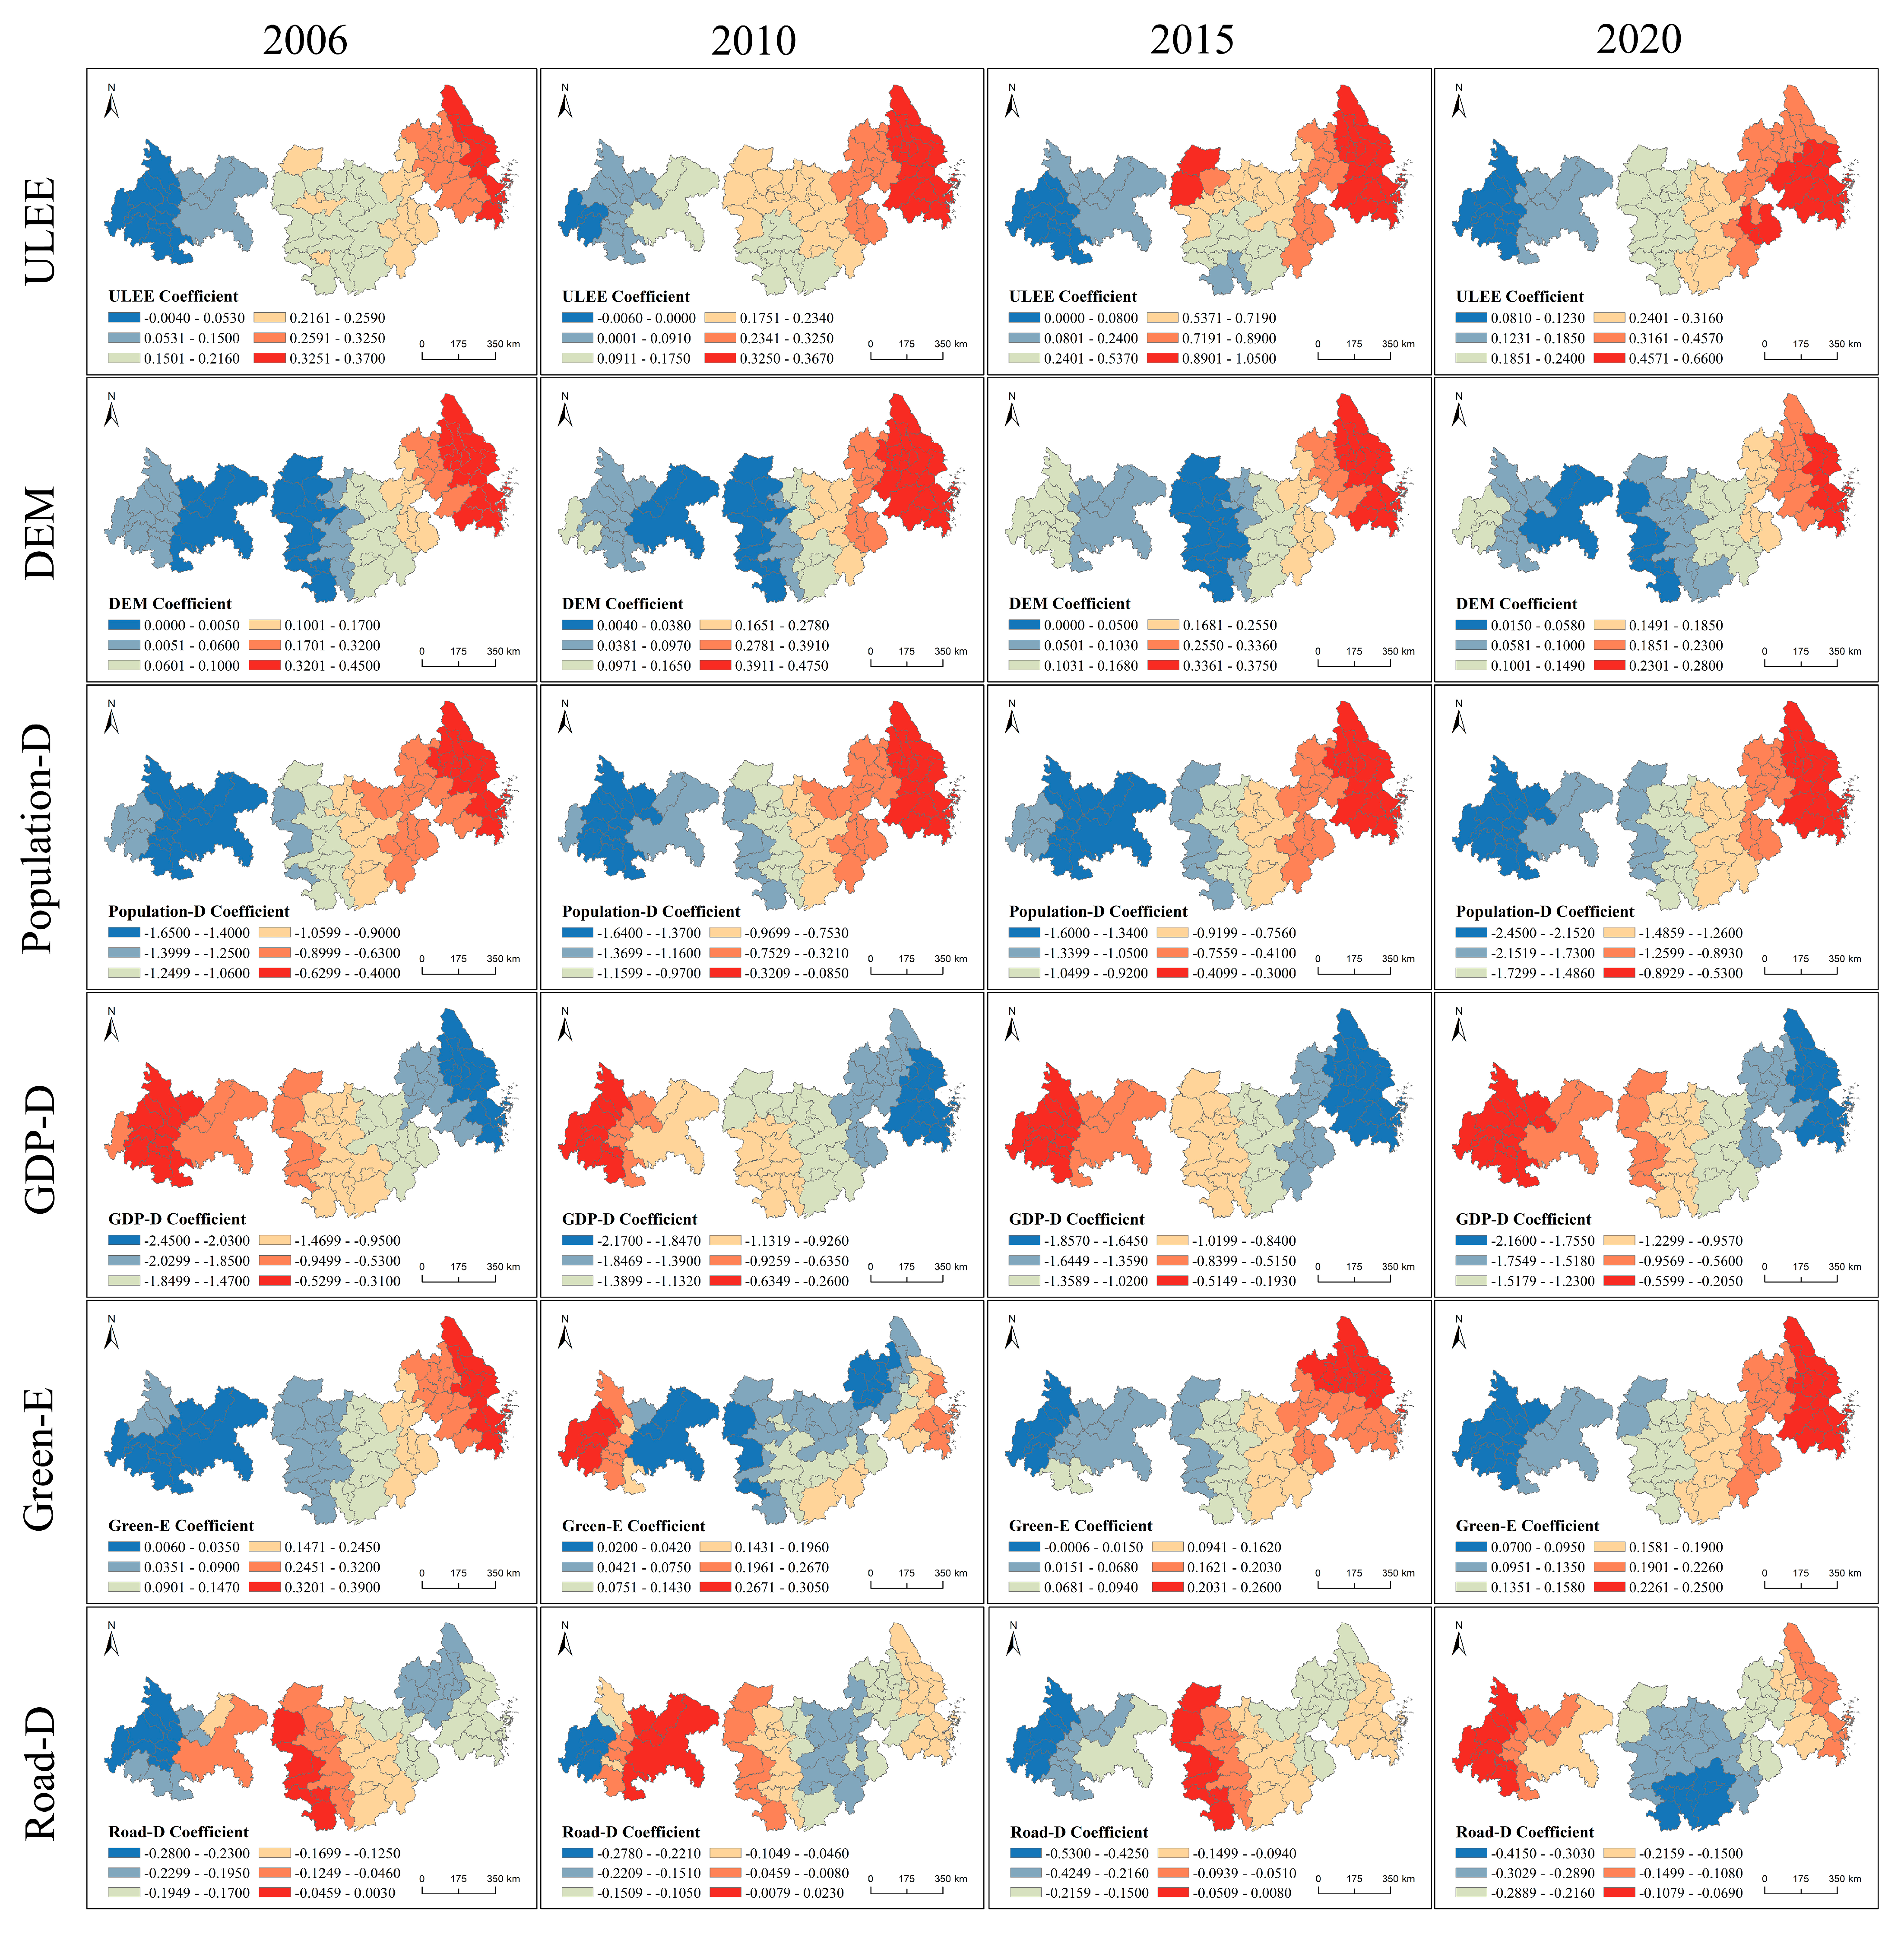
4.3.2. Spatial Variation Analysis Based on GWR Model

To further investigate spatial heterogeneity in the effects of ULEE on AESV, GWR analysis using ArcGIS 10.8 (https://www.arcgis.com/home/ accessed on 5 March 2022) software was carried out to explore its impact characteristics at different time points. The results showed that the R2 ranged from 0.662–0.875, significantly better than the OLS model.
As presented in Figure 7, ULEE was found to have a significant positive influence on ESs, consistent with the OLS analysis results. Its influence exhibited a general decreasing spatial trend from east to west, i.e., UA-YRD > UA-MRYR > UA-CY. This spatial pattern did not change greatly within the given study period. As the ULEE increased, considerable improvements in the AESV were observed in the UA-YRD, some progress in the UA-MRYR, and very little in the UA-CY.
There are several explanations for these findings. First, the UA-YRD is mainly flat; most of its cities have high-density built-up areas, which tend to optimise the original spatial basis, and environmental optimisation is essential in this context. In contrast, the UA-CY is hilly and mountainous, with higher ecological value. Most of its cities remain in a period of rapid development, except for the main cities of Chongqing and Chengdu. Their urban expansion is likely to encroach on ecological and agricultural spaces, resulting in the loss of ecological value. To a certain extent, this forms a barrier to the positive impact of increased expansion efficiency, so the increase in AESV becomes less pronounced. The UA-MRYR is still in the rapid development stage, and urban land continues to expand rapidly. The pursuit of land efficiency is inclined towards economic and social benefits, resulting in improved ecosystem services in general.
For each control variable, the effect of elevation was positive, and its influence showed a decreasing trend from east and west to the central part of the study area. The effect was high in the UA-YRD, low in the UA-MRYR’s western region, and low in the UA-CY’s eastern part. For instance, the landscapes of Hangzhou, Jinhua, and Ya’an are dominated mainly by mountains and hills with high vegetation cover; urban land accounts for a relatively low proportion of their overall land space, resulting in better AESV. The effects of population density and GDP density were generally adverse. Coincidentally, the influence of population density presented a decreasing spatial trend from west to east, while the influence of GDP density decreased from east to west. For example, Shanghai, Nanjing, and Jiaxing showed more significant adverse effects on AESV due to their high urbanisation rates, large proportions of urban land, high population densities, and high GDP densities, which severely affected ecological patterns. These spatial patterns did not change much during the study period, and the effect of the greening rate in the built-up area was positive, with a spatial pattern that was high in the east and low in the west. This spatial pattern did not change greatly during the study period, as shown by the influence of urban road density as a negative. However, a pattern was seen that was higher in the central and western parts and lower in the eastern region. Furthermore, areas of high influence changed significantly during the study period—higher performance was observed in the UA-MRYR for 2006 and 2015, and in the UA-CY for 2010 and 2020.

5. Conclusions and Suggestions

Based on efficiency theory and land use theory, combined with the requirements of high-quality development, this paper has explored the impact mechanism of ULEE on ESs. The Super-SBM and InVEST models were applied to measure the ULEE and AESVs of the three major urban agglomerations in the YREB. The OLS and GWR models were applied to analyse quantitatively the real impact of ULEE on AESV. Our main conclusions are as follows:
(1)
ULEE has a positive and indirect impact on ESs. The influence of mediation can be divided into three aspects: Land use structure, land use pattern, and land use quality.
(2)
The trends of change in ULEE in the three major urban agglomerations during the study period were comparable; efficiency values generally decreased and showed clear phases, decreasing from 2006 to 2014, rebounding gradually from 2014 to 2019, and declining significantly in 2020. There were also noticeable spatial differences in the ULEE of the urban agglomerations; the UA-YRD had significantly higher ULEE than the UA-MRYR or the UA-CY.
(3)
The AESV of the three major urban agglomerations showed a continuous decreasing trend during the study period, with significant spatial differences. At the same time, there was a particular coincidence between the change trends of AESV and ULEE.
(4)
The regression coefficient between ULEE and AESV in the three urban agglomerations was positive; the enhancement of ULEE significantly contributed to the improvement of ESs. The influence of ULEE on ESs generally showed a decreasing trend from east to west. To conclude, the UA-YRD had the highest performance, followed by the UA-MRYR, while the lowest was in the UA-CY; this pattern of spatial heterogeneity was maintained throughout the given study period.
Against a background of high-quality development, constraints on unmitigated urbanisation will be significantly strengthened, and the impact of urban land expansion on ESs will be weakened accordingly. The concepts and models of smart urban growth and green development have increasingly become more widespread [70,71], and in this context the importance of urban expansion efficiency will be significantly enhanced. Therefore, relevant departments should take active measures to enhance the efficiency of urban land expansion and to promote ecological improvement and high-quality development. First, the intensive use of urban land should be further strengthened. The output of ecological products and pollution emissions should be included in processes of efficiency accounting, and their comprehensive benefit should be integrated into the government assessment system. Second, greater attention should be given to city–industry integration, particularly during the construction and development of new areas. The creation of urban green spaces should be vigorously promoted, and the coordination of the “three zones” should be strengthened to increase the output efficiency of ecological and agricultural areas. Third, technological empowerment along with optimisation and upgrading of industry should be actively promoted. Investments in environmental protection should be increased, and the environmental protection industry should be further developed. In addition, regional links should be strengthened, and the complementary advantages between different cities and urban clusters should be realised.
With the deepening effect of the high-quality development of urban agglomerations, the dimensions of urban land expansion efficiency will become more extensive. Economic efficiency, environmental efficiency, social efficiency, and innovation efficiency are all important aspects of urban land expansion. However, due to the limited length of this paper and the difficulty quantifying invisible factors such as policy, innovation, and management, this analysis of the comprehensive efficiency of urban land expansion in this paper has not gone deep enough, and the selection of influencing factors as variables was not comprehensive enough. Therefore, subsequent studies will require improvements to analyse the comprehensive efficiency of urban land expansion, strengthen the innovative application of new methods, and further discuss the impact mechanism of ULEE on ecosystem services.

Author Contributions

Conceptualization, Q.H. and K.W.; methodology, K.W. and X.O.; software, X.O. and K.W.; formal analysis, K.W.; data curation, K.W. and X.O.; writing—original draft preparation, K.W.; writing—review and editing, Q.H. and X.Z.; visualization, K.W. and X.O.; supervision, Q.H. and X.Z. All authors have read and agreed to the published version of the manuscript.

Funding

This research was funded by the Scientific Research Foundation of Hunan Provincial Education Department, China (Grant No. 21A0591), Science and Technology Project of Hunan Provincial Department of Land and Resources, China (No. 2022-49) and the National Science Foundation of Hunan Province, China (Grant No. 2021JJ40015).

Institutional Review Board Statement

Not applicable.

Informed Consent Statement

Not applicable.

Data Availability Statement

All data and materials are available upon request.

Acknowledgments

We would like to thank the experts who provide thoughtful comments for this work. All individuals agree to confirm.

Conflicts of Interest

The authors declare no conflict of interest.

References

  1. Xu, Y.; Zhao, S.; Fan, J. Urban planning construction land standard and its revision based on climate and topography in China. J. Geogr. Sci. 2021, 31, 194–208. [Google Scholar] [CrossRef]
  2. Liu, X.; Xin, L. Assessment of the Efficiency of Cultivated Land Occupied by Urban and Rural Construction Land in China from 1990 to 2020. Land 2022, 11, 941. [Google Scholar] [CrossRef]
  3. Li, Y.; Liu, Y.; Long, H.; Cui, W. Community-based rural residential land consolidation and allocation can help to revitalise hollowed villages in traditional agricultural areas of China: Evidence from Dancheng County, Henan Province. Land Use Policy 2014, 39, 188–198. [Google Scholar] [CrossRef]
  4. Chen, H.; Meng, C.; Cao, Q. Measurement and Influencing Factors of Low Carbon Urban Land Use Efficiency—Based on Non-Radial Directional Distance Function. Land 2022, 11, 1052. [Google Scholar] [CrossRef]
  5. Morano, P.; Guarini, M.R.; Sica, F.; Anelli, D. Ecosystem Services and Land Take. A Composite Indicator for the Assessment of Sustainable Urban Projects. In Proceedings of the International Conference on Computational Science and Its Applications, Cagliari, Italy, 13–16 September 2021; Springer: Berlin/Heidelberg, Germany, 2021; pp. 210–225. [Google Scholar]
  6. Li, B.; Chen, D.; Wu, S.; Zhou, S.; Wang, T.; Chen, H. Spatio-Temporal Assessment of Urbanization Impacts on Ecosystem Services: Case Study of Nanjing City, China. Ecol. Indic. 2016, 71, 416–427. [Google Scholar] [CrossRef]
  7. Azadi, H.; Ho, P.; Hasfiati, L. Agricultural land conversion drivers: A comparison between less developed, developing and developed countries. Land Degrad. Dev. 2011, 22, 596–604. [Google Scholar] [CrossRef]
  8. Milnar, M.; Ramaswami, A. Impact of Urban Expansion and In Situ Greenery on Community-Wide Carbon Emissions: Method Development and Insights from 11 US Cities. Environ. Sci. Technol. 2020, 54, 16086–16096. [Google Scholar] [CrossRef]
  9. Li, G.; Fang, C.; Li, Y.; Wang, Z.; Sun, S.; He, S.; Qi, W.; Bao, C.; Ma, H.; Fan, Y.; et al. Global Impacts of Future Urban Expansion on Terrestrial Vertebrate Diversity. Nat. Commun. 2022, 13, 1628. [Google Scholar] [CrossRef]
  10. Hao, Y.; Wu, Y.; Wang, L.; Huang, J. Re-examine environmental Kuznets curve in China: Spatial estimations using environmental quality index. Sustain. Cities Soc. 2018, 42, 498–511. [Google Scholar] [CrossRef]
  11. Masini, E.; Tomao, A.; Barbati, A.; Corona, P.; Serra, P.; Salvati, L. Urban Growth, Land-use Efficiency and Local Socioeconomic Context: A Comparative Analysis of 417 Metropolitan Regions in Europe. Environ. Manag. 2019, 63, 322–337. [Google Scholar] [CrossRef]
  12. Du, J.; Bai, X.; Lu, Y.; Wang, H.; Zhao, J.; Liu, J.; Wang, H.; Sui, X.; Fang, Q. Diagnostic Efficacy of Ultrasonographic Characteristics of Thyroid Carcinoma in Predicting Cervical Lymph Node Metastasis. Ultrasound Med. Biol. 2016, 42, 68–74. [Google Scholar] [CrossRef] [PubMed]
  13. He, S.; Yu, S.; Li, G.; Zhang, J. Exploring the influence of urban form on land-use efficiency from a spatiotemporal heterogeneity perspective: Evidence from 336 Chinese cities. Land Use Policy 2020, 95, 104576. [Google Scholar] [CrossRef]
  14. Wu, C.; Wei, Y.; Huang, X.; Chen, B. Economic transition, spatial development and urban land use efficiency in the Yangtze River Delta, China. Habitat Int. 2017, 63, 67–78. [Google Scholar] [CrossRef]
  15. Yao, M.; Zhang, Y. Evaluation and Optimization of Urban Land-Use Efficiency: A Case Study in Sichuan Province of China. Sustainability 2021, 13, 1771. [Google Scholar] [CrossRef]
  16. Wey, W.; Hsu, J. New Urbanism and Smart Growth: Toward achieving a smart National Taipei University District. Habitat Int. 2014, 42, 164–174. [Google Scholar] [CrossRef]
  17. Yao, J.; Xu, P.; Huang, Z. Impact of urbanization on ecological efficiency in China: An empirical analysis based on provincial panel data. Ecol. Indic. 2021, 129, 107827. [Google Scholar] [CrossRef]
  18. Yu, J.; Zhou, K.; Yang, S. Land use efficiency and influencing factors of urban agglomerations in China. Land Use Policy 2019, 88, 104143. [Google Scholar] [CrossRef]
  19. Lu, X.; Kuang, B.; Li, J. Regional difference decomposition and policy implications of China’s urban land use efficiency under the environmental restriction. Habitat Int. 2018, 77, 32–39. [Google Scholar] [CrossRef]
  20. Manika, S.; Karalidis, K.; Gospodini, A. Spatial Analysis of Economic Activities as a Tool for Effective Urban Policies. Smart Cities 2022, 5, 276–293. [Google Scholar] [CrossRef]
  21. Xie, H.; Chen, Q.; Lu, F.; Wu, Q.; Wang, W. Spatial-temporal disparities, saving potential and influential factors of industrial land use efficiency: A case study in urban agglomeration in the middle reaches of the Yangtze River. Land Use Policy 2018, 75, 518–529. [Google Scholar] [CrossRef]
  22. Costanza, R.; D’Arge, R.; Groot, D.R. The Value of the World’s Ecosystem Services and Natural Capital. Nature 1997, 387, 253–260. [Google Scholar] [CrossRef]
  23. Millennium Ecosystem Assessment. Ecosystems and Human Well-Being: Current State and Trends; Island Press: Washington, DC, USA, 2005; pp. 77–101. [Google Scholar]
  24. Daily, G.C. Nature’s services: Societal dependence on natural ecosystems. Corp. Environ. Strategy 1997, 6, 220–221. [Google Scholar]
  25. Howarth, R.B.; Farber, S. Accounting for the value of ecosystem services. Ecol. Econ. 2004, 41, 421–429. [Google Scholar] [CrossRef]
  26. Cui, R.; Han, J.; Hu, Z. Assessment of Spatial Temporal Changes of Ecological Environment Quality: A Case Study in Huaibei City, China. Land 2022, 11, 944. [Google Scholar] [CrossRef]
  27. Nelson, E.; Mendoza, G.; Regetz, J. Modeling multiple ecosystem services, biodiversity conservation, commodity production, and tradeoffs at landscape scales. Front. Ecol. Environ. 2009, 7, 4–11. [Google Scholar] [CrossRef]
  28. Wang, X.; Pan, T.; Pan, R.; Chi, W.; Ma, C.; Ning, L.; Wang, X.; Zhang, J. Impact of Land Transition on Landscape and Ecosystem Service Value in Northeast Region of China from 2000–2020. Land 2022, 11, 696. [Google Scholar] [CrossRef]
  29. Gao, X.; Xu, Z.; Niu, F.; Long, Y. An evaluation of China’s urban agglomeration development from the spatial perspective. Spat. Stat. 2017, 21, 475–491. [Google Scholar] [CrossRef]
  30. Wang, S.; Chen, B. Energy–water nexus of urban agglomeration based on multiregional input–output tables and ecological network analysis: A case study of the Beijing–Tianjin–Hebei region. Appl. Energy 2016, 178, 773–783. [Google Scholar] [CrossRef]
  31. Yao, S.; Zhou, C.; Wang, D.; Xiu, C.L.; Wang, C.X.; Chen, M.X. New Perspectives on Urban Agglomerations in China; China Science Publishing: Beijing, China, 2016; Volume 6, pp. 150–155. [Google Scholar]
  32. Fang, C.; Zhou, C.; Gu, C.; Chen, L.D.; Li, S.C. Theoretical analysis of interactive coupled effects between urbanization and eco-environment in mega-urban agglomerations. Acta Geogr. Sin. 2016, 71, 531–550. [Google Scholar] [CrossRef]
  33. Tian, P.; Wu, H.; Yang, T.; Jiang, F.; Zhang, W.; Zhu, Z.; Yue, Q.; Liu, M.; Xu, X. Evaluation of urban water ecological civilisation: A case study of three urban agglomerations in the Yangtze River Economic Belt, China. Ecol. Indic. 2021, 123, 107351. [Google Scholar] [CrossRef]
  34. Liu, Y.; Zhang, X.; Pan, X.; Ma, X.; Tang, M. The spatial integration and coordinated industrial development of urban agglomerations in the Yangtze River Economic Belt, China. Cities 2020, 104, 102801. [Google Scholar] [CrossRef]
  35. Smith, A. An Inquiry into the Nature and Causes of the Wealth of Nations; Guo, D., Wang, Y., Eds.; The Commercial Press: Beijing, China, 2002. [Google Scholar]
  36. Douglass North. Structure and Change in Economic History; W W Norton & Company: New York, NY, USA, 1982. [Google Scholar]
  37. Che, S. Review of efficiency theory. Commer. Res. 2011, 5, 31–35. [Google Scholar]
  38. Samuelson, P.; Nordhaus, W. Economics; Xiao, S., Ed.; The Commercial Press: Beijing, China, 2012. [Google Scholar]
  39. Cui, X.; Wang, X. Urban land use change and its effect on social metabolism: An empirical study in Shanghai. Habitat Int. 2015, 49, 251–259. [Google Scholar] [CrossRef]
  40. Chen, K.; Long, H. Impacts of land market on urban-rural integrated development in China. J. Nat. Resour. 2019, 34, 221–235. [Google Scholar] [CrossRef]
  41. Chang, J.; Wu, X.; Liu, A.; Wang, Y.; Xu, B.; Yang, W.; Laura, A.; Gu, B.; Peng, C.; Ge, Y. Assessment of net ecosystem services of plastic greenhouse vegetable cultivation in China. Ecol. Econ. 2010, 70, 740–748. [Google Scholar] [CrossRef]
  42. Sun, X.; Tang, H.; Yang, P.; Hu, G.; Liu, Z.; Wu, J. Spatiotemporal patterns and drivers of ecosystem service supply and demand across the conterminous United States: A multiscale analysis. Sci. Total Environ. 2020, 703, 135005. [Google Scholar] [CrossRef]
  43. Chen, T.; Feng, Z.; Zhao, H.; Wu, K. Identification of ecosystem service bundles and driving factors in Beijing and its surrounding areas. Sci. Total Environ. 2020, 711, 134687. [Google Scholar] [CrossRef]
  44. Deng, X.; Huang, J.; Scott, R.; Zhang, J.; Li, Z. Impact of urbanization on cultivated land changes in China. Land Use Policy 2015, 45, 1–7. [Google Scholar] [CrossRef]
  45. Song, W.; Deng, X. Land-use/land-cover change and ecosystem service provision in China. Sci. Total Environ. 2017, 576, 705–719. [Google Scholar] [CrossRef]
  46. Sun, Q.; Zhou, L.; Shen, R.; Liu, T. Spatial Heterogeneity of Urban Land Use in Yangtze River Economic Belt Based on DMSP/OLS Data. Remote Sens. Inf. 2019, 34, 79–86. [Google Scholar]
  47. Luo, Q.; Zhou, J.; Li, Z.; Yu, B. Spatial differences of ecosystem services and their driving factors: A comparation analysis among three urban agglomerations in China’s Yangtze River Economic Belt. Sci. Total Environ. 2020, 725, 138452. [Google Scholar] [CrossRef] [PubMed]
  48. Song, J.; Chen, X. Eco-efficiency of grain production in China based on water footprints: A stochastic frontier approach. J. Clean. Prod. 2019, 236, 117685. [Google Scholar] [CrossRef]
  49. Xia, C.; Hu, S.; Wu, S.; Yu, D. Spatial-Temporal Evolution Characteristics of Urban Land Use Efficiency in Yangtze River Economic Belt. Econ. Geogr. 2021, 41, 115–124. [Google Scholar]
  50. Du, Y.; Jiang, J.; Li, C. Ecological efficiency evaluation of marine ranching based on the Super-SBM model: A case study of Shandong. Ecol. Indic. 2021, 131, 108174. [Google Scholar] [CrossRef]
  51. Tone, K. A slacks-based measure of efficiency in data envelopment analysis. Eur. J. Oper. Res. 2001, 130, 498–509. [Google Scholar] [CrossRef]
  52. Zhou, C.; Shi, C.; Wang, S.; Zhang, G. Estimation of eco-efficiency and its influencing factors in Guangdong province based on Super-SBM and panel regression models. Ecol. Indic. 2018, 86, 67–80. [Google Scholar] [CrossRef]
  53. Tone, K. A slacks-based measure of super-efficiency in data envelopment analysis. Eur. J. Oper. Res. 2002, 143, 32–41. [Google Scholar] [CrossRef]
  54. Yan, R.; Cai, Y.; Li, C.; Wang, X.; Liu, Q.; Yan, S. Spatial interactions among ecosystem services and the identification of win-win areas at the regional scale. Ecol. Complex. 2021, 41, 100938. [Google Scholar]
  55. Bagstad, K.J.; Villa, F.; Batker, D.; Harrison-Cox, J.; Voigt, B.; Johnson, G.W. From theoretical to actual ecosystem services: Mapping beneficiaries and spatial flows in ecosystem service assessments. Ecol. Soc. 2014, 19, 64. [Google Scholar] [CrossRef]
  56. Greg, B.; Lars, B. The extrapolation of social landscape values to a national level in New Zealand using landscape character classification. Appl. Geogr. 2012, 35, 84–94. [Google Scholar]
  57. Tallis, H.; Ricketts, T.; Guerry, A. InVEST 2.2.4 User’s Guide; The Natural Capital Project: Stanford, CA, USA, 2011. [Google Scholar]
  58. Zhang, D.; Huang, Q.; He, C.; Wu, J. Impacts of urban expansion on ecosystem services in the Beijing-Tianjin-Hebei urban agglomeration, China: A scenario analysis based on the Shared Socioeconomic Pathways. Resour. Conserv. Recycl. 2017, 125, 115–130. [Google Scholar] [CrossRef]
  59. Long, H.; Ge, D.; Zhang, Y.; Tu, S.; Qu, Y.; Ma, L. Changing man-land interrelations in China’s farming area under urbanization and its implications for food security. J. Environ. Manag. 2018, 209, 440–451. [Google Scholar] [CrossRef] [PubMed]
  60. Hall, L.S.; Krausman, P.R.; Morrison, M.L. The habitat concept and a plea for standard terminology. Wildl. Soc. Bull. 1997, 25, 173–182. [Google Scholar]
  61. Chu, L.; Sun, T.; Wang, T.; Li, Z.; Cai, C. Evolution and Prediction of Landscape Pattern and Habitat Quality Based on CA-Markov and InVEST Model in Hubei Section of Three Gorges Reservoir Area (TGRA). Sustainability 2018, 10, 3854. [Google Scholar] [CrossRef]
  62. Eade, J.D.O.; Dominic, M. Spatial Economic Valuation: Benefits Transfer using Geographical Information Systems. J. Environ. Manag. 1996, 48, 97–110. [Google Scholar] [CrossRef]
  63. Yu, D.; Shi, P.; Liu, Y.; Xun, B. Detecting land use-water quality relationships from the viewpoint of ecological restoration in an urban area. Ecol. Eng. 2013, 53, 205–216. [Google Scholar] [CrossRef]
  64. Schirpke, U.; Tscholl, S.; Tasser, E. Spatio-temporal changes in ecosystem service values: Effects of land-use changes from past to future (1860–2100). J. Environ. Manag. 2020, 272, 111068. [Google Scholar] [CrossRef]
  65. Ouyang, Z.; Zheng, H.; Xiao, Y.; Polasky, S.; Liu, J.; Xu, W.; Wang, Q.; Zhang, L.; Xiao, Y.; Rao, E.; et al. Improvements in ecosystem services from investments in natural capital. Science 2016, 352, 1455–1459. [Google Scholar] [CrossRef]
  66. Ouyang, X.; Tang, L.; Wei, X.; Li, Y. Spatial interaction between urbanization and ecosystem services in Chinese urban agglomerations. Land Use Policy 2021, 109, 105587. [Google Scholar] [CrossRef]
  67. Zhong, Z.; Chen, Z.; He, L. Technological innovation, industrial structural change and carbon emission transferring via trade--An agent-based modeling approach. Technovation 2022, 110, 102350. [Google Scholar]
  68. Peng, J.; Hu, X.; Qiu, S.; Hu, Y.; Meersmans, J.; Liu, Y. Multifunctional landscapes identification and associated development zoning in mountainous area. Sci. Total Environ. 2019, 660, 765–775. [Google Scholar] [CrossRef] [PubMed]
  69. Di, F.M.; Sallustio, L.; Vizzarri, M.; De Rosa, D.; De Lisio, L.; Loy, A.; Eichelberger, B.A.; Marchetti, M. Expert-based and correlative models to map habitat quality: Which gives better support to conservation planning? Glob. Ecol. Conserv. 2018, 16, e00513. [Google Scholar]
  70. Handy, S. Smart growth and the transportation-land use connection: What does the research tell us? Int. Reg. Sci. Rev. 2005, 28, 146–167. [Google Scholar] [CrossRef]
  71. Tao, F.; Zhang, H.; Hu, J.; Xia, X. Dynamics of green productivity growth for major Chinese urban agglomerations. Appl. Energy 2016, 196, 170–179. [Google Scholar] [CrossRef]
Figure 1. The mechanism framework of the impact of ULEE on ESs.
Land 11 01591 g001
Figure 2. The location of the Yangtze River Economic Belt and its three major urban agglomerations.
Land 11 01591 g002
Figure 3. Temporal changes of ULEE in the three major urban agglomerations, 2006–2020.
Land 11 01591 g003
Figure 4. Spatial differences of ULEE among the three major urban agglomerations.
Land 11 01591 g004
Figure 5. The temporal changes of AESV in three major urban agglomerations, 2006–2020.
Land 11 01591 g005
Figure 6. The spatial difference of ULEE among three major urban agglomerations.
Land 11 01591 g006
Figure 7. Spatial distribution patterns of impact indicators of ESs in three major urban agglomerations.
Land 11 01591 g007
Table 1. Major limitations of related studies.
Study TopicsRelated LiteratureMajor Limitations
Urban land expansionXu [1] et al., Newbold [5] et al.Insufficient in the examination of expansion efficiency.
Ecosystem servicesHowarth [25] et al., Cui [26] et al., Wang [28] et al.Equivalent factors vary widely and are highly subjective.
The impact of urban land expansion on ecosystem servicesMilnar [8] et al., Li [9] et al., Hao [10] et al.A lack of research exploring the impacts on ecosystem services from an efficiency perspective.
Urban land efficiencyWu [14] et al., Yao [15] et al., Yao [17] et al., Liu [20] et al.Few comparative studies for urban agglomerations, especially multiple urban agglomerations.
Table 2. Index system of input-output.
Index ClassificationIndicatorIndicator Nature
Inputsinvestment in fixed assetscapital input
employment number in the secondary and tertiary industrieslabour input
new urban land arealand input
R&D expendituretechnology input
Desired outputsaverage GDPeconomy
per capita disposable incomepopulation
Undesired outputsemission of CO2-
emission of SO2-
Table 3. Results of OLS.
IndicatorsCStdTPVIF
Elevation0.1480.0572.1470.035 *1.212
Population density−1.4690.312−5.0370.000 *5.331
GDP density−1.2730.321−4.0080.001 *6.349
Greening rate of built-up area0.0640.0690.9210.3611.322
Urban road density−0.1280.089−1.6530.047 *3.754
ULEE0.6770.1562.9160.044 *1.423
Asterisk (*) indicates that the regression result is significant at p < 0.05.
Publisher’s Note: MDPI stays neutral with regard to jurisdictional claims in published maps and institutional affiliations.

