Article

Regionalization Research of Mountain-Hazards Developing Environments for the Eurasian Continent

1
Key Research Institute of Yellow River Civilization and Sustainable Development & Collaborative Innovation Center on Yellow River Civilization Jointly Built by Henan Province and Ministry of Education, Henan University, Kaifeng 475001, China
2
Key Laboratory of Mountain Hazards and Earth Surface Process, Institute of Mountain Hazards and Environment, Chinese Academy of Sciences, Chengdu 610041, China
3
Laboratory of the Yellow River Cultural Heritage, Henan University, Kaifeng 475001, China
*
Author to whom correspondence should be addressed.
Land 2022, 11(9), 1519; https://doi.org/10.3390/land11091519
Submission received: 11 August 2022 / Revised: 3 September 2022 / Accepted: 5 September 2022 / Published: 9 September 2022
(This article belongs to the Special Issue Landslide and Natural Hazard Monitoring)

Abstract

:
Carrying out mountain-hazards developing environment research is helpful for understanding the spatial characteristics of the mountain hazards so as to contribute to mountain-hazards prevention and mitigation and the safety of infrastructures and major projects. In this study, the Eurasian continent was selected as the research area to conduct regionalization research on mountain-hazards developing environments. Using peak ground acceleration (PGA), the annual average precipitation and topographic relief as root factors of mountain-hazards developing environments (known as PPR factors) to represent the characteristics of geological structures, climatic impacts and geomorphology, the regionalization of mountain-hazards developing environments of the Eurasian continent was conducted through the combination of computer automatic classification and later artificial cartographic generalization. Finally, 15 subregions were obtained. A preliminary judgment of the mountain-hazards susceptibility for each region according to the characteristics of PPR factors was made, and nine subregions were identified as the overall high-susceptibility areas of mountain hazards. Based on the analysis of the characteristics of PPR factors and the mountain-hazards susceptibility characteristics in different mountain-hazards developing environment subregions, the high susceptibility regions of mountain hazards could be divided into three types: arid and active-geologic regions, humid and active-geologic regions, and humid and inactive-geologic regions. We hope that our research provides support for subsequent works of more specific and reasonable mountain-hazards susceptibility, hazard and risk models construction for different types of mountain-hazards developing environments.

1. Introduction

Regionalization research is a common geographical method which could be used to divide land into areas, each of which has a set of regulations that differs from other regions [1]. Geographical regionalization is a scientific method to understand geographical characteristics and discover geographical laws [2]. Nowadays, regionalization research is applied in many studies that highlight the regional differences of geographical objects [3,4]. Xu et al. [5] conducted the preliminary research of the geographic regionalization of China’s land background and the spectral reflectance characteristics of soil. Zhang et al. [6] talked about the regionalization of natural disasters in China. Wang and Shi [7] carried out the comprehensive regionalization research of agricultural natural disaster in China. Wu et al. [8] conducted the research of the regionalization and distribution types of the bryophytes in China. Frankel [9] conducted the regionalization research of the world economy. Gao et al. [10] talked about the new progresses and development trends in the research of physio-geographical regionalization in China. Xu et al. [11] performed the research of spatial change of China’s grain production based on the geographical regionalization of natural factors during 1990–2010. Badr et al. [12] introduced a tool for hierarchical climate regionalization. Zhang et al. [13] studied the eco-geographical regionalization in the Loess Plateau based on the dynamic consistency of vegetation. Gamelo et al. [14] studied the health regionalization in Amazonas, especially the progress and challenges. Morrone [15] talked about the biogeographical regionalization. Zhu et al. [16] conducted the ecological function evaluation and regionalization in Baiyangdian Wetland. Yu et al. [17] used a case study of population and economic risk caused by typhoons in Guangdong Province to finish the comprehensive regionalization of natural disaster risk.
Mountain-hazards developing environments are comprehensive surface environments composed of atmosphere, biosphere, hydrosphere and lithosphere [18,19]. There are many factors affecting the developing of mountain hazards, and different researchers often consider various factors when studying the hazard-developing environments, including precipitation, vegetation, lithology, river, slope, aspect, soil and many other factors [20]. Qin et al. [21] discussed the regionalization of geological hazards developing environments of road flood in Wanzhou. Lin et al. [22] performed the integrated regionalization of developing environments of geological disasters in Chongqing City. At present, the relevant research on mountain hazards mainly focuses on the prevention and mitigation, hazard assessment [23,24], risk assessment [25,26] and early warning of mountain hazards [27,28], while the research on the developing environments of mountain hazards is not paid enough attention. In fact, the regionalization research of the mountain-hazards developing environments should be the basis and premise of the subsequent assessment model construction of susceptibility, hazard and risk. In order to construct more suitable assessment models with regional characteristics, the regionalization research is necessary for the regions with a great difference in hazards-developing environments [29,30]. In this study, the Eurasian continent was selected as the research area to conduct regionalization research of mountain-hazards developing environments in order to understand geographical characteristics, discover geographical laws, and provide a guide for the follow-up disaster research in the Eurasian continent.

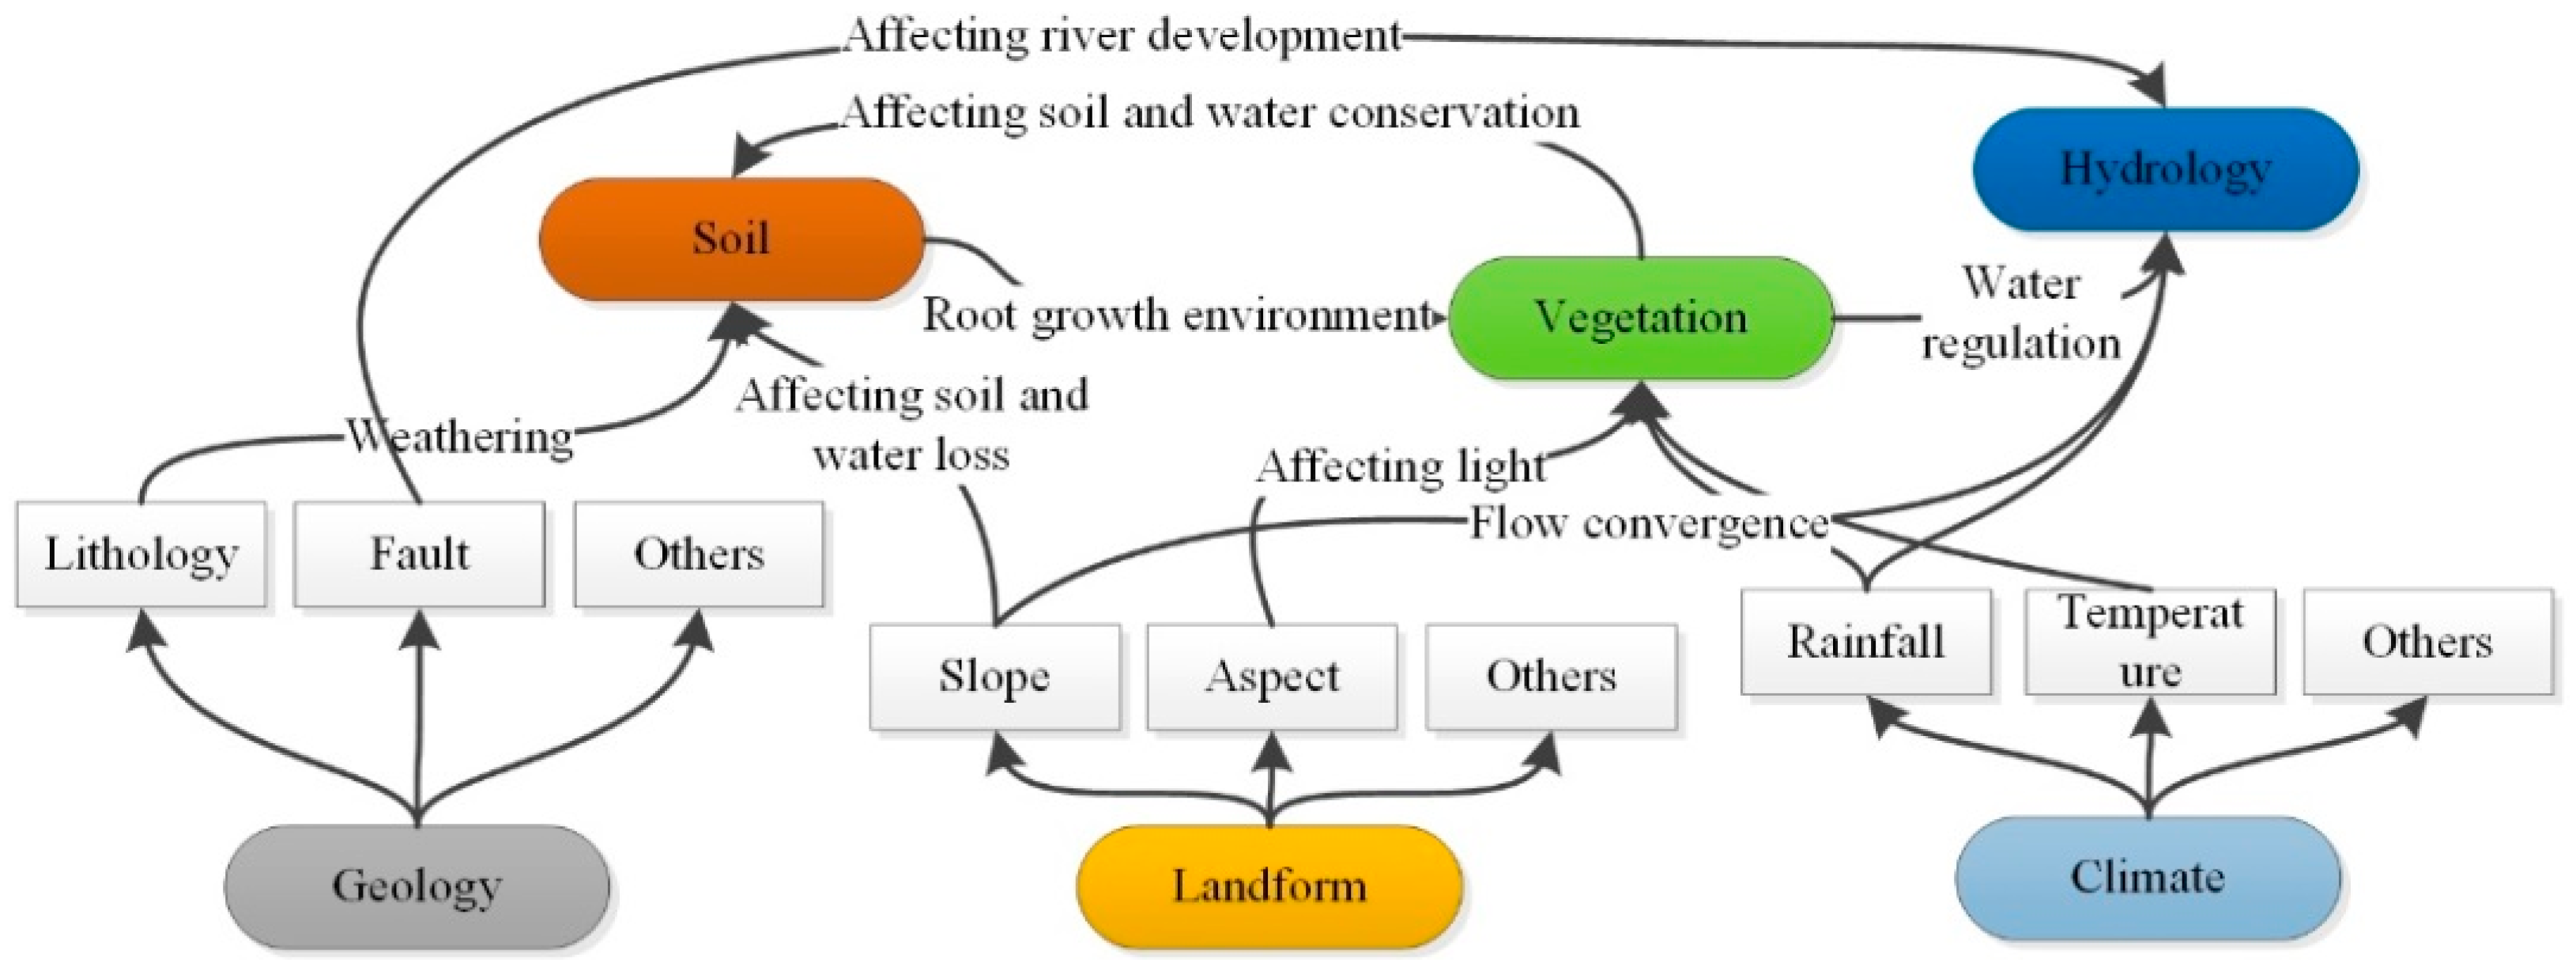
2. Theoretical Construction of Root Factor Selecting for Mountain-Hazards Developing Environments

The diversity of mountain-hazards developing environment factors leads to the complexity of the research. In order to understand the relationships of various factors better, these factors could be classified according to the attribute characteristics of the factors. For example, lithology, fault and other factors could be classified as geological factors; slope, aspect and fluctuation as geomorphic factors; precipitation and temperature as climatic factors; soil humidity, soil erodibility and other factors as soil factors; and river network density and distance to the rivers as hydrological factors.
Geographical elements interact and connect with each other to form a unique surface complex system. After comparative analysis, it is not difficult to find that geological, geomorphic and climatic factors could be regarded as the most basic and bottom factors for mountain-hazards developing, and they could be regarded as the root of factor “tree” of mountain-hazards developing environments (Figure 1). As initial environmental factors, they can affect subsequent soil development [31,32], vegetation growth [33,34], river development [35] and the formation of many other factors (Figure 1). They play an important role for the hazards-developing environments of mountain hazards from underground, surface and above ground. Analyzing the root factors is a good way to understand the characteristics of regional hazard-developing environments, which can effectively avoid the problems of complex analysis and unclear research focus caused by too many hazard-developing environment factors.

3. Study Area and Materials
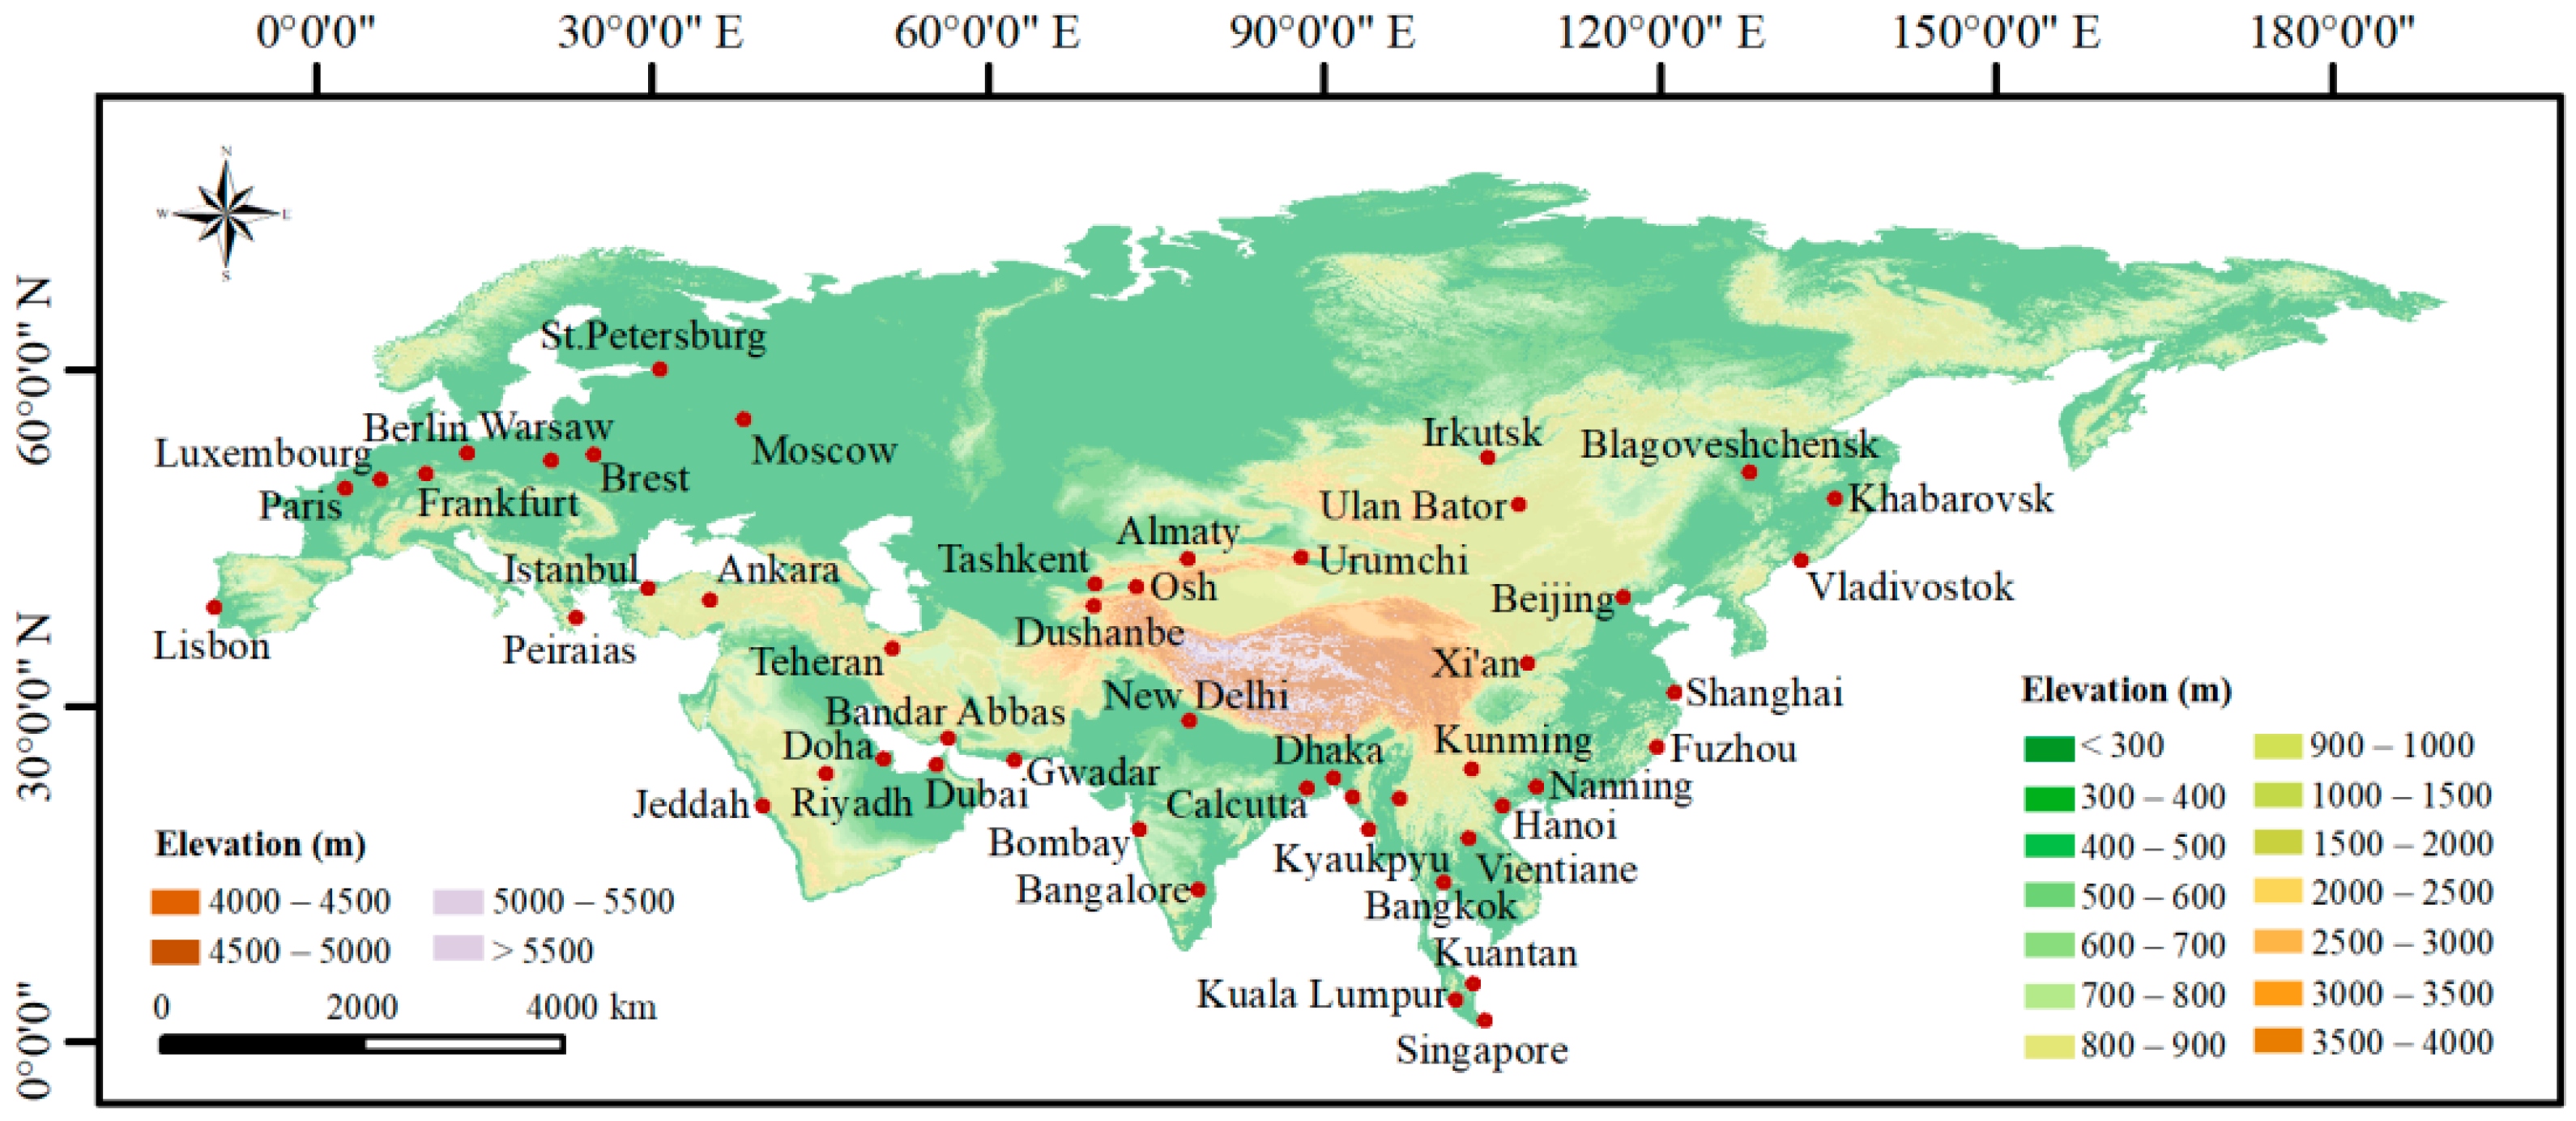
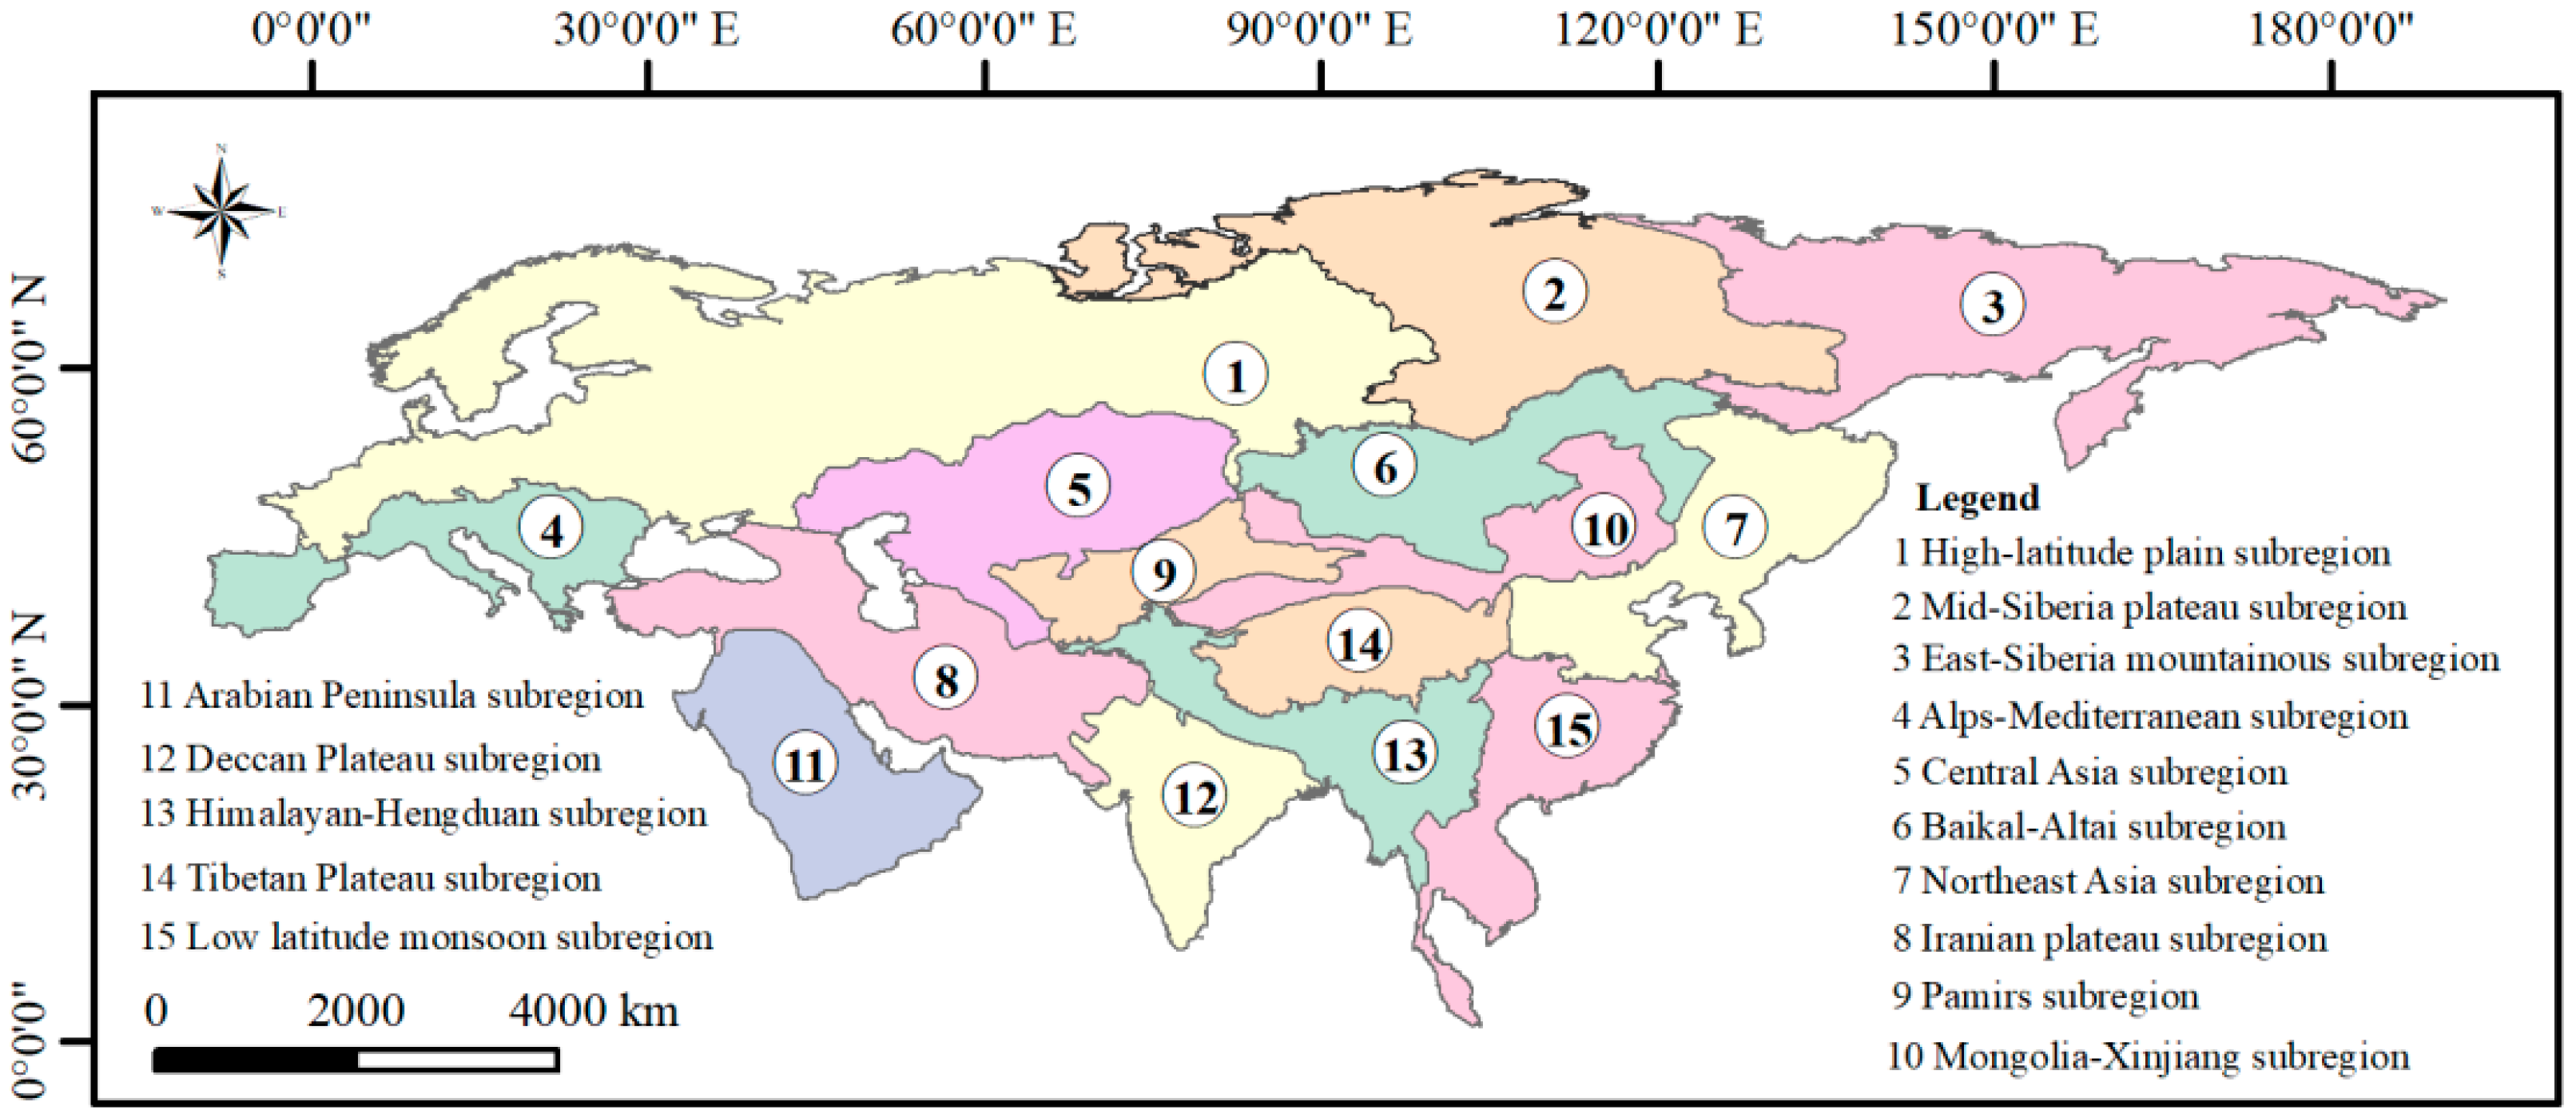
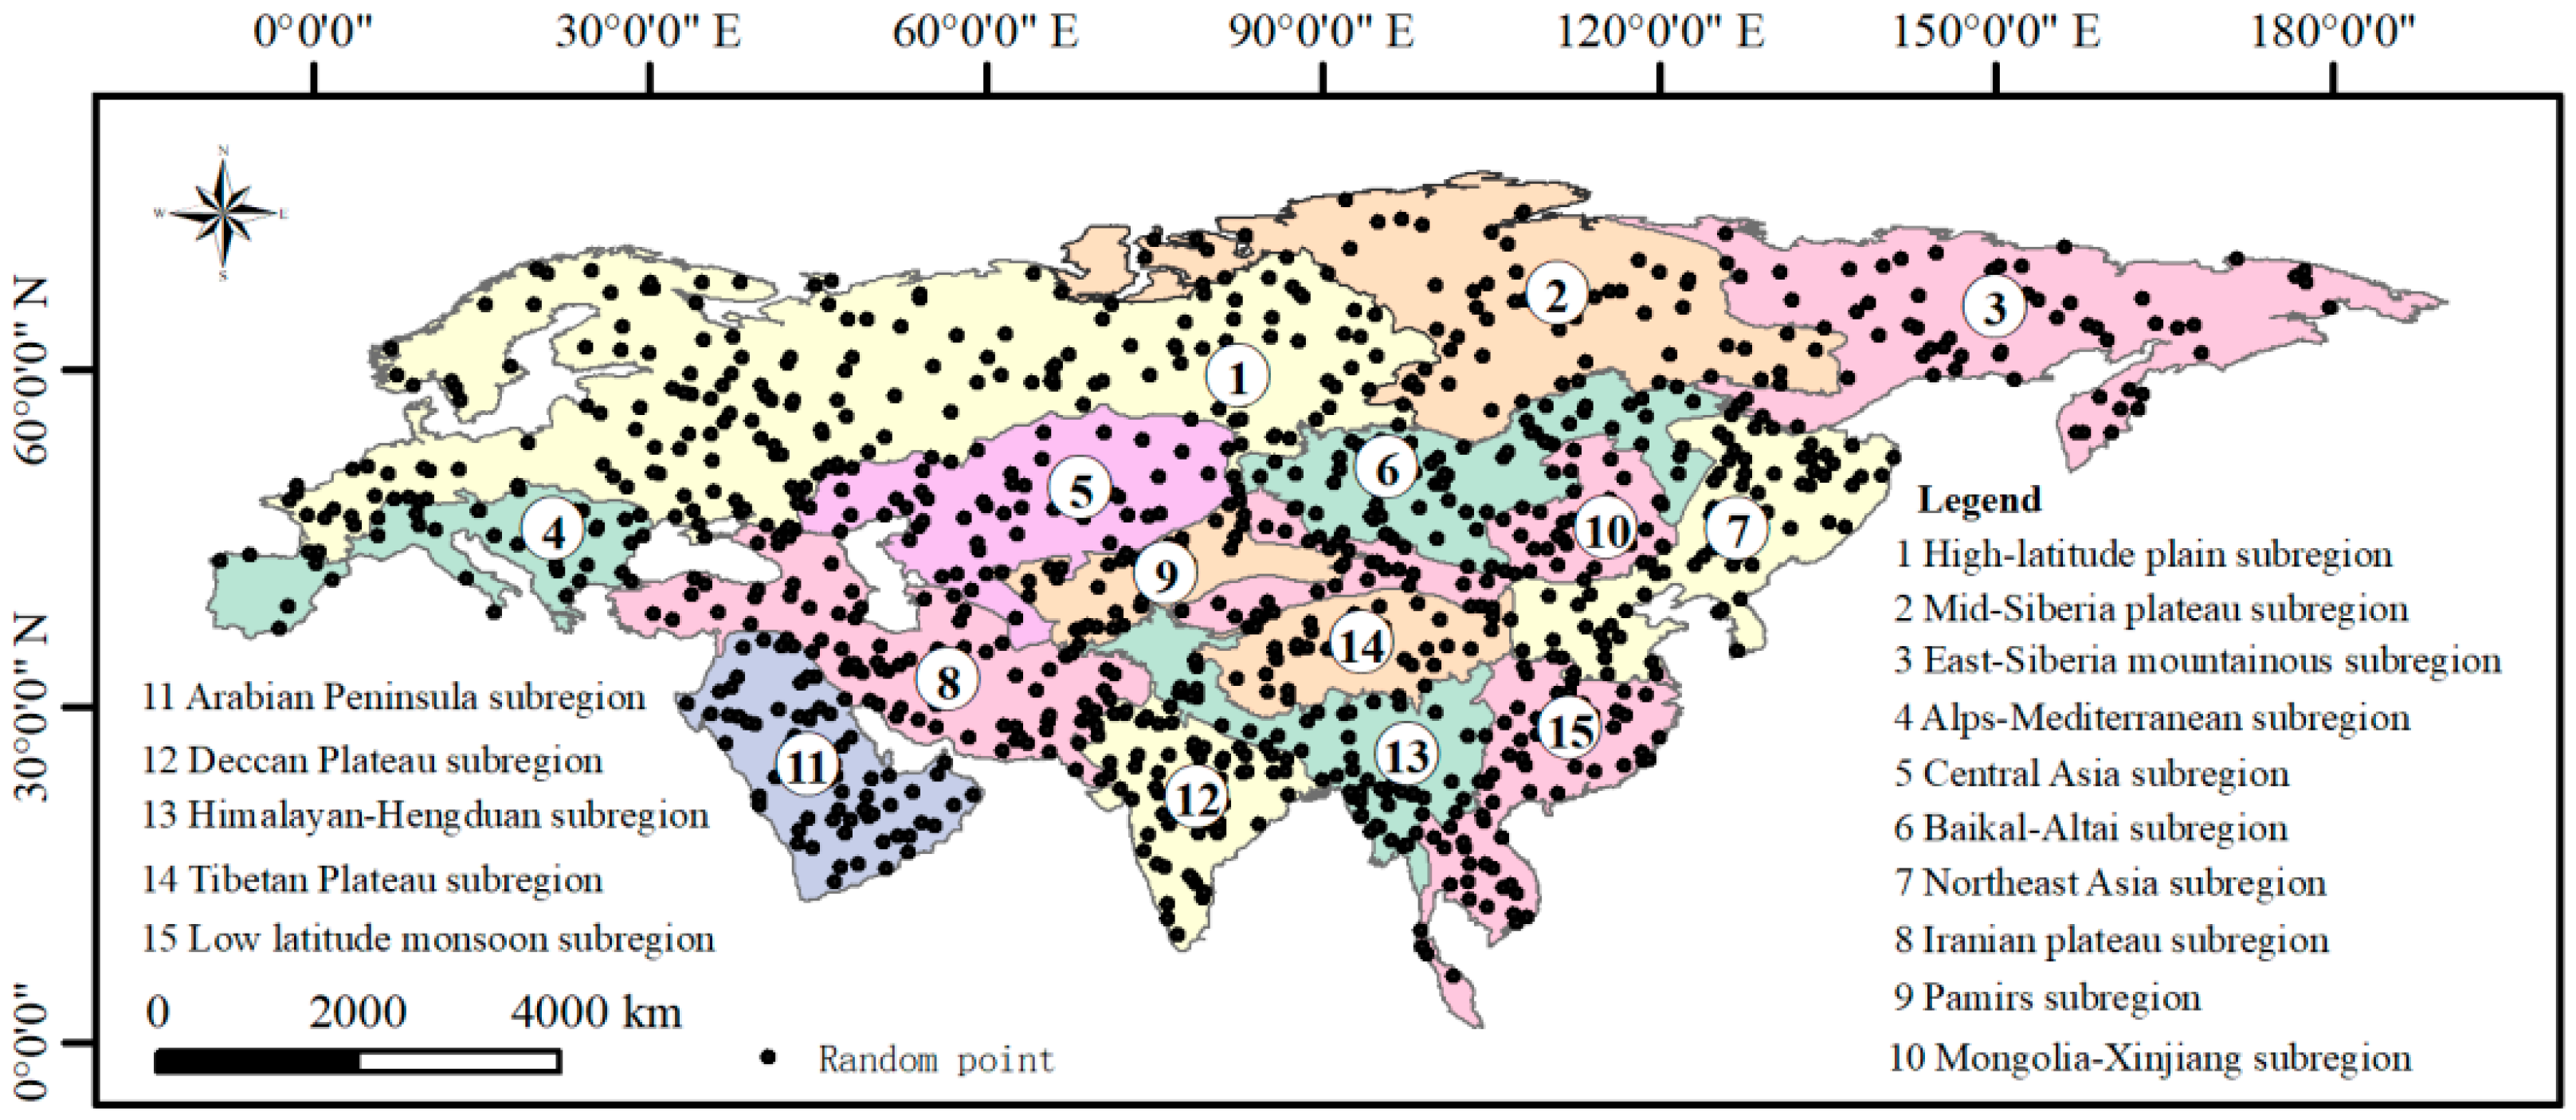
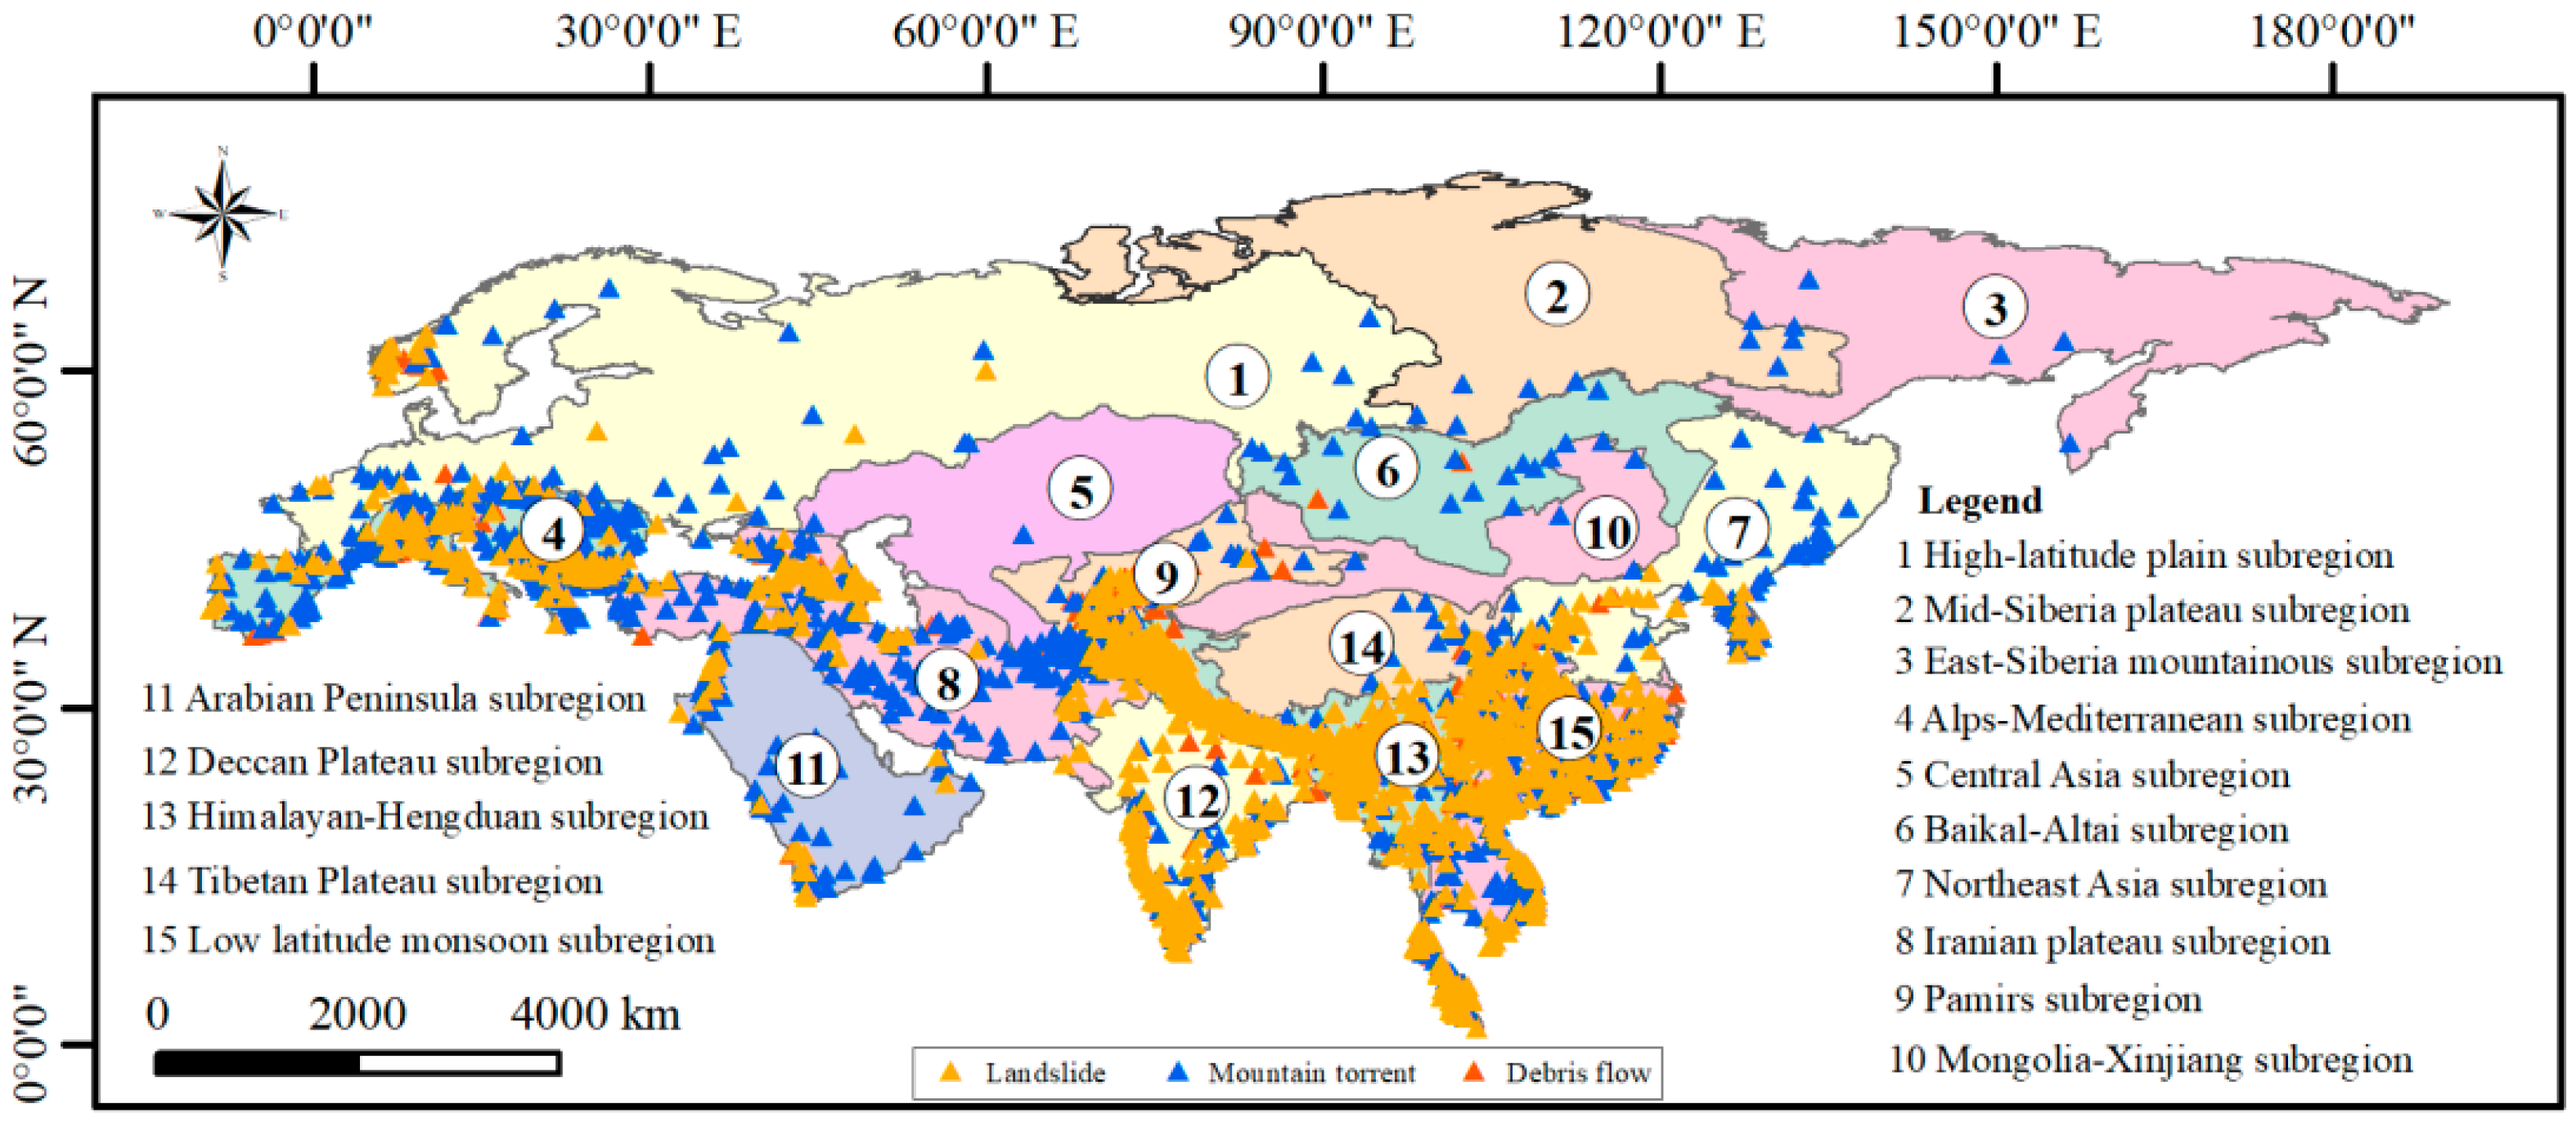
3.1. Study Area

Continents are understood to be large, continuous, discrete masses of land, ideally separated by expanses of water. The continental Eurasia is the largest mainland of the world (Figure 2). There are rich and diverse climate types, high-relief mountains and complex geological environments. According to the Köppen climate classification improved by Peel et al. [38], the Eurasian continent, benefitting from its wide hinterland and huge terrain elevation difference, has 29 climate types, almost including all climate types in the Köppen climate classification system. According to the calculation and statistics, mountain areas (including hills and mountains) account for 57% of the total area of the continental Eurasia. The high value of topographic relief is mainly distributed in the Alps, the Himalayas, the Hengduan, and the Sayan mountains, which may provide the transformation conditions from potential energy to kinetic energy for the developing of mountain hazards. Using PGA data from the Global Seismic Hazard Map, which is the result of Global Seismic Hazard Assessment Program (GSHAP) [39], to analyze the seismicity characteristics of the continental Eurasia, it could be found that the high value of PGA is mainly located near the Alpine–Himalayan seismic region, and also has some high value distributions in the Pamir Plateau, Lake Baikal of Russia and Kamchatka Peninsula. The PGA values above 0.4 m/s2 (corresponding to seismic intensity above 9 degrees, having serious damage to buildings and natural environments) account for 51.09% of the whole region. The complexity of the mountain-hazards developing environments of the Eurasian continent provides conditions for the study of hazards-developing environment regionalization work, and could provide reference for similar work in other regions.

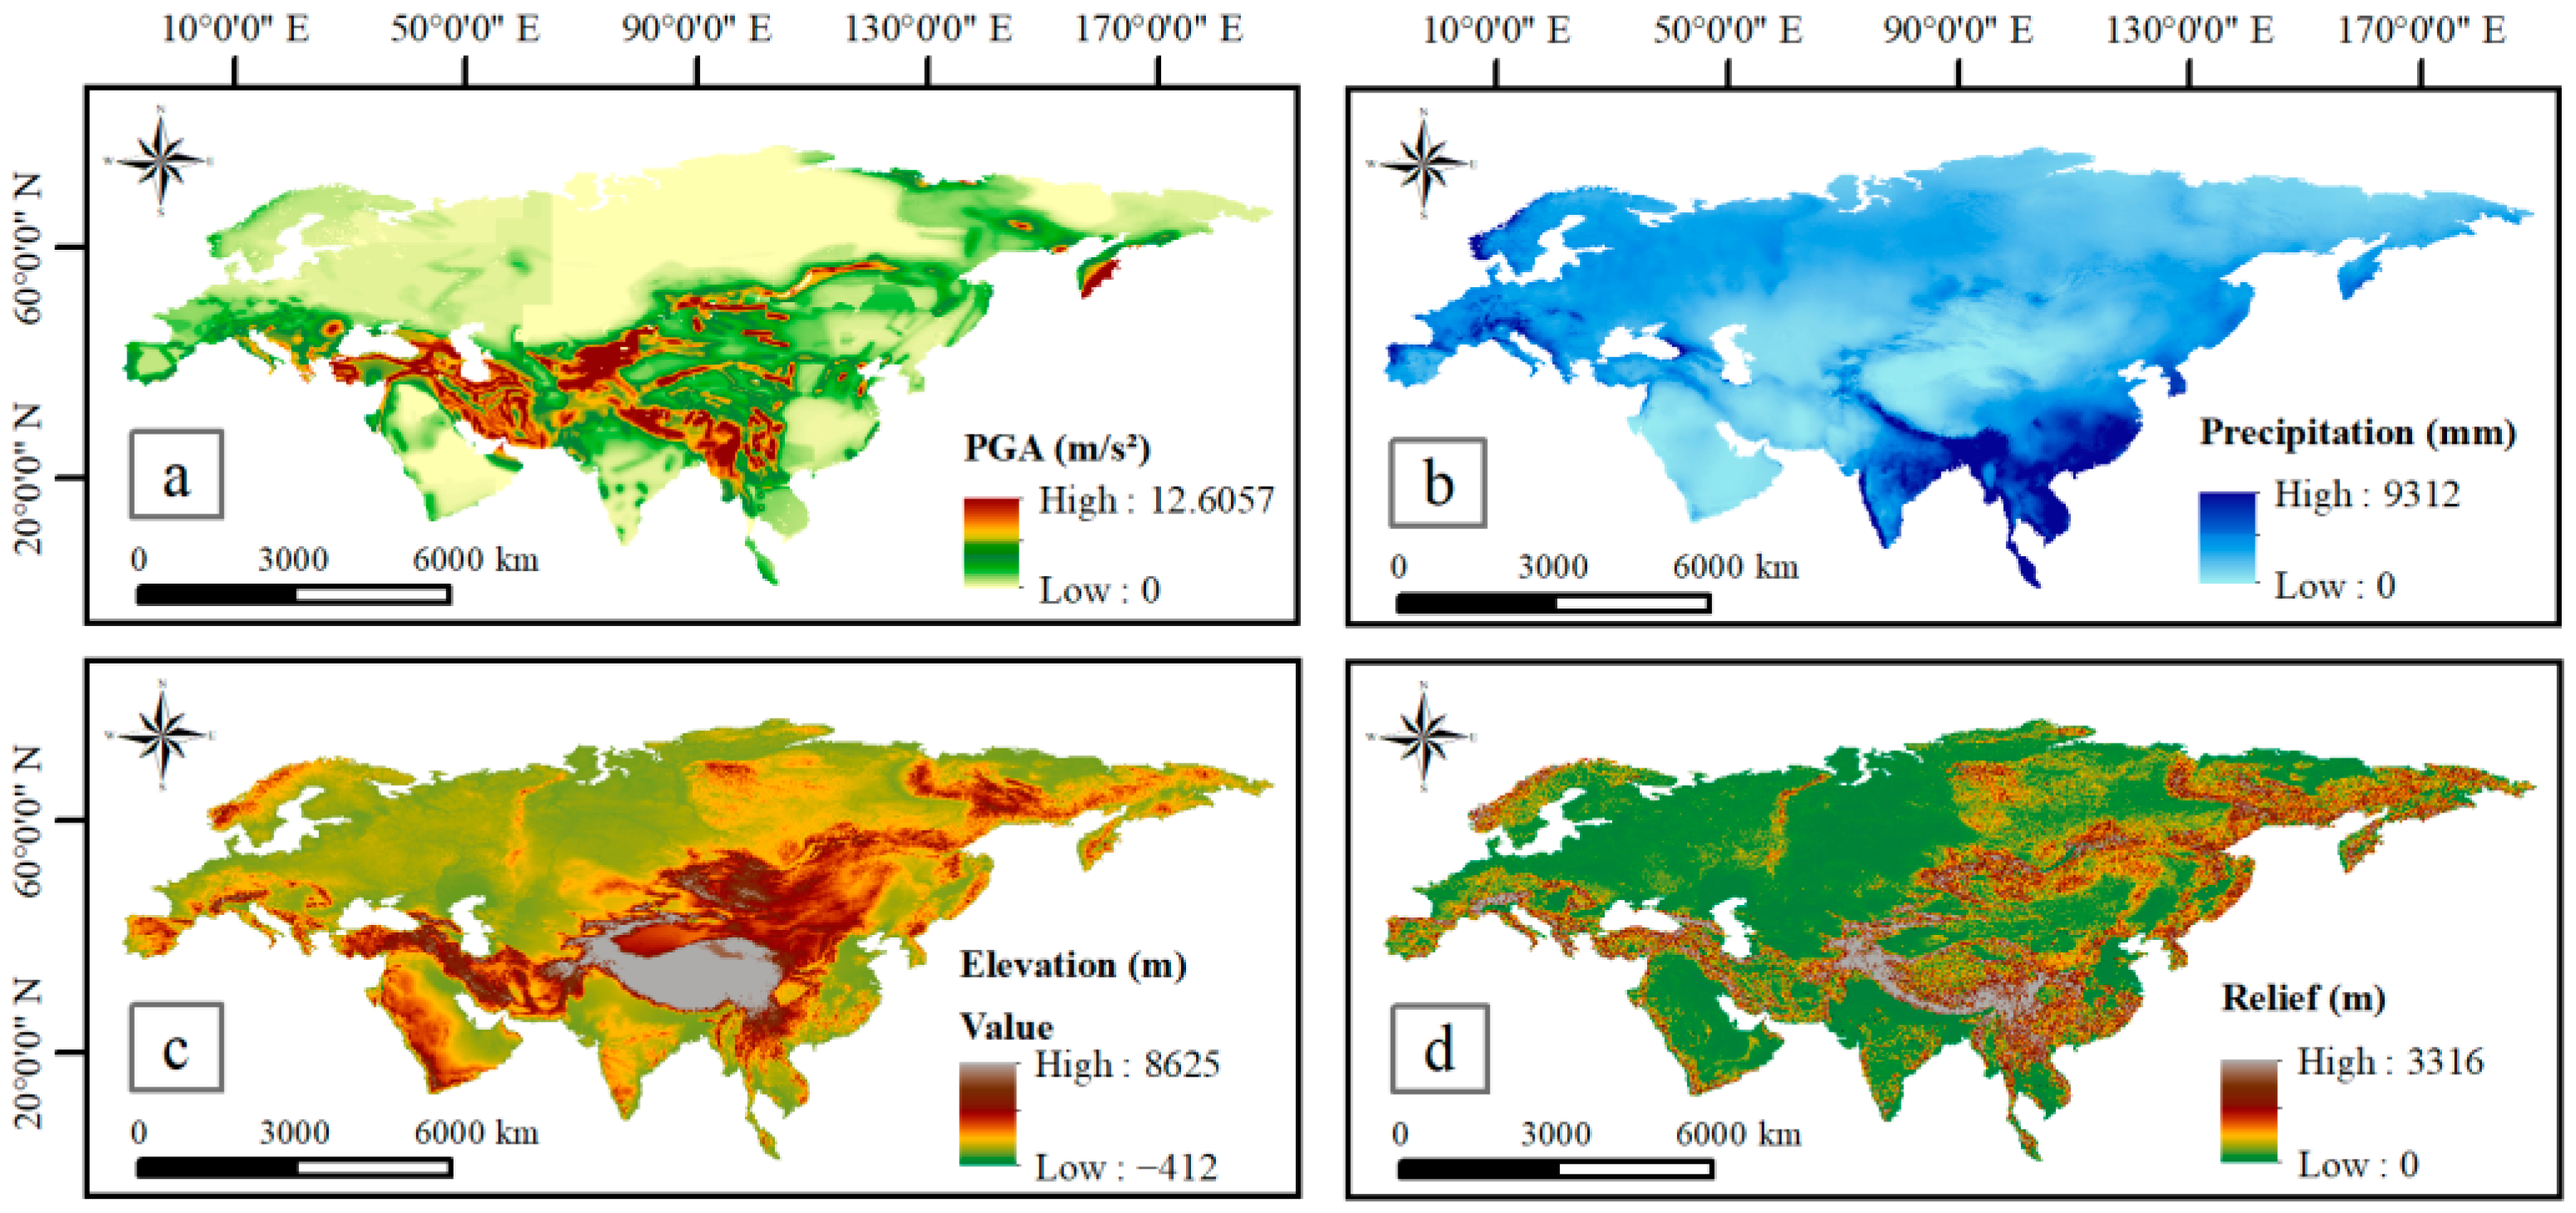
3.2. Representative Significance of PPR on Mountain-Hazards Developing Environments

For the mountain-hazards developing environments in large regions, if just selecting three concrete indicators to characterize geological, geomorphic and climatic factors, the peak ground acceleration (PGA), annual average precipitation and topographic relief (known as PPR factors) could be chosen as the three main factors which are well representative:
(1)
Peak ground acceleration (PGA) represents the intensity of seismic activities and is an important index to measure the intensity of seismic actions [40]. Seismic activities can make rock and soil produce cracks and even faults, which can create conditions for the developing of mountain-hazards [41,42]. For geological factors, PGA, which represents the strength of seismic activity, may be more representative than other related indicators, such as lithology, faults, rock strength, distance from faults and etc.
(2)
Temperature and precipitation are two elements that reflect the characteristics of the climate [43]. For mountain hazards, precipitation could provide water conditions for the developing of mountain hazards [44]. The formation of hazards-developing environments is the result of the interaction of geographical elements over a long time. With the impact of precipitation on hazards-developing environments on a long-time scale, its effect on vegetation growth and soil development could be better explained [45,46]. Based on the above considerations, the annual average precipitation was selected to characterize the impact of climate factors on the formation of hazards-developing environments of mountain hazards.
(3)
The most important role of geomorphic factors in the formation of hazards-developing environments of mountain hazards is to provide potential energy conditions for the developing of mountain hazards (such as absolute height) and the transformation conditions from potential energy to kinetic energy (such as slope or topographic relief). In contrast, the transformation condition from potential energy to kinetic energy is particularly important for the developing of mountain hazards [47,48]. For this condition, topographic relief emphasizes the difference between the highest and lowest altitude in a certain area, which can reflect the characteristics of elevation change [49]. Compared with the slope emphasizing the steepness and flatness of the ground at a certain point, topographic relief can better show the regional characteristics of the landform, so it may be more suitable to be selected as a representative indicator to reflect the geomorphic elements of the hazards-developing environments.

3.3. Materials

3.3.1. PGA Data

In this research, PGA data come from the global seismic hazard map, which is the research result of the global seismic hazard assessment program (GSHAP) [50,51] (http://gmo.gfz-potsdam.de/pub/data_details/data_details_frame.html, accessed on 13 November 2019). It provides a description of seismic hazard based on peak ground acceleration (PGA, ms−2) with a 50-year exceedance probability of 10% (475-year return period) [52]. The data are provided in the form of grid, with a numerical range of 0~12.6057 m/s2 and a grid resolution of 0.1° (equivalent to 11 km near the equator). In order to unify the resolution of PPR indicators, 0.1° resolution PGA was interpolated into 30″ resolution data (roughly equivalent to 1 km near the equator, Figure 3a) in later data analysis.

3.3.2. Annual Average Precipitation

The annual average precipitation data come from WorldClim website [53] (https://www.worldclim.org/data/index.html, accessed on 13 November 2019). The data provided by the website involve various data types, such as temperature, precipitation, solar radiation, wind speed and water vapor pressure. It can provide grid data with different resolutions and sizes, which is widely used in the needs of large-scale regional mapping and spatial simulation. In this study, the monthly average precipitation data with grid resolution of 30″ were selected. By accumulating the monthly precipitation data, the annual average precipitation data were obtained, and the value range is 0~9312 mm (Figure 3b).

3.3.3. Elevation

GMTED2010 is a kind of global multi-resolution terrain elevation data [54] (https://topotools.cr.usgs.gov/gmted_viewer/, accessed on 13 November 2019). This data product could provide three resolution data (30″, 15″ and 7.5″). The corresponding pixel sizes near the equator are about 1000 m, 500 m and 250 m. Referring to the resolution of other data sources in this study, this study selected the 30″ resolution grid data of GMTED2010 as the DEM elevation data source (Figure 3c). Considering that the landslide hazards occur on the slope, the mountain torrents and debris flows generally develop in the small valleys or watersheds, and they are more dependent on the topographic height difference in a small area. Therefore, when calculating the topographic relief, 3 km × 3 km was taken as the neighborhood statistical range by using the ArcGIS focus statistics tool under the equal area projection coordinate system. The maximum and minimum values within the neighborhood range were calculated, and the two values were subtracted to obtain the topographic relief grid data, which were converted into 30″ resolution geographic coordinate grid data and displayed in ArcGIS, as shown in Figure 3d.

4. Methods

4.1. Data Standardization

The min-max standardization [55] is a linear transformation of the original data so that the original data are mapped between [0–1].
  y i = x i x m i n x m a x x m i n
where yi is a new value after standardization, xi is the original value, xmax is the maximum value of original values, and xmin is the minimum value of original values.

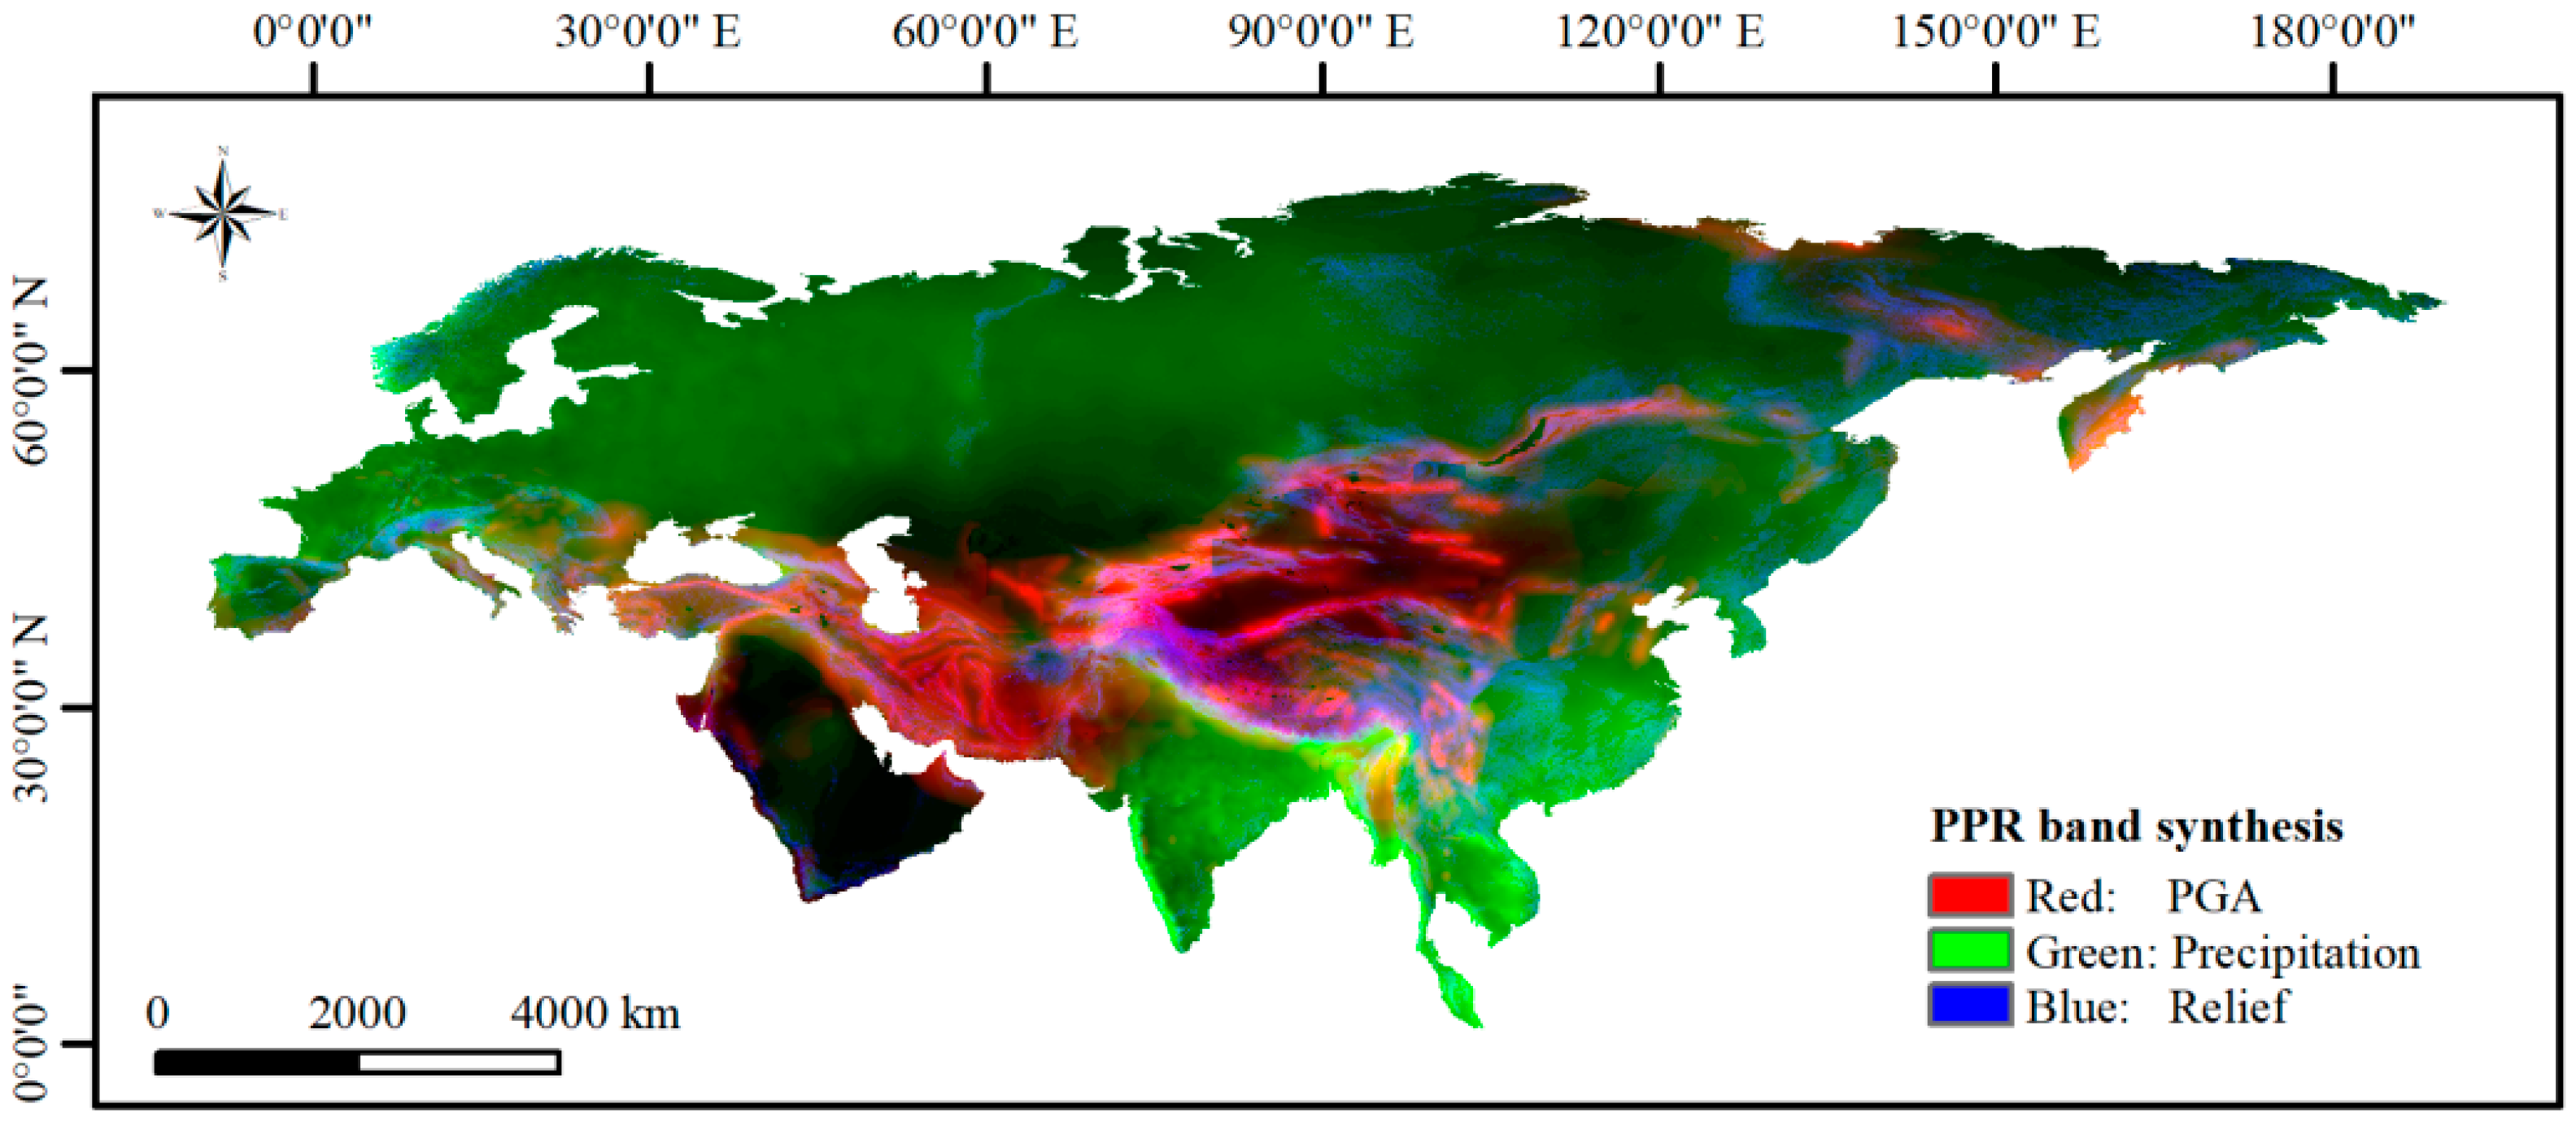
4.2. Geospatial Data Band Synthesis

The operation of creating a single raster dataset with multiple bands is called band synthesis. Band synthesis is often used in remote sensing image data processing. Typically, each data band in the received satellite data is contained in a separate file. For example, using band1, band2 and band3 to render these raster datasets together to create a color composite, we need to synthesize bands into a separate raster dataset. At present, referring to the band synthesis operation of remote sensing images, relevant researchers have been also trying to synthesize different geospatial grid data to obtain multi-dimensional geospatial data [56].

4.3. Spatial Clustering Algorithm ISODATA

Spatial clustering algorithm is a computer algorithm for automatic classification according to the agglomeration and discrete states of sample points in multi-dimensional space. Each spatial unit in the study area has n-dimensional characteristics, and each dimension carries a certain value of attribute information. Therefore, each spatial unit would correspond to a point in the N-dimensional space. The principle of spatial clustering method is to classify them according to certain mathematical statistical methods, so that the differences between individuals in the same group are as small as possible, while the differences between individuals in different groups are as large as possible so as to determine the spatial distribution law and pattern of the sample set.
The iterative self-organizing data analysis algorithm (ISODATA) is a clustering algorithm that adds two operations of “merging” and “splitting” to the classification process on the basis of K-means algorithm and controls these two operations by setting parameters. When the number of clustering centers is unknown, the ISODATA algorithm is recommended. The basic idea of the algorithm is as follows:
Firstly, some initial values are selected as the clustering centers, and the pixels to be classified are allocated according to the index;
Calculate the distance of various ground objects in the sample;
The cluster group splits and merges to form a new cluster center;
Continue to iterate and recalculate, then end the operation when the result converges. At present, this method has many applications in remote sensing image classification, image retrieval, voice conversion, multi-agent task allocation and other fields [57,58,59,60]. The method is also relatively mature.

4.4. Spatial Stratified Heterogeneity Analysis Using Geodetector

Spatial stratified heterogeneity is the spatial representation of socio-economic processes and natural phenomena. It refers to a geographical phenomenon in which the variance within an attribute value layer (statistical concept, corresponding to a geographical class or sub-region) is less than the variance between layers. For example, there are differences between different types or regions, such as land use map, climatic regionalization, ecological regionalization, geographical regionalization, etc. The geographic detector proposed by Wang et al. [61] is a new statistical method to detect the influencing factors of geographic events by measuring the similarity between independent variables and dependent variables, and then reveal the driving force behind them. In this tool, q statistics can be used to identify, test, find and attribute. The value range of q is from 0 to 1. The larger the value of q is, the stronger the ability of independent variable x could explain the spatial differentiation of attribute Y. When the value of q is 1, it indicates that factor X completely controls the spatial distribution of Y, and a value of 0 indicates that there is no relationship between them. The q value between 0 and 1 indicates that X explains the spatial stratified heterogeneity of q ∗ 100%. Nowadays, geodetector was applied to solve problems with spatial stratified heterogeneity in many fields, such as land use, climate boundary and population pattern [62,63,64,65,66].

5. Results

5.1. Data Standardization and PPR Band Synthesis

We first selected the min-max standardization method to normalize the PPR data, and then multiplied them by 255 to generate grids with gray value of 0~255, which were transformed into integer grid data, and used 8 bits for data storage so as to complete the data standardization processing. Although the original data were scaled in the standardization process, they are still consistent with the original data in the expression of the relative size of the data. At the same time, they realize the dimensionless of the data, which is conducive to the transmission and use of the data. Referring to the data-management method of remote sensing image grid dataset, the three grid layers of PPR were synthesized to generate the “three-dimensional geo-information space” grid dataset. We used the remote-sensing grid dataset for geographic data management and visualization [56,67,68]. After the band synthesis operation of the above data, it can express the combination information of hazards-developing environments using the pseudocolor display (Figure 4).

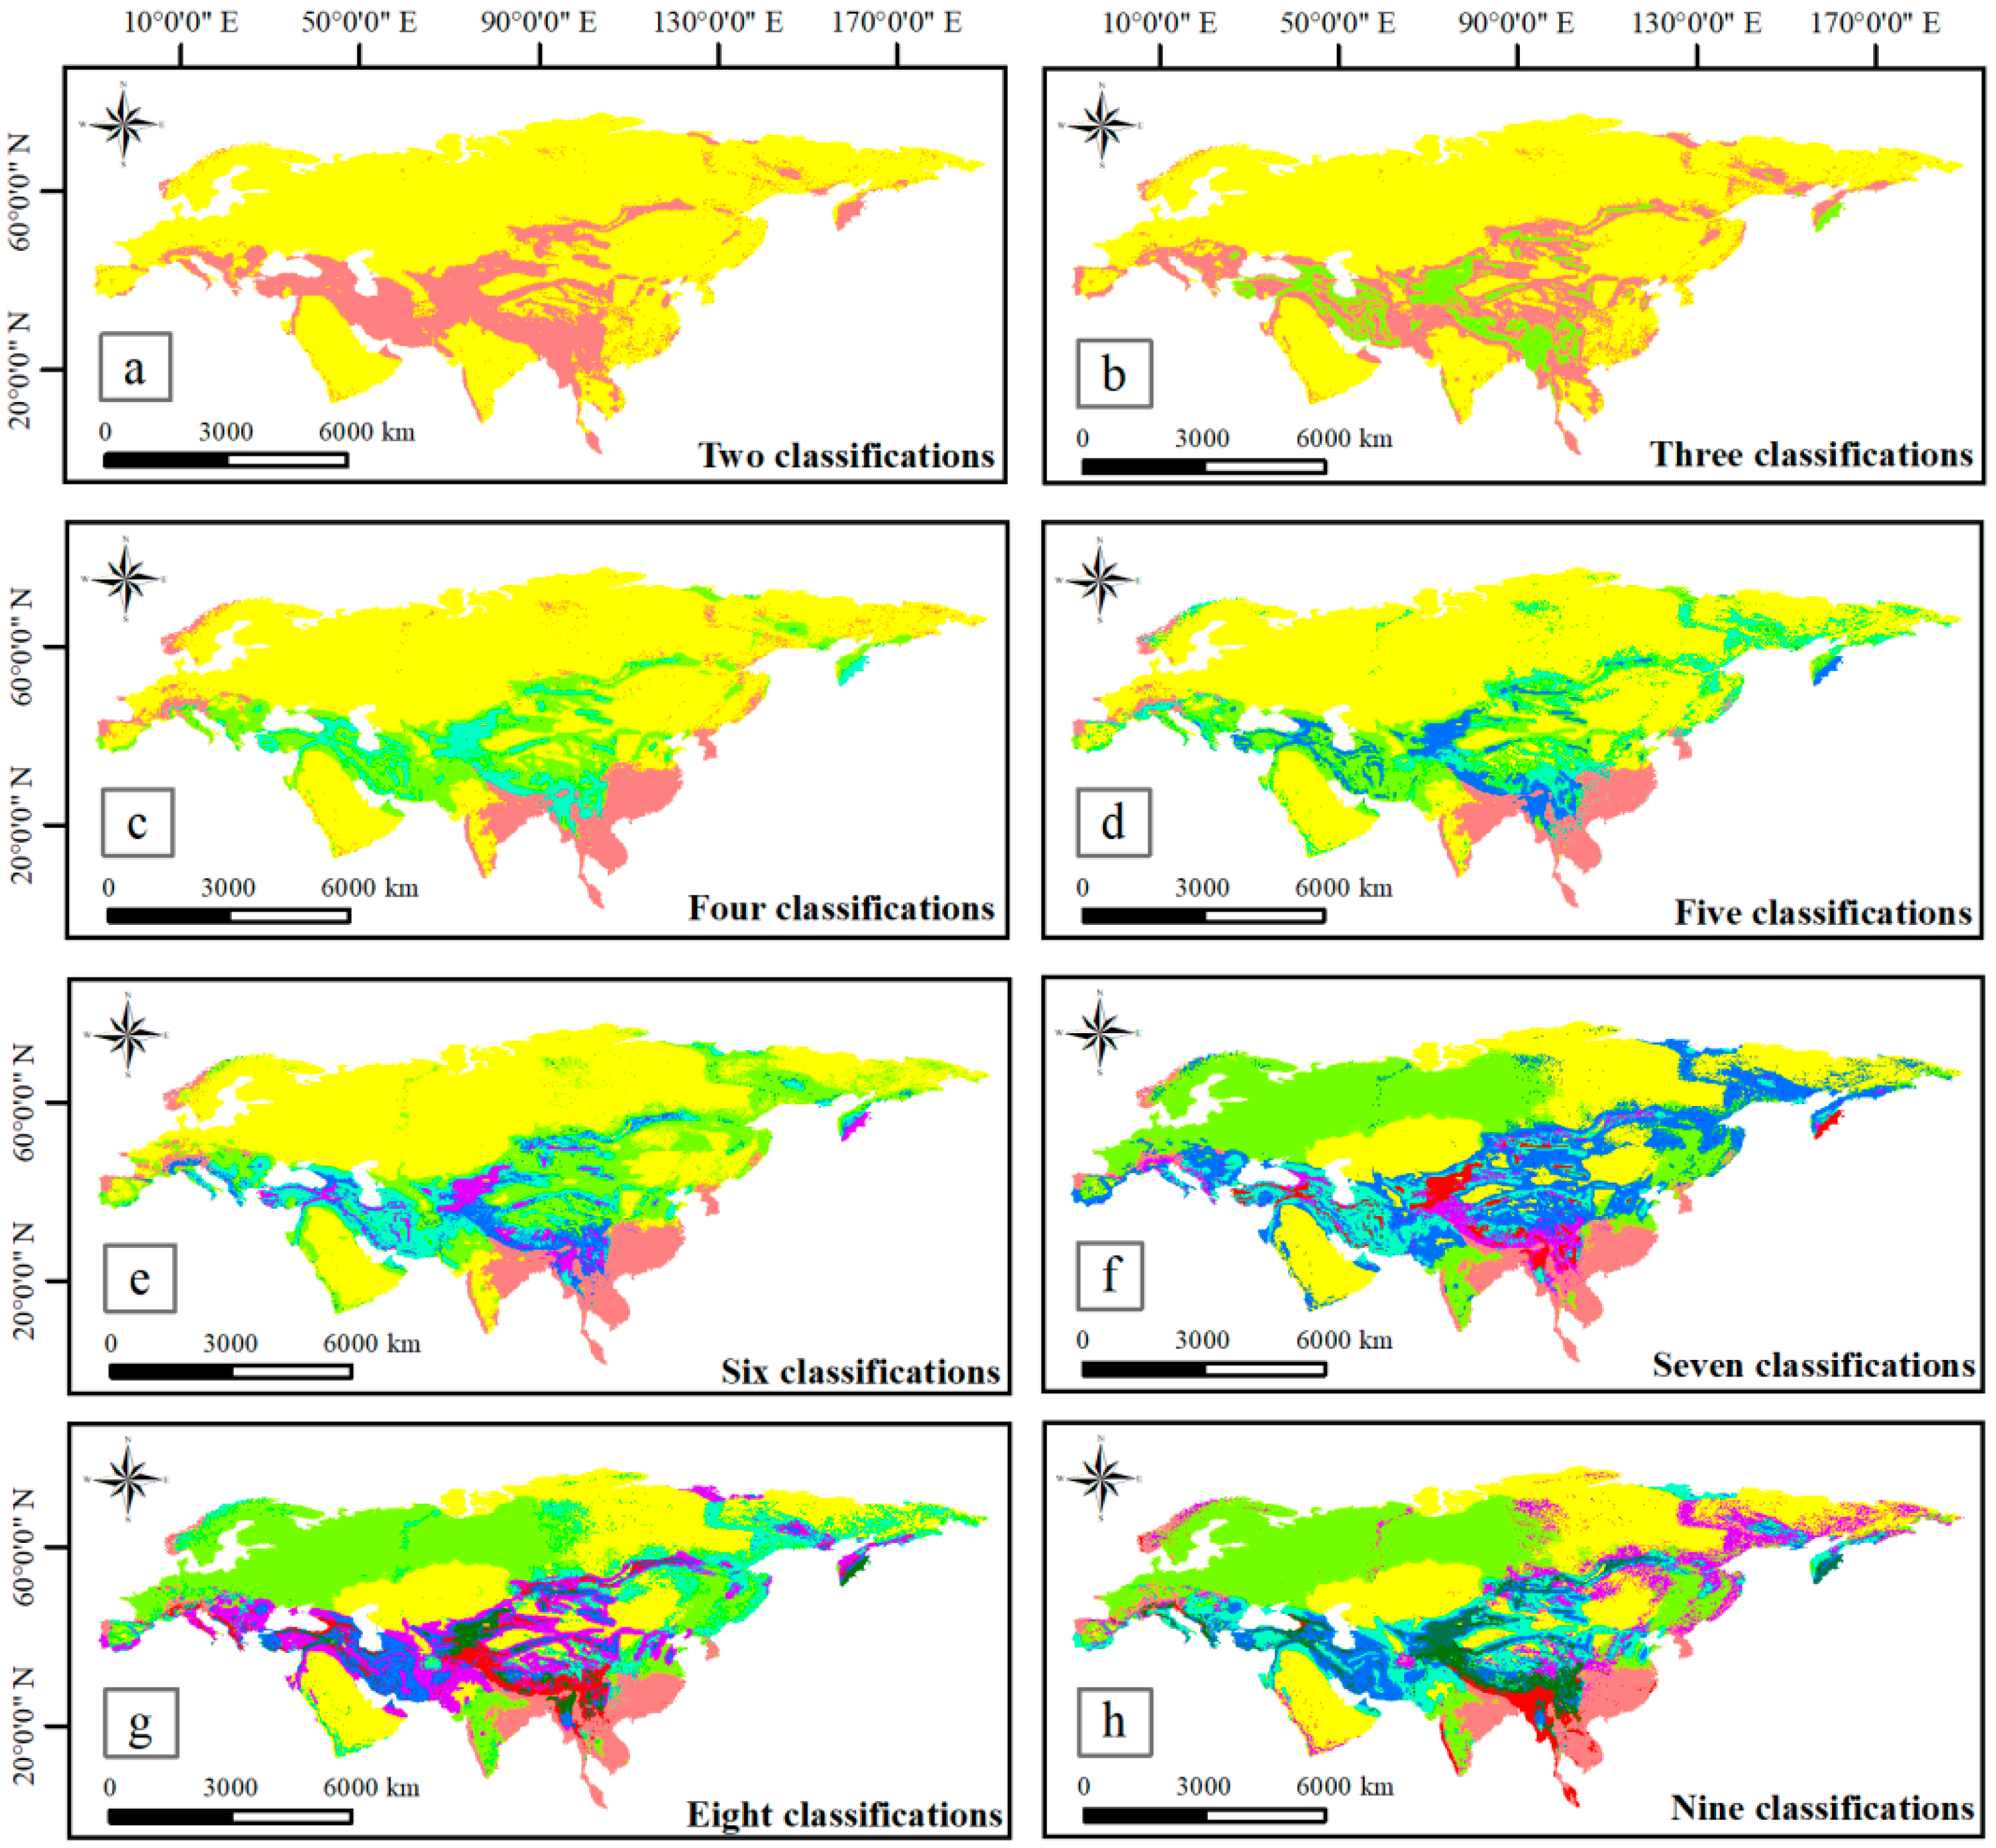
5.2. PPR Automatic Classification of 3D Geo-Information Spatial Data

If the spatial data of multi-dimensional geo-information are stored and managed in the form of multi-band remote sensing images, the relevant image-processing methods could be used to process these data [56]. Using the ISODATA (iterative self-organizing data analysis) algorithm, the spatial clustering unsupervised automatic classification processing was carried out for the three-dimensional geo-information spatial grid dataset (PPR grid dataset) composed of standardized PGA, annual average precipitation and topographic relief. In the process of data processing, it could be found that the number of classifications could affect the classification results.
As shown in Figure 5, when the number of classifications is set to 2, the method first generates two categories with the greatest difference. Compared with the original PPR data, it could be found that the PGA regional difference is more distinguished when two categories were classified. With the increase in classification number, patches become more fragmented and diversified, which is similar to remote sensing image classification progresses. When nine categories were classified, the classification of complex regions was more diverse and complex. For example, the Qinghai Tibet Plateau and pan-third-pole region are obviously more complex than that of Southern China, indicating the complexity of the PPR feature combination of the Qinghai-Tibet Plateau and the pan-third-pole region.

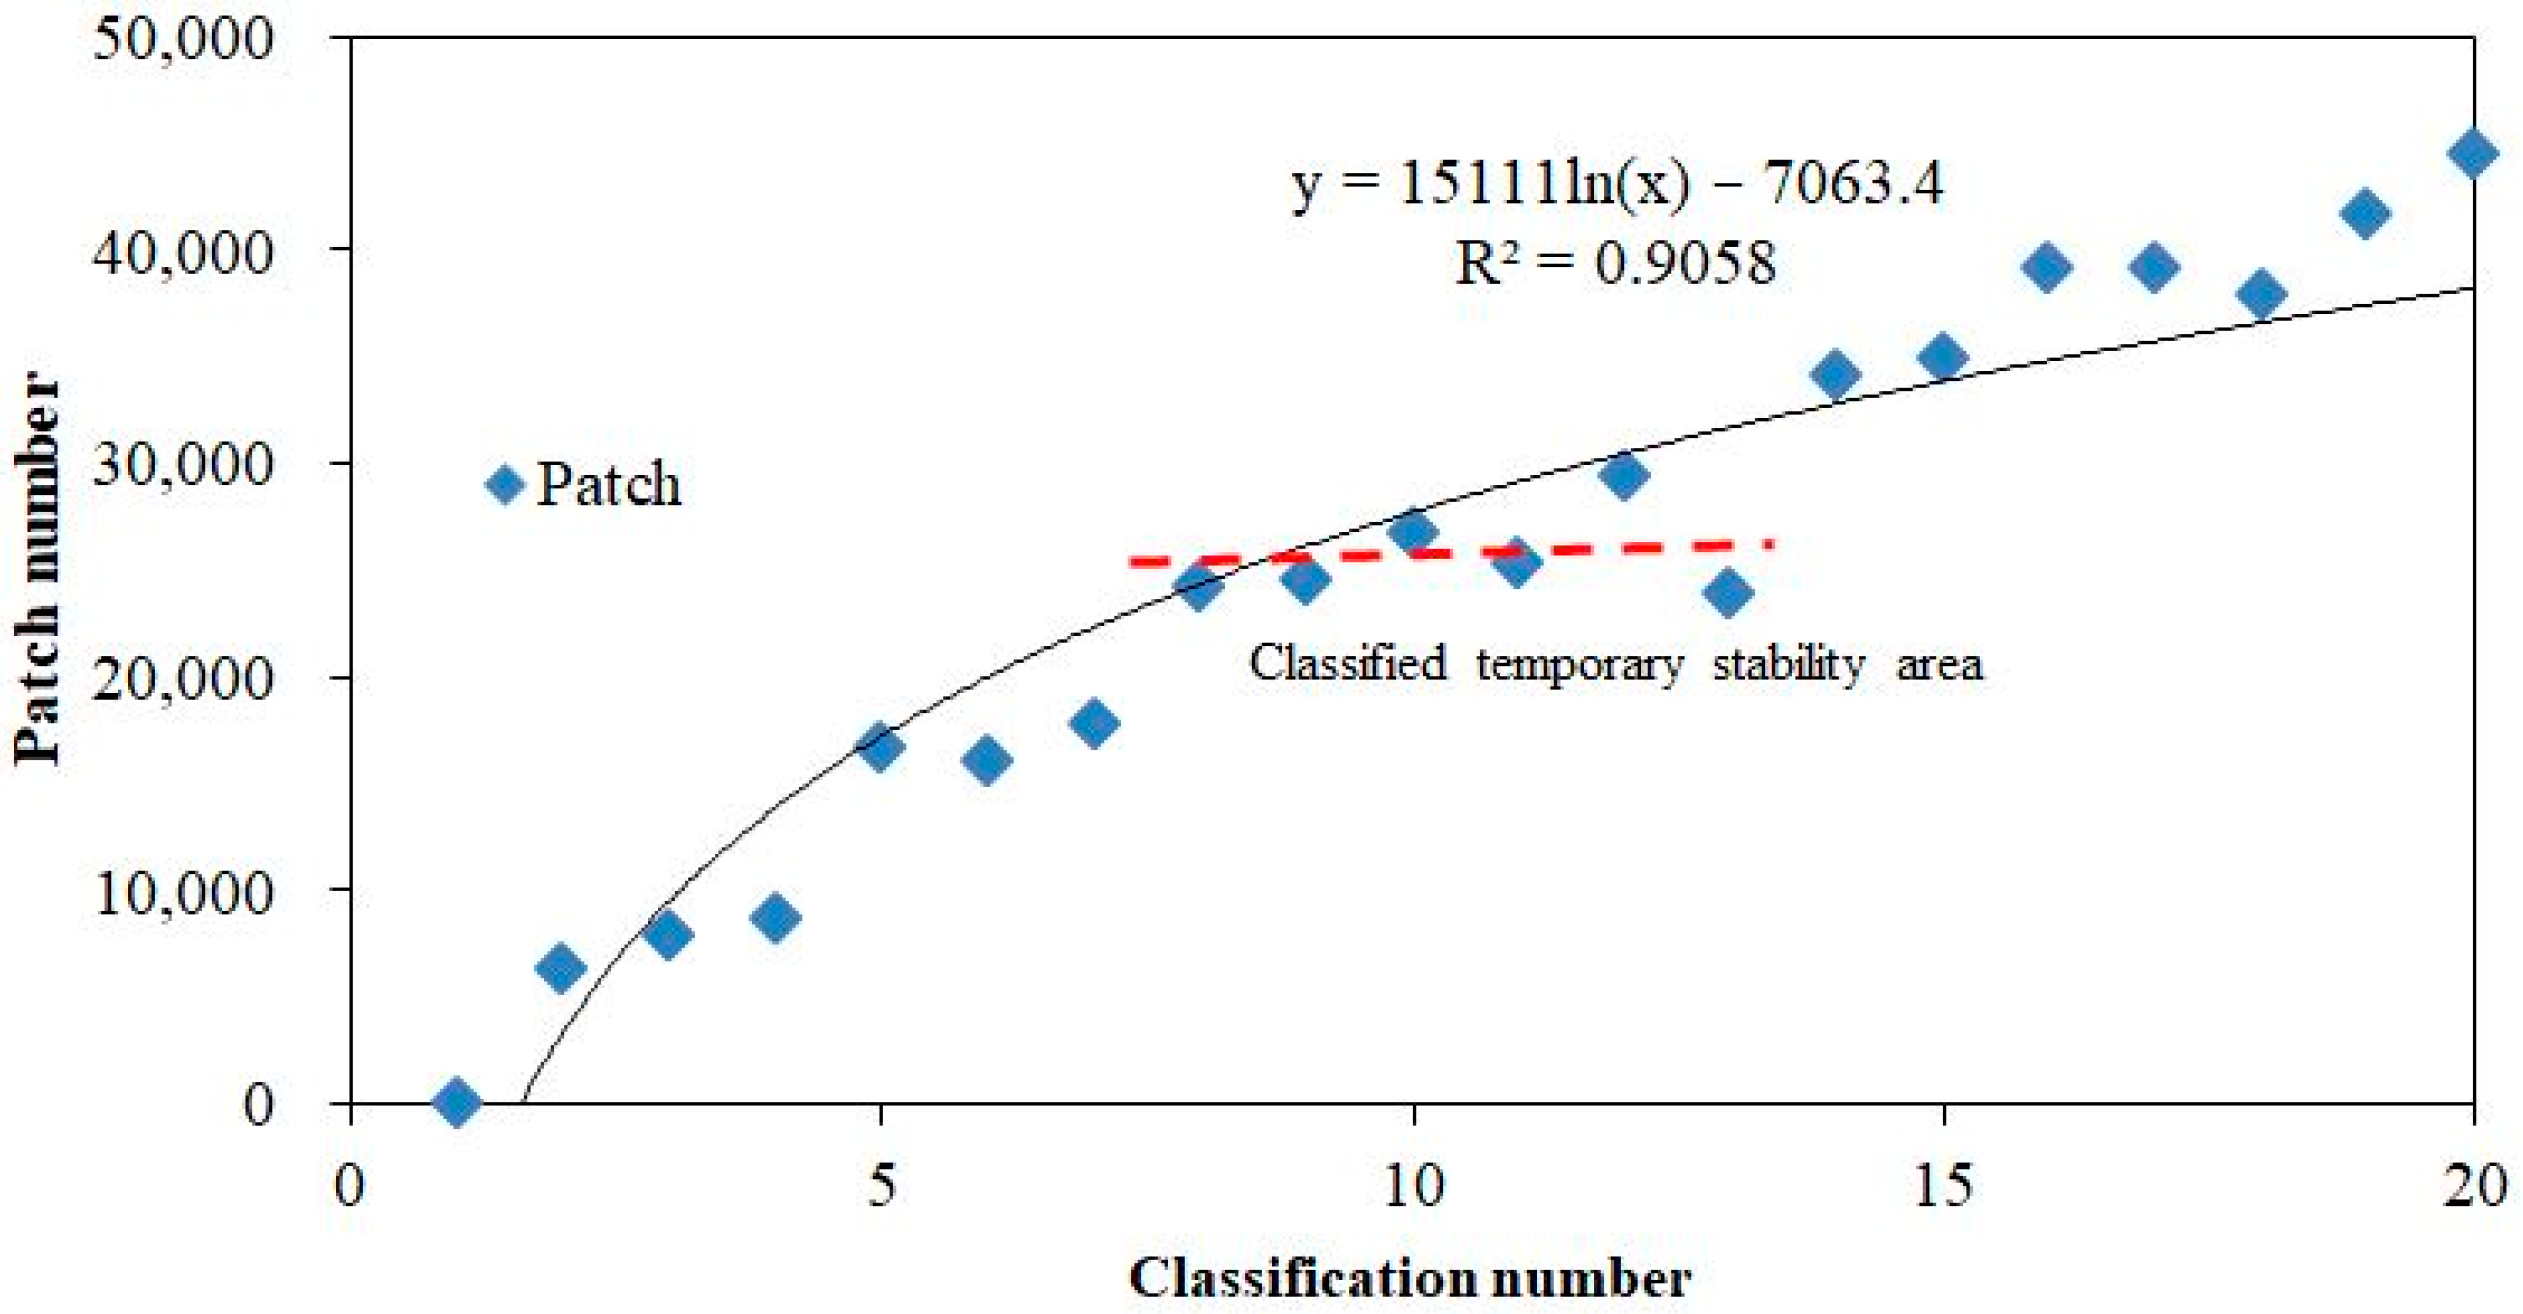
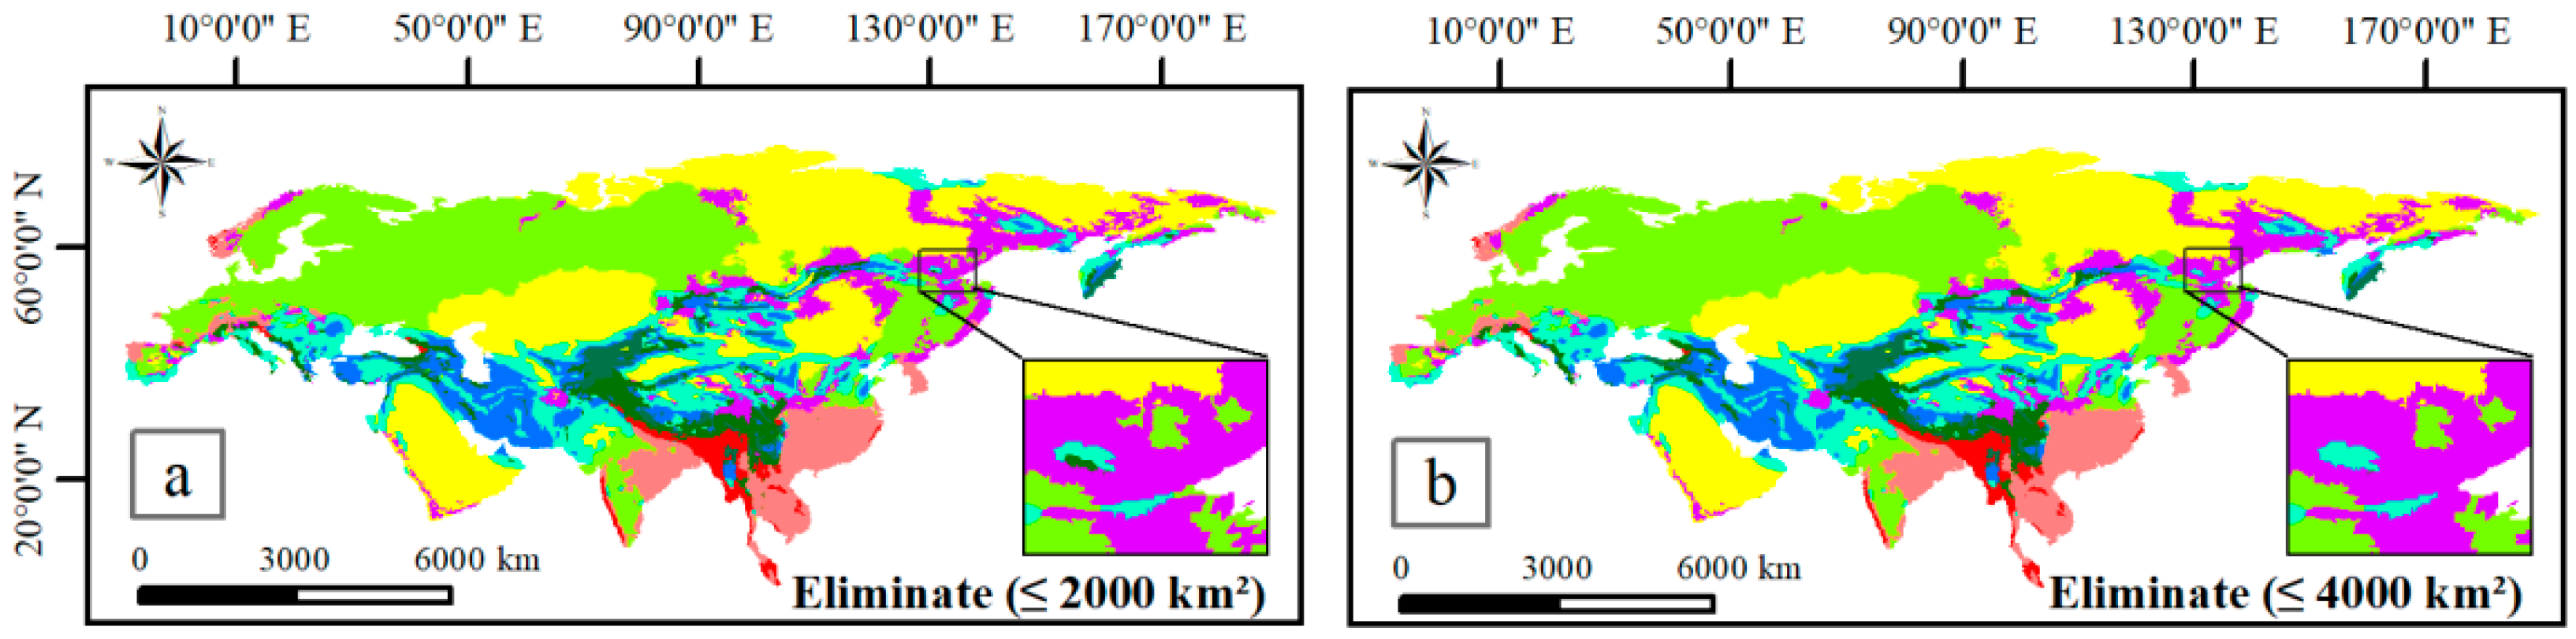
5.3. Cartographic Generalization and Regionalization Results

Cartographic generalization in cartography emphasizes the use of general and abstract forms to reflect the regular type characteristics and discards the secondary features [69]. In order to make the results of PPR classification have more obvious regional characteristics and meet the needs of follow-up research, we intended to eliminate and merge the classified small spots in order to achieve the purpose of cartographic generalization. Which of the above classification results could be selected as the basis for cartographic generalization? It is mainly determined by observing the change of the number of patches in each classification result [70]. We found that the number of patches increased significantly with the increase in the number of PPR classifications, but the number of classified patches fluctuated up and down in the 8~13 classification stages, and the total number of patches in the classification results showed a temporary saturation state (Figure 6). Based on this phenomenon and considering the amount of data processing, the nine-classification result (Figure 5h) was selected for subsequent cartographic generalization processing.
By performing equal area projection transformation on the above nine-classification result and counting the patch area, it was found that the patch areas are significantly different, and the maximum difference between the maximum value and the minimum value can be more than six orders of magnitude (Figure 7a). After performing the local magnification, it was found that the area of most patches is less than 2000 km2, and there are still a large number of spots above 4000 km2 (Figure 7b). In order to merge as many small patches into large patches as possible, 4000 km2 was selected as the small patch elimination threshold, and the small patch elimination was automatically performed in ArcGIS 10 software, which is developed and maintained by the Esri company (Redlands, CA, USA).
The following figures show the results of patch elimination of the PPR nine-classification result with different thresholds (2000 km2 and 4000 km2). Although different thresholds were used for patch elimination, because the threshold is smaller than the whole large area, the large blocks still maintain consistency and integrity (Figure 8).
After the automatic elimination of small patches, the classification result (Figure 9) was combined manually. Considering the nine-classification result of PPR data, geomorphic classification data [71] and the integrity of natural geographical units, the small patches were merged into the surrounding large blocks one by one. The regional integrity and the geo-information similarity of the combined patches were maintained as far as possible. Finally, 15 PPR subregions were demarcated (Figure 9). The difference of hazard-developing environments in one region is relatively small, which can make the susceptibility, hazard and risk assessment model construction work more targeted and scientific.

5.4. Analysis on the Ability of Hazards-Developing Environment Regionalization to Explain the Spatial Stratified Heterogeneity of PPR Factors

The purpose of mountain-hazards developing environment regionalization is to minimize the difference of hazards-developing environments in the area and highlight the difference of hazards-developing environments in different regions. The hazards-developing environment regionalization conducted in this research is based on the classification of the combined characteristics of PPR data, so the advantages and disadvantages of the regionalization results can be judged by exploring the interpretation ability to PGA, annual precipitation and topographic relief.
If the spatial stratified heterogeneity interpretation ability is strong, it proves that the regionalization results take into account the regional characteristics of the three; if the interpretation ability is weak, it shows that the regionalization results do not show the regional characteristics of the three factors well. Therefore, we selected the geodetector tool [61] introduced in the research method to detect the interpretation ability of the regionalization results to the stratified heterogeneity of PPR factors. Since increasing the density of sampling points can improve the accuracy of the calculation results [61], after performing the equal area projection of the Eurasian continent research area, the random point amount was set to 20,000, and 19,825 effective points were obtained after removing the invalid points on the boundary. Taking the PPR regionalization type quantity as the independent variable X, and PGA, annual average rainfall and topographic relief as the dependent variable Y, respectively, we calculated the corresponding three q values, and analyzed the interpretation degree of the regionalization results to the PPR data according to the q value.
According to the calculation results, the regionalization results have the strongest interpretation for PGA, which can explain 61.43% of the PGA stratified heterogeneity characteristics, 58.38% for the annual average precipitation’s spatial stratified heterogeneity, and 30.31% for the topographic relief’s spatial stratified heterogeneity. The reason for the difference of q values is that PGA and annual rainfall have more obvious regional characteristics, better continuity of numerical distribution, smoother numerical transition of adjacent grids in space, and relatively simple spatial stratified heterogeneity. Therefore, the regionalization result has a better interpretation effect on their spatial stratified heterogeneity characteristics. Due to the continuous change in mountainous terrain, the transition between the values of adjacent grids is poor, which makes the regional continuity relatively weak. As a result, the spatial stratified heterogeneity of topographic relief is more complex. Therefore, the interpretation ability of the regionalization result is not as good as the first two factors. Combined with the q values of relevant literature, the PPR regionalization result has a strong ability to explain the spatial stratified heterogeneity characteristics of PGA, annual average precipitation and topographic relief, and has achieved the purpose of hazard-developing regionalization.

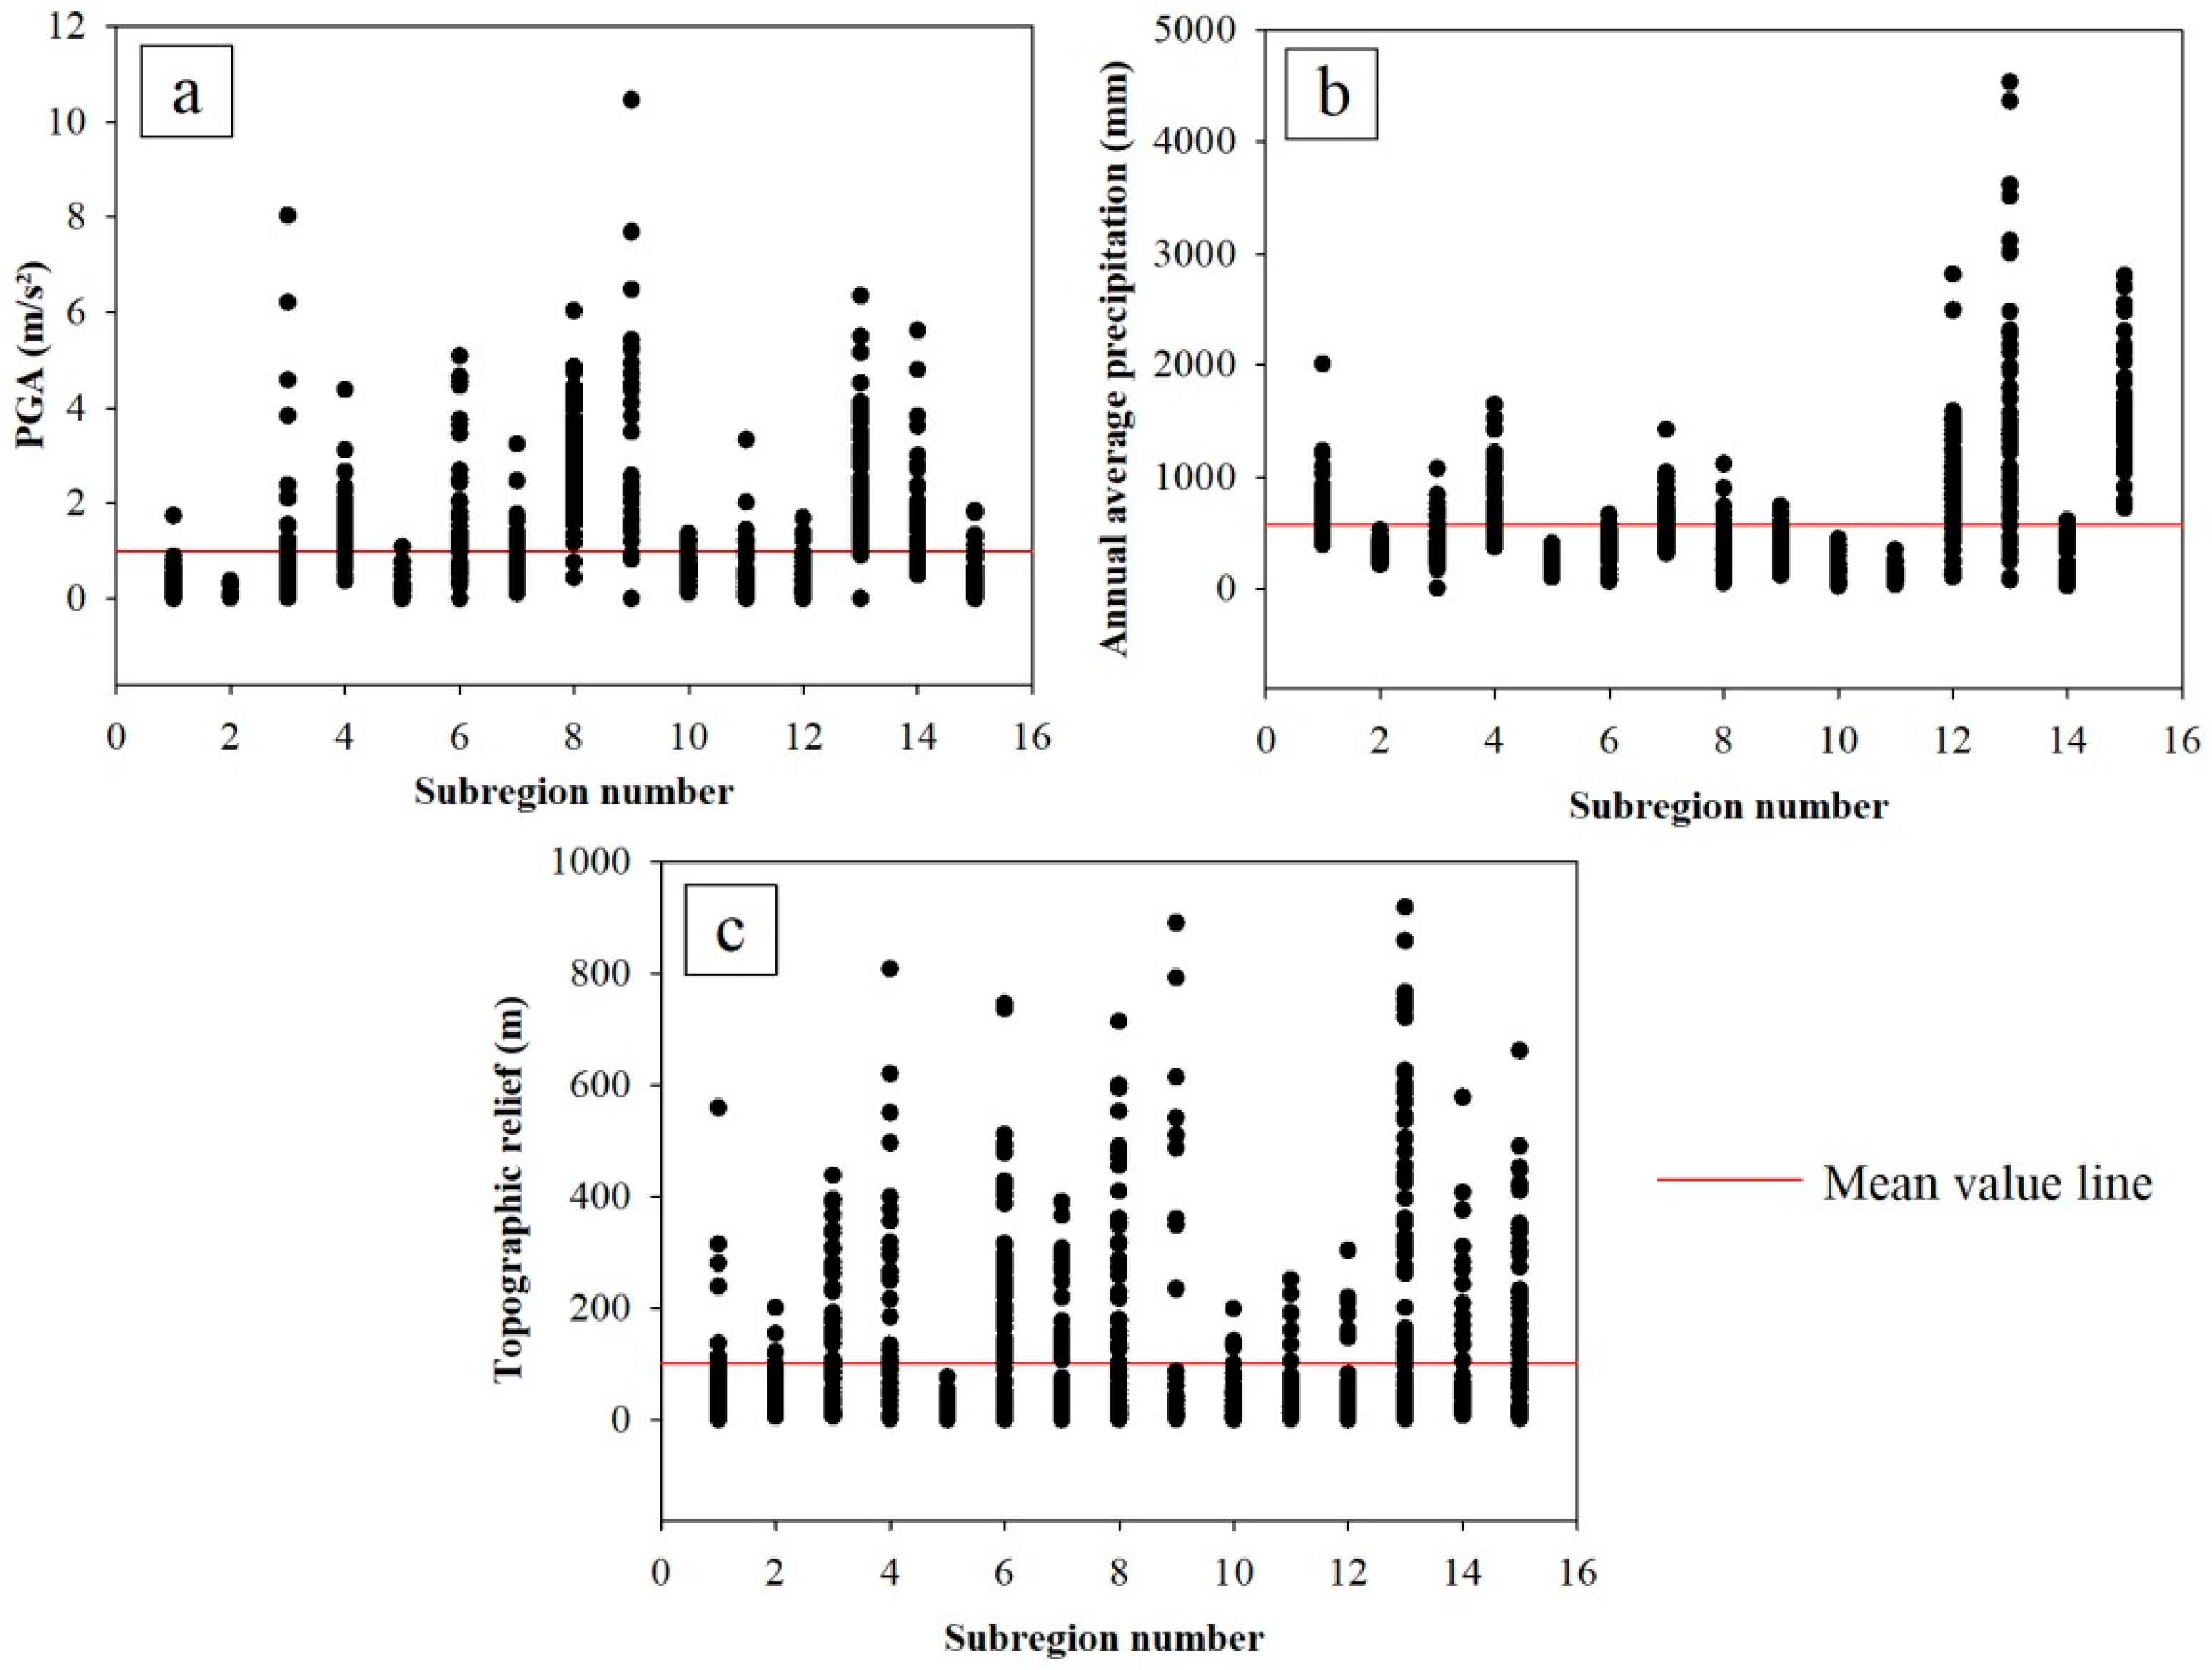
5.5. Characteristic Analysis of PPR Factors in Each Subregion

The analysis of PPR factor characteristics was mainly realized by statistics of PPR factor values obtained at randomly sampling points. Considering the problem of projection deformation in large areas, in order to ensure the rationality of sampling, we first transformed the research area of the Eurasian continent into equal area projection, then used the random point generation tool of ArcGIS software to generate 1000 random points (Figure 10). The “Extract Multi Values to Points” tool was used to obtain the PGA value, annual average precipitation and topographic relief value at each point.
Draw the sampling mean line of each factor of PPR as the reference standard, and compare the distribution of PGA values, annual average precipitation values and topographic relief values of sampling points in each subregion (Figure 11). The following can be found:
(1)
The subregion with higher PGA values (mainly distributing above the mean value) include 4 Alps–Mediterranean subregion, 6 Baikal–Altai subregion, 8 Iranian plateau subregion, 9 Pamirs subregion, 13 Himalayan–Hengduan subregion and 14 Tibetan Plateau subregion.
(2)
The subregions with high annual average precipitation (mainly distributing above the mean value) include 1 high-latitude plain subregion, 4 Alps–Mediterranean subregion, 7 Northeast Asia subregion, 12 Deccan Plateau subregion, 13 Himalayan–Hengduan subregion and 15 low-latitude monsoon subregion.
(3)
In terms of topographic relief, the areas with large variation range of topographic relief mainly include 3 East-Siberia mountainous subregion, 4 Alps–Mediterranean subregion, 6 Baikal–Altai subregion, 7 Northeast Asia subregion, 8 Iranian plateau subregion, 9 Pamirs subregion, 11 Arabian Peninsula subregion, 12 Deccan Plateau subregion, 13 Himalayan–Hengduan subregion, 14 Tibetan Plateau subregion, and 15 low-latitude monsoon subregion.

5.6. Analysis of Mountain-Hazards Susceptibility in Each Hazard-Developing Environment Subregion

Considering the PPR data as the background factor of hazards-developing environments, we can judge the difficulty of developing mountain-hazards in different subregions based on the geological, climatic and geomorphic conditions they represent. Based on the promotion effect of “more mountains, more water and more fragmentation” on the developing of mountain hazards, the following rules were set according to the existing relevant research to analyze the relationship between PPR and mountain-hazards susceptibility.
Premise rules are as follows:
Large relief is the “necessary and insufficient condition” for the development of mountain-hazards. The developing of “mountain” hazards should first have relief as the basic support [72,73];
Rainfall could infiltrate and soften the rocks and soil mass, reduce the strength of rocks and soil mass, and is conducive to the breeding of mountain hazards [74,75];
Judgment rules are as follows:
When there is only the relief condition or rainfall condition, or both conditions are not available, it is not conducive to the developing of mountain hazards;
A certain amount of precipitation and a certain amount of relief are the favorable conditions for the developing of mountain hazards;
Geological activities can break rocks and develop fissures, which are conducive to the infiltration of water, promote the developing of landslide hazards, and also provide material source conditions for debris flow hazards so as to form a good mountain-hazards developing environment in places with relief conditions but relatively little rainfall [76].
Based on the analysis of Figure 11, the overall value of PPR sampling points in each subregion is marked by drawing a table. Generally, the overall value above the mean line was marked with color, and the overall value below the mean line was not marked with color. Based on the premise rules and judgment rules listed above, a preliminary judgment could be made for the mountain-hazards susceptibility of hazards-developing environments represented by PPR (Table 1).
It could be found that among the hazards-developing environment subregions in the Eurasian continent, the subregions with relatively high susceptibility mainly include the Alps–Mediterranean subregion, Baikal–Altai subregion, Northeast Asia subregion, Iranian plateau subregion, Pamirs subregion, Deccan Plateau subregion, Himalayan–Hengduan subregion, Tibetan Plateau subregion, and low-latitude monsoon subregion.
By superimposing the regionalization results of mountain-hazards developing environments in the Eurasian continent with the mountain hazards (landslides, mountain torrents and debris flows), which we collected from NASA, Dartmouth Flood Observatory website and others [77,78] (Figure 12). It could be found that the mountain-hazards aggregation areas are basically consistent with the overall high-susceptibility areas of mountain hazards analyzed in Table 1. Although the Tibetan Plateau subregion and Baikal–Altai subregion have relatively fewer mountain-hazards records due to their vast area and sparse population, the relevant literatures can still support the relevant judgment in Table 1 [79,80].

6. Discussion

The regionalization of mountain-hazards developing environments in the Eurasian continent based on PPR data effectively reduces the difference of hazard-developing environments in the interior of each subregion. We have a preliminary understanding of the relative values of PPR factors in 15 hazard-developing environment subregions. The more similar geographic configurations of two areas are, the more similar the values (processes) of the target variable at these two areas would be, also known as geographic similarity [81]. That is to say, we can classify many hazard-developing environment regions, and put some similar hazard-developing environment regions into one category. The similar hazards-developing environment regions have similar characteristics for the developing of mountain hazards. Combined with the mountain-hazards susceptibility judgment rules, we could obtain nine subregions with overall high susceptibility. Further analysis of these nine subregions shows that some of them are similar in PPR characteristics, so they can be divided into the following three categories:
(1)
Arid and active-geologic regions: this category includes the Baikal–Altai subregion, Iranian plateau subregion, Pamirs subregion and Tibetan Plateau subregion. The characteristics of such regions are that the PGA value and relief value are relatively high [82,83]. Although the precipitation value is relatively low, the active geological activities break the rocks and soil mass, which is conducive to the infiltration of precipitation along the cracks [84,85]. It is conducive to the developing of landslides and other mountain-hazards, and the broken rocks and soil mass also provides rich solid source conditions for the developing of debris flow hazards [86].
(2)
Humid and active-geologic regions: this category mainly includes the Alps–Mediterranean subregion and the Himalayan–Hengduan subregion. All PPR values of such regions are high. In these subregions, the active geological activities make the rocks and soil broken. The infiltration and softening for rocks and soil by abundant precipitation can reduce the strength of rocks and soil and provide rich water source conditions for the developing of mountain hazards, while the large relief provides basic potential energy transformation conditions for the developing of mountain hazards [87,88]. It can be seen that this kind of hazards-developing environments is most conducive to the developing of mountain hazards, compared with the other two types of hazard-developing environments [89].
(3)
Humid and inactive-geologic regions: the subregions involved in this category include the Northeast Asia subregion, Deccan Plateau subregion and low-latitude monsoon subregion. In terms of precipitation characteristics, the above subregions are affected by monsoons [90,91], and the precipitation is relatively rich. There is large topographic relief in these subregions, which can provide the most basic potential energy conversion conditions for the developing of mountain hazards. However, the geological activities in these areas are relatively weak, so the developing of rock and soil fissures in these subregions is weaker than the first two categories [92].
Compared with the above three categories of hazards-developing environments, we find that large relief is the most basic condition for the developing of mountain hazards, which is also the reason for the so-called “mountain” hazards. High PGA and precipitation can exist one or both, which is helpful to the developing of mountain hazards [93,94]. Therefore, the difference of hazards-developing environments in the three categories of mountain hazards’ high susceptibility is mainly caused by the difference in PGA and precipitation. It should be noted that the susceptibility inference results of these subregions just represent overall and broad situations, and that in their interiors, they may behave independently due to the action of other variables not considered in this study. According to the differences of the developing environments, the mountain-hazards susceptibility or hazard index models for different hazards-developing environmental backgrounds could be constructed using more variables in order to obtain more detailed assessment results, which also makes the constructed models have different regional applicability (Table 2). On the other hand, this study also has limitations. Due to the limitation of the length of the article, we only carried out one-level regionalization research, and did not carry out higher-level regionalization research. Therefore, the subsequent assessment models built based on different mountain-hazards developing environments in this regionalization research could improve the regional applicability and model accuracy compared with the case of just using one model for the whole region, but there is still space for improvement in constructing models based on higher-level regionalization results.

7. Conclusions

This research divides the hazards-developing environments of mountain-hazards for the Eurasian continent, so as to help the subsequent susceptibility, hazard and risk assessments under different mountain-hazards developing environmental backgrounds and could improve the scientificity and rationality. It would help relevant researchers understand geographical characteristics and discover geographical laws so as to carry out disaster assessment better and ultimately serve the practical needs of disaster prevention and mitigation. Specifically, this research has the following understanding and conclusions:
(1)
Based on unsupervised classification, small patch elimination and merging operations, 15 mountain-hazards developing environment subregions with their own characteristics were obtained.
(2)
The analysis based on geodetectors shows that the regionalization results have the best interpretation ability for PGA spatial stratified heterogeneity (q = 0.61), followed by the annual average precipitation spatial stratified heterogeneity (q = 0.58) and the topographic relief spatial stratified heterogeneity (q = 0.30). Overall, the regionalization results can reflect the spatial stratified heterogeneity of PPR to a certain extent and reflect the regional characteristics of mountain-hazards developing environments.
(3)
The strength characteristics of PPR values in 15 subregions were analyzed, and the susceptibility of mountain hazards in each subregion was preliminarily identified according to the listed judgment rules. Nine subregions, including Alps–Mediterranean subregion, Baikal–Altai subregion, Northeast Asia subregion, Iranian Plateau subregion, Pamirs subregion, Deccan Plateau subregion, Himalayan–Hengduan subregion, Tibetan Plateau sub-region, and low-latitude monsoon subregion, were preliminarily identified as the overall high susceptibility regions of mountain hazards.
(4)
Through the classification of nine mountain hazards’ overall high-susceptibility regions, three different types of areas were obtained. They are arid and active-geologic regions, humid and active-geologic regions, and humid and inactive-geologic regions.

Author Contributions

Conceptualization, D.C. and C.G.; methodology, D.C.; formal analysis, D.C.; supervision, D.C. and C.G.; validation, D.C.; writing—original draft, D.C.; writing—review and editing, D.C. and C.G.; funding acquisition D.C. and C.G. All authors have read and agreed to the published version of the manuscript.

Funding

This research was funded by the international partnership program of the Chinese Academy of Sciences (Grant No. 131551KYSB20160002), and the Key Research Program of Frontier Sciences, CAS (Grant No. QYZDY-SSW-DQC006).

Institutional Review Board Statement

Not applicable.

Informed Consent Statement

Not applicable.

Data Availability Statement

Publicly available datasets were analyzed in this study. We have added the relevant data URL in the article.

Acknowledgments

The authors would like to thank all colleagues who gave us help in this study.

Conflicts of Interest

The authors declare no conflict of interest.

References

  1. Buytaert, W.; Beven, K. Regionalization as a learning process. Water Resour. Res. 2009, 45, W11419. [Google Scholar] [CrossRef]
  2. Zheng, D.; Ou, Y.; Zhou, C. Understanding of and thinking over geographical regionalization methodology. Acta Geogr. Sin. 2008, 63, 563–573. [Google Scholar]
  3. Quesada-Román, A.; Mata-Cambronero, E. The geomorphic landscape of the barva volcano, Costa Rica. Phys. Geogr. 2021, 42, 265–282. [Google Scholar] [CrossRef]
  4. Franch-Pardo, I.; Napoletano, B.M.; Bocco, G.; Barrasa, S.; Cancer-Pomar, L. The role of geographical landscape studies for sustainable territorial planning. Sustainability 2017, 9, 2123. [Google Scholar] [CrossRef]
  5. Xu, B.; Ji, G.; Zhu, Y. A preliminary research of geographic regionalization of China land background and spectral reflectance characteristics of soil. Remote Sens. Environ. China 1991, 6, 142–151. [Google Scholar]
  6. Zhang, L.; Shi, P.; Wang, J.; Zhu, L. Regionalization of natural disasters in China. J. Beijing Normal Univ. 1995, 31, 415–421. [Google Scholar]
  7. Wang, P.; Shi, P.-J. Comprehensive regionalization of agricultural natural disaster in China. J. Nat. Disasters 2000, 9, 16–23. [Google Scholar]
  8. Wu, P.; Jia, Y. The regionalization and distribution types of the bryophytes in China. J. Plant Resour. Environ. 2006, 15, 1. [Google Scholar]
  9. Frankel, J.A. The Regionalization of the World Economy; University of Chicago Press: Chicago, IL, USA, 2007. [Google Scholar]
  10. Gao, J.; Huang, J.; Li, S.; Cai, Y. The new progresses and development trends in the research of physio-geographical regionalization in China. Prog. Geogr. 2010, 29, 1400–1407. [Google Scholar]
  11. Xu, H.; Zhu, H. Spatial change of China’s grain production based on geographical division of natural factors during 1990–2010. Acta Geogr. Sin. 2015, 70, 582–590. [Google Scholar]
  12. Badr, H.S.; Zaitchik, B.F.; Dezfuli, A.K. A tool for hierarchical climate regionalization. Earth Sci. Inform. 2015, 8, 949–958. [Google Scholar] [CrossRef]
  13. Zhang, T.; Peng, J.; Liu, Y.; Zhao, M. Eco-geographical regionalization in loess plateau based on the dynamic consistency of vegetation. Geogr. Res. 2015, 34, 1643–1661. [Google Scholar]
  14. Garnelo, L.; Sousa, A.B.L.; Silva, C.d.O.d. Health regionalization in amazonas: Progress and challenges. Ciênc. Saúde Coletiva 2017, 22, 1225–1234. [Google Scholar] [CrossRef] [PubMed]
  15. Morrone, J.J. The spectre of biogeographical regionalization. J. Biogeogr. 2018, 45, 282–288. [Google Scholar] [CrossRef]
  16. Zhu, J.; Zhou, Y.; Wang, S.; Wang, L.; Liu, W.; Li, H.; Mei, J. Ecological function evaluation and regionalization in baiyangdian wetland. Acta Ecol. Sin. 2020, 40, 459–472. [Google Scholar]
  17. Yu, H.; Guo, H.; Wang, J. Comprehensive regionalization of natural disaster risk—A case study of population and economic risk caused by typhoon in guangdong province. J. Catastrophol. 2022, 837, 131–137. [Google Scholar]
  18. Qiao, Y.; Li, M.; Zhang, W. Comprehensive evaluation on geological hazards and the environment of developing geological hazards in the northwest hebei on the basis of rs. Chin. J. Geol. Hazard Control 2002, 13, 83–87. [Google Scholar]
  19. Wang, D.; Wan, K.; Ma, W. Emergency decision-making model of environmental emergencies based on case-based reasoning method. J. Environ. Manag. 2020, 262, 110382. [Google Scholar] [CrossRef]
  20. Reichenbach, P.; Rossi, M.; Malamud, B.D.; Mihir, M.; Guzzetti, F. A review of statistically-based landslide susceptibility models. Earth-Sci. Rev. 2018, 180, 60–91. [Google Scholar] [CrossRef]
  21. Qin, Q.; Lin, X.; Tang, H.; Chen, H. Environment zoning of geological hazards developing of road flood in wanzhou. J. Chongqing Jiaotong Univ. 2011, 30, 89–94. [Google Scholar]
  22. Lin, X.-S.; Tang, H.-M.; Chen, H.-K.; Qin, Q.-M. Integrated zoning of developing hazards of geological disasters in chongqing city. Zhongguo Anquan Kexue Xuebao 2011, 21, 3–9. [Google Scholar]
  23. Kritikos, T.; Robinson, T.R.; Davies, T.R. Regional coseismic landslide hazard assessment without historical landslide inventories: A new approach. J. Geophys. Res. Earth Surf. 2015, 120, 711–729. [Google Scholar] [CrossRef]
  24. Vasu, N.N.; Lee, S.-R.; Pradhan, A.M.S.; Kim, Y.-T.; Kang, S.-H.; Lee, D.-H. A new approach to temporal modelling for landslide hazard assessment using an extreme rainfall induced-landslide index. Eng. Geol. 2016, 215, 36–49. [Google Scholar] [CrossRef]
  25. Dikshit, A.; Sarkar, R.; Pradhan, B.; Acharya, S.; Alamri, A.M. Spatial landslide risk assessment at phuentsholing, bhutan. Geosciences 2020, 10, 131. [Google Scholar] [CrossRef]
  26. Novellino, A.; Cesarano, M.; Cappelletti, P.; Martire, D.D.; Napoli, M.D.; Ramondini, M.; Sowter, A.; Calcaterra, D. Slow-moving landslide risk assessment combining machine learning and insar techniques. Catena 2021, 203, 105317. [Google Scholar] [CrossRef]
  27. Guzzetti, F.; Gariano, S.L.; Peruccacci, S.; Brunetti, M.T.; Marchesini, I.; Rossi, M.; Melillo, M. Geographical landslide early warning systems. Earth-Sci. Rev. 2020, 200, 102973. [Google Scholar] [CrossRef]
  28. Hidayat, R.; Sutanto, S.J.; Hidayah, A.; Ridwan, B.; Mulyana, A. Development of a landslide early warning system in Indonesia. Geosciences 2019, 9, 451. [Google Scholar] [CrossRef]
  29. Li, Y.; Xu, L.; Gu, F.; Su, N.; Zhang, L. Influence of disaster-pregnant factors on debris flow hazard. Earth Sci. 2022, 1–12. [Google Scholar] [CrossRef]
  30. Huang, L.; Xiang, L.-Y. Method for meteorological early warning of precipitation-induced landslides based on deep neural network. Neural Process. Lett. 2018, 48, 1243–1260. [Google Scholar] [CrossRef]
  31. Huggett, R.J. Soil chronosequences, soil development, and soil evolution: A critical review. Catena 1998, 32, 155–172. [Google Scholar] [CrossRef]
  32. Gray, J.M.; Bishop, T.F.; Wilford, J.R. Lithology and soil relationships for soil modelling and mapping. Catena 2016, 147, 429–440. [Google Scholar] [CrossRef]
  33. Jiang, Z.; Liu, H.; Wang, H.; Peng, J.; Meersmans, J.; Green, S.M.; Quine, T.A.; Wu, X.; Song, Z. Bedrock geochemistry influences vegetation growth by regulating the regolith water holding capacity. Nat. Commun. 2020, 11, 2392. [Google Scholar] [CrossRef] [PubMed]
  34. Ding, Y.; Li, Z.; Peng, S. Global analysis of time-lag and-accumulation effects of climate on vegetation growth. Int. J. Appl. Earth Obs. Geoinf. 2020, 92, 102179. [Google Scholar] [CrossRef]
  35. Sangireddy, H.; Carothers, R.A.; Stark, C.P.; Passalacqua, P. Controls of climate, topography, vegetation, and lithology on drainage density extracted from high resolution topography data. J. Hydrol. 2016, 537, 271–282. [Google Scholar] [CrossRef]
  36. Anselin, L. What is Special About Spatial Data? Alternative Perspectives on Spatial Data Analysis (89-4); UC Santa Barbara: National Center for Geographic Information and Analysis: Santa Barbara, CA, USA, 1989. [Google Scholar]
  37. Goodchild, M.F. The validity and usefulness of laws in geographic information science and geography. Ann. Assoc. Am. Geogr. 2004, 94, 300–303. [Google Scholar] [CrossRef]
  38. Peel, M.C.; Finlayson, B.L.; Mcmahon, T.A. Updated world map of the köppen-geiger climate classification. Hydrol. Earth Syst. Sci. 2006, 11, 259–263. [Google Scholar] [CrossRef]
  39. GSHAP. The Global Seismic Hazard Map Online. Available online: http://gmo.gfz-potsdam.de/ (accessed on 5 November 2020).
  40. Suzuki, A.; Iervolino, I. Italian vs. Worldwide history of largest pga and pgv. Ann. Geophys. 2017, 60, S0551. [Google Scholar] [CrossRef]
  41. Ayonghe, S.; Mafany, G.; Ntasin, E.; Samalang, P. Seismically activated swarm of landslides, tension cracks, and a rockfall after heavy rainfall in bafaka, cameroon. Nat. Hazards 1999, 19, 13–27. [Google Scholar] [CrossRef]
  42. Xu, C.; Xu, X. Controlling parameter analyses and hazard mapping for earthquake-triggered landslides: An example from a square region in Beichuan county, Sichuan province, China. Arab. J. Geosci. 2013, 6, 3827–3839. [Google Scholar] [CrossRef]
  43. Alexander, L.V.; Zhang, X.; Peterson, T.C.; Caesar, J.; Gleason, B.; Tank, A.K.; Haylock, M.; Collins, D.; Trewin, B.; Rahimzadeh, F. Global observed changes in daily climate extremes of temperature and precipitation. J. Geophys. Res. Atmos. 2006, 111, 1042–1063. [Google Scholar] [CrossRef]
  44. Chleborad, A.F. Preliminary evaluation of a precipitation threshold for anticipating the occurrence of landslides in the seattle, washington, area. US Geol. Surv. Open-File Rep. 2003, 3, 39. [Google Scholar]
  45. Zhu, L.; Gong, H.; Dai, Z.; Xu, T.; Su, X. An integrated assessment of the impact of precipitation and groundwater on vegetation growth in arid and semiarid areas. Environ. Earth Sci. 2015, 74, 5009–5021. [Google Scholar] [CrossRef]
  46. Khormali, F.; Kehl, M. Micromorphology and development of loess-derived surface and buried soils along a precipitation gradient in northern iran. Quat. Int. 2011, 234, 109–123. [Google Scholar] [CrossRef]
  47. Korup, O.; Montgomery, D.R.; Hewitt, K. Glacier and landslide feedbacks to topographic relief in the himalayan syntaxes. Proc. Natl. Acad. Sci. USA 2010, 107, 5317–5322. [Google Scholar] [CrossRef] [Green Version]
  48. Korup, O.; Clague, J.J.; Hermanns, R.L.; Hewitt, K.; Strom, A.L.; Weidinger, J.T. Giant landslides, topography, and erosion. Earth Planet. Sci. Lett. 2007, 261, 578–589. [Google Scholar] [CrossRef]
  49. Chang, K.-T.; Antes, J.; Lenzen, T. The effect of experience on reading topographic relief information: Analyses of performance and eye movements. Cartogr. J. 1985, 22, 88–94. [Google Scholar] [CrossRef]
  50. Shedlock, K.M.; Giardini, D.; Grunthal, G.; Zhang, P. The gshap global seismic hazard map. Seismol. Res. Lett. 2000, 71, 679–686. [Google Scholar] [CrossRef]
  51. GSHAP. Global seismic hazard assessment program. Ann. Geofis. 1999, 42, 115–201. [Google Scholar]
  52. Giardini, D.; Grünthal, G.; Shedlock, K.M.; Zhang, P. The gshap global seismic hazard map. Ann. Geofis. 1999, 42, 1225–1230. [Google Scholar] [CrossRef]
  53. Fick, S.E.; Hijmans, R.J. Worldclim 2: New 1-km spatial resolution climate surfaces for global land areas. Int. J. Climatol. 2017, 37, 4302–4315. [Google Scholar] [CrossRef]
  54. Danielson, J.J.; Gesch, D.B. Global Multi-Resolution Terrain Elevation Data 2010 (Gmted2010); US Department of the Interior, US Geological Survey: Washington, DC, USA, 2011.
  55. Zhang, H.; Qiu, B.; Zhang, K. A new risk assessment model for agricultural products cold chain logistics. Ind. Manag. Data Syst. 2017, 117, 1800–1816. [Google Scholar] [CrossRef]
  56. Cheng, D.; Gao, C.; Zhao, M.; Cheng, Y. Research on the enhanced expression of terrace information based on dem and remote sensing image. J. Arid. Land Resour. Environ. 2016, 30, 124–130. [Google Scholar]
  57. Memarsadeghi, N.; Mount, D.M.; Netanyahu, N.S.; Moigne, J.L. A fast implementation of the isodata clustering algorithm. Int. J. Comput. Geom. Appl. 2007, 17, 71–103. [Google Scholar] [CrossRef]
  58. Abbas, A.W.; Minallh, N.; Ahmad, N.; Abid, S.A.R.; Khan, M.A.A. K-means and isodata clustering algorithms for landcover classification using remote sensing. Sindh Univ. Res. J.-SURJ 2016, 48. [Google Scholar]
  59. Dunn, J.C. A fuzzy relative of the isodata process and its use in detecting compact well-separated clusters. J. Cybern. 1973, 3, 32–57. [Google Scholar] [CrossRef]
  60. Gunderson, R. Application of fuzzy isodata algorithms to star tracker pointing systems. IFAC Proc. Vol. 1978, 11, 1319–1323. [Google Scholar] [CrossRef]
  61. Wang, J.; Xu, C. Geodetector: Principle and prospective. Acta Geogr. Sin. 2017, 72, 116–134. [Google Scholar]
  62. Xu, C.; Li, Y.; Wang, J.; Xiao, G. Spatial-temporal detection of risk factors for bacillary dysentery in Beijing, Tianjin and Hebei, China. BMC Public Health 2017, 17, 743. [Google Scholar] [CrossRef] [Green Version]
  63. Yuan, X.; Han, J.; Shao, Y.; Li, Y.; Wang, Y. Geodetection analysis of the driving forces and mechanisms of erosion in the hilly-gully region of northern Shaanxi province. J. Geogr. Sci. 2019, 29, 779–790. [Google Scholar] [CrossRef]
  64. Chen, J.; Wang, D.; Li, G.; Sun, Z.; Wang, X.; Zhang, X.; Zhang, W. Spatial and temporal heterogeneity analysis of water conservation in beijing-tianjin-hebei urban agglomeration based on the geodetector and spatial elastic coefficient trajectory models. GeoHealth 2020, 4, e2020GH000248. [Google Scholar] [CrossRef]
  65. Zhao, R.; Zhan, L.; Yao, M.; Yang, L. A geographically weighted regression model augmented by geodetector analysis and principal component analysis for the spatial distribution of pm2.5. Sustain. Cities Soc. 2020, 56, 102106. [Google Scholar] [CrossRef]
  66. Zhou, X.; Wen, H.; Zhang, Y.; Xu, J.; Zhang, W. Landslide susceptibility mapping using hybrid random forest with geodetector and rfe for factor optimization. Geosci. Front. 2021, 12, 101211. [Google Scholar] [CrossRef]
  67. Dzemyda, G.; Kurasova, O.; Zilinskas, J. Multidimensional data visualization. Methods Appl. Ser. Springer Optim. Appl. 2013, 75, 10.5555. [Google Scholar]
  68. Pastizzo, M.J.; Erbacher, R.F.; Feldman, L.B. Multidimensional data visualization. Behav. Res. Methods Instrum. Comput. 2002, 34, 158–162. [Google Scholar] [CrossRef] [PubMed]
  69. Nickerson, B.G. Automated cartographic generalization for linear features. Cartogr. Int. J. Geogr. Inf. Geovis. 1988, 25, 15–66. [Google Scholar] [CrossRef]
  70. Chunliu, G.; Deqiang, C.; Kewei, L. Study on color landscape area from the perspective of the fifth facade. J. Cent. China Norm. Univ. 2016, 50, 770–776. [Google Scholar]
  71. Iwahashi, J.; Pike, R.J. Automated classifications of topography from dems by an unsupervised nested-means algorithm and a three-part geometric signature. Geomorphology 2007, 86, 409–440. [Google Scholar] [CrossRef]
  72. Guo, F.F.; Yang, N.; Meng, H.; Zhang, Y.Q.; Ye, B.Y. Application of the relief amplitude and slope analysis to regional landslide hazard assessments. Geol. China 2008, 35, 131–143. [Google Scholar]
  73. Su, X.; Wei, W.; Guo, W.; Wang, S.; Wang, G.; Wu, W.; Ye, W. Analyzing the impact of relief amplitude to loess landslides based on srtm dem in tianshui prefecture. J. Glaciol. Geocryol. 2017, 39, 616–622. [Google Scholar]
  74. Zhu, W.; Liu, B. Forming and development process of soil landslide during rainfall. Chin. J. Rock Mech. Eng. 2002, 21, 509–512. [Google Scholar]
  75. Caine, N. The rainfall intensity-duration control of shallow landslides and debris flows. Geogr. Ann. Ser. A Phys. Geogr. 1980, 62, 23–27. [Google Scholar]
  76. Margielewski, W.; Urban, J. Crevice-type caves as initial forms of rock landslide development in the flysch carpathians. Geomorphology 2003, 54, 325–338. [Google Scholar] [CrossRef]
  77. NASA. Global Landslide Catalog Export. Available online: https://data.nasa.gov/Earth-Science/Global-Landslide-Catalog-Export/dd9e-wu2v (accessed on 21 January 2022).
  78. Brakenridge, G.R. Global Active Archive of Large Flood Events. Available online: http://floodobservatory.colorado.edu/Archives/ (accessed on 21 January 2022).
  79. Liu, G.; Yan, Y.; Liu, J. Analysis of distribution character and background of geological hazards in western Qinghai-Tibet plateau. Geol. Surv. China 2017, 4, 37–45. [Google Scholar]
  80. Nepop, R.; Agatova, A. Estimating magnitudes of prehistoric earthquakes from landslide data: First experience in southeastern altai. Russ. Geol. Geophys. 2008, 49, 144–151. [Google Scholar] [CrossRef]
  81. Zhu, A.; Lv, G.; Zhou, C.; Qin, C. Geographic similarity: Third law of geography? J. Geo-Inf. Sci. 2020, 22, 04000673. [Google Scholar]
  82. Alimohammadlou, Y.; Najafi, A.; Gokceoglu, C. Estimation of rainfall-induced landslides using ann and fuzzy clustering methods: A case study in saeen slope, azerbaijan province, Iran. Catena 2014, 120, 149–162. [Google Scholar] [CrossRef]
  83. Asadi, M.; Goli Mokhtari, L.; Shirzadi, A.; Shahabi, H.; Bahrami, S. A comparison study on the quantitative statistical methods for spatial prediction of shallow landslides (case study: Yozidar-Degaga route in Kurdistan province, Iran). Environ. Earth Sci. 2022, 81, 51. [Google Scholar] [CrossRef]
  84. Lacroix, P.; Handwerger, A.L.; Bièvre, G. Life and death of slow-moving landslides. Nat. Rev. Earth Environ. 2020, 1, 404–419. [Google Scholar] [CrossRef]
  85. Nafarzadegan, A.R.; Talebi, A.; Malekinezhad, H.; Emami, N. Antecedent rainfall thresholds for the triggering of deep-seated landslides (case study: Chaharmahal & Bakhtiari province, Iran). Ecopersia 2013, 1, 23–39. [Google Scholar]
  86. Sharifi, F.; Samadi, S.Z.; Wilson, C.A. Causes and consequences of recent floods in the golestan catchments and caspian sea regions of iran. Nat. Hazards 2012, 61, 533–550. [Google Scholar] [CrossRef]
  87. Zhao, J.; Zhang, Q.; Wang, D.; Wu, W.; Yuan, R. Machine learning-based evaluation of susceptibility to geological hazards in the Hengduan mountains region, China. Int. J. Disaster Risk Sci. 2022, 13, 305–316. [Google Scholar] [CrossRef]
  88. Liu, S.; Wei, L.; Hu, K. Topographical and geological variation of effective rainfall for debris-flow occurrence from a large-scale perspective. Geomorphology 2020, 358, 107134. [Google Scholar] [CrossRef]
  89. Lin, Q.; Wang, Y. Spatial and temporal analysis of a fatal landslide inventory in China from 1950 to 2016. Landslides 2018, 15, 2357–2372. [Google Scholar] [CrossRef]
  90. Meena, S.R.; Ghorbanzadeh, O.; van Westen, C.J.; Nachappa, T.G.; Blaschke, T.; Singh, R.P.; Sarkar, R. Rapid mapping of landslides in the western ghats (India) triggered by 2018 extreme monsoon rainfall using a deep learning approach. Landslides 2021, 18, 1937–1950. [Google Scholar] [CrossRef]
  91. Chandrasekaran, S.; Sayed Owaise, R.; Ashwin, S.; Jain, R.M.; Prasanth, S.; Venugopalan, R. Investigation on infrastructural damages by rainfall-induced landslides during november 2009 in Nilgiris, India. Nat. Hazards 2013, 65, 1535–1557. [Google Scholar] [CrossRef]
  92. Wang, P.; Bai, X.; Wu, X.; Yu, H.; Hao, Y.; Hu, B.X. Gis-based random forest weight for rainfall-induced landslide susceptibility assessment at a humid region in southern China. Water 2018, 10, 1019. [Google Scholar] [CrossRef]
  93. Titti, G.; Borgatti, L.; Zou, Q.; Cui, P.; Pasuto, A. Landslide susceptibility in the belt and road countries: Continental step of a multi-scale approach. Environ. Earth Sci. 2021, 80, 630. [Google Scholar] [CrossRef]
  94. Lin, L.; Lin, Q.; Wang, Y. Landslide susceptibility mapping on a global scale using the method of logistic regression. Nat. Hazards Earth Syst. Sci. 2017, 17, 1411–1424. [Google Scholar] [CrossRef] [Green Version]
Figure 1. Factor “tree” of mountain-hazards developing environments and effects of geology, landform and climate factors for the formation of mountain-hazards developing environments. There may be obvious differences in hazards-developing environments of mountain hazards in different regions of large areas [36,37]. This requires us to study the regionalization of hazards-developing environments in order to reflect the regional differences. However, natural elements are full of complexity. Through the analysis of the relationship between various factors, finding out the most important factors is an important step to realize the difference analysis of hazards-developing environments.
Land 11 01519 g001
Figure 2. Elevation of the Eurasian continent. The Eurasia continent is the largest continental area on Earth. Primarily in the Northern and Eastern Hemispheres, it spans from the Iberian Peninsula in the west to the Russian Far East in the east, from the Tanjung Piai of Malaysia in the south to the Russian Taymyr Peninsula in the north. The mainland is bordered by the Arctic Ocean to the north, the Indian Ocean to the south, the Atlantic Ocean to the west, and the Pacific Ocean to the east.
Land 11 01519 g002
Figure 3. PPR data: (a) PGA; (b) annual average precipitation; (c) elevation; (d) topographic relief.
Land 11 01519 g003
Figure 4. Pseudocolor representation of PPR 3D geo-information space data.
Land 11 01519 g004
Figure 5. Unsupervised automatic classification results of the PPR data using the ISODATA method.
Land 11 01519 g005
Figure 6. Relationship between classification number and patch number.
Land 11 01519 g006
Figure 7. Area statistics of nine-classification patches: (a) size distribution of patches; (b) drawing of partial enlargement.
Land 11 01519 g007
Figure 8. Small-patch elimination of nine-classification patches: (a) threshold of 2000 km2; (b) threshold of 4000 km2.
Land 11 01519 g008
Figure 9. Regionalization results of PPR mountain-hazards developing environments.
Land 11 01519 g009
Figure 10. Distribution of random points in the Eurasian continent.
Land 11 01519 g010
Figure 11. PPR values of random points in each subregion. (a) PGA (m/s2), (b) Annual average precipitation (mm), (c) Topagraphic relief (m).
Land 11 01519 g011
Figure 12. Mountain-hazards distribution in different subregions.
Land 11 01519 g012
Table 1. Relative strength table of PPR in each subregion and inference of mountain-hazards susceptibility.
Subregion NamePGAPrecipitationReliefSusceptibility CharacteristicsRules
1 High-latitude plain subregionLocal high value Local high valueOverall low susceptibility, local high susceptibility③, ④
2 Mid-Siberia plateau subregion Local high valueOverall low susceptibility
3 East-Siberia mountainous subregionLocal high valueLocal high value Overall low susceptibility, local high susceptibility③, ④
4 Alps-Mediterranean subregion Overall high susceptibility
5 Central Asia subregion Overall low susceptibility
6 Baikal-Altai subregion Overall high susceptibility
7 Northeast Asia subregionLocal high value Overall high susceptibility
8 Iranian plateau subregion Local high value Overall high susceptibility
9 Pamirs subregion Local high value Overall high susceptibility
10 Mongolia-Xinjiang subregion Local high valueOverall low susceptibility
11 Arabian Peninsula subregionLocal high value Overall low susceptibility, local high susceptibility③, ⑤
12 Deccan Plateau subregionLocal high value Overall high susceptibility
13 Himalayan-Hengduan subregion Overall high susceptibility
14 Tibetan Plateau subregion Overall high susceptibility
15 Low latitude monsoon subregionLocal high value Overall high susceptibility
Notes: In the above table, red indicates that the overall PGA value of the corresponding subregion is higher, blue indicates that there is more precipitation in the corresponding subregion, and brown indicates that there is a large change of topographic relief in the corresponding subregion. For the cases of overall PPR with small values, there is no color marking, but there may be local high value remarks.
Table 2. Model classifications and applicability characteristics.
Model TypeApplicability
Arid and active-geologic region modelAreas with low precipitation and high PGA
Humid and active-geologic region modelAreas with high precipitation and PGA values
Humid and inactive-geologic region modelAreas with low PGA value but relatively abundant precipitation
Publisher’s Note: MDPI stays neutral with regard to jurisdictional claims in published maps and institutional affiliations.

