Abstract
Logistics is playing an important role in China with the rapid growth of the digital economy, and has caused large quantities of carbon emissions as an energy-intensive industry. Due to the extreme imbalance of land urbanization, the performance of carbon emissions reduction in logistics is significantly different among regions. This paper establishes a new indicator to describe the carbon emissions catch-up effect and decomposes the impact of land urbanization into 4 driving factors, thereby identifying the impact of land urbanization on carbon emissions catch-up effect in detail. The results indicate that: (1) at the national level, the catch-up effect of carbon emissions in logistics showed three stages of “catching up-lagging behind-catching up”, which was consistent with the development of logistics. (2) At the regional level, the land urbanization-related factors had significant but different impacts on the catch-up effect of carbon emissions. The spatial expansion and road network density effect were the main inhibitors for catch-up effect of the eastern region, and spatial structure effect was the main inhibitor for central and western regions. (3) At the provincial level, the impact of land urbanization-related factors on provinces at different development stages was different. Finally, some policy implications are proposed to achieve carbon neutrality targets.
1. Introduction
With the rapid growth of the digital economy and urbanization, logistics is playing a more and more important role in China, which approximately contributes 4.5 percent of the growth of gross domestic product (GDP) and 3 to 5 percent of the total employment [1]. However, according to CEADs, logistics is the second-largest energy consumer and carbon emitter only next to industry in 2020 in China. The energy consumption of China’s logistics soared from 122 million tce in 2007 to 205 million tce in 2019 [2]. Among the energy used, the consumption of diesel alone has increased by 3.4 million tons per year. Too much energy consumption has caused serious carbon emissions and environmental pollution. Figure 1 indicates that the carbon emissions of China’s logistics reached 179 million tons in 2019, with an annual growth rate of about 5.6%, showing a significant growth trend.

Figure 1.
The carbon emissions of China’s logistics during 2007–2019.
The industrial development that accompanies land urbanization leads to a large amount of carbon emissions [3,4,5], especially logistics [6]. In the past 2 decades, the urban land scale and structure have changed significantly with the rapid process of land urbanization in China. The urban land has increased from 178 thousand square kilometers in 2007 to 200 thousand square kilometers in 2019, and the urban built-up area has increased from 35 thousand square kilometers in 2007 to 60 thousand square kilometers in 2019. Actually, land urbanization has significantly influenced the carbon emissions of logistics. For example, the expansion of urban land will enlarge the service scope of logistics, which means the transportation and distribution distance will increase, and more distribution sites should be constructed. The energy consumption and carbon emissions of logistics increase as a result. Meanwhile, the urban city has become more and more compact and the job–work distance separated. Traffic congestion has become more and more serious, especially in mega-cities, which leads to more inefficient logistics and causes too much energy consumption and carbon emissions. Therefore, identifying the impact of land urbanization on carbon emission of logistics and then proposing carbon emission reduction policies will be of great help for peaking carbon emissions and achieving carbon neutrality for China.
Since 2010, 87 regions, such as Guangdong, Beijing, Shanghai, etc., have been chosen as low-carbon pilot (LCP) regions successively in China, aiming to explore low-carbon development experience. In the past 10 years, the LCP regions proposed a lot of policies to reduce carbon emissions as much as possible, and have achieved remarkable effects. On average, the growth rate of carbon emissions in LCP regions is decreasing by about 0.93% each year, and in some regions, such as Beijing, the growth rate of carbon emissions by 1.22% each year. In this context, taking the LCP regions as benchmarks, investigating the changes in carbon emissions gap between them and non-low-carbon pilot (NLCP) regions, and identifying the effect of land urbanization on the changes in carbon emissions gap, are of great significance for detecting the catch-up effect of carbon emissions in NLCP regions, and help to propose urban land use policies to speed up carbon emissions reduction. Also, it can help to optimize the urban land use of NLCP regions. However, insufficient attention was paid to the effects of land urbanization on the catch-up effect between NLCP regions and benchmark.
Therefore, this paper focuses on the following questions. (1) Are the NLCP regions catching up with benchmark in carbon emission reduction? (2) How does land urbanization affect the NLCP regions’ efforts to catch up to the benchmark? In order to answer these questions. An aggregate indicator is established to describe the catch-up effect of NLCP regions to benchmark, and the Log-Mean Divisia Index (LMDI) method is applied to capture the effects of land urbanization on the catch-up effect of NLCP regions to benchmark in logistics. Comparative analysis is used to detect the different effects of land urbanization factors on the catch-up effect in logistics of China’s regions.
The remainder of the paper is organized as follows. The existing literature is analyzed in Section 2. An aggregate indicator is established, and the methods and data are described in Section 3. The empirical findings and comparative analysis are presented in Section 4. Section 5 concludes and proposes related policy implications.
2. Literature Review
Many scholars have explored the driving factors of carbon emissions in different ways. A great number of methods were used to explore how driving factors affect carbon emissions, mainly including regression methods [7,8,9,10] and decomposition methods [11,12,13,14,15]. Actually, regression methods focus more on external factors, e.g., industry structure [16,17], economic development [9,18], and technological innovation. However, regression results are susceptible to the choice of research objects and the number of factors, which often leads to the opposite conclusion of some factors. Thus, decomposition analysis has become a research hotspot, because it is an aggregate decomposition without interaction between factors.
Decomposition analysis is an approach which can identify the changes in energy consumption and energy-related carbon emissions using predefined factors quantitatively [19], in which many scholars mainly focused on the relationship between carbon emissions and economic development [20,21], technological progress [22], energy structure [23] and energy intensity [24]. Three decomposition methods have been widely acknowledged among scholars, including structural decomposition analysis (SDA), index decomposition analysis (IDA), and production-theoretical decomposition analysis (PDA).
SDA is dependent on input-output (I-O) tables and more economic details being attained clearly [25], so it often analyzes energy and emission differences from an economic systems perspective [26]. However, the updated I-O tables require more data and are not available in some countries and regions, which limits its application [27,28].
PDA is a method that combined the Shephard distance functions and environmental data envelopment analysis (DEA) technology, which provides more technical details. It is widely used by many scholars to analyze the technical factors and substitution factors which influence the changes in carbon emissions [29,30]. However, PDA usually leads to the inconsistency of structure effects.
Based on the index number theory, Ang [31] employed IDA to decompose the aggregate emissions into the effects of energy or carbon emissions intensity, activity structure, and total activity. Compared with SDA, IDA is more simple and more flexible because of lower data requirements. Two main methods are used primarily, named the Laspeyres Index and the Divisia Index [32]. Particularly, Logarithmic Mean Divisia Index (LMDI) was considered to be the best decomposition method because of no unexplained residual term [33], and was adopted by many scholars [34,35,36,37].
There are three perspectives in decomposition studies, including temporal decomposition, spatial decomposition, and spatial–temporal decomposition. The temporal decomposition regards the previous period as a baseline and compares at least two periods of a nation or region [38]. In this context, this decomposition idea could provide historical trends of regions, and it has been widely used by researchers [39,40,41,42].
The spatial decomposition, first proposed by Ang [43], focuses on discovering the driving factors of the difference among regions in a specific year and all regions can be ranked based on relative performance. Ang [44] classified the spatial decomposition into bilateral-region (B-R), radial-region (R-R) and multi-region (M-R) model. The B-R model could compare each pair of regions, but it is limited when the number of regions is large. To analyze more regions, a reference region could be considered. The R-R model compares each region with a reference region, but the comparison between the two regions could not be attained. Meanwhile, M-R model provides both direct comparisons between each region and the reference region and indirect comparisons between any two regions, which is the most widely used by scholars [45,46,47,48].
In order to capture both spatial differences between regions and temporal developments of specific regions simultaneously, Ang [49] introduced a spatial–temporal model. Now, a comprehensive framework that combined temporal and spatial decomposition is becoming more and more popular in recent years. Li [50], Wang [51], Chen [52], and Hang [53] employed the changes in pollutants (such as CO2 or SO2) from the temporal–spatial decomposition perspective.
In addition, scholars have carried out a series of studies based on the impact of urbanization on carbon emissions of logistics. For example, Lv [54] studied the impact of urbanization on carbon emissions from freight transport under different modes of freight transport, and Liu [55] studied the impact of urbanization on the carbon emissions of logistics from four aspects. Scholars also confirmed the multiple impacts of urbanization on carbon emissions from different perspectives [56,57,58,59]. It can be seen that urbanization has a significant impact on the carbon emissions of logistics, but the effect of land urbanization, an important aspect of urbanization, on carbon emissions in logistics has not received enough attention. The latest research showed that, the expansion and fragmentation of urban land would lead to growth in carbon emissions, while the connectivity between urban lands could promote carbon mitigation [60]. Li [61] found that there was an inverted U-shaped curve between the urban land spatial structure and carbon emissions in the process of urbanization. However, the spatial structure was only one of the manifestations of land urbanization, and these studies did not focus on the logistics industry. Therefore, it is necessary to comprehensively and deeply study the impact of land urbanization on carbon emissions of logistics.
Summarizing the previous literature, this paper contributes to the literature in three aspects. First, this paper establishes an aggregate indicator to describe the catch-up effect of NLCP regions to benchmark in carbon emissions reduction from dynamic spatial–temporal perspectives, which can reflect the effort of NLCP regions in carbon emissions reduction in logistics. Second, differing from the existing literature, which focuses on the influencing factors on the change of carbon emissions, we specifically investigate the impact of land urbanization factors on the catch-up effect of NLCP regions to benchmark in carbon emissions reduction of logistics. Especially, we decompose the impact of land urbanization into 4 factors which can provide more detailed information for carbon emissions reduction. The research framework is displayed in Figure 2. Third, this study focuses on detecting the different effects of the 4 factors of land urbanization. In this context, we implement a comparative analysis among different regions, analyze the similarities and differences in effects of the same influencing factor on different regions, and propose piecemeal measures to reduce carbon emission in logistics in NLCP regions by learning from their successful benchmarks.
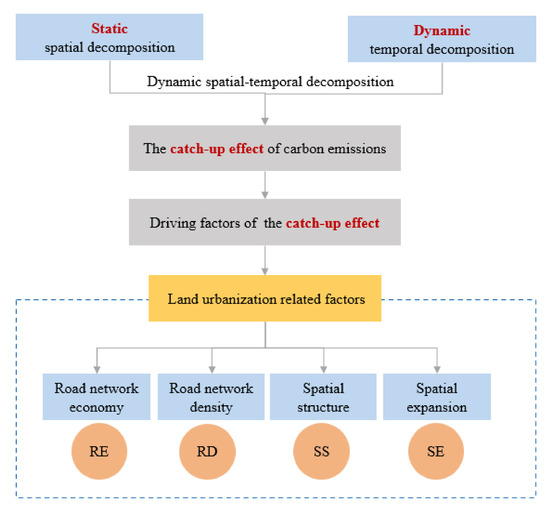
Figure 2.
The framework of research for the catch-up effect of carbon emissions in logistics.
3. Methods and Data
3.1. The Catch-Up Effect
Catch-up effect describes the carbon emissions reduction effort implemented by underperforming regions to bridge the gap with benchmarks. In this context, we can establish the benchmarks based on LCP regions, and assess the gap between NLCP regions and benchmarks, and then use the change of the gap to describe the catch-up effect of underperforming regions. Therefore, establishing the benchmark is a critical and fundamental step.
The existing literature generally has two strategies to determine the benchmarks. First, we can select a real entity which is pre-defined to meet policy makers’ specific demands, such as the best or the worst one, providing policy makers with critical information. This could be defined as a real entity strategy. For example, Sun [62] chose the best result as the benchmark and considered the levels of CO2 emission intensity of the 15 EU countries in 1995. Second, we also can select a virtual region constructed by the average of all regions automatically. This could be defined as a virtual entity strategy. For example, Ang [44] decomposed energy consumption in 30 regions of China by using the arithmetic average of all regions as a benchmark.
Actually, most of the LCP regions have made remarkable achievements in carbon emissions reduction, but no city was always the best among all the LCP regions in the past 10 years, which means we cannot specify a real entity as the benchmark. Therefore, we select the average performance of all LCP regions as the benchmark, i.e., we choose the virtual entity strategy. This is different from the existing literature using static strategy, which selects the average performance of all entities in the whole observation period as the benchmark. The average performance of LCP regions in each year is selected as the benchmark of the year, which means we establish time series benchmarks. In this way, we can prevent the influence of the performance fluctuation of benchmarks, and dynamically reflect the catch-up effort of underperforming regions.
The gap between an NLCP region and the benchmark in the carbon emissions reduction of logistics can be defined as follows:
In Equation (1), indicates the year . Where, indicates the total carbon emissions of logistics in NLCP region , while means the total carbon emissions of logistics of the benchmark. Therefore, as indicates the performance gap between region n and the benchmark in year t. then, the catch-up effort of region n, can be defined as follows:
In Equation (2), describes the change of the gap between NLCP region n and the benchmark from the year t to the year t + 1. Where if , it means that the gap increases or remains unchanged, which indicates there is no catch-up effect in region n. While if , it means that the gap is decreasing, and there is a catch-up effect in region n. Therefore, the advantage of using this method to establish the CUE indicators is that the average level of all LCP regions is used as the benchmark, which can more accurately reflect the most advanced level of low-carbon development of logistics in different periods, and the CUE indicators can reflect the annual change of the carbon emissions gap between the different regions and the benchmark.
3.2. The Decomposition Model
Most of the NLCP regions are under-developed, and urbanization is always considered an effective measure for economic development. With the development of urbanization, the urban land use of NLCP regions will change significantly, which will affect the carbon emissions of logistics. Land urbanization has four significant effects on carbon emissions. First, the scale of the urban area will change sharply due to the population explosion with the development of urbanization. Actually, the urban area usually expands rapidly, which means the service scope of logistics will be enlarged. Thus, some new logistics facilities should be constructed. Moreover, the distance between suppliers and consumers will be extended, which will make the logistics system more complex and increase distribution distance. In this context, more energy will be consumed and more CO2 will be emitted. This effect can be defined as the spatial expansion effect (SE). Second, the rapid growth of population will change the layout of the urban area, which indicates the layout of the urban will be redesigned and the usage of urban land will be clearer. Some areas will be designed as residential land, and some will be designed as industrial land. As a result, the city will become more job–work separated. However, the city’s infrastructure construction often lags behind the increase in urban population, which will lead to greater inefficiency in logistics and affect the catch-up effect of NLCP regions. This effect can be defined as the spatial structure effect (SS). Third, road network construction will be accelerated with the development of urbanization, which means the transportation capacity of logistics will be enhanced greatly. This will provide more convenient logistics services and stimulate greater potential demand for e-commerce, which will affect the energy consumption and carbon emissions of logistics. This effect can be defined as the road network economy effect (RE). Fourth, generally, the sprawl of urban built-up areas is forbidden, thus the city will become more and more compact. Meanwhile, the construction of a large number of roads and railways will increase road network density. In this context, many traffic lights should be set, the speed of vehicles will be controlled too strictly and many traffic jams may happen. Those will lead to inefficiency and too many carbon emissions in logistics. This effect can be defined as the road network density effect (RD). Thus, the impact of land urbanization on the catch-up effect of carbon emissions can be divided into four factors. In this context, more detailed information to understand the effect of land urbanization on the catch-up effect of carbon emissions can be discovered.
In order to identify the effects of land urbanization factors, the carbon emissions of logistics can be decomposed as shown in Equation (3) based on the Kaya identity [63].
In Equation (3), denotes the total carbon emissions of logistics in NLCP region . and , coal; , gasoline; , kerosene; , diesel) respectively denote the j-th energy consumption and the corresponding carbon emissions. Where, denotes the total energy consumption of logistics. respectively denotes the of logistics. R denotes road length. B denotes built-up area and SE denotes urban area.
On the right hand side of Equation (3), the carbon emissions of logistics are decomposed into seven driving factors: the first component could be interpreted as a carbon coefficient effect (); the second component describes the consumption ratio of each energy in the total energy, which could be interpreted as the energy structure effect (); the third indicates the energy consumption per unit of added value, which could be interpreted as the energy intensity effect (); the fourth component indicates the added value of logistics per unit of road length, which could be interpreted as the road network economy effect (); the fifth component indicates the road length per unit of built-up area, which could be interpreted as road network density effect (). The sixth component indicates the built-up area per unit of urban area, which could be interpreted as spatial structure effect (); At last, the urban area could be interpreted as a spatial expansion effect ().
The LMDI is considered the ‘best’ method for decomposition analysis; thus, we select the additive LMDI to analyze the effect of land urbanization on the catch-up effect in logistics. According to Equations (1) and (3), the carbon emissions gap between NLCP regions and the benchmark in year t can be shown in Equation (4):
Since the carbon emissions coefficient of each energy type is constant, is always equal to 0. Therefore, each factor on the right side of Equation (4) can be expressed as Equation (5):
where .
According to Equations (2) and (4), the catch-up effect (CUE) can be decomposed as Equation (6):
According to Equation (6), the catch-up effect of NLCP regions on benchmarks can be decomposed into 7 determinants. Obviously, always equals 0. refers to the catch-up effect achieved by energy structure optimization. refers to the catch-up effect achieved by the decrease in energy intensity. refers to the catch-up effect achieved by increasing the scale effect of road network. refers to the catch-up effect achieved by the decrease in road network density. refers to the catch-up effect achieved by the optimization of spatial structure. refers to the catch-up effect achieved by the decrease in the blind and disordered spatial expansion.
3.3. Data Resources
Transportation, warehousing, postal transport, and telecommunications are always the main components of China’s logistics. Therefore, we collect the panel data of these industries for 30 provinces (except Tibet, Hong Kong, Taiwan, and Macau because of lack of data) in China from 2007 to 2019. The data of population, urban area, built-up area, and value added in logistics were organized based on National Bureau of Statistics of the People’s Republic of China (2007–2019). To explore the impact of driving factors among regions briefly, 30 provinces are divided into three regions (Eastern region includes Beijing, Tianjin, Hebei, Liaoning, Shanghai, Jiangsu, Zhejiang, Fujian, Shandong, Guangdong, and Hainan; Central region includes Shanxi, Jilin, Heilongjiang, Anhui, Jiangxi, Henan, Hubei, and Hunan; Western region includes Inner Mongolia, Guangxi, Chongqing, Sichuan, Guizhou, Yunnan, Shaanxi, Gansu, Qinghai, Ningxia, and Xinjiang.). In addition, we converted the monetary data (e.g., value added of logistics) to the 2007 price level according to the GDP deflator to eliminate the impact of inflation. Moreover, as four types of fuel (coal, gasoline, diesel, and kerosene) dominate the energy consumption of logistics in China, these fuels were considered and were converted into standard coal-based values on the standard coal conversion coefficient (Coal: 0.714; gasoline: 1.471; diesel: 1.457; kerosene: 1.471). Carbon emissions in logistics is calculated based on the carbon emissions coefficient (Coal: 0.7559; gasoline: 0.5538; kerosene: 0.5714; diesel: 0.5921.).
4. Results
4.1. The Catch-Up Effect of Carbon Emissions in Logistics
4.1.1. The Analysis at the National Level
Figure 3 shows the CUE of carbon emissions in logistics at the national level during 2007–2019.
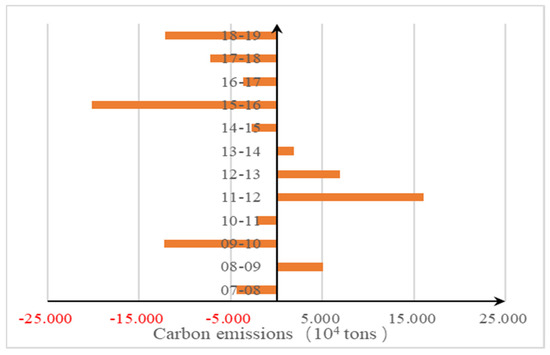
Figure 3.
The catch-up effect of carbon emissions on logistics at the national level during 2007-2019.
The average value of CUE of logistics in China was −29 thousand tons, which indicates that the NLCP regions caught up to the benchmark during 2007–2019. The carbon emissions catch-up effect of logistics in China presents a trend of “catching up-lagging behind-catching up” during the research period totally. Specifically, in the first stage, the value of CUE in 2007–2011 was less than 0 in most years, which meant the NLCP regions caught up to the benchmark in this period. In the second stage, the value of CUE in 2011–2014 was always greater than 0, indicating that the NLCP regions were lagging behind the benchmark in the carbon emissions reduction of logistics. However, the value of CUE was decreasing gradually, indicating that the trend of widening gap between NLCP regions and benchmark was narrowing. In the third stage, the value of CUE in 2014–2019 was always less than 0, indicating a constant catch-up effect of NLCP regions. It is worth noting that the absolute value of CUE was increasing steadily since 2016, which means the gap of carbon emissions reduction between NLCP regions and benchmark was continuously shrinking.
4.1.2. Comparative Analysis at the Regional Level
Figure 4 shows the carbon emissions CUE of logistics in China at the regional level, which indicates that the values of CUE of the three regions of logistics in China are quite different.
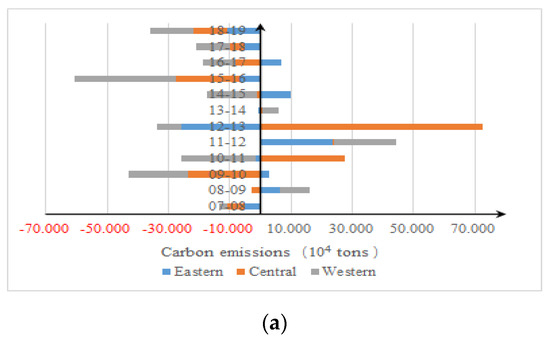
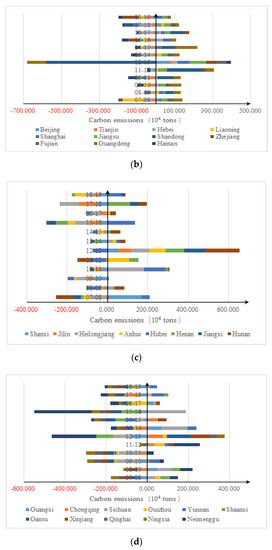
Figure 4.
The catch-up effect of carbon emissions in logistics at the regional level during 2007–2019. (a). The catch-up effect at regional level; (b). the catch-up effect of eastern regions; (c). the catch-up effect of central regions; (d). the catch-up effect of western regions.
According to Figure 4a, the average value of CUE in eastern, central, and western regions was −6 thousand tons, 19 thousand tons, and −87 thousand tons respectively, indicating that the eastern and western regions caught up to the benchmark, while the central region lagged behind the benchmark in carbon emission reduction of logistics. The absolute value of CUE in the eastern region was always small, especially after 2013, indicating that the eastern region has a low potential to reduce carbon emissions of logistics. Meanwhile, the absolute values of CUE in central and western regions were big, meaning that there is a large potential to reduce carbon emissions of logistics in those two regions.
Based on Figure 4b, among the eastern regions, the average value of CUE in seven provinces is less than 0, and the average CUE of Hebei (−226), Tianjin (−191), and Hainan (−167) is particularly significant. Tianjin and Hainan have consistently shown the catch-up effect. However, the average CUE of Guangdong (285) and Jiangsu (256) is greater than 0, indicating that those provinces were lagging behind the benchmark in carbon emissions reduction of logistics. According to Figure 4c, the CUE of most central provinces has increased, such as Henan and Hubei. Moreover, Jilin has always shown a catch-up effect, and Shanxi has also begun to show a stable catch-up effect since 2013, but the CUE of Hunan has been increasing since 2012. According to Figure 4d, most western provinces, such as Qinghai and Ningxia, have shown a catch-up effect in the past decade, but the CUE of Sichuan has increased rapidly since 2013.
4.2. Analysis of Decomposition Results
4.2.1. Analysis at the National Level
Figure 5 shows the CUE decomposition results of carbon emissions in logistics at the national level during 2007–2019, indicating that the land urbanization factors had important but different effects on the CUE of carbon emissions of logistics in China during 2007–2019.
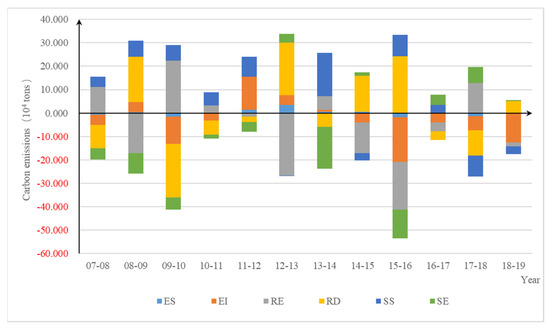
Figure 5.
The catch-up effect decomposition results of carbon emissions in logistics at the national level during 2007–2019.
Specifically, spatial expansion (SE) and road network economy (RE) are the main contributors to the catch-up effect of logistics. However, it is worth noting that spatial expansion shows the opposite effect after 2016. On the contrary, spatial structure (SS) is the main inhibitor to the catch-up effect of NLCP regions in most years, but it has become a contributor since 2017. On average, road network density (RD) is an inhibitor to the catch-up effect of NLCP regions, but the impact of road network density fluctuates wildly in the research period. Therefore, only using a composite indicator to describe land urbanization and assess the impact of land urbanization on the catch-up effect of logistics is probably inaccurate and may lead to an incorrect explanation.
As logistics is an energy-intensive industry, energy-related factors are always the key factor affecting the catch-up effect. For instance, the energy intensity (EI) showed a positive impact on CUE, especially after 2014, Liu [64] and Wang [65] also obtained similar results. Therefore, reducing the energy intensity of logistics has a continuously positive impact on CUE. However, since the energy structure (ES) of logistics changed little during the research period, it has little impact on CUE compared with other factors.
4.2.2. Comparative Analysis at the Regional Level
Figure 6 shows the CUE decomposition results of carbon emissions on logistics at the regional level during 2007–2019.
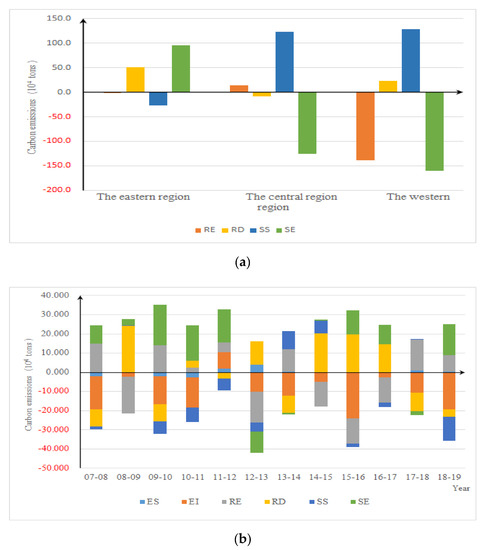
Figure 6.
Comparative analysis of the decomposition results. (a) The overall results of land urbanization factors on three regions; (b) the catch-up effect decomposition results of the eastern region; (c) the catch-up effect decomposition results of the central region; (d) the catch-up effect decomposition results of the western region.
Specifically, Figure 6a shows the overall effect of land urbanization factors on three regions, and Figure 6b–d shows the CUE decomposition results of the three regions separately during 2007–2019. According to Figure 6a, among the land urbanization-related factors, spatial expansion had a significant positive effect on the CUE in the central and western regions, but had a negative impact on the CUE in the eastern region. Spatial structure promoted the CUE in the eastern region but had a significant negative impact on the CUE in the central and western regions. Road network economy contributed to the CUE in the western region significantly, but has little effect on the eastern and central regions. Road network density had a negative impact on the CUE in the eastern and western regions, while a negligible effect in the central region. Therefore, the contribution of land urbanization-related factors to the CUE of logistics in the three regions is significantly different.
According to Figure 6b, in the eastern region, the spatial expansion was the key factor inhibiting catching up to benchmark during 2007–2019, with an average of 79.4 thousand tons each year, especially for Guangdong and Jiangsu. In addition, it had a slightly positive impact on catching up to benchmark only in three years. Road network density was another key inhibitor for eastern regions catching up to benchmark, with an average of 42.5 thousand tons each year, especially for Beijing and Shanghai. However, it had a positive impact on catching up to benchmark in the last two years. Therefore, road network density may tend to be a contributor to catching up to the benchmark in carbon emission reduction due to the construction of urban rail traffic. Spatial structure was the key contributor to catching up to the benchmark for eastern regions in carbon emission reduction, now with an average of −21.97 thousand tons each year, especially for Beijing, Shanghai, and Jiangsu. In addition, it had a slight negative impact on catching up to the benchmark only in four years. Road network economy had a significantly fluctuant impact on catching up to benchmark for eastern regions in carbon emission reduction of logistics. On average, it had a positive impact on catching up to benchmark, with an average of −1.68 thousand tons each year. However, it had a significantly negative impact on catching up to benchmark for eastern regions in the last two years. In addition, the energy structure had a slight negative impact on the CUE, and energy intensity had a significant and stable positive impact on the CUE in the eastern region. Therefore, by improving energy intensity, the eastern region had significantly improved the low-carbon levels of logistics.
According to Figure 6c, in the central region, spatial expansion was the main factor in promoting CUE, but in recent years the impact has decreased and tends to be negative for some provinces. Spatial structure was the main factor inhibiting CUE, but after 2015, it changed to be a contributor, especially for Heilongjiang and Jiangxi. Road network economy was an inhibitor for CUE on average, but the impact fluctuated sharply. In the last three years, it played a negative role on CUE stably, especially for Shanxi, Jilin, and Anhui. Therefore, the negative impact of RE may increase with the rapid development of the digital economy. Road network density played a slight positive role on CUE during the research period for central regions. However, it is worth noting that the impact of RD was consistent in Hubei, Henan, Anhui, and Jilin. In addition, both the energy structure and energy intensity have inhibited the CUE in the central region, but they have begun to play a positive role in recent years.
According to Figure 6d, similar to the central region, spatial expansion was the main factor in promoting CUE of logistics, and the spatial structure was the main factor in inhibiting CUE. The difference is that the road network economy significantly promoted CUE of logistics in the western region, especially after 2011, while road network density decreased the CUE, especially after 2012. In addition, energy intensity has decreased CUE as a whole, but in recent years it has begun to tend to be a contributor in this region. And it is worth noting that energy structure promoted the CUE in the western region, which was different from the eastern and central regions.
5. Discussion
5.1. The Catch-Up Effect in Logistics
At the national level, the carbon emissions catch-up effect of logistics in China was greater than 0 during 2011–2014, and less than 0 in other years as a whole. This was mainly because e-commerce began to grow rapidly around 2012 in China, and stimulated massive demand in logistics, such as logistics distribution vehicles and logistics infrastructure, thus significantly increasing energy consumption and carbon emissions. Meanwhile, with the promotion of low-carbon policies in benchmark after 2011, the gap between the country and benchmark in carbon emissions of logistics has gradually widened. After 2014, since NLCP regions paid more and more attention to low-carbon development, more and more intelligent devices were used in logistics, thus the carbon emissions of logistics were gradually controlled, and the NLCP regions began to catch up to the benchmark.
At the regional level, the carbon emissions catch-up effects of logistics in the three regions of China were significantly different. The CUE in the eastern region was slightly less than 0 and stable in the research period. This was mainly because most of the LCP regions are located in this region, which facilitated NLCP regions continuously learning low-carbon development experiences from benchmarks. Another possible reason was the provinces in the eastern region are developed areas, and they have sufficient capital and strong technological force to continuously research and apply intelligent and environmentally friendly devices instead of traditional equipment, which reduced the carbon emissions of logistics. The CUE in the central region was significantly greater than 0 and sharply fluctuant from 2007 to 2019. This may be because many provinces in the central region constructed many national integrated transportation hubs (Henan, Hubei, Jiangxi, for instance), which was playing an important role in transport and warehousing. Obviously, transport and warehousing are energy-intensive and high-emission sectors in logistics. The CUE in the western region was far less than 0 and stable during the observation period, indicating a continuous catch-up effect in the carbon emission reduction of logistics. Actually, due to the radiation effect of national integrated transportation hubs in the central region, logistics in the western region developed slowly. Especially, some energy-intensive and high-emission sectors, such as transport, warehousing, and distribution processing, were gradually abolished along with the optimization of the logistics system.
5.2. Driving Factors of the Catch-Up Effect in Logistics
At the national level, the road network economy was a significant contributor to the catch-up effect in carbon emissions reduction of logistics during the observation period. This may be because the local government of NLCP regions energetically developed modern logistics systems due to the rapid development of e-commerce, and some outdated equipment and technology were eliminated, resulting in the growth of carbon emissions in logistics decreased compared with benchmarks. However, the impact of the road network economy decreased gradually after 2016, indicating that the regional difference in equipment and technology logistics has decreased. Affected by the spatial expansion, the CUE in logistics first increased and then decreased. The reason may be that the benchmarks have been built and developed earlier. Specifically, the urban area of most benchmarks expanded relatively earlier and faster, which widened the transportation and distribution distance, promoting carbon emissions of logistics. As the benchmark gradually entered the middle and later stage of land urbanization, the urban scale tended to be stable and the carbon emissions of logistics has been controlled. Meanwhile, the space of most NLCP regions expands rapidly, resulting in a decrease in CUE. It is worth noting that spatial structure and road network density had negative effects on increasing CUE of logistics in most years. One possible reason is that with the development of land urbanization, the urban area becomes too crowded, resulting in the inefficiency of logistics. Meanwhile, many urban roads are constructed to satisfy the demand for travel, transport, and distribution, which makes the transportation system more complex. More traffic lights are set to control the speed of vehicles and then traffic congestion increases.
At the regional level, the road network economy significantly promoted CUE of logistics in the eastern and western regions, but inhibited CUE of logistics in the central region. The regional difference is mainly because the central region is the logistics center of China, the development of the digital economy in each region will generate massive logistics service demand for the central region, which will increase carbon emissions. Meanwhile, there is a new characteristic named returning migrant-induced urbanization in the central region, which means many people return to county-level central cities from eastern provinces. In this context, the impact of road network economy will increase due to the online shopping habit of returning people. Therefore, most important is optimizing the layout of logistics to obtain the scale economy effect. Regarding spatial expansion, this effect mainly inhibited CUE of logistics in the eastern region, slightly contributed to CUE of logistics in the central region before 2017 then turned to be an inhibitor after 2017, and mainly contributed CUE of logistics in the western region. This is mainly because the urban areas in eastern and central regions expanded earlier in the process of land urbanization. The urban sprawl increased the carbon emissions of logistics in the eastern region and began to play a role in the central region. Therefore, disorderly and blindly spatial expansion should be strictly controlled, and land utility should be planned reasonably to avoid further blind spatial expansion in eastern and central regions in the process of land urbanization. Spatial structure had a positive impact on CUE of logistics in the eastern region; in contrast, it had a negative impact on CUE in central and western regions. The regional difference was mainly because the urban space was optimized earlier in the eastern region since the new urbanization with Chinese characteristics’ strategy proposed in the 18th National Congress in 2012. Meanwhile, the space optimization in central and western regions was slow because the local government was lacking capital. It will become more and more urgent for the central region to scientifically optimize the city structure because of the population pouring in from rural areas and returning from eastern regions. In this process, the local governments should distribute these people reasonably, and avoid a large number of people pouring into cities. Road network density had a negative impact on CUE in the eastern region, while had a slightly positive impact on CUE in the central region. This is because most of the provinces in the eastern region are developed and they have gotten to the mature stage of urbanization. As he layout of urban areas becomes more and more compact, the road network density increases; then, more and more speed restrictions and traffic lights are set, and the logistics system becomes more and more inefficient. Therefore, it will be of great significance to optimize the traffic system for carbon emissions reduction in the logistics of the eastern region. Specifically, increasing the construction of urban rail traffic and decreasing the construction of city roads will be conducive to decreasing the road network density; thus, the vehicle moving speed can be increased, and the efficiency of the logistics system can be improved. In view of the negative impact of energy structure, it will be of great help to reduce carbon emission in logistics by improving the share of green energy, such as hydrogen energy and solar power. In this context, the local governments should promote the infrastructure construction of green energy, and propose measures to encourage logistics enterprises to increase the consumption of green energy and decrease the consumption of traditional energy. Meanwhile, a large share of low-value-added and energy-intensive sectors should also be distributed in the central region. Promoting the application of new energy equipment and replacing the energy-intensive equipment will be conducive to reducing the CUE in the central region.
6. Conclusions
To discover the effect of land urbanization-related factors driving provinces to catch up to benchmark in carbon emissions reduction of logistics and detect the similarities of and differences of the same influencing factor on different regions, we propose an aggregate indicator to describe the catch-up effect of NLCP regions to benchmark and establish a decomposition model based on the Kaya identity and LMDI. First, an indicator was established and used to assess the CUE of NLCP regions at the national and regional levels. Then, the decomposition model was extended to capture the impact of land urbanization factors on the CUE. Finally, a comparative analysis was proposed to detect the key factors influencing regions and provinces during the process of land urbanization. The main results are listed as follows.
(1) At the national level, the carbon emissions catch-up effect of logistics has generally experienced three stages, and presents the characteristics of “catching up-lagging behind-catching up”. (2) At the regional level, the land urbanization-related factors had significant but different impacts on the carbon emissions catch-up effect. In the eastern region, the spatial structure effect had a positive impact on the carbon emissions catch-up effect, but the spatial expansion effect and road network density effect had a fluctuating and negative impact; in the central region, the spatial expansion effect had a positive impact on carbon emissions catch-up effect, but the spatial structure effect had a negative impact; in the western region, the road network economy effect and spatial expansion effect had a positive impact on carbon emissions catch-up effect, but the spatial structure effect had a negative impact. (3) At the provincial level, the impact of the land urbanization-related factors was different. The road network economy effect had a negative impact on carbon emissions catch-up effect in Beijing, Shanghai, and other developed provinces; road network density effect and spatial structure effect had a negative impact in developing provinces such as Xinjiang and Inner Mongolia; the spatial expansion effect played a negative role in carbon emissions catch-up effect for rapidly expanding provinces such as Beijing and Jiangsu, and had a positive impact on provinces with slow urbanization. In addition, as for energy-related factors, the energy structure had little impact on the carbon emissions catch-up effect of most provinces, but the energy intensity had a positive impact on most eastern and western provinces.
This paper is just an attempt to explore the impact of land urbanization on the catch-up effect of the inter-regional carbon emissions gap in logistics. There are still some limitations in this paper. For example, the catch-up effect is influenced by many factors, but this paper only considers land-urbanization factors, other factors related to industrial agglomeration or technological progress are also expected to research in the future.
Author Contributions
Conceptualization, B.L. and Y.W.; methodology, Y.W. and X.C.; resources, L.M. and B.N.; data curation, B.N. and Y.L.; writing—original draft preparation, Y.W.; writing—review and editing, B.L. All authors have read and agreed to the published version of the manuscript.
Funding
This paper was supported by National Natural Science Foundation of China (No. 71804189), Shandong Provincial Natural Science Foundation of China (No. ZR ZR2021MG029).
Institutional Review Board Statement
Not applicable.
Informed Consent Statement
Not applicable.
Data Availability Statement
Some or all data, models, or code that support the findings of this study are available from the corresponding author upon reasonable request.
Conflicts of Interest
No potential conflict of interest was reported by authors.
References
- Rashidi, K.; Cullinane, K. Evaluating the sustainability of national logistics performance using data envelopment analysis. Transp. Policy 2019, 74, 35–46. [Google Scholar] [CrossRef]
- National Bureau of Statistics of China. China Energy Statistics Yearbook; China Statistical Press: Beijing, China, 2019.
- Zhou, Y.; Chen, M.; Tang, Z.; Mei, Z. Urbanization, land use change, and carbon emissions: Quantitative assessments for city-level carbon emissions in Beijing-Tianjin-Hebei region. Sustain. Cities Soc. 2021, 66, 102701. [Google Scholar] [CrossRef]
- Wang, H.; Lu, X.; Deng, Y.; Sun, Y.; Nielsen, C.P.; Liu, Y.; Zhu, G.; Bu, M.; Bi, J.; McElroy, M.B. China’s CO2 peak before 2030 implied from characteristics and growth of cities. Nat. Sustain. 2019, 2, 748–754. [Google Scholar] [CrossRef]
- Wang, G.; Han, Q.; de Vries, B. Assessment of the relation between land use and carbon emission in Eindhoven, The Netherlands. J. Environ. Manag. 2019, 247, 413–424. [Google Scholar] [CrossRef]
- Zhang, R.; Matsushima, K.; Kobayashi, K. Can land use planning help mitigate transport-related carbon emissions? A case of Changzhou. Land Use Policy 2018, 74, 32–40. [Google Scholar] [CrossRef]
- Shahbaz, M.; Loganathan, N.; Muzaffar, A.T.; Ahmed, K.; Ali Jabran, M. How urbanization affects CO2 emissions in Malaysia? The application of STIRPAT model. Renew. Sustain. Energy Rev. 2016, 57, 83–93. [Google Scholar] [CrossRef]
- Wang, C.; Wang, F.; Zhang, X.; Yang, Y.; Su, Y.; Ye, Y.; Zhang, H. Examining the driving factors of energy related carbon emissions using the extended STIRPAT model based on IPAT identity in Xinjiang. Renew. Sustain. Energy Rev. 2017, 67, 51–61. [Google Scholar] [CrossRef]
- Yang, L.; Xia, H.; Zhang, X.; Yuan, S. What matters for carbon emissions in regional sectors? A China study of extended STIRPAT model. J. Clean. Prod. 2018, 180, 595–602. [Google Scholar] [CrossRef]
- Zhang, S.; Zhao, T. Identifying major influencing factors of CO2 emissions in China: Regional disparities analysis based on STIRPAT model from 1996 to 2015. Atmos. Environ. 2019, 207, 136–147. [Google Scholar] [CrossRef]
- Chen, J.; Wang, P.; Cui, L.; Huang, S.; Song, M. Decomposition and decoupling analysis of CO2 emissions in OECD. Appl. Energy 2018, 231, 937–950. [Google Scholar] [CrossRef]
- Li, A.; Zhang, A.; Zhou, Y.; Yao, X. Decomposition analysis of factors affecting carbon dioxide emissions across provinces in China. J. Clean. Prod. 2017, 141, 1428–1444. [Google Scholar] [CrossRef]
- Wang, H.; Zhou, P.; Xie, B.-C.; Zhang, N. Assessing drivers of CO2 emissions in China’s electricity sector: A metafrontier production-theoretical decomposition analysis. Eur. J. Oper. Res. 2018, 275, 1096–1107. [Google Scholar] [CrossRef]
- Wang, M.; Feng, C. Decomposition of energy-related CO2 emissions in China: An empirical analysis based on provincial panel data of three sectors. Appl. Energy 2017, 190, 772–787. [Google Scholar] [CrossRef]
- Wang, M.; Feng, C. Understanding China’s industrial CO2 emissions: A comprehensive decomposition framework. J. Clean. Prod. 2017, 166, 1335–1346. [Google Scholar] [CrossRef]
- Li, H.; Mu, H.; Zhang, M.; Gui, S. Analysis of regional difference on impact factors of China’s energy—Related CO2 emissions. Energy Sustain. Energy Environ. Prot. 2012, 39, 319–326. [Google Scholar] [CrossRef]
- Li, H.; Mu, H.; Zhang, M.; Li, N. Analysis on influence factors of China’s CO2 emissions based on Path—STIRPAT model. Energy Policy Asian Energy Secur. 2011, 39, 6906–6911. [Google Scholar] [CrossRef]
- Al-mulali, U.; Lee, J.Y.; Hakim Mohammed, A.; Sheau-Ting, L. Examining the link between energy consumption, carbon dioxide emission, and economic growth in Latin America and the Caribbean. Renew. Sustain. Energy Rev. 2013, 26, 42–48. [Google Scholar] [CrossRef]
- Wang, H.; Ang, B.W.; Su, B. A Multi-region structural decomposition analysis of global CO2 emission intensity. Ecol. Econ. 2017, 142, 163–176. [Google Scholar] [CrossRef]
- Du, Q.; Zhou, J.; Pan, T.; Sun, Q.; Wu, M. Relationship of carbon emissions and economic growth in China’s construction industry. J. Clean. Prod. 2019, 220, 99–109. [Google Scholar] [CrossRef]
- Wu, Y.; Tam, V.W.Y.; Shuai, C.; Shen, L.; Zhang, Y.; Liao, S. Decoupling China’s economic growth from carbon emissions: Empirical studies from 30 Chinese provinces (2001–2015). Sci. Total Environ. 2019, 656, 576–588. [Google Scholar] [CrossRef]
- Yeh, J.-C.; Liao, C.-H. Impact of population and economic growth on carbon emissions in Taiwan using an analytic tool STIRPAT. Sustain. Environ. Res. 2017, 27, 41–48. [Google Scholar] [CrossRef]
- Chen, J.; Xu, C.; Cui, L.; Huang, S.; Song, M. Driving factors of CO2 emissions and inequality characteristics in China: A combined decomposition approach. Energy Econ. 2019, 78, 589–597. [Google Scholar] [CrossRef]
- Xu, S.-C.; Zhang, L.; Liu, Y.-T.; Zhang, W.-W.; He, Z.-X.; Long, R.-Y.; Chen, H. Determination of the factors that influence increments in CO2 emissions in Jiangsu, China using the SDA method. J. Clean. Prod. 2017, 142, 3061–3074. [Google Scholar] [CrossRef]
- Chang, Y.F.; Lin, S.J. Structural decomposition of industrial CO2 emission in Taiwan: An input-output approach. Energy Policy 1998, 26, 5–12. [Google Scholar] [CrossRef]
- Zeng, L.; Xu, M.; Liang, S.; Zeng, S.; Zhang, T. Revisiting drivers of energy intensity in China during 1997–2007: A structural decomposition analysis. Energy Policy 2014, 67, 640–647. [Google Scholar] [CrossRef]
- Hoekstra, R.; van den Bergh, J.C.J.M. Comparing structural decomposition analysis and index. Energy Econ. 2003, 25, 39–64. [Google Scholar] [CrossRef]
- Su, B.; Ang, B.W. Structural decomposition analysis applied to energy and emissions: Some methodological developments. Energy Econ. 2012, 34, 177–188. [Google Scholar] [CrossRef]
- Wang, C. Decomposing energy productivity change: A distance function approach. Energy 2007, 32, 1326–1333. [Google Scholar] [CrossRef]
- Wang, H.; Zhou, P. Multi-country comparisons of CO2 emission intensity: The production-theoretical decomposition analysis approach. Energy Econ. 2018, 74, 310–320. [Google Scholar] [CrossRef]
- Ang, B.W.; Zhang, F.Q. A survey of index decomposition analysis in energy and environmental studies. Energy 2000, 25, 1149–1176. [Google Scholar] [CrossRef]
- Ang, B.W. Decomposition analysis for policymaking in energy: Which is the preferred method? Energy Policy 2004, 32, 1131–1139. [Google Scholar] [CrossRef]
- Ang, B.W. The LMDI approach to decomposition analysis: A practical guide. Energy Policy 2005, 33, 867–871. [Google Scholar] [CrossRef]
- Chong, C.; Liu, P.; Ma, L.; Li, Z.; Ni, W.; Li, X.; Song, S. LMDI decomposition of energy consumption in Guangdong Province, China, based on an energy allocation diagram. Energy 2017, 133, 525–544. [Google Scholar] [CrossRef]
- Jeong, K.; Kim, S. LMDI decomposition analysis of greenhouse gas emissions in the Korean manufacturing sector. Energy Policy 2013, 62, 1245–1253. [Google Scholar] [CrossRef]
- Wang, M.; Feng, C. Decomposing the change in energy consumption in China’s nonferrous metal industry: An empirical analysis based on the LMDI method. Renew. Sustain. Energy Rev. 2018, 82, 2652–2663. [Google Scholar] [CrossRef]
- Zhang, C.; Su, B.; Zhou, K.; Yang, S. Analysis of electricity consumption in China (1990–2016) using index decomposition and decoupling approach. J. Clean. Prod. 2019, 209, 224–235. [Google Scholar] [CrossRef]
- Zhang, X.-P.; Zhang, J.; Tan, Q.-L. Decomposing the change of CO2 emissions: A joint production theoretical approach. Energy Policy 2013, 58, 329–336. [Google Scholar] [CrossRef]
- Mousavi, B.; Lopez, N.S.A.; Biona, J.B.M.; Chiu, A.S.F.; Blesl, M. Driving forces of Iran’s CO2 emissions from energy consumption: An LMDI decomposition approach. Appl. Energy 2017, 206, 804–814. [Google Scholar] [CrossRef]
- Zhang, W.; Li, K.; Zhou, D.; Zhang, W.; Gao, H. Decomposition of intensity of energy-related CO2 emission in Chinese provinces using the LMDI method. Energy Policy 2016, 92, 369–381. [Google Scholar] [CrossRef]
- Chen, L.; Duan, Q. Decomposition analysis of factors driving CO2 emissions in Chinese provinces based on production-theoretical decomposition analysis. Nat. Hazards 2016, 84, 267–277. [Google Scholar] [CrossRef]
- Wang, Q.; Chiu, Y.-H.; Chiu, C.-R. Driving factors behind carbon dioxide emissions in China: A modified production-theoretical decomposition analysis. Energy Econ. 2015, 51, 252–260. [Google Scholar] [CrossRef]
- Ang, B.W.; Zhang, F.Q. Inter-regional comparisons of energy-related CO2 emissions using the decomposition technique. Energy 1999, 24, 297–305. [Google Scholar] [CrossRef]
- Ang, B.W.; Xu, X.Y.; Su, B. Multi-country comparisons of energy performance: The index decomposition analysis approach. Energy Econ. 2015, 47, 68–76. [Google Scholar] [CrossRef]
- Román-Collado, R.; Morales-Carrión, A.V. Towards a sustainable growth in Latin America: A multiregional spatial decomposition analysis of the driving forces behind CO2 emissions changes. Energy Policy 2018, 115, 273–280. [Google Scholar] [CrossRef]
- Yuan, R.; Rodrigues, J.F.D.; Behrens, P. Driving forces of household carbon emissions in China: A spatial decomposition analysis. J. Clean. Prod. 2019, 233, 932–945. [Google Scholar] [CrossRef]
- Shi, Y.; Han, B.; Han, L.; Wei, Z. Uncovering the national and regional household carbon emissions in China using temporal and spatial decomposition analysis models. J. Clean. Prod. 2019, 232, 966–979. [Google Scholar] [CrossRef]
- Zhang, C.; Wu, Y.; Yu, Y. Spatial decomposition analysis of water intensity in China. Socio-Econ. Plan. Sci. 2019, 69, 100680. [Google Scholar] [CrossRef]
- Ang, B.W.; Su, B.; Wang, H. A spatial–temporal decomposition approach to performance assessment in energy and emissions. Energy Econ. 2016, 60, 112–121. [Google Scholar] [CrossRef]
- Li, H.; Zhao, Y.; Qiao, X.; Liu, Y.; Cao, Y.; Li, Y.; Wang, S.; Zhang, Z.; Zhang, Y.; Weng, J. Identifying the driving forces of national and regional CO2 emissions in China: Based on temporal and spatial decomposition analysis models. Energy Econ. 2017, 68, 522–538. [Google Scholar] [CrossRef]
- Wang, Q.; Wang, Y.; Zhou, P.; Wei, H. Whole process decomposition of energy-related SO2 in Jiangsu Province, China. Appl. Energy 2017, 194, 679–687. [Google Scholar] [CrossRef]
- Chen, C.; Zhao, T.; Yuan, R.; Kong, Y. A spatial-temporal decomposition analysis of China’s carbon intensity from the economic perspective. J. Clean. Prod. 2019, 215, 557–569. [Google Scholar] [CrossRef]
- Hang, Y.; Wang, Q.; Wang, Y.; Su, B.; Zhou, D. Industrial SO2 emissions treatment in China: A temporal-spatial whole process decomposition analysis. J. Environ. Manag. 2019, 243, 419–434. [Google Scholar] [CrossRef]
- Lv, Q.; Liu, H.; Yang, D.; Liu, H. Effects of urbanization on freight transport carbon emissions in China: Common characteristics and regional disparity. J. Clean. Prod. 2019, 211, 481–489. [Google Scholar] [CrossRef]
- Liu, B.; Cheng, K.; Ma, Z. Research on the impacts of urbanization on logistics carbon emission changes. Chin. J. Popul. Resour. Environ. 2016, 26, 54–60. [Google Scholar]
- Lv, T.; Hu, H.; Zhang, X.; Wang, L.; Fu, S. Impact of multidimensional urbanization on carbon emissions in an ecological civilization experimental area of China. Phys. Chem. Earth 2022, 126, 103120. [Google Scholar] [CrossRef]
- Sufyanullah, K.; Ahmad, K.A.; Sufyan Ali, M.A. Does emission of carbon dioxide is impacted by urbanization? An empirical study of urbanization, energy consumption, economic growth and carbon emissions—Using ARDL bound testing approach. Energy Policy 2022, 164, 112908. [Google Scholar] [CrossRef]
- Wang, W.-Z.; Liu, L.-C.; Liao, H.; Wei, Y.-M. Impacts of urbanization on carbon emissions: An empirical analysis from OECD countries. Energy Policy 2021, 151, 112171. [Google Scholar] [CrossRef]
- Liu, F.; Liu, C. Regional disparity, spatial spillover effects of urbanisation and carbon emissions in China. J. Clean. Prod. 2019, 241, 118226. [Google Scholar] [CrossRef]
- Zhu, E.; Qi, Q.; Chen, L.; Wu, X. The spatial-temporal patterns and multiple driving mechanisms of carbon emissions in the process of urbanization: A case study in Zhejiang, China. J. Clean. Prod. 2022, 358, 131954. [Google Scholar]
- Li, J.; Huang, X.; Chuai, X.; Yang, H. The impact of land urbanization on carbon dioxide emissions in the Yangtze River Delta, China: A multiscale perspective. Cities 2021, 116, 103275. [Google Scholar] [CrossRef]
- Sun, J.W. Is CO2 emission intensity comparable? Energy Policy 2000, 28, 1081–1084. [Google Scholar] [CrossRef]
- Kaya, Y. Impact of carbon dioxide emission on GNP growth: Interpretation of proposed scenarios. In Presentation to the Energy and Industry Subgroup; Response Strategies Working Croup IPCC: Paris, France, 1989. [Google Scholar]
- Liu, B.; Su, X.; Shi, J.; Hou, R. Does urbanization drive economic growth decoupled from energy consumption in China’s logistics? J. Clean. Prod. 2020, 257, 120468. [Google Scholar] [CrossRef]
- Wang, Q.; Jiang, R.; Zhan, L. Is decoupling economic growth from fuel consumption possible in developing countries?—A comparison of China and India. J. Clean. Prod. 2019, 229, 806–817. [Google Scholar] [CrossRef]
Publisher’s Note: MDPI stays neutral with regard to jurisdictional claims in published maps and institutional affiliations. |
© 2022 by the authors. Licensee MDPI, Basel, Switzerland. This article is an open access article distributed under the terms and conditions of the Creative Commons Attribution (CC BY) license (https://creativecommons.org/licenses/by/4.0/).